Embed Size (px)
Citation preview
Trends in the Supply and Distribution of Obstetric Delivery
Providers in North Carolina
Erin P. Fraher, PhD MPP With Julie Spero, Katie Gaul & Matt Minnotte
Program on Health Workforce Research & Policy Cecil G. Sheps Center for Health Services Research, UNC-CH
Joint Legislative Oversight Committee on Health and Human Services Subcommittee on Midwives
February 26, 2014
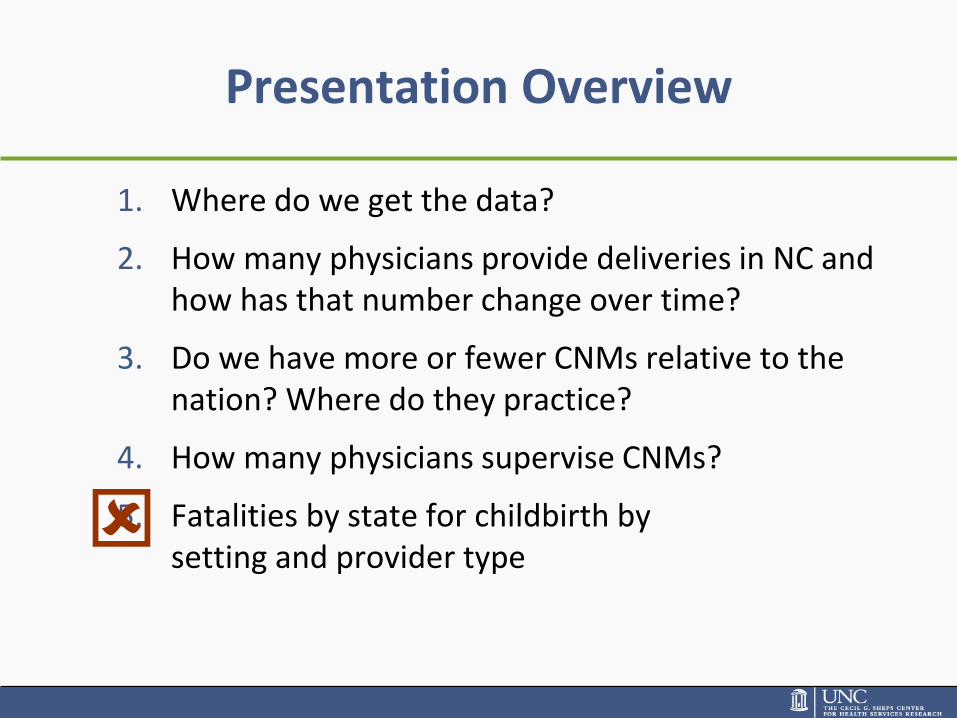
Presentation Overview
1. Where do we get the data?
2. How many physicians provide deliveries in NC and how has that number change over time?
3. Do we have more or fewer CNMs relative to the nation? Where do they practice?
4. How many physicians supervise CNMs?
5. Fatalities by state for childbirth by setting and provider type
Where do we get the data? The North Carolina Health Professions Data System (HPDS)
• HPDS draws on licensure data on 19 health professions from 12 licensure boards
• Today’s data from Board of Nursing, Medical Board and Midwifery Joint Committee
• NC has unique (and much envied!) data system thanks to cooperation of licensure boards
• Based at Cecil G. Sheps Center for Health Services Research at UNC-CH but mission is statewide
We don’t advocate. We provide ‘straight up’ data and analyses
• Health Professions Data System is independent of government and health care professionals
• Independence brings rigor and objectivity
• Funding provided by: NC AHEC Program Office, data request fees, project cross-subsidies, and the UNC-CH Office of the Provost (Health Affairs)

Slight decline in number of physicians providing deliveries in last 10 years
928 913
0
200
400
600
800
1,000
1,200
2000 2001 2002 2003 2004 2005 2006 2007 2008 2009 2010 2011**
# o
f P
hys
icia
ns
Do
ing
De
live
rie
s
Year
Total Physicians Doing Deliveries, North Carolina, 2000-2011
Note: Data include active, instate , nonfederal, non-resident-in-training physicians licensed in North Carolina as of October 31, 2011 who reported that they provide obstetric deliveries. Sources: North Carolina Health Professions Data System, with data from the North Carolina Medical Board, 2011; US Census Bureau and Office of Management and Budget, 2013.

Due to significant decrease among Family Physicians doing deliveries
44
14
227
111
714 766
17 22
0
100
200
300
400
500
600
700
800
900
2001 2006 2011
Year
Obstetrics and Gynecology
Family Med.
Emerg. Med.
Other Spec.
# o
f P
hys
icia
ns
Specialty Type of Physicians Providing Obstetric Deliveries, North Carolina, 2001-2011
Note: Data include active, instate , nonfederal, non-resident-in-training physicians licensed in North Carolina as of October 31, 2011 who reported that they provide obstetric deliveries. Specialties are based on self-reported Primary Area of Practice. Sources: North Carolina Health Professions Data System, with data from the North Carolina Medical Board, 2011; US Census Bureau and Office of Management and Budget, 2013.

Only 4% of Family Medicine physicians provide obstetric deliveries, clustered in western and central counties
Family Medicine Physicians Who Provide Routine Obstetric Deliveries
per 10,000 Childbearing Age* Females, North Carolina, 2011
Note: *Childbearing age: 15-44 years. Data include active, instate , nonfederal, non-resident-in-training physicians licensed in North Carolina as of October 31, 2011 who reported a primary area of practice of “Family Medicine.” Sources: North Carolina Health Professions Data System, with data from the North Carolina Medical Board, 2011; US Census Bureau and Office of Management and Budget, 2013.
Nonmetropolitan County (54)

130 132
0
20
40
60
80
100
120
140
160
2000 2001 2002 2003 2004 2005 2006 2007 2008 2009 2010 2011**
Year
Nu
mb
er
of
Bir
ths
Number of Births per Physician Providing Deliveries, North Carolina, 2000-2011
Number of births per physician providing deliveries varies by year but overall stable over last 10 years
Sources: Physician data: North Carolina Health Professions Data System, with data from the North Carolina Medical Board, 2011; Data include active, in-state,
non-federal, non-resident-in-training physicians licensed in North Carolina as of October 31, 2011 who reported that they provide obstetric deliveries. The
Maternal and Child Health, Family Planning, and Women’s Health Program Directors in the U.S. Department of Health and Human Services (USDHHS) Region
IV Office; and the Maternal and Child Health, Family Planning, and Women’s Health Programs and the state statistical agencies in each state in USDHHS Region
IV. A collaborative project of the Cecil G. Sheps Center for Health Services Research at The University of North Carolina at Chapel Hill;

NC has about average supply of CNMs relative to United States average
1.0
1.2
0.0
0.2
0.4
0.6
0.8
1.0
1.2
1.4
1.6
Year
US Certified Nurse Midwives
NC Certified Nurse Midwives
CN
Ms
Pe
r 1
0,0
00
Ch
ild
be
ari
ng
Ag
e F
em
ale
s
Certified Nurse Midwives (CNMs) per 10,000 Childbearing Age* Females,
US and NC, 1984 to 2011
*Notes: Figures include all licensed, active, instate certified nurse midwives. Childbearing age:15-44 years.
Sources: North Carolina Health Professions Data System, 1979 to 2012; The Registered Nurse Population- Findings
from the National Sample Survey of Registered Nurses, 2008, 2004, 2000, 1996,1992, 1988, 1984, 1980; North Carolina Office of State Planning;
U.S. Bureau of the Census; North Carolina population data are smoothed figures based on 1980, 1990, 2000, and 2010 Censuses.

And a relatively even distribution of CNMs in rural and urban areas
1.3
1.0
0.0
0.5
1.0
1.5
2.0
Year
Metropolitan
Nonmetropolitan
CN
Ms
Pe
r 1
0,0
00
Ch
ild
be
ari
ng
Ag
e F
em
ale
s
Note: *Childbearing age: 15-44 years.
Sources: North Carolina Health Professions Data System, with data from the North Carolina Board of Nursing; Midwifery Joint Committee,1984 to 2011; North
Carolina Office of State Planning. Figures include all licensed, active, in-state CNMs. North Carolina population data are based on 1980, 1990, 2000, and 2010
Censuses and the NC Office of State Budget Management. Source for Metropolitan-Nonmetropolitan definition: Office of Management and Budget, 2013.
Certified Nurse Midwives (CNMs) per 10,000 Childbearing Age* Females by
Metropolitan and Nonmetropolitan Counties, North Carolina, 1984-2011

But about half (47) of NC’s counties do not have a CNM; distribution generally
in “clusters” around state Certified Nurse Midwives (CNMs) per 10,000 Childbearing Age* Females
North Carolina, 2011
Note: Data include active, instate CNMs licensed in North Carolina as of October 31, 2011. *Childbearing age: 15-44 years. Sources: North Carolina Health Professions Data System, with data from the North Carolina Board of Nursing; Midwifery Joint Committee, 2011; US Census Bureau and Office of Management and Budget, 2013.
Nonmetropolitan County (54)
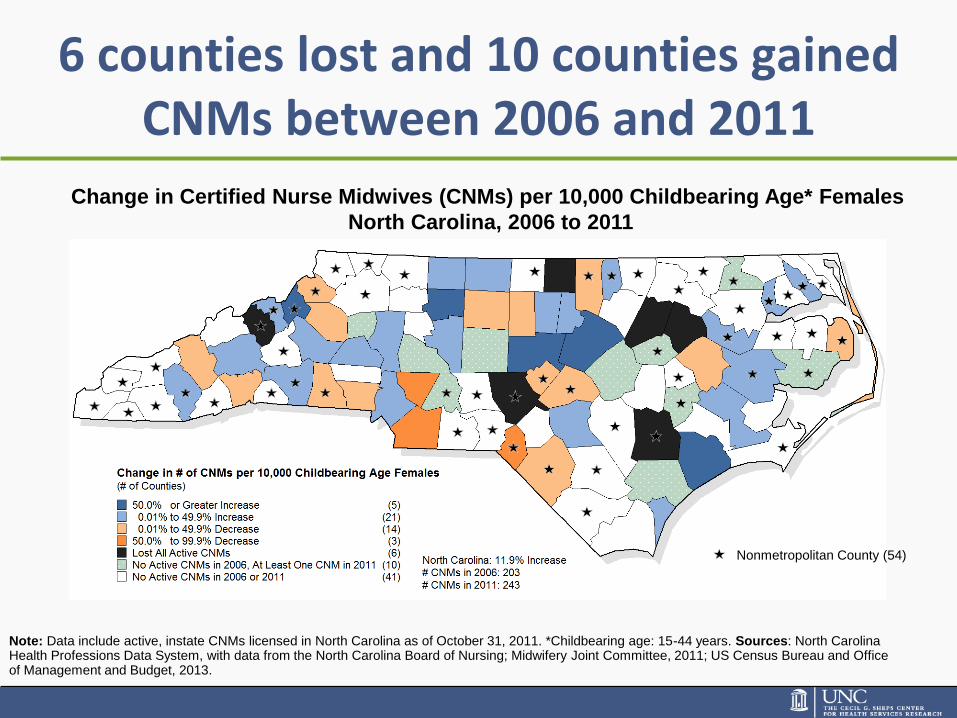
6 counties lost and 10 counties gained CNMs between 2006 and 2011
Note: Data include active, instate CNMs licensed in North Carolina as of October 31, 2011. *Childbearing age: 15-44 years. Sources: North Carolina Health Professions Data System, with data from the North Carolina Board of Nursing; Midwifery Joint Committee, 2011; US Census Bureau and Office of Management and Budget, 2013.
Change in Certified Nurse Midwives (CNMs) per 10,000 Childbearing Age* Females
North Carolina, 2006 to 2011
Nonmetropolitan County (54)

Increasing percent of CNMs in hospitals, decrease in group practice
18%
27%
55%
43%
13% 14%
9% 7% 5%
8%
0%
10%
20%
30%
40%
50%
60%
2007 2008 2009 2010 2011
Pe
rce
nt
of
CN
Ms
by p
rac
tic
e s
ett
ing
Year
Hospital
Solo GroupPractice
Publichealth/HlthDept.
School ofNursing
Other
Certified Nurse Midwives by Practice Setting, North Carolina, 2007-2011
Note: Data include active, in-state CNMs licensed in North Carolina as of October 31, 2011. *Childbearing age: 15-44 years. Sources: North Carolina Health Professions Data System, with data from the North Carolina Board of Nursing; Midwifery Joint Committee, 2011; US Census Bureau and Office of Management and Budget, 2013.

Over 99% of NC births are in hospitals but rapid growth in home births
297
388
602
0
100
200
300
400
500
600
700
2001 2005 2008
Nu
mb
er
of
Ho
me
Bir
ths
Year
Number of Home Births, North Carolina, 2001-2008
Sources: Centers for Disease Control and Prevention. National Center for Health Statistics. VitalStats. www.cdc.gov/nchs/vitalstats.htm, accessed 2/25/14.
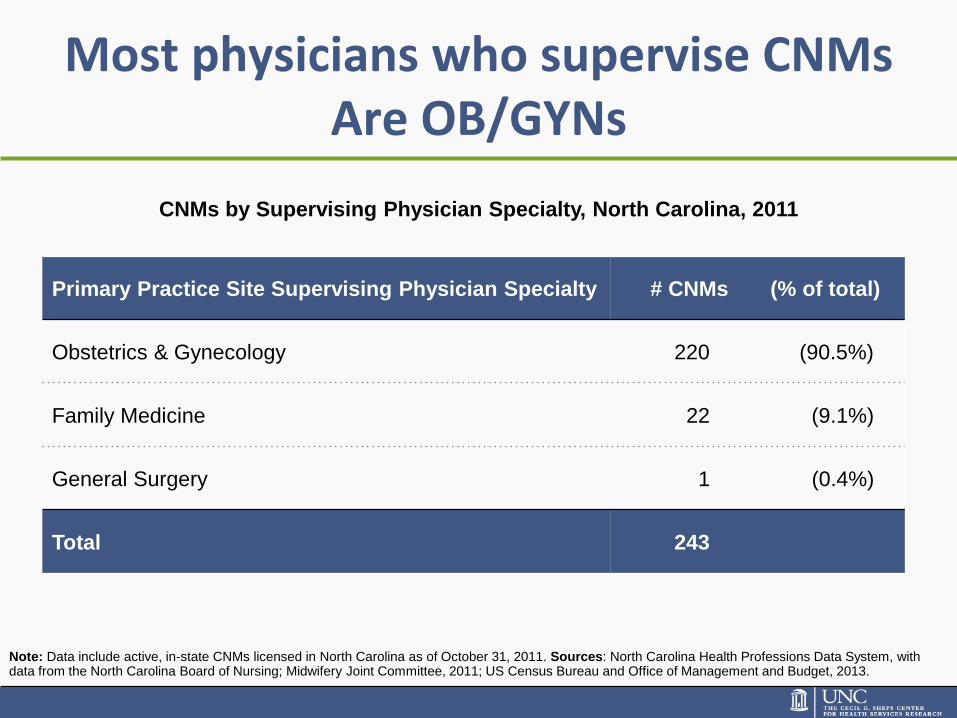
Most physicians who supervise CNMs Are OB/GYNs
Primary Practice Site Supervising Physician Specialty # CNMs (% of total)
Obstetrics & Gynecology 220 (90.5%)
Family Medicine 22 (9.1%)
General Surgery 1 (0.4%)
Total 243
Note: Data include active, in-state CNMs licensed in North Carolina as of October 31, 2011. Sources: North Carolina Health Professions Data System, with data from the North Carolina Board of Nursing; Midwifery Joint Committee, 2011; US Census Bureau and Office of Management and Budget, 2013.
CNMs by Supervising Physician Specialty, North Carolina, 2011
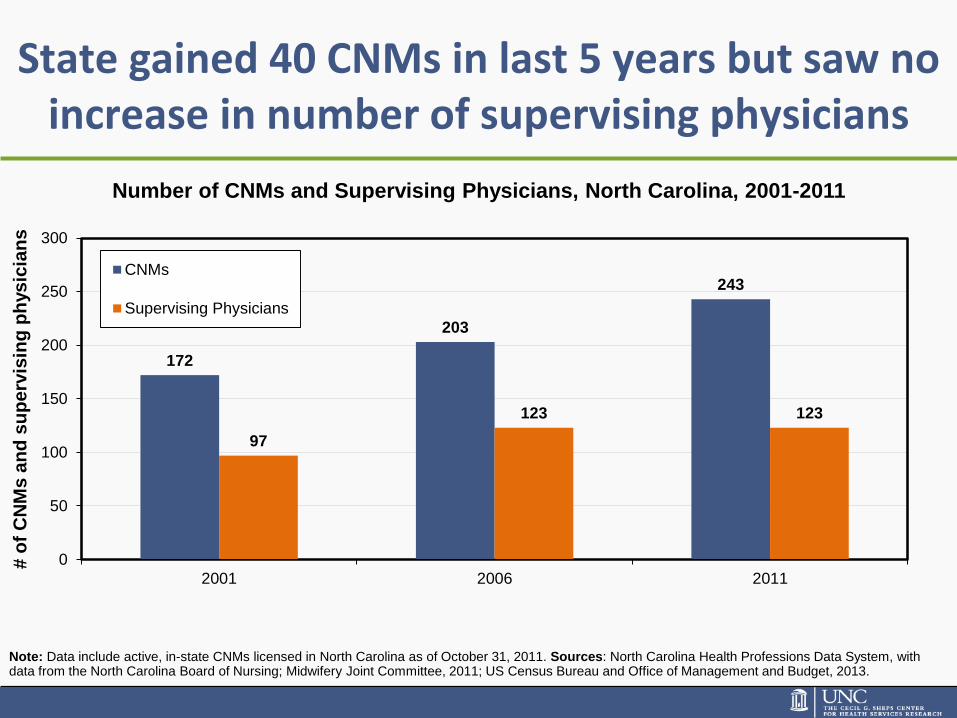
State gained 40 CNMs in last 5 years but saw no increase in number of supervising physicians
172
203
243
97
123 123
0
50
100
150
200
250
300
2001 2006 2011
# o
f C
NM
s a
nd
su
pe
rvis
ing
ph
ys
icia
ns
CNMs
Supervising Physicians
Number of CNMs and Supervising Physicians, North Carolina, 2001-2011
Note: Data include active, in-state CNMs licensed in North Carolina as of October 31, 2011. Sources: North Carolina Health Professions Data System, with data from the North Carolina Board of Nursing; Midwifery Joint Committee, 2011; US Census Bureau and Office of Management and Budget, 2013.
Note: Data include active, in-state CNMs licensed in North Carolina as of October 31, 2011. Sources: North Carolina Health Professions Data System, with data from the North Carolina Board of Nursing; Midwifery Joint Committee, 2011; US Census Bureau and Office of Management and Budget, 2013.
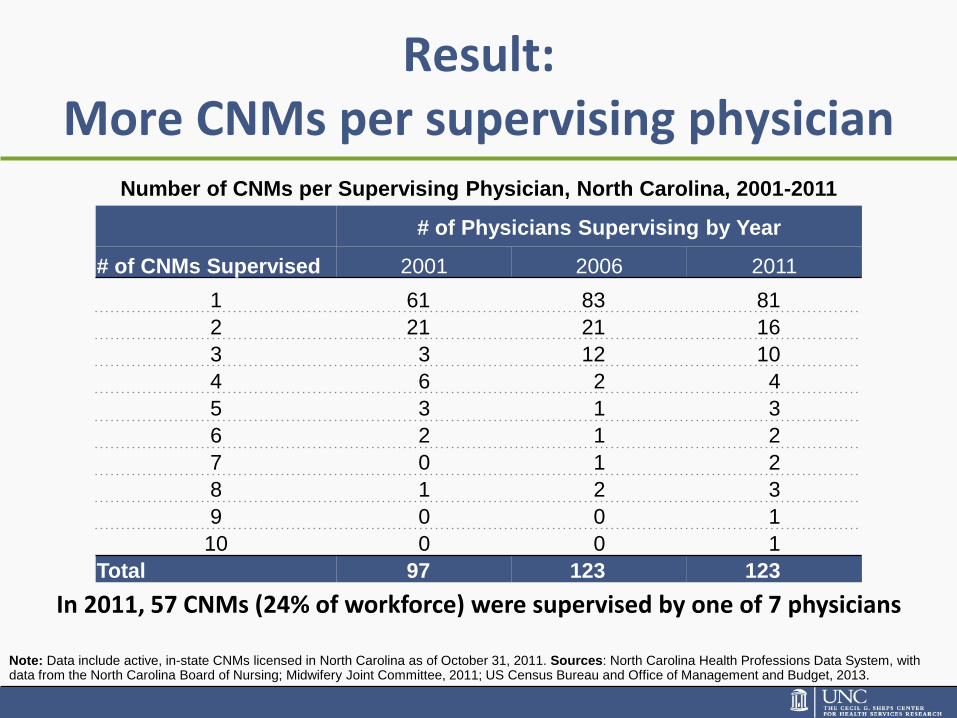
Result: More CNMs per supervising physician
# of Physicians Supervising by Year
# of CNMs Supervised 2001 2006 2011
1 61 83 81
2 21 21 16
3 3 12 10
4 6 2 4
5 3 1 3
6 2 1 2
7 0 1 2
8 1 2 3
9 0 0 1
10 0 0 1
Total 97 123 123
In 2011, 57 CNMs (24% of workforce) were supervised by one of 7 physicians
Number of CNMs per Supervising Physician, North Carolina, 2001-2011
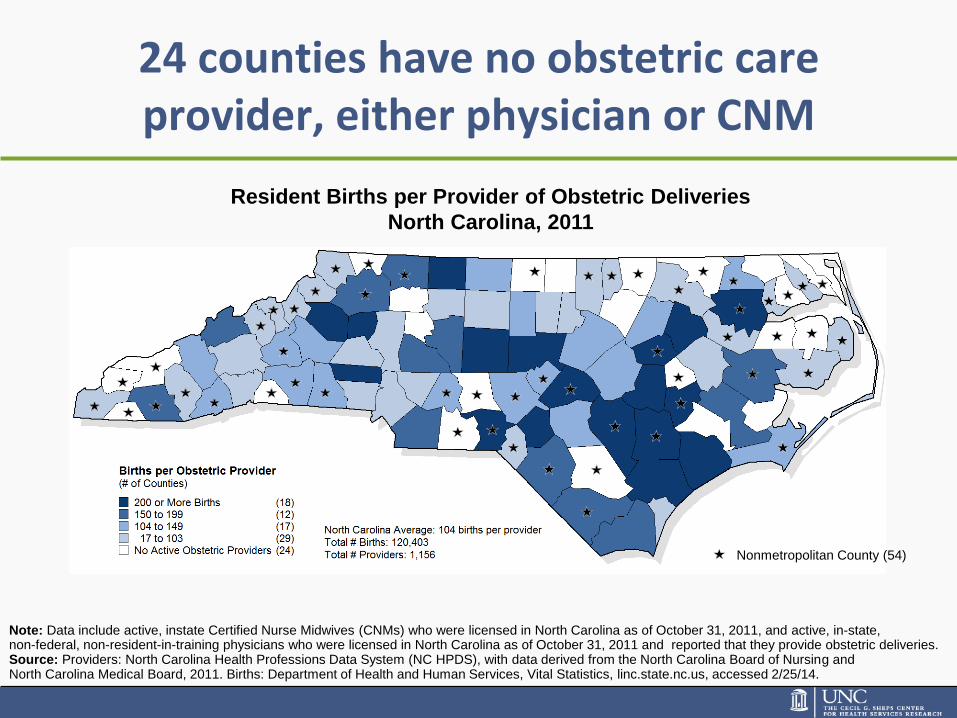
24 counties have no obstetric care provider, either physician or CNM
Note: Data include active, instate Certified Nurse Midwives (CNMs) who were licensed in North Carolina as of October 31, 2011, and active, in-state, non-federal, non-resident-in-training physicians who were licensed in North Carolina as of October 31, 2011 and reported that they provide obstetric deliveries. Source: Providers: North Carolina Health Professions Data System (NC HPDS), with data derived from the North Carolina Board of Nursing and North Carolina Medical Board, 2011. Births: Department of Health and Human Services, Vital Statistics, linc.state.nc.us, accessed 2/25/14.
Resident Births per Provider of Obstetric Deliveries
North Carolina, 2011
Nonmetropolitan County (54)

Questions?
Erin Fraher, PhD MPP
Director
Program on Health Workforce Policy and Research
919-966-5012
http://www.healthworkforce.unc.edu

5.4
4.7
0.0
1.0
2.0
3.0
4.0
5.0
6.0
US NC
Ra
tio
pe
r 1
0K
po
pu
lati
on
North Carolina has slightly fewer Ob-Gyns per capita than US average
Ob-Gyns per 10,000 population, United States and North Carolina, 2011

And 72 of NC’s counties are below the state average of OBGYNs-to-childbearing population
OBGYNs per 10,000 Childbearing Age* Females
North Carolina, 2011
Note: *Childbearing age: 15-44 years. Data include active, instate , nonfederal, non-resident-in-training physicians licensed in North Carolina as of October 31, 2011 who reported a primary area of practice of “Obstetrics and Gynecology.” Sources: North Carolina Health Professions Data System, with data from the North Carolina Medical Board, 2011; US Census Bureau and Office of Management and Budget, 2013.