Embed Size (px)
Citation preview

1
Trends in North America
Terminal Operations
Nick TaroSenior Vice President APMT
April 26, 2006

2
Volume- ContainersU.S. Container growth rate is 1 million TEUS per yearWorldwide fleet of containers at the beginning of 2005 was 13 million with overall capacity of approx 20 million TEUS
Container TEU Volume
2000 2005 % Change
New York/New Jersey 3,050,746 4,792,922 57%
Port of Virginia 1,375,000 1,981,955 44%
Port of Long Beach 4,600,787 6,709,818 46%
Port of Los Angeles 4,879,428 7,484,624 53%
Port of Seattle 1,488,267 2,087,929 40%
Port of Tacoma 1,320,272 2,063,264 56%
Source: US DOT MARAD 2004 Vessel Call Report
3
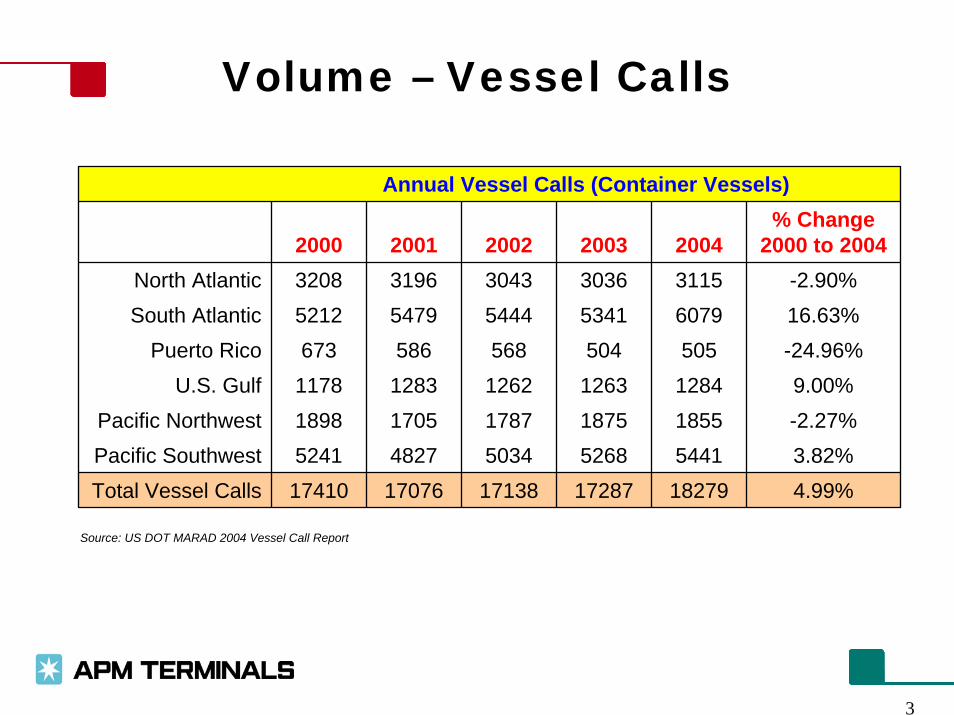
Volume – Vessel Calls
Annual Vessel Calls (Container Vessels)
2000 2001 2002 2003 2004% Change
2000 to 2004North Atlantic 3208 3196 3043 3036 3115 -2.90%South Atlantic 5212 5479 5444 5341 6079 16.63%
Puerto Rico 673 586 568 504 505 -24.96%U.S. Gulf 1178 1283 1262 1263 1284 9.00%
Pacific Northwest 1898 1705 1787 1875 1855 -2.27%Pacific Southwest 5241 4827 5034 5268 5441 3.82%Total Vessel Calls 17410 17076 17138 17287 18279 4.99%
Source: US DOT MARAD 2004 Vessel Call Report

4
Volume – Total CapacityAnnual Vessel Calls (container vessels)
2002 2003 2004 2005
New York 2121 2296 2331 2370
Baltimore 381 337 372 376
Virginia Ports 1529 1064 1717 1731
Charleston 1393 1402 1481 1464
Savannah 1085 1258 1227 1386
Houston 772 748 787 874
LA/Long Beach 2779 2975 3082 2812
Tacoma 529 533 526 618
Seattle 781 748 760 808 4345402337833538Seattle
3590407241293948Tacoma
4103381137153559LA/Long Beach
2513248025682383Houston
3536351934623205Savannah
3323324733063206Charleston
3224319231813099Virginia Ports
2804284329192797Baltimore
3326324832103084New York
2005200420032002
Average TEU Capacity Per Vessel
Source: US DOT MARAD Vessel Call Statistics
Savannah has seen a 28% increase in vessel calls in 4 years
New York, Virginia, Houston and Tacoma have all seen over 12% increase in vessel calls in 4 years
The TEU capacity of ships calling Seattle has increased by 23% in 4 years
New York, Savannah and Long Beach have seen the TEU Capacity of ships grow by over 8% in 4 years

5
Terminal Capacity
Many ports expecting to reach capacity by 2007Marine terminals on the west coast handle 3500 TEUs per Acre- Port of Houston averages 5887 TEUs per acre
Increasing the stacking density will increase terminal capacityRequires equipment that can stack higherRequires technology to optimize yard space
Marine terminals are using off dock empty depots and are removing chassis from terminals in order to increase throughput capacityMarine terminals are charging export demurrage and reducing free time so that customers do not use the terminals as storage facilities.

6
Terminal Capacity - ExpansionU.S. Public Port Capital Expenditures (thousands of Dollars)
1946-2003 % of Expenditures 2004-2008 % of Expenditures
North Atlantic $ 4,772,217.00 19% $ 1,472,197.00 14%
South Atlantic $ 3,924,617.00 15% $ 2,348,159.00 22%
Gulf $ 4,664,280.00 18% $ 2,012,895.00 19%
South Pacific $ 9,004,730.00 35% $ 3,626,281.00 34%
North Pacific $ 3,013,504.00 12% $ 1,099,914.00 10%
Totals $25,379,348.00 $10,559,446.00 Source: US DOT Nov 2005 Report
Data based on 45 Port Authorities and Terminal OperatorsOf the $10,559,446 being spent 2004-2008, $4,331,111 is on container terminals and $1,732,908 is for the infrastructure of the terminals (i.e. road, rail, utilities etc)
7
Environmental, Safety and SecurityMaritime Transportation Act of 2002 (MTSA)
Has strengthened and added protective layers of defense to our Nation’s Port securityMARSEC System – mirrors the Homeland Security Levels (color coded system) – USCG issues MARSEC directives setting forth mandatory measuresMTSA requires each terminal operator to have a trained Facility Security Officer (FSO) and they must have a Facility Security Plan (FSP)
The International Ship and Port Facility Security Code (ISPS Code) –Comprehensive set of measures to enhance the security of ships and port facilities developed after 9/11ISPS Codes formalizes and standardizes global security measures

8
Environmental, Safety and Security

9
Environmental, Safety and Security
Through 2004, ports have received over $515 million in Federal Grant funding for port securityIt is expected that port facility security costs to meet the MTSA act of 2002 will be $5.4 billion over the next 10 years.

10
Cost
Technology and organizational innovations, efficiency gains and cost reductions have been passed to shippers in the form of lower rates and improved service. Terminal operators are being pushed to lower the cost per lift while increasing productionCost of providing enhanced security, vacis exams are being passed on to the customers
11
Productivity
All terminals are looking to increase productivityTechnology advancements to automate yardsTwin pick and quad lift spreader bars on cranes RTGS with GPS auto pilotOCR and RFID to increase traffic flow

12
Customer Demands
Demand a greater reliability at lower costsReal time and accurate updates via technology
Cargo releases, Vessel production, etcReduced turn time in terminals –
Most drivers are paid per move, not hourlyIncreased vessel production in order for ships to spend less time in ports

13
Truck PowerTruck traffic is projected to double by 2025National Highway System consists of approximately 160,000 miles of Federal, State and Local roadwaysPier Pass – in Los Angeles and Long Beach – in first five months, shifted 1.2 million truck moves to night and weekend gates. Now 40% of truck traffic work on off peak hoursRising fuel costs make it difficult to keep drivers if fuel surcharges are not offeredSome Marine Terminals work via appointment systems to control the truck volume in the terminal

14
Rail Links
The Nation’s rail system consists of a private rail network with 174,000 miles of track connecting all 48 contiguous states as well as Canada and Mexico.BNSF Railway, Union Pacific Railroad, Norfolk Southern and CSX are each spending more than $1 billion this year to add tracks, increase intermodal capacity, purchase locomotives and rail cars, and hire more crew

15
CompetitionNumber of competitors is decreasing as stevedores merge and terminal operators buy other operatorsIn 2004 the top 25 U.S. container ports handled more than 98% of the total volume of containerized cargoTerminal operations is a narrow margin businessBusiness is not always awarded based on ‘base rates’ but the service levels the terminal operator commits to as well as the ‘extras’ that are included in the base rate