Embed Size (px)
Citation preview

Trends in International Migration
70
© OECD 2003
C. RECENT TRENDS IN INTERNATIONAL MIGRATION IN ASIA AND CENTRAL AND EASTERN EUROPE
The 2001 edition of Trends in International Migrationfocused on Asian Migration to OECD countries. In thecurrent report, particular is accorded to migration flowswithin Asia. The trends presented below concern
Main Trends in International Migration
71
© OECD 2003
several countries of East and South-East Asia and arebased on information collected within the frameworkof the Annual Workshop on international migrationand the labour market (Tokyo 4-5 February 2002).This workshop was organised by the Japanese author-ities with the participation of the ILO and the OECD.Concerning migration in Central and Eastern Europe,the focus is on trends in migrations flows from and inthis region as well as on the impact of the EU enlarge-ment on migration.
1. Recent developments in migration flows within East and South-East Asia6
a) Background and major recent trends
The fragility of East and Southeast Asian econo-mies was revealed in the aftermath of the terrorist
attacks on the World Trade Center in New York onSeptember 11 2001. Just as they appeared to berecovering from the effects of the 1997 Asian financialcrisis, these economies were once again thrust into anenvironment of declining regional and globaldemand. There are, of course, significant variationsbut most Asian economies had resumed growthby 1999 and several, including Hong Kong, Singapore,Korea and Malaysia had achieved rapid growthby 2000 (see Table I.19). Then came a rapid reversal.In 2001, Singapore was in its first recession since inde-pendence; Hong Kong, too, experienced negativegrowth and Japan, which had never really recoveredfrom the collapse of its bubble economy in 1989, wasin full recession. Even Chinese Taipei, which hadavoided the worst effects of the Asian financial crisis,appears to be entering a period of slower growth. OnlyKorea may be on a more sustained course to recovery.
Box I.8. Linguistic competence and integration into the labour marketTheme box on the Integration of Immigrants
Proficiency in the language of the host country is an essential factor in the successful integration ofimmigrants into the labour market. This facilitates communication at the workplace and is a condition of accessto the information network (access to job vacancies, social exchanges, labour laws…). The acquisition oflinguistic skills is dependant on numerous elements, such as the length of stay, age at the time of migration, thelevel of educational attainment of the migrant and his/her parents, whether or not there is a large ethnic group inthe area of residence or whether there is any link between the mother tongue and the language of the hostcountry. (see for example Dustman, 1994, in Germany; Carliner,1995, in the United States; Chiswick and Miller,2000, in Canada; Shields and Price, 2001, in the United Kingdom; Chiswick, Lee and Miller in Australia).
Since the pioneer work of Reimers (1983) and Grenier (1984), up to the more recent studies undertaken byChiswick and Miller (2002), most studies identify a significant and positive impact, on a comparable scale, of theeffects of linguistic competence on employment and the conditions of pay.1 However, all things being equal, it mustbe noted that immigrants capable of expressing themselves, who are able to write and understand the language ofthe host country, will receive a salary of at least 10% higher than those who lack these competencies. This result isconfirmed if we take into consideration the bias of selective recruitment and the problems of evaluating linguisticability. In the case of Israel, several studies present estimations of salary differences of over 20% (e.g. Berman et al.,2000; Chiswick, 1998). Besides, mastering the language of the host country seems equally to facilitate access to thelabour market as well as positions of responsibility (Minns, 1999; Miller and Neo, 1997; Koussoudji, 1988).
Linguistic competence exerts, nevertheless, an impact of a certain importance according to gender(i.e. notably in the case of women – Shields and Price, 2001; Beiser and Hou, 2000; Chiswick and Miller, 1999),depending on the origin of the immigrants (e.g., more notably for Cubans and Portoricans than for Mexicans inthe United States – Reimers, 1983), according to level of education ( i.e. illustrating a phenomenon ofcomplementarity between education and linguistic competence – Chiswick and Miller, 2002), relative to theplace of residence (i.e. higher in urban areas than in rural zones – McManus, 1990) or relative to the size of theethnic group (i.e. decrease in importance when the ethnic group is a large one; MacManus, 1990). Finally, someauthors find that familiarity in speaking the language is more important than competency in reading and writing(Chiswick, 1991), while some place a high emphasis on the role of writing (Gonzales, 2000; Dustman, 1994) otherrecognise the cross-effect (e.g. the necessity of reading and speaking well – Chiswick and Miller, 1999).
1. Hayfron (2001) in the case of Norway as well as Cornelius and Tsuda (2002) for Japan are, to our knowledge, the only twostudies which do not find a link between the linguistic competence of immigrants and their labour market performance. Therepresentative element of the data used in these two studies must, however, be viewed with caution.
Trends in International Migration
72
© OECD 2003
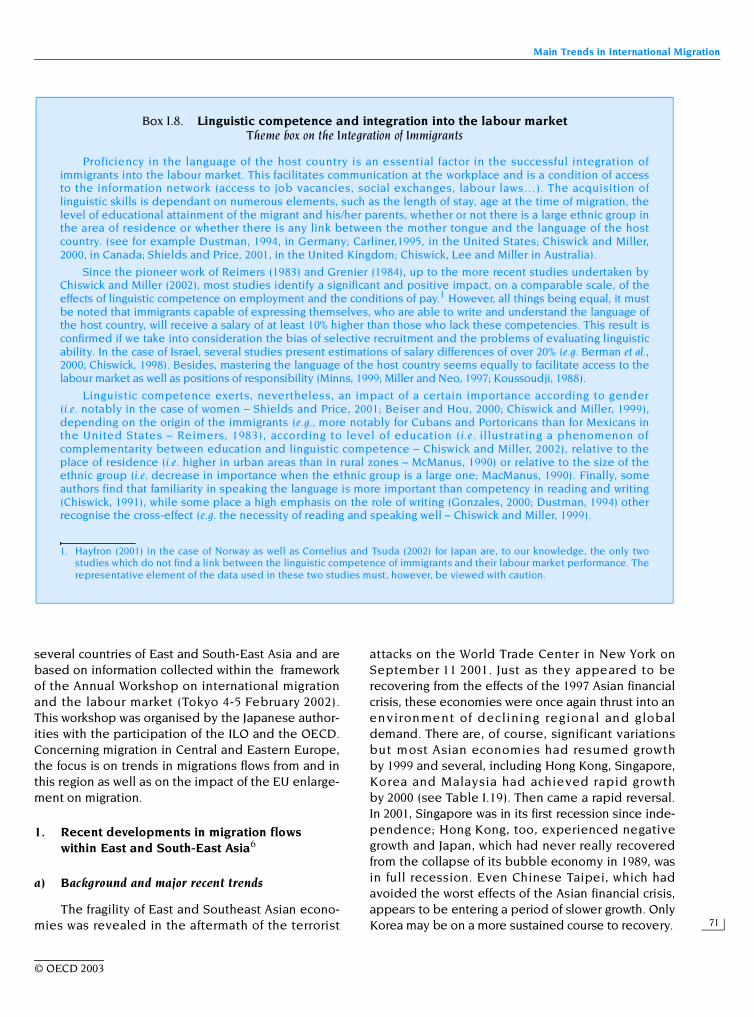
Even during the brief recoveries in economicgrowth in the aftermath of the Asian financial crisis,unemployment proved persistent and rose markedlyin the renewed downturn in 2001. It is now at all-timehighs in the recent histories of Hong Kong, Singaporeand Chinese Taipei with no suggestion of a reversal inthe immediate future (see Table I.20). The structuraladjustments that these tiger economies and Japanare undergoing that have seen an export of labour-intensive manufacturing and an increasing reliance onhigh-tech industries, underlies this persistence ofunemployment. While labour deficits emerge inmodern sectors, labour surpluses increase in moretraditional sectors.
The East and Southeast Asian economies underconsideration are all characterized by movementsboth into and out of their respective territories. It isaltogether too simple to conceptualize economiesinto sending and receiving areas. All have inflows as
well as outflows, although the composition and rela-tive volume of the flows vary. For example, thePhilippines can be considered as a country ofemigration par excellence with over 7 million of itscitizens living or working overseas, but that country,too, also imports highly skilled migrants to assist incertain key sectors of the economy. In 1999, therewere almost six thousand foreign workers in thePhilippines, the majority of whom were Japaneseexecutives, a tiny number compared with the numberof emigrants but nevertheless significant for the localeconomy. Indonesia also follows this general pattern,while Thailand and Malaysia both import and exportlarge numbers of workers and Japan, Korea, ChineseTaipei, Singapore and Hong Kong are all economiesof net immigration.
Any population movement in Asia has to beplaced in its demographic context of decliningfertility in the region. Fertility levels have fallen
Table I.19. Real GDP growth in selected Asian countries and in Australia, 1996-2001Percentages
Sources: Asian Development Bank, Key Indicators of Developing Asian and Pacific Countries, 2002 and OECD Economic Outlook, No. 71, June 2002.
1996 1997 1998 1999 2000 2001
Chinese Taipei 6.1 6.7 4.6 5.4 5.9 –1.9Hong Kong (China) 4.5 5.0 –5.3 3.0 10.5 0.1Japan 3.5 1.8 –1.1 0.7 2.4 –0.4Korea 6.8 5.0 –6.7 10.9 9.3 3.0Singapore 7.7 8.5 – 6.9 10.3 –2.0Indonesia 8.0 4.5 –13.2 0.9 4.8 3.3Malaysia 10.0 7.3 –7.4 6.1 8.3 0.4Philippines 5.8 5.2 –0.5 3.3 4.0 3.4Thailand 5.9 –1.4 –10.8 4.4 4.6 1.8China 9.6 8.8 7.1 7.8 8.0 7.3Vietnam 9.3 8.2 4.4 4.7 6.1 6.8Australia 4.0 3.5 5.4 4.5 3.4 2.4
Table I.20. Unemployment rates in selected Asian countries and in Australia, 1996-2001Per cent of total labour force
Sources: Asian Development Bank, Asia Recovery Information Centre and OECD Economic Outlook, No. 71, June 2002.
1996 1997 1998 1999 2000 2001
Chinese Taipei 2.6 2.7 2.7 2.9 3.0 4.4Hong Kong (China) 2.8 2.2 2.7 2.9 3.4 6.7Japan 3.4 3.4 4.1 4.7 4.7 5.0Korea 2.0 2.6 6.8 6.3 4.1 3.5Singapore 3.0 2.4 3.2 4.6 4.4 5.0Indonesia 4.9 4.7 5.5 6.4 6.1 –Malaysia 2.5 2.6 3.2 3.4 3.1 3.7Philippines 8.6 8.7 10.1 9.7 12.0 –Thailand 1.1 0.9 3.4 3.0 2.4 –China 3.0 3.1 3.1 3.1 3.1 3.6Vietnam 5.9 6.0 6.9 6.7 6.4 –Australia 8.2 8.3 7.7 7.0 6.3 6.7
Main Trends in International Migration
73
© OECD 2003
precipitously in Japan and most of the Chineseculture areas (see Table I.21). With the exception ofChina itself, these areas tend to be the destinationsfor migration as economies come to terms with veryslow growth in their labour forces. Conversely, thosecountries with higher fertility tend to be areas oforigin of migration.
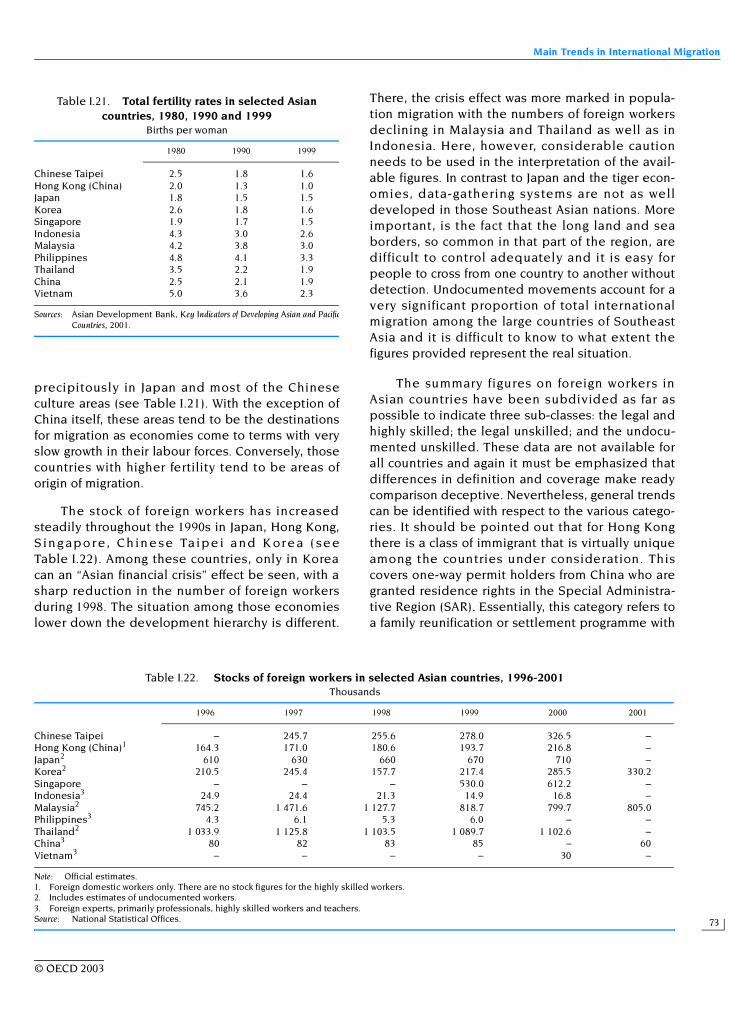
The stock of foreign workers has increasedsteadily throughout the 1990s in Japan, Hong Kong,S in g apo r e, Ch in e se Ta ipe i a nd K or e a ( se eTable I.22). Among these countries, only in Koreacan an “Asian financial crisis” effect be seen, with asharp reduction in the number of foreign workersduring 1998. The situation among those economieslower down the development hierarchy is different.
There, the crisis effect was more marked in popula-tion migration with the numbers of foreign workersdeclining in Malaysia and Thailand as well as inIndonesia. Here, however, considerable cautionneeds to be used in the interpretation of the avail-able figures. In contrast to Japan and the tiger econ-omies, data-gathering systems are not as welldeveloped in those Southeast Asian nations. Moreimportant, is the fact that the long land and seaborders, so common in that part of the region, aredifficult to control adequately and it is easy forpeople to cross from one country to another withoutdetection. Undocumented movements account for avery significant proportion of total internationalmigration among the large countries of SoutheastAsia and it is difficult to know to what extent thefigures provided represent the real situation.
The summary figures on foreign workers inAsian countries have been subdivided as far aspossible to indicate three sub-classes: the legal andhighly skilled; the legal unskilled; and the undocu-mented unskilled. These data are not available forall countries and again it must be emphasized thatdifferences in definition and coverage make readycomparison deceptive. Nevertheless, general trendscan be identified with respect to the various catego-ries. It should be pointed out that for Hong Kongthere is a class of immigrant that is virtually uniqueamong the countries under consideration. Thiscovers one-way permit holders from China who aregranted residence rights in the Special Administra-tive Region (SAR). Essentially, this category refers toa family reunification or settlement programme with
Table I.21. Total fertility rates in selected Asian countries, 1980, 1990 and 1999
Births per woman
Sources: Asian Development Bank, Key Indicators of Developing Asian and PacificCountries, 2001.
1980 1990 1999
Chinese Taipei 2.5 1.8 1.6Hong Kong (China) 2.0 1.3 1.0Japan 1.8 1.5 1.5Korea 2.6 1.8 1.6Singapore 1.9 1.7 1.5Indonesia 4.3 3.0 2.6Malaysia 4.2 3.8 3.0Philippines 4.8 4.1 3.3Thailand 3.5 2.2 1.9China 2.5 2.1 1.9Vietnam 5.0 3.6 2.3
Table I.22. Stocks of foreign workers in selected Asian countries, 1996-2001Thousands
Note: Official estimates.1. Foreign domestic workers only. There are no stock figures for the highly skilled workers.2. Includes estimates of undocumented workers.3. Foreign experts, primarily professionals, highly skilled workers and teachers.Source: National Statistical Offices.
1996 1997 1998 1999 2000 2001
Chinese Taipei – 245.7 255.6 278.0 326.5 –Hong Kong (China)1 164.3 171.0 180.6 193.7 216.8 –Japan2 610 630 660 670 710 –Korea2 210.5 245.4 157.7 217.4 285.5 330.2Singapore – – – 530.0 612.2 –Indonesia3 24.9 24.4 21.3 14.9 16.8 –Malaysia2 745.2 1 471.6 1 127.7 818.7 799.7 805.0Philippines3 4.3 6.1 5.3 6.0 – –Thailand2 1 033.9 1 125.8 1 103.5 1 089.7 1 102.6 –China3 80 82 83 85 – 60Vietnam3 – – – – 30 –
Trends in International Migration
74
© OECD 2003
the majority entering the city under this category aseither minor children or spouses of Hong Kong men.Their number is currently set at 150 a day.
It is worth reiterating that many of those wholeave Asian economies as immigrants or as more orless permanent settlers are highly skilled. Almost onethird of the emigrants from Hong Kong to Australia andone seventh of immigrants arriving in Canada in theearly 1990s were holders of a university degree. Thefact that many choose not to become permanent immi-grants but become either return migrants, migrants tothird country destinations or transnational circulatorsafter obtaining a new citizenship does not invalidatethe essentially longer-term intent of this migrationflow. While these groups will not be entirely ignored inthe following discussion, the focus will be more onhighly skilled worker and student flows.
b) Flows of highly skilled workers: must we speak about brain drain?
During the second half of the 1990s, Asiansmade up between one third to two fifths of settlerarrivals to Australia and a significant trend has beenthe substantial shift towards skills and businessmigration and away from family-based criteria.Canada was the pioneer of managing its migrationthrough a points-based system of selection and nowtakes over a quarter of its total intake from just twocountries, China and India. The United States, whilestill maintaining its emphasis in its immigration onfamily reunification, has adjusted its intake toincrease the proportion of independent, qualifiedand business immigrants.
Quite apart from these trends in long-term immi-gration policy an equally significant shift has beentowards admitting increasing numbers of workers toNorth American countries and Australia under someform of temporary admission programme. In theUnited States, the numbers admitted under the H-1Bprogramme, introduced in 1992 with an annual ceilingof 65 000. The ceiling was increased to 115 000 in 1999and then again to 195 000 between 2001 and 2003showing the marked growth in importance of thischannel. China, India, Japan and the Philippinesaccounted for almost two thirds of the 65 000 intakein 1999, with India accounting for the vast majority.Migrants who enter with a H-1B visa are entitled toremain in the United States for up to six years.Australia, too, appears to have shifted towards agreater reliance on temporary entrants who may, in
the late 1990s, have reached over 400 000, or 2-3% ofthe resident population.
While destination countries have increasedtheir intake of the highly skilled through shifts insettler intake and by developing shorter-term entryprogrammes, the countries of origin can consider theloss of personnel not to be in their best interests.The so-called “brain drain” has tended to be seenas negative for countries of origin. It has to beconsidered however in the context of “brain gain”and “brain exchange”. It is important to bear in mindthat the total number of highly skilled who aremoving in, among and from Asian countries is quitesmall relative to the total populations of the econo-mies concerned and even relative to the availablepool of skilled labour itself.
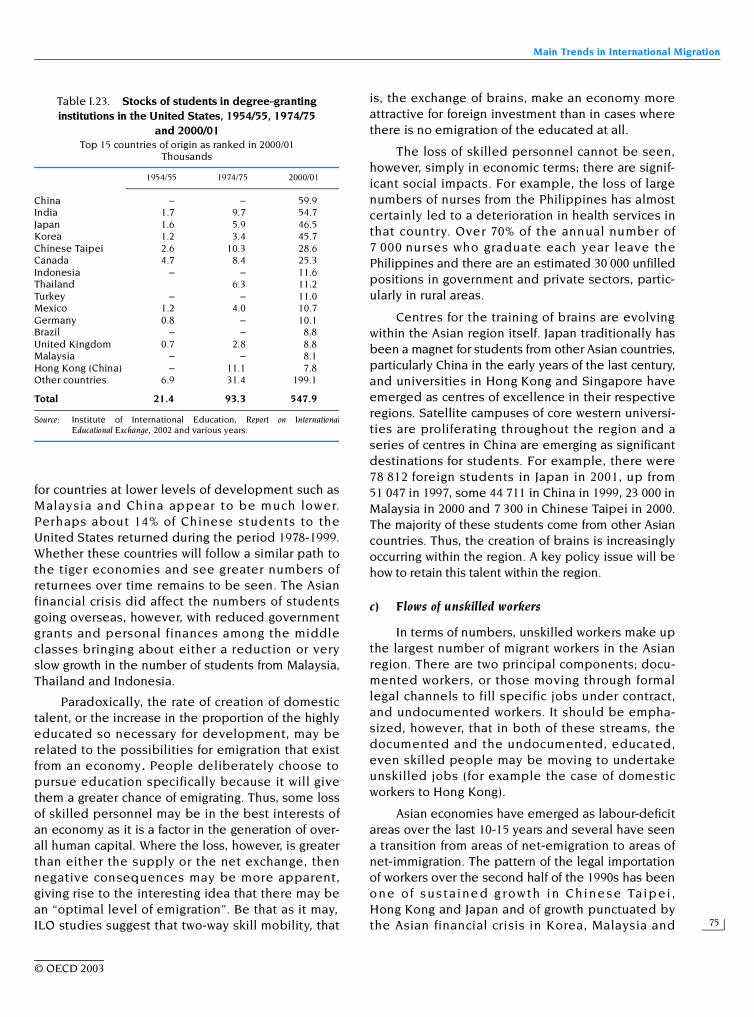
Nevertheless, the movement of small numbers ofhighly qualified people can have a significant impacton particular sectors of the labour market and on socialand economic development, particularly in the contextof an increasing competition for skills in the globalisedeconomy. The debate can perhaps be best illustratedby examining the movement of students from Asianeconomies to tertiary institutions overseas. The UnitedStates has for long been the principal destination with30% of the 34 232 foreign students in 1954/55 comingfrom Asian countries. By 2000/01, there were547 867 foreign students registered in degree-grantinginstitutions in the United States, with seven of theleading eight sources of the students being Asiancountries (see Table I.23). Nearly 21% came from Chinaand India alone.
Taking the example of Chinese Taipei, it can beseen that relatively few students returned during theearly period of student migration overseas in the 1960sand 1970s. The numbers of those returning acceleratedthroughout the 1980s until the mid-1990s when govern-ment subsidies for return were removed and manyreturnees, coming back on their own account, may nothave registered. Thus, the more recent data are notstrictly comparable. Nevertheless, it seems clear that,by the 1990s, development in Chinese Taipei hadreached the level where significant numbers ofstudents returned and fewer chose to leave in the firstplace, being able to receive a quality education athome. Only 937 students returned to Chinese Taipei in1980 compared with some 6 510 in 1994 and the returnrate in 1988 was estimated at around 32%, three timesthe return rate in 1980.
While many highly skilled migrants may havereturned to Chinese Taipei, or to Korea, return rates
Main Trends in International Migration
75
© OECD 2003
for countries at lower levels of development such asMalaysia and China appear to be much lower.Perhaps about 14% of Chinese students to theUnited States returned during the period 1978-1999.Whether these countries will follow a similar path tothe tiger economies and see greater numbers ofreturnees over time remains to be seen. The Asianfinancial crisis did affect the numbers of studentsgoing overseas, however, with reduced governmentgrants and personal finances among the middleclasses bringing about either a reduction or veryslow growth in the number of students from Malaysia,Thailand and Indonesia.
Paradoxically, the rate of creation of domestictalent, or the increase in the proportion of the highlyeducated so necessary for development, may berelated to the possibilities for emigration that existfrom an economy. People deliberately choose topursue education specifically because it will givethem a greater chance of emigrating. Thus, some lossof skilled personnel may be in the best interests ofan economy as it is a factor in the generation of over-all human capital. Where the loss, however, is greaterthan either the supply or the net exchange, thennegative consequences may be more apparent,giving rise to the interesting idea that there may bean “optimal level of emigration”. Be that as it may,ILO studies suggest that two-way skill mobility, that
is, the exchange of brains, make an economy moreattractive for foreign investment than in cases wherethere is no emigration of the educated at all.
The loss of skilled personnel cannot be seen,however, simply in economic terms; there are signif-icant social impacts. For example, the loss of largenumbers of nurses from the Philippines has almostcertainly led to a deterioration in health services inthat country. Over 70% of the annual number of7 000 nurses who graduate each year leave thePhilippines and there are an estimated 30 000 unfilledpositions in government and private sectors, partic-ularly in rural areas.
Centres for the training of brains are evolvingwithin the Asian region itself. Japan traditionally hasbeen a magnet for students from other Asian countries,particularly China in the early years of the last century,and universities in Hong Kong and Singapore haveemerged as centres of excellence in their respectiveregions. Satellite campuses of core western universi-ties are proliferating throughout the region and aseries of centres in China are emerging as significantdestinations for students. For example, there were78 812 foreign students in Japan in 2001, up from51 047 in 1997, some 44 711 in China in 1999, 23 000 inMalaysia in 2000 and 7 300 in Chinese Taipei in 2000.The majority of these students come from other Asiancountries. Thus, the creation of brains is increasinglyoccurring within the region. A key policy issue will behow to retain this talent within the region.
c) Flows of unskilled workers
In terms of numbers, unskilled workers make upthe largest number of migrant workers in the Asianregion. There are two principal components; docu-mented workers, or those moving through formallegal channels to fill specific jobs under contract,and undocumented workers. It should be empha-sized, however, that in both of these streams, thedocumented and the undocumented, educated,even skilled people may be moving to undertakeunskilled jobs (for example the case of domesticworkers to Hong Kong).
Asian economies have emerged as labour-deficitareas over the last 10-15 years and several have seena transition from areas of net-emigration to areas ofnet-immigration. The pattern of the legal importationof workers over the second half of the 1990s has beeno ne of susta ine d g rowth in Chine se Taipei ,Hong Kong and Japan and of growth punctuated bythe Asian financial crisis in Korea, Malaysia and
Table I.23. Stocks of students in degree-granting institutions in the United States, 1954/55, 1974/75
and 2000/01Top 15 countries of origin as ranked in 2000/01
Thousands
Source: Institute of International Education, Report on InternationalEducational Exchange, 2002 and various years.
1954/55 1974/75 2000/01
China – – 59.9India 1.7 9.7 54.7Japan 1.6 5.9 46.5Korea 1.2 3.4 45.7Chinese Taipei 2.6 10.3 28.6Canada 4.7 8.4 25.3Indonesia – – 11.6Thailand 6.3 11.2Turkey – – 11.0Mexico 1.2 4.0 10.7Germany 0.8 – 10.1Brazil – – 8.8United Kingdom 0.7 2.8 8.8Malaysia – – 8.1Hong Kong (China) – 11.1 7.8Other countries 6.9 31.4 199.1
Total 21.4 93.3 547.9
Trends in International Migration
76
© OECD 2003
Thailand. In the latter cases, the stock of legal workersdeclined somewhat from 1997-1998 but resumed anupward course quite quickly in Korea and Malaysia.The official data suggest that the number of legalmigrants stabilized in Thailand, but at a considerablylower level than before the crisis. The onset of therecession in 2001 has seen lower numbers ofunskilled workers in Chinese Taipei but not inHong Kong. In early 2002, there are reports of largenumbers of Indonesians being expelled from Malaysia,either those who are found to be illegally in the coun-try or those whose contracts have expired. Malaysiawould like to reduce its dependence on workers fromIndonesia who can easily “disappear” into the localpopulation and increase recruitment of workers froma greater diversity of sources. Given Malaysia’s geog-raphy, and the demography of neighboring countries,any such policy would not appear to have a highprobability of success.
Many of the high-tech industries that East Asianeconomies are promoting, for example, also requiresubstantial numbers of unskilled workers who areinvolved with packaging and dispatch of high-techproducts. These activities are low-paid, involve longhours are boring and involve hard work that anincreasingly highly educated local labour force isunwilling to undertake.
Several of the East and Southeast Asian coun-tries are still significant suppliers of unskilled work-ers through official labour recruitment programmes,both government and private. The Philippines,Indonesia, Thailand and China all fall into thiscategory. China sends workers to some 181 countriesand territories, plus large numbers to regionalfishing fleets. In November 2001, China had 460 000workers abroad who were involved with contractsworth USD13.3 billion in 2001. The Philippines is thecountry of origin of workers par excellence, withsome 866 590 workers overseas in 2001, up from837 020 in 1999. The numbers of Filipinos employedin Asia, however, actually declined over this period,with markets in Europe and the Middle Eastcompensating for these losses. Remittances fromthese workers that pass through official channelswere estimated to have exceeded USD 6 billion in2000 although this figure was down from a recordUSD 6.8 billion in 1999. Thailand, perhaps becauseof its greater reliance on Asian markets, particularlyChinese Taipei, saw a slight decline in the numberof workers overseas from 202 416 in 1999 to 193 041in 2000. Thai workers overseas remitted someUSD 1.5 billion in 2000. As emphasized earlier, a
considerable amount of the monies remitted passesthrough informal channels as do many of the workersthemselves.
d) Foreign workers in an irregular situation
The total numbers of undocumented workersare much more significant in the countries of South-east Asia than they are in East Asia. Also, the dataon those who entered illegally or who enteredlegally and overstayed their visas or changed theirdesignated terms of entry are likely to be muchmore reliable for economies in the latter region thanfor Southeast Asian countries.
The numbers of illegal entrants to Hong Kong,primarily from China, who were caught and deporteddeclined markedly from 14 892 in 1998-99 to only4 397 in 1999-2000 – a far cry from the tens of thou-sands of would-be entrants to the city of just a fewdecades ago. The creation of widespread opportuni-ties in the Pearl River delta region and continuedtight control along the border have all but elimi-nated irregular migration as a major policy concernin the SAR. In Singapore, too, the number of illegalimmigrants apprehended declined sharply from23 000 in 1998 to 16 500 in 2000. The principal reasongiven for the decline is the Asian financial crisisalthough, like the relationship between Hong Kongand Shenzhen, the creation of intervening opportu-nities for migrants across the causeway in Malaysiasurely played a part.
In Chinese Taipei, on the other hand, rising illegalmigration from China appears to be a growing prob-lem. It is estimated that just over half of all those whoenter legally into Korea as trainees “disappear” intothe wider labour force and become overstayers. Korea,the worst affected of the original tiger economies, sawa sharp reduction in undocumented workers from148 048 in 1997 to 99 537 in 1998 following an amnestyfor illegal workers that allowed them to leave the coun-try without paying a fine. As the Korean economyresumed rapid growth the number of undocumentedworkers, too, accelerated markedly from 1998 to reach250 756 in November 2001.
Estimates of up to 1.43 million illegal migrantshave been made for Malaysia before the onset ofthe financial crisis. Official estimates of illegal migra-tion in Malaysia are based on annual apprehensionsthat are difficult to translate into stock estimates.Since 1997, however, the numbers of those appre-hended un der the Ops Nyah exercise s haveincreased and it would seem doubtful that the
Main Trends in International Migration
77
© OECD 2003
number of those eluding capture and residing ille-gally in Malaysia had declined. The social distancebetween certain Indonesian groups, such as theMinangkabau of Sumatra, for example, and ethnicMalays in peninsular Malaysia is much less thanbetween the Minangkabau and the Javanese of thecapital, Jakarta. In both peninsular Malaysia andEast Malaysia, there are virtually invisible minoritiesfrom neighboring countries.
Similarly, in Thailand, the data on the numbersof undocumented workers appear to be distinctly“spongy”. Under the new Prime Minister, TaksinShinawatra, a concerted effort has been made toregister undocumented workers and by the end ofOctober 2001, 562 527 workers had registered forlegal work permits, although it was estimated that afurther 300 000-400 000 undocumented workersremained in the country. Despite statistics to showthat 319 629 workers were arrested in 1999 and444 636 in 2000 these apprehensions do not seem tohave decreased significantly the numbers of undoc-umented workers in the country.
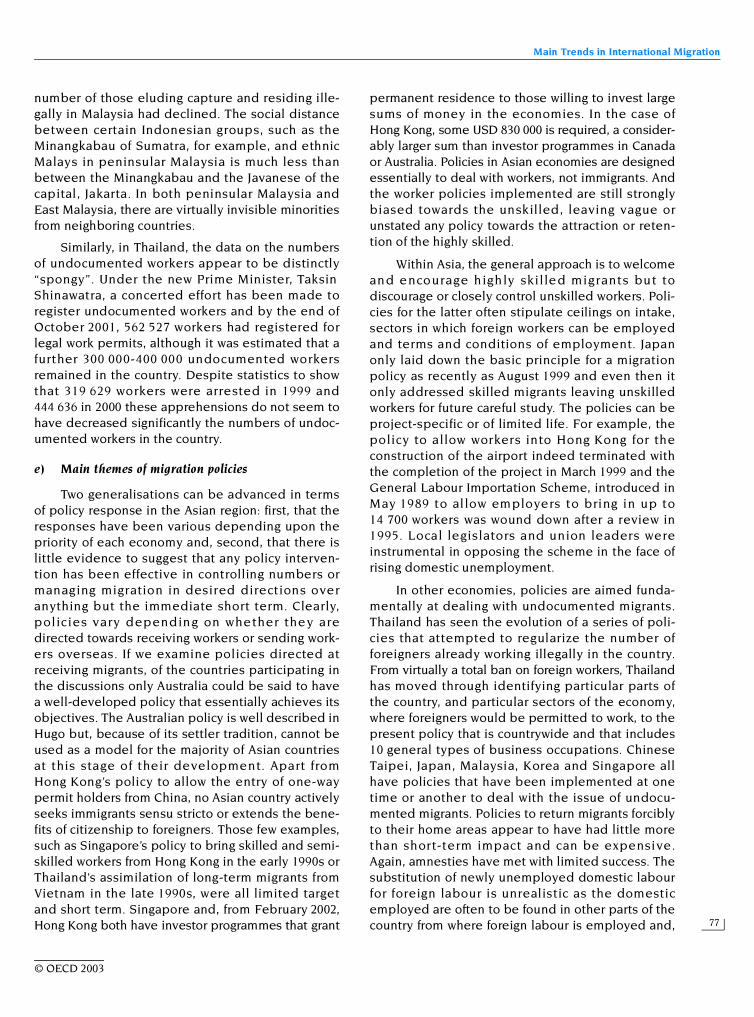
e) Main themes of migration policies
Two generalisations can be advanced in termsof policy response in the Asian region: first, that theresponses have been various depending upon thepriority of each economy and, second, that there islittle evidence to suggest that any policy interven-tion has been effective in controlling numbers ormanaging migration in desired directions overanything but the immediate short term. Clearly,policies vary depending on whether they aredirected towards receiving workers or sending work-ers overseas. If we examine policies directed atreceiving migrants, of the countries participating inthe discussions only Australia could be said to havea well-developed policy that essentially achieves itsobjectives. The Australian policy is well described inHugo but, because of its settler tradition, cannot beused as a model for the majority of Asian countriesat this stage of their development. Apart fromHong Kong’s policy to allow the entry of one-waypermit holders from China, no Asian country activelyseeks immigrants sensu stricto or extends the bene-fits of citizenship to foreigners. Those few examples,such as Singapore’s policy to bring skilled and semi-skilled workers from Hong Kong in the early 1990s orThailand’s assimilation of long-term migrants fromVietnam in the late 1990s, were all limited targetand short term. Singapore and, from February 2002,Hong Kong both have investor programmes that grant
permanent residence to those willing to invest largesums of money in the economies. In the case ofHong Kong, some USD 830 000 is required, a consider-ably larger sum than investor programmes in Canadaor Australia. Policies in Asian economies are designedessentially to deal with workers, not immigrants. Andthe worker policies implemented are still stronglybiased towards the unskilled, leaving vague orunstated any policy towards the attraction or reten-tion of the highly skilled.
Within Asia, the general approach is to welcomeand encourage highly skilled migrants but todiscourage or closely control unskilled workers. Poli-cies for the latter often stipulate ceilings on intake,sectors in which foreign workers can be employedand terms and conditions of employment. Japanonly laid down the basic principle for a migrationpolicy as recently as August 1999 and even then itonly addressed skilled migrants leaving unskilledworkers for future careful study. The policies can beproject-specific or of limited life. For example, thepolicy to allow workers into Hong Kong for theconstruction of the airport indeed terminated withthe completion of the project in March 1999 and theGeneral Labour Importation Scheme, introduced inMay 1989 to allow employers to bring in up to14 700 workers was wound down after a review in1995. Local legislators and union leaders wereinstrumental in opposing the scheme in the face ofrising domestic unemployment.
In other economies, policies are aimed funda-mentally at dealing with undocumented migrants.Thailand has seen the evolution of a series of poli-cies that attempted to regularize the number offoreigners already working illegally in the country.From virtually a total ban on foreign workers, Thailandhas moved through identifying particular parts ofthe country, and particular sectors of the economy,where foreigners would be permitted to work, to thepresent policy that is countrywide and that includes10 general types of business occupations. ChineseTaipei, Japan, Malaysia, Korea and Singapore allhave policies that have been implemented at onetime or another to deal with the issue of undocu-mented migrants. Policies to return migrants forciblyto their home areas appear to have had little morethan short-term impact and can be expensive.Again, amnesties have met with limited success. Thesubstitution of newly unemployed domestic labourfor foreign labour is unrealistic as the domesticemployed are often to be found in other parts of thecountry from where foreign labour is employed and,
Trends in International Migration
78
© OECD 2003
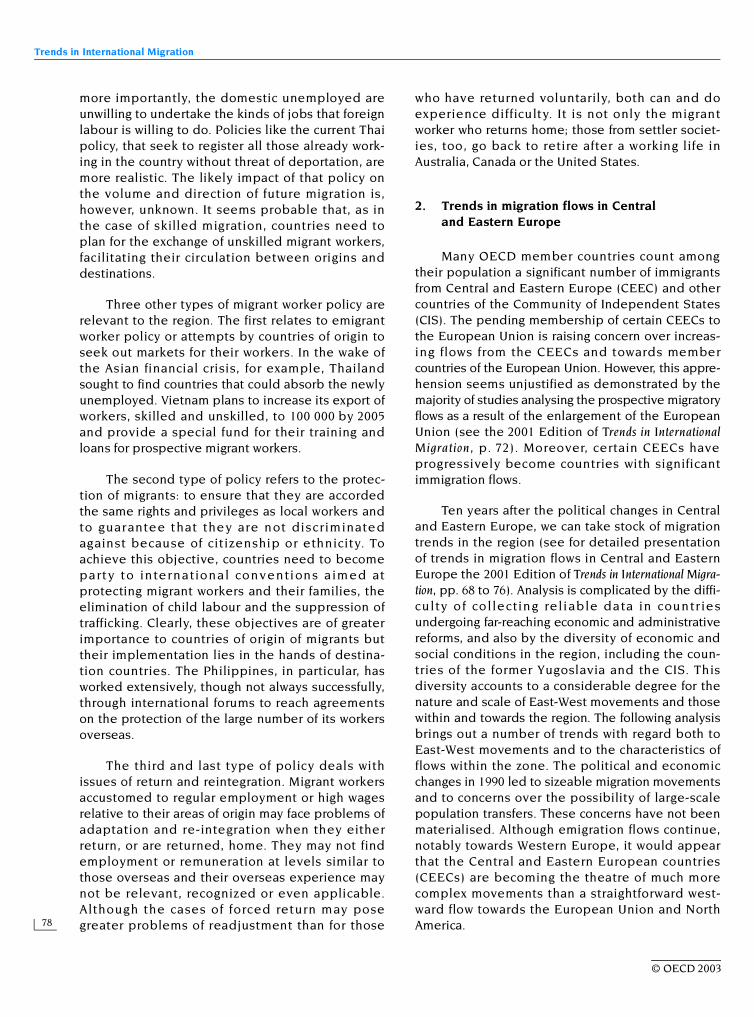
more importantly, the domestic unemployed areunwilling to undertake the kinds of jobs that foreignlabour is willing to do. Policies like the current Thaipolicy, that seek to register all those already work-ing in the country without threat of deportation, aremore realistic. The likely impact of that policy onthe volume and direction of future migration is,however, unknown. It seems probable that, as inthe case of skilled migration, countries need toplan for the exchange of unskilled migrant workers,facilitating their circulation between origins anddestinations.
Three other types of migrant worker policy arerelevant to the region. The first relates to emigrantworker policy or attempts by countries of origin toseek out markets for their workers. In the wake ofthe Asian financial crisis, for example, Thailandsought to find countries that could absorb the newlyunemployed. Vietnam plans to increase its export ofworkers, skilled and unskilled, to 100 000 by 2005and provide a special fund for their training andloans for prospective migrant workers.
The second type of policy refers to the protec-tion of migrants: to ensure that they are accordedthe same rights and privileges as local workers andto guarantee that they are not discriminatedagainst because of citizenship or ethnicity. Toachieve this objective, countries need to becomeparty to international conventions a imed atprotecting migrant workers and their families, theelimination of child labour and the suppression oftrafficking. Clearly, these objectives are of greaterimportance to countries of origin of migrants buttheir implementation lies in the hands of destina-tion countries. The Philippines, in particular, hasworked extensively, though not always successfully,through international forums to reach agreementson the protection of the large number of its workersoverseas.
The third and last type of policy deals withissues of return and reintegration. Migrant workersaccustomed to regular employment or high wagesrelative to their areas of origin may face problems ofadaptation and re-integration when they eitherreturn, or are returned, home. They may not findemployment or remuneration at levels similar tothose overseas and their overseas experience maynot be relevant, recognized or even applicable.Although the cases of forced return may posegreater problems of readjustment than for those
who have returned voluntarily, both can and doexperience difficulty. It is not only the migrantworker who returns home; those from settler societ-ies, too, go back to retire after a working life inAustralia, Canada or the United States.
2. Trends in migration flows in Central and Eastern Europe
Many OECD member countries count amongtheir population a significant number of immigrantsfrom Central and Eastern Europe (CEEC) and othercountries of the Community of Independent States(CIS). The pending membership of certain CEECs tothe European Union is raising concern over increas-ing flows from the CEECs and towards membercountries of the European Union. However, this appre-hension seems unjustified as demonstrated by themajority of studies analysing the prospective migratoryflows as a result of the enlargement of the EuropeanUnion (see the 2001 Edition of Trends in InternationalMigration, p. 72). Moreover, certain CEECs haveprogressively become countries with significantimmigration flows.
Ten years after the political changes in Centraland Eastern Europe, we can take stock of migrationtrends in the region (see for detailed presentationof trends in migration flows in Central and EasternEurope the 2001 Edition of Trends in International Migra-tion, pp. 68 to 76). Analysis is complicated by the diffi-culty of collecting reliable data in countr iesundergoing far-reaching economic and administrativereforms, and also by the diversity of economic andsocial conditions in the region, including the coun-tries of the former Yugoslavia and the CIS. Thisdiversity accounts to a considerable degree for thenature and scale of East-West movements and thosewithin and towards the region. The following analysisbrings out a number of trends with regard both toEast-West movements and to the characteristics offlows within the zone. The political and economicchanges in 1990 led to sizeable migration movementsand to concerns over the possibility of large-scalepopulation transfers. These concerns have not beenmaterialised. Although emigration flows continue,notably towards Western Europe, it would appearthat the Central and Eastern European countries(CEECs) are becoming the theatre of much morecomplex movements than a straightforward west-ward flow towards the European Union and NorthAmerica.
Main Trends in International Migration
79
© OECD 2003
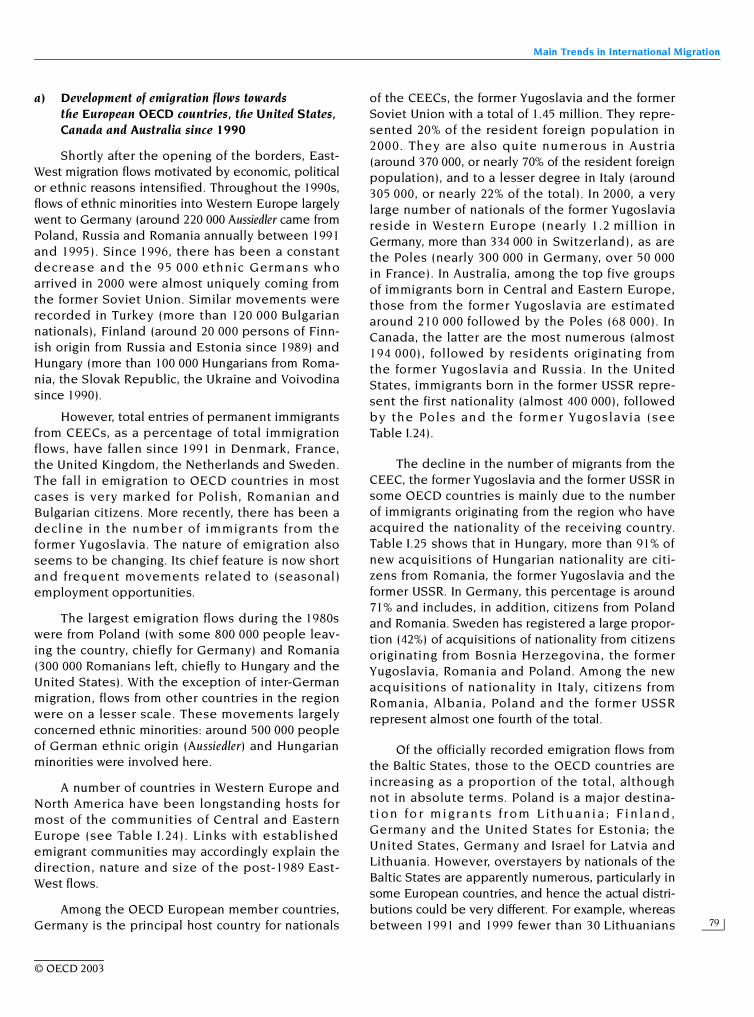
a) Development of emigration flows towards the European OECD countries, the United States, Canada and Australia since 1990
Shortly after the opening of the borders, East-West migration flows motivated by economic, politicalor ethnic reasons intensified. Throughout the 1990s,flows of ethnic minorities into Western Europe largelywent to Germany (around 220 000 Aussiedler came fromPoland, Russia and Romania annually between 1991and 1995). Since 1996, there has been a constantdecrease and the 95 000 ethnic Germans whoarrived in 2000 were almost uniquely coming fromthe former Soviet Union. Similar movements wererecorded in Turkey (more than 120 000 Bulgariannationals), Finland (around 20 000 persons of Finn-ish origin from Russia and Estonia since 1989) andHungary (more than 100 000 Hungarians from Roma-nia, the Slovak Republic, the Ukraine and Voivodinasince 1990).
However, total entries of permanent immigrantsfrom CEECs, as a percentage of total immigrationflows, have fallen since 1991 in Denmark, France,the United Kingdom, the Netherlands and Sweden.The fall in emigration to OECD countries in mostcases is very marked for Polish, Romanian andBulgarian citizens. More recently, there has been adecline in the number of immigrants from theformer Yugoslavia. The nature of emigration alsoseems to be changing. Its chief feature is now shortand frequent movements related to (seasonal)employment opportunities.
The largest emigration flows during the 1980swere from Poland (with some 800 000 people leav-ing the country, chiefly for Germany) and Romania(300 000 Romanians left, chiefly to Hungary and theUnited States). With the exception of inter-Germanmigration, flows from other countries in the regionwere on a lesser scale. These movements largelyconcerned ethnic minorities: around 500 000 peopleof German ethnic origin (Aussiedler) and Hungarianminorities were involved here.
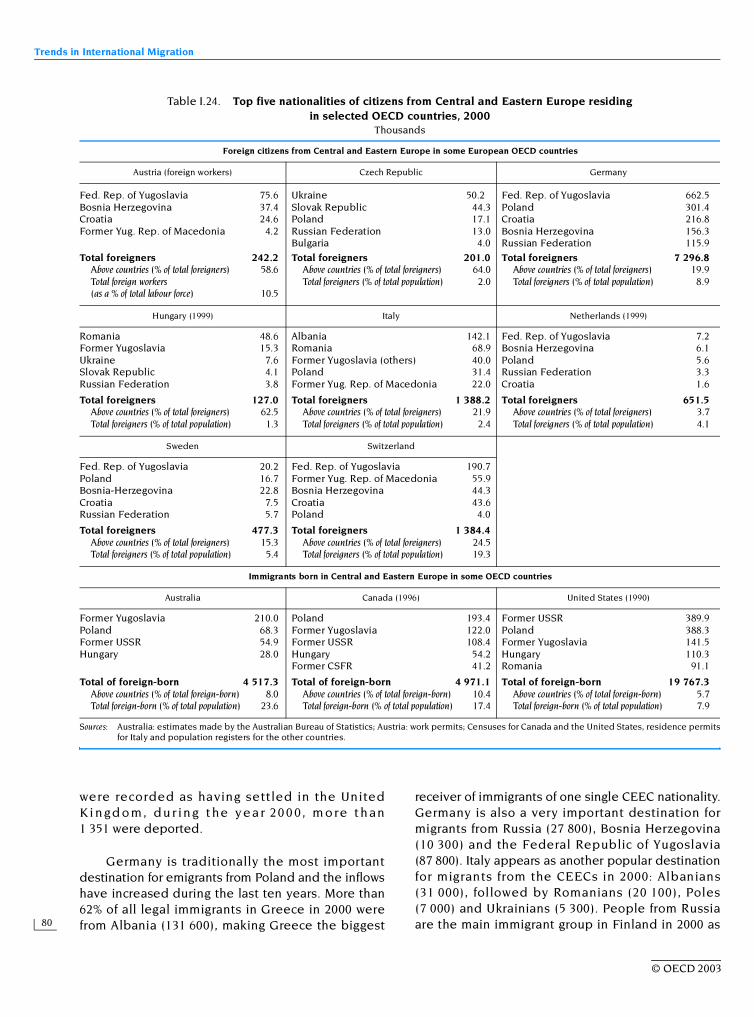
A number of countries in Western Europe andNorth America have been longstanding hosts formost of the communities of Central and EasternEurope (see Table I.24). Links with establishedemigrant communities may accordingly explain thedirection, nature and size of the post-1989 East-West flows.
Among the OECD European member countries,Germany is the principal host country for nationals
of the CEECs, the former Yugoslavia and the formerSoviet Union with a total of 1.45 million. They repre-sented 20% of the resident foreign population in2000. They are also quite numerous in Austria(around 370 000, or nearly 70% of the resident foreignpopulation), and to a lesser degree in Italy (around305 000, or nearly 22% of the total). In 2000, a verylarge number of nationals of the former Yugoslaviareside in Western Europe (nearly 1.2 million inGermany, more than 334 000 in Switzerland), as arethe Poles (nearly 300 000 in Germany, over 50 000in France). In Australia, among the top five groupsof immigrants born in Central and Eastern Europe,those from the former Yugoslavia are estimatedaround 210 000 followed by the Poles (68 000). InCanada, the latter are the most numerous (almost194 000), followed by residents originating fromthe former Yugoslavia and Russia. In the UnitedStates, immigrants born in the former USSR repre-sent the first nationality (almost 400 000), followedby the Poles and the former Yugoslavia (seeTable I.24).
The decline in the number of migrants from theCEEC, the former Yugoslavia and the former USSR insome OECD countries is mainly due to the numberof immigrants originating from the region who haveacquired the nationality of the receiving country.Table I.25 shows that in Hungary, more than 91% ofnew acquisitions of Hungarian nationality are citi-zens from Romania, the former Yugoslavia and theformer USSR. In Germany, this percentage is around71% and includes, in addition, citizens from Polandand Romania. Sweden has registered a large propor-tion (42%) of acquisitions of nationality from citizensoriginating from Bosnia Herzegovina, the formerYugoslavia, Romania and Poland. Among the newacquisitions of nationality in Italy, citizens fromRomania, Albania, Poland and the former USSRrepresent almost one fourth of the total.
Of the officially recorded emigration flows fromthe Baltic States, those to the OECD countries areincreasing as a proportion of the total, althoughnot in absolute terms. Poland is a major destina-t i o n fo r mi gr a n t s f r o m L i t h u a n i a ; F i n la n d ,Germany and the United States for Estonia; theUnited States, Germany and Israel for Latvia andLithuania. However, overstayers by nationals of theBaltic States are apparently numerous, particularly insome European countries, and hence the actual distri-butions could be very different. For example, whereasbetween 1991 and 1999 fewer than 30 Lithuanians
Trends in International Migration
80
© OECD 2003
were recorded as having settled in the UnitedKi n gd o m, du r in g t he y e a r 20 0 0, m o re t h an1 351 were deported.
Germany is traditionally the most importantdestination for emigrants from Poland and the inflowshave increased during the last ten years. More than62% of all legal immigrants in Greece in 2000 werefrom Albania (131 600), making Greece the biggest
receiver of immigrants of one single CEEC nationality.Germany is also a very important destination formigrants from Russia (27 800), Bosnia Herzegovina(10 300) and the Federal Republic of Yugoslavia(87 800). Italy appears as another popular destinationfor migrants from the CEECs in 2000: Albanians(31 000), followed by Romanians (20 100), Poles(7 000) and Ukrainians (5 300). People from Russiaare the main immigrant group in Finland in 2000 as
Table I.24. Top five nationalities of citizens from Central and Eastern Europe residing in selected OECD countries, 2000
Thousands
Sources: Australia: estimates made by the Australian Bureau of Statistics; Austria: work permits; Censuses for Canada and the United States, residence permitsfor Italy and population registers for the other countries.
Foreign citizens from Central and Eastern Europe in some European OECD countries
Austria (foreign workers) Czech Republic Germany
Fed. Rep. of Yugoslavia 75.6 Ukraine 50.2 Fed. Rep. of Yugoslavia 662.5Bosnia Herzegovina 37.4 Slovak Republic 44.3 Poland 301.4Croatia 24.6 Poland 17.1 Croatia 216.8Former Yug. Rep. of Macedonia 4.2 Russian Federation 13.0 Bosnia Herzegovina 156.3
Bulgaria 4.0 Russian Federation 115.9
Total foreigners 242.2 Total foreigners 201.0 Total foreigners 7 296.8Above countries (% of total foreigners) 58.6 Above countries (% of total foreigners) 64.0 Above countries (% of total foreigners) 19.9Total foreign workers (as a % of total labour force) 10.5
Total foreigners (% of total population) 2.0 Total foreigners (% of total population) 8.9
Hungary (1999) Italy Netherlands (1999)
Romania 48.6 Albania 142.1 Fed. Rep. of Yugoslavia 7.2Former Yugoslavia 15.3 Romania 68.9 Bosnia Herzegovina 6.1Ukraine 7.6 Former Yugoslavia (others) 40.0 Poland 5.6Slovak Republic 4.1 Poland 31.4 Russian Federation 3.3Russian Federation 3.8 Former Yug. Rep. of Macedonia 22.0 Croatia 1.6
Total foreigners 127.0 Total foreigners 1 388.2 Total foreigners 651.5Above countries (% of total foreigners) 62.5 Above countries (% of total foreigners) 21.9 Above countries (% of total foreigners) 3.7Total foreigners (% of total population) 1.3 Total foreigners (% of total population) 2.4 Total foreigners (% of total population) 4.1
Sweden Switzerland
Fed. Rep. of Yugoslavia 20.2 Fed. Rep. of Yugoslavia 190.7Poland 16.7 Former Yug. Rep. of Macedonia 55.9Bosnia-Herzegovina 22.8 Bosnia Herzegovina 44.3Croatia 7.5 Croatia 43.6Russian Federation 5.7 Poland 4.0
Total foreigners 477.3 Total foreigners 1 384.4Above countries (% of total foreigners) 15.3 Above countries (% of total foreigners) 24.5Total foreigners (% of total population) 5.4 Total foreigners (% of total population) 19.3
Immigrants born in Central and Eastern Europe in some OECD countries
Australia Canada (1996) United States (1990)
Former Yugoslavia 210.0 Poland 193.4 Former USSR 389.9Poland 68.3 Former Yugoslavia 122.0 Poland 388.3Former USSR 54.9 Former USSR 108.4 Former Yugoslavia 141.5Hungary 28.0 Hungary 54.2 Hungary 110.3
Former CSFR 41.2 Romania 91.1
Total of foreign-born 4 517.3 Total of foreign-born 4 971.1 Total of foreign-born 19 767.3Above countries (% of total foreign-born) 8.0 Above countries (% of total foreign-born) 10.4 Above countries (% of total foreign-born) 5.7Total foreign-born (% of total population) 23.6 Total foreign-born (% of total population) 17.4 Total foreign-born (% of total population) 7.9
Main Trends in International Migration
81
© OECD 2003
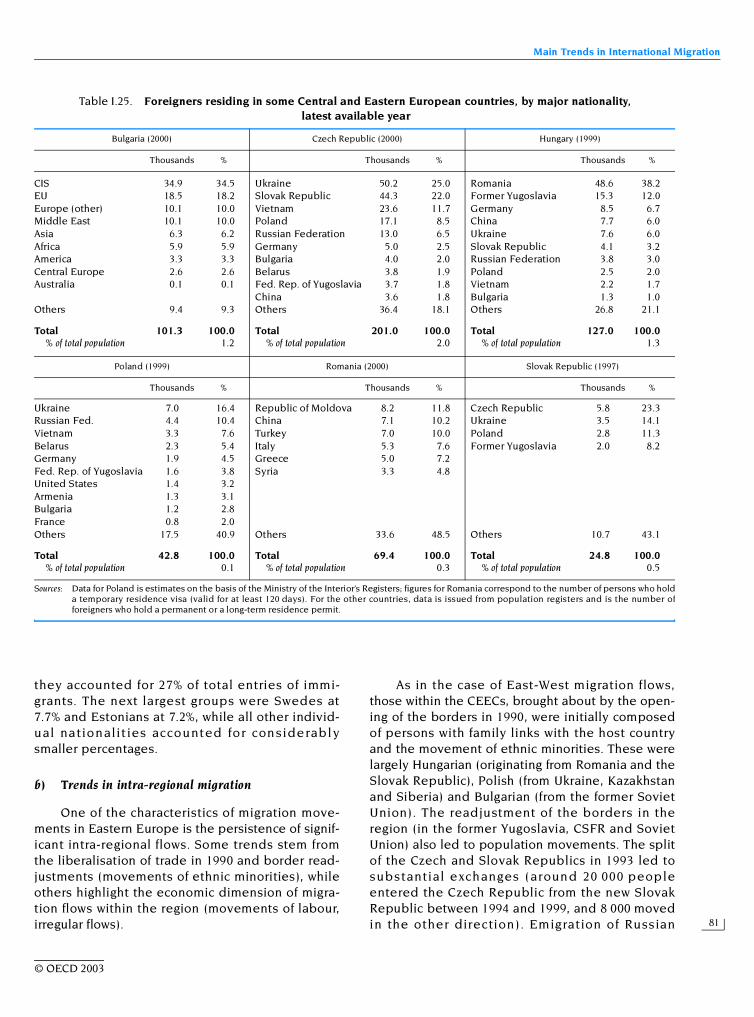
they accounted for 27% of total entries of immi-grants. The next largest groups were Swedes at7.7% and Estonians at 7.2%, while all other individ-ual nationalit ies accounted for considerablysmaller percentages.
b) Trends in intra-regional migration
One of the characteristics of migration move-ments in Eastern Europe is the persistence of signif-icant intra-regional flows. Some trends stem fromthe liberalisation of trade in 1990 and border read-justments (movements of ethnic minorities), whileothers highlight the economic dimension of migra-tion flows within the region (movements of labour,irregular flows).
As in the case of East-West migration flows,those within the CEECs, brought about by the open-ing of the borders in 1990, were initially composedof persons with family links with the host countryand the movement of ethnic minorities. These werelargely Hungarian (originating from Romania and theSlovak Republic), Polish (from Ukraine, Kazakhstanand Siberia) and Bulgarian (from the former SovietUnion). The readjustment of the borders in theregion (in the former Yugoslavia, CSFR and SovietUnion) also led to population movements. The splitof the Czech and Slovak Republics in 1993 led tosubstantial exchanges (around 20 000 peopleentered the Czech Republic from the new SlovakRepublic between 1994 and 1999, and 8 000 movedin the other direction). Emigration of Russian
Table I.25. Foreigners residing in some Central and Eastern European countries, by major nationality, latest available year
Sources: Data for Poland is estimates on the basis of the Ministry of the Interior’s Registers; figures for Romania correspond to the number of persons who holda temporary residence visa (valid for at least 120 days). For the other countries, data is issued from population registers and is the number offoreigners who hold a permanent or a long-term residence permit.
Bulgaria (2000) Czech Republic (2000) Hungary (1999)
Thousands % Thousands % Thousands %
CIS 34.9 34.5 Ukraine 50.2 25.0 Romania 48.6 38.2EU 18.5 18.2 Slovak Republic 44.3 22.0 Former Yugoslavia 15.3 12.0Europe (other) 10.1 10.0 Vietnam 23.6 11.7 Germany 8.5 6.7Middle East 10.1 10.0 Poland 17.1 8.5 China 7.7 6.0Asia 6.3 6.2 Russian Federation 13.0 6.5 Ukraine 7.6 6.0Africa 5.9 5.9 Germany 5.0 2.5 Slovak Republic 4.1 3.2America 3.3 3.3 Bulgaria 4.0 2.0 Russian Federation 3.8 3.0Central Europe 2.6 2.6 Belarus 3.8 1.9 Poland 2.5 2.0Australia 0.1 0.1 Fed. Rep. of Yugoslavia 3.7 1.8 Vietnam 2.2 1.7
China 3.6 1.8 Bulgaria 1.3 1.0Others 9.4 9.3 Others 36.4 18.1 Others 26.8 21.1
Total 101.3 100.0 Total 201.0 100.0 Total 127.0 100.0% of total population 1.2 % of total population 2.0 % of total population 1.3
Poland (1999) Romania (2000) Slovak Republic (1997)
Thousands % Thousands % Thousands %
Ukraine 7.0 16.4 Republic of Moldova 8.2 11.8 Czech Republic 5.8 23.3Russian Fed. 4.4 10.4 China 7.1 10.2 Ukraine 3.5 14.1Vietnam 3.3 7.6 Turkey 7.0 10.0 Poland 2.8 11.3Belarus 2.3 5.4 Italy 5.3 7.6 Former Yugoslavia 2.0 8.2Germany 1.9 4.5 Greece 5.0 7.2Fed. Rep. of Yugoslavia 1.6 3.8 Syria 3.3 4.8United States 1.4 3.2Armenia 1.3 3.1Bulgaria 1.2 2.8France 0.8 2.0Others 17.5 40.9 Others 33.6 48.5 Others 10.7 43.1
Total 42.8 100.0 Total 69.4 100.0 Total 24.8 100.0% of total population 0.1 % of total population 0.3 % of total population 0.5
Trends in International Migration
82
© OECD 2003
nationals continues to be observed today in theBaltic countries.
Hungary reports an increase in inflows ofHungarian ethnic minorities. The flows reached ahigh level in 1999, particularly for people fromRomania and the Ukraine. The increase may beexplained by the apprehension that Hungary willshortly introduce the admission rules applied in theEU, which are restrictive for Romanian and Ukrainiannationals.
Roma minorities are present in most countries inthe region and flows both to Western Europe andwithin Central Europe were very substantial onceborders opened; they have since fallen considerablyoverall. At the same time, countries such as Finlandsaw nu mbers of Roma migrants r ise in 1999(1 500 from Slovakia and 300 from Poland). A numberof countries (the Czech Republic, the Slovak Republic,Bulgaria and Hungary) are conduct ing activeprogrammes to integrate Roms socially and economi-cally, often with funding under programmes by theEuropean Union (PHARE) and/or the Council ofEurope. Such investments may, over the long term,mean that they settle permanently. But Roms arefrequently marginalised and their living conditionsare deplorable. They often live on the edges oflarger towns (Romania, Hungary, Bulgaria, the formerYugoslavia, and the Czech Republic) or in villagesentirely inhabited by Roms (Bulgaria, Romania).7 Inthe majority of cases, Gypsies have a level of educa-tion much lower than the rest of the population andare more vulnerable to unemployment. A degree ofrejection by the rest of the population renders thesuccess of active policies targeted towards thisgroup more difficult. As a result, these minorities arestill much inclined to emigrate.
Annual intra-regional migrant flows are gener-ally modest, varying between around a hundredpersons in Bulgaria to a few thousand in the CzechRepublic. Hungary, however, attracted well over10 000 immigrants from other CEEC countries in1999. Part of these movements appears to be trig-gered by historical ties. The greater part of migrantmovements from the Slovak Republic and withinEurope were to the Czech Republic, although themovements of Czechs have decreased dramaticallyafter the split of the Federation in 1993. Likewise, inthe Czech Republic, in 1999, the biggest group ofmigrants were Slovaks, followed by Ukrainians;Russians took a fifth place (after Vietnamese). In
Hungary, similarly to previous years, most immi-grants in 1999 arrived from neighbouring countries –predominantly Romania – and most of them wereethnic Hungarians. In 2000, around 61 000 Bulgariansof Turkish origin emigrated to Turkey.
Likewise, the return migration of the so-called“Russian speaking population” – Russians, Belarus-sians, Ukrainians – although diminishing, remainsthe dominant component of emigration flows fromthe Baltic States. In the case of Latvia, after adecline from 80% to 70% during 1998, the proportionfell to 67% in 1999; in the case of Lithuania, thecorresponding figures were 60%, 55% and 48%.Detailed data on the ethnic composition of Estonia’semigration flows were not made available in 1997and in 1999; in 1998, those leaving for either Russia,Belarus or the Ukraine accounted for approximately60% of the total.
The inflow of persons to Poland underwent anoticeable change in 2000. The number of arrivingforeign visitors declined, breaking with a long lastingpast trend. This is mainly caused by a decline in thenumber of short-time visitors arriving from border-lands of relatively well-off countries (Germany, theCzech Republic and Slovakia) for whom Poland is anattractive shopping destination. This more thanoffsets a growing numbers of petty traders and occa-sional irregular workers coming from Belarus and theUkraine where the economies are weak. However,the number of long-term arrivals of citizens fromBelarus and the Ukraine grew strongly by 28% and17%, respectively. Cit izens from CEECs form,together with Vietnamese, the bulk of the long-termarrivals in Poland.
In CEECs, the main groups of residing foreign-ers originate from the CIS region, accounting for alarge percentage of the total foreign population (seeTable I.25). However, while citizens from CIS coun-tries are currently the largest group of permanentlyresiding foreigners, their share is expected todecrease, reflecting the decline in foreign trade andeconomic relations with the CIS countries. In theCzech Republic, Ukrainian and Slovak citizensaccounted in 2000 for 25% and 22%, respectively,whilst Germans accounted for less than 3%. Czechand Ukrainian citizens accounted for 23% and 14%respectively in the Slovak Republic. The share ofRomanians and former Yugoslavia citizens inHungary accounted in 1999 respectively for 38% and12% of the total foreign population.
Main Trends in International Migration
83
© OECD 2003
c) Trends in asylum seekers
Border openings gave rise to important move-ments of asylum seekers, which was later increasedby the conflict in the former Yugoslavia. The move-ment of refugees from the former Yugoslavia peakedbetween 1992 and 1993, but stil l continues toGermany, Switzerland, Austria, Norway and Canada.Many migrants from Kosovo have since returnedhome. Within Central and Eastern Europe itself, thereis currently an increase in the transit flows of peoplecoming from outside the region and seeking to enterWestern Europe. A substantial part of this is irregularmigration. These flows eventually leading to WesternEuropean countries were at the root of significantchanges in the process of dealing with examination ofasylu m re que sts in most Western coun tr ie sbetween 1993 and 1997 and in 2001.
Important differences exist between countries asto the nationality of asylum seekers from Central andEastern Europe and the CIS. In Belgium, for example,the number of applicants from Russia has increasedsignificantly in the last two years. In Finland, mostapplications came from Poland, the Slovak Republicand Russia. Sweden saw an increase in the number ofapplications, from 11 300 to 16 300 in 2000, the bulk ofthe increase (3 800) being on account of Bosnians. InNorway the bulk of the asylum seekers from Croatia,Bulgaria and Russia appear to have been lured bytravel agencies specialising in “asylum tours”. Suchagencies advertise generous benefits for asylumseekers in Norway, easy-to-get well-paid jobs andlong processing times that guarantee at least a year’slawful residence. Almost all Bulgarian asylum seekersin 2001 came in chartered bus tours in the time spanof a few weeks between the end of June and thebeginning of July. Their applications were deemed tobe unfounded, and by the end of September all ofthem had been returned to their home country. Theauthorities thereby sent the signal, in particular tothe people of Central and Eastern Europe, thatalthough Norway may need foreign labour andalthough labour immigration may be encouraged, theasylum route is not the way to go for job seekers. Theapplications of Bulgarians and Croatians have sincebeen processed in an accelerated procedure. Mostapplications are rejected, and more accurate informa-tion about the prospects for a successful asylumapplication is distributed through local media.
In Austria there is a marked difference in theprocedures for refugee intakes from Kosovo andBosnia Herzegovina. While Bosnians had hardly
registered as asylum seekers – they were called war-refugees rather than asylum seekers – AlbanianKosovars tended to choose the asylum route. Theissue of settlement in Austria is in the forefrontwith Kosovars, while repatriation had been thegeneral understanding when Bosnians entered acouple of years earlier. As it turned out, hardlyany Bosnians returned to their country of origin,while most Albanians tended to return.
d) Illegal migrant flows and border crossings
While the influx of Kosovars in Italy endedafter 1999, irregular immigration continued along thesouthern and south-eastern coasts, and many ofthose arriving requested asylum. Almost all of thepersons landing on the Italian coast (more than 80%)were citizens from the Balkan region; in 9 out of10 cases their immigration was undocumented.These immigrants requested asylum and movednorthwards into the richer parts of Italy and often,but not always, to other countries.
Many foreign workers take advantage of Italy’slarge informal seasonal economy and then return totheir countries. This is particularly true for EasternEuropeans who come from countries for which no visais required to enter the Schengen area – Poland, theCzech Republic, Slovakia. For many migrants seekingto enter Western Europe or North America, the CEECsconstitute a stage on their journey. Most of thesemigrants are documented, having entered as tourists,businessmen or students. Due to their commonborder with Germany, the countries most affected bythis are Poland and the Czech Republic. Hungary isalso a transit country, on account of its borders withAustria. Bulgaria is a transit country for migrantsseeking to enter Greece, as well as those seeking toreach other parts of Western Europe. Transit migrationencourages the development of illegal immigrationand employment in a number of the CEECs. Thesemigrants come from neighbouring countries such asTurkey, Albania or the former Yugoslavia, but also fromAsia (Bangladesh, India, Afghanistan, Iran, Iraq).
Th e Ge rman bo rder pol ice inte rce pt ed28 500 illegal immigrants in 2001. Nearly 20% camefrom Romania and the former Yugoslavia. Illegalcrossings are concentrated on the borders withPoland, the Czech Republic and Austria but a largeproportion have been in transit from other countries,as organised by traffickers. In the case of the SlovakRepublic, inflows prevail at the Hungarian andUkrainian borders, outflows dominate at the Czech,Austrian and Polish borders. The main countries of
Trends in International Migration
84
© OECD 2003
origin of illegal migrants are the former Yugoslavia,Afghanistan and Romania. Overall, South Asianmigrants seem to be dominating the illegal flows.
In 2000, two-thirds of all registered illegalborder crossings in Hungary were attempts to leavethe country, indicating Hungary’s transit role in ille-gal migration. A contributing factor might be thatmigrants from Romania, the former Yugoslavia andthe former Soviet Union can easily enter Hungarylegally, but find it difficult to get the necessary visasto the West. The largest group among more than onehundred nationalities who were caught crossing theHungarian borders il legal ly was Romanians,followed by people from the former Yugoslavia.
In other cases, transit is carried through legalchannels. In Austria, until 1989, asylum seekers andrefugees (the majority from Eastern Europe) usedAustria as a stepping stone for emigration to the tradi-tional immigration countries overseas. Austria neverconceived of itself as a settlement country for refugees.In 1999, as the number of asylum applications hadreached record levels and affected integration of immi-grants. Asylum seekers tended to leave again in largernumbers, in particular to other countries within Europe(two-thirds of all outflows). However, in 2000, 4 000 or81% of the 5 900 efugees leaving Austria travelled tothe United States, perhaps reflecting stricter admit-tance practices in other European countries.
e) Developments in labour migration
Some Western European countries make signifi-cant use of workers from the CEECs. Most initial workpermits in Finland in 2000 (over 78%) were granted fortemporary work, most applicants from neighbouringareas, above all Russia and Estonia (over 70% of initialwork permits). Altogether, Russians and Estoniansaccounted for almost 74% of temporary workers; thesewere largely seasonal workers for agriculture andhorticulture, especially strawberry pickers.
In Austria, the proportion of persons from CEECsin initial work-permit applications is increasing (by 21%on 1999), most importantly from Hungarians. In 2000,around 30% (7 500) came from CEECs, in particularfrom Hungary (2 700), the Slovak Republic (2 000),Poland (1 400) and Romania (700). Of the remaining18 400 short-term foreign work permits, the majorshare went to citizens of the former Yugoslavia. Of allpermanent licence holders, the proportion of citizensof CEECs has been rising from the early 1990s to 1998.Increasing intra-regional opportunities within theCEEC caused the recent decline.
In the case of the Czech Republic, the highestnumbers of economic migrants are Slovaks, takingadvantage of the special conditions to access theCzech labour market. Second and third most impor-tant foreign workers are Polish and Bulgarian. InHungary, more than 15 000 Romanians and around4 400 Ukrainians had work permits and formed thelargest groups among the foreign labour force.Fourth after the Chinese came the Czechs, whoseshare is growing. The number of Polish workers in theHungarian labour market has dropped drastically.
f) EU enlargement and the impact on migration
Ten CEECs are currently candidates for the nextstage of European Union enlargement in 2005:Cyprus, the Czech Republic, Estonia, Hungary,Latvia, Lithuania, Malta, Poland, Slovak Republicand Slovenia. Other countries in the region will beincluded in subsequent waves of enlargement.
Recent discussions of enlargement among currentEU members show that a number of them are appre-hensive about inflows of CEEC workers a fterenlargement, under the principle of free movementof persons (see Box I.9). Accordingly, the accessiontreaties for the first wave of countries are likely toinclude a transitional clause, meaning that workersfrom CEEC countries cannot freely enter the labourmarket throughout the Union. Other countries, likeNorway, look to CEECs for help in alleviating theirlabour shortages. Some estimates, however, indi-cate that the countries joining the European Unionmay well experience return movements by theirnationals resident in the West. Net East-West flowscould accordingly be smaller, or indeed negative,after the CEECs join the European Union (see formore detail Migration Policies and EU enlargement. TheCase of Central and Eastern Europe. OECD, Paris 2000).
Conclusion
The movement of asylum seekers and migrantsfrom the former Yugoslavia to Western Europeancountries has diminished in recent years, and quitespectacularly in some countries, but continues to be– in 2000 – a major source of migrants for many OECDcountries. Illegal border crossings account for a signif-icant part of total movements of CEEC citizens, partic-ularly in Hungary, Germany, Poland and Greece.
Clearly, East-West migration flows persist butinflows into most CEECs have increased and diver-sified. Most of these countries are becoming a prime
Main Trends in International Migration
85
© OECD 2003
destination for migrants from the East and the South(the CIS and, to a lower extent, the former Yugoslavia).
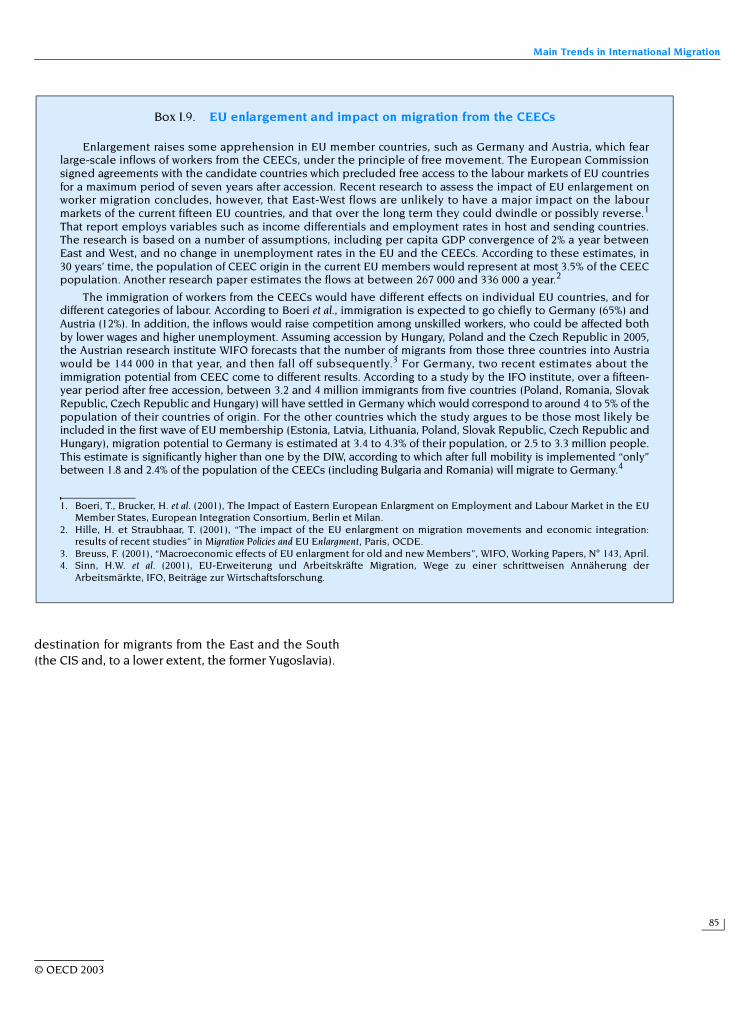
Box I.9. EU enlargement and impact on migration from the CEECs
Enlargement raises some apprehension in EU member countries, such as Germany and Austria, which fearlarge-scale inflows of workers from the CEECs, under the principle of free movement. The European Commissionsigned agreements with the candidate countries which precluded free access to the labour markets of EU countriesfor a maximum period of seven years after accession. Recent research to assess the impact of EU enlargement onworker migration concludes, however, that East-West flows are unlikely to have a major impact on the labourmarkets of the current fifteen EU countries, and that over the long term they could dwindle or possibly reverse.1
That report employs variables such as income differentials and employment rates in host and sending countries.The research is based on a number of assumptions, including per capita GDP convergence of 2% a year betweenEast and West, and no change in unemployment rates in the EU and the CEECs. According to these estimates, in30 years’ time, the population of CEEC origin in the current EU members would represent at most 3.5% of the CEECpopulation. Another research paper estimates the flows at between 267 000 and 336 000 a year.2
The immigration of workers from the CEECs would have different effects on individual EU countries, and fordifferent categories of labour. According to Boeri et al., immigration is expected to go chiefly to Germany (65%) andAustria (12%). In addition, the inflows would raise competition among unskilled workers, who could be affected bothby lower wages and higher unemployment. Assuming accession by Hungary, Poland and the Czech Republic in 2005,the Austrian research institute WIFO forecasts that the number of migrants from those three countries into Austriawould be 144 000 in that year, and then fall off subsequently.3 For Germany, two recent estimates about theimmigration potential from CEEC come to different results. According to a study by the IFO institute, over a fifteen-year period after free accession, between 3.2 and 4 million immigrants from five countries (Poland, Romania, SlovakRepublic, Czech Republic and Hungary) will have settled in Germany which would correspond to around 4 to 5% of thepopulation of their countries of origin. For the other countries which the study argues to be those most likely beincluded in the first wave of EU membership (Estonia, Latvia, Lithuania, Poland, Slovak Republic, Czech Republic andHungary), migration potential to Germany is estimated at 3.4 to 4.3% of their population, or 2.5 to 3.3 million people.This estimate is significantly higher than one by the DIW, according to which after full mobility is implemented “only”between 1.8 and 2.4% of the population of the CEECs (including Bulgaria and Romania) will migrate to Germany.4
1. Boeri, T., Brucker, H. et al. (2001), The Impact of Eastern European Enlargment on Employment and Labour Market in the EUMember States, European Integration Consortium, Berlin et Milan.
2. Hille, H. et Straubhaar, T. (2001), “The impact of the EU enlargment on migration movements and economic integration:results of recent studies” in Migration Policies and EU Enlargment, Paris, OCDE.
3. Breuss, F. (2001), “Macroeconomic effects of EU enlargment for old and new Members”, WIFO, Working Papers, N° 143, April.4. Sinn, H.W. et al. (2001), EU-Erweiterung und Arbeitskräfte Migration, Wege zu einer schrittweisen Annäherung der
Arbeitsmärkte, IFO, Beiträge zur Wirtschaftsforschung.