Embed Size (px)
Citation preview
Volume 3. Finance
Trendsinhigher education

Published in 2008 by:The Association of Universities and Colleges of Canada600-350 Albert StreetOttawa, ON K1R 1B1Phone: (613) 563-3961 ext. 205Fax: (613) 563-9745E-mail: [email protected]: www.aucc.ca
Trends in higher educationVolume 3: Finance
ISSN: 0847-5482ISBN: 978-0-88876-262-3
Deposited with the National Library of CanadaPrinted in Canada
Copies may be obtained online at www.aucc.ca or by contacting AUCC.
The Association of Universities and Colleges of Canada is the voice of Canada’s universities. AUCC represents 92 Canadian public and private not-for-profit universities and university-degree level colleges. Since 1911, we have provided strong and effective representation for our members, in Canada and abroad. Our mandate is to facilitate the development of public policy on higher education and to encourage cooperation among universities and governments, industry, communities, and institutions in other countries.
Front cover photo: Carleton University

Highlights ................................................................................................................................................................................................................4Introduction ..........................................................................................................................................................................................................7University funding in an international context ..........................................................................................10Structure and sources of university funding in Canada ................................................................15 Endowment funds .........................................................................................................................................................................................17 Ancillary funds ................................................................................................................................................................................................17 Capital funds .....................................................................................................................................................................................................17 Sponsored research fund ..........................................................................................................................................................................19 General operating funds and special purpose and trust funds ..................................................................................24Drivers of change .......................................................................................................................................................................................31Conclusion ........................................................................................................................................................................................................... 42Appendix A: United States ..........................................................................................................................................................45Appendix B: United Kingdom ................................................................................................................................................50Appendix C: Austra lia ........................................................................................................................................................................55Appendix D: Revenues that are not related to the core mission
of a university (Canada) .......................................................................................................................59Appendix E: HEPI ..................................................................................................................................................................................61List of f igures ..................................................................................................................................................................................................62References .............................................................................................................................................................................................................63
Table of contents
4 | Trends in higher education | Volume 3. Finance
• Canadianuniversitiesservemorethan1.5millionfull-andpart-timestudentsinvariousdegreeandcontinuingeducationprogramsandemploymorethan150,000full-timefacultyandfull-andpart-timeprofessional,technicaland supportstaff.
• Nationally,universitiesarea$26billionenterprise–largerthanthepulpandpaperindustry,theoilandgasextractionindustry,theutilitiessector,thecombinedarts,entertainmentandrecreationindustriesandsuchprominentmanufacturingindustriesasaerospace,motorvehicle,metalfabricating,furnitureandplasticproducts.
Comparing Canada to the U.S., U.K. and Australia
• Onaperstudentbasis,U.S.four-yearpublicuniversitiesandcollegeshavesignificantlymoreresourcestofundresearchandteachingactivitiesthantheircounterpartsinCanada,theU.K.andAustralia.ComparedtotheirCanadiancounterparts,universitiesintheU.S.have$8,000CADmorerevenuesperstudentandthegaphasgrownoverthelast30years.Atthebeginningofthe1980s,Canadianuniversitieshada$2,000perstudentfundingadvantagecomparedtotheirU.S.publicpeers,butthatadvantageerodedquicklyoverthefirsthalfofthe1980s,andsincethebeginningofthe1990s,thefundingadvantageofpublicU.S.universitieshasgrownsteadilytomorethan$8,000CADperstudent(Allmonetaryamountsinthisdocumentappearinconstant2006-07dollars,unlessotherwiseindicated).
•Theper-studentfundinggapbetweenCanadaandtheU.S.–orresourceadvantage–meansgreaterinvestmentsinthelearningenvironmentintheU.S.thaninCanadianuniversities,includinginvestmentsinfaculty.Between1987and2006,full-timeequivalentenrolmentinCanadagrewby56percentwhilegrowthinfull-timefacultyincreasedbyonly18percent.Duringthesameperiod,
full-timeequivalentenrolmentinU.S.four-yearpublicuniversitiesandcollegesgrewbyanestimated33percent,matchingthe33percentincreaseinfull-timefaculty.
• IntheU.K.,perstudentfundinggrewfrom$17,000CADto$20,600CADbetween1994-95and2006-07.Thatcomparestojustlessthan$21,000CADinCanadaand$29,000CADintheU.S.Basedonrecentpolicychanges,itislikelythatU.K.universitieswillcontinuetoclosesomeofthefundinggapwiththeirU.S.publicpeersandmovefurtheraheadofCanadianuniversitiesoverthenextfewyears.
• IntheU.K.between1995-96and2006-07,full-timeequivalentenrolmentgrewby25percentcomparedtoa20percentincreaseinfull-timefaculty.Asinvestmentsincreasedmorerapidlyinthelatterhalfofthatperiod,increasesinfull-timefacultynumbershavemorecloselymatchedenrolmentincreases.
• InAustralia,perstudentfundingfellbetween1996and2002,beforeitbegantorecoverin2003.By2006,perstudentfundingwasjustunder$20,000CAD–almostthesameastheirCanadiancounterparts.
• Since1995,full-timeequivalentenrolmentinAustraliahasgrownby41percent,muchfasterthanthe10percentincreaseinfull-timefacultyfrom2001until2006-07.Recently,studentfacultyratioshavestabilized–butathistoricallyhighlevels.
Funding of teaching and research in Canada
• Canadianuniversitieshavethreecoremissions:teaching,researchandcommunityservice(thelatterisnotexploredinthisreport).Fundingforuniversityactivitiescomesfromavarietyofsources,thelargerofwhicharefederalandprovincialgovernmentfundsandprograms,andstudenttuitionfees.
• InCanada,therehasbeenstronggrowthincapitalspendingsince1999.Themajor
Highlights
Association of Universities and Colleges of Canada | 5
increase in capital spending was financed by a combination of government grants, private fundraising and, in some provinces, increasing reliance on borrowing. In some cases, the annual cost of servicing the debt comes out of university operating budgets, reducing the amount of money available to cover teaching and related expenditures.
• All sources of externally sponsored research funding have grown significantly in the last decade. Notably, federal investments doubled from $1.2 billion in 1996-97 to $2.4 billion in 2006-07 (over and above the large federal investments in research infrastructure through the Canada Foundation for Innovation).
• As externally sponsored research has grown over the last decade, so too have the institutional costs associated with funding the costs of those projects. External sponsors rarely fund the full range of these costs, leaving universities to cover unfunded institutional costs. As research investments grow, the resulting draw on general university revenues has continued to grow. Unfunded institutional costs associated with research, undertaken for all external sponsors, grew from an estimated $1.1 billion in 1996-97 to almost $1.7 billion in 2006-07. With enrolment also increasing, internal competition for general university revenues continues to escalate.
Universities support an array of institutional costs to cultivate an environment where top-flight research, research training and knowledge transfer are conducted. In addition, universities cover most of the costs of faculty time devoted to research, including externally sponsored research. The cost of faculty time spent on sponsored and unsponsored research was estimated at close to $1.7 billion in 2006-07.
• Provincial government support and tuition fee income combined have long provided 90 percent or more of university operating and special purpose revenues. In 1980, governments contributed 84 percent of the funds available for teaching and unsponsored research costs. Student fees for credit courses covered about 10 percent and investments
and donations covered the remaining four to five percent. By 2006, these shares were 66 percent, 24 percent and 10 percent respectively, with the proportions varying significantly by province and by institution.
• Since 2000-01, provincial governments have also significantly increased their overall operating and special purpose funding of universities but a substantial portion of these increases was explicitly intended to offset some of the revenue losses that the universities would confront as a result of either new tuition regulations in some provinces or agreements with the universities to limit tuition increases.
• Recent increases in operating and special purpose and trust revenues from all sources, when adjusted for inflation and enrolment growth, have begun to reverse the long-term decline in per student funding for teaching and research costs not covered by external sponsors. In 2006-07, per student funding amounted to $15,000, which is $500 higher per student than in 2001-02, but also $6,000 per student less than at the beginning of the 1980s, and $2,000 per student less than at the beginning of the 1990s.
Government funding (primarily provincial) on a per student basis fell from more than $17,900 in 1980-81 to $13,600 in 1990-91 and to just $9,900 in 2006-07. Student fee revenue (from credit course enrolments), net of financial aid given back to students from the universities, was $2,000 per student during most of the 1980s then rose to $3,700 in 1999 and has remained at that level since.
The decade ahead
• In the years to come, the principal drivers of change in university finances will include growing demands from governments, the private sector, communities and individual Canadians for the education, research and community services provided by universities, and increasing cost pressures resulting from global competition for faculty, the changing mix of students, the need to reach out to non-traditional students, and campus maintenance and renewal challenges.

Photo: The University of Lethbridge
The three core missions of a university are teaching, research and community service.

Association of Universities and Colleges of Canada | 7
Introduction Canadian universities serve more than 1.5 million full- and part-time students in various degree and continuing education programs and employ more than 150,000 full-time faculty and full- and part-time professional, technical and support staff.
Universities have a significant impact on the Canadian economy, both nationally and locally. Nationally, universities are a $26 billion enterprise – larger than the pulp and paper industry, the oil and gas extraction industry, the utilities sector, the combined arts, entertainment and recreation industries and such prominent manufacturing industries as aerospace, motor vehicle, metal fabricating, furniture and plastic products.
However, the impact of universities on our country, on our communities and on individuals extend well beyond these financial impacts. Through the three core activities that characterize every university – teaching, research and community service – universities have a direct impact on our identity, our productivity, our social, physical and economic well-being, and our quality of life. They broaden our horizons culturally, philosophically and intellectually.
This third and final volume of the 2007-08 edition of Trends focuses on the resources that Canadian universities have to support their teaching and research activities. We live, learn and work in an increasingly global environment, and understanding funding trends in an international context becomes even more important. The volume begins by comparing the combined funding for teaching and research in Canadian universities with higher education funding in some of our most important comparator countries: the United States, the United Kingdom and Australia. As this volume will show, there are many complexities in making funding comparisons and that is the primary reason why the analysis has been limited to four countries. Further research is required to conduct similar comparisons with other countries.
The second section of this volume examines university funding trends in Canada over the last three decades and attempts to “disentangle,” to the extent possible, the resources available for and dedicated to sponsored research activities, unsponsored research activities and teaching activities. In the process, it will illustrate how the majority of university investments in teaching and research produce joint learning, discovery and knowledge mobilization outcomes.
This section also describes the “fund accounting system” used in Canada. It will then adjust the information reported in these funds – the endowment fund, ancillary fund, capital fund, sponsored research fund, special purpose and trust fund and the general operating fund – in order to align more closely with the three core missions of a university: teaching, research and community service.
Even with these adjustments, university finances are not that simple; research and teaching are not mutually exclusive activities. Studying in a research-intensive environment is a unique element of a university education, and one that students benefit from every day. By equal measure, the act of conducting research enables faculty to broaden the scope of their teachings. Consequently, while a significant portion of the research conducted by faculty is funded by outside sponsors, the universities themselves fund an important amount of their faculty members’ research. They do so because the inter-relationship between teaching and research is at the heart of the modern university, and faculty members are thus expected to conduct research as part of their employment and professional commitment. As well, universities are often left to cover some research-related costs even in the case of sponsored research because external sponsors rarely fund the full range of associated costs.
Photo: The University of Lethbridge

8 | Trends in higher education | Volume 3. Finance
The third section of this volume of Trends will illustrate several of the factors that will drive change in the decade ahead. Demand for the education, research and community services that universities provide is growing, and this is likely to influence future funding requirements. Universities are expected to provide more and better quality educational opportunities to a broader and ever-growing group of students. There is also an expectation that faculty will conduct increasingly complex research and engage in a greater amount of community service. These demands are emanating not only from students and parents, but also from governments and communities as the university’s role as a catalyst of innovation and as a key contributor to social and economic well-being is increasingly taken as a given in Canadian society.

The inter-relationship between teaching and research is
at the heart of the modern university.
Phot
o: U
nive
rsity
of N
ew B
runs
wic
k, S
t. Jo
hn C
ampu
s
10 | Trends in higher education | Volume 3. Finance
University funding in an international contextEvery country profiled in this report – the U.S., U.K., Australia and Canada – has a unique approach to funding higher education and research activities, in both the design and implementation of funding mechanisms which have resulted from the political and historical context of each country. The differences arise in a number of areas, including public-private institutional arrangements, public-private (government-student) sharing of the costs of higher education and government responsibilities at the federal and state/provincial levels.
The analysis of the funding arrangements in the four countries demonstrates that there is no single best practice for investing in and for promoting returns on investment in higher education and research activities.
The common element among the four countries is the intertwining of support mechanisms for teaching and research. This intertwining is an indicator of both the overlapping nature of teaching and research, and the common goals across each of the four nations: to support quality teaching and research to meet labour market demands, drive productivity and stimulate economic growth through mechanisms that provide long term sustainability.
One of the goals defined at the outset of the research for this publication was to create a precise demarcation in funding for teaching and research in these four countries. The second section of this publication does undertake, for analytical purposes, a disentangling of funding for teaching and research in Canada. However, it quickly became apparent that, due to wide variations in how the four countries report higher education data to the Organization for Economic Cooperation and Development (OECD), Higher Education Research and Development (HERD) data is insufficient
for international comparisons at this level of detailed analysis. Given the significant differences in data reporting within teaching and research, the intertwining of teaching and research funding across all four countries, and the joint outcomes they generate, this report combines funding for teaching and research for the purposes of analyzing trends in resources available over time in an international context.
Appendices A, B and C discuss the differing approaches to higher education funding and research funding in the U.S., the U.K. and Australia in greater detail. The appendices also illustrate both the kinds of changes that these nations are making to enhance the levels of funding for teaching and research and the measures they are taking to ensure that funding formulae and mechanisms are sustainable in the longer term.
To facilitate the comparisons of the combined funding available for teaching and research,1 the resources available in each country have been converted to Canadian currency, adjusted for shifts in the costs universities face using an American-based Higher Education Price Index (HEPI), and described in per student terms to help adjust for changes in enrolment growth over time. The use of the HEPI deflator is explored in more detail in Appendix E.
Based on this per student funding indicator, it is clear that U.S. four-year public universities2 and colleges have significantly more resources to fund research and teaching activities than their counterparts in the other three countries. Compared to their Canadian counterparts, universities in the U.S. have $8,000 CAD more revenues per student. Moreover, the gap in funding has grown over the last 30 years. Indeed, at the beginning of the 1980s, Canadian universities had a $2,000 CAD per student funding advantage compared to their U.S. public peers – with $25,000 CAD per student to support teaching and research
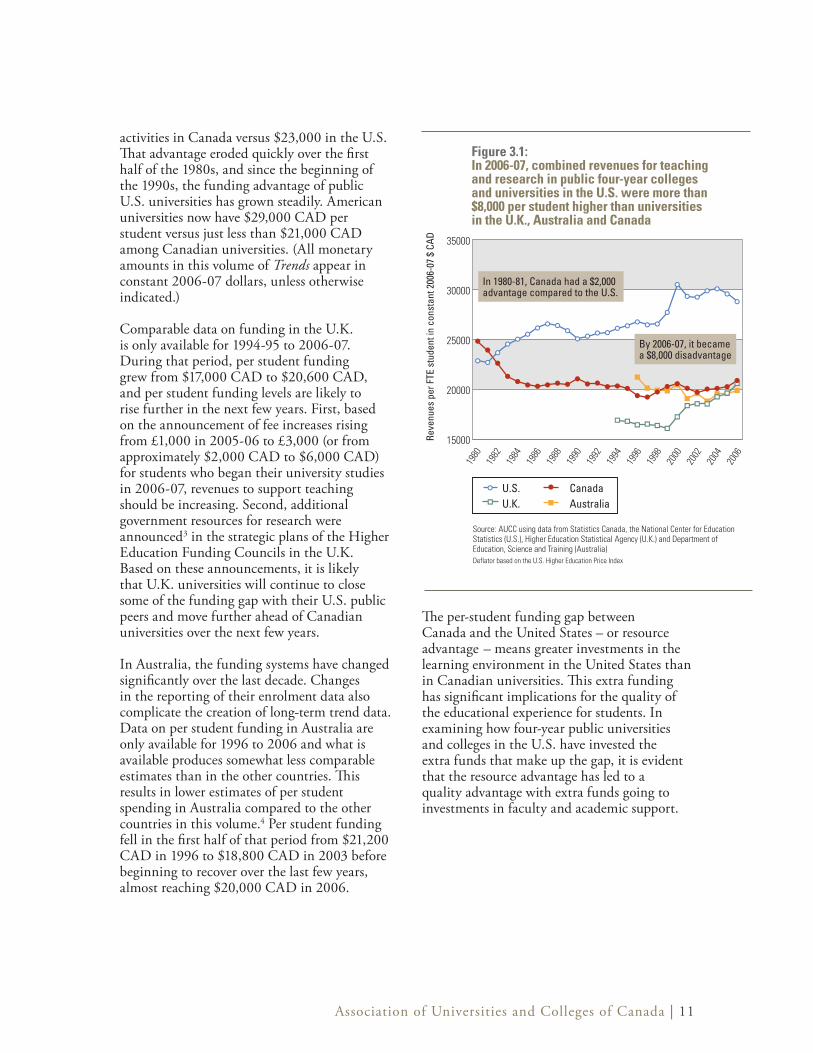
Association of Universities and Colleges of Canada | 11
The per-student funding gap between Canada and the United States – or resource advantage – means greater investments in the learning environment in the United States than in Canadian universities. This extra funding has significant implications for the quality of the educational experience for students. In examining how four-year public universities and colleges in the U.S. have invested the extra funds that make up the gap, it is evident that the resource advantage has led to a quality advantage with extra funds going to investments in faculty and academic support.
activities in Canada versus $23,000 in the U.S. That advantage eroded quickly over the first half of the 1980s, and since the beginning of the 1990s, the funding advantage of public U.S. universities has grown steadily. American universities now have $29,000 CAD per student versus just less than $21,000 CAD among Canadian universities. (All monetary amounts in this volume of Trends appear in constant 2006-07 dollars, unless otherwise indicated.)
Comparable data on funding in the U.K. is only available for 1994-95 to 2006-07. During that period, per student funding grew from $17,000 CAD to $20,600 CAD, and per student funding levels are likely to rise further in the next few years. First, based on the announcement of fee increases rising from £1,000 in 2005-06 to £3,000 (or from approximately $2,000 CAD to $6,000 CAD) for students who began their university studies in 2006-07, revenues to support teaching should be increasing. Second, additional government resources for research were announced3 in the strategic plans of the Higher Education Funding Councils in the U.K. Based on these announcements, it is likely that U.K. universities will continue to close some of the funding gap with their U.S. public peers and move further ahead of Canadian universities over the next few years.
In Australia, the funding systems have changed significantly over the last decade. Changes in the reporting of their enrolment data also complicate the creation of long-term trend data. Data on per student funding in Australia are only available for 1996 to 2006 and what is available produces somewhat less comparable estimates than in the other countries. This results in lower estimates of per student spending in Australia compared to the other countries in this volume.4 Per student funding fell in the first half of that period from $21,200 CAD in 1996 to $18,800 CAD in 2003 before beginning to recover over the last few years, almost reaching $20,000 CAD in 2006.
Figure 3.1:In 2006-07, combined revenues for teaching and research in public four-year colleges and universities in the U.S. were more than $8,000 per student higher than universities in the U.K., Australia and Canada
Source: AUCC using data from Statistics Canada, the National Center for Education Statistics (U.S.), Higher Education Statistical Agency (U.K.) and Department of Education, Science and Training (Australia)Deflator based on the U.S. Higher Education Price Index
15000
20000
25000
30000
35000Australia
U.K.
Canada
U.S.
1980
1982
1984
1986
1988
1990
1992
1994
1996
1998
2000
2002
2004
2006
Reve
nues
per
FTE
stu
dent
in c
onst
ant 2
006-
07 $
CA
D
U.S. CanadaU.K. Australia
In 1980-81, Canada had a $2,000advantage compared to the U.S.
By 2006-07, it becamea $8,000 disadvantage

12 | Trends in higher education | Volume 3. Finance
From the mid-1950s until the mid-1980s, enrolment and full-time faculty grew in lockstep both in the United States and in Canada. However, over the last 20 years the trends have been significantly different. Between 1987 and 2006, full-time equivalent enrolment in Canada grew by 56 percent while growth in full-time faculty increased by only 18 percent. This contrasts sharply with the trend in U.S. four-year public universities and colleges. Between 1987 and 2006 full-time equivalent enrolment grew by an estimated 33 percent in these U.S. institutions, which matched the 33 percent increase in full-time faculty.
In the U.K. between 1995-96 and 2006-07 (the only period with comparable data), full-time equivalent enrolment grew by 25 percent compared to a 20 percent increase in full-time faculty. However, as investments increased more rapidly in the latter half of that period, increases in full-time faculty numbers have more closely matched enrolment increases.
Since 1995, full-time equivalent enrolment in Australia has grown by 41 percent, much faster than the 10 percent increase in full-time faculty, all of which occurred since 2001. Within that more recent period, student faculty ratios have stabilized – but at historically high levels.
Clearly, funding policies have played a determinant role in the ability of universities in the U.S. to increase faculty numbers at the same pace as enrolment increases. Canadian universities, like peer institutions in the U.K. and Australia, have begun to hire more faculty over the last six or seven years, but even so, the growth in faculty is barely keeping pace with enrolment, and student-faculty ratios are at historical highs in all three countries.
Faculty hiring is not the only area of investment where Canada has fallen behind. Further analysis of spending patterns of four-year public universities and colleges in the U.S. indicates they are also using additional resources to increase investments in student support services, libraries, research and public services.
According to the National Survey of Student Engagement (NSSE), a major U.S. survey which seeks to identify the educational practices and student behaviours that are central to the learning experience, investments in these areas create an engaging, interactive and research-enriched learning environment for students, enhancing the quality of their learning experience. Survey findings from 2006 indicate that such an environment is highly correlated to personal development and the development of highly valued skills – problem
Figure 3.2:In the U.S., full-time faculty growth has kept pace with enrolment growth whereas in the U.K., Australia and Canada, enrolment has grown more quickly than faculty numbers
0%
10%
20%
30%
40%
50%
60%Full-time faculty growth
Full-time equivalent student growth
AustraliaU.K. U.S.Canada U.S.Canada
Sources: AUCC using data from Statistics Canada, the National Center for Education Statistics (U.S.), Higher Education Statistical Agency (U.K.) and Department of Education, Science and Training (Australia)
1987 to 2006 1995 to 2006
Full-time equivalent student growthFull-time faculty growth

Association of Universities and Colleges of Canada | 13
solving, critical thinking, and communication, as well as teamwork and leadership skills – which graduates will need in the labour force. The survey also illustrates the important role that “universities [and their faculty] play in organizing the curriculum and other learning opportunities to get students to participate in activities that decades of research studies show are linked to student learning.”5 These elements are key factors that drive levels of student engagement, contributing to different levels of student engagement reported in Canada compared to peer institutions in the U.S.
The NSSE focuses on five key clusters of activities that are linked to desired outcomes of a university experience. Each cluster identifies important faculty activities that encourage students to engage more fully in
the educational process and thereby benefit from opportunities for “deeper learning.” In 2006, more than 30 Canadian universities participated in NSSE. A recent report6 shows that on average, U.S. universities score better than their Canadian peers on two very critical NSSE benchmarks7: active and collaborative learning and student-faculty interaction.8
The first category, active and collaborative learning, measures participation in class, making presentations, working with other students on projects, tutoring other students and participating in community-based projects. In this category, the average score of 41 for first-year students in the U.S. was significantly higher than the average score for first-year students in Canada (see Figure 3.3).
In the category of student-faculty interaction, the relative advantage in the U.S. was even higher for first-year students. This benchmark is significantly influenced by investments in university faculty. It includes measures like discussing grades with instructors, receiving prompt feedback, talking about career plans with faculty members, discussing ideas with faculty outside class and working with faculty on activities other than coursework, which can range from social committees to research projects. In both categories, the average U.S. university scores were also significantly higher for senior students.
The NSSE surveys and the analyses of factors that lead to high ratings for certain institutions provide useful information on various academic practices that have proven effective for different student cohorts in various university settings. Though the results indicate that there is no one-size-fits-all solution for institutions, it is clear that quality depends in good measure on the degree of interaction between students and faculty. Key findings such as these point to the link between greater investment in faculty and services on the one hand and enhancement of the quality of the learning environment and student engagement levels on the other.
0
10
20
30
40
50
60
70
Figure 3.3:First-year Canadian students participating in NSSE trail well behind their U.S. peers in key areas of student engagement
Source: Council of Ontario Universities using the National Survey of Student Engagement, 2006
OntarioCanadaAll U.S. institutionsTop 10 percent
Student-faculty interaction
ONTARIO CANADA ALL U.S. TOP 10%
Active and collaborative learning
ONTARIO CANADA ALL U.S. TOP 10%
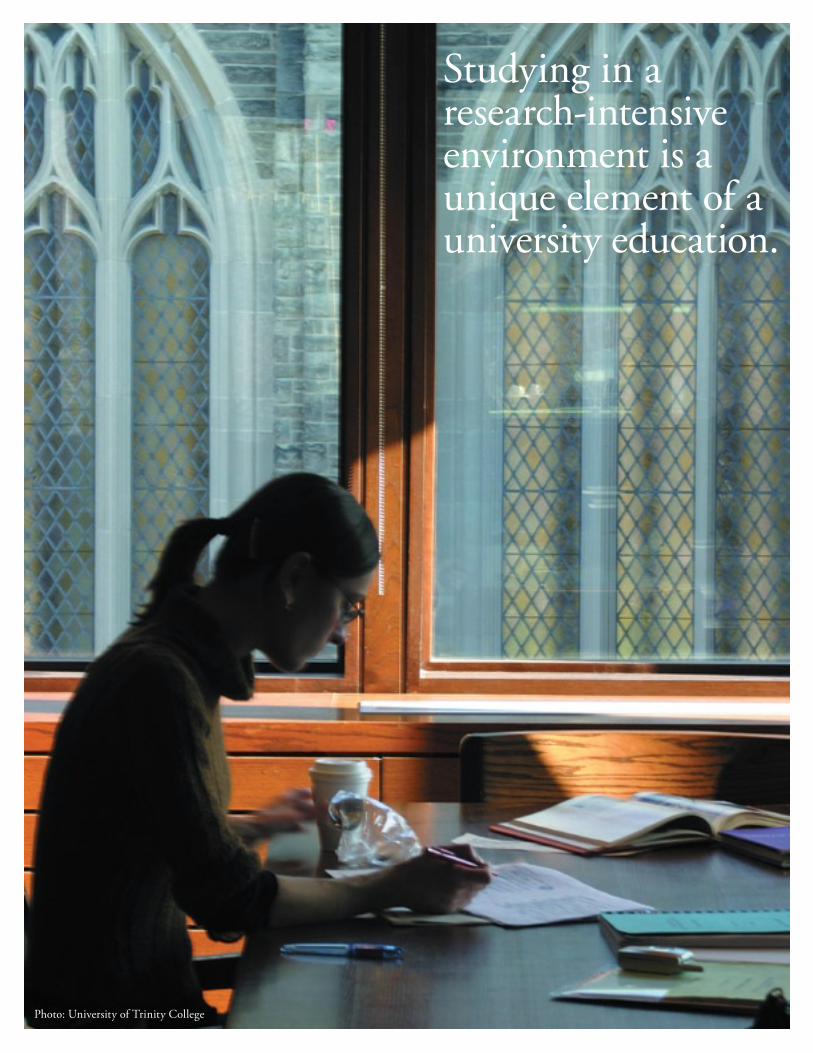
Studying in a research-intensive environment is a unique element of a university education.
Photo: University of Trinity College

Association of Universities and Colleges of Canada | 15
Structure and sources of university funding in CanadaThe following section provides additional details of the funding for teaching and research in Canada. The analysis begins by describing the fund accounting system that is widely used to report on higher education in Canada. The analysis in the section above noted that, at least for the purpose of international comparisons, HERD data do not make it possible to demarcate funding of universities’ educational role from funding of universities’ research role.
Within Canada, it is at least possible to begin to disentangle funding levels and funding mechanisms for these two core university roles. A complete demarcation of funding for the two roles is neither possible nor desirable given their overlapping nature. Nevertheless, some disentangling is analytically important. This section begins that task. In particular, it will demonstrate that in Canada, external funding for university research has not traditionally covered all the research costs and has consequently drawn support from general university revenues to cover these costs. As research investments grow, the draw from the general revenues has continued to grow. With enrolment also increasing, the internal competition for resources continues to escalate.
Examining these funding trends and funding sources provides an important perspective for understanding financial pressures in order to help inform public policy and institutional decision-making. Finally, descriptions of international funding mechanisms contained in the appendices provide additional information to examine how other countries are supporting current demand for university teaching and research and the efforts they are taking to ensure long-term sustainability.
The structure of university finance in Canada is complex, as it is in most developed countries. Universities direct funding to one of their three main activities:
• Teaching and scholarship; • Research; and
• Community and university service – contributing to the quality of life in the local and regional community, as well working on internal university governance, peer review and administrative services.
Given the overlapping nature of the university’s three main activities – and the fact that a very significant portion of university funding usually comes in the form of a block grant – it is often difficult to identify precisely the funds allocated to each of these three activities. The situation is further complicated because external funding that is targeted to a specific project usually only covers a portion of that project’s cost. The remainder of the cost must either be funded from the block grant or cross-subsidized through other funding sources.
Canadian universities generally use a “fund accounting system,” which allows them to distinguish between funding attracted for a designated purpose and funding that supports a broader array of university activities. In a fund accounting system, universities match (or account for) revenues coming into each fund with expenditures from the same fund. One of the purposes of the fund accounting system is to account for and respect the restrictions imposed on the use of funds that the universities receive for designated or targeted purposes. In that way the accounting system helps universities transparently illustrate how they are following the intent of their various sponsors. The Canadian Association of University Business Officers (CAUBO) produces a guidebook describing the principles of fund accounting. Under this system, university revenues are divided into the following six funds:
• Endowment fund; • Ancillary fund; • Capital fund; • Sponsored research fund; • Special purpose and trust fund; and • General operating fund.
16 | Trends in higher education | Volume 3. Finance
Community service
Universities provide a vast array of community services to their local communities, which include but are not limited to: conference facilities; sporting facilities and events; child care services; psychological and physical health care services; dental services; access to art galleries, cultural exhibits and theatrical performances; cost-effective utilities; and affordable summer lodging. These services often fill a gap in the local economy or provide cost-effective alternatives.
Whether focused in large urban centres like Toronto, Vancouver and Montreal or smaller communities like Antigonish or Peterborough, these projects and initiatives have teaching and learning implications for students, as well as direct benefits for the local community.
For students, engaging in various aspects of the community-university interface provides service learning opportunities and a chance to apply their theoretical knowledge.
In these ways, the impact of university community service activities on the lives of individuals and communities extend beyond the economic impacts often associated with higher education and research, frequently offering intrinsic values that are difficult to quantify. The impact of community service is often more easily described in terms of its impact on collective identity, quality of life and social well-being.
The funding for community service initiatives is often taken from a variety of university “pots,” including private, designated donations, and can be difficult to attribute to a single purpose. Consequently, the funding trends for the community service function of universities cannot be illustrated in the same way as the funding trends for teaching and research and therefore will not be highlighted further in this report.
While the fund accounting system is very useful, it does not clearly identify how revenues and expenditures from the six accounts are combined to individually and collectively support the teaching, research and community service missions of the universities. The following section describes the sources and levels of funding that make up the six CAUBO-defined funds and, for analytical purposes, reallocates these monies to the main university activities. For example, in the CAUBO guidelines, the research funding that universities receive from external sources is allocated to the sponsored research fund. These revenues only cover a portion of the costs of sponsored research projects and do not cover the costs of any of the faculty research that is funded internally. This means that universities
must draw on some of the revenues from their general operating fund and special purpose and trust fund to cover these additional research costs. Furthermore, these two funds together also support the teaching and community service roles of Canadian universities. This report illustrates the revenues that flow from the general operating fund and special purpose and trust fund to support the unfunded costs of research in order to better represent the amount of money needed by universities to conduct research. It documents the adjustments made to the financial data available from CAUBO to more consistently report the financial information and help readers interpret changes in funding trends for core university activities over the period from 1980-81 to 2006-07.

Association of Universities and Colleges of Canada | 17
institution’s primary operating activities of teaching, research and community service. In 2006-07, the revenues from ancillary enterprises at Canadian universities totalled almost $1.7 billion. Growth in revenues and expenditures is driven largely by increases in student numbers, and revenues have therefore grown almost precisely in line with enrolment growth.
Capital funds
The capital fund is for the expansion of, or major renovations to, the physical infrastructure on university campuses. Universities rely on funding from a variety of sources to finance capital projects.
Endowment funds
Since 1999,9 CAUBO has included data on endowment funding in its annual reports on university revenues. The revenues that flow into an endowment fund are “restricted revenues” – primarily donations and interest income restricted for specific purposes by the donor or the university. Donations are invested by universities and, generally speaking, it is the income generated from these investments that provides resources for the universities to spend on an annual basis. An endowment fund is meant to provide a resource (a stream of income) that universities can rely upon in perpetuity. To meet this goal and maintain purchasing power, universities have created spending policies that limit the annual amount that can be spent out of the endowment fund – generally about four to five percent of the total value of the liquid portion of the fund.10 The endowment fund itself is not expendable, nor are the donations to the endowment that increase the endowment capital. Therefore, annual changes in endowment capital have been excluded in the analysis here of annual university revenues and expenditures. Revenues flowing from the endowment fund to other funds in the annual revenues of the universities are included in the analysis.
Investment income generated by endowment funds is used for a variety of purposes. In 2006-07, Canadian universities used $420 million in revenues generated from endowment funds to finance expenditures in their other funds. Most of that amount (close to $285 million) financed activities in the special purpose and trust fund, including much of the $275 million in scholarships and bursaries provided to students from the fund.
Ancillary funds
Ancillary funds are generated primarily through the sale of goods and services from bookstores, student residences, parking facilities, the university press, university facility rentals and food services. These goods and services are generally provided on a cost-recovery basis11 and complement the
Figure 3.4:Capital funding was significantly higher over the last seven years than during the 1990s
Source: AUCC using data from Statistics CanadaDeflator based on the U.S. Higher Education Price Index
1980
-81
1982
-83
1984
-85
1986
-87
1988
-89
1990
-91
1992
-93
1994
-95
1996
-97
1998
-99
2000
-01
2002
-03
2004
-05
Capital excluding CFICFI and government matching fundingCapital including CFI and government matching funding
$0.0
$0.5
$1.0
$1.5
$2.0Capital including CFI
CFI and government matching funding
Capital excluding CFI
2006
-07e
Cons
tant
200
6-07
$ b
illio
ns

18 | Trends in higher education | Volume 3. Finance
Provincial governments support capital projects in various ways. In some cases, they provide the majority of the funding required to finance capital projects. At other times, they provide a much smaller investment and universities pay for these projects either through fundraising or by financing the costs of the projects themselves – either from their endowments or debt financing, including in some cases issuing their own bonds to finance major capital projects.
The amount of capital investment varies widely over time as does the need for, and availability of, capital resources. Nationally, revenues in the capital fund surpassed the billion dollar mark for the first time in 1999-2000. To highlight just how volatile these revenues are, in the preceding year (1998-99) capital revenues were less than half that amount. The rapid growth was driven primarily by a one-time jump for Ontario universities under that province’s SuperBuild program intended to help address the major increase in enrolment associated with the “double-cohort.” The following year, provincial government’s capital funding declined by more than 40 percent in Ontario, illustrating the volatile and “lumpy” nature of capital funding. After falling below $1.1 billion from 2002-03 to 2003-04, capital funding subsequently jumped back into the $1.4 billion range in 2006-07. This type of volatility is repeated over time in other provinces and institutions.
Historically, capital investments for research facilities were included in the capital fund. However, using the CAUBO methodology, both the revenues and expenditures associated with the Canadian Foundation for Innovation (CFI), along with the corresponding matching funds from provincial governments and other contributors, are reported in the sponsored research fund and not the capital fund. Therefore, trends within the sponsored research fund must be examined to determine what adjustments are required when reporting the revenues available to conduct research versus those that are targeted for capital projects. Not surprisingly, expenditures from the sponsored research fund for buildings, land and equipment have expanded very rapidly as a result of including CFI revenues and expenditures in this fund. Given the scale of
the CFI investments, CFI funding will be excluded from the sponsored research fund for the purposes of the analysis here to avoid creating misperceptions about the funding available to conduct sponsored research and allow for comparisons over time. While CFI funding has unquestionably been a major support to the overall university research effort in Canada, netting CFI program revenues and costs out of the sponsored research fund and including them within the capital fund12 provides a clearer, more comparable picture of spending and revenues in each fund.
The Canada Foundation for Innovation
Until 2001, the vast majority of capital projects – whether they were for teaching, research or ancillary facilities – were accounted for within the capital fund itself. This changed with the introduction of funding through the Canada Foundation for Innovation (CFI). CFI was established by the federal government in 1997 as a vehicle to fund the construction and operation of research infrastructure projects in Canadian universities, affiliated teaching hospitals, colleges and not-for-profit institutions. These infrastructure projects include state-of-the-art equipment, buildings, laboratories and databases. CFI provides funding for up to 40 percent of the eligible costs of each infrastructure project, and the balance of the project’s costs are paid by the institutions and their funding partners. Provincial governments are the most important funding partner, and they often match the federal government’s 40 percent contribution. However, there are many other possible sources of Canadian or foreign partner contributions:
Institutional funds, trust funds or foundations; Federal departments and agencies; Municipal governments; Firms and corporations; Volunteer organizations; and, Individuals.
•
•••••
Association of Universities and Colleges of Canada | 19
Universities account for CFI funds in the year in which they are spent; this differs from government reporting, which occurs when CFI funds are disbursed. While the CAUBO reports have specifically identified CFI funding since the funds began to flow to universities in 1999-2000, these reports do not separately identify all of the matching funding. It is therefore necessary to estimate the amounts of matching funds.13
CFI funding (along with the matching contributions) has surpassed $750 million annually since 2002-03, and in 2006-07, the combined funding was an estimated $755 million of which $570 million has been allocated to the capital fund for analytical purposes in this report.14 When CFI funding is combined with revenues for other capital projects, total capital funding has been at or near the $1.8 billion mark in each of the last five years – more than double the funding available throughout most of the 1980s and 1990s.
Even when CFI funding is excluded, there has been strong growth in capital spending since 1999. The major increase in capital spending was financed by a combination of government grants, private fundraising and increased debt. The increasing reliance on debt (primarily in Ontario and Quebec), has resulted in a number of institutions issuing their own debentures to finance major capital projects and/or refinancing existing debt. In some cases, the annual cost of servicing the debt comes out of university operating budgets, reducing the amount of money available to cover teaching and related expenditures. As universities take steps to address the need for new construction and refurbishment of aging facilities, it is not surprising that they have turned to other financing vehicles to make up the funding shortfalls.
The practice of issuing debentures is not a Canada-wide phenomenon. In some provinces a university contemplating such a move is required first to obtain government approval.15 The bottom line, however, is that as universities take steps to refurbish and expand their physical facilities, governments often provide only partial funding and often require the institution to finance part of the expenditure – largely through private donations. With many institutions clamouring for private donations (along with a host of other ‘competitors’ such as hospitals and non-profit agencies), the level of risk has increased markedly and, in some cases, the operating budget has borne the brunt of fundraising shortfalls. This is an unintended consequence of increases in capital spending and, in some provinces, has resulted in changes in government policies. This issue will be explored again later in this volume (see p.40).
Sponsored research fund
The sponsored research fund does not provide a comprehensive picture of all the funding that supports university research. The preceding section on capital funding documented that some of the CFI and CFI matching support should be counted as capital funding, but clearly, those funds also support university research activities. Furthermore, in addition to the external funding that universities receive for sponsored research within this fund, they must also draw upon their own resources to support the unfunded institutional costs of research. The following section explores the various types of funding that support university research.
Universities conduct a wide range of basic and applied research. This section discusses the funds used to support these research activities. Many of these research activities have external sponsors, while some are funded internally. The main component, the sponsored research fund, is a designated fund to account for external funding of universities’ sponsored research activities. The main sources of this funding are governments, the private sector and the not-for-profit sector.
20 | Trends in higher education | Volume 3. Finance
Externally sponsored research projects involve the allowable direct costs, non-allowable direct costs and institutional costs (or so-called “indirect costs”) that are incurred during the research process.16 For example, for research projects funded by the federal research granting agencies, allowable direct costs are those that can be directly attributed to the cost of conducting the specific research project. These eligible costs include: salaries and stipends for research assistants, research equipment and supplies, administrative services directly related to the research project, travel costs and costs associated with publishing results. Non‑allowable direct costs are primarily the salaries of the principal researchers (faculty) on the research project. Universities cover these costs through general operating funds. Universities also support an array of other costs that arise as a result of hosting the research project. These institutional costs include: operating and maintaining facilities and resources such as laboratories, libraries and computer networks; managing the research process (including coordinating research, preparing grant applications and managing intellectual property); and ensuring regulatory and safety compliance. External sponsors cover only a portion of these costs.
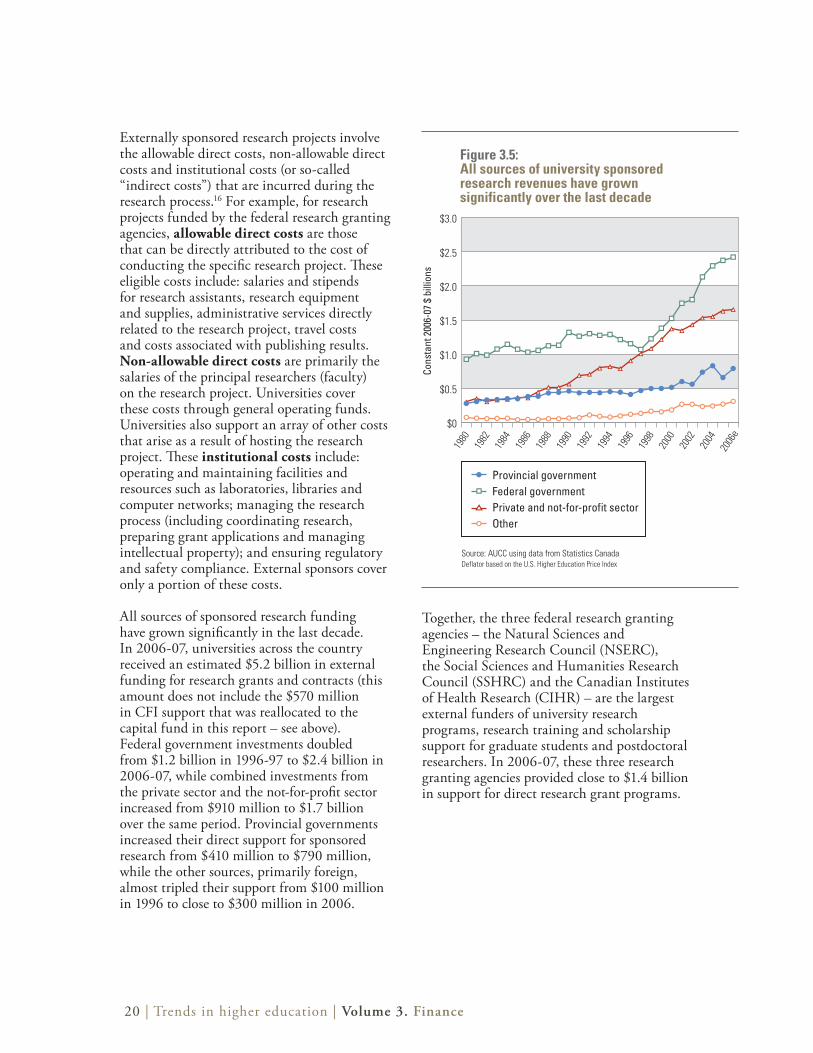
All sources of sponsored research funding have grown significantly in the last decade. In 2006-07, universities across the country received an estimated $5.2 billion in external funding for research grants and contracts (this amount does not include the $570 million in CFI support that was reallocated to the capital fund in this report – see above). Federal government investments doubled from $1.2 billion in 1996-97 to $2.4 billion in 2006-07, while combined investments from the private sector and the not-for-profit sector increased from $910 million to $1.7 billion over the same period. Provincial governments increased their direct support for sponsored research from $410 million to $790 million, while the other sources, primarily foreign, almost tripled their support from $100 million in 1996 to close to $300 million in 2006.
Together, the three federal research granting agencies – the Natural Sciences and Engineering Research Council (NSERC), the Social Sciences and Humanities Research Council (SSHRC) and the Canadian Institutes of Health Research (CIHR) – are the largest external funders of university research programs, research training and scholarship support for graduate students and postdoctoral researchers. In 2006-07, these three research granting agencies provided close to $1.4 billion in support for direct research grant programs.
Figure 3.5:All sources of university sponsored research revenues have grown significantly over the last decade
Source: AUCC using data from Statistics CanadaDeflator based on the U.S. Higher Education Price Index
1980
1982
1984
1986
1988
1990
1992
1994
1996
1998
2000
2002
2004
Provincial governmentFederal governmentPrivate and not-for-profit sectorOther
$0
$0.5
$1.0
$1.5
$2.0
$2.5
$3.0Other
Private sector and foundations
Federal government
Provincial government
2006
e
Cons
tant
200
6-07
$ b
illio
ns

Association of Universities and Colleges of Canada | 21
In addition to the external funding that universities receive to conduct sponsored research projects, they must draw upon their own resources to support the unfunded institutional costs and faculty costs associated with sponsored research projects. As well, universities support the research activities of faculty who are conducting research without external funding by covering faculty time, direct costs and institutional costs associated with this unsponsored research.17 Studies18 reveal that Canadian university faculty spend between 20 to 45 percent of their time conducting both sponsored and unsponsored research. The amount of time devoted to research varies depending on the size and mission of the institution as well as on the faculty member’s primary field of expertise. Based on Statistics Canada estimates, the cost of faculty time devoted to sponsored and unsponsored research increased 60 percent in the last decade from $1.1 billion in 1996 to $1.7 billion in 2006 (see examples of typical differences in faculty time devoted to R&D in Table 1). Figure 3.6 also illustrates that as the funding for sponsored research has grown over the last decade, so too have the institutional costs associated with funding the costs of those projects – unfunded institutional costs have grown from $1.1 billion in 1996-97 to $1.7 billion in 2006-07.
At the aggregate level, for purposes of analysis, this publication utilizes the Statistics Canada methodology for reporting Canada’s HERD to the OECD. This methodology is designed to capture all the costs associated with university research and to illustrate how universities contribute to overall national R&D efforts. It is important to understand and document how
Table 1: Faculty time coefficients for research
Institution size Education Fine arts Humanities
Social sciences
Agriculture and
biological sciences
Engineering and
applied sciences
Health professions
Mathematics and
physical sciences
Small 0.20 0.20 0.25 0.25 0.30 0.35 0.30 0.30
Medium 0.25 0.20 0.25 0.30 0.40 0.35 0.40 0.35
Large 0.25 0.20 0.30 0.35 0.45 0.40 0.45 0.45
Source: Statistics Canada
1991
-92
1993
-94
1995
-96
1997
-98
1999
-00
2001
-02
2003
-04
2005
-06
Figure 3.6:In addition to the strong growth in external funding for sponsored research and CFI related infrastructure, universities draw from their other revenues to support research activities
Source: AUCC using data from Statistics CanadaDeflator based on the U.S. Higher Education Price Index
Sponsored research (net of CFI)Unfunded institutional costs of sponsored researchCost of faculty time on researchCFI and government matching funding
$0.0
$1.0
$2.0
$3.0
$4.0
$5.0
$6.0CFI
Cost of faculty time on research
Unfunded institutional costs of sponsored research
Sponsored research (net of CFI)
Cons
tant
200
6-07
$ b
illio
ns
2006
-07e
university research activities are supported in Canada and other comparator nations because it is the total costs of all university research activities that are widely used internationally to calculate universities’ contributions to national R&D efforts.
22 | Trends in higher education | Volume 3. Finance
It is also important to recognize that the resources devoted to these R&D activities cannot be directly used to support teaching and academic support services for students. These research investments do, however, create a research-enriched learning environment that is a distinguishing element of a university education, and from that perspective, they are highly desirable investments. There are also clear public benefits from conducting research and teaching together. So-called “economies of scope” arise because it is less expensive to conduct teaching and research together than to undertake each activity separately.19
Universities support an array of costs to cultivate an environment where top-flight research, research training and knowledge transfer are conducted. This environment is supported by a number of centralized services – from research administration and support, to libraries, industry liaison and ethical review committees to name but a few examples. Each of these services is essential to the successful attraction, productive management and support of external research funding. In Canada, unlike other countries in this report, external sponsors rarely cover the costs of the time that faculty spend on their research projects. Universities therefore cover the costs of faculty time on research whether or not the projects have external sponsorship. Universities also cover, to the extent possible,20 the unfunded institutional costs whenever their faculty are successful in research competitions (for examples, refer to the aforementioned list of costs on page 20). As well, changes in Canada’s research environment over the past two decades have created many new institutional costs, including the need for technology transfer offices and knowledge mobilization networks to transfer knowledge to other sectors. Given that all costs are not fully covered by the external research funder, universities will, to the extent possible, draw upon their general operating and endowment funds to subsidize the direct research funding.
Students, especially those in advanced degree programs, benefit both from the scholarship programs of the federal research granting
agencies ($330 million) and the research training they receive through the funding of faculty research by the granting agencies (generally about 30 percent of a research grant supports students who assist faculty in their research). Combined, funding from the research granting agencies grew from almost $1,400 per student in 1996 to almost $1,800 per student in 2006-07 in real terms (when adjusted for price changes using the Higher Education Price Index or HEPI).
Between 1998-99 and 2006-07, the federal government introduced a number of major initiatives related to research including the Canada Foundation for Innovation, the Canada Research Chairs program and the Indirect Costs program. These initiatives have helped to enhance and strengthen the research and learning environment in Canada.
As noted earlier, for analytical clarity here, CFI funding is treated as capital funding rather than sponsored research funding. Notwithstanding this fact, there can be no doubt about the significance of CFI funding to the overall university research effort. CFI infrastructure funding has created the new state-of-the-art equipment, buildings, laboratories and databases required to conduct research, and has strengthened the capacity of Canadian universities and research hospitals affiliated with universities to carry out world-class research and technology development. Due to a lack of national historical data, it is not possible to benchmark the state of university research infrastructure today against that which existed in 1980. Without such a baseline it is difficult to generate an infrastructure metric that would put the previous stock of research infrastructure in context, especially given the new demands generated by the rapid increases in graduate students and the more measured increases in university faculty over the last decade. However, it is clear that the new infrastructure funded by CFI has been an integral part of the ability of universities to attract and accommodate many more students and faculty.
Association of Universities and Colleges of Canada | 23
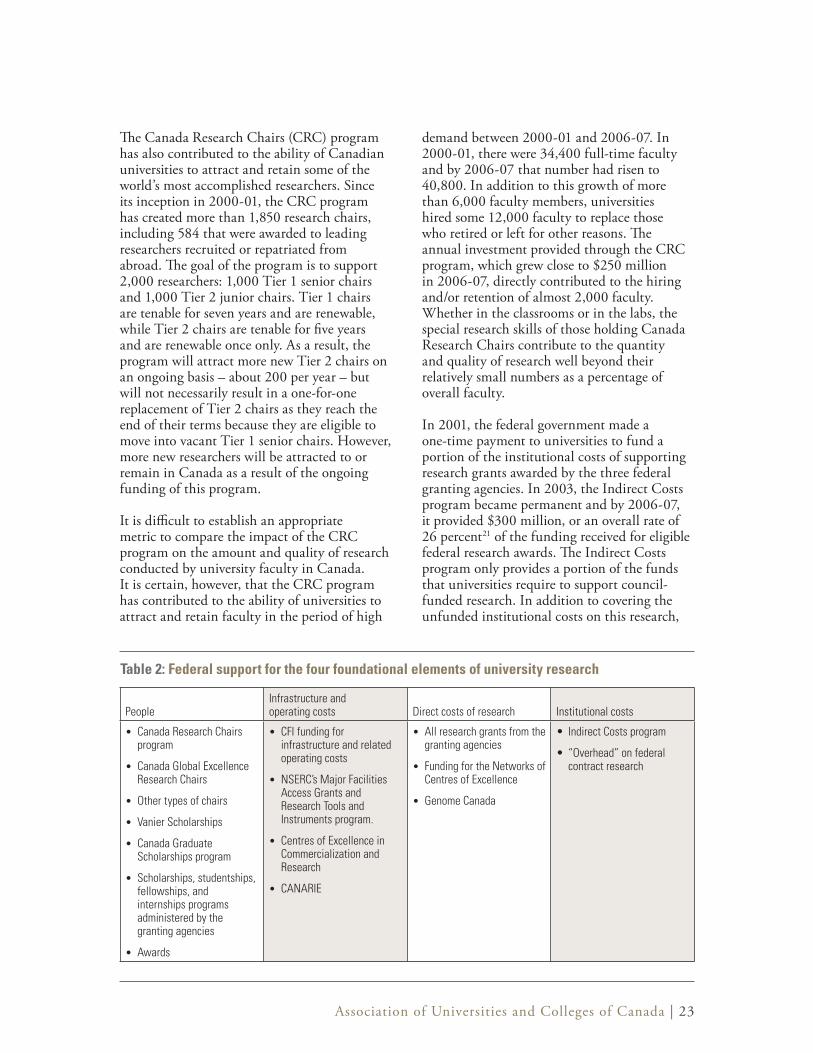
The Canada Research Chairs (CRC) program has also contributed to the ability of Canadian universities to attract and retain some of the world’s most accomplished researchers. Since its inception in 2000-01, the CRC program has created more than 1,850 research chairs, including 584 that were awarded to leading researchers recruited or repatriated from abroad. The goal of the program is to support 2,000 researchers: 1,000 Tier 1 senior chairs and 1,000 Tier 2 junior chairs. Tier 1 chairs are tenable for seven years and are renewable, while Tier 2 chairs are tenable for five years and are renewable once only. As a result, the program will attract more new Tier 2 chairs on an ongoing basis – about 200 per year – but will not necessarily result in a one-for-one replacement of Tier 2 chairs as they reach the end of their terms because they are eligible to move into vacant Tier 1 senior chairs. However, more new researchers will be attracted to or remain in Canada as a result of the ongoing funding of this program.
It is difficult to establish an appropriate metric to compare the impact of the CRC program on the amount and quality of research conducted by university faculty in Canada. It is certain, however, that the CRC program has contributed to the ability of universities to attract and retain faculty in the period of high
demand between 2000-01 and 2006-07. In 2000-01, there were 34,400 full-time faculty and by 2006-07 that number had risen to 40,800. In addition to this growth of more than 6,000 faculty members, universities hired some 12,000 faculty to replace those who retired or left for other reasons. The annual investment provided through the CRC program, which grew close to $250 million in 2006-07, directly contributed to the hiring and/or retention of almost 2,000 faculty. Whether in the classrooms or in the labs, the special research skills of those holding Canada Research Chairs contribute to the quantity and quality of research well beyond their relatively small numbers as a percentage of overall faculty.
In 2001, the federal government made a one-time payment to universities to fund a portion of the institutional costs of supporting research grants awarded by the three federal granting agencies. In 2003, the Indirect Costs program became permanent and by 2006-07, it provided $300 million, or an overall rate of 26 percent21 of the funding received for eligible federal research awards. The Indirect Costs program only provides a portion of the funds that universities require to support council-funded research. In addition to covering the unfunded institutional costs on this research,
Table 2: Federal support for the four foundational elements of university research
PeopleInfrastructure and operating costs Direct costs of research Institutional costs
Canada Research Chairs program
Canada Global Excellence Research Chairs
Other types of chairs
Vanier Scholarships
Canada Graduate Scholarships program
Scholarships, studentships, fellowships, and internships programs administered by the granting agencies
Awards
•
•
•
•
•
•
•
CFI funding for infrastructure and related operating costs
NSERC’s Major Facilities Access Grants and Research Tools and Instruments program.
Centres of Excellence in Commercialization and Research
CANARIE
•
•
•
•
All research grants from the granting agencies
Funding for the Networks of Centres of Excellence
Genome Canada
•
•
•
Indirect Costs program
“Overhead” on federal contract research
•
•

24 | Trends in higher education | Volume 3. Finance
universities cover the unfunded costs on other sponsored research projects including research sponsored by other federal departments and agencies, provincial governments, charitable organizations and the private sector. AUCC estimates that the unfunded institutional costs associated with research undertaken for all external sponsors have risen from $1.1 billion in 1996-97 to more than $1.7 billion in 2006-07.
More recently, the federal government has made additional investments in university R&D. These include the Centres of Excellence in Commercialization and Research program in 2007 and the Global Excellence Research Chairs in 2008. Under the former program, 18 centres of excellence were funded in fiscal 2007-08 at a level of $15 million each over five years. An additional $52 million is available for the creation of new centres of excellence in the 2009 competition. The latter initiative will allocate $21 million over two years to establish 10 Global Excellence Research Chairs (with plans to provide another 10 chairs in the following two years). In keeping with the federal government’s S&T strategy, these chairs will target the following four areas: the environment, natural resources and energy, health, and information and communication technologies. Each Canada Global Excellence Research Chair will receive up to $10 million over seven years.
General operating funds and special purpose and trust funds
The general operating fund and the special purpose and trust fund are closely linked. The general operating fund is an unrestricted fund used to finance the primary activities of teaching and research other than sponsored research. Most of the revenues in this fund are derived from provincial operating grants and tuition fees. It is used to pay for faculty and staff salaries and student support services as well as assist faculty in their work and cover administrative costs. The special purpose and
trust fund consists of revenues that have a purpose designated by either a government department or private sector donors. Together, the general operating fund and special purpose and trust fund provide the revenues to fund teaching, academic and financial support services for students, unsponsored research, and community activities. They also cover the costs associated with sponsored research that are not directly funded from other sources.
How these monies are usedThere are significant differences in how universities allocate their revenues to either the general operating fund or the special purpose and trust fund, which are often related to the imperatives of their provincial funding regimes. Such differences hinder accurate inter-institutional and inter-provincial comparisons. To enhance comparability, the two funds have been combined in this volume.
Some of the monies in these funds support activities that are not directly related to teaching or research. Therefore, for the purposes of these calculations, they have been netted out of the monies being discussed. The exclusions include monies that flow to and through the universities for student scholarships and bursaries, monies that flow through the universities from Ministries of Health to cover health care services provided to the public at the universities, fees for non-credit programs and various miscellaneous fees, as well as the sales of other goods and services that are not related to teaching or research (see Appendix D for more information).
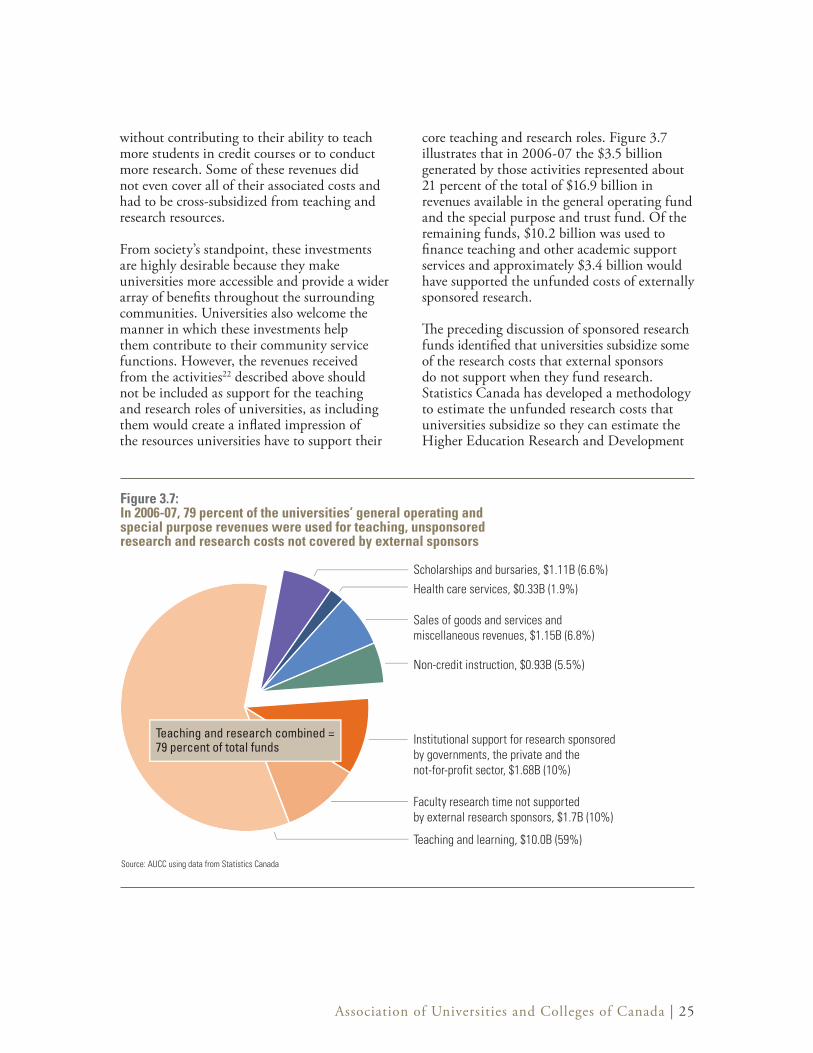
When combined, revenues that flow through the universities to cover scholarships and bursaries, health care services, sales of goods and services, and non-credit and other student fees account for 21 percent of all operating and special purpose resources. Together, these types of revenues grew from $940 million in 1996-97 to $3.5 billion a decade later, adding $2.6 billion to the gross revenues of universities
Association of Universities and Colleges of Canada | 25
without contributing to their ability to teach more students in credit courses or to conduct more research. Some of these revenues did not even cover all of their associated costs and had to be cross-subsidized from teaching and research resources.
From society’s standpoint, these investments are highly desirable because they make universities more accessible and provide a wider array of benefits throughout the surrounding communities. Universities also welcome the manner in which these investments help them contribute to their community service functions. However, the revenues received from the activities22 described above should not be included as support for the teaching and research roles of universities, as including them would create a inflated impression of the resources universities have to support their
core teaching and research roles. Figure 3.7 illustrates that in 2006-07 the $3.5 billion generated by those activities represented about 21 percent of the total of $16.9 billion in revenues available in the general operating fund and the special purpose and trust fund. Of the remaining funds, $10.2 billion was used to finance teaching and other academic support services and approximately $3.4 billion would have supported the unfunded costs of externally sponsored research.
The preceding discussion of sponsored research funds identified that universities subsidize some of the research costs that external sponsors do not support when they fund research. Statistics Canada has developed a methodology to estimate the unfunded research costs that universities subsidize so they can estimate the Higher Education Research and Development
Figure 3.7:In 2006-07, 79 percent of the universities’ general operating and special purpose revenues were used for teaching, unsponsored research and research costs not covered by external sponsors
Source: AUCC using data from Statistics Canada
Faculty research time not supported by external research sponsors, $1.7B (10%)
Institutional support for research sponsoredby governments, the private and the not-for-profit sector, $1.68B (10%)
Non-credit instruction, $0.93B (5.5%)
Sales of goods and services andmiscellaneous revenues, $1.15B (6.8%)
Health care services, $0.33B (1.9%)
Scholarships and bursaries, $1.11B (6.6%)
Teaching and learning, $10.0B (59%)
Teaching and research combined = 79 percent of total funds
26 | Trends in higher education | Volume 3. Finance
component of Canada’s aggregate research efforts and report them to the OECD. Based on AUCC’s current estimates,* universities would, at a minimum, need to spend close to $3.4 billion to support those research programs at internationally competitive levels. To illustrate the impact of cross subsidization required to support their research-related activities, $3.4 billion represents approximately one-fifth of the general operating and special purpose fund resources for all universities.
Again, a major portion of these research costs relates to faculty members’ time conducting research, with most of that time devoted to conducting research for external sponsors. Provincial government operating grants to universities flow in the full knowledge that universities draw upon these monies to cover some of the cost of the time faculty spend on research. Moreover, the time requirement to conduct sponsored research is growing and is expected to continue to grow. Both the federal and provincial governments have signalled that they recognize and value the strategic importance of university-based R&D to Canada’s economic competitiveness and prospects for prosperity.
University administrators and faculty also recognize the importance of their research activities; these activities are seen as an integral part of the employment contract for faculty members. Active engagement in R&D is critical
to what they teach and how they teach. The knowledge and expertise that faculty develop through their research directly contribute to their knowledge base and therefore to the teaching, learning and research training that take place in classrooms, labs and seminar rooms on university campuses.
There are other synergies between research and teaching. One of the most important is training the next generation of researchers and knowledge workers who will subsequently be employed throughout all sectors of the economy. Even when faculty are not involved in externally sponsored R&D projects, they are still expected to engage in discovery, scholarship and other creative activities. Universities provide them with time to do so as part of their responsibilities. Of course, the amount of time will vary across universities, and across and within academic departments or disciplines.
The link between research and teaching makes it difficult to apportion university revenues solely to one activity or the other. For illustrative purposes, the chart 3.7 divides the university’s general operating and special purpose and trust funds into support for teaching and learning, funding for unsupported research costs and support for other activities which are not directly related to teaching and research but which are delivered on a cost
* Several changes in the research funding environment have arisen since the last set of extensive revisions were made to Statistics Canada’s estimation methodology for HERD. Since the late 1990s, the federal government has introduced two major research programs that impact the HERD methodology. The Indirect Costs program provides funding for institutional costs that in the past were a significant portion of the costs that needed to be estimated. The CFI programs and the associated matching funds from provincial governments, among others, also impact the level of sponsored research reported by Canadian universities. However, the Statistics Canada methodological guidelines exclude capital from the direct costs base for the calculation of indirect costs. To be consistent, the CFI and matching contributions should, to the extent possible, also be excluded from the direct costs base for the calculation of institutional costs. Statistics Canada regularly reviews its methodological documentation for accuracy and completeness. The application of an estimation model depends upon the underlying data and how they are processed. For this volume of Trends, AUCC is presenting their suggested modifications of Statistics Canada’s estimates of HERD. These modifications have been proposed to Statistics Canada which has agreed to investigate and assess them within their quality framework. In addition, some other external research sponsors are also providing more funding for institutional costs than they were when the methodology was revised in the late 1990s. For example, provincial governments in Ontario and Quebec now provide significant levels of support for institutional costs on various provincial research grants. At this stage, it is not possible to estimate accurately the impact of those changes so we have not made further adjustments to the estimates of direct and indirect research support from other sponsors. Statistics Canada will be conducting an extensive quality assessment of how research is being funded, and they have stated that they look forward to continuing to work with AUCC during the assessment.
Association of Universities and Colleges of Canada | 27
recovery or flow-through basis. Chart 3.7 highlights the link between teaching and research activities. The following distributions of the revenues used to fund unsupported research costs are based on the methodology Statistics Canada utilizes to report Canada’s HERD investments to the OECD, adjusted as per the footnote on page 26.
The first component in this HERD methodology, the cost of faculty time spent on sponsored and unsponsored R&D, is determined on the basis of a survey of faculty time. In 2006-07, these costs were estimated at close to $1.7 billion. As Table 1 highlighted (see page 21), faculty typically spend between 20 and 45 percent of their time working on various research projects, depending largely on their specific discipline and institution.
The second component relates to the costs universities underwrite when they conduct research for not-for-profit organizations, the private sector, and federal and provincial government departments and agencies. In 2006-07, the estimated costs were $2.15 billion, of which close to $1.68 billion were not covered by external sponsors. This component includes the institutional costs of supporting federal research council grants.23 The Indirect Costs program covered close to $300 million of the costs in 2006-07 and the universities covered the remaining $240 million in institutional costs to support research sponsored by the councils. Provincial policies vary widely, with some provincially sponsored research projects supported even beyond 40 percent while many others receive little or no support for institutional costs.
There is similar variability in how the not-for-profit and private sectors support institutional costs in other countries. In 2006-07, not-for-profit organizations conducted $700 million in R&D activities through the universities and virtually no institutional costs
were covered in the vast majority of those grants and contributions. Private industry contracts with universities to conduct R&D totalled $600 million. While some industry contracts included significant institutional cost components, others did not support any of these costs. It is interesting to note that in order to encourage university research partnerships with the not-for-profit groups and private industry, U.K. governments now contribute significantly to the institutional costs of research sponsored by these sectors.
Seventy-nine percent of the revenues in the universities’ general operating and special purpose and trust funds are used for teaching purposes, unsponsored research, and research costs not covered by external sponsors. Though the support is frequently targeted to one particular teaching or research activity, the majority of those university expenditures produce overlapping or mutually reinforcing learning, discovery and knowledge mobilization outcomes. Thus, the growth in funding for sponsored research which has been so pronounced over the last 10 years has also had positive impacts on education, especially graduate education. One clear area where there is a strong direct relationship is in the grant funding provided by the federal granting agencies. As noted earlier, about 30 percent of the funds that support the research projects led by faculty flow to the graduate students (and in some cases undergraduate students) who work with the principal researchers on those projects. The learning and research skills that result from this interaction are one of the prime examples of the mutually reinforcing outcomes resulting from research investments. At the same time, the increases in sponsored and unsponsored research on campuses drive up the faculty time and institutional cost components related to research, thereby supporting the growing amount of unfunded research costs that have created pressure on the general operating and special purpose and trust funds.
28 | Trends in higher education | Volume 3. Finance
Where the monies come fromProvincial government support and tuition fee income combined have long provided 90 percent or more of university general operating and special purpose revenues. Not only are they the most important sources, but they are also linked in policy terms since provincial governments determine the level of operating support and also play an increasingly important role in the determination of tuition fee levels in Canada.
Since 2000-01, provincial governments have significantly increased their overall operating and special purpose funding of universities. Once adjusted for increases in inflationary cost pressures, this funding increased by $1.7 billion from almost $7 billion in 2000-01 to close to $8.7 billion in 2006-07. These were critical investments which have helped to support the rapid enrolment increases during that period. However, a substantial portion of these increases in government funding has been explicitly tied to freezes or to tight controls on tuition increases. Part of the increase in the government funding was explicitly intended to offset some of the revenue losses that the universities would confront as a result of either new tuition regulations in some provinces or agreements with the universities regarding their tuition policies.
Tuition freezes have long been in effect in Quebec, Newfoundland and Manitoba. In the latter two cases, the freezes have followed on the heels of rollbacks in student fees. In these two instances, the impact of the initial rollbacks did not negatively affect university revenues as governments agreed to increase the operating grants to compensate for forgone tuition revenue. In the last few years, several other provincial governments have introduced or negotiated these types of tuition policies with universities24– freezes or tuition rollbacks combined with compensating grant offsets to the universities. They include Saskatchewan and Alberta in 2004, as well as similar arrangements announced this year in Prince Edward Island, Nova Scotia and New Brunswick.25 Governments in British Columbia
and Ontario have imposed tuition freezes at various times in the last decade, and while fees in these two provinces are not currently frozen, the rates of increase are very limited.
Universities can confront challenges in this type of policy arrangement. Over the longer term, the amount of resources provided by governments in the form of tuition offset may not keep pace with the changes in the costs of providing a dynamic teaching and learning environment. Indeed, if the offsets are to be rolled into the operating grants, then there is an even greater likelihood that the revenues from government offsets will not adequately compensate for the revenues that the universities would have derived from their own tuition policies. Over a longer period, the specific terms and duration of any agreements or regulations that affect tuition fees and the related tuition offset policies can have a significant impact on aggregate university revenues.
Over time, intermingled grant, tuition and student aid policies make it increasingly complex to track the implications of funding policies from either the universities’ or the students’ perspectives. Government policies effectively control university revenues from operating grants and tuition fees (as well as underlying policies that impact institutional student aid support). Relatively large increases in operating grants driven by tuition compensation policies can create public misperceptions about the resources universities have available to support teaching and research.
Until very recently, universities’ general operating and special purpose and trust funding – and consequently, unsponsored research – did not keep pace with either the direct funding for research or the rapid increase in enrolment. Furthermore, the demands on universities to engage in R&D and to increase enrolments (at least at an aggregate national level) are not likely to abate over the decade to come. The fact that per student funding for teaching is lower than in the past could be undermining the joint outcomes of teaching and research. The section on international

Association of Universities and Colleges of Canada | 29
trends, which highlighted comparisons with the U.S., U.K. and Australia revealed the impact of combined funding trends for teaching and research in Canada (see Figure 3.1).
In 1980, governments contributed 84 percent of the funds available for teaching and unsponsored research costs. Student fees for credit courses covered about 10 percent and investments and donations covered the remaining four to five percent. By 2006, these shares were 66 percent from government sources, 24 percent from student fees and 10 percent from investments and donations, with the proportions varying significantly by province and by institution.
Government funding (primarily provincial) fell from more than $17,900 per student in 1980-81 to $13,600 in 1990-91 and to just $9,900 in 2006-07. Student fee revenue (from credit course enrolments), net of financial aid given back to students from the universities, was $2,000 per student during most of the 1980s then rose to $3,700 in 1999 and has remained at that level since.
Recent increases in general operating and special purpose and trust revenues from all sources, when adjusted for inflation and enrolment growth, have begun to reverse the long-term decline in per student funding for teaching and research costs not covered by external sponsors. As demonstrated in Figure 3.8, in 2006-07, per student funding amounts to $15,000, which is $500 higher per student than in 2001-02, but also $6,000 per student less than at the beginning of the 1980s, and $2,000 per student less than at the beginning of the 1990s.
In conclusion, while universities’ per student revenues to support teaching and research costs not covered by external sponsors have stabilized since about 2000, they remain at historical lows. The next section will discuss the factors that will drive changes in relation to university financing in the years to come – particularly in relation to the universities’ teaching and research activities and the nexus between them.
1980
-81
1982
-83
1984
-85
1986
-87
1988
-89
1990
-91
1992
-93
1994
-95
1996
-97
1998
-99
2000
-01
2002
-03
2004
-05
Figure 3.8:Despite recent increases in government funding, rapid enrolment growth and inflationary pressures have resulted in universities having significantly less resources to support teaching, learning and research than in the 1980s and most of the 1990s
Source: AUCC using data from Statistics CanadaDeflator based on the U.S. Higher Education Price Index
Total general operating and special purposes and trust revenuesGovernmentStudent fees net of scholarshipsGifts, donations and investment income
$0
$5,000
$10,000
$15,000
$20,000
$25,000Gifts, donations and investment income
Student fees net of scholarships
Government
Total revenues
2006
-07
Reve
nues
per
FTE
stu
dent
in c
onst
ant 2
006-
07 $

Investments in teaching and research produce joint learning, discovery and knowledge mobilization outcomes.
Photo: The University of Winnipeg
Association of Universities and Colleges of Canada | 31
Drivers of change the more significant impact will likely be on demand for space in professional and graduate programs. These are the most resource intensive and costly programs on university campuses and the cost pressures are likely to be far greater than the costs to accommodate the projected undergraduate enrolment increase.
The enrolment volume of Trends pointed to several other factors that are likely to influence the demand for university education. University-educated parents are also more likely to encourage their children to seek a postsecondary education, thereby positively influencing demand. Today’s parents, the so-called baby boom generation, are more educated than any past generation and their influence on their children’s educational aspirations continues to impact enrolment demand. These parents attended university when tuition costs were lower (in real terms). In light of their own university experience and their greater sense of political influence, they are likely to be actively engaged in efforts to provide higher education to their children at reasonable costs.
As noted previously, all provincial governments currently have policies or agreements with universities to constrain tuition increases and in four provinces the cost of tuition is lower, in relative terms, than it was in 2000-01. As was explored in the previous section of this report, given that tuition revenue now represents about one quarter of total revenues, any initiatives to limit tuition increases will translate into funding problems for universities unless there is growth in government operating grants to cover the foregone tuition revenue. Insufficient funding has been demonstrated to affect the quality of the learning experience and capacity of the institutions to provide opportunities for prospective students.
The key drivers of change that will determine the level of university financing required in the decade ahead are the growing demands for the education, research and community services provided by universities. Universities are expected to provide more and better quality educational opportunities to a wider array and growing number of students. They are also expected to assist more faculty members to conduct more and more complex research and increase their community service participation. These demands are emanating not only from students and parents, but also from governments and communities as the university’s role as a catalyst of innovation and as a key contributor to social and economic well-being is increasingly taken as a given in Canadian society.
Growing demand for university education
As illustrated in the preceding volumes of Trends, students, parents, employers and the community at large are placing greater value on a university education. Youth have heard the message from parents and potential employers about the importance of education. They are demanding access to university in greater numbers and there is every indication that this trend will continue.
As noted in the enrolment volume of Trends (Spring 2007), the number of full-time university students is expected to grow by another 70,000 to 150,000 between 2006-07 and 2016-17. Nationally, demography will not drive demand to the extent that it has over the last decade. Population growth in the 18 to 21 age range – the main cohort for bachelor’s programs – will rise more slowly over the first half of the decade before falling back to current levels by 2016-17. However, growth in the population base of young adults aged 22 to 35 will continue. This will continue to increase the demand for undergraduate programs, but
32 | Trends in higher education | Volume 3. Finance
For their part, employers are filling more and more of their job vacancies with university-educated employees who are apt to learn and adapt while on the job. University-educated employees are also receiving, on average, higher salaries and better career advancement opportunities than those who do not have a university degree in hand. The fact that employees with university degrees generally reap strong economic returns over time reinforces the economic incentives for individuals to invest in their education and encourages more Canadians to do so.
Meanwhile, population in the primary working ages of 25 to 59 will grow much more slowly than in the past 20 years. Labour shortages are likely to arise over the course of the coming decade (2008-18) and, in particular, in the following decade (2018-2028). The shortages are likely to create a demand for educated workers right across the Canadian economy. The need to prepare today’s youth, as well as people being displaced by shifts in the economy, for jobs in the coming decade will drive shifts in demand for education.
There is a greater public awareness of the need to ensure that all segments of society are encouraged to undertake the education and training that are required to fuel growth in the economy and to support an aging population. Demands from the public and from employers will continue to influence government investment decisions. Programs designed to attract, retain and support students from groups that are currently underrepresented – such as Aboriginal people, recent immigrants and youth from low-income backgrounds – are likely to generate additional demand for a university education.
The ability of universities to meet this rising demand will depend in large measure on their funding to expand their human and physical resources to attract and support these new students. Growing the number of spaces for university students will not only require more professors and support services, it will require state-of-the-art physical infrastructure to ensure that there is an appropriate place for students to study and learn.
In addition, there is a growing awareness of the desirability of improving the quality of the learning experience. Many Canadian universities participate in the National Survey of Student Engagement (NSSE) and/or conduct their own surveys and assessments of the quality of the learning environment. The NSSE assessments have highlighted unfavourable gaps with peer institutions in the U.S., particularly with respect to student engagement in active and collaborative learning activities and student-faculty interaction. Several universities are assessing how to address these gaps within their current resources and how they could be even more effective with additional resources.
Growing demand for university research
Canada also has a growing need for basic and applied research. There is a broad consensus that investments in university R&D by the federal and provincial governments will not only lead to long-term economic growth and national prosperity, but also to improvements in education, health, environment, culture and public policy. Governments and policy makers also have a greater appreciation of the growing costs and complexities of participating in university R&D activities. Despite the recent growth in the value of the Canadian currency, the costs of research equipment, books, journal subscriptions, research technicians and primary investigators have all significantly outpaced inflationary changes as measured by CPI (see Appendix E for more information on HEPI). University researchers are increasingly expected to collaborate across disciplines, across sectors and around the world. While technology helps to minimize additional partnering costs, the rise in multidisciplinary, collaborative and intersectoral activities is generating new research costs.
Association of Universities and Colleges of Canada | 33
Given these growing costs, countries wanting to compete internationally continue to grow their investments in R&D. Consequently, countries throughout the OECD have set ambitious growth targets for R&D investments. For instance, the United Kingdom and the European Union have established targets of 2.5 percent by 2014 and three percent by 2010 respectively. While Canada does not have a formal GERD to GDP target as part of its 2007 federal S&T strategy, AUCC’s forthcoming Momentum publication (October 2008) will highlight that governments and other sectors are looking to universities more and more to enhance Canada’s national R&D capacity and international research competitiveness. Significant investments in university-based research will be required not only to keep pace with increased investments by key competitor countries, but also to train the researchers required in other sectors to build this research capacity. The global competition for faculty, students and researchers is certain to escalate in this emerging environment. That competition is also certain to drive cost increases on university campuses in Canada.
Innovation strategies at all levels of government are likely to drive demand for university research over the next decade. Although encouraging investment in private sector R&D was a major focal point of the federal S&T strategy,26 the government also made commitments that will impact longer-term federal investments in university-based R&D. In the strategy, the government stated its commitment to ensure that the postsecondary research environment be globally competitive. The strategy strikes a careful balance between providing long-term investments in basic research across all disciplines and gaining competitive advantages in four priority areas: natural resources, information and communications technologies, health and related life sciences and technologies and environmental sciences and technologies. The federal government earmarked a significant share of new spending to R&D initiatives in its in 2007 and 2008 budgets for these areas.
Provincial governments have also made significant new investments in innovation and R&D. Provincial investments have frequently complemented the federal government’s approaches, though some elements in provincial strategies address unique regional opportunities and challenges. The provinces have assumed a greater role in funding research over the past decade. Their strategies indicate that they recognize universities as an important component of innovation and as a central pillar of growth and prosperity.
Several provinces have made longer term commitments to further investment increases. For example, Alberta and Quebec have established aggressive R&D spending targets.27 Most strategies outline criteria for defining strategic priorities or specific areas in which to achieve research excellence, as well as the need to develop highly skilled personnel. As with the 2007 federal S&T strategy, there is also strong emphasis on better linkages between university researchers and the intended users of research results, predominantly in industry.28 The transfer of ideas from the laboratory bench to the marketplace is particularly emphasized in the industry-rich provinces such as Alberta, Quebec and Ontario. Conversely, in Atlantic Canada, where there is a smaller private sector presence, fewer resources and less critical mass, the focus is on leveraging the region’s university R&D strengths in order to compete in the global knowledge-based economy.29
Competitive global pressures are also likely to drive R&D investment decisions in Canada over the coming decade. University R&D is seen as a contributing element to national prosperity in the innovation strategies of key competitor countries.
34 | Trends in higher education | Volume 3. Finance
For example, Backing Australia’s Ability,30 an innovation policy launched in 2001, bears a striking resemblance to Canada’s 2007 federal S&T strategy. Over the next 10 years, the Australian policy commits to three key elements in the innovation process: generating ideas and undertaking research; accelerating commercialization of ideas; and developing and retaining skills. Key objectives include stimulating increased business investment in R&D and building a competitive R&D advantage for the country. The innovation policy includes increased funding for university research and training as well as a commitment to maintain the doubling of funding for research excellence through the Australian Research Council’s National Competitive Grants programme. The policy also promotes support for large-scale collaborative research that reflects national research priorities: research infrastructure, tax incentives for R&D investment, assistance for commercialization and overhead costs for medical research institutes. Since 2001, the Australian government has invested $8.3 billion AUD (equivalent to $7.8 billion CAD) in the initiatives outlined in Backing Australia’s Ability.
In 2000, the European Union launched the “Lisbon Strategy,” an initiative to make the EU the most competitive, knowledge-based economy in the world by creating a European Research Area (ERA). The ERA is intended to replace informal cooperation among countries with integrated, cross-border and multidisciplinary research programs to achieve more critical mass, sustainable, long-term growth and competitiveness across member countries. University R&D is a central plank of this effort given universities’ widely recognized role in knowledge creation and dissemination, and as an important training ground for researchers. Fuelling the ERA’s development is the Seventh Framework programme (FP7), which from 2007 to 2013, will disburse €50.5 billion ($81.2 billion CAD), a 40 percent increase over the amount available under FP6.31
In the U.K., the Science & Innovation Investment Framework 2004-2014 focuses on increasing business R&D and proposes strengthening linkages across sectors and focusing more on knowledge transfer and the commercialization of university research. In addition, the government has committed significant new resources to create a more sustainable research funding environment for universities and public laboratories. The new funding framework emphasizes the importance of world-class centres of research excellence; the development of skilled scientists, engineers and technologists; and, robust financial management to meet the full economic costs of research (see Appendix B). The government has committed to funding significant growth in investments in the public science base, including universities, in order to supply the skills and research required by the economy. The framework sets a goal to increase public science investments at least in line with the growth rate of the economy over the 10-year period.
The United States, which ranks first internationally in terms of overall investments in research activities32 and research output,33 recently articulated a long-term vision to maintain and strengthen its innovation capacities. The American Competitiveness Initiative (ACI), launched in 2006, emphasizes the centrality of research to the country’s competitiveness, particularly in terms of cutting-edge basic research performed primarily in universities. The first priority of the ACI is to double the amount of funding for innovation-enabling, fundamental research supported by physical science and engineering agencies over 10 years. The ACI and two major reports34 led to the passing of the America Creating Opportunities to Meaningfully Promote Excellence in Technology, Education, and Science (COMPETES) Act in August 2007, which focuses on three key areas: increasing research investments; strengthening learning, teaching and research opportunities in science, technology, engineering and math throughout the education system; and developing an innovation infrastructure. This legislation underscores broad-based support for the ACI recommendations to enhance research and education in the U.S.
Association of Universities and Colleges of Canada | 35
The innovation strategies developed by emerging countries such as Brazil, Russia, India and China (commonly referred to as the BRIC countries) have also clearly identified the role of university R&D in achieving greater economic and social prosperity. In particular, China and India are building their respective knowledge bases through enhanced investments in their higher education institutions as they shift their focus from labour-intensive exports to capital-intensive exports and higher value-added goods and services.35
In 2006, China declared its plan to build 30 new science cities and raise its annual research spending to more than $100 billion USD by 2020, at which point 60 percent of the country’s economic growth is expected to be based on S&T. Meanwhile, over the past decade, a select group of Chinese higher education institutions36 have received significant support from the Chinese government to develop new cutting-edge research centres, improve facilities, enhance commercialization activities, reform administration and management and enhance international recruitment and networking opportunities.37
India’s S&T policy, launched in 2003, also emphasizes fostering scientific research in universities and other academic, scientific and engineering institutions by strengthening or restructuring funding for basic research in science, medicine and engineering and upgrading university infrastructure.38 A five-fold increase in the country’s education budget under India’s five-year plan (2007-12) will include a number of initiatives to enhance science education and research.39
The more competitive international R&D environment will indeed drive demands to expand Canada’s national R&D efforts, including investments in universities. Other key drivers of change in the levels of financing required by universities are the expectations of the federal and provincial governments, and a growing societal reliance on universities to meet a wide array of needs. Universities face not only growing demand for their services but also increasingly explicit expectations in all regions
of the country that they will both provide high quality services and nurture their respective teaching and research niches. In this context, the importance of institutional planning and public accountability becomes more critical than ever before.
Cost pressures
Global competition is driving up the cost of attracting and retaining the best and brightest faculty. Since 1999, salary increases for faculty have grown at more than twice the annual inflation rate, reflecting both pressures for faculty salaries – the “catch-up” for the economic slowdown that occurred in much of the 1990s – and increased demand for faculty arising from enrolment and research expansion.
The salaries required to hire new faculty have grown at an even faster pace than those of continuing faculty. The resurgence in salary competition for new faculty is a clear indicator that universities are facing stiffer competition for highly qualified personnel than was the case in the late 1990s. The introduction of special programs such as the Canada Research Chairs program and various provincial research or excellence chairs, has focused even more attention on the “best and the brightest,” thus contributing to increased compensation pressures for universities.
Furthermore, the competition for highly qualified personnel is growing among other sectors in Canada. The 2006 Census revealed that between 2001 and 2006 the number of adults aged 25 to 64 who held a PhD increased by 30 percent. In 2006, employment of PhD graduates aged 25 to 64 also rose to record levels, filling more than 122,000 full- and part-time positions throughout the Canadian economy. This represented a 30 percent increase since the previous Census in 2001. Half of the PhD holders were working in social services, government and educational occupations, a 28 percent increase from 2001. There were 22,000 doctoral graduates working in the natural sciences, 13,000 in health occupations and 12,000 in management occupations. Demand for PhDs in health occupations
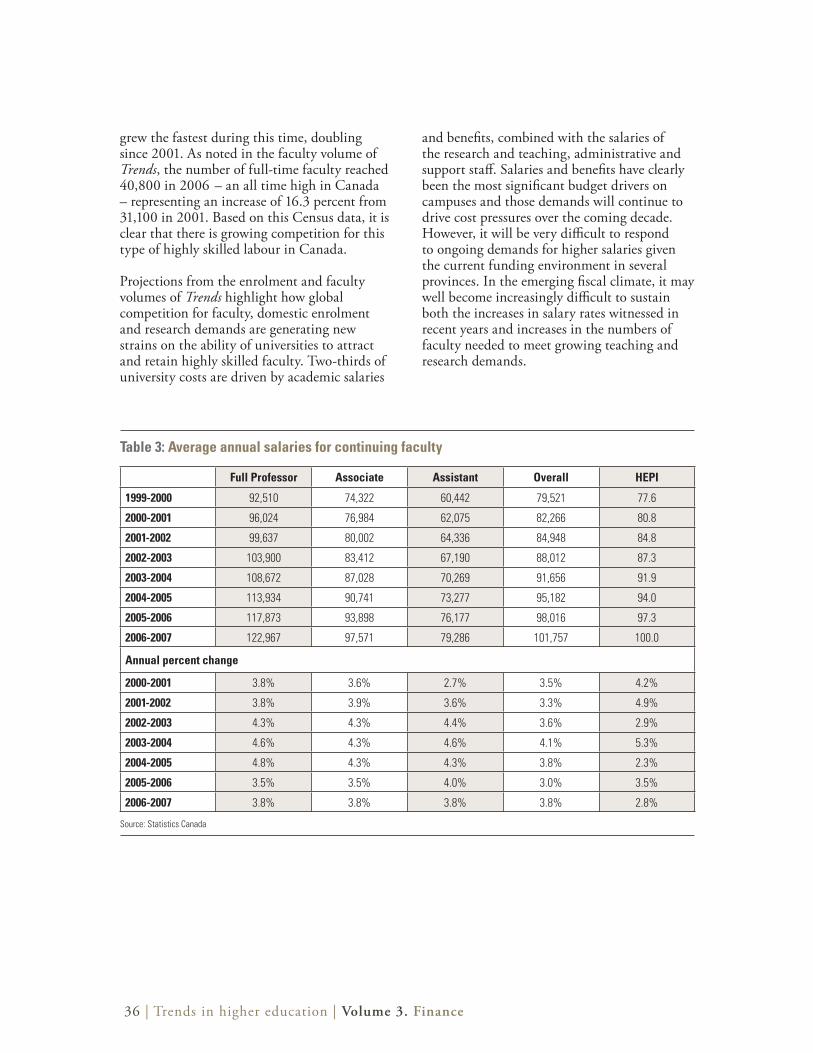
36 | Trends in higher education | Volume 3. Finance
grew the fastest during this time, doubling since 2001. As noted in the faculty volume of Trends, the number of full-time faculty reached 40,800 in 2006 – an all time high in Canada – representing an increase of 16.3 percent from 31,100 in 2001. Based on this Census data, it is clear that there is growing competition for this type of highly skilled labour in Canada.
Projections from the enrolment and faculty volumes of Trends highlight how global competition for faculty, domestic enrolment and research demands are generating new strains on the ability of universities to attract and retain highly skilled faculty. Two-thirds of university costs are driven by academic salaries
and benefits, combined with the salaries of the research and teaching, administrative and support staff. Salaries and benefits have clearly been the most significant budget drivers on campuses and those demands will continue to drive cost pressures over the coming decade. However, it will be very difficult to respond to ongoing demands for higher salaries given the current funding environment in several provinces. In the emerging fiscal climate, it may well become increasingly difficult to sustain both the increases in salary rates witnessed in recent years and increases in the numbers of faculty needed to meet growing teaching and research demands.
Table 3: Average annual salaries for continuing faculty
Full Professor Associate Assistant Overall HEPI
1999-2000 92,510 74,322 60,442 79,521 77.6
2000-2001 96,024 76,984 62,075 82,266 80.8
2001-2002 99,637 80,002 64,336 84,948 84.8
2002-2003 103,900 83,412 67,190 88,012 87.3
2003-2004 108,672 87,028 70,269 91,656 91.9
2004-2005 113,934 90,741 73,277 95,182 94.0
2005-2006 117,873 93,898 76,177 98,016 97.3
2006-2007 122,967 97,571 79,286 101,757 100.0
Annual percent change
2000-2001 3.8% 3.6% 2.7% 3.5% 4.2%
2001-2002 3.8% 3.9% 3.6% 3.3% 4.9%
2002-2003 4.3% 4.3% 4.4% 3.6% 2.9%
2003-2004 4.6% 4.3% 4.6% 4.1% 5.3%
2004-2005 4.8% 4.3% 4.3% 3.8% 2.3%
2005-2006 3.5% 3.5% 4.0% 3.0% 3.5%
2006-2007 3.8% 3.8% 3.8% 3.8% 2.8%
Source: Statistics Canada
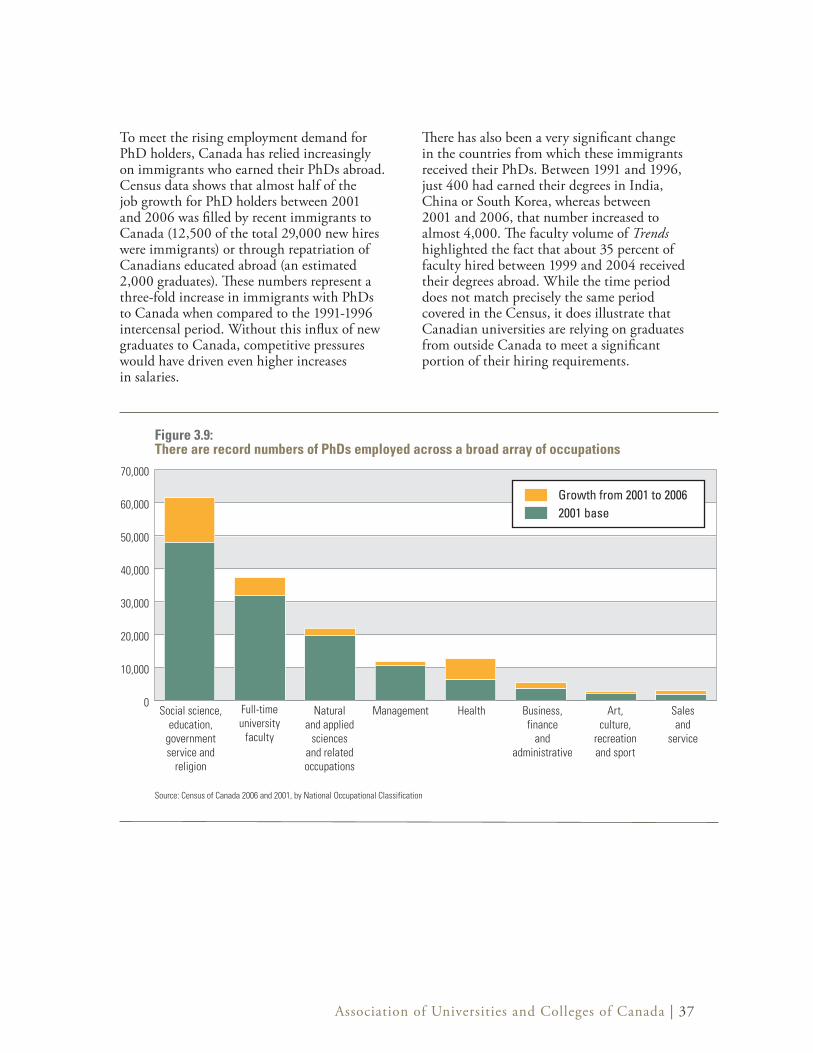
Association of Universities and Colleges of Canada | 37
To meet the rising employment demand for PhD holders, Canada has relied increasingly on immigrants who earned their PhDs abroad. Census data shows that almost half of the job growth for PhD holders between 2001 and 2006 was filled by recent immigrants to Canada (12,500 of the total 29,000 new hires were immigrants) or through repatriation of Canadians educated abroad (an estimated 2,000 graduates). These numbers represent a three-fold increase in immigrants with PhDs to Canada when compared to the 1991-1996 intercensal period. Without this influx of new graduates to Canada, competitive pressures would have driven even higher increases in salaries.
There has also been a very significant change in the countries from which these immigrants received their PhDs. Between 1991 and 1996, just 400 had earned their degrees in India, China or South Korea, whereas between 2001 and 2006, that number increased to almost 4,000. The faculty volume of Trends highlighted the fact that about 35 percent of faculty hired between 1999 and 2004 received their degrees abroad. While the time period does not match precisely the same period covered in the Census, it does illustrate that Canadian universities are relying on graduates from outside Canada to meet a significant portion of their hiring requirements.
Figure 3.9:There are record numbers of PhDs employed across a broad array of occupations
0
10,000
20,000
30,000
40,000
50,000
60,000
70,000
Social science,education,
governmentservice and
religion
Full-timeuniversity
faculty
Management Health Business,finance
andadministrative
Art,culture,
recreationand sport
Salesand
service
Naturaland applied
sciencesand relatedoccupations
Growth from 2001 to 20062001 base
Source: Census of Canada 2006 and 2001, by National Occupational Classification

38 | Trends in higher education | Volume 3. Finance
Figure 3.10:Between 2001 and 2006, almost 16,000 PhD holders between the ages of 25 and 64 immigrated to Canada
Europe
Africa
Central,South America,the Caribbeanand Bermuda
United Statesof America
Asia (including the Middle East)
Oceaniaand Other
CANADA
90 (1%)
7,690 (49%)
1,010 (7%)
755 (5%)
1,785 (11%)
4,245 (27%)
Source: Statistics Canada, 2006 Census.Notes:1. “Oceania and other” – “other” includes Greenland, Saint Pierre and Miquelon, the category “Other country.” 2. Recent immigrants refer to those who arrived in Canada between January 1, 2001 and Census Day, May 16, 2005.
PhD – Top five places of birth
People’s Republic of China – 3,070
India – 1,200
United States of America – 1,010
Iran – 910
Russian Federation – 780
Moreover, the Census revealed that the number of recent immigrants who stayed in Canada after earning their degrees here was significantly smaller between 2001 and 2006 than in early intercensal periods. These declines have taken place despite strong increases in the number of foreign students who are enrolled in and completing doctoral programs in Canada during the last decade. Thus, while Canadian universities are attracting more foreign students to enrol in PhD programs than ever before, a smaller number of graduates are choosing to remain in Canada than a decade ago. This provides evidence of the growing global demand for PhDs and also indicates that
foreign graduates from Canadian universities are now more likely to take their skills abroad at the very time when it is clear from our immigration trends that there is a high demand here in Canada. Foreign students who have graduated from doctoral programs in Canada are an important pool of candidates for faculty positions at Canadian universities and for employment in other sectors in Canada. As we lose proportionately more graduates than in past years, this narrows the pool within Canada from which universities (and other domestic sectors) seek to attract new employees, thereby increasing the cost of attracting candidates from abroad.
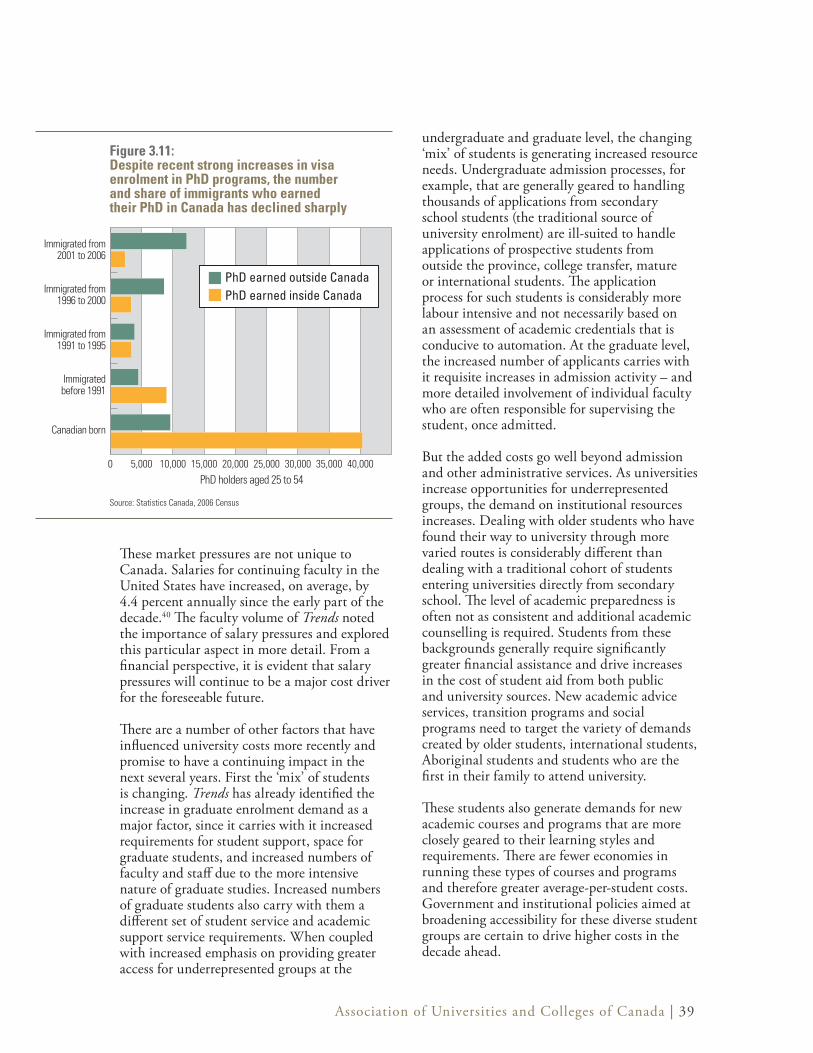
Association of Universities and Colleges of Canada | 39
These market pressures are not unique to Canada. Salaries for continuing faculty in the United States have increased, on average, by 4.4 percent annually since the early part of the decade.40 The faculty volume of Trends noted the importance of salary pressures and explored this particular aspect in more detail. From a financial perspective, it is evident that salary pressures will continue to be a major cost driver for the foreseeable future.
There are a number of other factors that have influenced university costs more recently and promise to have a continuing impact in the next several years. First the ‘mix’ of students is changing. Trends has already identified the increase in graduate enrolment demand as a major factor, since it carries with it increased requirements for student support, space for graduate students, and increased numbers of faculty and staff due to the more intensive nature of graduate studies. Increased numbers of graduate students also carry with them a different set of student service and academic support service requirements. When coupled with increased emphasis on providing greater access for underrepresented groups at the
undergraduate and graduate level, the changing ‘mix’ of students is generating increased resource needs. Undergraduate admission processes, for example, that are generally geared to handling thousands of applications from secondary school students (the traditional source of university enrolment) are ill-suited to handle applications of prospective students from outside the province, college transfer, mature or international students. The application process for such students is considerably more labour intensive and not necessarily based on an assessment of academic credentials that is conducive to automation. At the graduate level, the increased number of applicants carries with it requisite increases in admission activity – and more detailed involvement of individual faculty who are often responsible for supervising the student, once admitted.
But the added costs go well beyond admission and other administrative services. As universities increase opportunities for underrepresented groups, the demand on institutional resources increases. Dealing with older students who have found their way to university through more varied routes is considerably different than dealing with a traditional cohort of students entering universities directly from secondary school. The level of academic preparedness is often not as consistent and additional academic counselling is required. Students from these backgrounds generally require significantly greater financial assistance and drive increases in the cost of student aid from both public and university sources. New academic advice services, transition programs and social programs need to target the variety of demands created by older students, international students, Aboriginal students and students who are the first in their family to attend university.
These students also generate demands for new academic courses and programs that are more closely geared to their learning styles and requirements. There are fewer economies in running these types of courses and programs and therefore greater average-per-student costs. Government and institutional policies aimed at broadening accessibility for these diverse student groups are certain to drive higher costs in the decade ahead.
Figure 3.11:Despite recent strong increases in visa enrolment in PhD programs, the number and share of immigrants who earned their PhD in Canada has declined sharply
Source: Statistics Canada, 2006 Census
Immigrated from2001 to 2006
Immigrated from1996 to 2000
Immigrated from1991 to 1995
Immigratedbefore 1991
Canadian born
0 5,000 10,000 15,000 20,000 25,000 30,000 35,000 40,000
PhD earned outside Canada PhD earned inside Canada
PhD holders aged 25 to 54
40 | Trends in higher education | Volume 3. Finance
The long-term decline in per student operating funding identified in the previous section (see Figure 3.8) has created another problem for the state of physical infrastructure on university campuses today. Many universities have had little choice but to delay different types of maintenance costs. The growth in student and research demands resulted in additional delays in responding to repairs and upkeep of physical infrastructure. In 2000-01, the Canadian Association of University Business Officers (CAUBO) undertook the first Canada-wide study of the state of university infrastructure, estimating that the accumulated deferred maintenance (ADM) incurred nationally by universities amounted to approximately $3.6 billion. As universities invested heavily in the expansion of their facilities over the last seven years, some problems were addressed through major renovations, but other maintenance problems were further delayed due to urgent expansion needs.
In 2006, the Association of Atlantic Universities (AAU) released a report that estimated that ADM costs in the region had grown to $863 million.41 The Council of Ontario Universities (COU) conducted a full audit in 2006 of the physical infrastructure on Ontario campuses and found that they now have a larger ADM problem than in 2001. Increased enrolment and research activity have major implications for physical facilities. The COU reported that over $9 billion in new construction is required by 2021-22 to address “growth” and existing shortfalls in space in Ontario alone. Additionally, COU identified $1.6 billion in deferred maintenance of the existing physical infrastructure.42 Other universities across Canada are in the midst of similar reviews and audits of their facilities.
Financing new construction and facilities renewal has taken on added significance because governments have altered their financing practices resulting in a considerable increase in universities’ debt servicing costs, which are now encroaching on operating funds that, in the past, would have been available for teaching and research.
The increase in debt servicing of academic buildings is the result of government practices to leverage as much private sector funding as possible in support of university construction. Over the past several years, both federal and provincial capital investments have generally provided only a portion of the required cost on the understanding (and sometimes written requirement) that universities provide the remainder from their own funds – often through private giving.
On the one hand, that development is an evolution of past practice where government seldom funded the entire cost of a construction project but was often the major contributor. On the other hand, the volume of additional construction required to meet teaching and research expansion has significantly increased demands on private fundraising. Despite an overall increase in private giving (and substantial investments in expanding the capacity of universities to generate more private giving), many universities were unable to meet fundraising targets and had to service the capital debt from operating funds. Since 1999, “interest payments” from the operating fund have mushroomed from about $25 million annually to over $100 million – and aggregate interest costs (across all funds) have risen from $200 million to $500 million. In Ontario, interest payments increased ten-fold, from about $5 million annually to over $50 million by 2005-06. These are long-term commitments – essentially mortgages – that eat into monies that, not too long ago, were devoted solely to operational expenses.
The greater reliance on private giving to finance capital expansion is but part of the story regarding changes in government financing. For example, from the mid-1990s and onwards, the Ontario government took a similar approach to “leverage” private giving in relation to institutional student assistance. That government policy provided partial funding to cover the cost of newly mandated forms of institutional student aid. The government matched the endowment revenues that universities attracted from private donations for student aid. Donor fatigue is now part of the university fundraising lexicon.43
Insufficient funding has been demonstrated to affect the quality of the learning experience and capacity of institutions to provide opportunities for prospective students.
Photo: The University of Winnipeg

42 | Trends in higher education | Volume 3. Finance
Conclusion Over the course of the last decade, provincial governments have significantly increased their overall operating and special purpose funding of universities and both federal and provincial governments have significantly increased their investments in university-based research. These investments have helped universities respond to rising domestic expectations in relation to higher education, research and knowledge transfer as well as to global competitive pressures to attract, support and retain highly qualified students, faculty and researchers.
Nevertheless, universities still have considerably fewer resources in per student terms than they had in the 1980s and most of the 1990s to support teaching, learning and research costs not covered by external sponsors. Recent increases in operating and special purpose and trust revenues from government, tuition and other sources, when adjusted for inflation and enrolment growth, have begun to reverse the long-term decline in the monies available on a per student basis for teaching and research costs not covered by external sponsors. However, at $15,000 in 2006-07, these per student monies were only marginally higher ($500) than in 2001-02, $6,000 less than at the beginning of the 1980s, and $2,000 less than at the beginning of the 1990s. This situation undermines the capacity of institutions to make the kinds of changes to the learning environment – changes that would enhance the level of student engagement and the amount of student-faculty interaction – that are so critical to improving the quality of the educational experience.
In addition to supporting a 42 percent increase in full-time enrolment between 1996-97 and 2006-07, universities also dramatically increased the amount of research that they conducted for external sponsors. It is important to recognize that universities need to draw on their other resources to support these sponsored research projects because external sponsors generally do not cover either the
time of the researchers or the full institutional costs associated with these projects. These research investments do, however, contribute to a research-enriched learning environment that is a distinguishing element of a university education. There are also clear public benefits from conducting research and teaching together. Economies of scope arise because it is less expensive to conduct teaching and research together than to undertake each activity separately. On average, universities use an estimated 20 percent of their general operating, special purpose and trust funds to support the unsponsored costs of university research activities.
This volume of Trends has focused considerable attention on the revenues that universities have to support teaching and research. It is important to recognize that some university revenues support activities that are not directly related to teaching or research. When making comparisons, it important to exclude revenues that flow to support activities that do not support teaching and research. When combined, revenues that flow through the universities to cover scholarships and bursaries, health care services, sales of goods and services, and non-credit and other student fees account for 21 percent of all general operating and special purpose resources. Together, these types of revenues grew from $940 million in 1996-97 to $3.5 billion a decade later, adding $2.6 billion to the gross revenues of universities without contributing to their ability to teach more students in credit courses or to conduct more research. Some of these revenues did not even cover all of their associated costs and had to be cross-subsidized from teaching and research resources.
With regard to comparative funding trends in the U.S., the U.K., Australia and Canada, this volume has stressed that the support mechanisms for teaching and research are interconnected and intertwined. This intertwining is an indicator of both the
Association of Universities and Colleges of Canada | 43
overlapping nature of teaching and research, and the shared desire in the four countries to support quality teaching and research to meet labour market demands, drive productivity and stimulate economic growth. The different mechanisms used to fund university-based research in the four countries make it difficult to disentangle funding for teaching and research in ways that would allow for cross-national comparisons of funding trends in relation to these two core university missions. Consequently, given these complexities and the economies of scope between teaching and research, the international comparisons in this volume of Trends focus on trends in the combined levels of funding for teaching and research (sponsored and unsponsored).
It is clear that public four-year universities
and colleges in the U.S. have significantly more resources to fund research and teaching activities than their counterparts in the other three countries. Compared to their Canadian counterparts, universities in the U.S. had $8,000 CAD more revenues per student in 2006-07. Moreover, the gap in funding has grown over the last 30 years. At the beginning of the 1980s, Canadian universities actually had a $2,000 per student funding advantage compared to their U.S. public peers – with $25,000 per student to support teaching and research activities in Canada versus $23,000 in the U.S. However, that advantage eroded quickly over the first half of the 1980s. Since the beginning of the 1990s, the funding advantage of four-year public universities and colleges in the U.S. has grown steadily. American universities now have $29,000 CAD per student versus just less than $21,000 CAD among Canadian universities.
In the U.K., during the period 1994-95 to 2006-07 (the only period for which comparable data is available), per student funding grew from $17,000 CAD to $20,600 CAD. Based on recent policy changes, per student funding levels are likely to rise further in the next few years and, as a result, U.K. universities will likely continue to close some of the funding gap
with their U.S. public peers and move further ahead of Canadian universities.
In Australia, available data produce somewhat less comparable estimates than in the other countries and likely understate per student spending in Australia in comparison to the other countries examined in this volume. These data suggest that per student funding initially fell from $21,200 CAD in 1996 to $18,800 CAD in 2003 before beginning to recover over the last few years, almost reaching $20,000 CAD in 2006.
Looking ahead, the key drivers of change indicate that there will be ongoing growth in the demand for the education, research and community services provided by universities over the coming decade. Universities are expected to provide more and better quality educational opportunities to a wider array and growing number of students. They are also expected to assist more faculty members to conduct more, and more complex, research and engage in more community service. These demands are emanating not only from students and parents, but also from governments and communities as the university’s role as a catalyst of innovation and as a key contributor to social and economic well-being is increasingly taken as a given in Canadian society, just as it is in many competitor countries.
Universities also face a range of increasing cost pressures resulting from global competition for faculty, the changing mix of students, the need to reach out to non-traditional students, and campus maintenance and renewal challenges. Universities undertake a range of measures to manage costs effectively, including consortia purchasing arrangements, energy conservation and shared programming; and they will need to continue to seek out further mechanisms to control non-salary costs. However, cost containment is only part of the equation as universities seek to meet growing expectations in sustainable ways. As in the comparator countries examined in this volume of Trends, the quest for additional resources will continue to be essential for Canadian universities.

Any initiative to limit tuition increases will translate into funding problems for universities unless there is growth in government operating grants
Photo: The University of Winnipeg

Association of Universities and Colleges of Canada | 45
In 2004-05, the latest year for which detailed data on all revenue sources are available, revenues in four-year public universities and colleges in the U.S. were $193.8 billion USD. For the purposes of analysis in this volume of Trends, close to $71 billion USD, which did not relate to research, teaching and learning, was netted from this total, reducing the total revenues available for research, teaching and learning to $123 billion USD.
While this report does not examine the funding trends in private, not-for-profit four-year universities and colleges in any significant detail, it is critical, given the importance of that sector in the U.S., to provide at least some highlights of that sector. Universities in the U.K., Australia, Canada and public four-year universities and colleges in the U.S. compete with these private universities and colleges for international students and faculty as well as for research funding and recognition. As noted in the earlier volumes of Trends, the competition is heating up, so it is increasingly important to understand the funding situation of the private, not-for-profit universities.
• The private, not-for-profit sector accounts for about 38 percent of FTE students enrolled in all four-year universities and colleges and close to half of students enrolled in graduate or professional programs in the U.S.
• Many of these institutions are in a league of their own when it comes to the funds they have available to support research and teaching. Others have far smaller funding advantages. They are a very diverse group of institutions and trends for the sector do not hold for all institutions within the sector. For example, according to the 2007 Digest of Education Statistics, the doctoral and medical universities in this group of private, not-for-profit four-year universities and colleges had expenditures of close to $70,000 USD per student44 in 2004-05 while per student expenditures were frequently less than $20,000 USD in those private, not-for-profit universities and colleges that primarily grant bachelors and master’s degrees.
• On average, private not-for-profit universities and colleges typically have about 30 percent more revenues per student to support teaching and research than their public sector peers in the U.S. Again, the range is quite wide and the doctoral and medical schools will have far greater competitive funding advantages.
Research Research conducted on public university campuses in the U.S. more than doubled in real terms from $15 billion USD in 1980 to $37 billion USD in 2006. Governments, primarily federal, provided the vast majority of the resources needed to conduct this R&D. Their investments grew from $10 billion USD to $22 billion USD over that period (1980-2006) with the federal government’s contribution accounting for almost 90 percent of those revenues. Universities and colleges allocated an estimated $8 billion USD from their general revenues for R&D activities and investments from private industry, not-for-profit organizations and other sources almost tripled, rising from $2.2 to $6.2 billion USD.
Support for university research in the U.S. is provided through a variety of departments and agencies, the three largest are the National Institutes of Health (NIH), the National Science Foundation (NSF) and the Department of Defence. As shown in Figure 3.12, after slow growth in the early 1990s and stagnation in the mid-1990s, federal support for university R&D doubled between 1997 and 2004. The growth in federal support was driven largely by the NIH whose budget also doubled.
Since 2004, the NIH budget has declined slightly in real terms driven, at least in some measure, by concerns about the size of the budget deficit in the U.S. There is now a perception in Congress that a number of other areas – notably the natural sciences and engineering – have been underfunded. These concerns were articulated at length in the report Rising Above the Gathering Storm, completed in 2005 by the National Academies of Science at the request of Congress.
Appendix A: United States
Photo: The University of Winnipeg
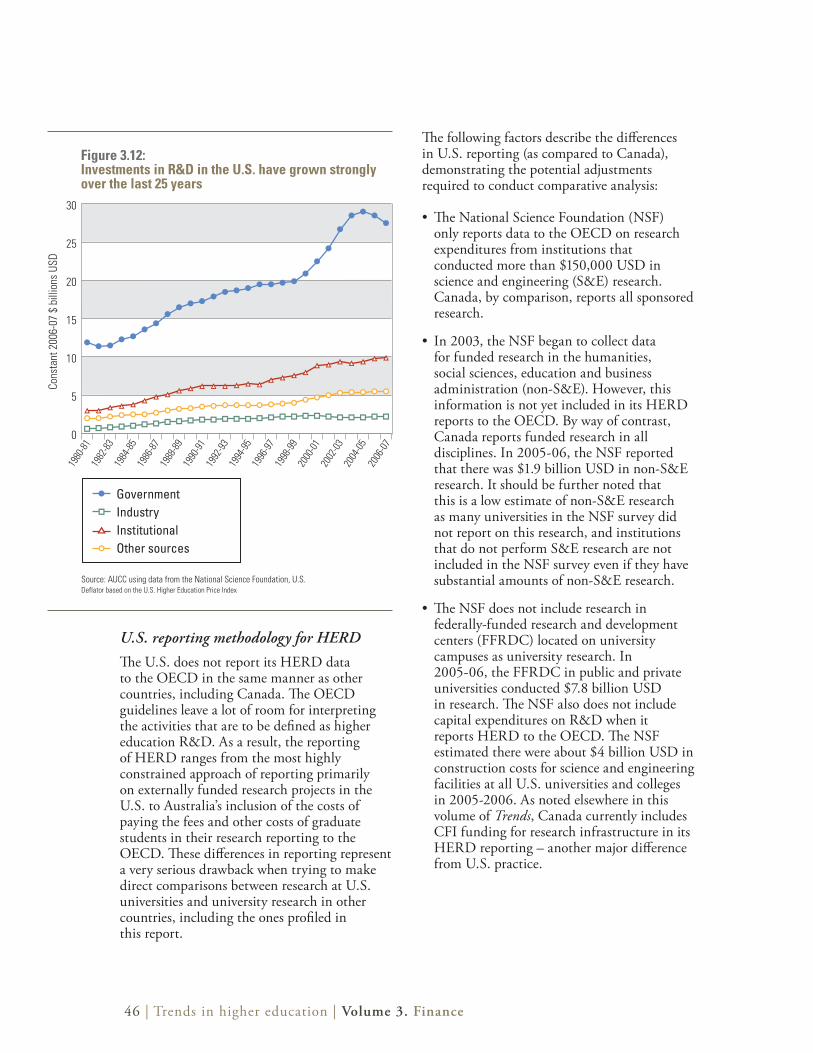
46 | Trends in higher education | Volume 3. Finance
U.S. reporting methodology for HERDThe U.S. does not report its HERD data to the OECD in the same manner as other countries, including Canada. The OECD guidelines leave a lot of room for interpreting the activities that are to be defined as higher education R&D. As a result, the reporting of HERD ranges from the most highly constrained approach of reporting primarily on externally funded research projects in the U.S. to Australia’s inclusion of the costs of paying the fees and other costs of graduate students in their research reporting to the OECD. These differences in reporting represent a very serious drawback when trying to make direct comparisons between research at U.S. universities and university research in other countries, including the ones profiled in this report.
The following factors describe the differences in U.S. reporting (as compared to Canada), demonstrating the potential adjustments required to conduct comparative analysis:
• The National Science Foundation (NSF) only reports data to the OECD on research expenditures from institutions that conducted more than $150,000 USD in science and engineering (S&E) research. Canada, by comparison, reports all sponsored research.
• In 2003, the NSF began to collect data for funded research in the humanities, social sciences, education and business administration (non-S&E). However, this information is not yet included in its HERD reports to the OECD. By way of contrast, Canada reports funded research in all disciplines. In 2005-06, the NSF reported that there was $1.9 billion USD in non-S&E research. It should be further noted that this is a low estimate of non-S&E research as many universities in the NSF survey did not report on this research, and institutions that do not perform S&E research are not included in the NSF survey even if they have substantial amounts of non-S&E research.
• The NSF does not include research in federally-funded research and development centers (FFRDC) located on university campuses as university research. In 2005-06, the FFRDC in public and private universities conducted $7.8 billion USD in research. The NSF also does not include capital expenditures on R&D when it reports HERD to the OECD. The NSF estimated there were about $4 billion USD in construction costs for science and engineering facilities at all U.S. universities and colleges in 2005-2006. As noted elsewhere in this volume of Trends, Canada currently includes CFI funding for research infrastructure in its HERD reporting – another major difference from U.S. practice.
1980
-81
1982
-83
1984
-85
1986
-87
1988
-89
1990
-91
1992
-93
1994
-95
1996
-97
1998
-99
2000
-01
2002
-03
2004
-05
Figure 3.12:Investments in R&D in the U.S. have grown strongly over the last 25 years
Source: AUCC using data from the National Science Foundation, U.S.Deflator based on the U.S. Higher Education Price Index
Government Industry Institutional Other sources
0
5
10
15
20
25
30 Other (including SSH)
Institutional
Industry
Government
2006
-07
Cons
tant
200
6-07
$ b
illio
ns U
SD
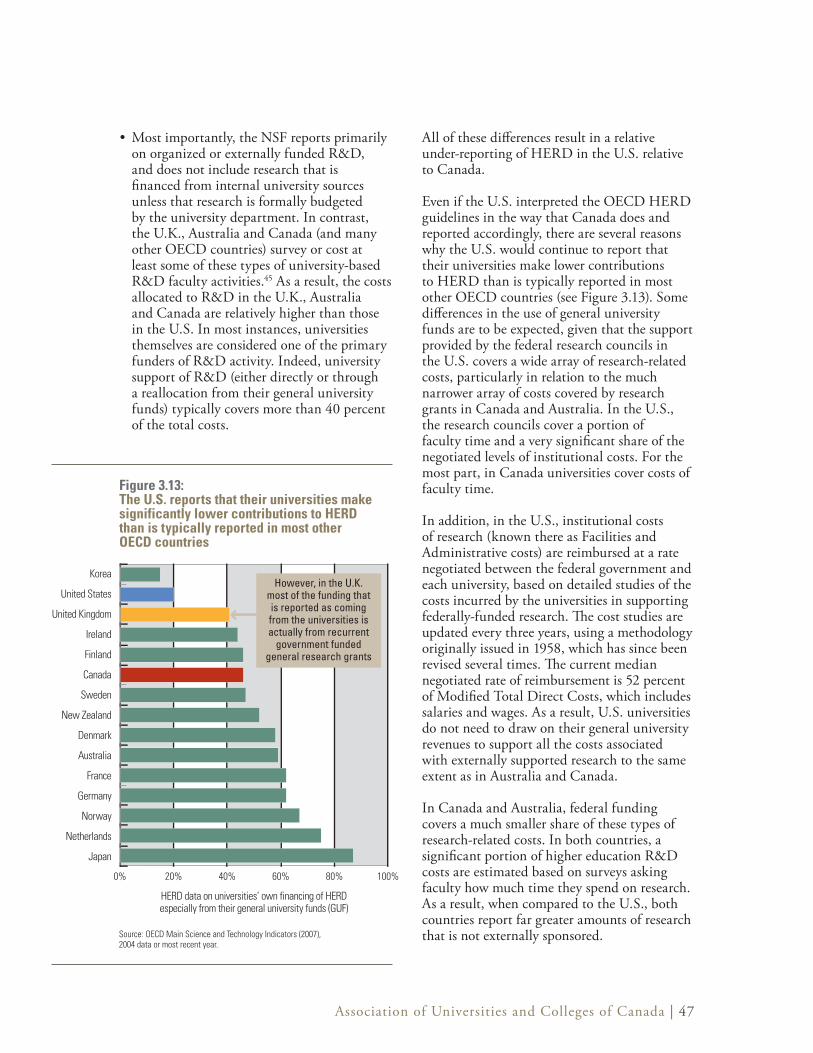
Association of Universities and Colleges of Canada | 47
• Most importantly, the NSF reports primarily on organized or externally funded R&D, and does not include research that is financed from internal university sources unless that research is formally budgeted by the university department. In contrast, the U.K., Australia and Canada (and many other OECD countries) survey or cost at least some of these types of university-based R&D faculty activities.45 As a result, the costs allocated to R&D in the U.K., Australia and Canada are relatively higher than those in the U.S. In most instances, universities themselves are considered one of the primary funders of R&D activity. Indeed, university support of R&D (either directly or through a reallocation from their general university funds) typically covers more than 40 percent of the total costs.
All of these differences result in a relative under-reporting of HERD in the U.S. relative to Canada.
Even if the U.S. interpreted the OECD HERD guidelines in the way that Canada does and reported accordingly, there are several reasons why the U.S. would continue to report that their universities make lower contributions to HERD than is typically reported in most other OECD countries (see Figure 3.13). Some differences in the use of general university funds are to be expected, given that the support provided by the federal research councils in the U.S. covers a wide array of research-related costs, particularly in relation to the much narrower array of costs covered by research grants in Canada and Australia. In the U.S., the research councils cover a portion of faculty time and a very significant share of the negotiated levels of institutional costs. For the most part, in Canada universities cover costs of faculty time.
In addition, in the U.S., institutional costs of research (known there as Facilities and Administrative costs) are reimbursed at a rate negotiated between the federal government and each university, based on detailed studies of the costs incurred by the universities in supporting federally-funded research. The cost studies are updated every three years, using a methodology originally issued in 1958, which has since been revised several times. The current median negotiated rate of reimbursement is 52 percent of Modified Total Direct Costs, which includes salaries and wages. As a result, U.S. universities do not need to draw on their general university revenues to support all the costs associated with externally supported research to the same extent as in Australia and Canada.
In Canada and Australia, federal funding covers a much smaller share of these types of research-related costs. In both countries, a significant portion of higher education R&D costs are estimated based on surveys asking faculty how much time they spend on research. As a result, when compared to the U.S., both countries report far greater amounts of research that is not externally sponsored.
Figure 3.13:The U.S. reports that their universities make significantly lower contributions to HERD than is typically reported in most other OECD countries
Korea
United States
United Kingdom
Ireland
Finland
Canada
Sweden
New Zealand
Denmark
Australia
France
Germany
Norway
Netherlands
Japan
Source: OECD Main Science and Technology Indicators (2007), 2004 data or most recent year.
HERD data on universities’ own financing of HERDespecially from their general university funds (GUF)
0% 20% 40% 60% 80% 100%
However, in the U.K. most of the funding that is reported as coming from the universities is actually from recurrent
government funded general research grants
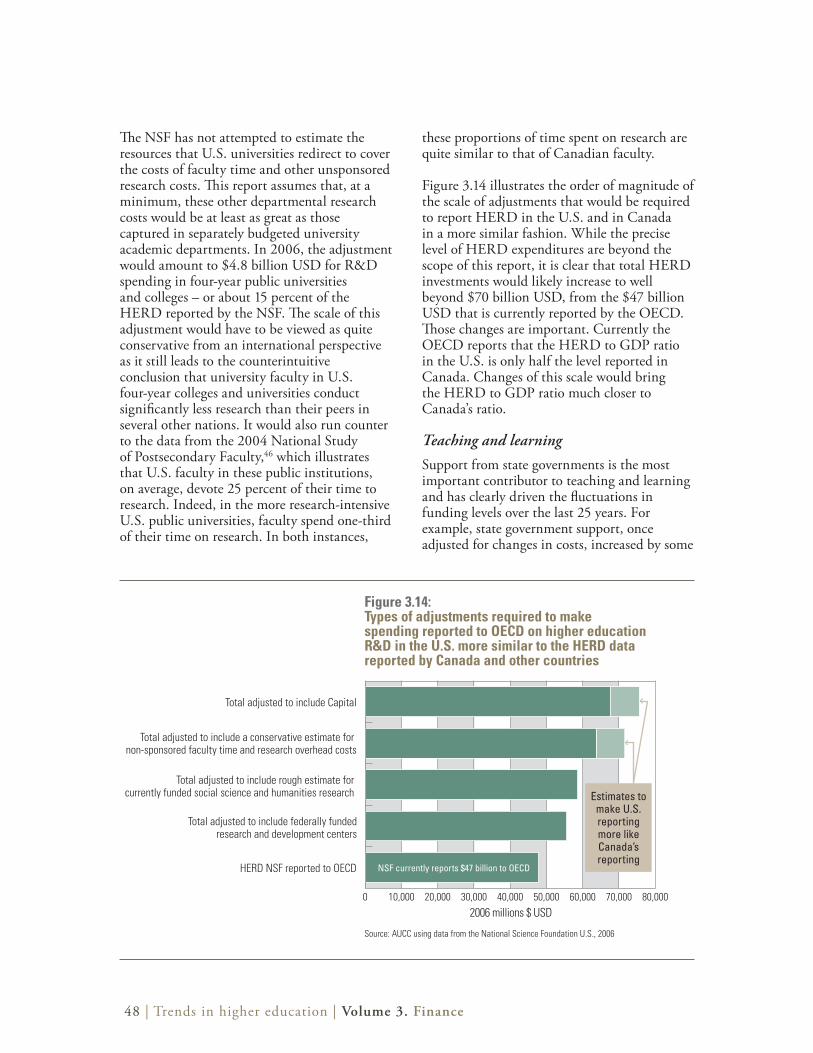
48 | Trends in higher education | Volume 3. Finance
The NSF has not attempted to estimate the resources that U.S. universities redirect to cover the costs of faculty time and other unsponsored research costs. This report assumes that, at a minimum, these other departmental research costs would be at least as great as those captured in separately budgeted university academic departments. In 2006, the adjustment would amount to $4.8 billion USD for R&D spending in four-year public universities and colleges – or about 15 percent of the HERD reported by the NSF. The scale of this adjustment would have to be viewed as quite conservative from an international perspective as it still leads to the counterintuitive conclusion that university faculty in U.S. four-year colleges and universities conduct significantly less research than their peers in several other nations. It would also run counter to the data from the 2004 National Study of Postsecondary Faculty,46 which illustrates that U.S. faculty in these public institutions, on average, devote 25 percent of their time to research. Indeed, in the more research-intensive U.S. public universities, faculty spend one-third of their time on research. In both instances,
these proportions of time spent on research are quite similar to that of Canadian faculty.
Figure 3.14 illustrates the order of magnitude of the scale of adjustments that would be required to report HERD in the U.S. and in Canada in a more similar fashion. While the precise level of HERD expenditures are beyond the scope of this report, it is clear that total HERD investments would likely increase to well beyond $70 billion USD, from the $47 billion USD that is currently reported by the OECD. Those changes are important. Currently the OECD reports that the HERD to GDP ratio in the U.S. is only half the level reported in Canada. Changes of this scale would bring the HERD to GDP ratio much closer to Canada’s ratio.
Teaching and learningSupport from state governments is the most important contributor to teaching and learning and has clearly driven the fluctuations in funding levels over the last 25 years. For example, state government support, once adjusted for changes in costs, increased by some
Figure 3.14:Types of adjustments required to make spending reported to OECD on higher education R&D in the U.S. more similar to the HERD data reported by Canada and other countries
Source: AUCC using data from the National Science Foundation U.S., 2006
0 10,000 20,000 30,000 40,000 50,000 60,000 70,000 80,000
HERD NSF reported to OECD
Total adjusted to include federally funded research and development centers
Total adjusted to include rough estimate for currently funded social science and humanities research
Total adjusted to include a conservative estimate for non-sponsored faculty time and research overhead costs
Total adjusted to include Capital
Estimates to make U.S. reporting more like Canada’s reporting
2006 millions $ USD
NSF currently reports $47 billion to OECD
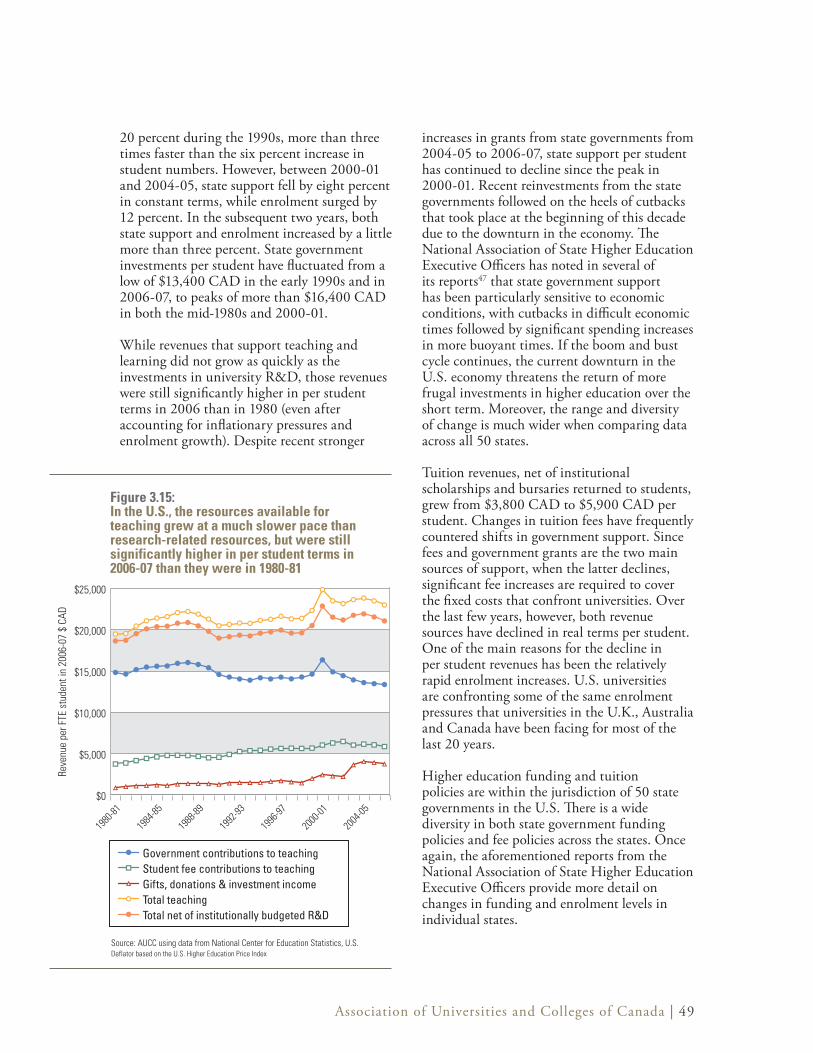
Association of Universities and Colleges of Canada | 49
20 percent during the 1990s, more than three times faster than the six percent increase in student numbers. However, between 2000-01 and 2004-05, state support fell by eight percent in constant terms, while enrolment surged by 12 percent. In the subsequent two years, both state support and enrolment increased by a little more than three percent. State government investments per student have fluctuated from a low of $13,400 CAD in the early 1990s and in 2006-07, to peaks of more than $16,400 CAD in both the mid-1980s and 2000-01.
While revenues that support teaching and learning did not grow as quickly as the investments in university R&D, those revenues were still significantly higher in per student terms in 2006 than in 1980 (even after accounting for inflationary pressures and enrolment growth). Despite recent stronger
Figure 3.15:In the U.S., the resources available for teaching grew at a much slower pace than research-related resources, but were still significantly higher in per student terms in 2006-07 than they were in 1980-81
$0
$5,000
$10,000
$15,000
$20,000
$25,000Total net of institutionally budgetted R&D
Total Teaching
Gifts, donations & investment income
Student fee contributions to teaching
Government contributions to teaching
Reve
nue
per F
TE s
tude
nt in
200
6-07
$ C
AD
Total net of institutionally budgeted R&DTotal TeachingGifts, donations & investment incomeStudent fee contributions to teachingGovernment contributions to teaching
Source: AUCC using data from National Center for Education Statistics, U.S.Deflator based on the U.S. Higher Education Price Index
Total net of institutionally budgeted R&DTotal teachingGifts, donations & investment incomeStudent fee contributions to teachingGovernment contributions to teaching
2004
-05
2000
-01
1996
-97
1992
-93
1988
-89
1984
-85
1980
-81
increases in grants from state governments from 2004-05 to 2006-07, state support per student has continued to decline since the peak in 2000-01. Recent reinvestments from the state governments followed on the heels of cutbacks that took place at the beginning of this decade due to the downturn in the economy. The National Association of State Higher Education Executive Officers has noted in several of its reports47 that state government support has been particularly sensitive to economic conditions, with cutbacks in difficult economic times followed by significant spending increases in more buoyant times. If the boom and bust cycle continues, the current downturn in the U.S. economy threatens the return of more frugal investments in higher education over the short term. Moreover, the range and diversity of change is much wider when comparing data across all 50 states.
Tuition revenues, net of institutional scholarships and bursaries returned to students, grew from $3,800 CAD to $5,900 CAD per student. Changes in tuition fees have frequently countered shifts in government support. Since fees and government grants are the two main sources of support, when the latter declines, significant fee increases are required to cover the fixed costs that confront universities. Over the last few years, however, both revenue sources have declined in real terms per student. One of the main reasons for the decline in per student revenues has been the relatively rapid enrolment increases. U.S. universities are confronting some of the same enrolment pressures that universities in the U.K., Australia and Canada have been facing for most of the last 20 years.
Higher education funding and tuition policies are within the jurisdiction of 50 state governments in the U.S. There is a wide diversity in both state government funding policies and fee policies across the states. Once again, the aforementioned reports from the National Association of State Higher Education Executive Officers provide more detail on changes in funding and enrolment levels in individual states.
50 | Trends in higher education | Volume 3. Finance
In 2006-07, universities in the U.K. had £18.1 billion available to support research and teaching. According to OECD estimates, funding for university research totalled £6.2 billion.
Research Government is the biggest source of funding for university R&D in the U.K, but there are several other important funders of sponsored research. In 2006-07, U.K. governments provided almost £4 billion in funding through two major university research mechanisms. Other government departments and agencies funded an additional £280 million in contractually-based research with universities. Another £290 million came from business enterprises, close to £825 million came from private, not-for-profit charitable organizations and £500 million came from foreign sources (including the EU and the U.S.) to finance targeted research initiatives. The universities also redirected £260 million to support research costs not covered by external funding sources.48
Government funds for university research are provided through a dual support system. Seven research councils provide grants, awarded through peer review, for specific projects and programs. Four Funding Councils provide block grant funding to support other university research costs, including basic research.
In 2006-07, the seven research councils provided £1.8 billion in grants to universities for the costs associated with specific research projects. The councils’ grants cover the direct costs of the research projects, a portion of the institutional costs to support these research projects, and faculty time devoted to these funded research projects. In 2003, the government reviewed the support provided through the councils and determined that the productivity of the U.K. university research base would not be financially sustainable in the longer term unless the government changed the way it was funding research. As a result, the government increased support provided
through the research councils and introduced plans that will cover the full economic costs (FEC) of research grants by 2011-12.
The other component of the dual support system, the four regional Funding Councils49 provide block grant funding to support “blue skies” (basic research), including faculty time,50 institutional costs and research infrastructure (research facilities and equipment). Together, the Funding Councils provided £2.1 billion in block grants in 2006-07. Currently, funding from these block grants also contributes to the universities’ costs related to research council programs and projects. Once the government’s plan to cover the full economic costs on council programs is fully implemented, the support from the block grants can be used to expand funding of blue skies research. For example, in England, the Higher Education Funding Council of England (HEFCE) provides block grant support for research through two programs: the Quality Related (QR) grants totalling £1,317.9 million and a much smaller Capacity Fund. QR funding is allocated selectively according to quality and volume of research in each university. The quality of research is assessed in the Research Assessment Exercise (RAE). The RAE is designed to provide comprehensive information on the quality of U.K. research in every subject area and to provide the funding bodies with a basis to allocate block grants. The RAE is based on a process of external expert reviews in which discipline-based panels assess the quality of research in their own discipline. A number of different measures are used to establish the volume of research activity in departments at higher education institutions, including measures of research-active staff, research assistants and research fellows in each department. The departments with the highest rating (5 and 5*) receive the majority of the funding allocated through the RAE.
Within their QR block grant for research, HEFCE introduced a new separate support element for charities-based research in 2006-07, fulfilling a commitment made by the government in its Science and Innovation
Appendix B: United Kingdom

Association of Universities and Colleges of Canada | 51
Framework 2004-2014. Prior to 2006-07, part of the core QR block grant was determined on the basis of research funded by charitable organizations and businesses. Therefore, while the new separate allocation for charities provided £135 million in 2006-07, only about half that amount is new funding. This new commitment recognizes that charities are an integral part of the research landscape in English higher education and seeks to minimize the strain caused by research grants from the charitable organizations, which only cover a portion of the institutional costs to conduct the research. As the amount of research partially sponsored by charities grew over the last decade, universities struggled to cover the balance of the unfunded costs, particularly in the fields of medicine and science. The increased government support for charities research provided through HEFCE’s QR funding has helped reduce the need for universities to draw on other university revenues to support that research.
It should also be noted that beginning in 2007-08, HEFCE will provide £60 million to universities allocated on the basis of the proportion of research income they receive from industry. Funding will be provided as part of the universities’ block QR research grant. In announcing this increase, the executive director of HEFCE stated “this new element of HEFCE funding will provide platforms and incentives that Higher Education Institutions need to seek commissions from the users of research…”51 The effective institutional cost rate is approximately 30 percent based on £198 million in industry funded research. While it is not all new funding, the separate HEFCE allocations for funding institutional costs of conducting research sponsored by foundations and business is driving a very significant portion of the growth in the QR research block grant – more than £100 million.
One of the major priorities of the new research support mechanisms is to create a more sustainable funding environment. There is growing recognition that if the funding policies are not sustainable they would eventually lead to major financial crises on university campuses, and also a decline in the quality of research, teaching and learning. There is also
a growing expectation that research funding from the councils and other research sponsors will cover the full costs of the research activities they are demanding of universities, thereby eliminating the need to cross-subsidize research costs from general operating revenues. If universities agree to take on research programs that do not cover the full costs of research, universities will be responsible for showing how they will cover those additional costs. It will also be the university’s responsibility to demonstrate that those additional costs will not undermine the sustainability of other research and teaching activities over the longer-term.
Over the last six years, significant changes have been introduced in the government funding mechanisms that support university research. The impetus for these changes resulted from a 2002 government review of the dual support model for funding university research. When the initial study was undertaken, many people involved in the funding of higher education believed that the research council grants combined with the QR block grants provided the universities with enough resources to cover all research-related costs, as well as enough revenue to cross-subsidize some of the teaching and learning costs. However, the study found just the opposite: the two major research programs were not covering all the research-related costs and the universities needed to redirect funding from other sources.
The review concluded that without some changes, the high productivity of the U.K. research base would not be financially sustainable over the longer term. Following an extensive consultation exercise in 2003, the government announced three measures to ensure sustainable funding for university research. First, higher education institutes (HEIs) and their funding partners were asked to adopt the Transparent Approach to Costing (TRAC52) methodology to enable a more accurate estimate of the full economic cost of research and to ensure that this is properly considered in funding decisions. Second, HEIs were asked to recover the full economic costs of their activities and, finally, research councils were asked to increase the proportion of the full economic cost paid to HEIs for research (80 percent of the FEC for applications received

52 | Trends in higher education | Volume 3. Finance
after 1 September 2005). The longer trajectory is to enable councils to provide close to the full economic cost of research undertaken in universities by around 2010. As a result, the U.K. government announced an increase of £120 million in 2005-06 rising to £200 million a year in 2007-08 to enable the councils to fund 80 percent of the full economic costs of research grants, while maintaining the current volume of research council supported research in HEIs.
One major impact of the change to recover the full economic costs of research is that universities will no longer have to redirect as much funding from their QR block grants. Those revenues can then be used to enhance the quality of the research environment – from increasing support for the research facilities,
equipment and support staff to providing more resources for faculty to conduct blue sky research.
In the U.K., the research-related block grants and the more extensive cost coverage provided by the research councils mean that universities do not need to redirect internal resources to cover research costs to the same extent as universities in Australia or Canada. The OECD reports that in the U.K. general university funds cover a significant share of research costs. However, it is clear that these funds come primarily from the government’s research-related block grants. Given that the research block grants in the U.K. are as large as the funding provided by research councils, the U.K. universities that receive the block grants are certainly encouraged to undertake departmentally based research.
Teaching and learningIn the U.K., the main sources of funding for teaching and learning have historically been government grants, government payment of the tuition fees for many domestic students and tuition fees paid by international students. In 2006-07, the four Higher Education Funding Councils provided almost £5.4 billion in teaching and learning support through block grants. In addition, U.K. governments fund several special projects to support initiatives such as expanded access, quality enhancement and Centres for Excellence in Teaching and Learning. Together, these programs provided another £600 million to universities.
In 2006-07, funding from tuition fees (whether paid by students or governments) contributed another £5 billion,53 of which foreign students contributed £1.7 billion. In 1998, the U.K. governments introduced means-tested fees for full-time domestic undergraduate students. The initial undergraduate fee was set at £1,000. However, between 1998-99 and 2005-06, only about one-third of students paid the full fee, about one-third paid partial fees and the remaining third were exempt from paying fees based on their family income. The government provided the universities with the fee revenues for the students who received exemptions and
Figure 3.16:Most sources of research funding have grown strongly in the U.K. over the last decade
Source: AUCC usig data from the Higher Education Statistical Agency, U.K.Deflator based on the U.S. Higher Education Price Index
£0.00
£0.25
£0.50
£0.75
£1.00
£1.25
£1.50
£1.75
£2.00
Other
Industry
Foreign government
Foundations and charities
Government general grants for R&D
Government direct (council support)
2006-07 2005-06 2004-05 2003-04 2002-03 2001-02 2000-01 1999-00 1998-99 1997-98 1996-97 1995-96 1994-95
2006
-07
2005
-06
2004
-05
2003
-04
2002
-03
2001
-02
2000
-01
1999
-00
1998
-99
1997
-98
1996
-97
1995
-96
1994
-95
Other
Industry
Foreign government
Foundations and charities
Government general grants for R&D
Government direct (council support)
Cons
tant
200
6-07
£ b
illio
n
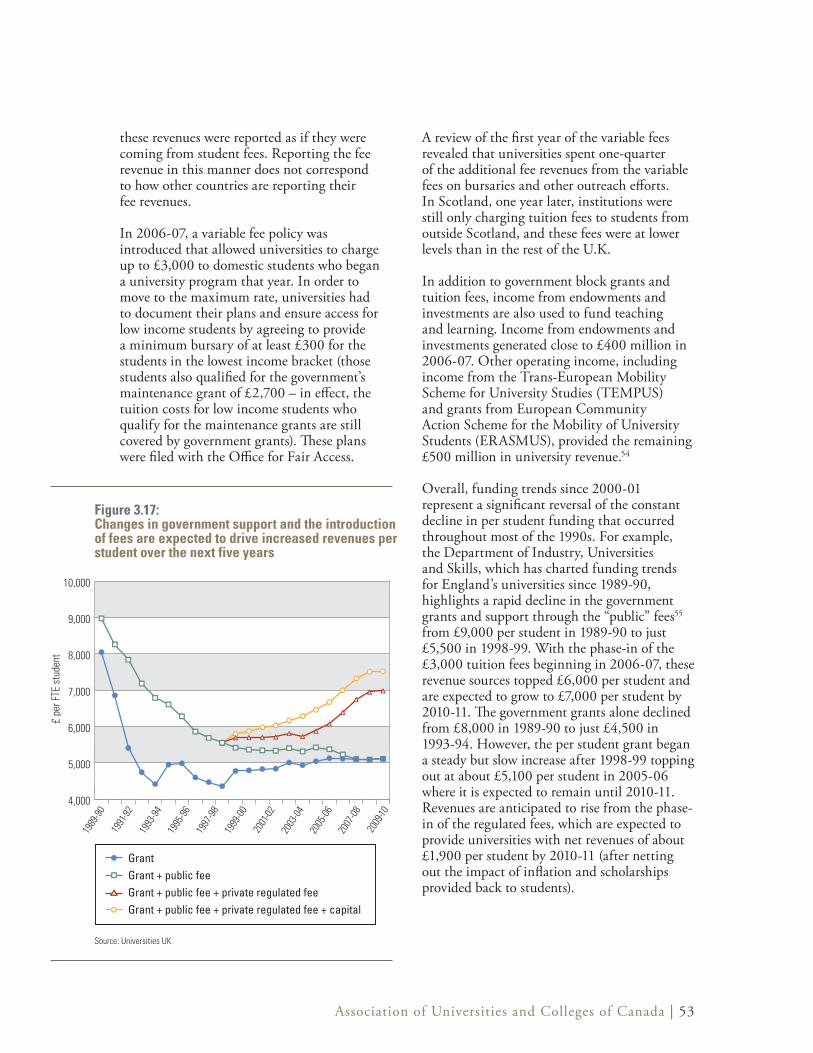
Association of Universities and Colleges of Canada | 53
these revenues were reported as if they were coming from student fees. Reporting the fee revenue in this manner does not correspond to how other countries are reporting their fee revenues.
In 2006-07, a variable fee policy was introduced that allowed universities to charge up to £3,000 to domestic students who began a university program that year. In order to move to the maximum rate, universities had to document their plans and ensure access for low income students by agreeing to provide a minimum bursary of at least £300 for the students in the lowest income bracket (those students also qualified for the government’s maintenance grant of £2,700 – in effect, the tuition costs for low income students who qualify for the maintenance grants are still covered by government grants). These plans were filed with the Office for Fair Access.
A review of the first year of the variable fees revealed that universities spent one-quarter of the additional fee revenues from the variable fees on bursaries and other outreach efforts. In Scotland, one year later, institutions were still only charging tuition fees to students from outside Scotland, and these fees were at lower levels than in the rest of the U.K.
In addition to government block grants and tuition fees, income from endowments and investments are also used to fund teaching and learning. Income from endowments and investments generated close to £400 million in 2006-07. Other operating income, including income from the Trans-European Mobility Scheme for University Studies (TEMPUS) and grants from European Community Action Scheme for the Mobility of University Students (ERASMUS), provided the remaining £500 million in university revenue.54
Overall, funding trends since 2000-01 represent a significant reversal of the constant decline in per student funding that occurred throughout most of the 1990s. For example, the Department of Industry, Universities and Skills, which has charted funding trends for England’s universities since 1989-90, highlights a rapid decline in the government grants and support through the “public” fees55 from £9,000 per student in 1989-90 to just £5,500 in 1998-99. With the phase-in of the £3,000 tuition fees beginning in 2006-07, these revenue sources topped £6,000 per student and are expected to grow to £7,000 per student by 2010-11. The government grants alone declined from £8,000 in 1989-90 to just £4,500 in 1993-94. However, the per student grant began a steady but slow increase after 1998-99 topping out at about £5,100 per student in 2005-06 where it is expected to remain until 2010-11. Revenues are anticipated to rise from the phase-in of the regulated fees, which are expected to provide universities with net revenues of about £1,900 per student by 2010-11 (after netting out the impact of inflation and scholarships provided back to students).
1989
-90
1991
-92
1993
-94
1995
-96
1997
-98
1999
-00
2001
-02
2003
-04
2005
-06
2007
-08
2009
-10
Figure 3.17:Changes in government support and the introduction of fees are expected to drive increased revenues per student over the next five years
Source: Universities UK
GrantGrant + public feeGrant + public fee + private regulated feeGrant + public fee + private regulated fee + capital
4,000
5,000
6,000
7,000
8,000
9,000
10,000grant + public fee + private regulated fee + capital
grant + public fee + private regulated fee
grant + public fee
grant
£ pe
r FTE
stu
dent

54 | Trends in higher education | Volume 3. Finance
One of the drivers behind the decline in per student funding was the very rapid increase in enrolment, and the expectation by government that universities could provide teaching in an increasingly efficient way. Over the course of the 1990s, while full-time enrolment grew by 73 percent, universities were required to reduce their per student costs – so-called efficiency gains. Enrolment growth over the first part of the current decade was encouraged with modest increases in government grant support per student, as well as from new tuition fees. While enrolment is expected to continue to grow in the latter half of the current decade, growth will be supported through additional tuition revenues and stable government funding. These changes are designed to create more sustainable funding levels for teaching.
Recent commitments by the government to increase the teaching grants in line with inflation and enrolment growth reflect the government’s commitment to a model that focuses on longterm financial sustainability, in contrast to the previous era that required a constant reduction in per student spending on the part of the universities. This combination of government and student fees is expected to cover the teaching and learning costs, so when new government programs create additional costs for the universities, these new costs will need to be covered. For example, the U.K government is increasing university funding to cover the additional costs of widening participation to underrepresented student groups, rather than expecting that the universities could create space for and support these new students at a much smaller or marginal cost.
Higher Education Sustainability in the U.K.
An institution is being managed on a sustainable basis if, taking one year with another, it is recovering its full economic costs across its activities as a whole, and is investing in its infrastructure (physical, human and intellectual) at a rate adequate to maintain its future productive capacity appropriate to the needs of its strategic plan and students, sponsors and other customers’ requirements.
Another way to express this is to say that the institution needs to do the activity today in a way which will not threaten its ability to do it in the future.
Source: Joint Costing and Pricing Steering Group, Transparent approach to costing: An overview of TRAC (June 2005)
Association of Universities and Colleges of Canada | 55
In 2006, total university revenues to support teaching and research in Australia were $14.6 billion AUD. Based on estimates from OECD and Universities Australia, total spending on university-based research was $4.5 billion AUD.
Research The Australian Commonwealth government is the largest funder of university R&D in Australia, and in 2006 contributed approximately $1.95 billion AUD ($841 million AUD from the research councils plus $1.085 billion AUD from other commonwealth government departments who fund competitive research programs). Like the U.K., the Australian Commonwealth government provides support for higher education research through a dual funding system comprised of competitive research grants and several performance-based research grants. In addition, both countries have separate programs for research infrastructure.
The two major research granting councils in Australia are the Australian Research Council (ARC) and the National Health and Medical Research Council (NHMRC). In 2006, the research councils provided $841 million AUD to universities to cover the direct costs of specific research projects. However, similar to Canada and unlike the U.K. and the U.S., the institutional costs and the faculty time associated with research projects are not funded by the research councils.
The Australian Commonwealth government supports some of the institutional costs associated with the research councils’ programs through the Research Infrastructure Block Grants (RIBG) program.56 The RIBG is the first of three major components of the performance-based research grants administered by the Department of Education, Science and Training (DEST). In 2006-07, universities received close to $1.1 billion AUD through the three performance-based research grants programs.
Institutional allocations under the RIBG are based on the share of funding each institution receives over the two most recent years from competitive grants (funded primarily by the research councils). In 2006-07, this program provided $204 million AUD to universities to help them cover some of their institutional costs. The current rate of reimbursement is approximately 20 percent of the funds provided through the research councils. The Australian government will provide another $555 million AUD between 2006-07 and 2010-11, to maintain the RIBG support at about 20 percent of Australian competitive research grant income.57
The Research Training Scheme (RTS) is the largest component of the performance-based research block grants. The RTS allocation mechanism is based on an institution’s success in a performance index comprising completions of higher degree by research student weighted by course level and field of study (50 percent), research income (40 percent) and research publications (10 percent). To minimize adverse impacts on higher education institutions, a safety net is applied to ensure that RTS grant amounts do not fall below 95 percent of an institution’s previous year’s RTS grant amount, indexed to current prices. In 2006-07, $552 million AUD was disbursed through this mechanism to help universities cover the costs of research training in master’s and doctoral programs. From the students’ perspective, the RTS provides them with an exemption from tuition fees for the duration of their course, up to a maximum period of four years’ (full-time equivalent) study for a research doctoral program and two years’ (full-time equivalent) study for a research master’s program.
Appendix C: Australia
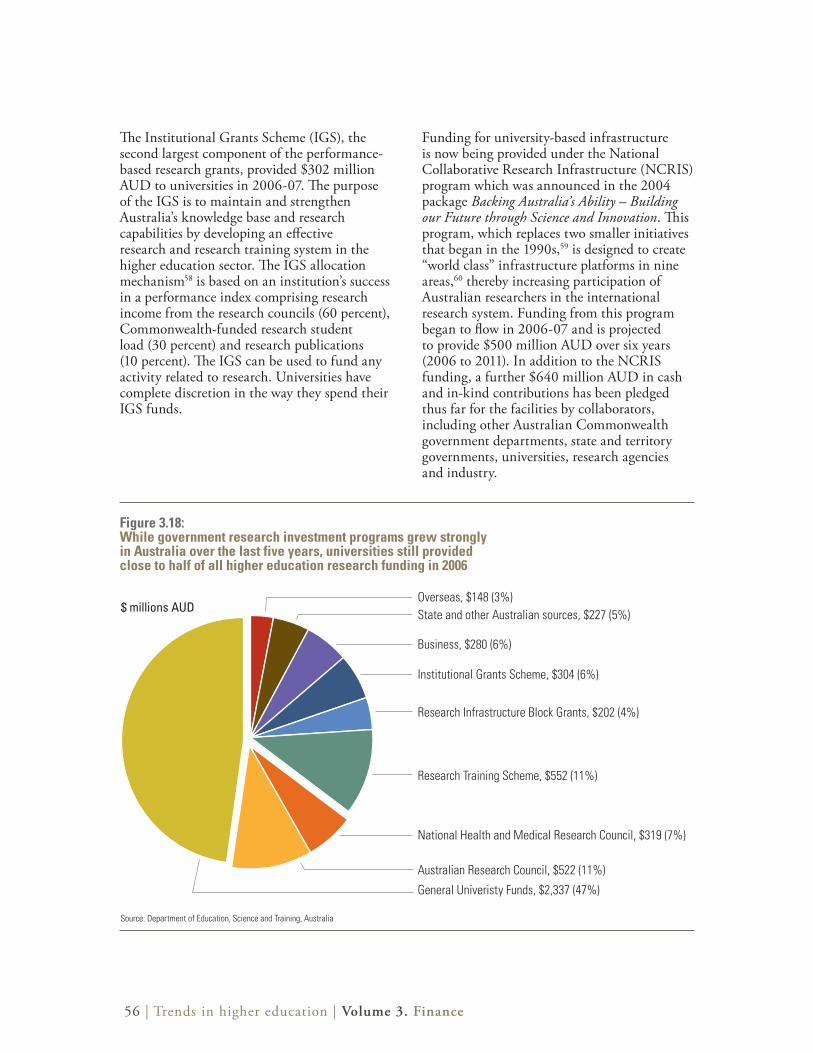
56 | Trends in higher education | Volume 3. Finance
The Institutional Grants Scheme (IGS), the second largest component of the performance-based research grants, provided $302 million AUD to universities in 2006-07. The purpose of the IGS is to maintain and strengthen Australia’s knowledge base and research capabilities by developing an effective research and research training system in the higher education sector. The IGS allocation mechanism58 is based on an institution’s success in a performance index comprising research income from the research councils (60 percent), Commonwealth-funded research student load (30 percent) and research publications (10 percent). The IGS can be used to fund any activity related to research. Universities have complete discretion in the way they spend their IGS funds.
Funding for university-based infrastructure is now being provided under the National Collaborative Research Infrastructure (NCRIS) program which was announced in the 2004 package Backing Australia’s Ability – Building our Future through Science and Innovation. This program, which replaces two smaller initiatives that began in the 1990s,59 is designed to create “world class” infrastructure platforms in nine areas,60 thereby increasing participation of Australian researchers in the international research system. Funding from this program began to flow in 2006-07 and is projected to provide $500 million AUD over six years (2006 to 2011). In addition to the NCRIS funding, a further $640 million AUD in cash and in-kind contributions has been pledged thus far for the facilities by collaborators, including other Australian Commonwealth government departments, state and territory governments, universities, research agencies and industry.
Figure 3.18:While government research investment programs grew strongly in Australia over the last five years, universities still provided close to half of all higher education research funding in 2006
Source: Department of Education, Science and Training, Australia
Overseas, $148 (3%)State and other Australian sources, $227 (5%)
Business, $280 (6%)
Institutional Grants Scheme, $304 (6%)
Research Infrastructure Block Grants, $202 (4%)
Research Training Scheme, $552 (11%)
National Health and Medical Research Council, $319 (7%)
Australian Research Council, $522 (11%)
General Univeristy Funds, $2,337 (47%)
$ millions AUD

Association of Universities and Colleges of Canada | 57
In addition, the Higher Education Endowment Fund (HEEF) was created from government surpluses in 2006-07 and 2007-08 and, supplemented with another $5 billion AUD, was renamed the Education Investment Fund (EIF) in Australia’s latest 2008 budget announcements. The 2008 budget also announced changes in how this fund, now totalling $11 billion AUD, will be allocated. First, vocational education institutions will be given access to the new fund as well as research institutions. Second, under the previous endowment structure, only the interest on the endowment, approximately $300 million AUD annually, could be used to fund new projects.61 The new provisions not only provide more funding for the endowment, but also remove the interest-only spending cap. This latter change should increase both the number and scale of funded infrastructure projects. In some respects, this project is similar to Canada’s CFI initiative. However, unlike CFI, the EIF projects do not require matching funding. Moreover, they also cover some of the direct research costs of the projects in addition to the infrastructure components. These changes will therefore drive some increases in Australia’s higher education R&D investments over the next few years.
Teaching and learningIn 2003, the Australian Commonwealth government released a policy document Our Universities: Backing Australia’s Future, which set out major higher education reforms that encompassed teaching and learning, workplace relations, governance, student financing, research, cross sectoral collaboration and quality matters. Over the first 10 years (2004-05 to 2013-14), the goal of this policy is to provide an additional $11 billion AUD in funding.
In 2005-06, as part of the implementation of the policy reforms, the Australian Commonwealth government replaced its system of funding teaching and learning through block operating grants with an enrolment-based funding model. The Commonwealth Grant Scheme (CGS) provides a fixed amount per discipline towards the cost of an agreed upon number of Commonwealth-supported student places each year for every university. The number of Commonwealth-supported places, in particular disciplines, is negotiated with each institution. In 2006, the universities received $3.8 billion AUD in funding under the CGS.
The Australian Commonwealth government also funds teaching and learning through an array of targeted programs, including funding for quality, equity, collaboration, workplace productivity, the Learning and Teaching Performance Fund, the National Institutes Fund, superannuation and the Capital Development Pool. Combined, these programs provided $920 million AUD in 2006 to support teaching and learning in Australian universities.
Tuition fees from domestic students are the second most important source of revenues for teaching and learning. In 1989, the Australian Commonwealth government created the Higher Education Contribution Scheme (HECS), a tuition fee program under which students could choose to pay a discounted fee at the time they enrolled (a discount of 25 percent), or defer the payment and repay the full fee under an income contingent loans program.

58 | Trends in higher education | Volume 3. Finance
Tuition fees are reported differently in Australia than in either the U.S. or Canada. In Australia, universities receive tuition fee revenues from both student and government contributions. This increases the complexity of understanding who is paying for higher education and making international comparisons of funding trends. The Commonwealth government covers the costs of domestic undergraduate students who borrow to cover their tuition costs and also covers the difference between the fee discount and the actual tuition for students who pay up-front. When these government contributions are combined with the up-front student contributions, undergraduate student fees for domestic students totalled about $2.5 billion AUD in university revenues in 2006. Fees for postgraduate students and domestic undergraduate students paying full fees contributed another $1 billion AUD to university revenues and international students contributed another $2.3 billion AUD. Over the last decade, universities in Australia have relied more heavily on international student fees as a source of funding. In 2006, international student fees made up approximately 15 percent of the income of institutions in Australia.
In 2005, as part of the aforementioned policy changes, the Australian government replaced HECS fees with the Student Contribution Amount (SCA). This tuition system maintains many of the features of HECS, including a program called HECS-HELP, a loan system to help eligible students pay their SCA. Initially, institutions could choose to enrol full-fee paying undergraduate domestic students up to a maximum of 35 percent of the total enrolment in the given discipline, but only after all Commonwealth-supported places were filled. The 2008 budget announced increases in the number of Commonwealth-supported places which will result in the phasing out of full-fee paying students.
The 2005 changes also allowed institutions to partially deregulate the fees they charge students. Each institution could determine their own student contribution level, within the ranges determined by the Australian Commonwealth government. The three student contribution ranges by program area created under HECS in 199762 were maintained, while a fourth, based on national priorities, was added. Other changes under SCA included decreasing the upfront discount for payments from 25 percent to 20 percent and limiting the number of years a student is entitled to a government-supported place to a maximum of seven years of full-time studies. In 2007-08, the maximum fees allowed ranged from $5,000 AUD in selected arts and science programs to close to $8,333 AUD in medical programs. The 2008 budget announced fee reductions for students in mathematics and science: in 2009, HECS for students entering these programs will be reduced from $7,260 to $4,077 (the national priority rate) in an attempt to encourage more students to study these disciplines.
The Australian government is currently conducting another major review of its higher education sector. The review is considering the challenges facing the sector, and its ability to meet the needs of the Australian community and economy and the options for ongoing reform. It will inform the preparation of the government’s future policy agenda for higher education and could well impact the funding levels and mechanisms for the higher education sector in Australia.

Association of Universities and Colleges of Canada | 59
• Health services: In some instances, the health services provided by clinicians in hospital facilities on university campuses are reported as university revenue. In 2006-07, funding for health treatment costs reached nearly $325 million, more than double the $155 million allocated for these services in 2001-02. The contributions for health treatment costs are concentrated in a very small number of institutions. Since these health treatment costs are not related to teaching and research, they should be excluded whenever possible. This is especially important when conducting any inter-institutional funding comparisons.63
• Sales of goods and services: As a result of the accounting changes to the Canadian Institute of Chartered Accountants (CICA) guidelines in 1999, sales of goods and services and miscellaneous income jumped from $385 million in 1998-99 to $915 million in 1999-2000 and to more than $1.2 billion in 2006-07. The change from “net” to “gross” accounting of some activities64 had a particularly strong impact on the reporting of sales of goods and services and miscellaneous income – such as ticket sales from university art galleries and museums and profits incurred from the sale of utilities – inflating the revenues in the general operating fund and making it difficult to compare revenues in the period before 1999 with periods afterwards. Therefore, since 1999,65 revenues in the general operating fund appear highly inflated in comparison with the earlier period. Since the vast majority of these services and products are not directly related to teaching and research activities, they should be excluded from university revenues when the goal is to report specifically on the resources available for teaching and research.
The following revenues support activities that are not directly related to the core missions of universities, and have been netted out of the funds directed to support teaching and research:
• Scholarships and bursaries: To enhance the comparability of funding to support teaching, this report has netted out all forms of institutional student aid from the fees that students pay. In 2006-07, the various scholarship and bursary programs provided by or through Canadian universities to their students amounted to $1.1 billion, up from $350 million a decade earlier and just $130 million in 1977-78.
Tuition and aid policies differ by province, which makes it difficult and misleading to compare the fees levied without first netting out the university revenues returned to students through scholarships and bursaries. In effect, low-fee, low-aid policies may not net a university any more revenue in per student terms than a high-fee, high-aid policy. Therefore, net revenues generated from the mix of institutional fees and aid policies is more appropriate than gross revenues when comparing the revenues available to support teaching activities over time. It is also a useful tool for comparing the real level of revenues that fees generate across jurisdictions – particularly with some high fee, high aid universities in the U.S.
Appendix D: Revenues that are not related to the core mission of a university (Canada)

60 | Trends in higher education | Volume 3. Finance
• Non-credit programs: Universities provide both credit and non-credit instructional programs for students, with the majority of students (and costs) associated with the credit programs. However, students in non-credit programs take more than 400,000 courses annually. In 2006-07, students invested nearly $300 million in non-credit courses, up from $250 million a decade earlier and just $125 million in 1977. These courses include professional development (such as technology training, language and literacy and communication skills) and personal development (art and music appreciation, retirement planning, photography, etc.). While fees for non-credit courses are increasingly expected to cover most of their direct costs, universities frequently pay for some of the associated overhead costs, contributing to their community service role. As important as these revenues are in supporting lifelong learning, the revenues from non-credit courses should not be included when analyzing the resources available to support teaching in degree programs.
• Miscellaneous fees: Miscellaneous fees are collected to cover the costs of student and community use of athletic facilities, health services for students and library fees, but they exclude the fees collected by the institution on behalf of student councils and federations. In 2006, universities collected $580 million to cover these miscellaneous fees, up from $14 million in 1977. Once again, these fees should not be included when analyzing the resources available to support teaching in degree programs.
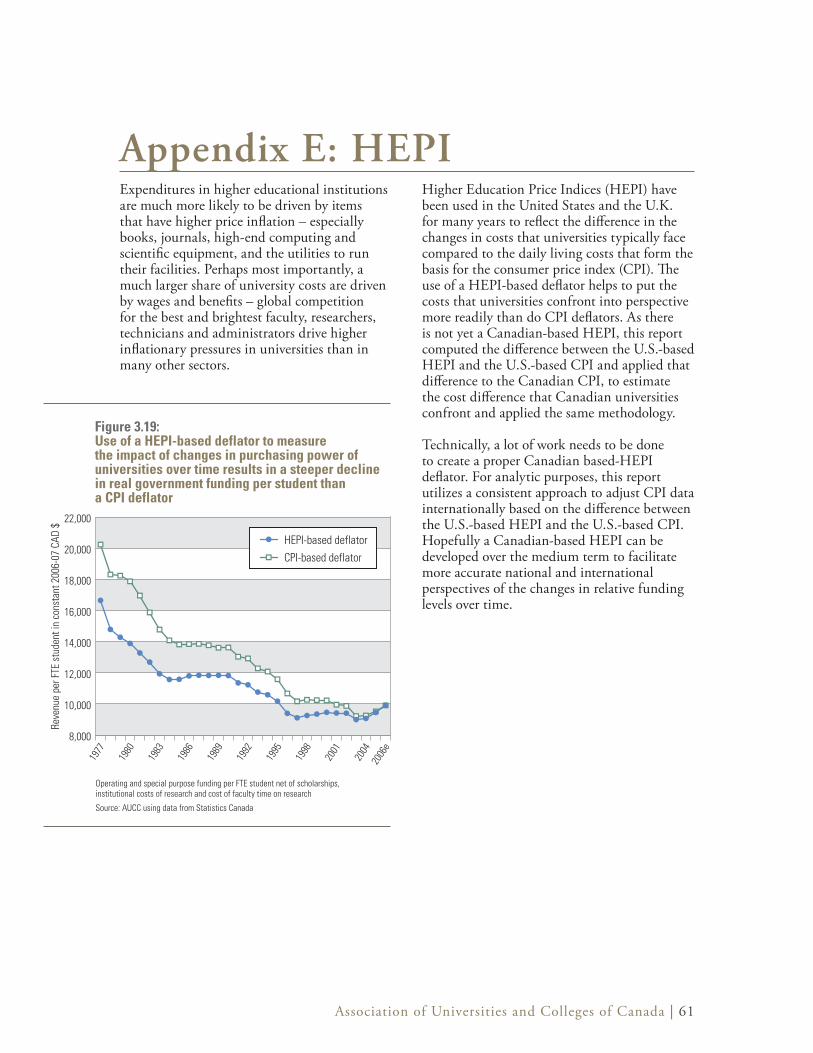
Association of Universities and Colleges of Canada | 61
Expenditures in higher educational institutions are much more likely to be driven by items that have higher price inflation – especially books, journals, high-end computing and scientific equipment, and the utilities to run their facilities. Perhaps most importantly, a much larger share of university costs are driven by wages and benefits – global competition for the best and brightest faculty, researchers, technicians and administrators drive higher inflationary pressures in universities than in many other sectors.
Higher Education Price Indices (HEPI) have been used in the United States and the U.K. for many years to reflect the difference in the changes in costs that universities typically face compared to the daily living costs that form the basis for the consumer price index (CPI). The use of a HEPI-based deflator helps to put the costs that universities confront into perspective more readily than do CPI deflators. As there is not yet a Canadian-based HEPI, this report computed the difference between the U.S.-based HEPI and the U.S.-based CPI and applied that difference to the Canadian CPI, to estimate the cost difference that Canadian universities confront and applied the same methodology.
Technically, a lot of work needs to be done to create a proper Canadian based-HEPI deflator. For analytic purposes, this report utilizes a consistent approach to adjust CPI data internationally based on the difference between the U.S.-based HEPI and the U.S.-based CPI. Hopefully a Canadian-based HEPI can be developed over the medium term to facilitate more accurate national and international perspectives of the changes in relative funding levels over time.
Appendix E: HEPI
Figure 3.19:Use of a HEPI-based deflator to measure the impact of changes in purchasing power of universities over time results in a steeper decline in real government funding per student than a CPI deflator
Operating and special purpose funding per FTE student net of scholarships, institutional costs of research and cost of faculty time on research
Source: AUCC using data from Statistics Canada
8,000
10,000
12,000
14,000
16,000
18,000
20,000
22,000
CPI-based deflator
HEPI-based deflator
Reve
nue
per F
TE s
tude
nt in
con
stan
t 200
6-07
CAD
$
2006
e
2004
2001
1998
1995
1992
1989
1986
1983
1980
1977
Table 2: Average annual salaries for continuing faculty
Full Professor Associate Assistant Overall HEPI1999-2000 92,510 74,322 60,442 79,521 77.62000-2001 96,024 76,984 62,075 82,266 80.82001-2002 99,637 80,002 64,336 84,948 84.82002-2003 103,900 83,412 67,190 88,012 87.32003-2004 108,672 87,028 70,269 91,656 91.92004-2005 113,934 90,741 73,277 95,182 94.02005-2006 117,873 93,898 76,177 98,016 97.32006-2007 122,967 97,571 79,286 101,757 100.0Annual percent change 2000-2001 3.8% 3.6% 2.7% 3.5% 4.2%2001-2002 3.8% 3.9% 3.6% 3.3% 4.9%2002-2003 4.3% 4.3% 4.4% 3.6% 2.9%2003-2004 4.6% 4.3% 4.6% 4.1% 5.3%2004-2005 4.8% 4.3% 4.3% 3.8% 2.3%2005-2006 3.5% 3.5% 4.0% 3.0% 3.5%2006-2007 3.8% 3.8% 3.8% 3.8% 2.8%
Source: Statistics Canada
CPI-based deflator
HEPI-based deflator
62 | Trends in higher education | Volume 3. Finance
Figure 3.1: In 2006-07, combined revenues for teaching and research in public four-year colleges and universities in the U.S. were $9,000 CAD per student higher than universities in the U.K., Australia and Canada..............................................................................................................11
Figure 3.2: In the U.S., full-time faculty growth has kept pace with enrolment growth whereas in the U.K., Australia and Canada, enrolment has grown more quickly than faculty numbers .................................12
Figure 3.3: First-year Canadian students participating in NSSE trail well behind their U.S. peers in key areas of student engagement ...................................................................................................13
Figure 3.4: Capital funding was significantly higher over the last seven years than during the 1990s ...................17
Figure 3.5: All sources of university sponsored research revenues have grown significantly over the last decade ............................................................................................................................................20
Figure 3.6: In addition to the strong growth in external funding for sponsored research and CFI related infrastructure, universities draw from their other revenues to support research activities ..............................21
Figure 3.7: In 2006-07, 79 percent of the universities’ general operating and special purpose revenues were used for teaching, unsponsored research and research costs not covered by external sponsors ........................25
Figure 3.8: Despite recent increases in government funding, rapid enrolment growth and inflationary pressures have resulted in universities having significantly less resources to support teaching, learning and research than in the 1980s and most of the 1990s ......................................................29
Figure 3.9: There are record numbers of PhDs employed across a broad array of occupations ....................................37
Figure 3.10: Between 2001 and 2006, almost 16,000 PhD holders between the ages of 25 and 64 immigrated to Canada .........................................................................................................................38
Figure 3.11: Despite recent strong increases in visa enrolment in PhD programs, the number and share of immigrants who earned their PhD in Canada has declined sharply ....................................39
Figure 3.12: Investments in R&D in the U.S. have grown strongly over the last 25 years ............................................46
Figure 3.13: The U.S. reports that their universities make significantly lower contributions to HERD than is typically reported in most other OECD countries ............................................47
Figure 3.14: Types of adjustments required to make spending reported to OECD on higher education R&D in the U.S. more similar to the HERD data reported by Canada and other countries ...............48
Figure 3.15: In the U.S., the resources available for teaching grew at a much slower pace than research-related resources, but were still significantly higher in per student terms in 2006-07 than they were in 1980-81 .....................................................................................................................................................................................49
Figure 3.16: Most sources of research funding have grown strongly in the U.K. over the last decade ...................52
Figure 3.17: Changes in government support and the introduction of fees is expected to drive increased revenues per student over the next five years ...............................................................................................................................................53
Figure 3.18: While government research investment programs grew strongly in Australia over the last five years, universities still provided close to half of all higher education research funding in 2006 .......................56
Figure 3.19: Use of a HEPI-based deflator to measure the impact of changes in purchasing power of universities over time results in a steeper decline in real government funding per student than a CPI deflator ............................................................................................................................61
List of figures
Association of Universities and Colleges of Canada | 63
All Canadian data that are not referenced below are based on AUCC estimates and/or analysis of data collected by Statistics Canada.
1 To compare the funding that is meant to support the annual costs of teaching and research combined, it is necessary to separate out funds that flow to support capital projects and funding that is directed to services that are ancillary to the teaching and research activities of universities. These allocations are only made possible through extensive consultations with funding experts in the U.S., U.K. and Australia (refer to Appendices A, B and C and Structure and sources of university funding in Canada, for a description of the adjustments made for comparative purposes).
2 This report compares public four-year universities and colleges in the U.S. because these publicly supported bachelors, master’s and doctoral level institutions are a much closer match in role and function to the universities in the U.K., Australia and Canada. However, Appendix A highlights some of the characteristics of the not-for-profit universities in the U.S.
3 For more details on the U.K.’s Science and Innovation Investment Framework 2004-2014 (2004), see http://www.hm-treasury.gov.uk/media/5/B/spend04_sciencedoc_1_090704.pdf.
4 Given the differences in the timing of their school year, Australia uses a calendar year rather than a fiscal year basis for reporting their data. The school years in Australia and Canada are therefore not in sync, creating another reason for using trend-line rather than point-in-time comparisons. More importantly, Australia reports its FTE enrolment on the basis of enrolment throughout the school year, while the other three nations report their enrolment using a snap-shot of enrolment at one point during the fall term. This has the effect of creating lower estimates of per student spending in Australia when compared to the reporting used by the other countries.
5 For more details on the National Survey of Student Engagement, see http://nsse.iub.edu/html/quick_facts.cfm.
6 Mercier, P. and Díaz, V., Ontario National Survey of Student Engagement (NSSE) and Consortium for Student Retention Data Exchange (CSRDE). Presentation at the annual Council on University Planning and Analysis (CUPA) — Ministry of Training Colleges and Universities (MTCU), Toronto (November 2006).
7 An institution’s benchmark score is the average of all the student-by-student benchmark scores. The only way an institutional benchmark score of 100 would be possible is if every student responded to the highest category on every one of the component items in that benchmark.
8 At this time, it is not possible to compare NSSE indicators with countries outside North America.
9 In 1999, accounting changes required universities to report their revenues and expenditures in gross rather than net terms. In effect, expenses were ‘grossed up’ and measures were implemented to record the associated ‘income.’ In some cases, it appears that the additional income was reflected in miscellaneous income and sales of service income, while in other cases (such as in Ontario), it appears that the change was handled through the expenditure table by reporting ‘gross expenditures’ and then using external cost recoveries. The overall effect is to report higher expenditures than in the pre-1999-2000 period and, in the case of most provinces, higher income.
10 For more details on the University Investment Survey, see the CAUBO website http://www.caubo.ca/.
11 In some instances, a university’s revenues from ancillary services exceed the cost of providing those services. The small net difference can be used to fund teaching and research.
References
64 | Trends in higher education | Volume 3. Finance
12 CFI investments are primarily for capital projects and although there is often an operating component, they would typically only account for a small share of CFI investments. To account for the operating component, the CFI support and government matching contributions have been extracted from the sponsored research fund and transferred to the capital fund.
13 While it is clear that most universities report the provincial matching contributions as sponsored research funding, there are some instances where the matching funds are reported under the general operating fund.
14 The federal CFI component included $53 million in operating and maintenance support in 2006-07. Those funds are not matched by other external partners. In addition, the funding that universities received either in-kind or through matching contributions from business and non-government sponsors are not included as capital funding.
15 Even where the practice of first obtaining government approval is in place (such as in Quebec), the government will consider steps to limit the amount of debt exposure.
16 AUCC, Maximizing Efficiency, Effectiveness and Accountability in the System of Federal Support to University Research in Canada: An AUCC Discussion Paper (2006), http://www.aucc.ca/_pdf/english/reports/2007/governance_paper_02_12_e.pdf.
17 In all of the comparator countries reviewed in this document, there is an expectation that most faculty will conduct research and that those costs will be covered either through direct research funding or through the general operating funds of the universities. There is a wide array of government programs and mechanisms to support the costs of faculty time to conduct research in the four countries in this report (see Appendices A, B and C).
18 For examples see: Landry, R. and Amara, N., Estimation of Time Spent on Research in the Higher Education Sector, 2001, unpublished survey available from Statistics Canada.
19 Pouris, A., Estimating R&D Expenditures in the Higher Education Sector, Minerva, Volume 45-1, (2007).
20 Universities have also responded to rising student demand by increasing the number of students admitted over the last eight years – the same period of rising research demands. The internal competition for resources to support both sets of demands has strained the core support activities in both areas.
21 The Indirect Costs program provides reimbursement to universities on the basis of a sliding scale formula. Universities receiving less in research funding are reimbursed at higher rates for their institutional costs thereby supporting the efforts of smaller universities to increase their research capacity.
22 In this report, it has only been possible to reallocate some of the costs unrelated to research and teaching. Further research is required to identify all of the revenues and costs flowing from these other functions and the associated cross subsidies that are required to fully support them.
23 The calculation of institutional costs is determined formulaically. It is based on a detailed methodology of the costs of conducting university based research. The full documentation is available on Statistics Canada’s website at http://www.statcan.ca/english/sdds/document/5109_D1_T9_V3_E.pdf.
24 Universities are autonomous institutions and their boards typically have authority to set tuition policies as part of their responsibility for the ongoing financial sustainability and solvency of the university.
Association of Universities and Colleges of Canada | 65
25 The recent changes in Nova Scotia illustrate how these types of policies work. In March 2008, the provincial government and the Council of Nova Scotia University Presidents signed a memorandum of understanding that will effectively freeze tuition fees in the province at 2007-08 levels for three years from 2008-09 to 2010-11. Over that same period, provincial operating grants will increase by $30 million per year (for a total of $90 million in the third year) to compensate the universities for the lost tuition revenue.
26 Government of Canada, Mobilizing Science and Technology to Canada’s Advantage (May 2007).
27 For example, Quebec has set a target of raising industrial R&D to two percent of GDP and Alberta’s nanotechnology strategy seeks a two percent share of the global nanotechnology market by 2020.
28 Government of Nova Scotia, Innovative Nova Scotia: An Innovation Policy for the Nova Scotia Economy (2004).
29 Research Money, Vol. 21, Number 18 (2007).
30 For more details on Backing Australia’s Ability see http://backingaus.innovation.gov.au/back_res2004.htm.
31 With a total budget of €50.5 billion, FP7 will continue for seven years. An additional €2.7 billion has been earmarked for the Euratom programme on nuclear research, which will run for five years. For more details see http://cordis.europa.eu/fp7/home_en.html.
32 OECD, Main Science and Technology Indicators, Volume 2007/2, Science Directorate, Technology and Industry (2007).
33 Research output as measured by the number of scientific publications. National Science Foundation, Science & Engineering Indicators (2008).
34 The National Academies, Rising Above the Gathering Storm: Energizing and Employing America for a Brighter Economic Future (2007) and the Council on Competitiveness, Innovate America (2004).
35 The Conference Board of Canada, The Rise of the BRICs – What Does it Mean for Canada? (January 2008).
36 From the Ministry of Education of the People’s Republic of China website http://www.moe.edu.cn/edoas/website18/en/higher_h.htm.
37 Launched in 1995, the 211 Project was aimed at developing 100 quality universities for the 21st century, through improving facilities and curricula in priority program areas. The 985 Project, launched in 1998, provided support to 10 of China’s universities and in 2004, was increased to 38 universities. World Education News. “International Rankings and Chinese Higher Education Reform” (October 2006) and Pallavi Aiyar “China hunts abroad for academic talent” (February 2006).
38 From the Ministry of Science & Technology (India) web site http://dst.gov.in/stsysindia/stp2003.htm.
39 Herstatt, C. et al, India’s National Innovation System: Key Elements and Corporate Perspectives, Working Paper No. 51 (January 2008).
40 American Association of University Professors, 2006-07 Annual Report on the Economic Status of the Profession (2007).
41 Association of Atlantic Universities, Campus Infrastructure Renewal (2006).
42 Council of Ontario Universities, Ontario Universities: Strategic Partners in Provincial Prosperity, 2008 Provincial Pre-Budget Submission (January 2008).
43 Snowdon, K., Without a Roadmap: Government Funding and Regulation of Canada’s Universities and Colleges, CPRN Research Report (December 2005).
44 The per student expenditures were adjusted to exclude funding that flows through the hospitals, supports auxiliary enterprises and other expenditures that do not support teaching and research. National Center for Higher Education Statistics, Digest of Education Statistics, Table 351 (2007).

66 | Trends in higher education | Volume 3. Finance
45 There are many concerns with the methods that different countries use to estimate these costs and so it is not possible to determine precisely how different the U.S. is from other countries. See: Pouris, A., Estimating R&D expenditures in the higher education sector, Minerva, (Volume 45-1, 2007).
46 National Center for Education Statistics, National Study of Postsecondary Faculty (2004).
47 State Higher Education Executive Officers (SHEEO), State Higher Education Finance FY 2006 (http://www.sheeo.org/finance/shef_fy06.pdf).
48 National Statistics U.K., Gross Domestic Expenditure on Research and Development 2005 (2007) (http://www.statistics.gov.uk/pdfdir/gerd0307.pdf).
49 The Funding Councils in the U.K. are made up of the Higher Education Funding Council of England, Scottish Higher Education Funding Council, Higher Education Funding Council for Wales, and the Northern Ireland Department for Employment and Learning.
50 The time faculty devote to research in departments that do not receive RAE allocations is not included in the OECD estimates of HERD. This is significantly different from how HERD is calculated in Canada and is a major constraint in making direct comparisons of university based research activity using HERD data.
51 From the Higher Education Funding Council for England website http://www.hefce.ac.uk/news/hefce/2006/business.htm.
52 The TRAC methodology sets specific rates under each of the following headings: Directly Incurred Costs, Directly Allocated Costs, and Indirect Costs. It covers costs related to researcher time, staff, equipment, travel, etc. The TRAC methodology has introduced some new processes and activities, the most notable are the requirements to allocate academic staff time, and to build up the cost of research projects on a full economic cost basis. Time allocation has been the most contentious issue, but is essential if HEIs are to know where their academic staff effort is being directed, and if they are to plan how these costs can be funded.
53 Currently, revenues from tuition fees include both student and government contributions. This is significantly different from how fees are reported in Canada and will limit our ability to illustrate how much of the funding comes from government and how much comes from students. It will be important to monitor how the new fee regime will change the reporting after 2005-06 so that bursaries provided from the universities to the students can be netted out of the student contributions in order to follow the same methodology used in Canada and the U.S.
54 For more information on TEMPUS or ERASMUS, see http://www.erasmus.ac.uk/index.html.
55 Public fees refer to the fees paid by the Local Education Authorities prior to 1998 and the £1,000 fee since 1998 whether paid by government or the student.
Association of Universities and Colleges of Canada | 67
56 The RIBG Grant is not for capital infrastructure. It must be used only for non-capital aspects of facilities such as libraries, laboratories, computing centres, animal houses, herbaria, experimental farms; equipment purchases, installation, maintenance, hire and lease; salaries of research support staff (including research assistants, accounting and administrative staff and technicians) employed to provide general support activity in a given area (e.g. a research assistant providing support for a number of research projects but not a research assistant dedicated to a particular project); provide for travel costs to allow participation in international consortia. The RIBG Grant must not be used for capital works (i.e. construction of buildings), salaries of teaching and research, or research-only academic staff (including the cost of ‘buying time’ to free such staff to do more research); salaries of staff supporting research at the institutional level (e.g. Deputy Vice-Chancellor (Research), Research Grants Officer); stipends of postgraduate research students; or travel costs directly associated with individual projects.
57 From Backing Australia’s Ability website http://backingaus.innovation.gov.au/2004/research/ribg.htm.
58 Department of Education, Employment and Workplace Relations, The Process for Determining Institutional Grants Scheme (IGS) and Research Infrastructure Block Grants (RIBG) Scheme Grant Amounts (2008).
59 The two smaller initiatives were the Systemic Infrastructure Initiative (SII) and the Major National Research Facilities (MNRF) programs.
60 The nine areas include: evolving biomolecular platforms and informatics, integrated biological systems, characterisation, fabrication, biotechnology products, optical and radio astronomy, integrated marine observing system, structure and evolution of the Australian continent, and platforms for collaboration. In addition, funding will be provided in three more areas: networked biosecurity framework, terrestrial ecosystems research network, population health and data linkage.
61 The goal for HEEF, and now EIF, is to promote excellence, diversity, specialization and responsiveness to local labour market needs.
62 In 1997, three different tuition cost bands were established by discipline, based on the relative cost of course delivery and the range in income that students might reasonably expect to earn after graduation.
63 In many instances, provincial departments of agriculture, forestry, heritage, culture and social services are funding activities through the universities that are only tangentially related to the university’s academic missions. By way of illustration, some provincial government funds flow through the University of British Columbia to support some of the costs of the Museum of Anthropology. The revenues generated through ticket sales also flow through the university’s financial statements, but these revenues do not even cover all the cost of the museum, which the university subsidizes. While these types of activities are welcomed and help universities provide an expanded array of services in their local communities, they do not directly assist universities in meeting their central teaching or research-related missions. Ideally, it would be desirable to remove all of this type of flow-through funding. However, these costs are difficult to identify in the CAUBO reports and therefore they have not been removed in this analysis.
64 Prior to 1999, universities reported only the net revenues generated from the sales to external organizations from such things as laboratory tests, space rental, conferences and medical clinics.
65 Prior to 1999, such sales were restricted to the ancillary fund, but since then they can be accounted for in any fund.