Embed Size (px)
Citation preview
RETIREMENT PLANTRENDS INHIGHER EDUCATION2021 REPORT

TABLE OF CONTENTSExecutive Summary ����������������������������������������������������������� 3
Sector Trends ���������������������������������������������������������������������� 5
Retirement Benefits Package ������������������������������������������ 9
Participation and Contributions ������������������������������������13
Employer Contributions ��������������������������������������������������15
Loans and Hardship Withdrawals ���������������������������������19
Impact of COVID-19 ��������������������������������������������������������22
Auto Features �������������������������������������������������������������������24
Use of Advisors and Consultants ���������������������������������27
Investment Arrays and Plan Services �������������������������30
Dedicated Representatives �������������������������������������������35
Financial Wellness ����������������������������������������������������������� 37
Defining Plan Success ���������������������������������������������������� 40
About the Survey �������������������������������������������������������������43
2
EXECUTIVESUMMARY
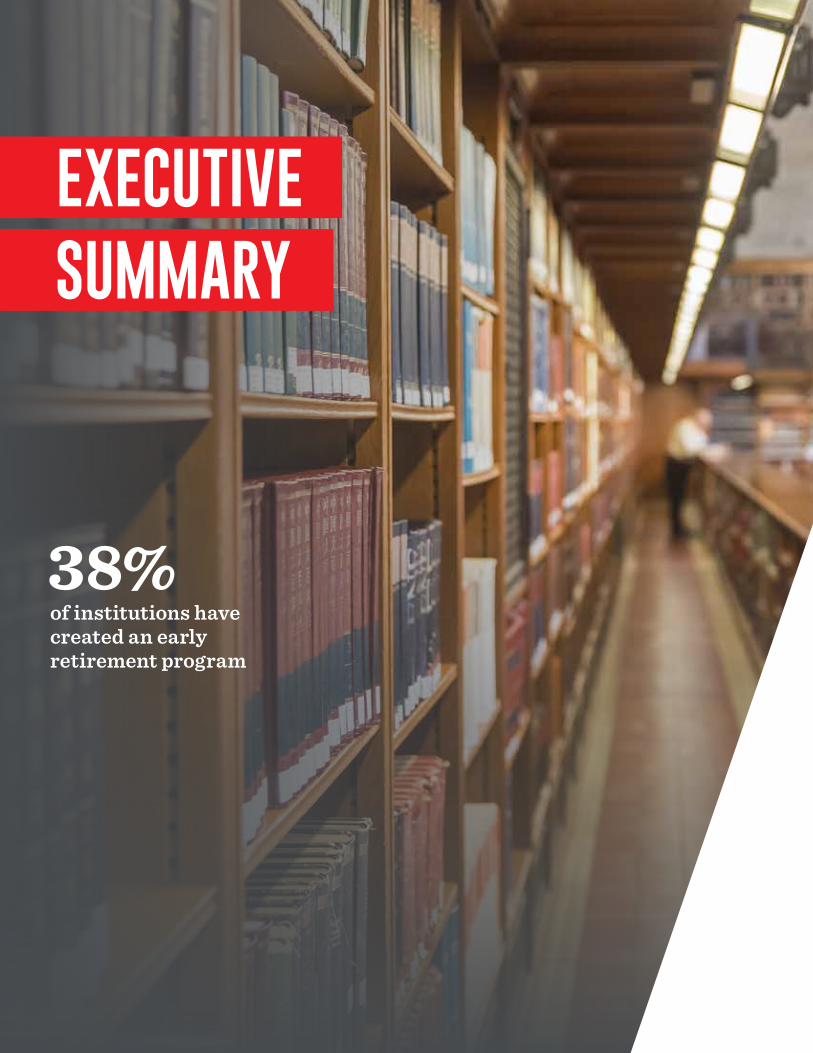
38%of institutions have created an early retirement program
4
The transformation of the higher education sector over the past few years, exacerbated by the COVID-19 pandemic, highlights the importance of talent management in the success of institutions.
Technological innovation is changing the talent needed to teach the incoming student population and to analyze data for research projects� Institutions dedicate growing resources to faculty and staff development, turnover is on the rise, and 38% of institutions have created an early retirement program to contain the effects of the COVID-19 pandemic� More than ever, institutions of higher education rely on their retirement plan provider to implement success strategies�
This report is based on a survey of 150 higher education institutions conducted by a third-party research firm in 2020 in every segment: public and private, not-for-profit, faith-based, and for-profit� Trends highlighted in the report impact each institution differently based on its heritage, financial resources, and position� Newer institutions with a focus on e-learning may be more interested in the trend toward automatic enrollment of new and existing faculty and staff� More traditional brick-and-mortar institutions are more likely to have a defined benefit (DB) plan and may want to carefully review trends highlighted in this report�
Reading this report, many institutions may be inspired to challenge their retirement plan service provider to play a greater role in counseling faculty and staff nearing retirement� Counseling needs are not limited to income strategies and portfolio management� Healthcare decisions are becoming a larger part of retirement readiness planning� The need for belonging, esteem, and self-actualization also play a role in retirement decisions� In the process of delivering counseling, retirement plan providers need to communicate opportunities for continued involvement that give a meaningful purpose to the life of so many dedicated faculty and staff�
Belt-tightening measures adopted in reaction to recent trends are leading institutions to examine the design of their retirement benefits package, placing greater emphasis on defined contribution (DC) plans and employee contributions (voluntary or mandatory)� Loan utilization is growing, and more institutions are outsourcing plan administration functions to their retirement plan service provider� Universities and colleges are placing greater emphasis on broadening the range of financial wellness communications with faculty and staff� As expected, income replacement ratios, participation rates, the amount saved, and retirement readiness scores continue to be the key metrics by which institutions gauge the success of their retirement plan�
EXECU
TIVE SU
MM
ARY
| TRAN
SAM
ERICA
institutions of higher education in every segment: public and private, not-for-profit, faith-based, and for-profit.
This report is based on a survey of
150

5
SECTOR TRENDS
6
SECTOR TREN
DS | TRA
NSA
MERIC
A
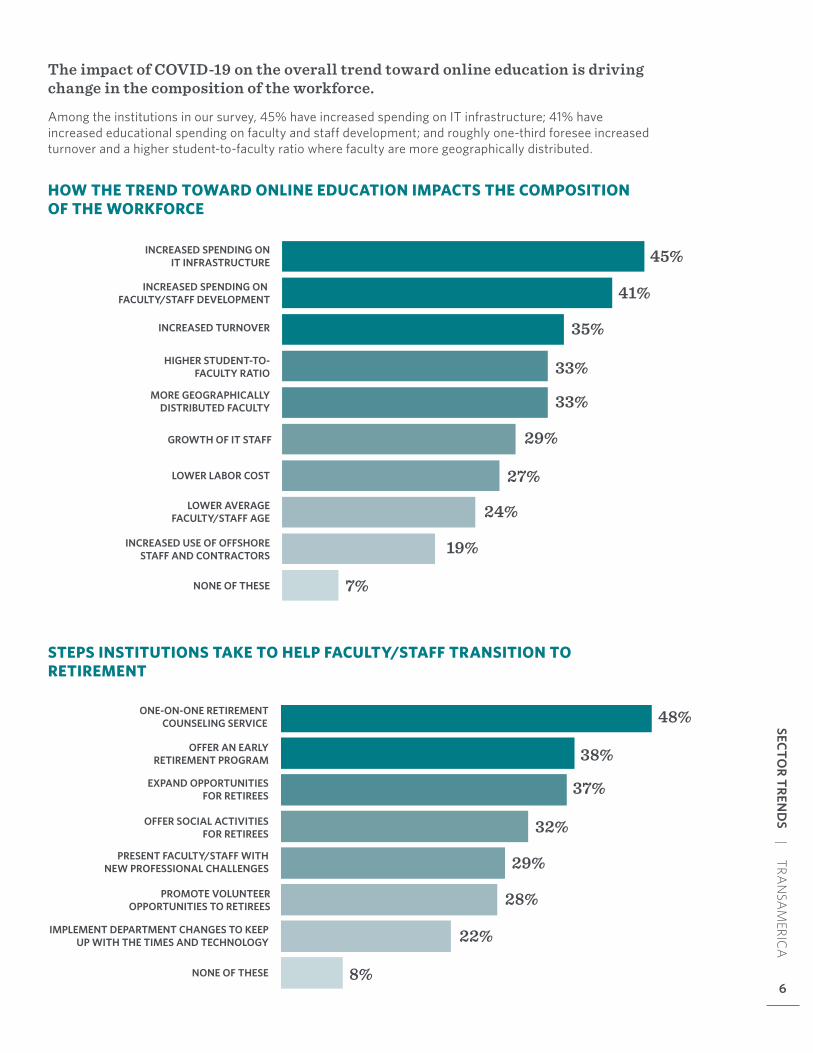
The impact of COVID-19 on the overall trend toward online education is driving change in the composition of the workforce.
Among the institutions in our survey, 45% have increased spending on IT infrastructure; 41% have increased educational spending on faculty and staff development; and roughly one-third foresee increased turnover and a higher student-to-faculty ratio where faculty are more geographically distributed�
HOW THE TREND TOWARD ONLINE EDUCATION IMPACTS THE COMPOSITION OF THE WORKFORCE
STEPS INSTITUTIONS TAKE TO HELP FACULTY/STAFF TRANSITION TO RETIREMENT
45%
41%
35%
33%
33%
29%
27%
24%
19%
7%
INCREASED SPENDING ON IT INFRASTRUCTURE
INCREASED SPENDING ON FACULTY/STAFF DEVELOPMENT
INCREASED TURNOVER
HIGHER STUDENT-TO-FACULTY RATIO
MORE GEOGRAPHICALLYDISTRIBUTED FACULTY
LOWER LABOR COST
LOWER AVERAGEFACULTY/STAFF AGE
INCREASED USE OF OFFSHORESTAFF AND CONTRACTORS
NONE OF THESE
GROWTH OF IT STAFF
48%
38%
37%
32%
29%
28%
22%
8%
ONE-ON-ONE RETIREMENTCOUNSELING SERVICE
OFFER AN EARLYRETIREMENT PROGRAM
EXPAND OPPORTUNITIESFOR RETIREES
OFFER SOCIAL ACTIVITIESFOR RETIREES
PRESENT FACULTY/STAFF WITHNEW PROFESSIONAL CHALLENGES
IMPLEMENT DEPARTMENT CHANGES TO KEEPUP WITH THE TIMES AND TECHNOLOGY
NONE OF THESE
PROMOTE VOLUNTEEROPPORTUNITIES TO RETIREES
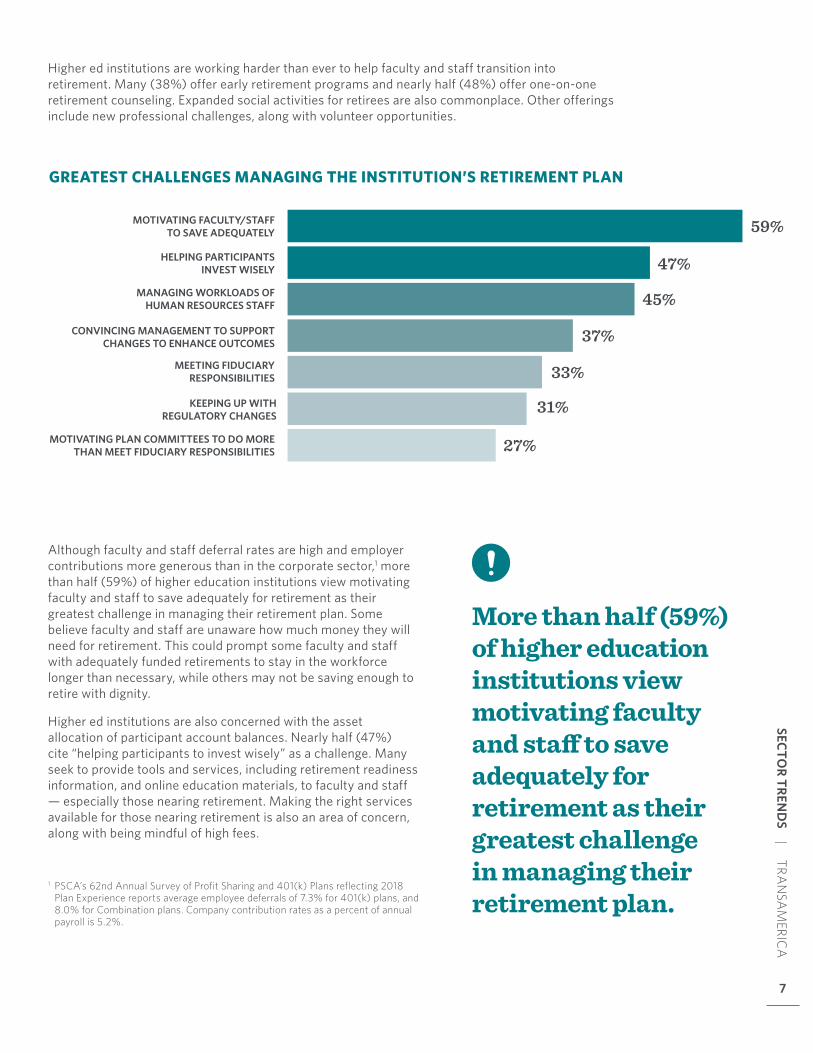
Although faculty and staff deferral rates are high and employer contributions more generous than in the corporate sector,1 more than half (59%) of higher education institutions view motivating faculty and staff to save adequately for retirement as their greatest challenge in managing their retirement plan� Some believe faculty and staff are unaware how much money they will need for retirement� This could prompt some faculty and staff with adequately funded retirements to stay in the workforce longer than necessary, while others may not be saving enough to retire with dignity�
Higher ed institutions are also concerned with the asset allocation of participant account balances� Nearly half (47%) cite “helping participants to invest wisely” as a challenge� Many seek to provide tools and services, including retirement readiness information, and online education materials, to faculty and staff — especially those nearing retirement� Making the right services available for those nearing retirement is also an area of concern, along with being mindful of high fees�
1 PSCA’s 62nd Annual Survey of Profit Sharing and 401(k) Plans reflecting 2018 Plan Experience reports average employee deferrals of 7.3% for 401(k) plans, and 8.0% for Combination plans. Company contribution rates as a percent of annual payroll is 5.2%.
More than half (59%) of higher education institutions view motivating faculty and staff to save adequately for retirement as their greatest challenge in managing their retirement plan.
Higher ed institutions are working harder than ever to help faculty and staff transition into retirement� Many (38%) offer early retirement programs and nearly half (48%) offer one-on-one retirement counseling� Expanded social activities for retirees are also commonplace� Other offerings include new professional challenges, along with volunteer opportunities�
GREATEST CHALLENGES MANAGING THE INSTITUTION’S RETIREMENT PLAN
59%
47%
45%
37%
33%
31%
27%
MOTIVATING FACULTY/STAFFTO SAVE ADEQUATELY
HELPING PARTICIPANTSINVEST WISELY
MANAGING WORKLOADS OFHUMAN RESOURCES STAFF
CONVINCING MANAGEMENT TO SUPPORTCHANGES TO ENHANCE OUTCOMES
MEETING FIDUCIARYRESPONSIBILITIES
MOTIVATING PLAN COMMITTEES TO DO MORETHAN MEET FIDUCIARY RESPONSIBILITIES
KEEPING UP WITHREGULATORY CHANGES
7
SECTOR TREN
DS | TRA
NSA
MERIC
A
FACULTY AND STAFF UNAWARE OF THE AMOUNT
NEEDED FOR RETIREMENT
HAVING THE RIGHT SERVICES
FOR THOSE NEARING
RETIREMENT
HIGH FEES LATE ENTRY INTO PLAN
POOR FUND CHOICES
POOR DIVERSIFICATION/
REBALANCING
LOW CONTRIBUTIONS
HAVING THE RIGHT FUNDS
THAT ARE APPROPRIATE
FOR ANY PARTICIPANT
28%
14%
36%
16%
21%
13%
21%17%
12%16% 15%16%
20%
14%
20%20%26%
20162020
EXTREMELYCONCERNED
VERYCONCERNED
SOMEWHATCONCERNED
NOT VERYCONCERNED
NOT AT ALLCONCERNED
FACULTY/STAFF UNAWARE OF
AMOUNT NEEDED FOR RETIREMENT
HAVING THE RIGHT SERVICES
FOR THOSE NEARING
RETIREMENT
HIGH FEES LATE ENTRY INTO PLAN
POOR FUND CHOICES
POORDIVERSIFICATION/
REBALANCING
LOW CONTRIBU-
TIONS
HAVING FUNDS THAT ARE
APPROPRIATE FOR ANY
PARTICIPANT
36%
35%
23%
7%
28%
37%
23%
5%
7%
26%
42%
21%
3%
8%
21%
31%
33%
5%
11%
20%
34%
25%
3%
18%
20%
37%
29%
3%
11%
17%
39%
27%
5%
11%
16%
34%
34%
5%
11%
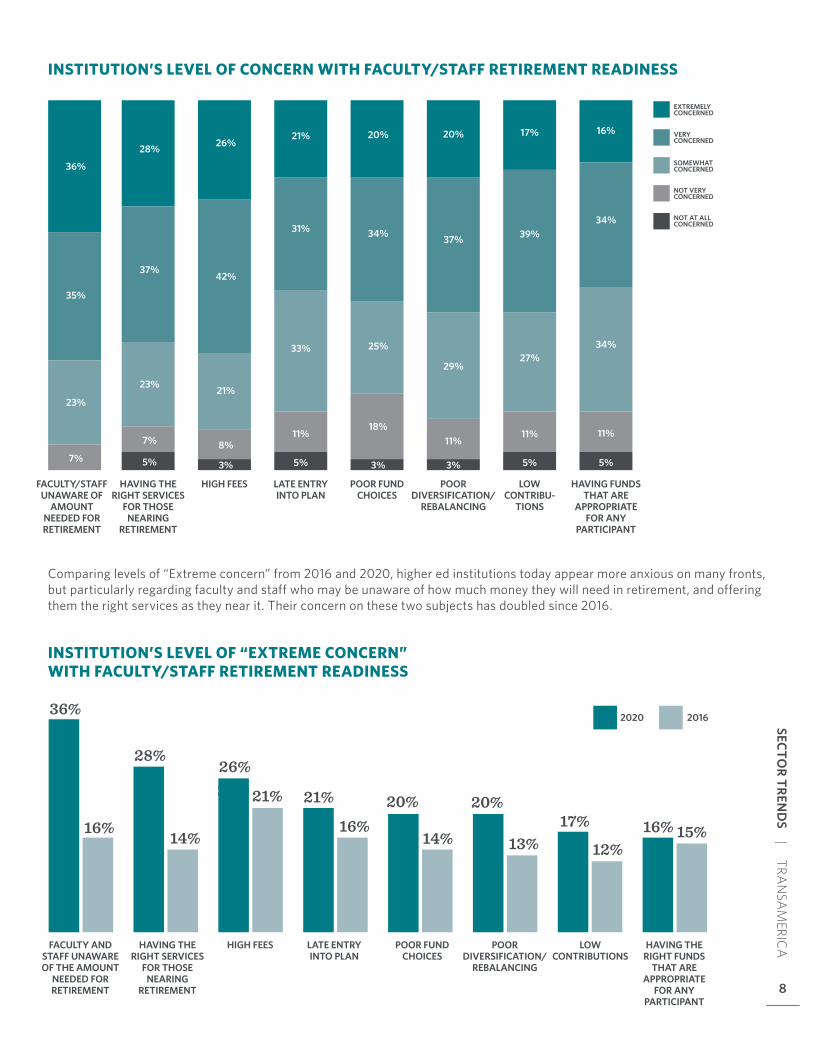
Comparing levels of “Extreme concern” from 2016 and 2020, higher ed institutions today appear more anxious on many fronts, but particularly regarding faculty and staff who may be unaware of how much money they will need in retirement, and offering them the right services as they near it� Their concern on these two subjects has doubled since 2016�
8
SECTOR TREN
DS | TRA
NSA
MERIC
A
INSTITUTION’S LEVEL OF CONCERN WITH FACULTY/STAFF RETIREMENT READINESS
INSTITUTION’S LEVEL OF “EXTREME CONCERN” WITH FACULTY/STAFF RETIREMENT READINESS

RETIREMENTBENEFITS PACKAGE
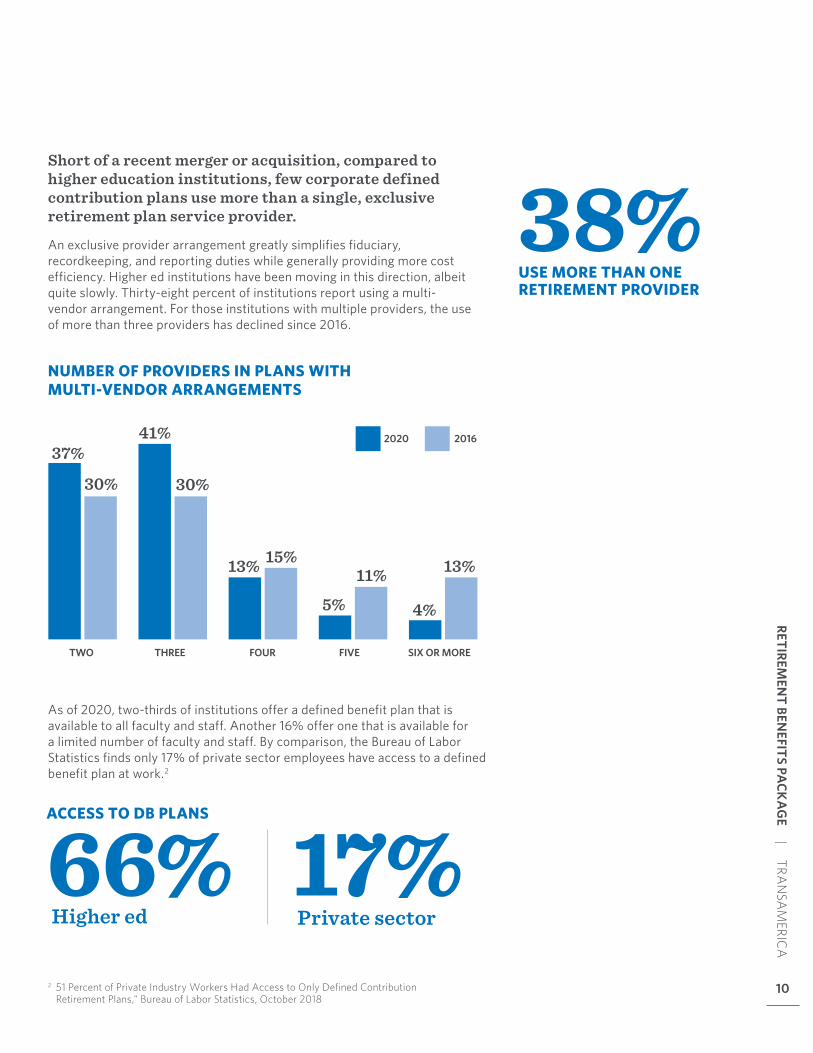
Short of a recent merger or acquisition, compared to higher education institutions, few corporate defined contribution plans use more than a single, exclusive retirement plan service provider.
An exclusive provider arrangement greatly simplifies fiduciary, recordkeeping, and reporting duties while generally providing more cost efficiency� Higher ed institutions have been moving in this direction, albeit quite slowly� Thirty-eight percent of institutions report using a multi-vendor arrangement� For those institutions with multiple providers, the use of more than three providers has declined since 2016�
As of 2020, two-thirds of institutions offer a defined benefit plan that is available to all faculty and staff� Another 16% offer one that is available for a limited number of faculty and staff� By comparison, the Bureau of Labor Statistics finds only 17% of private sector employees have access to a defined benefit plan at work�2
10
RETIREMEN
T BENEFITS PA
CKA
GE | TRA
NSA
MERIC
A
NUMBER OF PROVIDERS IN PLANS WITH MULTI-VENDOR ARRANGEMENTS
10
TWO THREE FOUR FIVE SIX OR MORE
30%
37%
30%
13% 15%
5%11%
4%
13%
41% 20162020
Higher ed Private sector
ACCESS TO DB PLANS
66% 17%2 51 Percent of Private Industry Workers Had Access to Only Defined Contribution
Retirement Plans," Bureau of Labor Statistics, October 2018
USE MORE THAN ONE RETIREMENT PROVIDER
38%
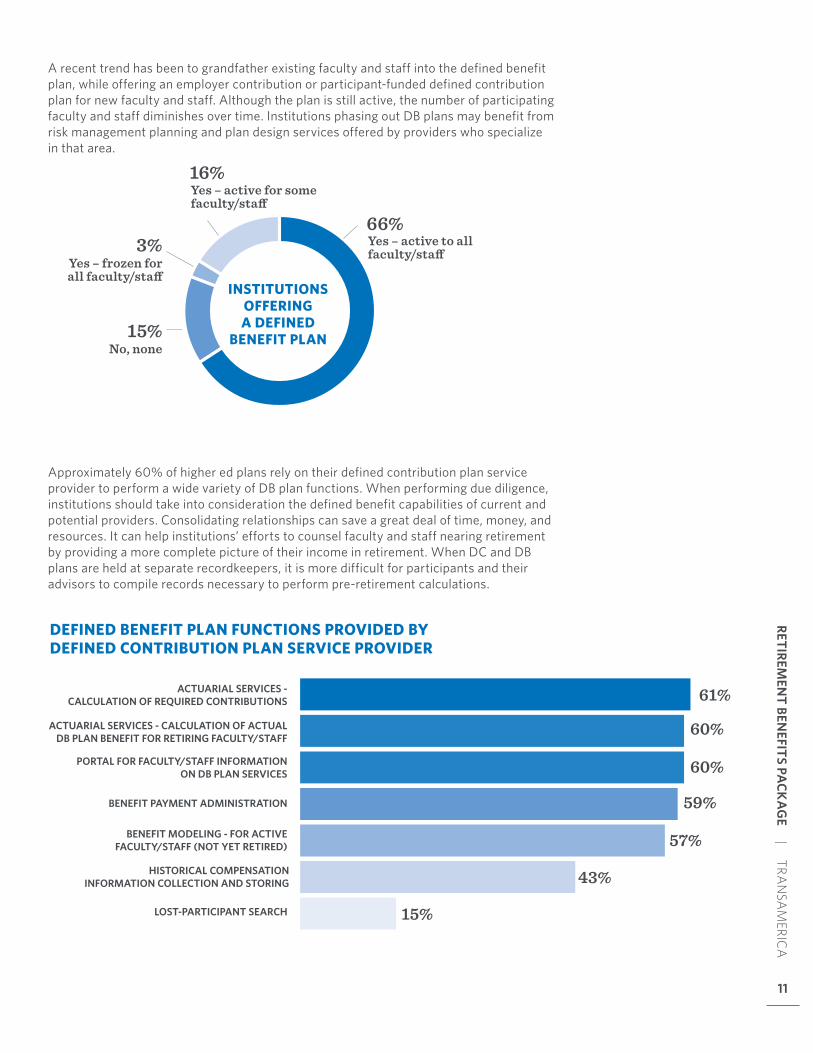
Approximately 60% of higher ed plans rely on their defined contribution plan service provider to perform a wide variety of DB plan functions� When performing due diligence, institutions should take into consideration the defined benefit capabilities of current and potential providers� Consolidating relationships can save a great deal of time, money, and resources� It can help institutions’ efforts to counsel faculty and staff nearing retirement by providing a more complete picture of their income in retirement� When DC and DB plans are held at separate recordkeepers, it is more difficult for participants and their advisors to compile records necessary to perform pre-retirement calculations�
DEFINED BENEFIT PLAN FUNCTIONS PROVIDED BY DEFINED CONTRIBUTION PLAN SERVICE PROVIDER
INSTITUTIONS OFFERING A DEFINED
BENEFIT PLAN
66%
16%Yes – active for some faculty/staff
No, none
Yes – frozen for all faculty/staff
Yes – active to all faculty/staff
15%
3%
61%
60%
60%
59%
57%
43%
15%
ACTUARIAL SERVICES -CALCULATION OF REQUIRED CONTRIBUTIONS
ACTUARIAL SERVICES - CALCULATION OF ACTUALDB PLAN BENEFIT FOR RETIRING FACULTY/STAFF
PORTAL FOR FACULTY/STAFF INFORMATIONON DB PLAN SERVICES
BENEFIT PAYMENT ADMINISTRATION
BENEFIT MODELING - FOR ACTIVEFACULTY/STAFF (NOT YET RETIRED)
LOST-PARTICIPANT SEARCH
HISTORICAL COMPENSATIONINFORMATION COLLECTION AND STORING
11
RETIREMEN
T BENEFITS PA
CKA
GE | TRA
NSA
MERIC
A
11
A recent trend has been to grandfather existing faculty and staff into the defined benefit plan, while offering an employer contribution or participant-funded defined contribution plan for new faculty and staff� Although the plan is still active, the number of participating faculty and staff diminishes over time� Institutions phasing out DB plans may benefit from risk management planning and plan design services offered by providers who specialize in that area�
12
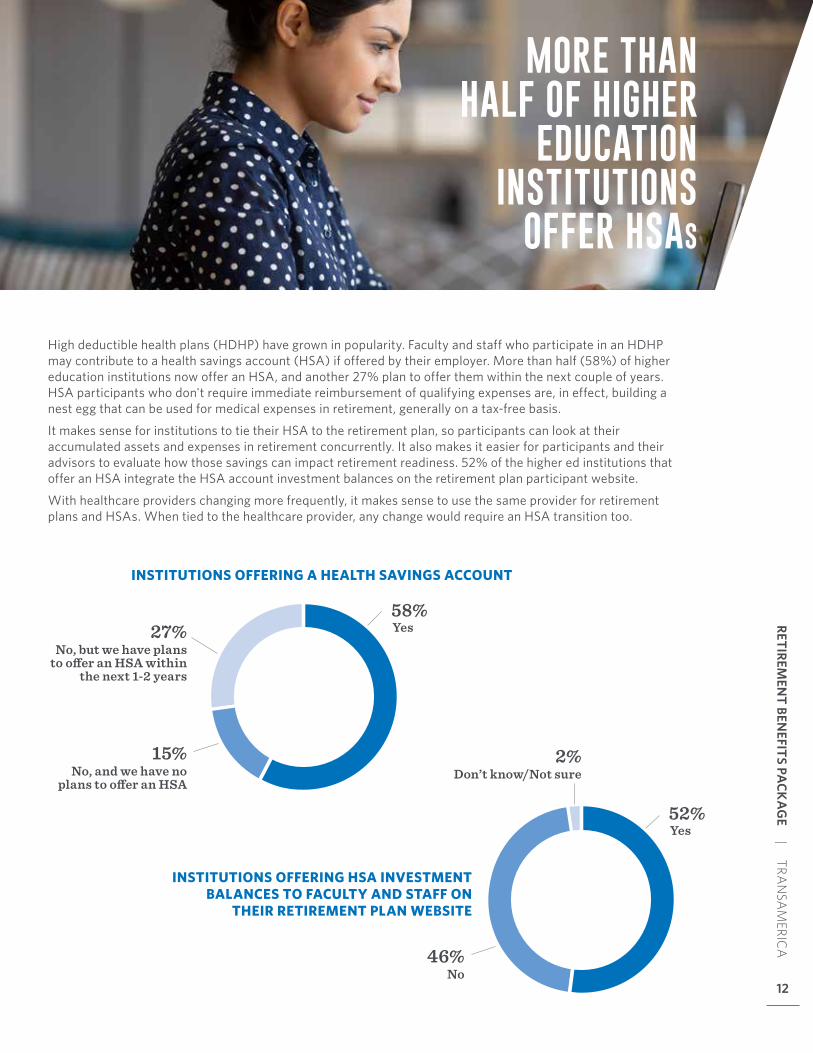
High deductible health plans (HDHP) have grown in popularity� Faculty and staff who participate in an HDHP may contribute to a health savings account (HSA) if offered by their employer� More than half (58%) of higher education institutions now offer an HSA, and another 27% plan to offer them within the next couple of years� HSA participants who don't require immediate reimbursement of qualifying expenses are, in effect, building a nest egg that can be used for medical expenses in retirement, generally on a tax-free basis�
It makes sense for institutions to tie their HSA to the retirement plan, so participants can look at their accumulated assets and expenses in retirement concurrently� It also makes it easier for participants and their advisors to evaluate how those savings can impact retirement readiness� 52% of the higher ed institutions that offer an HSA integrate the HSA account investment balances on the retirement plan participant website�
With healthcare providers changing more frequently, it makes sense to use the same provider for retirement plans and HSAs� When tied to the healthcare provider, any change would require an HSA transition too�
MORE THAN HALF OF HIGHER
EDUCATION INSTITUTIONS
OFFER HSAs
12
RETIREMEN
T BENEFITS PA
CKA
GE | TRA
NSA
MERIC
A
12
INSTITUTIONS OFFERING A HEALTH SAVINGS ACCOUNT
INSTITUTIONS OFFERING HSA INVESTMENT BALANCES TO FACULTY AND STAFF ON
THEIR RETIREMENT PLAN WEBSITE
58%
52%
No, and we have no plans to offer an HSA
No
No, but we have plans to offer an HSA within
the next 1-2 years
Don’t know/Not sure
Yes
Yes
15%
46%
27%
2%

13
PARTICIPATIONAND CONTRIBUTIONS
Is the retirement plan offered for the benefit of all, or only for the benefit of full-time faculty and staff?
Allowing part-time faculty and staff to participate can set an institution apart as it seeks to attract new talent� Roughly one out of five part-time faculty or staff are eligible to participate in their institution’s retirement plan�
At 42% of higher education institutions, faculty and staff are eligible to contribute to the plan immediately, which is in line with 2016� On the other hand, many institutions with a three-month waiting period for eligibility have lengthened eligibility periods to six months�
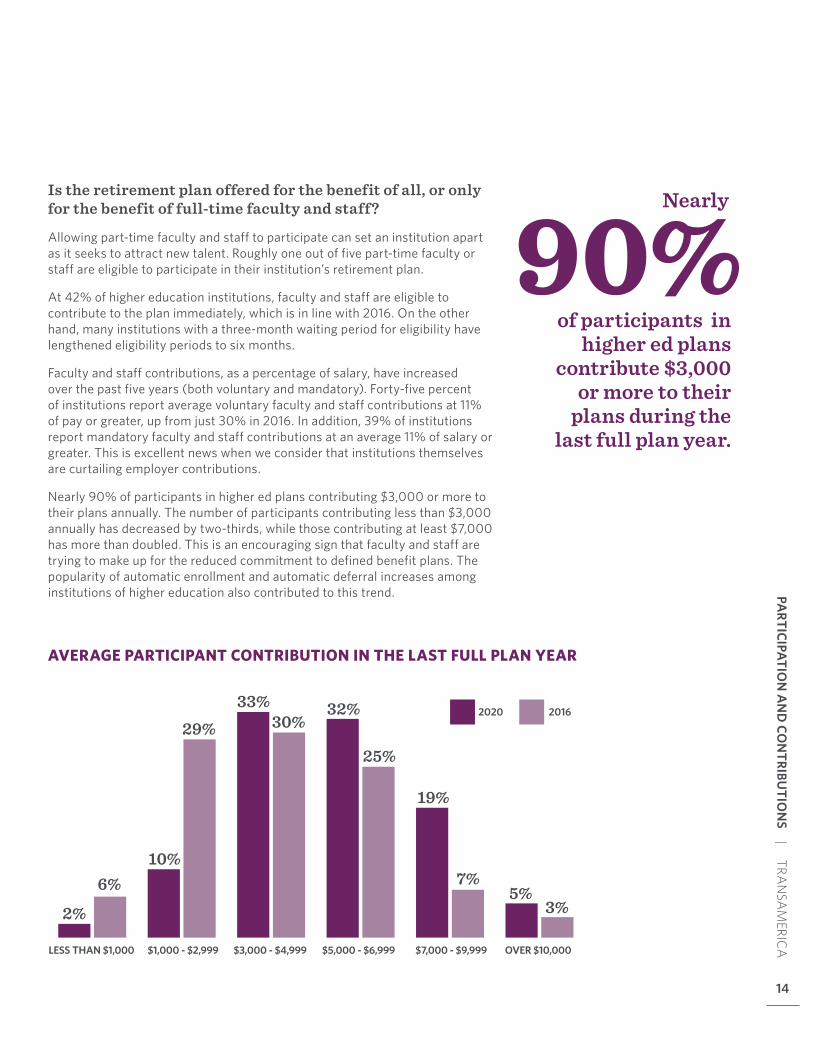
Faculty and staff contributions, as a percentage of salary, have increased over the past five years (both voluntary and mandatory)� Forty-five percent of institutions report average voluntary faculty and staff contributions at 11% of pay or greater, up from just 30% in 2016� In addition, 39% of institutions report mandatory faculty and staff contributions at an average 11% of salary or greater� This is excellent news when we consider that institutions themselves are curtailing employer contributions�
Nearly 90% of participants in higher ed plans contributing $3,000 or more to their plans annually� The number of participants contributing less than $3,000 annually has decreased by two-thirds, while those contributing at least $7,000 has more than doubled� This is an encouraging sign that faculty and staff are trying to make up for the reduced commitment to defined benefit plans� The popularity of automatic enrollment and automatic deferral increases among institutions of higher education also contributed to this trend�
14
PARTICIPATIO
N A
ND
CON
TRIBUTIO
NS | TRA
NSA
MERIC
A
AVERAGE PARTICIPANT CONTRIBUTION IN THE LAST FULL PLAN YEAR
of participants in higher ed plans
contribute $3,000 or more to their
plans during the last full plan year.
Nearly
90%
LESS THAN $1,000 $1,000 - $2,999 $3,000 - $4,999 $5,000 - $6,999 $7,000 - $9,999 OVER $10,000
10%
29%
2%6% 5%
3%
30%32%
25%
19%
7%
33%20162020

15
EMPLOYERCONTRIBUTIONS
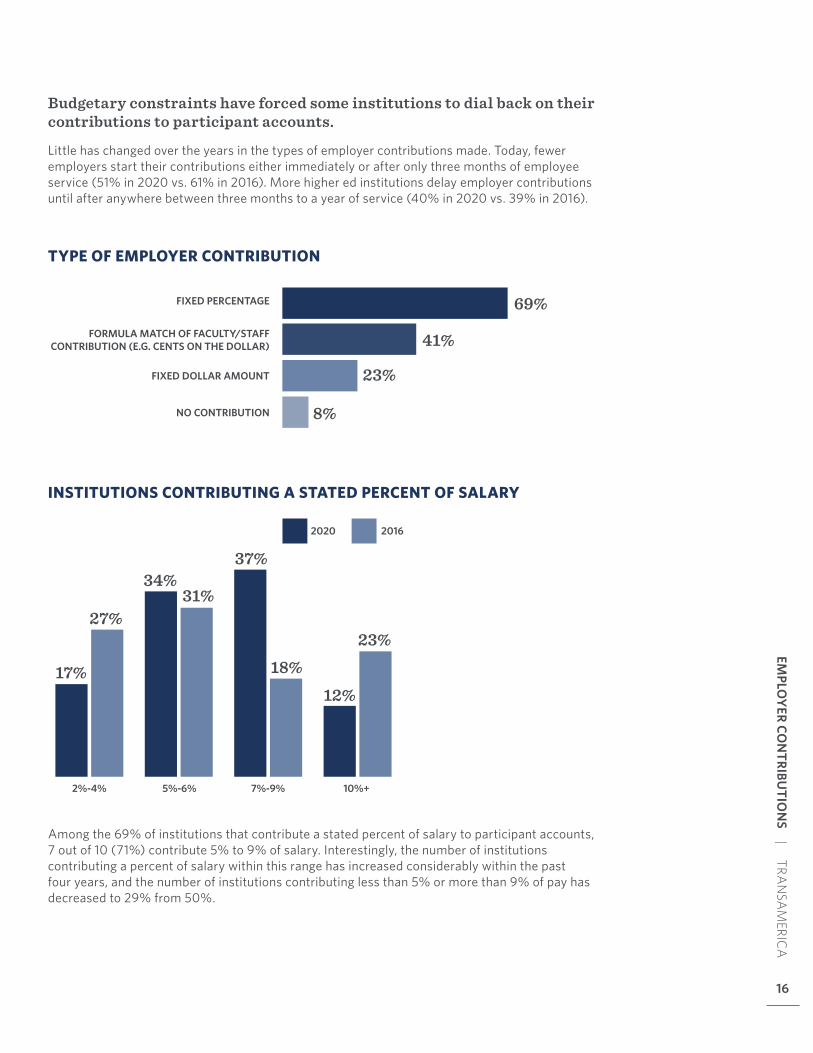
Budgetary constraints have forced some institutions to dial back on their contributions to participant accounts.
Little has changed over the years in the types of employer contributions made� Today, fewer employers start their contributions either immediately or after only three months of employee service (51% in 2020 vs� 61% in 2016)� More higher ed institutions delay employer contributions until after anywhere between three months to a year of service (40% in 2020 vs� 39% in 2016)�
Among the 69% of institutions that contribute a stated percent of salary to participant accounts, 7 out of 10 (71%) contribute 5% to 9% of salary� Interestingly, the number of institutions contributing a percent of salary within this range has increased considerably within the past four years, and the number of institutions contributing less than 5% or more than 9% of pay has decreased to 29% from 50%�
TYPE OF EMPLOYER CONTRIBUTION
INSTITUTIONS CONTRIBUTING A STATED PERCENT OF SALARY
69%
41%
23%
8%
FIXED PERCENTAGE
FORMULA MATCH OF FACULTY/STAFFCONTRIBUTION (E.G. CENTS ON THE DOLLAR)
FIXED DOLLAR AMOUNT
NO CONTRIBUTION
2%-4% 5%-6% 7%-9% 10%+
20162020
17%
27%
34%31%
37%
18%12%
23%
16
EMPLO
YER CO
NTRIBU
TION
S | TRAN
SAM
ERICA
2%
3%
4%
5%
6%
MORE THAN
6%
201620205%
6%
11%
28%
21%
22%
39%
28%
13%
6%
10%
9%
18%13%
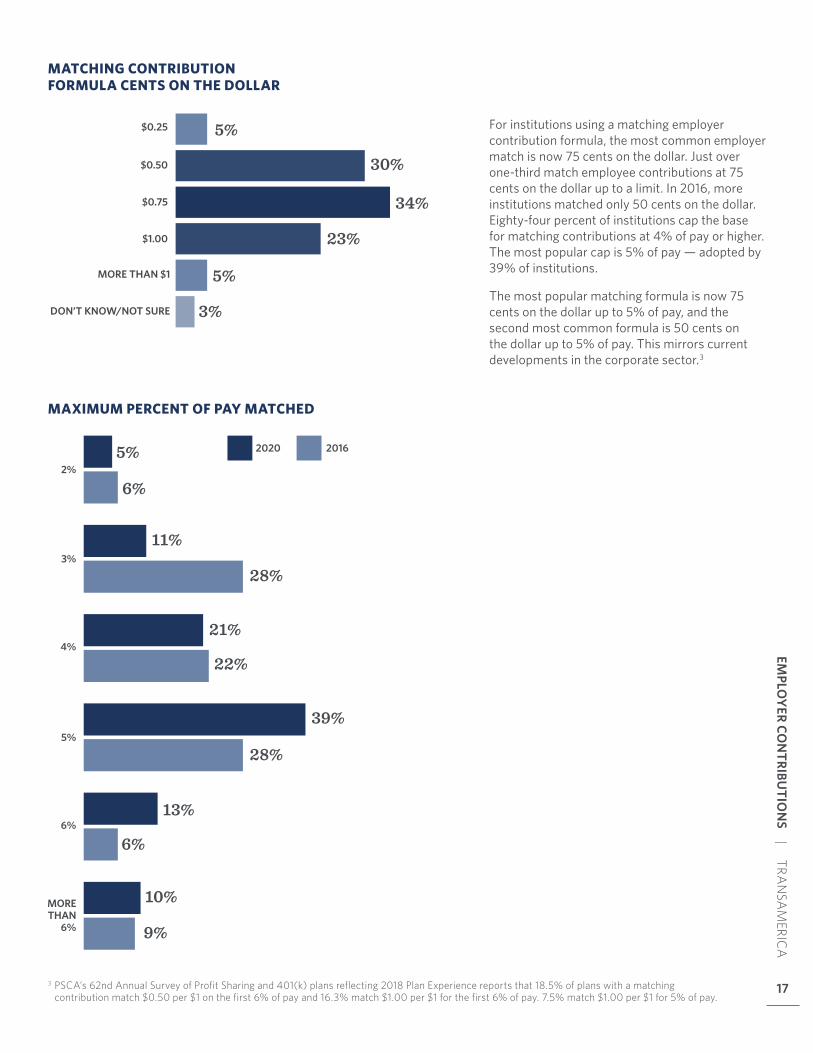
For institutions using a matching employer contribution formula, the most common employer match is now 75 cents on the dollar� Just over one-third match employee contributions at 75 cents on the dollar up to a limit� In 2016, more institutions matched only 50 cents on the dollar� Eighty-four percent of institutions cap the base for matching contributions at 4% of pay or higher� The most popular cap is 5% of pay — adopted by 39% of institutions�
The most popular matching formula is now 75 cents on the dollar up to 5% of pay, and the second most common formula is 50 cents on the dollar up to 5% of pay� This mirrors current developments in the corporate sector�3
3 PSCA’s 62nd Annual Survey of Profit Sharing and 401(k) plans reflecting 2018 Plan Experience reports that 18.5% of plans with a matching contribution match $0.50 per $1 on the first 6% of pay and 16.3% match $1.00 per $1 for the first 6% of pay. 7.5% match $1.00 per $1 for 5% of pay.
MATCHING CONTRIBUTION FORMULA CENTS ON THE DOLLAR
MAXIMUM PERCENT OF PAY MATCHED
5%
30%
34%
23%
5%
3%
41%
23%
8%
$0.25
$0.50
$0.75
$1.00
MORE THAN $1
DON’T KNOW/NOT SURE
17
EMPLO
YER CO
NTRIBU
TION
S | TRAN
SAM
ERICA
17
18
EMPLO
YER CO
NTRIBU
TION
S | TRAN
SAM
ERICA
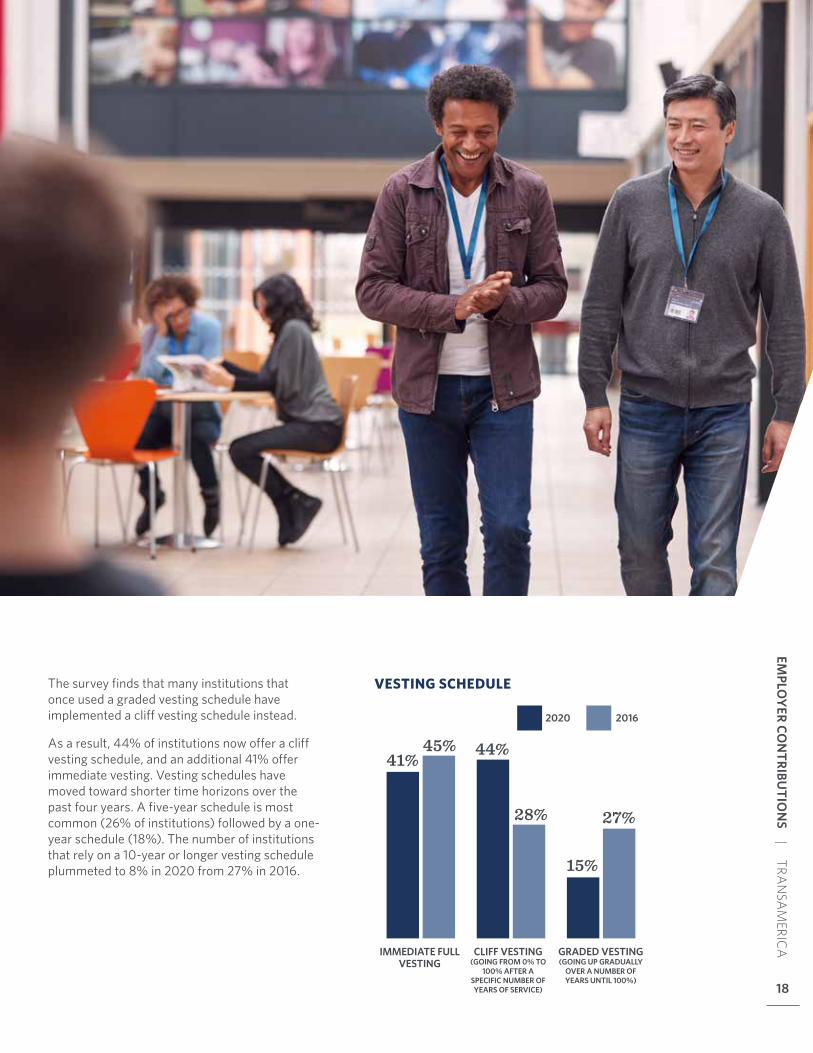
The survey finds that many institutions that once used a graded vesting schedule have implemented a cliff vesting schedule instead�
As a result, 44% of institutions now offer a cliff vesting schedule, and an additional 41% offer immediate vesting� Vesting schedules have moved toward shorter time horizons over the past four years� A five-year schedule is most common (26% of institutions) followed by a one-year schedule (18%)� The number of institutions that rely on a 10-year or longer vesting schedule plummeted to 8% in 2020 from 27% in 2016�
18
VESTING SCHEDULE
IMMEDIATE FULL VESTING
CLIFF VESTING (GOING FROM 0% TO
100% AFTER A SPECIFIC NUMBER OF YEARS OF SERVICE)
GRADED VESTING (GOING UP GRADUALLY
OVER A NUMBER OF YEARS UNTIL 100%)
45%41%
28%
15%
27%
44%
20162020

1919
LOANS ANDHARDSHIP WITHDRAWALS
20
LOA
NS A
ND
HA
RDSH
IP WITH
DRA
WA
LS | TRAN
SAM
ERICA
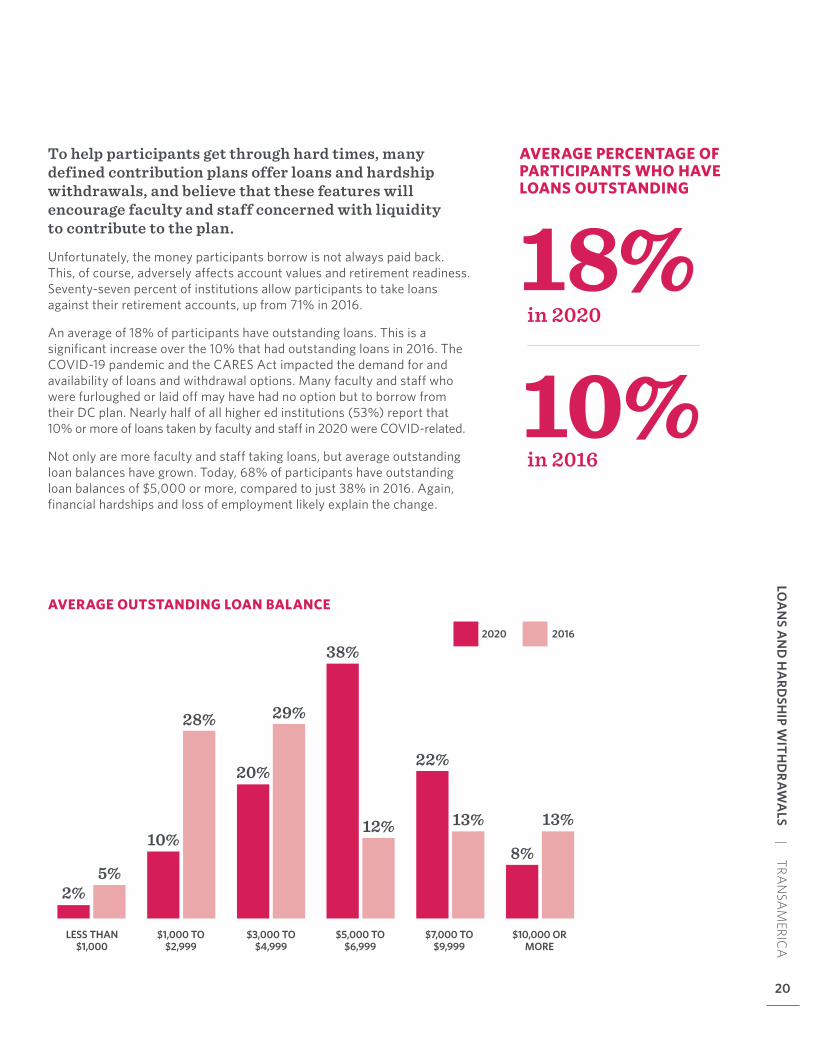
To help participants get through hard times, many defined contribution plans offer loans and hardship withdrawals, and believe that these features will encourage faculty and staff concerned with liquidity to contribute to the plan.
Unfortunately, the money participants borrow is not always paid back� This, of course, adversely affects account values and retirement readiness� Seventy-seven percent of institutions allow participants to take loans against their retirement accounts, up from 71% in 2016�
An average of 18% of participants have outstanding loans� This is a significant increase over the 10% that had outstanding loans in 2016� The COVID-19 pandemic and the CARES Act impacted the demand for and availability of loans and withdrawal options� Many faculty and staff who were furloughed or laid off may have had no option but to borrow from their DC plan� Nearly half of all higher ed institutions (53%) report that 10% or more of loans taken by faculty and staff in 2020 were COVID-related�
Not only are more faculty and staff taking loans, but average outstanding loan balances have grown� Today, 68% of participants have outstanding loan balances of $5,000 or more, compared to just 38% in 2016� Again, financial hardships and loss of employment likely explain the change�
LESS THAN $1,000
$1,000 TO $2,999
$3,000 TO $4,999
$5,000 TO $6,999
$7,000 TO $9,999
$10,000 OR MORE
2%5%
10%
28%
20%
29%
38%
12%
22%
13%
8%
13%
20162020
AVERAGE OUTSTANDING LOAN BALANCE
AVERAGE PERCENTAGE OF PARTICIPANTS WHO HAVE LOANS OUTSTANDING
20
in 2020
in 2016
18%10%
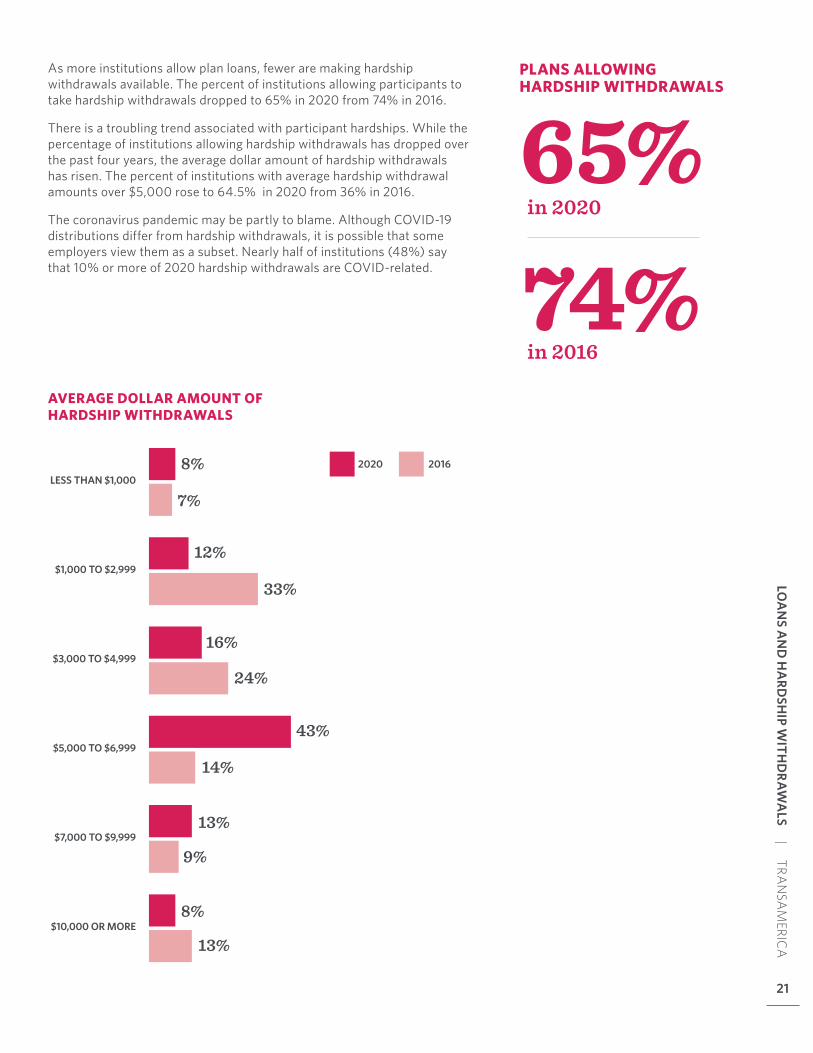
As more institutions allow plan loans, fewer are making hardship withdrawals available� The percent of institutions allowing participants to take hardship withdrawals dropped to 65% in 2020 from 74% in 2016�
There is a troubling trend associated with participant hardships� While the percentage of institutions allowing hardship withdrawals has dropped over the past four years, the average dollar amount of hardship withdrawals has risen� The percent of institutions with average hardship withdrawal amounts over $5,000 rose to 64�5% in 2020 from 36% in 2016�
The coronavirus pandemic may be partly to blame� Although COVID-19 distributions differ from hardship withdrawals, it is possible that some employers view them as a subset� Nearly half of institutions (48%) say that 10% or more of 2020 hardship withdrawals are COVID-related�
AVERAGE DOLLAR AMOUNT OF HARDSHIP WITHDRAWALS
201620208%
7%
12%
16%
24%
43%
14%
13%
13%
9%
8%
33%
LESS THAN $1,000
$1,000 TO $2,999
$3,000 TO $4,999
$5,000 TO $6,999
$7,000 TO $9,999
$10,000 OR MORE
21
LOA
NS A
ND
HA
RDSH
IP WITH
DRA
WA
LS | TRAN
SAM
ERICA
21
PLANS ALLOWING HARDSHIP WITHDRAWALS
in 2020
in 2016
65%74%
22
IMPA
CT OF CO
VID
-19 | TRAN
SAM
ERICA
COVID-19 RELATED LOANS IN 2020 AS A PERCENTAGE OF ALL LOANS
IMPACT OF COVID-19
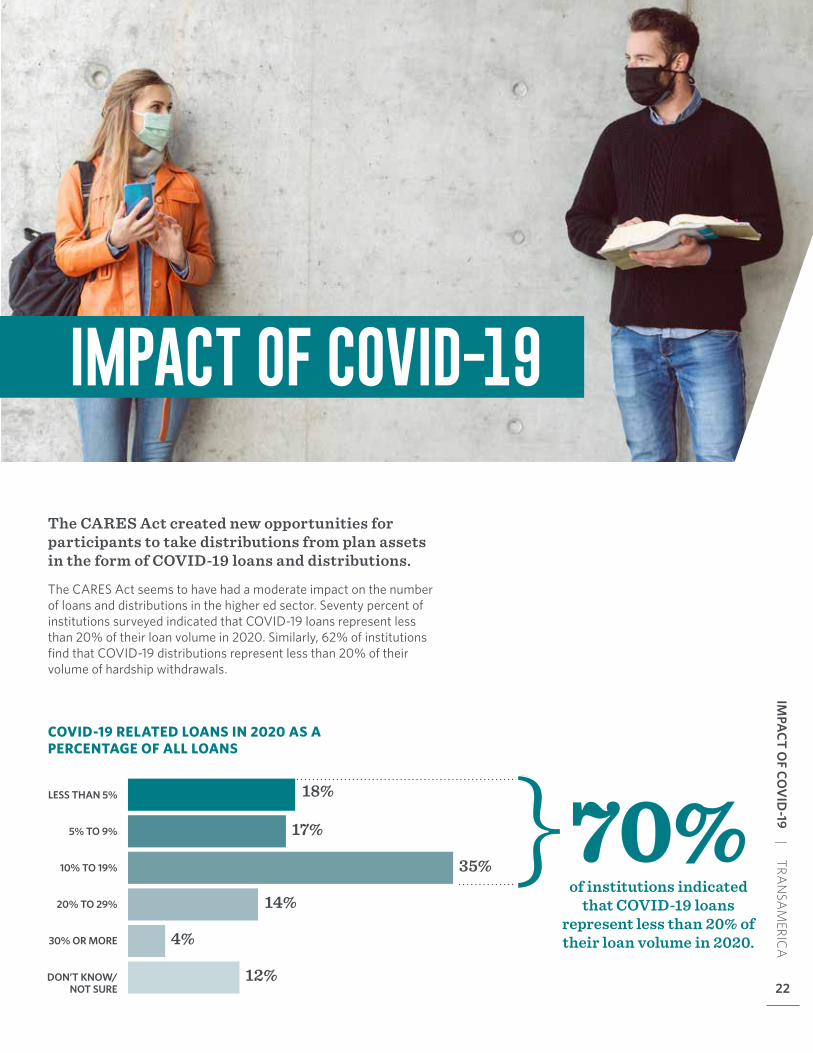
The CARES Act created new opportunities for participants to take distributions from plan assets in the form of COVID-19 loans and distributions.
The CARES Act seems to have had a moderate impact on the number of loans and distributions in the higher ed sector� Seventy percent of institutions surveyed indicated that COVID-19 loans represent less than 20% of their loan volume in 2020� Similarly, 62% of institutions find that COVID-19 distributions represent less than 20% of their volume of hardship withdrawals�
of institutions indicated that COVID-19 loans
represent less than 20% of their loan volume in 2020.
70%18%
17%
35%
14%
4%
12%
LESS THAN 5%
5% TO 9%
10% TO 19%
20% TO 29%
30% OR MORE
DON’T KNOW/NOT SURE 22
23
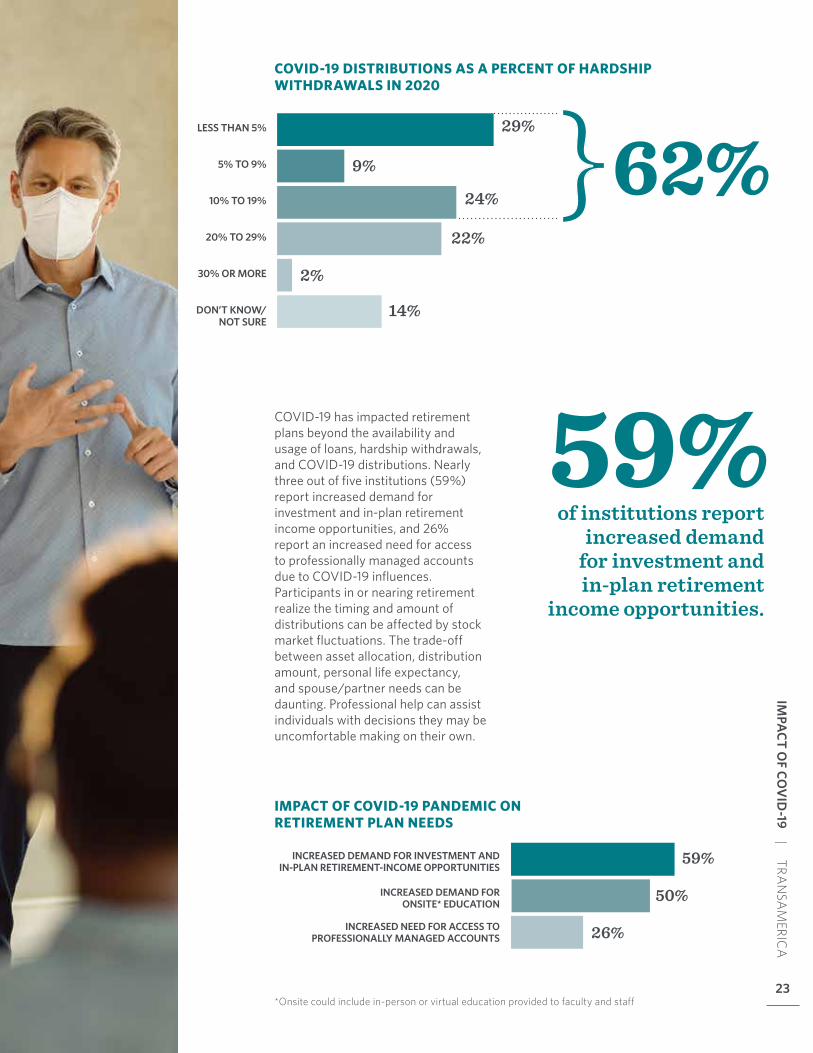
29%
9%
24%
22%
2%
14%
LESS THAN 5%
5% TO 9%
10% TO 19%
20% TO 29%
30% OR MORE
DON’T KNOW/NOT SURE
COVID-19 has impacted retirement plans beyond the availability and usage of loans, hardship withdrawals, and COVID-19 distributions� Nearly three out of five institutions (59%) report increased demand for investment and in-plan retirement income opportunities, and 26% report an increased need for access to professionally managed accounts due to COVID-19 influences� Participants in or nearing retirement realize the timing and amount of distributions can be affected by stock market fluctuations� The trade-off between asset allocation, distribution amount, personal life expectancy, and spouse/partner needs can be daunting� Professional help can assist individuals with decisions they may be uncomfortable making on their own�
*Onsite could include in-person or virtual education provided to faculty and staff
COVID-19 DISTRIBUTIONS AS A PERCENT OF HARDSHIP WITHDRAWALS IN 2020
IMPACT OF COVID-19 PANDEMIC ON RETIREMENT PLAN NEEDS
INCREASED DEMAND FOR INVESTMENT AND IN-PLAN RETIREMENT-INCOME OPPORTUNITIES
INCREASED NEED FOR ACCESS TOPROFESSIONALLY MANAGED ACCOUNTS
INCREASED DEMAND FORONSITE* EDUCATION
59%
26%
50%
of institutions report increased demand
for investment and in-plan retirement
income opportunities.
59%
23
IMPA
CT OF CO
VID
-19 | TRAN
SAM
ERICA
23
62%

24
AUTO FEATURES
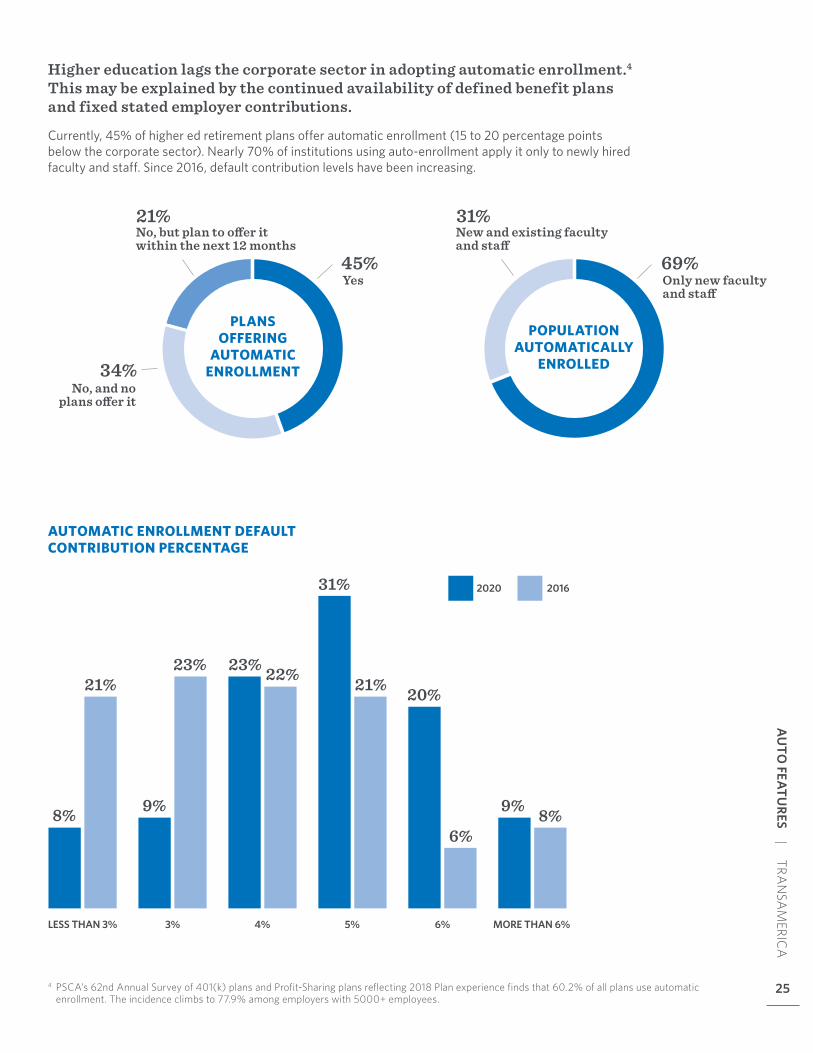
Higher education lags the corporate sector in adopting automatic enrollment.4 This may be explained by the continued availability of defined benefit plans and fixed stated employer contributions.
Currently, 45% of higher ed retirement plans offer automatic enrollment (15 to 20 percentage points below the corporate sector)� Nearly 70% of institutions using auto-enrollment apply it only to newly hired faculty and staff� Since 2016, default contribution levels have been increasing�
4 PSCA’s 62nd Annual Survey of 401(k) plans and Profit-Sharing plans reflecting 2018 Plan experience finds that 60.2% of all plans use automatic enrollment. The incidence climbs to 77.9% among employers with 5000+ employees.
POPULATION AUTOMATICALLY
ENROLLED
69%
31%New and existing facultyand staff
Only new faculty and staff
PLANS OFFERING
AUTOMATIC ENROLLMENT
45%
21%No, but plan to offer it within the next 12 months
No, and no plans offer it
Yes
34%
LESS THAN 3% 3% 4% 5% 6% MORE THAN 6%
20162020
8%
21%
9%
23% 23% 22%
31%
21% 20%
6%
9% 8%
AUTOMATIC ENROLLMENT DEFAULT CONTRIBUTION PERCENTAGE
25
AU
TO FEATU
RES | TRAN
SAM
ERICA
25
26
AU
TO FEATU
RES | TRAN
SAM
ERICA
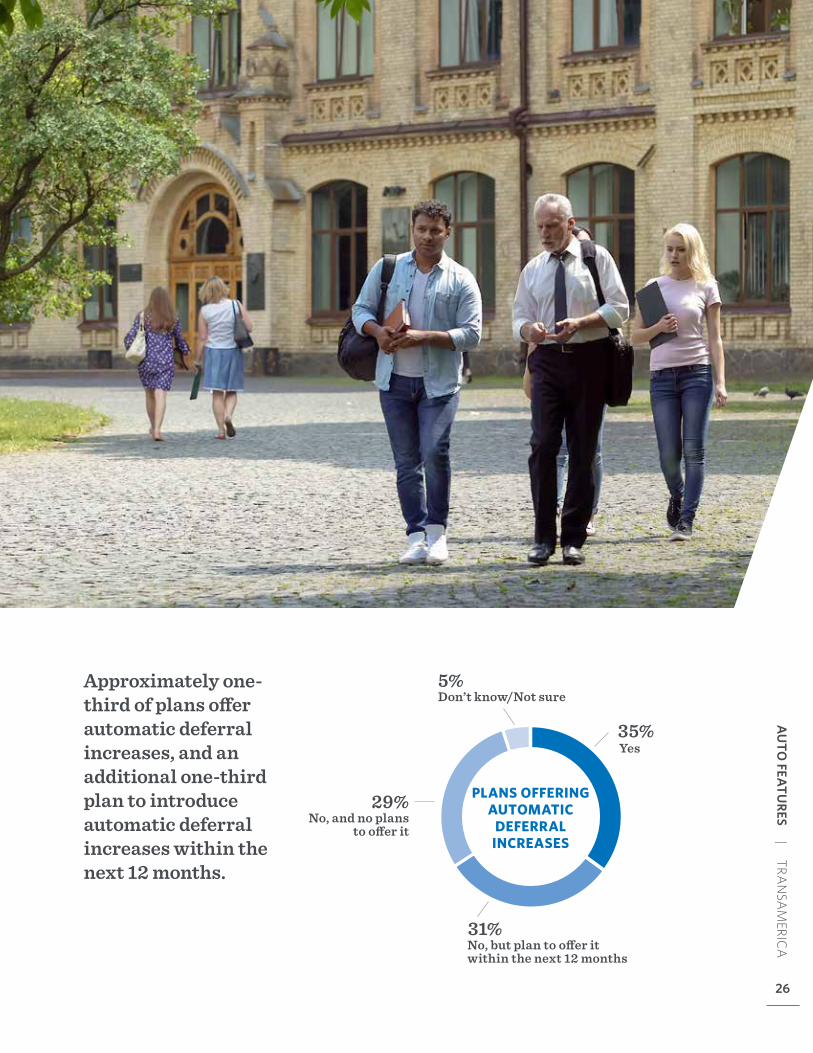
Approximately one-third of plans offer automatic deferral increases, and an additional one-third plan to introduce automatic deferral increases within the next 12 months.
PLANS OFFERING AUTOMATIC
DEFERRAL INCREASES
35%
31%
5%
29%
No, but plan to offer it within the next 12 months
Don’t know/Not sure
No, and no plans to offer it
Yes
26

2727
USE OF ADVISORSAND CONSULTANTS
28
USE O
F AD
VISO
RS AN
D CO
NSU
LTAN
TS | TRAN
SAM
ERICA
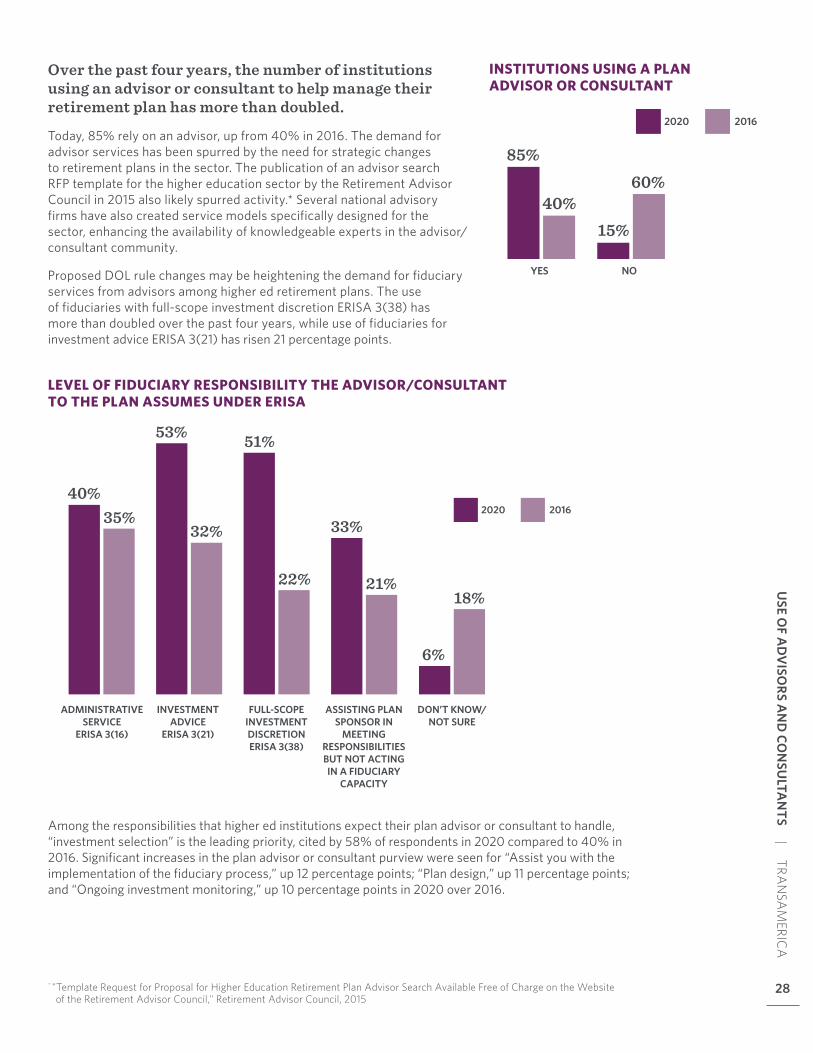
Over the past four years, the number of institutions using an advisor or consultant to help manage their retirement plan has more than doubled.
Today, 85% rely on an advisor, up from 40% in 2016� The demand for advisor services has been spurred by the need for strategic changes to retirement plans in the sector� The publication of an advisor search RFP template for the higher education sector by the Retirement Advisor Council in 2015 also likely spurred activity�* Several national advisory firms have also created service models specifically designed for the sector, enhancing the availability of knowledgeable experts in the advisor/consultant community�
Proposed DOL rule changes may be heightening the demand for fiduciary services from advisors among higher ed retirement plans� The use of fiduciaries with full-scope investment discretion ERISA 3(38) has more than doubled over the past four years, while use of fiduciaries for investment advice ERISA 3(21) has risen 21 percentage points�
Among the responsibilities that higher ed institutions expect their plan advisor or consultant to handle, “investment selection” is the leading priority, cited by 58% of respondents in 2020 compared to 40% in 2016� Significant increases in the plan advisor or consultant purview were seen for “Assist you with the implementation of the fiduciary process,” up 12 percentage points; “Plan design,” up 11 percentage points; and “Ongoing investment monitoring,” up 10 percentage points in 2020 over 2016�
YES NO
85%
40%15%
60%
20162020
* "Template Request for Proposal for Higher Education Retirement Plan Advisor Search Available Free of Charge on the Website of the Retirement Advisor Council," Retirement Advisor Council, 2015
40%35%
53%
32%
51%
22%
33%
21%18%
6%
20162020
ADMINISTRATIVE SERVICE
ERISA 3(16)
INVESTMENT ADVICE
ERISA 3(21)
FULL-SCOPE INVESTMENTDISCRETION ERISA 3(38)
ASSISTING PLAN SPONSOR IN
MEETING RESPONSIBILITIESBUT NOT ACTING IN A FIDUCIARY
CAPACITY
DON’T KNOW/NOT SURE
INSTITUTIONS USING A PLAN ADVISOR OR CONSULTANT
LEVEL OF FIDUCIARY RESPONSIBILITY THE ADVISOR/CONSULTANT TO THE PLAN ASSUMES UNDER ERISA
28
19%
7%
47%45%
21%
28%
12%
21%
20162020
MONTHLY ANNUALLYQUARTERLY SEMI-ANNUALLY
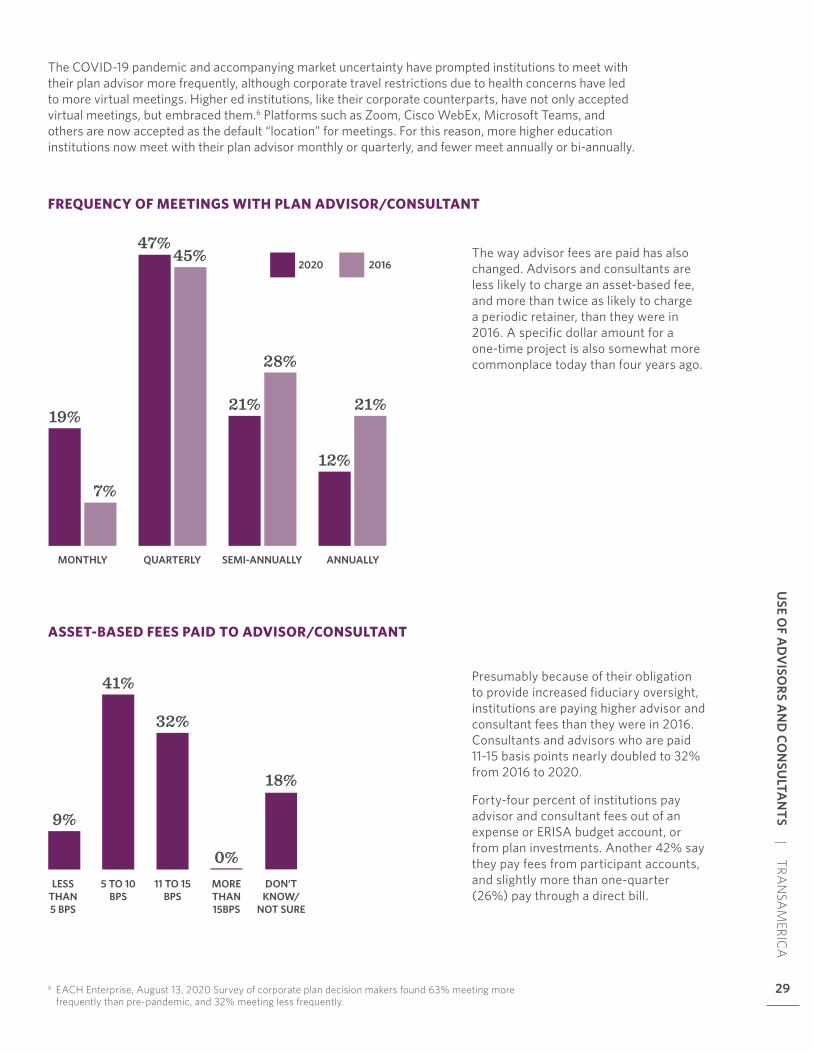
The way advisor fees are paid has also changed� Advisors and consultants are less likely to charge an asset-based fee, and more than twice as likely to charge a periodic retainer, than they were in 2016� A specific dollar amount for a one-time project is also somewhat more commonplace today than four years ago�
9%
41%
32%
0%
18%
LESS THAN5 BPS
5 TO 10 BPS
11 TO 15 BPS
MORE THAN 15BPS
DON’T KNOW/
NOT SURE
Presumably because of their obligation to provide increased fiduciary oversight, institutions are paying higher advisor and consultant fees than they were in 2016� Consultants and advisors who are paid 11-15 basis points nearly doubled to 32% from 2016 to 2020�
Forty-four percent of institutions pay advisor and consultant fees out of an expense or ERISA budget account, or from plan investments� Another 42% say they pay fees from participant accounts, and slightly more than one-quarter (26%) pay through a direct bill�
FREQUENCY OF MEETINGS WITH PLAN ADVISOR/CONSULTANT
ASSET-BASED FEES PAID TO ADVISOR/CONSULTANT
29
USE O
F AD
VISO
RS AN
D CO
NSU
LTAN
TS | TRAN
SAM
ERICA
29
The COVID-19 pandemic and accompanying market uncertainty have prompted institutions to meet with their plan advisor more frequently, although corporate travel restrictions due to health concerns have led to more virtual meetings� Higher ed institutions, like their corporate counterparts, have not only accepted virtual meetings, but embraced them�6 Platforms such as Zoom, Cisco WebEx, Microsoft Teams, and others are now accepted as the default “location” for meetings� For this reason, more higher education institutions now meet with their plan advisor monthly or quarterly, and fewer meet annually or bi-annually�
6 EACH Enterprise, August 13, 2020 Survey of corporate plan decision makers found 63% meeting more frequently than pre-pandemic, and 32% meeting less frequently.

30 30
INVESTMENT ARRAYSAND PLAN SERVICES
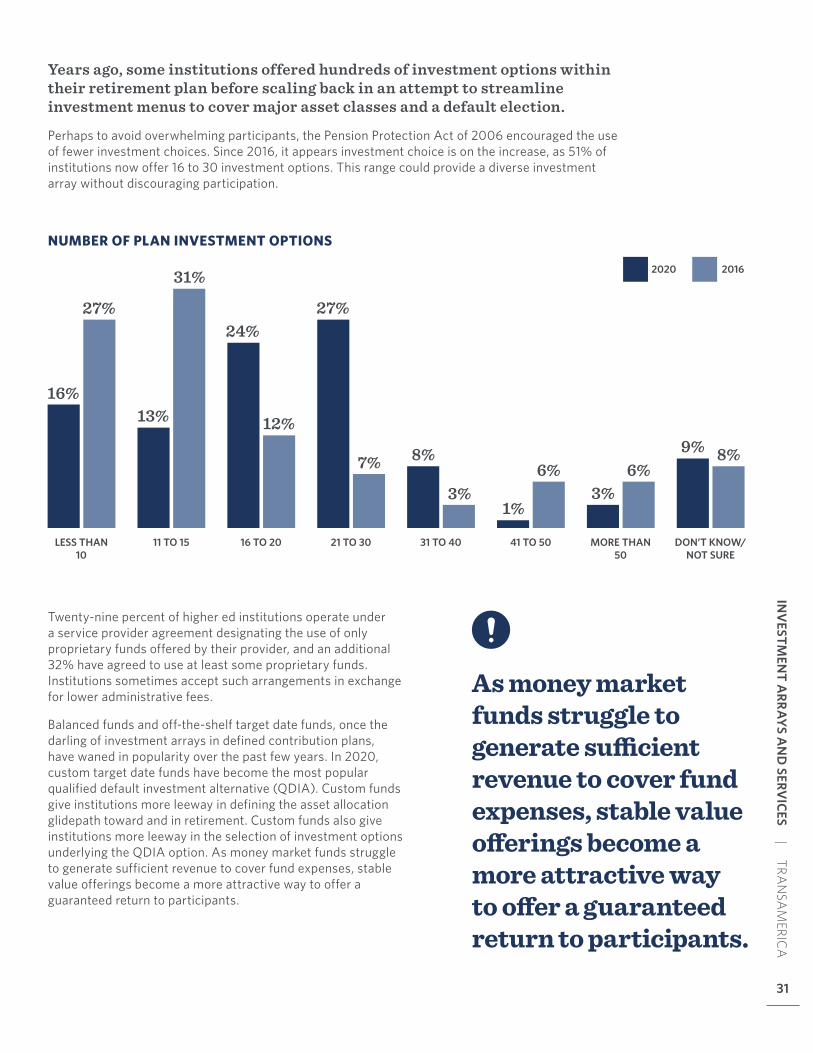
Years ago, some institutions offered hundreds of investment options within their retirement plan before scaling back in an attempt to streamline investment menus to cover major asset classes and a default election.
Perhaps to avoid overwhelming participants, the Pension Protection Act of 2006 encouraged the use of fewer investment choices� Since 2016, it appears investment choice is on the increase, as 51% of institutions now offer 16 to 30 investment options� This range could provide a diverse investment array without discouraging participation�
Twenty-nine percent of higher ed institutions operate under a service provider agreement designating the use of only proprietary funds offered by their provider, and an additional 32% have agreed to use at least some proprietary funds� Institutions sometimes accept such arrangements in exchange for lower administrative fees�
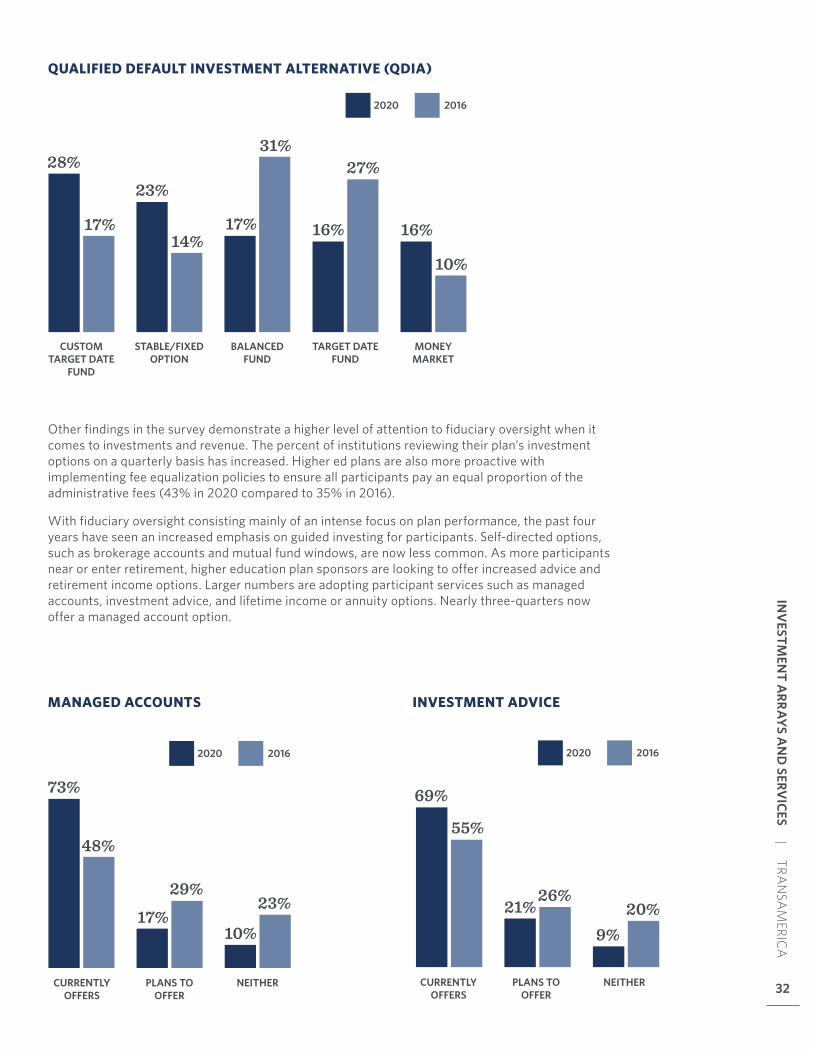
Balanced funds and off-the-shelf target date funds, once the darling of investment arrays in defined contribution plans, have waned in popularity over the past few years� In 2020, custom target date funds have become the most popular qualified default investment alternative (QDIA)� Custom funds give institutions more leeway in defining the asset allocation glidepath toward and in retirement� Custom funds also give institutions more leeway in the selection of investment options underlying the QDIA option� As money market funds struggle to generate sufficient revenue to cover fund expenses, stable value offerings become a more attractive way to offer a guaranteed return to participants�
As money market funds struggle to generate sufficient revenue to cover fund expenses, stable value offerings become a more attractive way to offer a guaranteed return to participants.
16%
27%
13%
31%
24%
12%
27%
7% 8%
3%1%
6%3%
6%9% 8%
20162020
LESS THAN10
11 TO 15 16 TO 20 21 TO 30 31 TO 40 41 TO 50 MORE THAN 50
DON’T KNOW/ NOT SURE
NUMBER OF PLAN INVESTMENT OPTIONS
31
INV
ESTMEN
T ARRAYS A
ND
SERVICES | TRA
NSA
MERIC
A
31
32
INV
ESTMEN
T ARRAYS A
ND
SERVICES | TRA
NSA
MERIC
A
32
Other findings in the survey demonstrate a higher level of attention to fiduciary oversight when it comes to investments and revenue� The percent of institutions reviewing their plan’s investment options on a quarterly basis has increased� Higher ed plans are also more proactive with implementing fee equalization policies to ensure all participants pay an equal proportion of the administrative fees (43% in 2020 compared to 35% in 2016)�
With fiduciary oversight consisting mainly of an intense focus on plan performance, the past four years have seen an increased emphasis on guided investing for participants� Self-directed options, such as brokerage accounts and mutual fund windows, are now less common� As more participants near or enter retirement, higher education plan sponsors are looking to offer increased advice and retirement income options� Larger numbers are adopting participant services such as managed accounts, investment advice, and lifetime income or annuity options� Nearly three-quarters now offer a managed account option�
QUALIFIED DEFAULT INVESTMENT ALTERNATIVE (QDIA)
MANAGED ACCOUNTS INVESTMENT ADVICE
28%
17%
23%
14%17%
31%
16%
27%
16%
10%
20162020
CUSTOM TARGET DATE
FUND
STABLE/FIXED OPTION
BALANCED FUND
TARGET DATE FUND
MONEY MARKET
73%
48%
17%29%
10%23%
20162020
CURRENTLYOFFERS
PLANS TO OFFER
NEITHER
69%
55%
21%26%
9%20%
20162020
CURRENTLYOFFERS
PLANS TO OFFER
NEITHER
33
INV
ESTMEN
T ARRAYS A
ND
SERVICES | TRA
NSA
MERIC
A
33
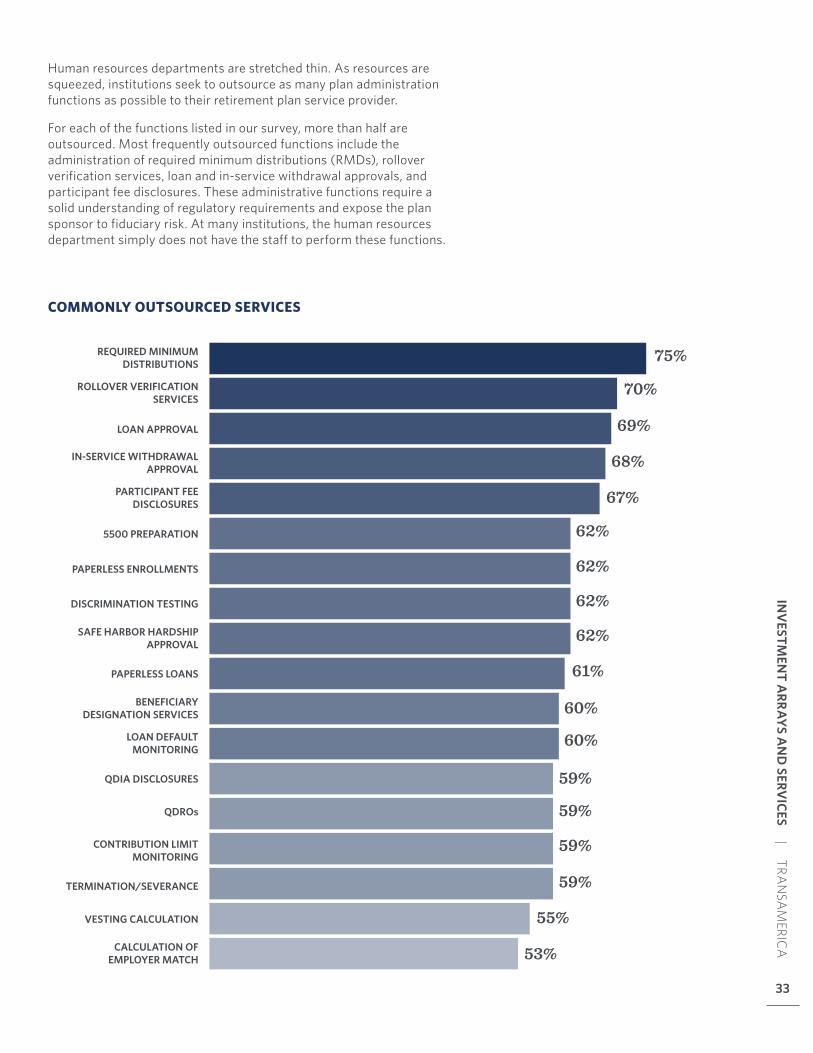
Human resources departments are stretched thin� As resources are squeezed, institutions seek to outsource as many plan administration functions as possible to their retirement plan service provider�
For each of the functions listed in our survey, more than half are outsourced� Most frequently outsourced functions include the administration of required minimum distributions (RMDs), rollover verification services, loan and in-service withdrawal approvals, and participant fee disclosures� These administrative functions require a solid understanding of regulatory requirements and expose the plan sponsor to fiduciary risk� At many institutions, the human resources department simply does not have the staff to perform these functions�
75%
70%
69%
68%
67%
62%
62%
62%
62%
61%
60%
60%
59%
59%
59%
59%
55%
53%
REQUIRED MINIMUM DISTRIBUTIONS
ROLLOVER VERIFICATION SERVICES
LOAN APPROVAL
IN-SERVICE WITHDRAWAL APPROVAL
PARTICIPANT FEE DISCLOSURES
5500 PREPARATION
PAPERLESS ENROLLMENTS
DISCRIMINATION TESTING
SAFE HARBOR HARDSHIP APPROVAL
PAPERLESS LOANS
BENEFICIARY DESIGNATION SERVICES
LOAN DEFAULT MONITORING
QDIA DISCLOSURES
QDROs
CONTRIBUTION LIMIT MONITORING
CALCULATION OF EMPLOYER MATCH
TERMINATION/SEVERANCE
VESTING CALCULATION
COMMONLY OUTSOURCED SERVICES
34
INV
ESTMEN
T ARRAYS A
ND
SERVICES | TRA
NSA
MERIC
A
34
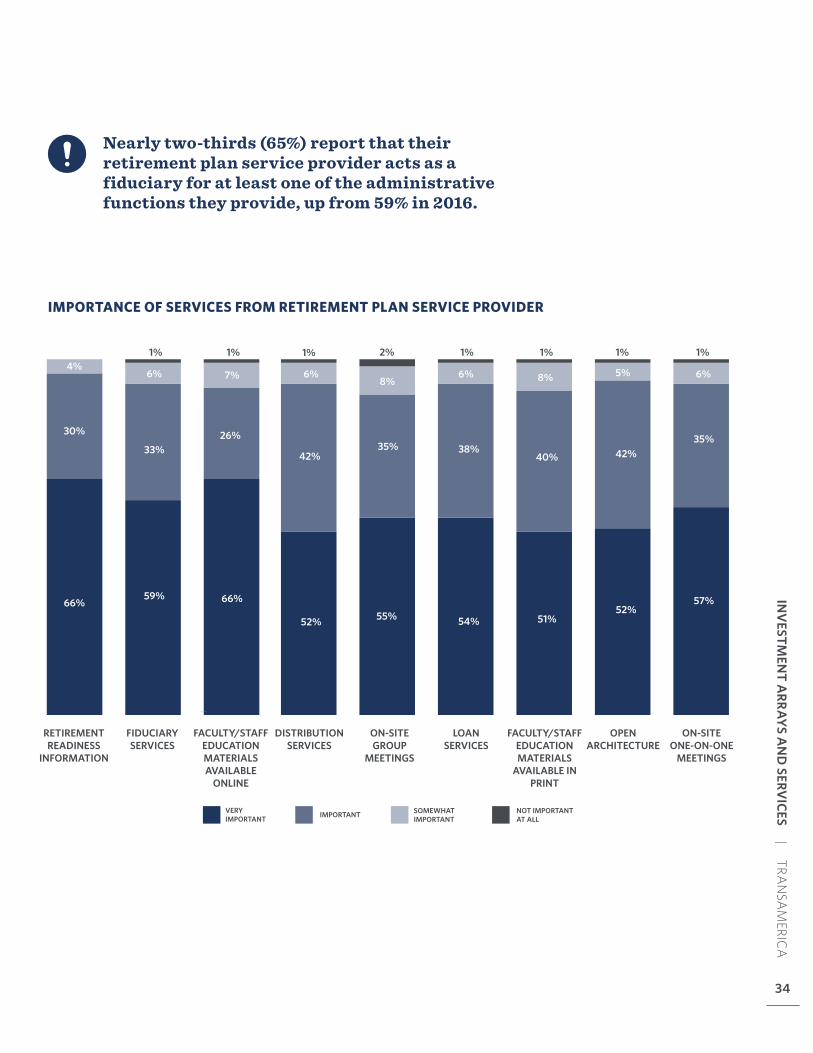
IMPORTANCE OF SERVICES FROM RETIREMENT PLAN SERVICE PROVIDER
Nearly two-thirds (65%) report that their retirement plan service provider acts as a fiduciary for at least one of the administrative functions they provide, up from 59% in 2016.
NOT IMPORTANT AT ALL
SOMEWHAT IMPORTANTIMPORTANTVERY
IMPORTANT
RETIREMENTREADINESS
INFORMATION
FIDUCIARYSERVICES
FACULTY/STAFF EDUCATIONMATERIALSAVAILABLE
ONLINE
DISTRIBUTIONSERVICES
LOANSERVICES
FACULTY/STAFFEDUCATIONMATERIALS
AVAILABLE IN PRINT
OPEN ARCHITECTURE
ON-SITE ONE-ON-ONE
MEETINGS
30%
66%
4%
33%26%
42%35%
40% 42%35%
57%52%
51%
38%
54%
59% 66%
7%
52%
6% 5%6% 6%8% 8%
55%
6%
6%
1% 1% 1%1% 2% 1% 1% 1%
ON-SITE GROUP
MEETINGS
35
DED
ICATED REPRESEN
TATIVES | TRA
NSA
MERIC
A
DEDICATEDREPRESENTATIVES
35
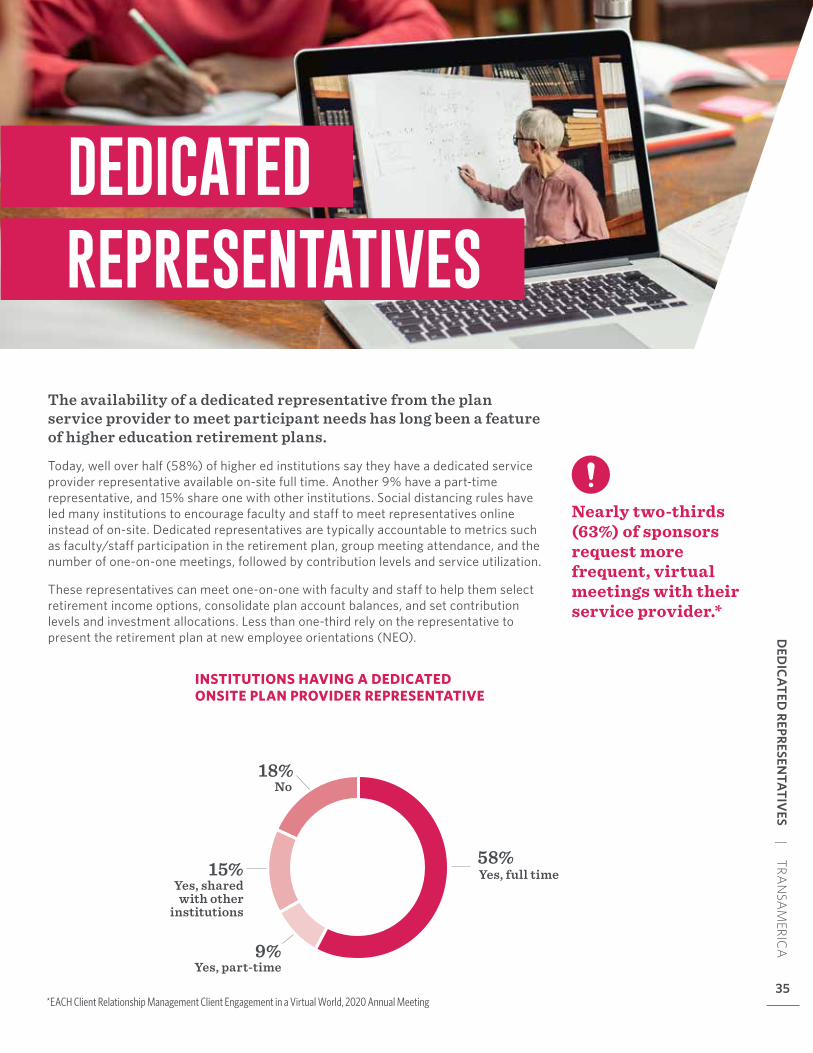
The availability of a dedicated representative from the plan service provider to meet participant needs has long been a feature of higher education retirement plans.
Today, well over half (58%) of higher ed institutions say they have a dedicated service provider representative available on-site full time� Another 9% have a part-time representative, and 15% share one with other institutions� Social distancing rules have led many institutions to encourage faculty and staff to meet representatives online instead of on-site� Dedicated representatives are typically accountable to metrics such as faculty/staff participation in the retirement plan, group meeting attendance, and the number of one-on-one meetings, followed by contribution levels and service utilization�
These representatives can meet one-on-one with faculty and staff to help them select retirement income options, consolidate plan account balances, and set contribution levels and investment allocations� Less than one-third rely on the representative to present the retirement plan at new employee orientations (NEO)�
58%15%
18%
9%
Yes, shared with other
institutions
No
Yes, part-time
Yes, full time
INSTITUTIONS HAVING A DEDICATED ONSITE PLAN PROVIDER REPRESENTATIVE
*EACH Client Relationship Management Client Engagement in a Virtual World, 2020 Annual Meeting
Nearly two-thirds (63%) of sponsors request more frequent, virtual meetings with their service provider.*
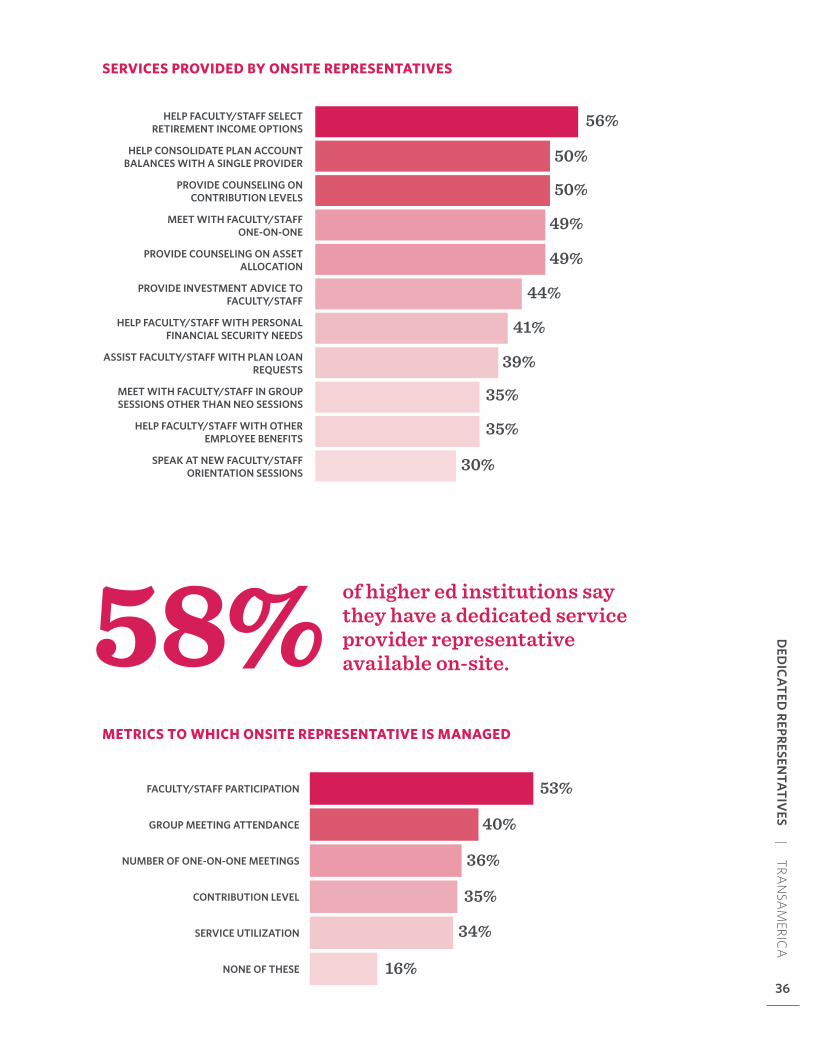
SERVICES PROVIDED BY ONSITE REPRESENTATIVES
METRICS TO WHICH ONSITE REPRESENTATIVE IS MANAGED
56%
50%
50%
49%
49%
44%
41%
39%
35%
35%
30%
HELP FACULTY/STAFF SELECT RETIREMENT INCOME OPTIONS
HELP CONSOLIDATE PLAN ACCOUNT BALANCES WITH A SINGLE PROVIDER
PROVIDE COUNSELING ON CONTRIBUTION LEVELS
MEET WITH FACULTY/STAFF ONE-ON-ONE
PROVIDE COUNSELING ON ASSET ALLOCATION
PROVIDE INVESTMENT ADVICE TO FACULTY/STAFF
HELP FACULTY/STAFF WITH PERSONAL FINANCIAL SECURITY NEEDS
ASSIST FACULTY/STAFF WITH PLAN LOAN REQUESTS
MEET WITH FACULTY/STAFF IN GROUP SESSIONS OTHER THAN NEO SESSIONS
HELP FACULTY/STAFF WITH OTHER EMPLOYEE BENEFITS
SPEAK AT NEW FACULTY/STAFF ORIENTATION SESSIONS
53%
40%
36%
35%
34%
16%
FACULTY/STAFF PARTICIPATION
GROUP MEETING ATTENDANCE
NUMBER OF ONE-ON-ONE MEETINGS
CONTRIBUTION LEVEL
SERVICE UTILIZATION
NONE OF THESE
of higher ed institutions say they have a dedicated service provider representative available on-site.58%
36
DED
ICATED REPRESEN
TATIVES | TRA
NSA
MERIC
A
36

37 37
FINANCIAL WELLNESS
66%
61%
51%
45%
38%
25%
25%
8%
7%
HEALTHCARE SAVINGS
RETIREMENT PREPAREDNESS
EMERGENCY SAVINGS
PROTECTION/INSURANCE COVERAGE
STUDENT DEBT
MORTGAGE DEBT
CREDIT CARD DEBT
SAVING FOR CHILDREN’S EDUCATION
INVESTMENT RISK
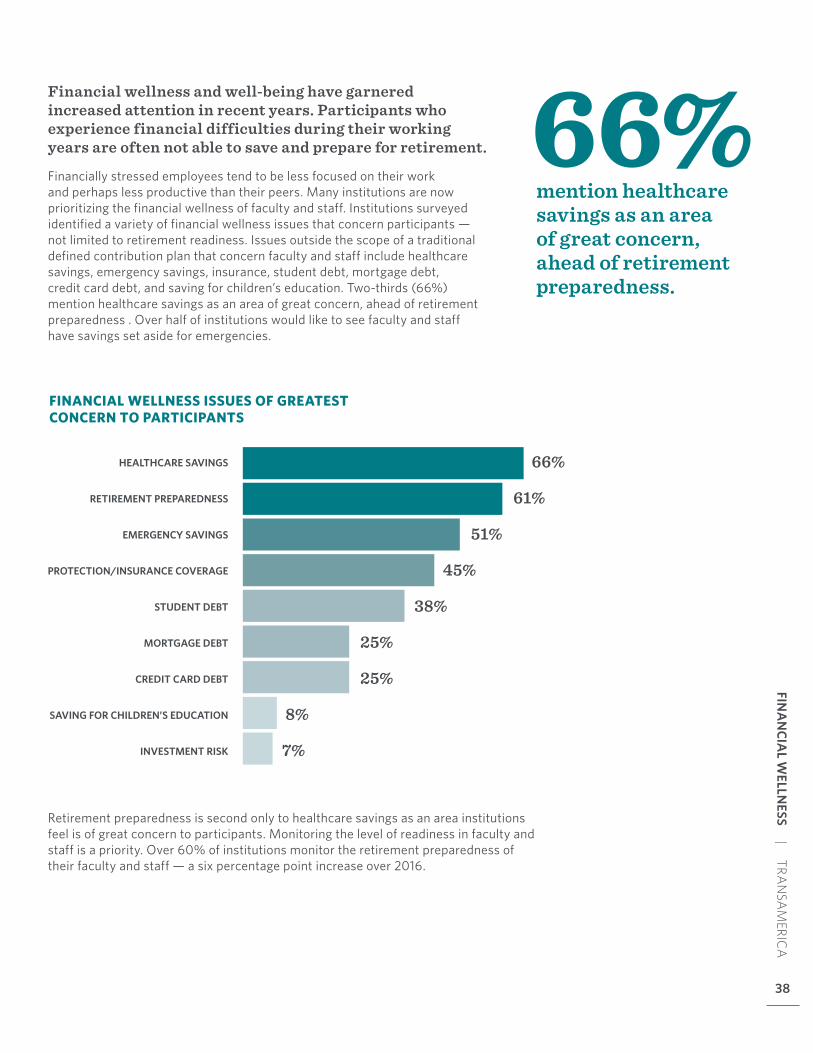
Financial wellness and well-being have garnered increased attention in recent years. Participants who experience financial difficulties during their working years are often not able to save and prepare for retirement.
Financially stressed employees tend to be less focused on their work and perhaps less productive than their peers� Many institutions are now prioritizing the financial wellness of faculty and staff� Institutions surveyed identified a variety of financial wellness issues that concern participants — not limited to retirement readiness� Issues outside the scope of a traditional defined contribution plan that concern faculty and staff include healthcare savings, emergency savings, insurance, student debt, mortgage debt, credit card debt, and saving for children’s education� Two-thirds (66%) mention healthcare savings as an area of great concern, ahead of retirement preparedness � Over half of institutions would like to see faculty and staff have savings set aside for emergencies�
Retirement preparedness is second only to healthcare savings as an area institutions feel is of great concern to participants� Monitoring the level of readiness in faculty and staff is a priority� Over 60% of institutions monitor the retirement preparedness of their faculty and staff — a six percentage point increase over 2016�
FINANCIAL WELLNESS ISSUES OF GREATEST CONCERN TO PARTICIPANTS
mention healthcare savings as an area of great concern, ahead of retirement preparedness.
66%
38
FINA
NCIA
L WELLN
ESS | TRAN
SAM
ERICA
38
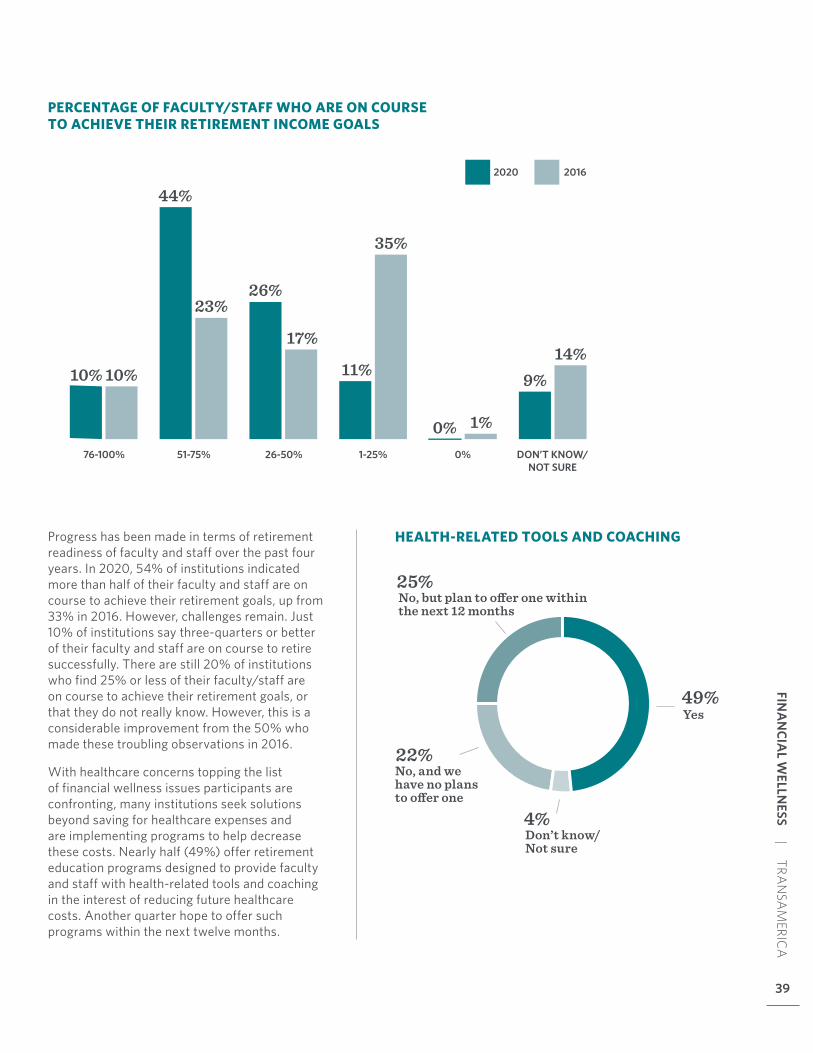
Progress has been made in terms of retirement readiness of faculty and staff over the past four years� In 2020, 54% of institutions indicated more than half of their faculty and staff are on course to achieve their retirement goals, up from 33% in 2016� However, challenges remain� Just 10% of institutions say three-quarters or better of their faculty and staff are on course to retire successfully� There are still 20% of institutions who find 25% or less of their faculty/staff are on course to achieve their retirement goals, or that they do not really know� However, this is a considerable improvement from the 50% who made these troubling observations in 2016�
With healthcare concerns topping the list of financial wellness issues participants are confronting, many institutions seek solutions beyond saving for healthcare expenses and are implementing programs to help decrease these costs� Nearly half (49%) offer retirement education programs designed to provide faculty and staff with health-related tools and coaching in the interest of reducing future healthcare costs� Another quarter hope to offer such programs within the next twelve months�
PERCENTAGE OF FACULTY/STAFF WHO ARE ON COURSE TO ACHIEVE THEIR RETIREMENT INCOME GOALS
20162020
10%10%
44%
26%
17%
11%
35%
0% 1%
9%14%
23%
76-100% 51-75% 26-50% 1-25% 0% DON’T KNOW/ NOT SURE
49%
25%
22%
4%
No, but plan to offer one within the next 12 months
No, and we have no plans to offer one
Don’t know/ Not sure
Yes
HEALTH-RELATED TOOLS AND COACHING
39
FINA
NCIA
L WELLN
ESS | TRAN
SAM
ERICA
39

40 40
DEFININGPLAN SUCCESS
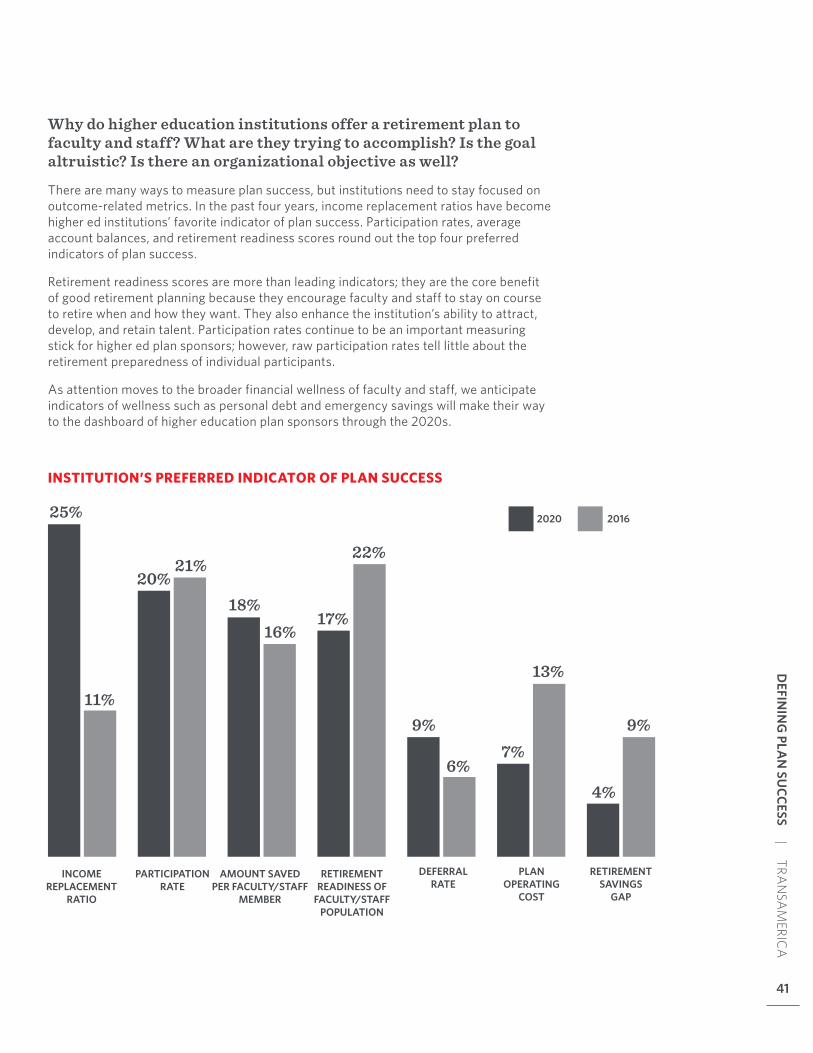
Why do higher education institutions offer a retirement plan to faculty and staff? What are they trying to accomplish? Is the goal altruistic? Is there an organizational objective as well?
There are many ways to measure plan success, but institutions need to stay focused on outcome-related metrics� In the past four years, income replacement ratios have become higher ed institutions’ favorite indicator of plan success� Participation rates, average account balances, and retirement readiness scores round out the top four preferred indicators of plan success�
Retirement readiness scores are more than leading indicators; they are the core benefit of good retirement planning because they encourage faculty and staff to stay on course to retire when and how they want� They also enhance the institution’s ability to attract, develop, and retain talent� Participation rates continue to be an important measuring stick for higher ed plan sponsors; however, raw participation rates tell little about the retirement preparedness of individual participants�
As attention moves to the broader financial wellness of faculty and staff, we anticipate indicators of wellness such as personal debt and emergency savings will make their way to the dashboard of higher education plan sponsors through the 2020s�
INSTITUTION’S PREFERRED INDICATOR OF PLAN SUCCESS
INCOME REPLACEMENT
RATIO
PARTICIPATION RATE
AMOUNT SAVED PER FACULTY/STAFF
MEMBER
RETIREMENT READINESS OF
FACULTY/STAFF POPULATION
DEFERRAL RATE
PLAN OPERATING
COST
RETIREMENT SAVINGS
GAP
25%
11%
20%21%
18%17%
22%
9%
6%7%
13%
4%
9%
16%
20162020
41
DEFIN
ING
PLAN
SUCCESS | TRA
NSA
MERIC
A
41
42
DEFIN
ING
PLAN
SUCCESS | TRA
NSA
MERIC
A
42
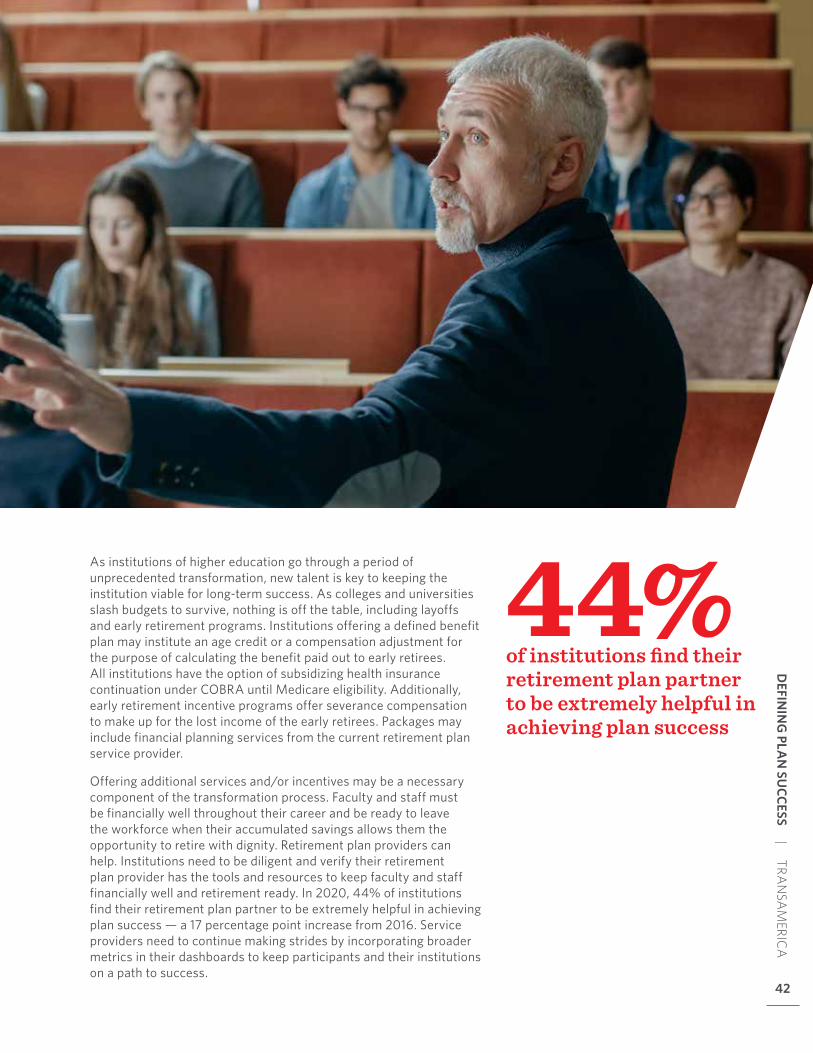
As institutions of higher education go through a period of unprecedented transformation, new talent is key to keeping the institution viable for long-term success� As colleges and universities slash budgets to survive, nothing is off the table, including layoffs and early retirement programs� Institutions offering a defined benefit plan may institute an age credit or a compensation adjustment for the purpose of calculating the benefit paid out to early retirees� All institutions have the option of subsidizing health insurance continuation under COBRA until Medicare eligibility� Additionally, early retirement incentive programs offer severance compensation to make up for the lost income of the early retirees� Packages may include financial planning services from the current retirement plan service provider�
Offering additional services and/or incentives may be a necessary component of the transformation process� Faculty and staff must be financially well throughout their career and be ready to leave the workforce when their accumulated savings allows them the opportunity to retire with dignity� Retirement plan providers can help� Institutions need to be diligent and verify their retirement plan provider has the tools and resources to keep faculty and staff financially well and retirement ready� In 2020, 44% of institutions find their retirement plan partner to be extremely helpful in achieving plan success — a 17 percentage point increase from 2016� Service providers need to continue making strides by incorporating broader metrics in their dashboards to keep participants and their institutions on a path to success�
of institutions find their retirement plan partner to be extremely helpful in achieving plan success
44%

43 43
ABOUT THE SURVEY
44
ABO
UT TH
E SURV
EY | TRA
NSA
MERIC
A
44
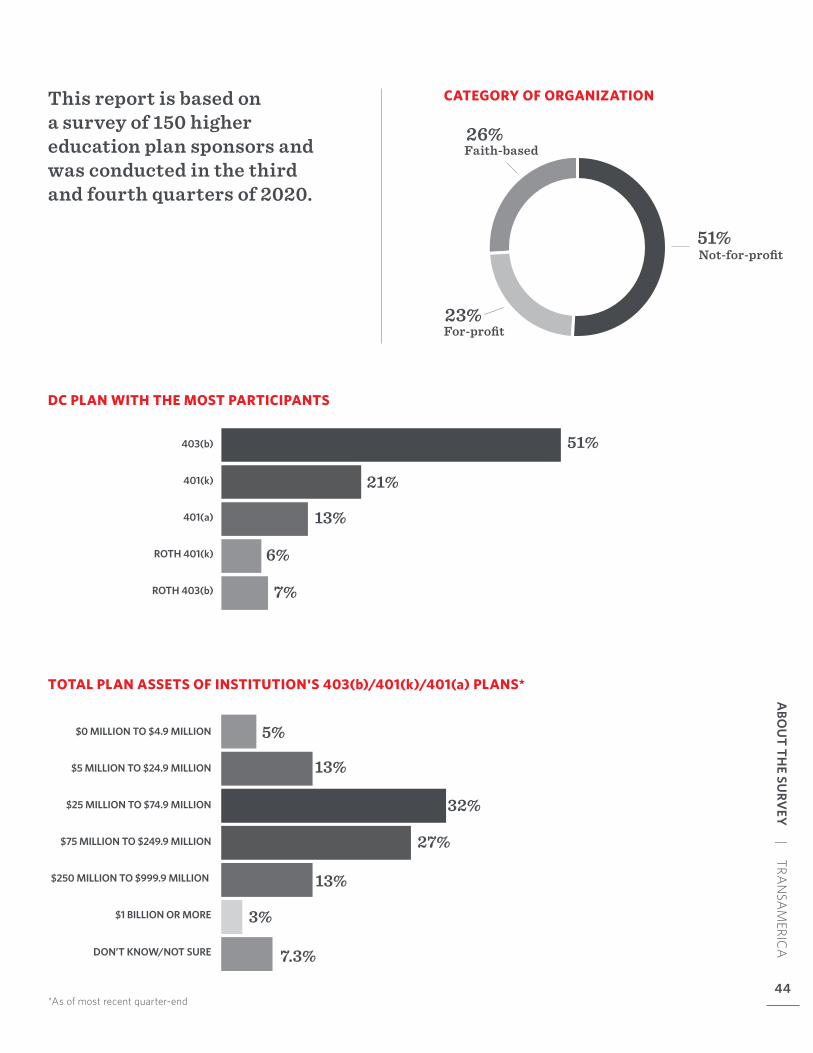
This report is based on a survey of 150 higher education plan sponsors and was conducted in the third and fourth quarters of 2020.
CATEGORY OF ORGANIZATION
51%
26%
23%
Faith-based
For-profit
Not-for-profit
DC PLAN WITH THE MOST PARTICIPANTS
403(b)
401(k)
401(a)
ROTH 401(k)
ROTH 403(b)
13%
6%
7%
21%
51%
TOTAL PLAN ASSETS OF INSTITUTION'S 403(b)/401(k)/401(a) PLANS*
$0 MILLION TO $4.9 MILLION
$5 MILLION TO $24.9 MILLION
$25 MILLION TO $74.9 MILLION
$75 MILLION TO $249.9 MILLION
$250 MILLION TO $999.9 MILLION
$1 BILLION OR MORE
DON’T KNOW/NOT SURE
3%
32%
5%
13%
27%
7.3%
13%
*As of most recent quarter-end
Before adopting any plan you should carefully consider all of the benefits, risks, and costs associated with a plan. Information regarding retirement plans is general and is not intended as legal or tax advice. Retirement plans are complex, and the federal and state laws or regulations on which they are based vary for each type of plan and are subject to change. In addition, some products, investment vehicles, and services may not be available or appropriate in all workplace retirement plans. Plan sponsors and plan administrators may wish to seek the advice of legal counsel or a tax professional to address their specific situations. Transamerica does not serve as a 3(16) plan fiduciary.
270956 © 2021 Transamerica Retirement Solutions, LLC 01/21
Want more information about the solutions Transamerica can offer your retirement plan?
Visit: Transamerica�com