Embed Size (px)
Citation preview
Trends in Cross Border Distribution
September 2012
Trends in Cross Border Distribution
September 2012
© Spence Johnson Ltd 2012 Private and Confidential Not for Circulation
2
Introduction
Cross-border fund managers and their distribution partners continue to face a challenging environment in Europe. Mutual funds are facing stiff competition from bank deposits and insurance as market turbulence continues to suppress risk appetite. Meanwhile the stagnant economic climate is resulting in asset managers looking for growth opportunities by distributing funds to new markets.
Cross border distribution is becoming increasingly resource intensive as distribution partners are becoming more sophisticated in an attempt to meet investors’ more stringent due diligence requirements. Extra resources coupled with fee pressure creates capacity issues which are resulting in many central product selection units being more discerning about which funds make their preferred lists. Greater due diligence requirements in turn put more strain on fund manager resources to meet the greater level of information requests required by distributers, placing tremendous importance on economies of scale and business efficiencies.
The UCITS IV toolkit promised solutions for streamlining cross border distribution and facilitating scale, but many fund managers have yet to overcome the obstacles in implementing the new structures. UCITS IV may have eased the regulatory requirement of management companies in each market but the commercial realities still dictate a presence on the ground. Despite the potential for a centralized legal entity, asset managers must retain local sales offices in order to facilitate relationships with their distributors. UCITS IV may in time bring some meaningful benefits for the industry but the commercial trends still point towards challenging times ahead for providers.
This report has been prepared for the Association of the Luxembourg Fund Industry (ALFI)
Trends in Cross Border Distribution
September 2012
© Spence Johnson Ltd 2012 Private and Confidential Not for Circulation
3
Executive Summary
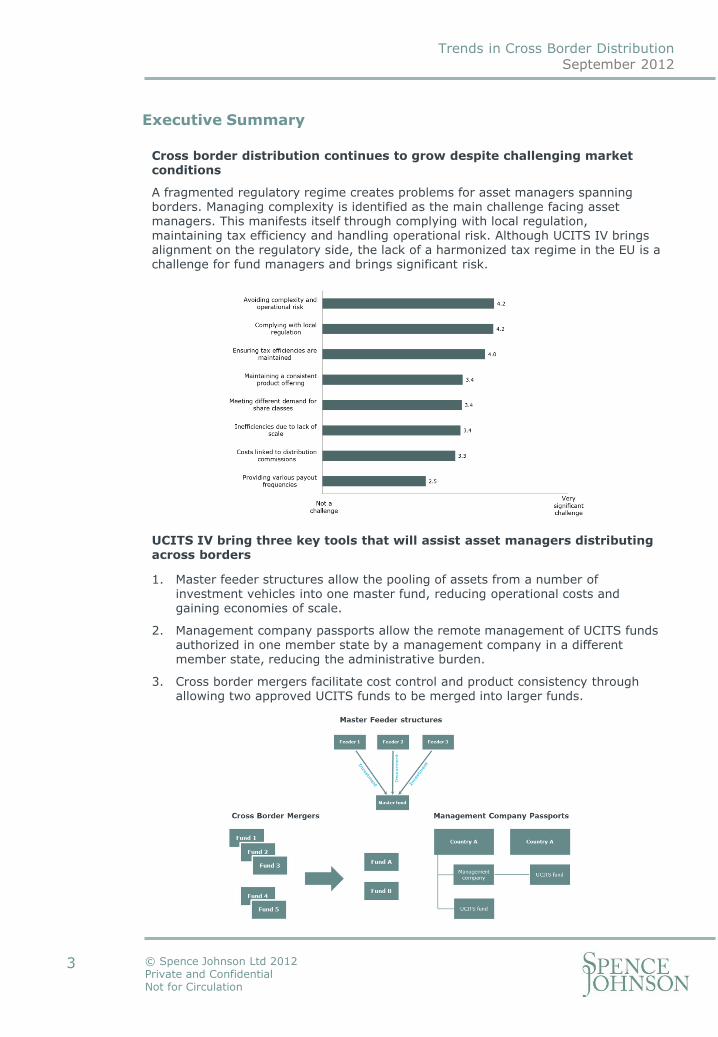
Cross border distribution continues to grow despite challenging market conditions
A fragmented regulatory regime creates problems for asset managers spanning borders. Managing complexity is identified as the main challenge facing asset managers. This manifests itself through complying with local regulation, maintaining tax efficiency and handling operational risk. Although UCITS IV brings alignment on the regulatory side, the lack of a harmonized tax regime in the EU is a challenge for fund managers and brings significant risk.
1. Master feeder structures allow the pooling of assets from a number of investment vehicles into one master fund, reducing operational costs and gaining economies of scale.
2. Management company passports allow the remote management of UCITS funds authorized in one member state by a management company in a different member state, reducing the administrative burden.
3. Cross border mergers facilitate cost control and product consistency through allowing two approved UCITS funds to be merged into larger funds.
UCITS IV bring three key tools that will assist asset managers distributing across borders
Trends in Cross Border Distribution
September 2012
© Spence Johnson Ltd 2012 Private and Confidential Not for Circulation
4
Executive Summary
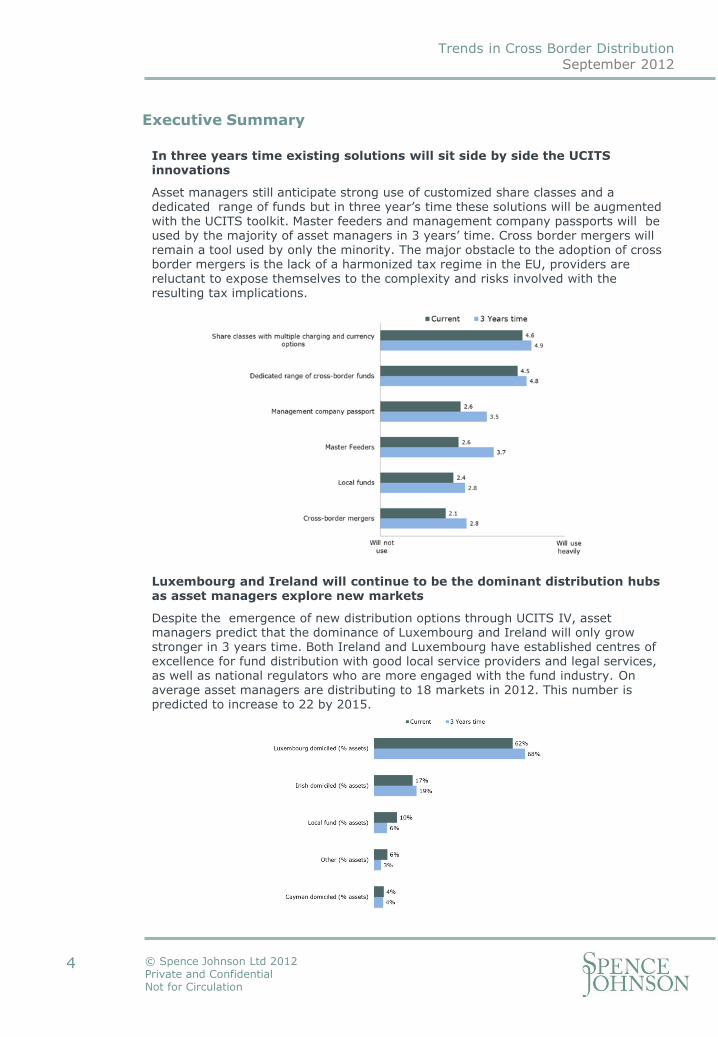
Luxembourg and Ireland will continue to be the dominant distribution hubs as asset managers explore new markets
Despite the emergence of new distribution options through UCITS IV, asset managers predict that the dominance of Luxembourg and Ireland will only grow stronger in 3 years time. Both Ireland and Luxembourg have established centres of excellence for fund distribution with good local service providers and legal services, as well as national regulators who are more engaged with the fund industry. On average asset managers are distributing to 18 markets in 2012. This number is predicted to increase to 22 by 2015.
In three years time existing solutions will sit side by side the UCITS innovations
Asset managers still anticipate strong use of customized share classes and a dedicated range of funds but in three year’s time these solutions will be augmented with the UCITS toolkit. Master feeders and management company passports will be used by the majority of asset managers in 3 years’ time. Cross border mergers will remain a tool used by only the minority. The major obstacle to the adoption of cross border mergers is the lack of a harmonized tax regime in the EU, providers are reluctant to expose themselves to the complexity and risks involved with the resulting tax implications.
Trends in Cross Border Distribution
September 2012
© Spence Johnson Ltd 2012 Private and Confidential Not for Circulation
Asset Managers
Aberdeen Global Services S.A. (26) AK AM (1) Amundi (24) Artisan Partners (3) Aviva Investors (21) Aviva Investors Luxembourg (23) Avoca Capital (26) AXA France (40) Baumann & Partners S.A (1) BlackRock (27) BNP Paribas Investment Partners (35) BNY Mellon Asset Management International (26) Brandes Investment Partners (12) Carmignac (13) CBP Quilvest (2) DWS (22) Federal Finance (2) Fidelity (31) Fidelity Worldwide Investment (31) Franklin Templeton Investments (39) Generali Investments (13) Henderson (30) HSBC Global Asset Management (34) Ignis Asset Management (19) ING Investment Management Europe (27) Investec Asset Management (25) JPMorgan AM Luxembourg (29) Jyske Invest Fund Management A/S (11) Kvibäck (N.A) LGT Group (11) Man Group (21) Mirae Asset Global Investments UK (12) Nomura Bank (Luxembourg) S.A. (8) Nordea (21) Nordea Investment Funds S.A. (21) Pictet&Cie (21) Pioneer Asset Management S.A. (3) Protected funds (1)
5
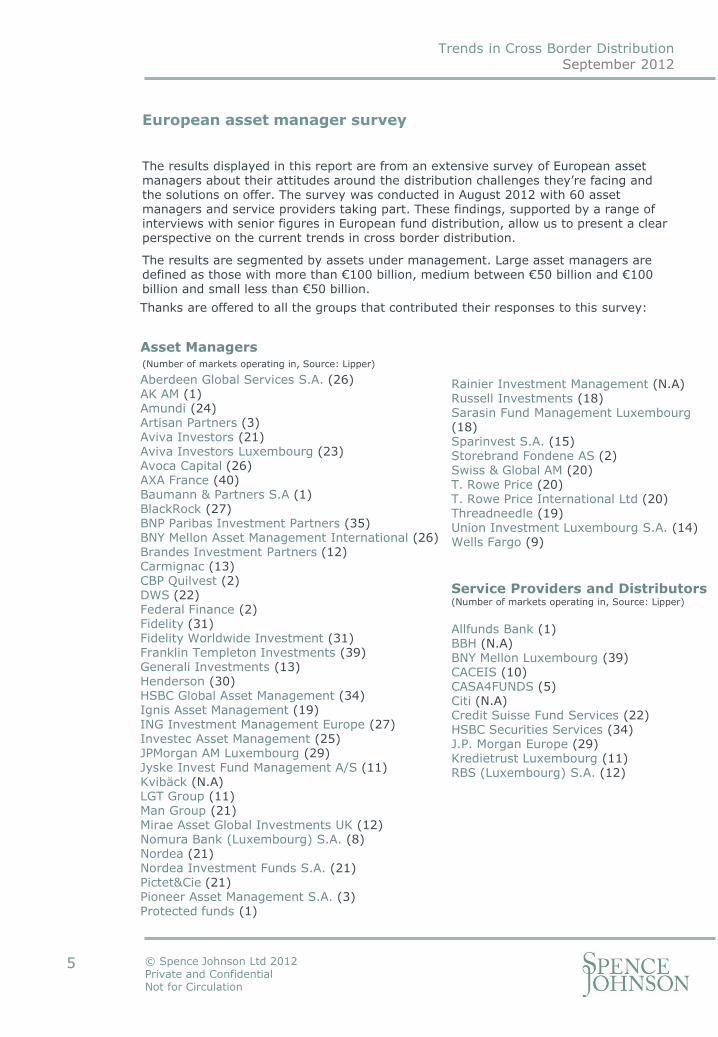
European asset manager survey
The results displayed in this report are from an extensive survey of European asset managers about their attitudes around the distribution challenges they’re facing and the solutions on offer. The survey was conducted in August 2012 with 60 asset managers and service providers taking part. These findings, supported by a range of interviews with senior figures in European fund distribution, allow us to present a clear perspective on the current trends in cross border distribution.
The results are segmented by assets under management. Large asset managers are defined as those with more than €100 billion, medium between €50 billion and €100 billion and small less than €50 billion.
(Number of markets operating in, Source: Lipper)
Thanks are offered to all the groups that contributed their responses to this survey:
Rainier Investment Management (N.A) Russell Investments (18) Sarasin Fund Management Luxembourg (18) Sparinvest S.A. (15) Storebrand Fondene AS (2) Swiss & Global AM (20) T. Rowe Price (20) T. Rowe Price International Ltd (20) Threadneedle (19) Union Investment Luxembourg S.A. (14) Wells Fargo (9)
Service Providers and Distributors (Number of markets operating in, Source: Lipper)
Allfunds Bank (1) BBH (N.A) BNY Mellon Luxembourg (39) CACEIS (10) CASA4FUNDS (5) Citi (N.A) Credit Suisse Fund Services (22) HSBC Securities Services (34) J.P. Morgan Europe (29) Kredietrust Luxembourg (11) RBS (Luxembourg) S.A. (12)
Trends in Cross Border Distribution
September 2012
© Spence Johnson Ltd 2012 Private and Confidential Not for Circulation
6
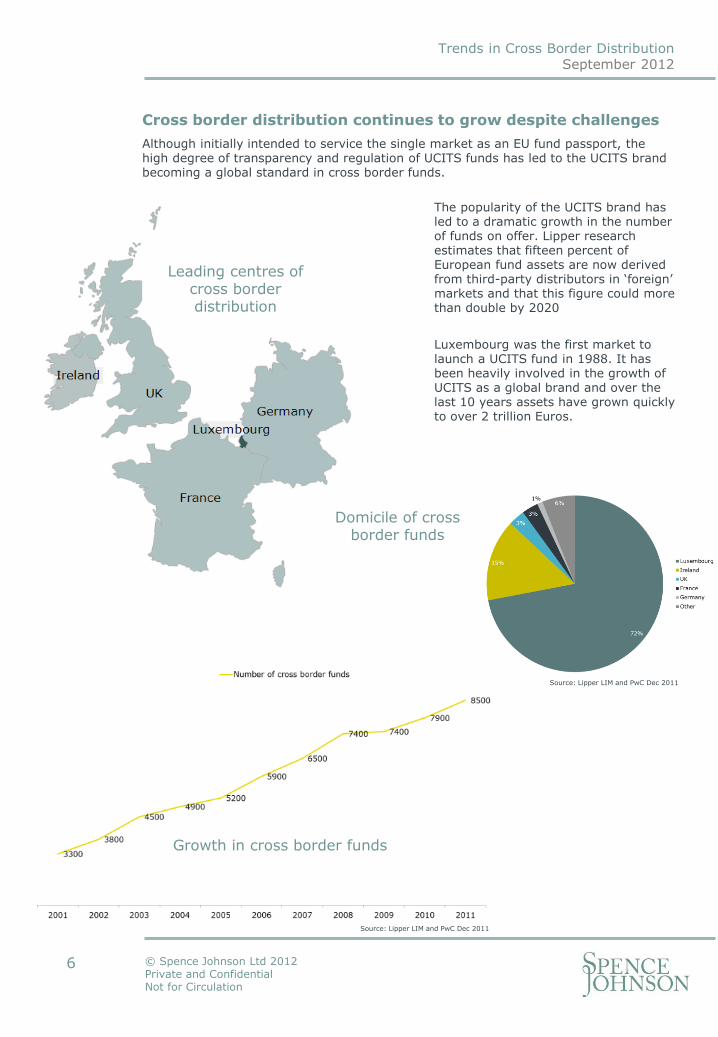
Cross border distribution continues to grow despite challenges
Although initially intended to service the single market as an EU fund passport, the high degree of transparency and regulation of UCITS funds has led to the UCITS brand becoming a global standard in cross border funds.
The popularity of the UCITS brand has led to a dramatic growth in the number of funds on offer. Lipper research estimates that fifteen percent of European fund assets are now derived from third-party distributors in ‘foreign’ markets and that this figure could more than double by 2020
Luxembourg was the first market to launch a UCITS fund in 1988. It has been heavily involved in the growth of UCITS as a global brand and over the last 10 years assets have grown quickly to over 2 trillion Euros.
Growth in cross border funds
Domicile of cross border funds
Leading centres of cross border distribution
Source: Lipper LIM and PwC Dec 2011
Source: Lipper LIM and PwC Dec 2011
Trends in Cross Border Distribution
September 2012
© Spence Johnson Ltd 2012 Private and Confidential Not for Circulation
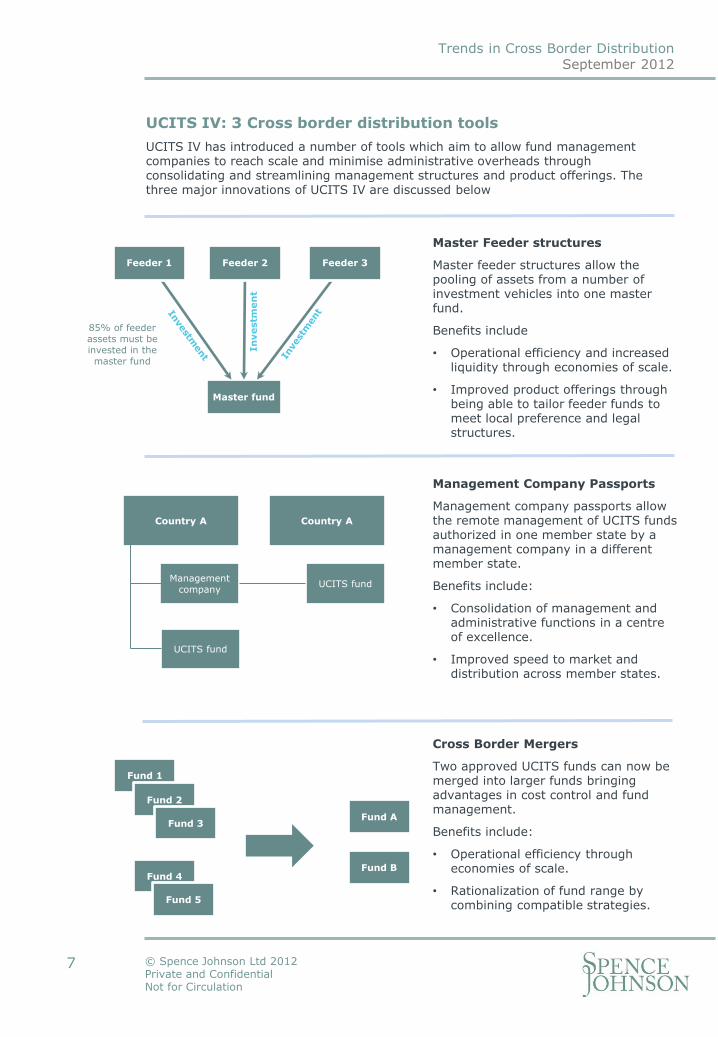
UCITS IV: 3 Cross border distribution tools
UCITS IV has introduced a number of tools which aim to allow fund management companies to reach scale and minimise administrative overheads through consolidating and streamlining management structures and product offerings. The three major innovations of UCITS IV are discussed below
Master Feeder structures
Master feeder structures allow the pooling of assets from a number of investment vehicles into one master fund.
Benefits include
• Operational efficiency and increased liquidity through economies of scale.
• Improved product offerings through being able to tailor feeder funds to meet local preference and legal structures.
Management Company Passports
Management company passports allow the remote management of UCITS funds authorized in one member state by a management company in a different member state.
Benefits include:
• Consolidation of management and administrative functions in a centre of excellence.
• Improved speed to market and distribution across member states.
Cross Border Mergers
Two approved UCITS funds can now be merged into larger funds bringing advantages in cost control and fund management.
Benefits include:
• Operational efficiency through economies of scale.
• Rationalization of fund range by combining compatible strategies.
Master fund
Feeder 2 Feeder 3 Feeder 1 In
vestm
en
t
85% of feeder assets must be invested in the master fund
7
Country A
Management company
UCITS fund
UCITS fund
Country A
Fund A
Fund B
Fund 1
Fund 2
Fund 3
Fund 4
Fund 5
Trends in Cross Border Distribution
September 2012
© Spence Johnson Ltd 2012 Private and Confidential Not for Circulation
8
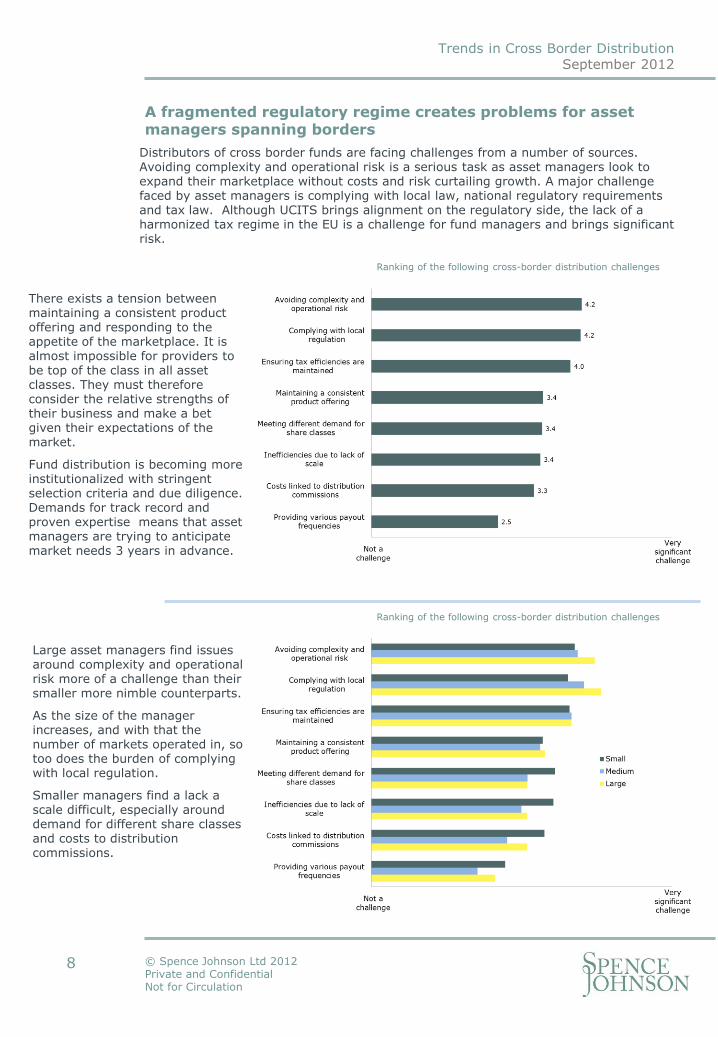
A fragmented regulatory regime creates problems for asset managers spanning borders
Distributors of cross border funds are facing challenges from a number of sources. Avoiding complexity and operational risk is a serious task as asset managers look to expand their marketplace without costs and risk curtailing growth. A major challenge faced by asset managers is complying with local law, national regulatory requirements and tax law. Although UCITS brings alignment on the regulatory side, the lack of a harmonized tax regime in the EU is a challenge for fund managers and brings significant risk.
Large asset managers find issues around complexity and operational risk more of a challenge than their smaller more nimble counterparts.
As the size of the manager increases, and with that the number of markets operated in, so too does the burden of complying with local regulation.
Smaller managers find a lack a scale difficult, especially around demand for different share classes and costs to distribution commissions.
Ranking of the following cross-border distribution challenges
Ranking of the following cross-border distribution challenges
There exists a tension between maintaining a consistent product offering and responding to the appetite of the marketplace. It is almost impossible for providers to be top of the class in all asset classes. They must therefore consider the relative strengths of their business and make a bet given their expectations of the market.
Fund distribution is becoming more institutionalized with stringent selection criteria and due diligence. Demands for track record and proven expertise means that asset managers are trying to anticipate market needs 3 years in advance.
Trends in Cross Border Distribution
September 2012
© Spence Johnson Ltd 2012 Private and Confidential Not for Circulation
9
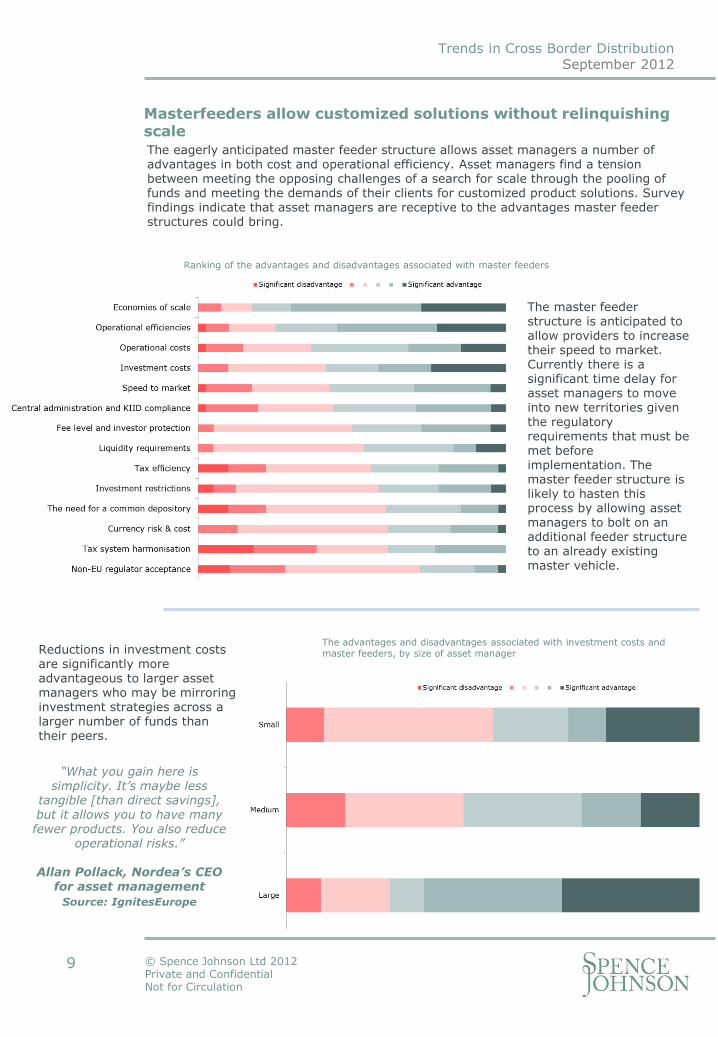
Masterfeeders allow customized solutions without relinquishing scale The eagerly anticipated master feeder structure allows asset managers a number of advantages in both cost and operational efficiency. Asset managers find a tension between meeting the opposing challenges of a search for scale through the pooling of funds and meeting the demands of their clients for customized product solutions. Survey findings indicate that asset managers are receptive to the advantages master feeder structures could bring.
Ranking of the advantages and disadvantages associated with master feeders
The master feeder structure is anticipated to allow providers to increase their speed to market. Currently there is a significant time delay for asset managers to move into new territories given the regulatory requirements that must be met before implementation. The master feeder structure is likely to hasten this process by allowing asset managers to bolt on an additional feeder structure to an already existing master vehicle.
Reductions in investment costs are significantly more advantageous to larger asset managers who may be mirroring investment strategies across a larger number of funds than their peers.
“What you gain here is simplicity. It’s maybe less
tangible [than direct savings], but it allows you to have many fewer products. You also reduce
operational risks.”
Allan Pollack, Nordea’s CEO for asset management
Source: IgnitesEurope
The advantages and disadvantages associated with investment costs and master feeders, by size of asset manager
Trends in Cross Border Distribution
September 2012
© Spence Johnson Ltd 2012 Private and Confidential Not for Circulation
10
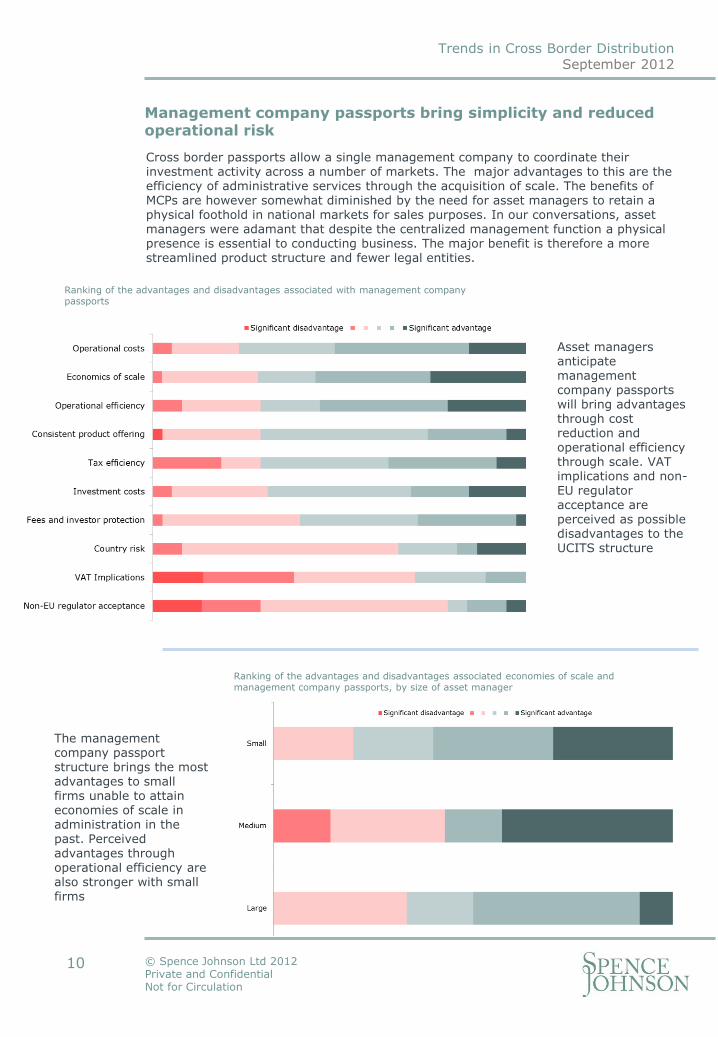
Management company passports bring simplicity and reduced operational risk
Cross border passports allow a single management company to coordinate their investment activity across a number of markets. The major advantages to this are the efficiency of administrative services through the acquisition of scale. The benefits of MCPs are however somewhat diminished by the need for asset managers to retain a physical foothold in national markets for sales purposes. In our conversations, asset managers were adamant that despite the centralized management function a physical presence is essential to conducting business. The major benefit is therefore a more streamlined product structure and fewer legal entities.
Ranking of the advantages and disadvantages associated with management company passports
Asset managers anticipate management company passports will bring advantages through cost reduction and operational efficiency through scale. VAT implications and non-EU regulator acceptance are perceived as possible disadvantages to the UCITS structure
The management company passport structure brings the most advantages to small firms unable to attain economies of scale in administration in the past. Perceived advantages through operational efficiency are also stronger with small firms
Ranking of the advantages and disadvantages associated economies of scale and management company passports, by size of asset manager
Trends in Cross Border Distribution
September 2012
© Spence Johnson Ltd 2012 Private and Confidential Not for Circulation
11
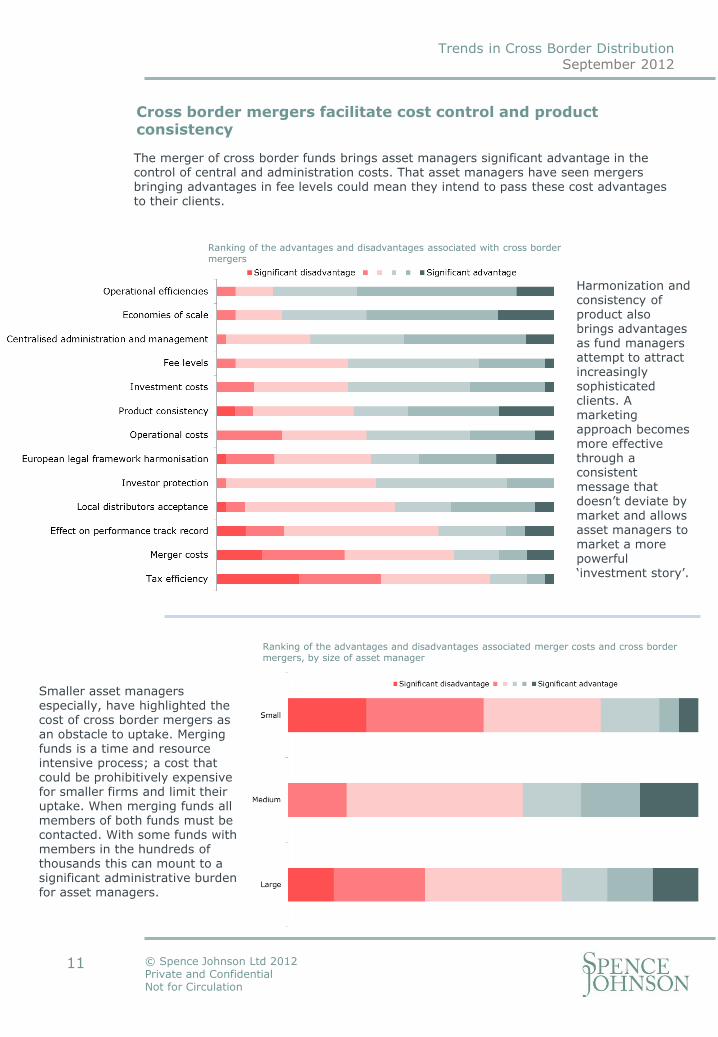
Cross border mergers facilitate cost control and product consistency
The merger of cross border funds brings asset managers significant advantage in the control of central and administration costs. That asset managers have seen mergers bringing advantages in fee levels could mean they intend to pass these cost advantages to their clients.
Harmonization and consistency of product also brings advantages as fund managers attempt to attract increasingly sophisticated clients. A marketing approach becomes more effective through a consistent message that doesn’t deviate by market and allows asset managers to market a more powerful ‘investment story’.
Smaller asset managers especially, have highlighted the cost of cross border mergers as an obstacle to uptake. Merging funds is a time and resource intensive process; a cost that could be prohibitively expensive for smaller firms and limit their uptake. When merging funds all members of both funds must be contacted. With some funds with members in the hundreds of thousands this can mount to a significant administrative burden for asset managers.
Ranking of the advantages and disadvantages associated with cross border mergers
Ranking of the advantages and disadvantages associated merger costs and cross border mergers, by size of asset manager
Trends in Cross Border Distribution
September 2012
© Spence Johnson Ltd 2012 Private and Confidential Not for Circulation
12
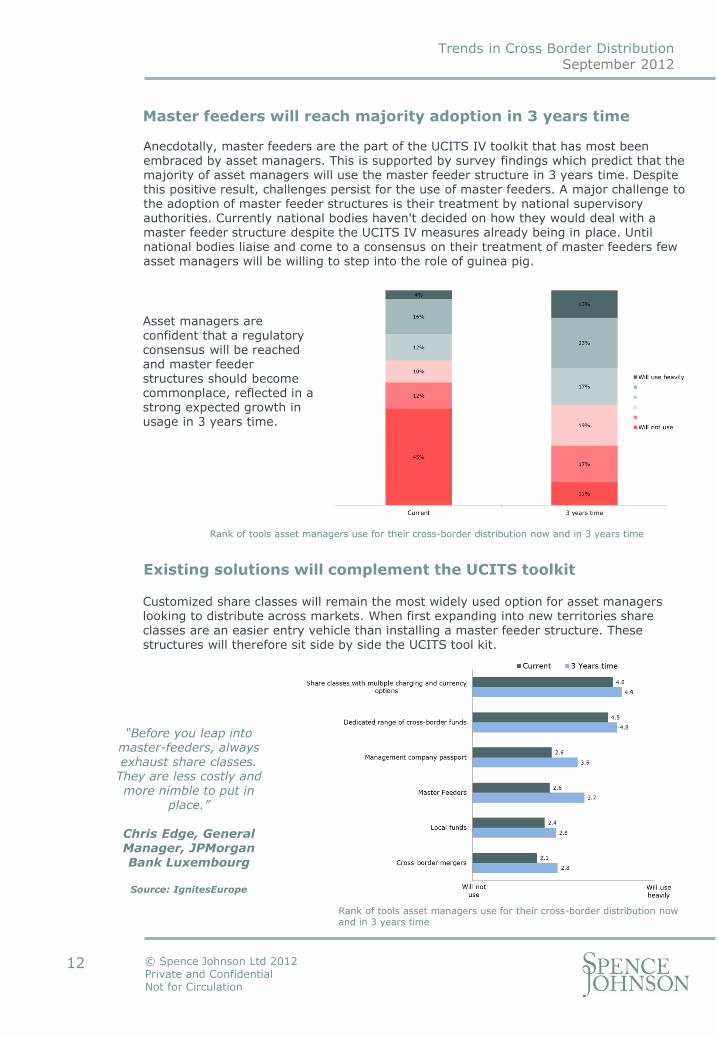
Anecdotally, master feeders are the part of the UCITS IV toolkit that has most been embraced by asset managers. This is supported by survey findings which predict that the majority of asset managers will use the master feeder structure in 3 years time. Despite this positive result, challenges persist for the use of master feeders. A major challenge to the adoption of master feeder structures is their treatment by national supervisory authorities. Currently national bodies haven't decided on how they would deal with a master feeder structure despite the UCITS IV measures already being in place. Until national bodies liaise and come to a consensus on their treatment of master feeders few asset managers will be willing to step into the role of guinea pig.
Master feeders will reach majority adoption in 3 years time
Rank of tools asset managers use for their cross-border distribution now and in 3 years time
Asset managers are confident that a regulatory consensus will be reached and master feeder structures should become commonplace, reflected in a strong expected growth in usage in 3 years time.
Existing solutions will complement the UCITS toolkit
“Before you leap into master-feeders, always exhaust share classes.
They are less costly and more nimble to put in
place.”
Chris Edge, General Manager, JPMorgan Bank Luxembourg
Source: IgnitesEurope
Customized share classes will remain the most widely used option for asset managers looking to distribute across markets. When first expanding into new territories share classes are an easier entry vehicle than installing a master feeder structure. These structures will therefore sit side by side the UCITS tool kit.
Rank of tools asset managers use for their cross-border distribution now and in 3 years time
Trends in Cross Border Distribution
September 2012
© Spence Johnson Ltd 2012 Private and Confidential Not for Circulation
13
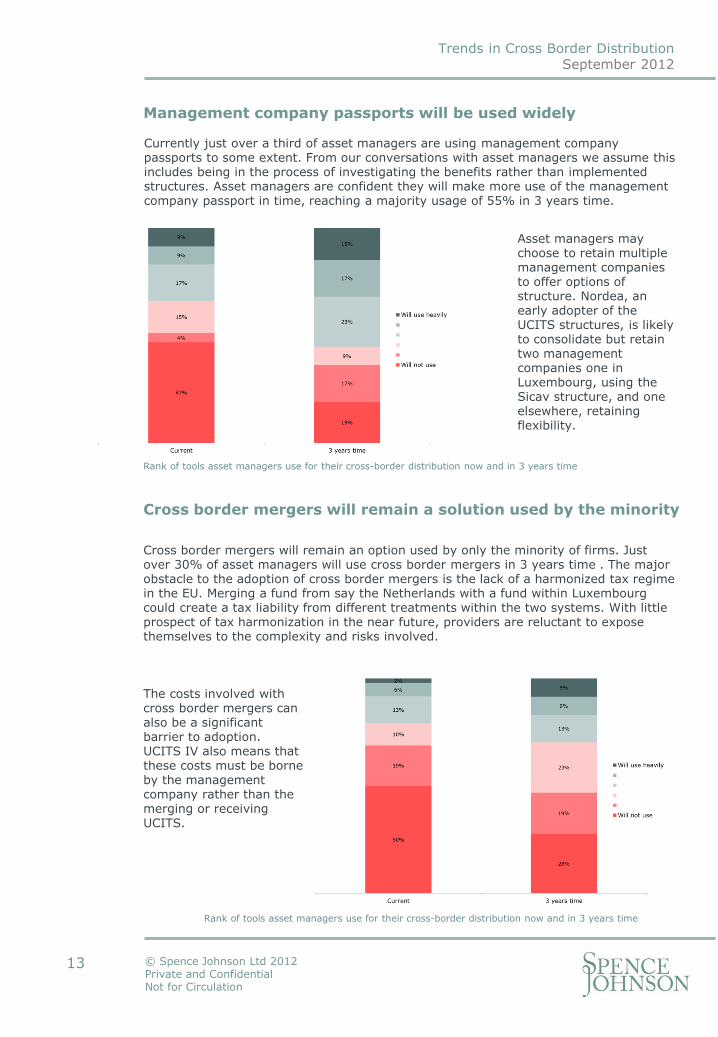
Cross border mergers will remain a solution used by the minority
Rank of tools asset managers use for their cross-border distribution now and in 3 years time
Cross border mergers will remain an option used by only the minority of firms. Just over 30% of asset managers will use cross border mergers in 3 years time . The major obstacle to the adoption of cross border mergers is the lack of a harmonized tax regime in the EU. Merging a fund from say the Netherlands with a fund within Luxembourg could create a tax liability from different treatments within the two systems. With little prospect of tax harmonization in the near future, providers are reluctant to expose themselves to the complexity and risks involved.
The costs involved with cross border mergers can also be a significant barrier to adoption. UCITS IV also means that these costs must be borne by the management company rather than the merging or receiving UCITS.
Rank of tools asset managers use for their cross-border distribution now and in 3 years time
Management company passports will be used widely
Currently just over a third of asset managers are using management company passports to some extent. From our conversations with asset managers we assume this includes being in the process of investigating the benefits rather than implemented structures. Asset managers are confident they will make more use of the management company passport in time, reaching a majority usage of 55% in 3 years time.
Asset managers may choose to retain multiple management companies to offer options of structure. Nordea, an early adopter of the UCITS structures, is likely to consolidate but retain two management companies one in Luxembourg, using the Sicav structure, and one elsewhere, retaining flexibility.
Trends in Cross Border Distribution
September 2012
© Spence Johnson Ltd 2012 Private and Confidential Not for Circulation
14
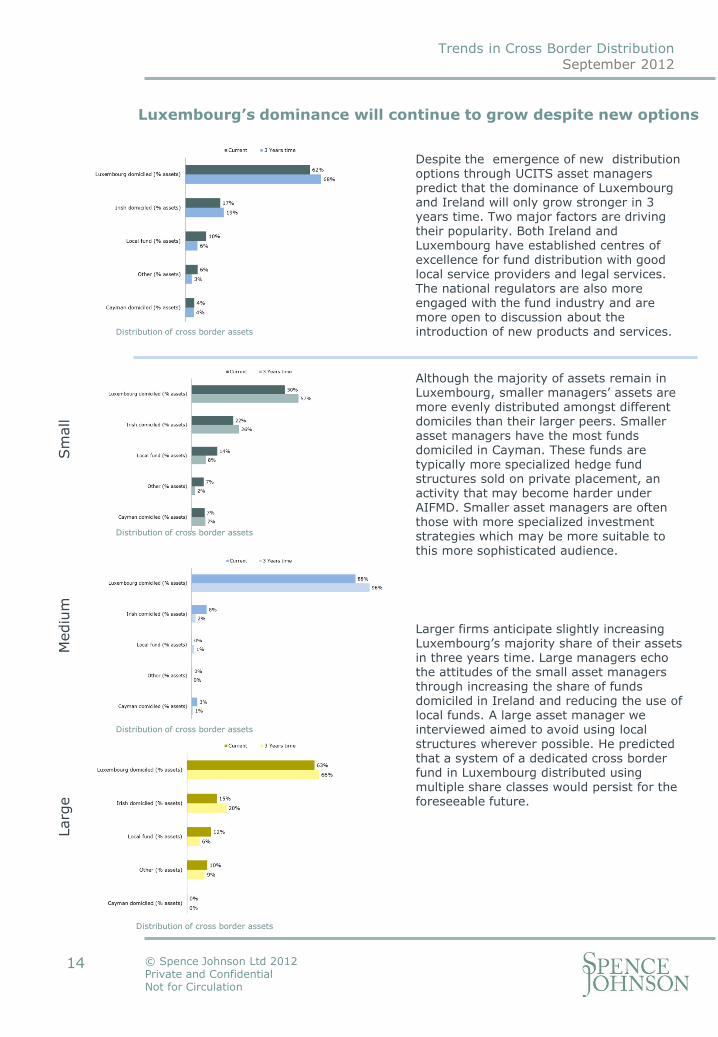
Luxembourg’s dominance will continue to grow despite new options
Despite the emergence of new distribution options through UCITS asset managers predict that the dominance of Luxembourg and Ireland will only grow stronger in 3 years time. Two major factors are driving their popularity. Both Ireland and Luxembourg have established centres of excellence for fund distribution with good local service providers and legal services. The national regulators are also more engaged with the fund industry and are more open to discussion about the introduction of new products and services.
Although the majority of assets remain in Luxembourg, smaller managers’ assets are more evenly distributed amongst different domiciles than their larger peers. Smaller asset managers have the most funds domiciled in Cayman. These funds are typically more specialized hedge fund structures sold on private placement, an activity that may become harder under AIFMD. Smaller asset managers are often those with more specialized investment strategies which may be more suitable to this more sophisticated audience.
Sm
all
Mediu
m
Larg
e
Larger firms anticipate slightly increasing Luxembourg’s majority share of their assets in three years time. Large managers echo the attitudes of the small asset managers through increasing the share of funds domiciled in Ireland and reducing the use of local funds. A large asset manager we interviewed aimed to avoid using local structures wherever possible. He predicted that a system of a dedicated cross border fund in Luxembourg distributed using multiple share classes would persist for the foreseeable future.
Distribution of cross border assets
Distribution of cross border assets
Distribution of cross border assets
Distribution of cross border assets
Trends in Cross Border Distribution
September 2012
© Spence Johnson Ltd 2012 Private and Confidential Not for Circulation
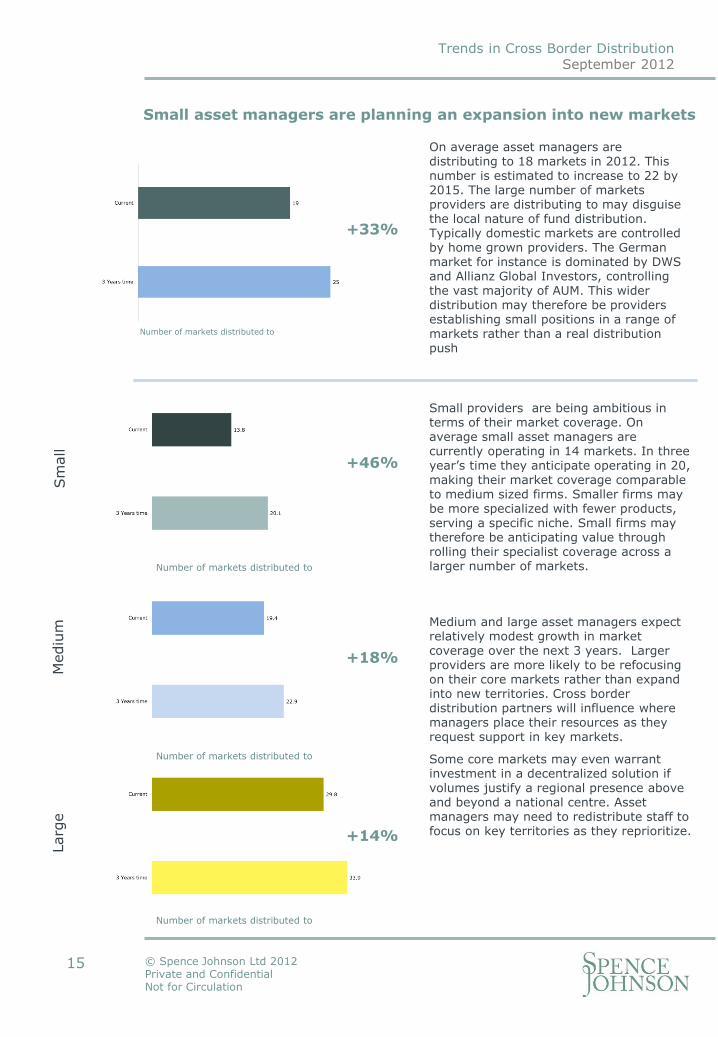
Small providers are being ambitious in terms of their market coverage. On average small asset managers are currently operating in 14 markets. In three year’s time they anticipate operating in 20, making their market coverage comparable to medium sized firms. Smaller firms may be more specialized with fewer products, serving a specific niche. Small firms may therefore be anticipating value through rolling their specialist coverage across a larger number of markets.
Sm
all
+46%
15
Small asset managers are planning an expansion into new markets
On average asset managers are distributing to 18 markets in 2012. This number is estimated to increase to 22 by 2015. The large number of markets providers are distributing to may disguise the local nature of fund distribution. Typically domestic markets are controlled by home grown providers. The German market for instance is dominated by DWS and Allianz Global Investors, controlling the vast majority of AUM. This wider distribution may therefore be providers establishing small positions in a range of markets rather than a real distribution push
Mediu
m
Larg
e
Medium and large asset managers expect relatively modest growth in market coverage over the next 3 years. Larger providers are more likely to be refocusing on their core markets rather than expand into new territories. Cross border distribution partners will influence where managers place their resources as they request support in key markets.
Some core markets may even warrant investment in a decentralized solution if volumes justify a regional presence above and beyond a national centre. Asset managers may need to redistribute staff to focus on key territories as they reprioritize.
+33%
+18%
+14%
Number of markets distributed to
Number of markets distributed to
Number of markets distributed to
Number of markets distributed to
Trends in Cross Border Distribution
September 2012
© Spence Johnson Ltd 2012 Private and Confidential Not for Circulation
16
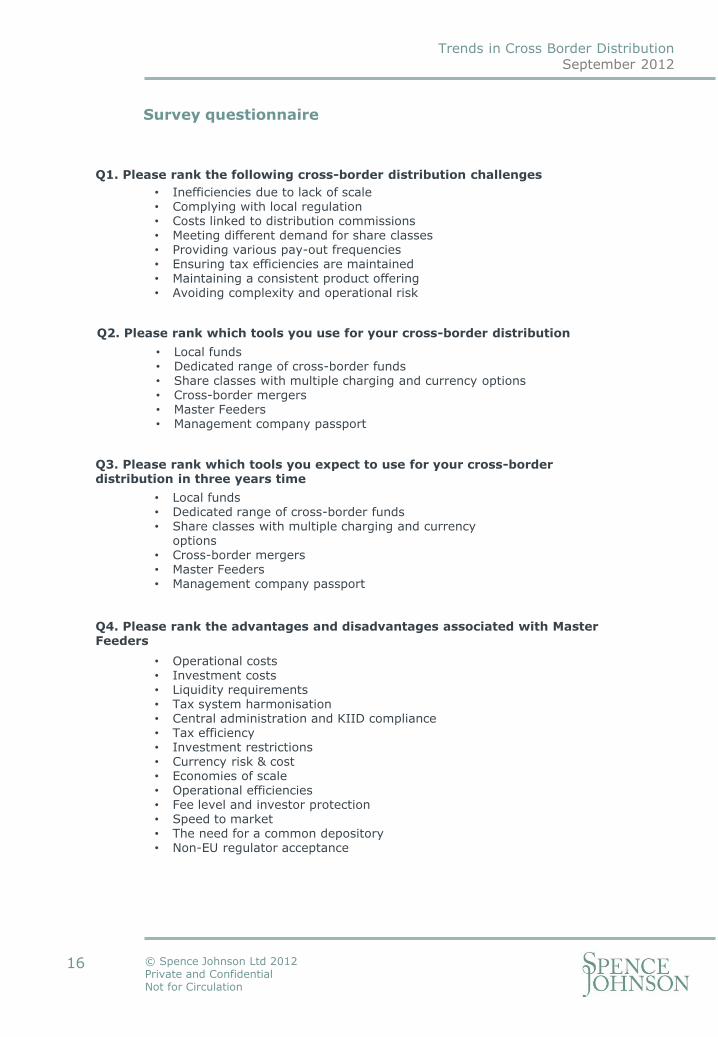
Survey questionnaire
Q1. Please rank the following cross-border distribution challenges
• Inefficiencies due to lack of scale • Complying with local regulation • Costs linked to distribution commissions • Meeting different demand for share classes • Providing various pay-out frequencies • Ensuring tax efficiencies are maintained • Maintaining a consistent product offering • Avoiding complexity and operational risk
Q2. Please rank which tools you use for your cross-border distribution
• Local funds • Dedicated range of cross-border funds • Share classes with multiple charging and currency options • Cross-border mergers • Master Feeders • Management company passport
Q3. Please rank which tools you expect to use for your cross-border distribution in three years time
• Local funds • Dedicated range of cross-border funds • Share classes with multiple charging and currency
options • Cross-border mergers • Master Feeders • Management company passport
Q4. Please rank the advantages and disadvantages associated with Master Feeders
• Operational costs • Investment costs • Liquidity requirements • Tax system harmonisation • Central administration and KIID compliance • Tax efficiency • Investment restrictions • Currency risk & cost • Economies of scale • Operational efficiencies • Fee level and investor protection • Speed to market • The need for a common depository • Non-EU regulator acceptance
Trends in Cross Border Distribution
September 2012
© Spence Johnson Ltd 2012 Private and Confidential Not for Circulation
17
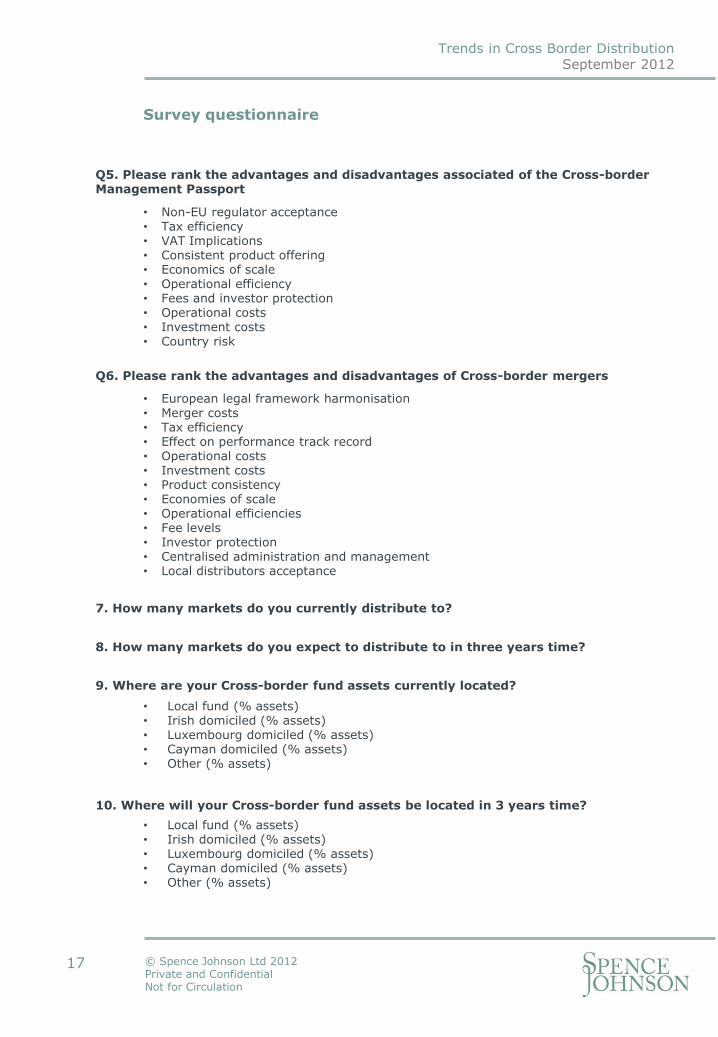
Survey questionnaire
Q5. Please rank the advantages and disadvantages associated of the Cross-border Management Passport
• Non-EU regulator acceptance • Tax efficiency • VAT Implications • Consistent product offering • Economics of scale • Operational efficiency • Fees and investor protection • Operational costs • Investment costs • Country risk
Q6. Please rank the advantages and disadvantages of Cross-border mergers
• European legal framework harmonisation • Merger costs • Tax efficiency • Effect on performance track record • Operational costs • Investment costs • Product consistency • Economies of scale • Operational efficiencies • Fee levels • Investor protection • Centralised administration and management • Local distributors acceptance
7. How many markets do you currently distribute to?
8. How many markets do you expect to distribute to in three years time? 9. Where are your Cross-border fund assets currently located?
10. Where will your Cross-border fund assets be located in 3 years time?
• Local fund (% assets) • Irish domiciled (% assets) • Luxembourg domiciled (% assets) • Cayman domiciled (% assets) • Other (% assets)
• Local fund (% assets) • Irish domiciled (% assets) • Luxembourg domiciled (% assets) • Cayman domiciled (% assets) • Other (% assets)
Trends in Cross Border Distribution
September 2012
© Spence Johnson Ltd 2012 Private and Confidential Not for Circulation
18
ABOUT THE AUTHORS
Nigel Birch Director, Spence Johnson
William Mayne Senior Consultant, Spence Johnson
Spence Johnson is an independent specialist provider of institutional investment research. Our research products and consulting assignments support marketing, sales, and strategic planning in investment based businesses
15 Abchurch Lane London EC4N 7BW United Kingdom
Telephone +44 (0) 20 7112 2131
Mobile +44 (0) 7766 916 120
www.spencejohnson.com