Embed Size (px)
Citation preview

Trends in Commercial Whole-Building Sensors and Controls
December 2020
Independent Statistics & Analysis www.eia.gov
U.S. Department of Energy
Washington, DC 20585

U.S. Energy Information Administration | Trends in Commercial Whole-Building Sensors and Controls i
This report was prepared by the U.S. Energy Information Administration (EIA), the statistical and analytical agency within the U.S. Department of Energy. By law, EIA’s data, analyses, and forecasts are independent of approval by any other officer or employee of the United States Government. The views in this report therefore should not be construed as representing those of the U.S. Department of Energy or other federal agencies.
December 2020
U.S. Energy Information Administration | Trends in Commercial Whole-Building Sensors and Controls 1
Trends in Commercial Whole-Building Sensors and Controls Sensor and control innovations—such as connected thermostats, wired and wireless sensors, whole-building submetering, building energy management systems (BEMS), and automated fault detection and diagnosis (AFDD)—can lower the demand for end-use energy services such as space heating, space cooling, ventilation, and lighting in buildings. Although U.S. Energy Information Administration (EIA) analyses have developed approaches for representing efficient building envelopes and appliances in the National Energy Modeling System (NEMS), EIA has not previously analyzed sensors and controls in NEMS.
To inform future modeling of energy management technologies in the NEMS Commercial Demand Module (CDM), EIA contracted with Leidos, Inc., to characterize six sensor and control technology categories:
1. Lighting controls 2. Heating, ventilation, and air conditioning (HVAC) controls 3. Automated fault detection and diagnosis 4. Building energy management systems software 5. Wired and wireless sensors and sensor networks 6. Whole-building electric submetering
The report begins with a brief technical overview of selected key sensor and control technologies within each category. Drawing from secondary literature, Leidos, Inc. estimates the share of existing floorspace and incorporates key technologies in the Commercial Building Energy Consumption Survey (CBECS) base year for 2012 and for 2018 (the next CBECS base year). A subsequent Leidos, Inc. analysis projects the share of floorspace expected to incorporate these technologies and estimates the associated energy impacts for the years 2020, 2030, 2040, and 2050. Along with this quantitative analysis, the report describes the quality of technological advancements and market trends for each key sensor and control technology.
Finally, the report recommends an approach for modeling sensors and controls in NEMS. The approach aggregates end-use service demand across fuels and then divides by square feet of floorspace to derive service demand intensity (SDI). Sensor and control technologies then reduce aggregate SDI according to the estimated percentage reduction in service demand attributable to each control technology and the projected penetration of the control technology. The forthcoming Annual Energy Outlook 2021 (AEO2021) has incorporated this approach.
The report, Trends in Commercial Whole-Building Sensors and Controls, is available in Appendix A. When referencing the report, cite it as a report by Leidos, Inc., prepared for the U.S. Energy Information Administration.

December 2020
U.S. Energy Information Administration | Trends in Commercial Whole-Building Sensors and Controls 2
APPENDIX
Trends in Commercial Whole-Building Sensors and Controls Prepared for: U.S. Energy Information Administration Task Order DE-EI0002956, Subtask 5.2 Prepared by: Leidos, Inc. 11951 Freedom Drive Reston, VA 20190 And Navigant Consulting, Inc. 1200 19th Street NW, Suite 700 Washington, DC 20036 October 14, 2019

2
Contents List of Abbreviations and Acronyms ............................................................................................................. 3
Introduction .................................................................................................................................................. 4
Key Technologies .......................................................................................................................................... 5
Lighting controls ........................................................................................................................................ 5
HVAC controls ........................................................................................................................................... 6
AFDD ......................................................................................................................................................... 7
BEMS software .......................................................................................................................................... 8
Wired and wireless sensors and sensor networks .................................................................................... 8
Whole-building submetering .................................................................................................................... 9
Technology Penetration .............................................................................................................................. 11
Methods for estimating base year floorspace penetration .................................................................... 12
Methods for projecting floorspace growth............................................................................................. 14
Energy Impacts ............................................................................................................................................ 14
General methods for estimating and projecting energy impacts ........................................................... 15
Energy savings estimates ........................................................................................................................ 17
Lighting controls .................................................................................................................................. 17
HVAC controls ..................................................................................................................................... 18
AFDD ................................................................................................................................................... 18
BEMS software .................................................................................................................................... 18
Whole-building submetering ............................................................................................................... 19
Key Trends and Technological Advances .................................................................................................... 20
Lighting controls ...................................................................................................................................... 21
HVAC controls ......................................................................................................................................... 22
AFDD ....................................................................................................................................................... 23
BEMS software ........................................................................................................................................ 24
Wired and wireless sensors and sensor networks .................................................................................. 25
Whole-building submeters...................................................................................................................... 25
Recommended Approach for Modeling and Analysis ................................................................................ 27

3
List of Abbreviations and Acronyms
ACEEE – American Council for an Energy-Efficient Economy AEO – Annual Energy Outlook AFDD – Automated Fault Detection and Diagnosis ASHRAE – American Society of Heating, Refrigerating and Air-Conditioning Engineers BAS – Building Automation System BEMS – Building Energy Management System BMS – Building Management System CAGR – Compound Annual Growth Rate CBECS – Commercial Building Energy Consumption Survey CDM – Commercial Demand Module CFL – Compact Fluorescent Lamp CT – Control Technology DDC – Direct Digital Control DER – Distributed Energy Resources DLC – Design Lights Consortium DOE – U.S. Department of Energy DR – Demand Response DSIRE – Database of State Incentives for Renewables and Efficiency EMCS - Energy Management and Control Systems FDD – Fault Detection and Diagnostics GSA – U.S. General Services Administration HVAC – Heating, Ventilation, and Air Conditioning IoT – Internet of Things IP – Internet Protocol IT – Information Technology LBNL – Lawrence Berkeley National Library LED – Light-Emitting Diode LMC – Lighting Market Characterization MEL – Miscellaneous Electric Load NEMS – National Energy Modeling System NILM – Non-Intrusive Load Monitoring NYSERDA – New York State Energy Research and Development Authority PNNL – Pacific Northwest National Laboratory SaaS – Software-as-a-Service SDI – Service Demand Intensity SSL – Solid State Lighting VAV – Variable Air Volume
4
Introduction The purpose of this report is to inform future modeling of whole-building energy management technologies in commercial buildings. The following six key sensor and control technologies were analyzed:
• Lighting controls • Heating ventilation air conditioning (HVAC) controls • Automated fault detection and diagnosis (AFDD) • Building energy management systems (BEMS) software • Wired and wireless sensors and sensor networks • Electric submeters
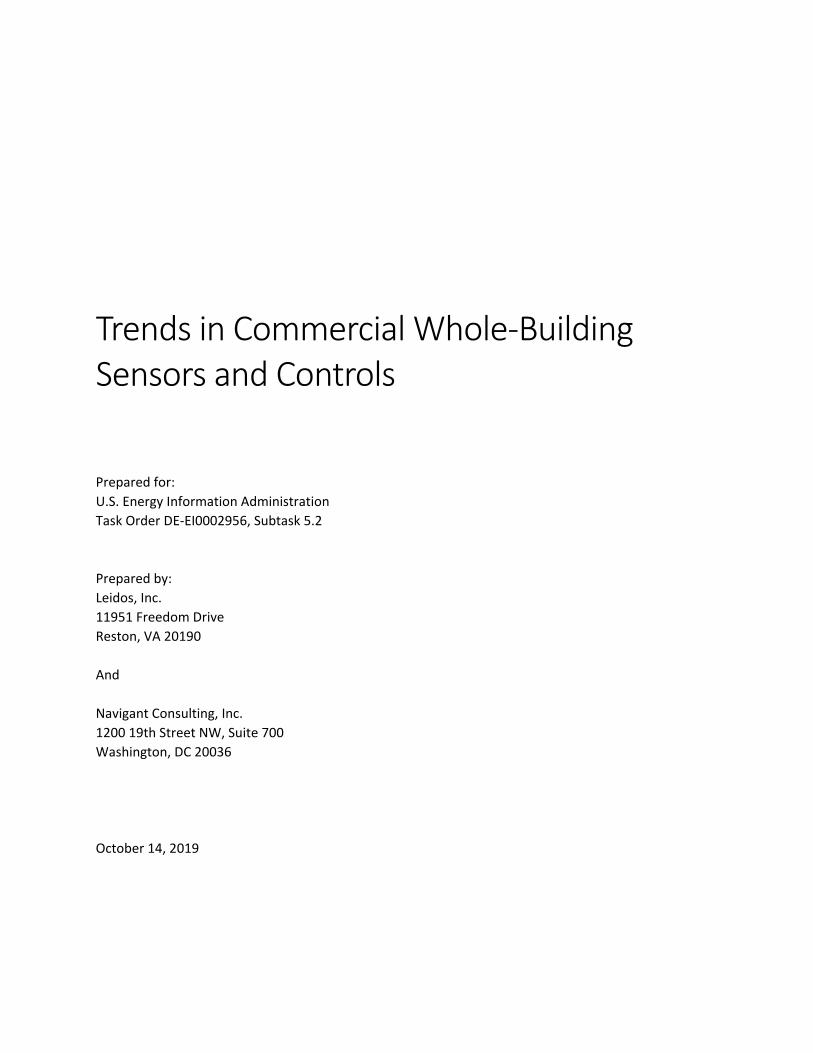
This report provides a brief technical overview of each key sensor and control technology. It also estimates the penetration and energy impacts of each technology in the U.S. commercial building space. Technology penetration is determined by estimating the share of existing floorspace that incorporates these technologies. Data are provided for the 2012 Commercial Building Energy Consumption Survey (CBECS) base year and for 2018 (the next CBECS base year). The share of floorspace expected to incorporate these technologies, along with estimates of the associated energy impacts, are projected for 2020, 2030, 2040, and 2050. Data and projections are reported according to the U.S. census divisions and commercial building types listed in Table 1. Finally, the report provides a brief overview of technological advancements and market trends for each key sensor and control technology.
Table 1. NEMS categorization of census divisions1 and commercial building types2
Census Divisions Commercial Building Types • New England • Middle Atlantic • East North Central • West North Central • South Atlantic • East South Atlantic • West South Atlantic • Mountain • Pacific
• Assembly • Education • Food Sales • Food Service • Health Care • Lodging • Office – Large (>50,000 sq. ft.) • Office – Small (≤50,000 sq. ft.) • Mercantile & Service • Warehouse • Other
1 U.S. Energy Information Administration, Commercial Buildings Energy Consumption Survey (CBECS) Maps, accessed June 17, 2019. 2 U.S. Energy Information Administration, Commercial Buildings Energy Consumption Survey (CBECS) Building Type Definitions, accessed June 17, 2019.

5
Key Technologies The sections below provide an overview of each key sensor and control technology including a basic definition, subcategories, and where applicable, functionalities. For the purposes of this report, the term controls refers to a system consisting of sensors and actuators/controllers. Lighting controls Lighting controls are composed of a sensor and actuator used to enable automatic and active management of lighting output levels. Key types of lighting control technologies include the following:
• Occupancy sensors (in other words, motion or presence sensors): Most occupancy sensors operate with either infrared or ultrasonic technology. Infrared sensors monitor the difference between the heat from a moving person and the heat of the background space. These sensors are useful in spaces that are enclosed, have high ceilings, airflow, or direct line-of-sight views (for example, private offices, lobbies, warehouse aisles, hallways, computer rooms, labs, conference rooms, storage closets).3 Ultrasonic sensors emit a high-frequency signal into the space and then read the frequency of the reflected signal and are more sensitive than infrared sensors. Ultrasonic sensors are useful in spaces where a direct line of sight is not possible and where high-level sensitivity is required (for example, restrooms, open offices, enclosed hallways/stairways).4 The controller component will turn off or dim the lights based on the data collected. Occupancy sensors come in a variety of coverage patterns (for example, 360 degrees, corridor), mounting configurations (for example, ceiling, wall), and levels of sensitivity.
• Photosensors: Indoor photosensors consist of a light-sensitive photocell that produces an electrical current in proportion to the amount of light that strikes it. The controller component will turn off or dim the lights based on the light measured.
• Multi-feature controls: This category includes any combination of lighting controls, such as an occupancy sensor and photosensor within one control system, instead of as separate units.
• Relays: Basic relays transmit on-off signaling from switches to one or more lights—allowing a lower voltage current to run through the light switch than is necessary to power the lights themselves. More sophisticated relays guard against current leakage, assist in communication logic between multiple switches and sensors, and switch to standby power supply in the event of a power failure.
• Switches: A simple switch turns a light on and off. More advanced switches include slide dimmers and touchpads with multiple buttons for various predefined scenes. Switches are no longer limited to a set location on a wall or within a room and can be remote controls or systems that can be controlled online or by a mobile app.
• Ballasts: Dimming ballasts accept control signals, at either low voltage or line voltage. In commercial buildings, dimming ballasts are mainly used to control linear fluorescent lighting.
• Drivers: Drivers for light-emitting diode (LED) lighting ensure that LEDs receive the correct voltage and current while also providing compatibility with dimming systems, communications with wired and wireless controls, and (increasingly) control of color consistency.
3 FacilitiesNet, Occupancy Sensors: Passive Infrared, Ultrasonic and Dual-Technology, accessed June 17, 2019 . 4 Ibid.
6
The following manual lighting controls are also employed in commercial buildings:
• Scheduling: turning lights on or off based on a schedule. • Task tuning: changing light levels based on what people need and prefer depending on the task
and time of day. • Load shedding: a change in lighting to reduce energy consumption during a particular time
period, either in response to a signal from the utility (in other words, demand response) or for an internal purpose such as controlling a facility’s peak demand.
HVAC controls HVAC controls regulate the operation of heating, ventilation, and air-conditioning systems. HVAC controls can be implemented on unitary systems (in other words, packaged heating, air conditioning, or both) or on central systems that consist of boilers and chillers to generate the heating and cooling and pumps, fans, air handling units, and terminal devices to distribute air. HVAC optimization technology focuses on detecting and responding to load changes while providing optimal thermal comfort. Indoor air quality (IAQ) is the quality of air within and around buildings that relates to the health and comfort of building occupants (for example, levels of asbestos, particulate pollution, radon, carbon monoxide, lead).5 HVAC controls regulate the air quality of indoor spaces and promote occupant health and comfort by filtering out harmful pollutants and odors.
Key HVAC control technologies include the following:
• Sensors and controllers: Sensors measure building temperature, air quality, humidity, and carbon dioxide (CO2) levels. The controllers use data collected by the sensors to regulate and change the output of various components within the HVAC system. In most cases, the controller acts based on a predefined control scheme where the difference between a reference input (for example, temperature, pressure) and a set point value is used to determine if any action should be taken. Advanced sensors and controllers may be programmed with learning algorithms that work in real time or on a predictive basis (for example, optimize start and stop times of equipment based on weather or building temperature). Sensors and controllers may be deployed either at the floor or building level.
• Economizer controls: Economizer controls pull cool outside air into a building, eliminating the need for electrical cooling. An economizer can come built into the rooftop HVAC unit or can be retrofitted into one. Economizers use sensors to measure the air temperature (dry bulb) or outdoor heat and humidity (enthalpy, wet bulb) to determine what action to take.
• Fan/pump speed controls: Variable frequency (or speed) drives in fans and pumps are able to vary the speed of the supply air. Speed controls are typically part of a variable air volume (VAV) HVAC system. They are actuated by a temperature or air pressure sensor and regulate the amount of air delivered by supply fans and pumps to individual rooms through air ducts.
• Demand controlled ventilation: This controlled ventilation modulates the exchange of fresh or outside air into an enclosed space by mechanical air-conditioning equipment. Ventilation is adjusted based on the occupancy of a space. The most common method in demand-controlled
5 U.S. Environmental Protection Agency, Indoor Air Quality – Indoor Pollutants and Sources, accessed August 9, 2019.

7
ventilation systems is sensing the CO2 that occupants exhale, which is then used to indicate an increase or decrease in occupancy.
There is no typical combination of HVAC controls. Economizer controls, fan speed controls, and demand-controlled ventilation systems will include sensors and controller components. For example, economizer controls are often paired with temperature or enthalpy sensors, and demand-controlled ventilation systems can use CO2 sensors. Some economizers can be purchased with integrated demand-controlled ventilation.
AFDD AFDD systems identify issues with specific system, equipment, and device performance in a building and send automated alerts, correct the problem, or both.6 In practice, AFDD is most commonly deployed for HVAC systems. AFDD technology may be delivered through a variety of implementation models, including integration into server-based software, desktop software, or software embedded in an equipment controller.7 AFDD algorithms may rely on historical or near real-time data from BEMS, from data local to the equipment or controller, from external sensors and meters, or from some combination of these data sources. AFDD software may be used by the building operator or energy manager or may be delivered through analysis-as-a-service8 contracts that do not require direct in-house use of the technology.9
Some of the types of faults an AFDD system can detect include:
• Sensor errors/faults • Energy consumption (explicit energy use fault) • Economizers and ventilation • Control-related pressurization issues • Commercial refrigeration (related to vapor/compression) • Space cooling/heating (related to vapor/compression) • Heating system (boiler, heat exchanger, furnace, etc.) • Cooling system (chillers, cooling towers, etc.) • Equipment cycling • Pump and fan systems • Scheduling (too little, too long, wrong time, etc.) • Simultaneous heating and cooling • Lighting end uses
6 Lawrence Berkeley National Laboratory (LBNL), Characterization and Survey of Automated Fault Detection and Diagnostic Tools, accessed June 17, 2019. 7 Ibid. 8 Analytics as a service (AaaS) refers to the provision of analytics software and operations through web-delivered technologies. 9 Lawrence Berkeley National Laboratory (LBNL), Characterization and Survey of Automated Fault Detection and Diagnostic Tools, accessed June 17, 2019.

8
BEMS software The term BEMS10 characterizes a broad set of solutions that can monitor and regulate the operation of potentially all building equipment and systems in a coordinated fashion based on established setpoints. A BEMS solution consists of sensors and controllers that are controlled by a software program. BEMS can integrate with and leverage data from lighting controls, HVAC controls, AFDD, wired or wireless sensors, or a combination of these technologies. Installation of a BEMS can be as simple as installing software or may require onsite integration. Once the system is installed, vendor services can range from basic customer service to regular maintenance, remote monitoring, and retuning. BEMS can use data from existing control and automation systems, from smart meter interval electricity consumption, from supplemental submeters and advanced sensors, from other business intelligence offerings, or from a combination of these options. It provides efficiency in one of two ways: focused improvements in HVAC, lighting, plug loads, or fire and security systems or the integrated management of multiple systems through Information Technology (IT) solutions. A BEMS system can be very basic, controlling the building based on a preset schedule or include more sophisticated functionalities such as the following:
• Visualization and reporting: BEMS can provide benchmarking, heat mapping, interactive portals,
and mobile apps. These tools are customizable and can vary from a simple dashboard to graphical presentations of energy consumption across floor plans. Data can be collected at the utility meter, by submeters, by lighting and HVAC sensors, or by a combination of these options.
• Predictive maintenance and advisory optimization: Predictive maintenance and advisory optimization involves using historical data collected on building equipment conditions to predict future performance. This functionality facilitates timely maintenance and retrofitting of building equipment. It can further lead to extending the life of the equipment, minimizing downtime, and optimally forecasting capital expenses.
• Optimization and automation: The most sophisticated functionality of BEMS is the optimization of automated demand response (DR), dynamic energy procurement, or peak demand management. Further, certain BEMS can automate the process of fault detection and diagnostics (FDD). Optimization can be delivered in two ways. The BEMS vendor can analyze the data and provide a list of recommendations to reduce energy consumption and achieve operational efficiency to the building facilities team for manual adjustments. The BEMS vendor can also remotely control and undertake the optimization measures. This action can include remotely shutting down or restarting a piece of equipment, changing setpoints, or both.
Wired and wireless sensors and sensor networks Wired and wireless sensors and sensor networks collect data on operations and equipment to provide greater insight into space use and equipment performance for the whole building. Occupancy, CO2, lighting, humidity, and temperature data are all inputs that can be used to implement either manual or automated improvements in building equipment operations to achieve greater energy efficiency. Wired and wireless sensors are used in HVAC controls, lighting controls, AFDD, and BEMS. 10 Other common terms, used interchangeably with BEMS in industry, are building control systems, building management systems, building automation systems (BAS), and energy management and control systems (EMCS).
9
Sensors in buildings can either be wired into the building’s electrical distribution network or can be wireless using an on-board electric power source. Because they are typically concealed within the walls, floors, and ceilings of a building, wired sensor networks can be costly and difficult to install in remote or inaccessible locations and to reconfigure or retrofit after initial installation.11 However, wired sensors are also more reliable, less prone to disruptions and interference, and exhibit longer service lifetimes. Wired and wireless sensor nodes consist of four components:
1) A sensor unit composed of the sensor(s) or transducer(s) that take measurements and convert measured signals into electrical signals.
2) A power supply—wireless sensors include the power supply and management device that monitors and regulates power from the source while wired sensors draw power and transmit data using the building’s electrical network.
3) A micro-controller or processing unit that converts electrical signals from the sensor/transducer into digital information.
4) Communication hardware that consists of the wireless transceiver that transmits data for further processing by a central unit or gateway.
Wired and wireless sensors can be linked through various communications protocols including open protocols (for example, BACnet, ZigBee), proprietary protocols for building applications (for example, LonWorks/LonTalk), Bluetooth, Ethernet, and Wi-Fi.
Whole-building submetering Whole-building submetering involves installing meters within a building that measure energy consumption at a more granular level than the utility provided meter that measures consumption for the entire building. Electric submeters can be installed to measure consumption of individual tenant spaces, equipment such as HVAC or lighting, or even individual plug loads to account for their actual energy usage. Submeters can also be used to identify energy use anomalies and waste and in some cases provide early identification of maintenance issues. It is important to note that submeters do not directly reduce energy use, but rather they provide the necessary, detailed energy data that can establish a basis for behavioral and operational changes by building operators and occupants.12
There are three increasing tiers of metering detail; however, a building owner may use multiple tiers within a building:
• Panel/sub-panel—Measures consumption for individual tenant spaces or aggregations of specific loads such as lighting panels or motor panels.
• Circuit level—Measures consumption of specific loads of interest within a panel or sub-panel. For example, discreet areas within a tenant space, such as a server room.
11 U.S. Department of Energy, Emerging Technologies Research and Development: DRAFT - Opportunities for Innovations in Sensors and Controls for Building Energy Management. April 2019, accessed June 17, 2019. 12 National Science and Technology Council Committee on Technology, Subcommittee on Buildings Technology Research and Development, Submetering of Building Energy and Water Usage: Analysis and Recommendations of the Subcommittee on Buildings Technology Research and Development, accessed June 4, 2019.
10
• End use—Measures consumption of individual end-use loads. These may be large loads—such as chillers, boilers, cooling towers, pumps, or motors—or smaller loads—such as individual pieces of office equipment (plug loads).
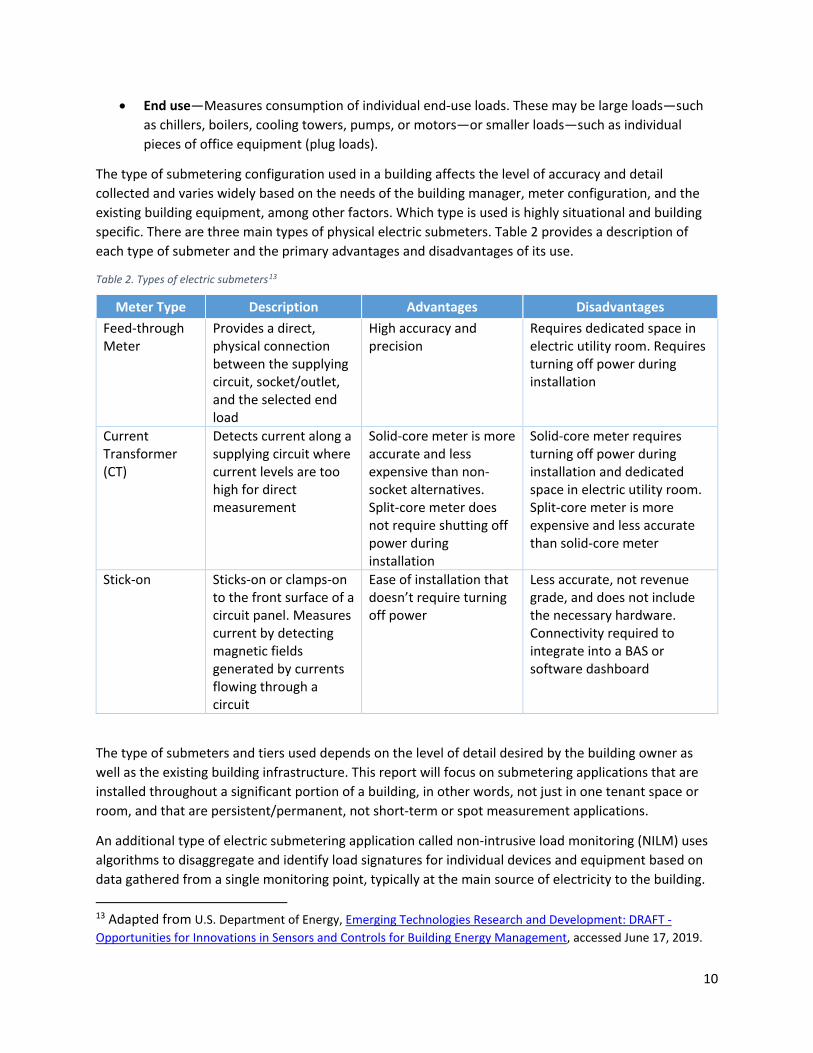
The type of submetering configuration used in a building affects the level of accuracy and detail collected and varies widely based on the needs of the building manager, meter configuration, and the existing building equipment, among other factors. Which type is used is highly situational and building specific. There are three main types of physical electric submeters. Table 2 provides a description of each type of submeter and the primary advantages and disadvantages of its use.
Table 2. Types of electric submeters13
Meter Type Description Advantages Disadvantages Feed-through Meter
Provides a direct, physical connection between the supplying circuit, socket/outlet, and the selected end load
High accuracy and precision
Requires dedicated space in electric utility room. Requires turning off power during installation
Current Transformer (CT)
Detects current along a supplying circuit where current levels are too high for direct measurement
Solid-core meter is more accurate and less expensive than non-socket alternatives. Split-core meter does not require shutting off power during installation
Solid-core meter requires turning off power during installation and dedicated space in electric utility room. Split-core meter is more expensive and less accurate than solid-core meter
Stick-on Sticks-on or clamps-on to the front surface of a circuit panel. Measures current by detecting magnetic fields generated by currents flowing through a circuit
Ease of installation that doesn’t require turning off power
Less accurate, not revenue grade, and does not include the necessary hardware. Connectivity required to integrate into a BAS or software dashboard
The type of submeters and tiers used depends on the level of detail desired by the building owner as well as the existing building infrastructure. This report will focus on submetering applications that are installed throughout a significant portion of a building, in other words, not just in one tenant space or room, and that are persistent/permanent, not short-term or spot measurement applications.
An additional type of electric submetering application called non-intrusive load monitoring (NILM) uses algorithms to disaggregate and identify load signatures for individual devices and equipment based on data gathered from a single monitoring point, typically at the main source of electricity to the building. 13 Adapted from U.S. Department of Energy, Emerging Technologies Research and Development: DRAFT - Opportunities for Innovations in Sensors and Controls for Building Energy Management, accessed June 17, 2019.
11
This technology has been studied for at least two decades and has been used in the residential sector on a limited scale, however, the use of NILM in the commercial sector poses unique challenges and is still being studied. The primary limitation to using NILM in the commercial sector is the lack of publicly available data on detailed load signatures for commercial building equipment.14 The equipment in commercial buildings is of much larger scale and has fundamentally different characteristics than that of residential building equipment, which has limited the application of this technology in the commercial sector.
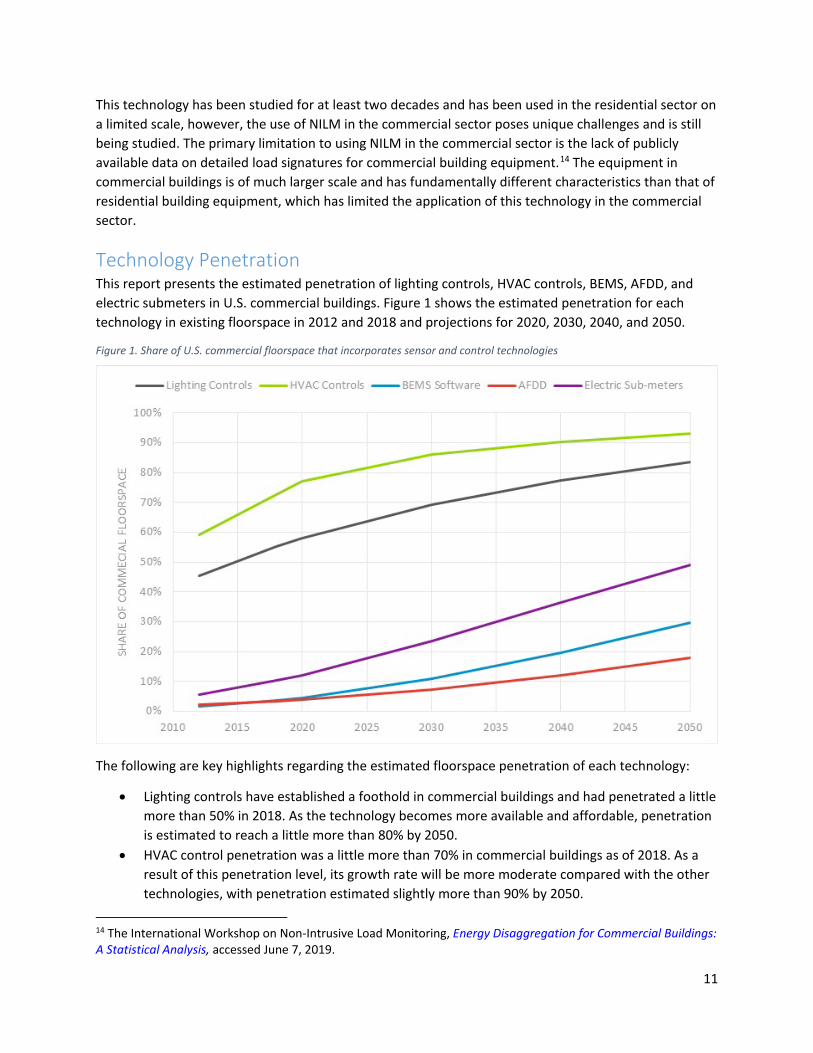
Technology Penetration This report presents the estimated penetration of lighting controls, HVAC controls, BEMS, AFDD, and electric submeters in U.S. commercial buildings. Figure 1 shows the estimated penetration for each technology in existing floorspace in 2012 and 2018 and projections for 2020, 2030, 2040, and 2050.
Figure 1. Share of U.S. commercial floorspace that incorporates sensor and control technologies
The following are key highlights regarding the estimated floorspace penetration of each technology:
• Lighting controls have established a foothold in commercial buildings and had penetrated a little more than 50% in 2018. As the technology becomes more available and affordable, penetration is estimated to reach a little more than 80% by 2050.
• HVAC control penetration was a little more than 70% in commercial buildings as of 2018. As a result of this penetration level, its growth rate will be more moderate compared with the other technologies, with penetration estimated slightly more than 90% by 2050.
14 The International Workshop on Non-Intrusive Load Monitoring, Energy Disaggregation for Commercial Buildings: A Statistical Analysis, accessed June 7, 2019.

12
• BEMS penetration was about 4% in 2018, although it is expected to grow steadily and is estimated to reach about 30% by 2050. (Note, this BEMS penetration is based on buildings that are controlling lighting and HVAC only through BEMS and no other key control technology.) However, growth in penetration for BEMS will be somewhat muted in the short term given that its adoption to date has been more aggressive among sophisticated building managers with data management skills.15 Nonetheless, as the value and understanding of how to implement BEMS technology increases, adoption by the wider market is expected.16
• AFDD penetration was about 4% in 2018 and is forecast to grow steadily through 2050, reaching about 20%. Similar to BEMS software, AFDD is a more sophisticated solution that could pose a challenging learning curve for building managers not as familiar with this technology.
• Submetering in commercial buildings is still an emerging practice and very little data exists on current installed stock. This study assumes 10% commercial floorspace penetration in 2018. Commercial submeter application varies by state and region and is often driven by the utility company and incentives and mandates. Submeter installation has to date largely been influenced by tenant profile with large corporate renters, energy-intensive users, and sustainability-conscious tenants tending to be early adopters. Market forecasts indicate growing interest and cost-effectiveness, and penetration is estimated to reach approximately 50% by 2050.
Methods for estimating base year floorspace penetration Estimates of floorspace penetration by building type are based on a combination of published literature, discussions with industry experts,17 CBECS and Annual Energy Outlook (AEO)18 data, and Navigant Research’s market reports.19 This report does not determine a separate estimate of floorspace with wired and wireless sensors. As noted previously, wired and wireless sensors are sensors that collect data and do not have a controller component. As such, they are integral components of HVAC controls, lighting controls, AFDD, and BEMS and cannot be isolated.
The 2012 floorspace for lighting controls, HVAC controls, and BEMS was extracted from 2012 CBECS data. To estimate lighting controls floorspace, buildings that indicated they controlled their lighting using either a building automation system (BAS), occupancy sensors, or daylight harvesting were used. To estimate HVAC control floorspace, buildings that indicated they either controlled their heating or cooling using BAS, or had a VAV system, demand-controlled ventilation, or economizer were used. Hence, a portion of lighting and HVAC controls floorspace includes BEMS (about 30% of lighting controls floorspace and 50% of HVAC controls floorspace). The report accounts for this overlap to some degree in determining BEMS floorspace. For BEMS, buildings that indicated they controlled their heating, cooling, or lighting using only BAS and no other lighting or HVAC controls (for example, occupancy sensors, VAV) were used. Figure 2 is a high-level illustration of how floorspace and energy savings (discussed in later sections) were determined for these control technologies.
15 Navigant, Intelligent Buildings Market Overview, accessed June 17, 2019. 16 Ibid. 17 Personal communication with Theodore Bohn and Ralph Muehleisen of Argonne National Laboratory and Paul Ehrlich of the Building Intelligence Group, June 26, 2019. 18 U.S. Energy Information Administration, Annual Energy Outlook 2019, accessed June 26, 2019. 19 Navigant Research, Market Data: Advanced Sensors and Electric Sub-meters, 2Q 2018, accessed June 25, 2019.

13
Figure 2. Floorspace methodology for lighting controls, HVAC controls, and BEMS
For AFDD and electric submeters, for which 2012 floorspace could not be determined from CBECS data, AEO2019, Navigant Research data, and a literature review were used. Floorspace for each technology was estimated for 2018 by applying an estimated percentage penetration to the total 2018 commercial floorspace from AEO2019.
AFDD floorspace penetration was estimated to be 4%. This amount was based on Navigant Research market data for the estimated percent revenue of software associated with AFDD out of total building automation revenue20 in 2018.21
To estimate electric submeter floorspace penetration, Leidos reviewed published literature and contacted several building energy experts. No source was able to provide observed or quantifiable data on submeter penetration in commercial buildings. An industry source from Argonne National Laboratory stated that they had "not seen a good reference document with numbers” for submeter penetration.22 One industry source estimated the current share of submetered commercial floor space as very low and probably a “single-digit” percentage.23 A literature source from 2013 estimated that submeters were present in about 10%–15% of commercial and multifamily residential building space at that time.24 To be conservative, this study uses 10% as the estimated 2018 submetered floorspace in commercial buildings.
The 2012 installed stock for AFDD and electric submeters was estimated using the 2018 floorspace as a starting point and interpolating 2012 floorspace. This process was done by building type using a compound annual growth rate (CAGR) determined from 2018 to 2027 Navigant Research market data for each technology.
Because of the lack of more specific data for AFDD and electric submeters, regional breakouts of penetration estimates were made in proportion to the share of all commercial floorspace in each census division by building type from CBECS data.
20 Total building automation revenue data comprised of buildings that had a certain level of automation and included revenue of hardware (for example, sensors and controllers), software, and vendor services. 21 Navigant Research, Intelligent Buildings Overview, 2Q 2018, accessed June 10, 2019. 22 Personal communication with Theodore Bohn, Argonne National Laboratory, June 26, 2019. 23 Personal communication with Paul Ehrlich, Founder, Building Intelligence Group, June 26, 2019. 24 Greentech Media, DOE Launches $100 Electric Submeter Challenge, accessed June 4, 2019.
14
Methods for projecting floorspace growth Using the 2012 and 2018 penetration estimates as a starting point, models were developed for each technology. First, floorspace penetration in 2020, 2030, 2040, and 2050 was projected based on a trend analysis of revenue and unit shipment forecasts from Navigant Research market data.25 This initial projected floorspace was then adapted to a sigmoid, or S-shaped, curve, which exhibits a slow initial adoption followed by a rapid increase and then a slowdown as penetration reaches maximum market penetration. The final projected floorspace was determined by applying the same S-shaped curve equation to each technology’s initial projected floorspace with slight modifications to the slope to best fit the data.
Energy Impacts Commercial building sensors and controls save energy by minimizing energy waste and optimizing building equipment performance. Sensors and controls can automate building processes and provide actionable information to equipment, occupants, and maintenance/operations staff.
Lighting and HVAC controls can ensure applicable equipment is used only when needed through automated responses (for example, occupancy sensors) or manual actions by building occupants and staff (for example, dimmers/switches, thermostats). Energy savings from these controls can vary widely based on the proliferation and sophistication of automated controls and behavior change required to employ manual actions. BEMS, AFDD, wired and wireless sensors, and submeters have the potential to implement efficient use of energy in all building equipment and operations. However, because wired and wireless sensors and submeters only collect data and do not reduce energy consumption directly, their impact will depend on how building automation systems and building operators choose to use the data.
External factors can also affect the effectiveness of controls, in particular, for HVAC. The optimal temperature setpoints are different for day versus night, milder versus colder months, seasons, and types of business operation. Multi-speed fan control may be more effective in hot and mild climates than cold while demand controlled ventilation may have a greater effect in cold climates than warm.26 Longer or shorter hours of daylight may also affect effectiveness of lighting controls.
Figure 3 shows the estimated energy savings for each technology in 2012 and 2018 and projections for 2020, 2030, 2040, and 2050.
25 Navigant Research, Connected Lighting Overview 3Q 2019; Market Data: Advanced Sensors and Electric Sub-meters, 2Q 2018; Intelligent Buildings Market Overview, 2Q 2018; Market Data: Building Energy Management Systems, 3Q 2017; Market Focus: Commercial Building Automation Systems, 2016 (website link to report no longer available), accessed June 25, 2019. 26 Pacific Northwest National Laboratory (PNNL), Energy Savings and Economics of Advanced Control Strategies for Packaged Air-Conditioning Units with Gas Heat, December 2011, accessed June 25, 2019.

15
Figure 3. Projected energy savings for select sensor and control technologies
General methods for estimating and projecting energy impacts Energy savings were determined in the form of all fuel energy use for lighting controls, HVAC controls, BEMS, and AFDD. Because only electric submeters are considered in this study, energy savings were determined in the form of electricity consumption for this technology. Similar to the approach for floorspace penetration, this report does not determine a separate estimate of energy savings from wired and wireless sensors.
To determine energy savings, first, the energy savings from each technology for commercial buildings was estimated. This amount was determined as the percentage energy savings from using the control technology out of the total energy use of the equipment, operation, or both being controlled. For example, percentage energy savings from lighting controls were out of total lighting energy use. A literature review on reported energy savings of buildings sensors and controls was conducted to determine energy savings. Energy savings estimates were mainly based on field studies evaluating specific buildings, simulations using energy modeling software, or analysis of past studies to determine the average energy savings. Because of a lack of detailed data, a combination of literature review and discussions with industry experts was used to estimate energy savings from electric submeters. Using the most recent and comprehensive reported data, where possible, percentage energy savings for each key sensor and control technology were identified. This percentage energy savings for each technology was then applied to each year in the analysis.
Second, the building end-use energy consumption affected by each key sensor and control technology was determined. For lighting controls, HVAC controls, and BEMS, this amount was extracted from 2012 CBECS data for the estimated floorspace penetration determined for each technology. Specifically,
16
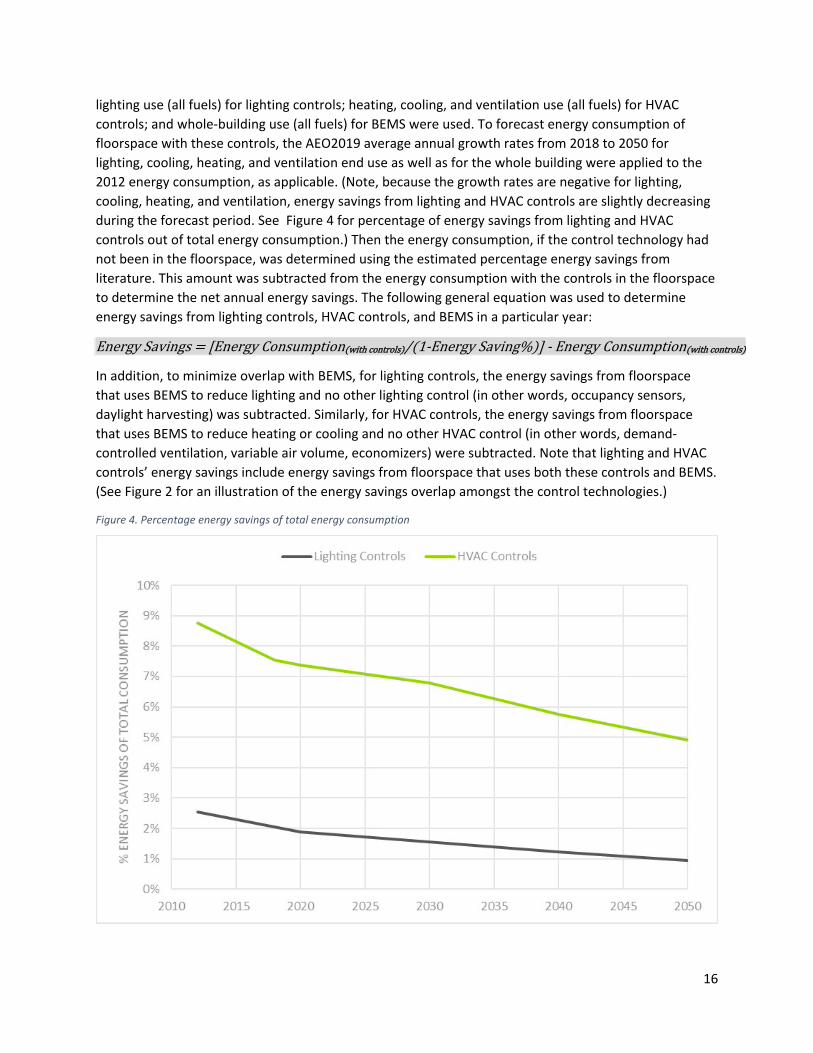
lighting use (all fuels) for lighting controls; heating, cooling, and ventilation use (all fuels) for HVAC controls; and whole-building use (all fuels) for BEMS were used. To forecast energy consumption of floorspace with these controls, the AEO2019 average annual growth rates from 2018 to 2050 for lighting, cooling, heating, and ventilation end use as well as for the whole building were applied to the 2012 energy consumption, as applicable. (Note, because the growth rates are negative for lighting, cooling, heating, and ventilation, energy savings from lighting and HVAC controls are slightly decreasing during the forecast period. See Figure 4 for percentage of energy savings from lighting and HVAC controls out of total energy consumption.) Then the energy consumption, if the control technology had not been in the floorspace, was determined using the estimated percentage energy savings from literature. This amount was subtracted from the energy consumption with the controls in the floorspace to determine the net annual energy savings. The following general equation was used to determine energy savings from lighting controls, HVAC controls, and BEMS in a particular year:
Energy Savings = [Energy Consumption(with controls)/(1-Energy Saving%)] - Energy Consumption(with controls)
In addition, to minimize overlap with BEMS, for lighting controls, the energy savings from floorspace that uses BEMS to reduce lighting and no other lighting control (in other words, occupancy sensors, daylight harvesting) was subtracted. Similarly, for HVAC controls, the energy savings from floorspace that uses BEMS to reduce heating or cooling and no other HVAC control (in other words, demand-controlled ventilation, variable air volume, economizers) were subtracted. Note that lighting and HVAC controls’ energy savings include energy savings from floorspace that uses both these controls and BEMS. (See Figure 2 for an illustration of the energy savings overlap amongst the control technologies.)
Figure 4. Percentage energy savings of total energy consumption
17
For AFDD, whole-building energy consumption is affected, and all fuels energy consumption for the whole building reported in the 2012 CBECS survey and for future years in AEO2019 was used. For electric submeters, whole-building electricity is affected, and electricity consumption reported in the 2012 CBECS survey and for future years in AEO2019 was used. To obtain the energy or electricity consumption of floorspace with each of these control technologies, the percentage floorspace penetration of the technology was applied, as applicable, to the total energy or electricity consumption. This energy or electricity consumption was then multiplied by the estimated percentage energy savings determined from literature reviews. The following general equation was used to determine energy savings for AFDD and electric submeters in a particular year:
Annual Energy Savings = Annual Energy Consumption x Floorspace Penetration % x Energy Savings %
Because of a lack of available regional data, energy savings for each building type are assumed to be proportional to the share of floorspace in each census division.
Energy savings estimates The following sections detail specific assumptions, quantification methods, and data sources for determining the energy savings from the use of each sensor and control technology reviewed in this report.
Lighting controls Lighting controls are estimated to save 24% of lighting energy use, on average, based on a 2011 study by Lawrence Berkeley National Laboratory (LBNL). The 2011 LBNL study evaluated energy savings for occupancy controls (including occupancy sensors, time clocks, energy management system), daylighting (photosensors, time clocks), personal tuning (dimmers, switches, etc), and institutional tuning (dimming ballasts, non-personal dimmers/switches). The study evaluated 240 energy savings estimates from 88 papers and case studies of various commercial building types and determined the energy savings estimates for each control type based on savings reported in energy metrics and for actual installations. The study reported 24% energy savings from occupancy controls to 36% energy savings from institutional tuning of lighting energy use.27 The U.S. Department of Energy’s (DOE) 2015 Lighting Market Characterization (LMC) report estimated lighting use energy savings from dimmers ranging from 5% to 10% and daylighting (photosensors) from 9% to 15% across building types. The 2015 LMC estimate did not include energy savings from occupancy sensors.28 A 2005 Pacific Northwest National Laboratory (PNNL) study used multiple case studies to determine lighting use energy savings of 20%–28% for occupancy sensors and 20%–60% for photosensors.29 Because occupancy sensors are typically used to
27 Lawrence Berkeley National Laboratory (LBNL), A Meta-Analysis of Energy Savings from Lighting Controls in Commercial Buildings, accessed June 17, 2019. 28 U.S. Department of Energy, 2015 US Lighting Market Characterization, accessed June 17, 2019. 29 U.S. Department of Energy, Advanced Sensors and Controls for Building Applications: Market Assessment and Potential R&D Pathways, accessed June 17, 2019.

18
control lighting in buildings, this report uses the 24% lighting energy use savings from occupancy sensors based on the more recent 2011 LBNL study.30
HVAC controls HVAC controls are estimated to save 24% of HVAC energy use, on average, based on a 2011 study conducted by PNNL. The study estimated energy savings from implementing controls (for example, multi-speed supply fan control, demand controlled ventilation, and economizer controls) on packaged heating and cooling units. Energy savings in the range of 24%–35% were estimated using EnergyPlus software to simulate 22 combinations of advanced control strategies in four different building types in 16 climate zones.31 The 2017 ACEEE study also estimated HVAC energy use savings from HVAC controls; specifically, 15%–50% from variable frequency drive controls and 5%–10% from smart thermostats.32 Based on the 2012 CBECS survey, about 40% of floorspace has VAV systems, which typically use variable frequency drive controls. Hence, applying a conservative approach, this report uses the 15% energy savings estimated for variable frequency drive controls.
AFDD A 2005 TIAX study identified faults that could arise in HVAC, lighting, water heating, and refrigeration systems in commercial buildings and then estimated the associated annual energy consumption impact of each type of fault.33 Based on this analysis, the study estimated whole-building energy savings through AFDD to be 2%–11%.34 The 2005 PNNL report estimated a similar range of 5%–15% whole-building energy savings from AFDD.35 This report uses 7% energy savings from AFDD as the midpoint of the more conservative range.
BEMS software BEMS software is estimated to save 10% of whole-building energy use, on average, based on a 2017 ACEEE study.36 The study conducted a literature review and interviewed field experts including utility program administrators, smart technology manufacturers, and smart building practitioners. The 2017 ACEEE study estimated whole-building energy savings from a building automation system that included sensors, controllers, and software to be 10%–25%.37 Applying a conservative approach, this report uses the 10% energy savings estimate from this study. Because these estimates are identified as whole-building energy savings, they likely include some savings through control of lighting and HVAC systems in
30 Lawrence Berkeley National Laboratory (LBNL), A Meta-Analysis of Energy Savings from Lighting Controls in Commercial Buildings, accessed June 17, 2019. 31 U.S. Department of Energy, Energy Savings and Economics of Advanced Control Strategies for Packaged Air-Conditioning Units with Gas Heat, accessed June 17, 2019. 32 American Council for an Energy-Efficient Economy (ACEEE), Smart Buildings: Using Smart Technology to Save Energy in Existing Buildings, accessed June 17, 2019. 33 U.S. Department of Energy, Energy Impact of Commercial Building Controls and Performance Diagnostics: Market Characterization, Energy Impact of Building Faults and Energy Savings Potential, accessed June 17, 2019. 34 Ibid. 35 U.S. Department of Energy, Advanced Sensors and Controls for Building Applications: Market Assessment and Potential R&D Pathways, accessed June 17, 2019. 36 American Council for an Energy-Efficient Economy (ACEEE), Smart Buildings: Using Smart Technology to Save Energy in Existing Buildings, accessed June 17, 2019. 37 Ibid.

19
the building. The 2005 PNNL report estimated 5%–15% whole-building energy savings from energy management control systems, a similar range as the 2017 ACEEE study.38
Whole-building submetering As previously stated, submeters do not directly reduce energy use, rather, they provide the necessary energy data that can establish a basis for behavioral and operational change. In addition, submetering in commercial buildings is not yet a common practice and there is a lack of detailed data at the submeter level. The lack of data combined with the variability in submeter types and installation tiers makes it challenging to estimate energy savings. The energy-saving potential of submetering will vary based on several factors, including building type, building use, climate, the presence of complementary energy management technologies (for example, AFDD, BEMS, etc.), and perhaps most importantly, the inclination of the building owner, occupants, or both to understand and act on the data collected.
Recent industry research has shown that energy savings can occur; however, the savings vary by the type and level of submeter application. Table 3 shows a range of estimated savings from various tiers of submeter installation.39
Table 3. Observed energy savings from various tiers of submeter installation
Action Observed Savings Source of Savings
Installation of meters 0–2% Initial impact, but savings will not persist Bill allocation only 2.5–5% Improved occupant awareness Building tune-up and load management
5–15% Improved awareness, identification of simple operations and maintenance improvements, and managing demand loads per electric rate schedules
Ongoing commissioning 15–45% Improved awareness, ongoing identification of simple operations and maintenance improvements, and continuing management attention
Although submeters do not save energy directly, they do tend to enable or enhance savings from other technologies such as AFDD, BEMS, and other energy management processes such as continuous commissioning. The boost in energy savings is estimated at 5% of electricity consumption on average when submeters are installed.40 This approximated average energy savings is based on the range of savings estimates found in literature from all types of submeter technologies, installation levels, and use cases and represents savings that are in addition to those estimated for other technologies in this study.
38 U.S. Department of Energy, Advanced Sensors and Controls for Building Applications: Market Assessment and Potential R&D Pathways, accessed June 17, 2019. 39 U.S. GSA, Submetering Business Case: How to calculate cost-effective solutions in the building context, accessed June 6, 2019. 40 U.S. Department of Energy, Emerging Technologies Research and Development: DRAFT - Opportunities for Innovations in Sensors and Controls for Building Energy Management, accessed June 9, 2019.

20
Key Trends and Technological Advances The next technological advances in building sensors and controls involve interconnected devices and the use of real-time data, as well as predictive analytics, to optimize building equipment and operations. In general, data analytics can provide useful insight for building operators in real-time. In the age of DR,41 utilities can also benefit from real-time analytics. As a result, some utilities are incentivizing investment in these technologies.
Internet of Things (IoT) and cloud computing can facilitate the connectivity of sensors and controls in buildings. IoT is a concept in which Internet Protocol (IP)-enabled devices collect data that are transmitted to a computer by the internet. Computer algorithms process the data, determine a course of action and accordingly, push commands back to devices to perform functions or notify customers. The underlying technologies include sensors and nodes for data collection, connectivity hardware to communicate and aggregate data, and computer algorithms to analyze the data. Hence IoT-enabled lighting controls, HVAC controls, BEMS, and AFDD can further maximize energy savings in buildings. For example, if a conference room is scheduled to be used, the lights will turn on when the occupants enter the room, and the sensors not only detect the presence of a person but can determine how many people are in the room. That data can then connect to the HVAC system, which can automatically adjust the heating or cooling, based on the number of occupants. Computer algorithms that make adjustments based on historical data gathered and processed (in other words, predictive analysis) can be further enhanced by the use of IoT. Cloud computing can facilitate the deployment of these IoT services. Cloud computing, or the cloud, is the delivery of computing resources over the internet on a pay-for-use basis. The cloud makes storage, management, and processing of data affordable and scalable.
IoT-enabled devices and use of third-party entities may introduce uncertainty by increasing the potential for cybersecurity attacks in commercial buildings.42 Although the industry is also vulnerable to internal attacks (for example, disgruntled employees), third-party breaches represent the primary threat.43
Cost barriers for sensor and control technologies are being overcome by benefits in efficient operations/maintenance and energy savings. As advanced sensors and controllers have become smaller in size and more easily embeddable into equipment, they have decreased in price.44 Another driver for increased implementation of these sensors and controls are building codes and regulations, which are continually adding requirements for improving controllability in the building space. The following sections discuss these trends in market and technology for each sensor and control technology.
41 Demand response (DR) is the ability to reduce load in response to price or other signals from the utility, usually to help meet peak demand. 42 Navigant Research, Cybersecurity Will Define Market Leaders in the Intelligent Buildings Market accessed September 26, 2019. 43 Ibid. 44 American Council for an Energy-Efficient Economy (ACEEE), Smart Buildings: Using Smart Technology to Save Energy in Existing Buildings, accessed June 9, 2019.
21
Lighting controls Technology Trends
• Finer controls: One driver pushing the development of lighting controls technologies is consumer demand for finer control of the lights themselves. Technologies allowing for finer dimming capability, as well as color tuning, enable lighting to be more responsive to occupants’ needs.45
• Effectiveness of LEDs: Growth of LEDs continues in the commercial lighting sector. The DOE Solid-State Lighting (SSL) program estimated that LEDs comprise 12% of total installed lighting stock in 2015 and forecast it to reach 86% by 2035 in the commercial sector.46 In addition to LED luminaires, linear LED tubes47 are emerging as a replacement for the linear fluorescent systems that are widely used in the commercial space. Although LEDs provide increased energy savings, controls add another level of savings—especially when combined with an LED retrofit. In addition, as lighting technology has advanced, the cost of producing LED lighting has decreased dramatically. Lower LED prices will further spur adoption of this technology, and adoption of associated lighting controls will likely increase as well.
• Connected lighting: Connected LED or linear fluorescent lighting is a lighting system with integrated sensors and controllers that are networked (either wired or wireless), allowing lighting products to communicate with each other and transmit data. The DOE SSL program estimated that connected LED lighting comprised about 1% of the lighting market in 2015 and will grow between 9% and 24%48 by 2035 in the commercial space.49
• Smart windows: Windows made of photochromic glass can vary light levels depending on the intensity of sunlight and those with thermochromic glass vary light levels based on ambient outdoor temperature. An LBNL study indicated that these smart windows alone can reduce lighting energy use by 48% to 67% compared with efficient low-emissivity (low-e) windows,50 which do not dynamically vary light.51
Market Trends • Lighting standards/building codes: Regulations can drive the switch to more energy-efficient
lighting such as LEDs, which can, in turn, result in greater penetration of lighting controls. The Energy Independence and Security Act of 2007 established regulation to phase out inefficient light
45 American Council for an Energy-Efficient Economy (ACEEE), The Inconsistency of Dimmers with LED Lamps, accessed August 19, 2019. 46 U.S. Department of Energy, Energy Savings Forecast of Solid-State Lighting in General Illumination Applications, accessed August 19, 2019. 47 Type A LED tubes come with an integrated driver that can be connected to the existing fluorescent ballast. Type B LED tubes have an internal driver and can be wired to the main voltage bypassing the entire fluorescent system. Type C LED tubes have an external drive and require removal of the fluorescent ballast. 48 The lower range represents the continuation of current levels of SSL investment and effort from DOE and industry stakeholders, and the higher range represents the implementation of DOE goals outlined in the annual SSL R&D Plan. 49 U.S. Department of Energy, Energy Savings Forecast of Solid-State Lighting in General Illumination Applications, accessed August 19, 2019. 50 Low-e windows have a coating to minimize infrared and ultraviolet light passing through the glass (in other words, maintaining the temperature) without minimizing visible light entering inside. 51 Lawrence Berkeley National Laboratory, Advancement of Electrochromic Windows, accessed October 21, 2019.

22
bulbs from 2012 to 2014. DOE increased efficiency standards for fluorescent tubes in 2018. Building codes are an additional driver for penetration of advanced lighting control technologies. For example, the 2016 version of American Society of Heating, Refrigerating and Air-Conditioning Engineers (ASHRAE) 90.152 requires either continuous dimming or the ability to dim lights at a point between 50% and 70%, at a point between 20% and 40%, and a point to turn off all controlled lighting.53 Furthermore, interior and exterior retrofits are required to comply with occupancy-based and scheduled full and partial shutoff and bi-level switching specifications.54 Similarly, California’s building energy efficiency standard, Title 24, requires multilevel lighting controls in areas, and certain luminaires have automatic day lighting controls.55
• State/utility incentive programs: According to the Database of State Incentives for Renewables & Efficiency (DSIRE), about 15 active utility or state-based financial incentive programs incorporate lighting controls and sensors.56 For example, Massachusetts’s Mass Save Networked Lighting Controls Initiative offers an up-front incentive of $0.50/square feet for projects that cover at least 25,000 square feet and have at least 150 fixtures controlled by networked controls. It also requires achieving energy savings more than 40% of the baseline.57
• Networked/wireless controls: An increasing number of lighting control solutions network all control points, assigning them unique addresses for individual or group programming. These networks may operate individually or in conjunction with other building systems. Besides increased control over all control points, networked lighting controls also generate data on lighting usage across the systems, providing building managers more insight into energy expenditures. Many manufacturers offer lighting and control solutions that enable control points to communicate wirelessly. Wireless communication eliminates low-voltage wiring, which drives down the cost of controls installation and retrofitting in existing buildings.
• Network interoperability: The market potential for lighting controls could be influenced by consumer confusion regarding what to purchase and fear that systems may become obsolete. Many IoT lighting systems and lighting control systems are proprietary or modified versions of communications protocols, such as ZigBee. Lack of network interoperability can limit a coordinated and holistic approach to controls in a building. Groups, such as the IoT Ready Alliance and the DesignLights Consortium (DLC), are working to address interoperability for IoT lighting and other IoT devices.
HVAC controls Technology Trends
• Self-diagnostics: The ability of HVAC components to self-diagnose and repair can enable the system to reduce unexpected downtime or service interruptions without the need of repair personnel. Self-diagnostic technologies give building operators more control and visibility into potential or emerging
52 ASHRAE 90.1 is the benchmark standard for commercial building energy codes in the U.S. 53 Leviton, Summary of Changes in ASHRAE 90.1 2016, IECC 2015 and Title 24 2016, accessed July 1, 2019. 54 U.S. Department of Energy, What You Need to Know about the New Energy Standard for Commercial Buildings: Standard 90.1-2016, accessed July 1, 2019. 55 California Energy Commission, 2016 Building Energy Efficiency Standards, accessed July 1, 2019. 56 DSIRE, Database of State Incentives for Renewables & Efficiency, accessed August 19, 2019. 57 American Council for an Energy-Efficient Economy (ACEEE), New Horizons for Energy Efficiency: Major Opportunities to Reach Higher Electricity Savings by 2030, accessed August 19, 2019.
23
problems within the system and can also send repair personnel a notification for more complex or extensive system issues.
• Smart HVAC controls: New HVAC technologies such as Nest and Hive allow users to control HVAC systems wirelessly on a smartphone app. Advancement of predictive analytics in these technologies would enable HVAC systems to respond to changes in the environment without human intervention. Although these types of smart HVAC controls are currently focused on the residential space, they could also have applications in commercial buildings.
• Smart windows: As mentioned, windows made of glass can vary light levels by sensing sunlight or temperature. An LBNL study indicated that these smart windows alone can reduce cooling energy use by 19% to 26% compared with efficient low-emissivity (low-e) windows, which do not dynamically vary light.58
Market Trends
• Digitization changing vendor offerings: Data and software capabilities are the key drivers changing current HVAC vendor offerings. The expanded software capabilities built into newer controllers can give vendors the ability to provide new, holistic optimization strategies for the operation of their heating and cooling equipment in conjunction with other building systems.
• Focus on occupant comfort: A growing trend in the commercial buildings market is a focus on occupant health, comfort, and productivity.59 Solutions focus on increasing energy and operational efficiency while simultaneously promoting improved occupant experience. HVAC systems are thought to promote occupant health and productivity when users have more flexibility and control over adjusting room temperature. For example, Comfy, a workplace employee app, allows users to indicate temperature comfort level throughout a building. The company claims that the app can save as much as 20% of energy that would otherwise be consumed.60
• Building codes: Similar to their impact on lighting controls, building codes are a driver for increasing penetration of advanced HVAC controls. Title 24 requires, among other things,
o Controls that can shut off HVAC systems during periods of non-use o HVAC with direct digital control (DDC) to be programmed for automatic demand shed
controls61 o DDC implemented in certain zones to monitor, detect faults, and reset setpoints62
AFDD Technology Trends
• Adaptive and autonomous controls: Dynamic models along with predictive analysis can train building controls to recognize complex patterns and adapt accordingly. This ability can greatly enhance correction of faults and response to external conditions (for example, weather forecasts, grid events) and building equipment conditions over longer temporal and spatial periods.
58 Lawrence Berkeley National Laboratory, Advancement of Electrochromic Windows, accessed October 21, 2019. 59 Navigant, The Occupant Health and Well-Being Trend Continues in 2019, accessed June 17, 2019. 60 American Council for an Energy-Efficient Economy (ACEEE), Smart Buildings: A Deeper Dive into Market Segments, accessed August 19, 2019. 61 Automatic demand shed controls reduce energy consumption by switching off heating or cooling in areas where the target temperature is reached. 62 California Energy Commission, 2016 Building Energy Efficiency Standards, accessed July 1, 2019.
24
• Cloud computing: Detecting, diagnosing, and fixing faults in an entire building requires complex analyses. Cloud computing can enable the performance of such sophisticated data analyses.
Market Trends
• Software-as-a-service: Software-as-a-service (SaaS) model, a distribution model where third-parties serve customers through internet-based applications, has become a typical method for delivering AFDD solutions.63 This model contrasts with earlier models that relied on in-house or direct organizational use, and it also differs from analysis-as-a-service provided by the AFDD vendor. SaaS models reduce costs through the shared nature of the applications. Instead of purchasing a license and installing the application in-house, SaaS models host the application in the cloud, charging customers only as much as they use. SaaS models reduce costs for using AFDD software while retaining customer flexibility. This expansion offers the potential to increase access to the technology and its associated benefits.
• History-based methodologies: Although rule-based methodologies to detect and diagnose faults are still common, vendors are beginning to use process history-based techniques.64 A rule-based system detects faults using a set of rules defined from expert knowledge. A history-based system detects faults by modeling the system using historical data to predict and validate current data from the system. A history-based methodology can treat the system as a black-box, requiring no understanding of how it works, and therefore the methodology can be applied to different types of systems. It does require obtaining historical data to create the model. A rule-based methodology may be limited in detecting faults that are not easily describable by rule, and it may not be able to address more complex issues.65
• Building codes: Both ASHRAE 90.1 and Title 24 require certain air economizers to include fault detection and diagnostic systems. 66,67
BEMS software Technology Trends
• IoT: IoT devices produce large amounts of data that can be integrated to a BEMS system, further enhancing its sophistication and capabilities. Compared with non-IoT BEMS, an IoT-enabled BEMS can provide a greater level of integration by connecting a greater number of sensor and control devices.68
Market Trends
63 Lawrence Berkeley National Laboratory (LBNL), Characterization and Survey of Automated Fault Detection and Diagnostic Tools, accessed June 17, 2019. 64 Ibid. 65 Mattera, C.G.; Quevedo, J.; Escobet, T.; Shaker, H.R.; Jradi, M. A Method for Fault Detection and Diagnostics in Ventilation Units Using Virtual Sensors. Sensors 2018, 18, 3931. 66 California Energy Commission, 2016 Building Energy Efficiency Standards, accessed July 1, 2019. 67 U.S. Department of Energy, What You Need to Know about the New Energy Standard for Commercial Buildings: Standard 90.1-2016, accessed July 1, 2019. 68 Facility Executive, Get Connected: Smart Building and the Internet of Things, accessed August 7, 2019.
25
• State/utility incentive program: According to the DSIRE database, about 18 active utility or state-based financial incentive programs incorporate energy management systems in buildings.69 Some pay-for-performance programs such as in New Jersey and New Hampshire provide incentives for energy reduction at the whole-building level and limit upgrades in certain areas (for example, lighting) to ensure multiple energy-saving measures are made across building systems.70 New York State Energy Research and Development Authority (NYSERDA) provides incentives for the installation of information gathering technologies that provide data necessary to monitor as well as optimize building equipment and operations. 71
• Cost-effective for larger buildings: Because BEMS can cover the square footage of a whole building in one application, larger buildings will have lower installation costs than smaller buildings.72
• Software-as-a-service: Many BEMSs are delivered by SaaS models to appeal to capital-constrained customers who have avoided improvements to legacy systems or investment in traditional controls and automation.
Wired and wireless sensors and sensor networks Technology Trends
• Advanced materials and manufacturing: Sensor performance improvements can benefit from advancements in the properties of the materials used in these devices. Reduced dimensions, modifications to the surface area and chemistry of these materials (for example, carbon nanotubes) have demonstrated during the past two decades the ability to enhance sensitivity of the sensor while reducing bulk.
• Cloud computing: Connecting wireless sensors, which could be monitoring a variety of variables (in other words, lighting, temperature, humidity, CO2) to the cloud, enable the management of a unified network of sensors and provide users more visibility and streamlined control.
Market Trends
• Multifunctional wireless sensor networks: Multifunctional wireless sensors keep costs low by reducing the number of necessary sensors and automating configuration and calibration processes. These wireless sensor networks are automated, plug-and-play, and capable of monitoring multiple parameters through effective power management.
Whole-building submeters Technology Trends
• Low-cost wireless metering: The U.S. Department of Energy issued the Low-Cost Wireless Metering Challenge in 2013 to address issues that affect commercial submeter adoption.73
69 DSIRE, Database of State Incentives for Renewables & Efficiency, accessed August 19, 2019. 70 American Council for an Energy-Efficient Economy (ACEEE), New Horizons for Energy Efficiency: Major Opportunities to Reach Higher Electricity Savings by 2030, accessed August 19, 2019. 71 Ibid. 72 American Council for an Energy-Efficient Economy (ACEEE), Smart Buildings: Using Smart Technology to Save Energy in Existing Buildings, accessed August 19, 2019. 73 U.S. Department of Energy, Low Cost Wireless Metering Challenge, accessed July 3, 2019.

26
These issues include cost and complexity of installation. The technology for submetering at the commercial level can be cost-prohibitive for many building owners. Submeters can range from $700 to more than $5,000 depending on the type and number of meters installed.74,75 Installing submeters can also cause disruption to building activities if power to the building is turned off during installation. In addition, current submeter hardware can take up large amounts of dedicated utility room space and many require manual reading. Current submeter technology also requires regular maintenance by properly trained O&M staff that can add recurring costs. The goal of the challenge was to encourage manufacturers to create a wireless submeter costing less than $100 that could provide reliable wireless data transmission to an onsite collection point and operate independently from existing building networks. Although only one company has met the specifications of the challenge so far, the trend continues to point towards inexpensive wireless submeters.76
• Expanded data collection: Submeters are increasingly used to facilitate sophisticated utility rate tariffs and real-time pricing scenarios.77 Submeters are also being used to measure data elements beyond energy usage including power quality data such as harmonics, power factors, and impulse detection.
Market Trends
• Strong industry growth for submeters: Increasing emphasis on energy efficiency in commercial buildings as well as technology trends such as the Internet of Things (IoT) and cloud computing are expanding the business case for investment in electric submeters. The global electric submeter market is expected to grow at 12% CAGR from 2018 to 2027 and reach more than 4 billion dollars.78 North America is anticipated to lead the global electric submeter market during the forecast period.
• Increasing regulation: As of 2016, 22 states, three counties, and Washington, D.C., had statutes, regulations, or rulings regarding the use of residential, commercial, or industrial submetering.79 New York City’s Local Law 88 (LL88) is a primary example that is expected to have significant impact. It requires all commercial buildings greater than 50,000 square feet to install electric submeters on tenant spaces up to 10,000 square feet by 2025.80 Current ASHRAE building
74 U.S. Department of Energy, Energy Efficiency in Separate Tenant Spaces – A Feasibility Study, accessed June 12, 2019. 75 National Science and Technology Council Committee on Technology. Subcommittee on Buildings Technology Research and Development, Submetering of Building Energy and Water Usage: Analysis and Recommendations of the Subcommittee on Buildings Technology Research and Development, accessed June 4, 2019. 76 EC&M, Submetering Trends in Commercial Buildings, accessed June 14, 2019. 77 Electrical Contractor, Finding Your Way in the Submetering World, accessed July 5, 2019. 78 Market Watch, Global Electric Sub-meter Market World Analysis and Forecast to 2027 & Expand CAGR around 12% during 2018-2027 – Global Demand Analysis & Opportunity Outlook 2027 by Research Nester, accessed June 5, 2019. 79 National Conference of State Legislatures, Utility Submetering, accessed June 14, 2019. 80 NYC Mayor’s Office of Sustainability, LL88: Lighting Upgrades & Sub-metering, accessed June 28, 2019.

27
standards also incorporate a number of submetering-related requirements for all buildings or building additions more than 25,000 square feet.81
Recommended Approach for Modeling and Analysis This report has been commissioned to enhance the modeling capabilities of the Commercial Demand Module (CDM) of the National Energy Modeling System (NEMS).82 The building sensors and control technologies described above may be broadly characterized as conservation measures. In general, the impact of any conservation technology measure is to reduce energy consumption through either a reduction in the demand for service or the improvement of the efficiency with which that service is provided. In the case of control technologies described in this report, the effective impact is to reduce service demand.
For each census division, the CDM estimates aggregate service demand across all fuels, based on service demand intensity, as follows (indices for time (t) and region (r) are implicit):
𝑆𝑆𝑆𝑆𝑆𝑆𝑆𝑆𝑆𝑆𝑆𝑆𝑆𝑆 𝐷𝐷𝑆𝑆𝐷𝐷𝐷𝐷𝐷𝐷𝑑𝑑𝑠𝑠,𝑏𝑏 = 𝑆𝑆𝐷𝐷𝐼𝐼𝑠𝑠,𝑏𝑏 ∗ 𝑆𝑆𝑆𝑆𝑆𝑆𝑇𝑇𝑏𝑏
where:
Service Demand s, b = Energy required to provide the service, expressed in either British thermal units or kilowatthours.
SDI s,b = Service demand intensity, expressed in energy units per square foot.
SQFTb = Floorspace of the considered building type in a given region and year.
Service demand intensity (SDI), defined as the demand for a service per square foot of floorspace, varies with service, building type, and location, but it is currently assumed to remain constant for a given end-use service in a given building type and location. The SDI incorporates the weighted average efficiency of the diverse array of equipment used to provide the service, so any adjustments to service demand will account for the efficiency of existing technology. With the incorporation of control technologies, the SDI is no longer assumed to remain static.
Each of the five classes of control technology (CT) is expected to reduce the demand for specific services in accordance with their applicability to a particular service, its (currently static) measure of impact, and its share of implementation within each building type. Table 4 shows preliminary assumptions about
81 ASHRAE, Standard 90.1 – Energy Standard for Buildings Except Low-Rise Residential Buildings, accessed June 28, 2019. 82 NEMS is a computer-based, energy-economy modeling system for the United States that projects the production, imports, conversion, consumption, and prices of energy, subject to assumptions on macroeconomic and financial factors, world energy markets, resource availability and costs, behavioral and technological choice criteria, cost and performance characteristics of energy technologies, and demographics. NEMS was designed and implemented by the U.S. Energy Information Administration (EIA) of the DOE. The CDM generates projections of commercial sector energy demand through 2050. https://www.eia.gov/outlooks/aeo/nems/documentation/.

28
which services are affected by the various technology choices. It should be noted that electric submetering technologies only affect electric end uses.
Table 4. Services affected by control technology
Service
Control Technology Lighting HVAC BEMS AFDD Submeters
Impact on Service Demand Intensity 24% 24% 10% 7% 5%*
Space Heating
X X X X Space Cooling
X X X X
Water Heating
X X X Ventilation
X X X X
Cooking
X X X Lighting X
X X X
Refrigeration
X X X MELs
X X X
* Impact is for electric end uses only
The technologies reduce the aggregate SDI within each building type as follows:
𝑆𝑆𝐷𝐷𝐼𝐼𝑠𝑠,𝑏𝑏′ = 𝑆𝑆𝐷𝐷𝐼𝐼𝑠𝑠,𝑏𝑏 ∗ � � �1 − 𝑆𝑆𝐷𝐷𝑆𝑆𝑆𝑆𝐷𝐷𝑆𝑆𝑠𝑠𝑠𝑠,𝑏𝑏,𝐶𝐶𝐶𝐶 ∗ 𝑇𝑇𝑆𝑆𝑆𝑆ℎ_𝑃𝑃𝑆𝑆𝐷𝐷𝑏𝑏,𝐶𝐶𝐶𝐶 ∗ 𝐶𝐶𝑇𝑇𝐹𝐹𝐹𝐹𝐹𝐹𝑔𝑔𝑠𝑠,𝐶𝐶𝐶𝐶�
𝑐𝑐𝑐𝑐𝑐𝑐𝐹𝐹𝐶𝐶𝐶𝐶
� ∗ 𝑆𝑆𝑆𝑆𝐷𝐷𝑆𝑆𝐷𝐷𝑆𝑆𝐶𝐶𝐶𝐶1,𝐶𝐶𝐶𝐶2
where:
Savings s, b, CT = Percent reduction in service demand s, in building type b, resulting from the use of control technology CT.
Tech_Pen b, CT = Penetration of control technology CT in building type b.
CT_Flag s, CT = Flag to indicate whether a specific control technology is applicable to a given service.
SynFac = Factor to capture synergistic impact of multiple control technologies (placeholder = 1.0)
The CT flag is a necessary component to restrict application of the technology to services that are related to its use—lighting controls are only applicable to lighting services. HVAC controls affect only heating, cooling, and ventilation. At this stage, we assume that BEMS and AFDD affect all services because our energy savings assumption is based on whole-building energy consumption. For electric submeters, all electric services are assumed to be affected.
It should be noted that this approach does not quantify any superseding or synergistic effects resulting from the use of more than one technology—for example, BEMS and AFDD are considered to have independent impacts on service demand. It may be possible that one system enhances the effectiveness of the other, or alternatively, introduces a redundancy that should be accounted for by

29
reducing the combined impact. This consideration will require additional investigation, and the current placeholder value of SynFac (1.0) may then be adjusted accordingly.
This approach also assumes that each CT is applicable to all building types. If desired, it is possible to establish flags that restrict application to specific building types or to constrain the SDI adjustment to apply to a specific fraction of a building type’s floorspace, such as tailoring the use of lighting occupancy controls in warehouses to that fraction of the floorspace that is actually occupied. For example, in a 200,000 square foot refrigerated warehouse with a 2,000 square foot front office, the impact of office lighting controls would be most appropriately applied to 10% of the floorspace.
Using the national aggregate penetration estimates for each of the CTs and the percentage savings and flags described above, Figure 5 depicts changes in the SDIs of various services resulting from increased adoption of these technologies. (Note that only one line is shown for HVAC systems because the impacts of CTs on heating, cooling, and ventilation are identical in this formulation, and they are presented together for simplicity.)
Figure 5. Service demand intensity index using national aggregate penetration of control technologies (1.0 = service demand intensity with 0% penetration of the control technology)
As noted above, the adjustments to SDI are based on static estimates of the impacts each of these CTs have on service demand, and changes in penetration levels are the only dynamic factor. As each of the control technologies comprises multiple sub-components, it is likely that the estimated marginal savings will change over time as technologies mature and the installation of additional sub-components occurs. For example, as described above, lighting controls cover a range of measures including occupancy controls, institutional tuning, dimmers, and photosensors. Each of these will contribute to the diminution of demand for lighting services, and this report recommends an aggregate savings rate of 24%, while individual measures have demonstrated savings from 5% to as high as 60%. It may be justified to include a modeling provision that adjusts the savings estimate from its current baseline to some maximum specified value that is consistent with the literature.
0.6500
0.7000
0.7500
0.8000
0.8500
0.9000
0.9500
1.0000
1.0500
2012 2014 2016 2018 2020 2022 2024 2026 2028 2030 2032 2034 2036 2038 2040 2042 2044 2046 2048 2050
HVAC Water Heating Lighting
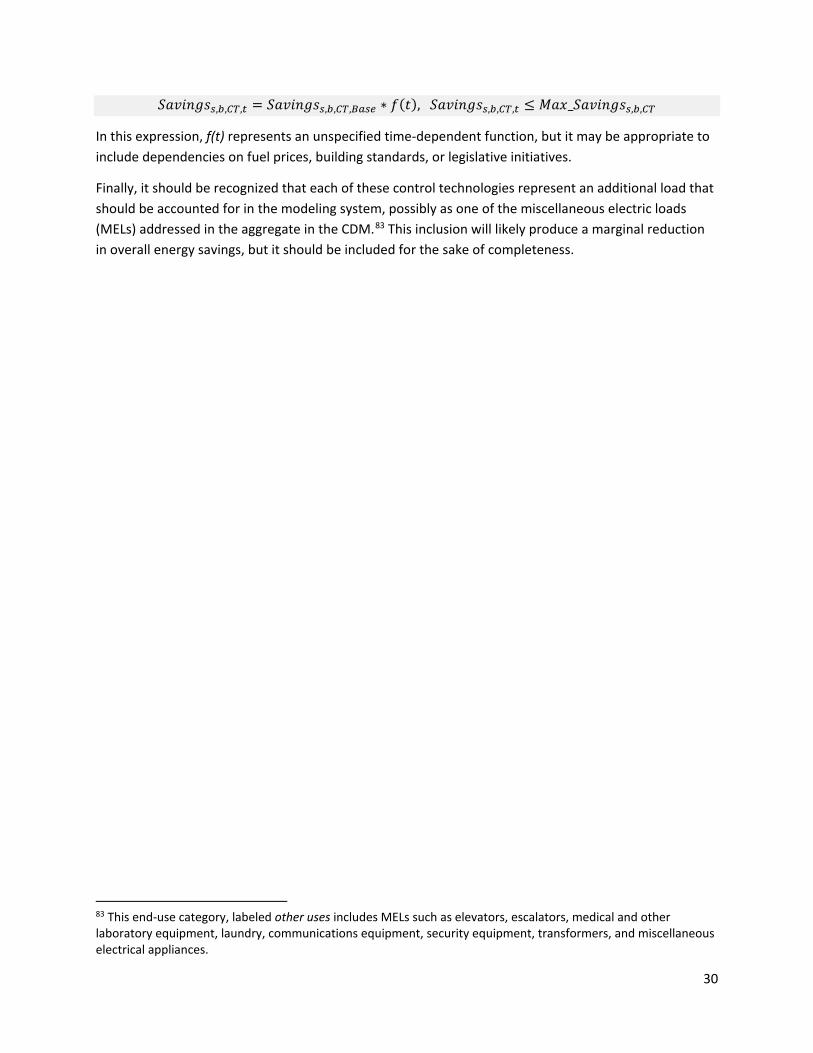
30
𝑆𝑆𝐷𝐷𝑆𝑆𝑆𝑆𝐷𝐷𝑆𝑆𝑠𝑠𝑠𝑠,𝑏𝑏,𝐶𝐶𝐶𝐶,𝑐𝑐 = 𝑆𝑆𝐷𝐷𝑆𝑆𝑆𝑆𝐷𝐷𝑆𝑆𝑠𝑠𝑠𝑠,𝑏𝑏,𝐶𝐶𝐶𝐶,𝐵𝐵𝐹𝐹𝑠𝑠𝐵𝐵 ∗ 𝑓𝑓(𝑡𝑡), 𝑆𝑆𝐷𝐷𝑆𝑆𝑆𝑆𝐷𝐷𝑆𝑆𝑠𝑠𝑠𝑠,𝑏𝑏,𝐶𝐶𝐶𝐶,𝑐𝑐 ≤ 𝑀𝑀𝐷𝐷𝑀𝑀_𝑆𝑆𝐷𝐷𝑆𝑆𝑆𝑆𝐷𝐷𝑆𝑆𝑠𝑠𝑠𝑠,𝑏𝑏,𝐶𝐶𝐶𝐶
In this expression, f(t) represents an unspecified time-dependent function, but it may be appropriate to include dependencies on fuel prices, building standards, or legislative initiatives.
Finally, it should be recognized that each of these control technologies represent an additional load that should be accounted for in the modeling system, possibly as one of the miscellaneous electric loads (MELs) addressed in the aggregate in the CDM.83 This inclusion will likely produce a marginal reduction in overall energy savings, but it should be included for the sake of completeness.
83 This end-use category, labeled other uses includes MELs such as elevators, escalators, medical and other laboratory equipment, laundry, communications equipment, security equipment, transformers, and miscellaneous electrical appliances.