Embed Size (px)
Citation preview
+15%
%
+5
+10
–50
–10–15
Tuition and Fees
Appropriations per FTE (• • • Excluding Federal Stimulus Funds)
2010
-11
2009
-10
2008
-09
2007
-08
2006
-07
2005
-06
2004
-05
2003
-04
2002
-03
2001
-02
2000
-01
1999
-00
1998
-99
1997
-98
1996
-97
1995
-96
1994
-95
1993
-94
1992
-93
1991
-92
1990
-91
1989
-90
1988
-89
1987
-88
1986
-87
1985
-86
1984
-85
1983
-84
1982
-83
1981
-82
1980
-81
Trends in Higher Education Series
Trends inCollege Pricing2011
© 2011 The College Board. College Board, Advanced Placement Program, SAT and the acorn logo are registered trademarks of the College Board. All other products and services may be trademarks of their respective owners. Visit the College Board on the Web: www.collegeboard.org.
About the College Board
The College Board is a mission-driven not-for-profit organization that
connects students to college success and opportunity. Founded in 1900, the
College Board was created to expand access to higher education. Today, the
membership association is made up of more than 5,900 of the world’s leading
educational institutions and is dedicated to promoting excellence and equity in
education. Each year, the College Board helps more than seven million students
prepare for a successful transition to college through programs and services in
college readiness and college success — including the SAT® and the Advanced
Placement Program®. The organization also serves the education community
through research and advocacy on behalf of students, educators and schools.
For further information, visit www.collegeboard.org.
College Board Advocacy & Policy Center
The College Board Advocacy & Policy Center was established to help transform
education in America. Guided by the College Board’s principles of excellence
and equity in education, we work to ensure that students from all backgrounds
have the opportunity to succeed in college and beyond. We make critical
connections between policy, research and real-world practice to develop
innovative solutions to the most pressing challenges in education today.
advocacy.collegeboard.org
TRENDS IN HIGHER EDUCATION SERIES TRENDS IN COLLEGE PRICING 2011 3
For detailed background data and additional information, please visit http://trends.collegeboard.org.
Highlights
Increases in college prices for the 2011-12 academic year reflect the influence of a weak economy and state funding that has not kept up with the growth in college enrollments. For the fifth consecutive year, the percentage increase in average tuition and fees at public four-year institutions was higher than the percentage increase at private nonprofit institutions. Substantial variation across states in pricing patterns makes national averages particularly difficult to interpret this year.
PUBLISHED TUITION AND FEE AND ROOM AND BOARD CHARGESCalifornia’s 2011-12 tuition and fee increases of 21% at public four-year institutions and 37% at public two-year colleges raised the national averages markedly. The increase for the public four-year sector was 7.0% excluding California, and 8.3% including it. The increase for public two-year institutions was 7.4% excluding California, and 8.7% including it.
•Over the decade from 2001-02 to 2011-12, published tuition and fees for in-state students at public four-year colleges and universities increased at an average rate of 5.6% per year beyond the rate of general inflation. This rate of increase compares to 4.5% per year in the 1980s and 3.2% per year in the 1990s.
•Over the decade from 2001-02 to 2011-12, published in-state tuition and fees at public two-year colleges increased at an average rate of 3.8% per year beyond the rate of general inflation. This rate of increase compares to 6.1% per year in the 1980s and 0.5% per year in the 1990s.
•Over the decade from 2001-02 to 2011-12, published tuition and fees at private nonprofit four-year institutions increased at an average rate of 2.6% per year beyond inflation. This rate of increase compares to 4.8% per year in the 1980s and 3.1% per year in the 1990s.
•Published charges do not reflect the prices most students pay. About one-third of full-time students pay for college without the assistance of grant aid, and some of these students receive federal tax credits and deductions to help cover expenses.
•Published in-state tuition and fees at public four-year institutions average $8,244 in 2011-12, $631 (8.3%) higher than in 2010-11. Average total charges, including tuition and fees and room and board, are $17,131, up 6.0% from 2010-11.
•Published out-of-state tuition and fees at public four-year colleges and universities average $20,770, $1,122 (5.7%) higher than in 2010-11. Average total charges are $29,657, up 5.2% from 2010-11.
•Published tuition and fees at public two-year colleges average $2,963, $236 (8.7%) higher than in 2010-11.
•Published tuition and fees at private nonprofit four-year colleges and universities average $28,500 in 2011-12, $1,235 (4.5%) higher than in 2010-11. Average total charges, including tuition and fees and room and board, are $38,589, up 4.4% from 2010-11.
•Estimated published tuition and fees at private for-profit institutions average $14,487 in 2011-12, $447 (3.2%) higher than in 2010-11.
VARIATION IN TUITION AND FEESHalf of all full-time students at public and private nonprofit four-year colleges attend institutions charging tuition and fees of $9,936 or less, and half attend institutions with published prices of $9,936 or more.
•In 2011-12, published in-state tuition and fees at public doctoral universities are $9,185, compared to $7,186 at public master’s universities and $6,604 at public bachelor’s colleges.
•Although the average increase in tuition and fees at public four-year colleges and universities in 2011-12 is 8.3% for in-state students and 5.7% for out-of-state students, 20% of full-time students at public four-year colleges and universities attend institutions that increased their published prices by 12% or more, and 10% attend institutions that increased their prices by less than 3%.
•In 2011-12, average published in-state tuition and fees for public four-year colleges and universities range from $7,056 in the South to $10,494 in New England. Average published in-state tuition and fees for public two-year colleges range from $1,928 in the West to $4,437 in New England.
•California, which enrolls about 10% of the nation’s full-time public four-year college students, has the highest percentage increase in published in-state tuition and fees (21%) for that sector in 2011-12. Arizona and Washington increased published in-state tuition and fees at public four-year institutions by 17% and 16%, respectively. In contrast, increases in Connecticut and South Carolina are about 2.5%.
•California, which enrolls about 15% of the nation’s full-time public two-year college students, also has the highest percentage increase in tuition and fees for this sector (37%) in 2011-12. Alabama and North Carolina increased published tuition and fees at public two-year colleges by 21% and 17%, respectively. In contrast, increases are less than 1% in Rhode Island and between 1% and 2% in Montana and North Dakota.
4 TRENDS IN COLLEGE PRICING 2011 TRENDS IN HIGHER EDUCATION SERIES
For detailed background data and additional information, please visit http://trends.collegeboard.org.
WHAT STUDENTS ACTUALLY PAYIn 2011-12, full-time undergraduates receive an estimated average of about $5,750 in grant aid from all sources and federal tax benefits at public four-year institutions, $15,530 at private nonprofit four-year institutions, and $3,770 at public two-year colleges.
•Between 2006-07 and 2011-12, the average net tuition and fees that in-state students pay at public four-year institutions, after taking grant aid from all sources and federal education tax credits and deductions into consideration, increased at an average rate of 1.4% per year beyond inflation, compared to 5.1% per year for published prices.
•In 2011-12, at both private nonprofit four-year and public two-year institutions, average net tuition and fees paid are lower than they were in 2006-07, after adjusting for inflation.
•In 2007-08, when average published tuition and fees at public four-year colleges ranged from $8,650 at the most selective institutions to $5,150 at those with open admission, average tuition and fees net of all grant aid and tax benefits ranged from $4,278 in the first group to $643 in the latter group.
•In 2007-08, when average published tuition and fees at private nonprofit four-year institutions ranged from $28,080 at the most selective institutions to $14,800 at those with open admission, average tuition and fees net of all grant aid and tax benefits ranged from $16,577 in the first group to $8,247 in the latter group.
COLLEGE AFFORDABILITYIn 2010, average income was lower at all levels of the income distribution than it had been a decade earlier. Declines ranged from 16% in inflation-adjusted dollars for the bottom 20% of families, and 11% for the top 5%, to 3% for families in the 60th to 80th percentiles.
•In 2010, median family income for those with a bachelor’s degree or more was $99,716, compared to $48,332 for those with only a high school diploma.
INSTITUTIONAL FINANCESState appropriations per full-time equivalent (FTE) student declined by 9% in constant dollars in 2008-09, by another 6% in 2009-10, and by 4% in 2010-11.
•State funding per FTE student for higher education institutions was 23% lower in inflation-adjusted dollars in 2010-11 than it had been a decade earlier.
•Subsidies per student — the difference between educational expenditures and net tuition revenues — increased at an average annual rate of 4.1% in inflation-adjusted dollars at private doctoral universities between 2002-03 and 2008-09 and declined in other sectors. The declines ranged from 0.2% at public two-year colleges to 5.6% at private master’s universities.
•In 2008-09, average subsidies per FTE student ranged from $1,470 at private master’s universities to $19,380 at private doctoral universities.
•In 2008-09, the average cost of educating a full-time student ranged from $41,200 at private doctoral institutions, where about one-third of students are graduate students, to $9,300 at public two-year colleges.
ENROLLMENT PATTERNS In 2008, only 2.2% of four-year degree-granting colleges and universities in the U.S. (53 out of 2,401) accepted less than 25% of their applicants. Almost half of all four-year degree-granting institutions (1,144 out of 2,401) were open admission or accepted at least 75% of their applicants.
•At the most selective institutions, where students have strong academic preparation, 83% of students who began their studies at four-year colleges in 2002 had completed degrees at their first institution by fall 2008. Only 27% of students who began at open enrollment institutions and 53% of those who began at institutions accepting at least 75% of their applicants earned degrees at their first institution within six years.
TRENDS IN HIGHER EDUCATION SERIES TRENDS IN COLLEGE PRICING 2011 5
For detailed background data and additional information, please visit http://trends.collegeboard.org.
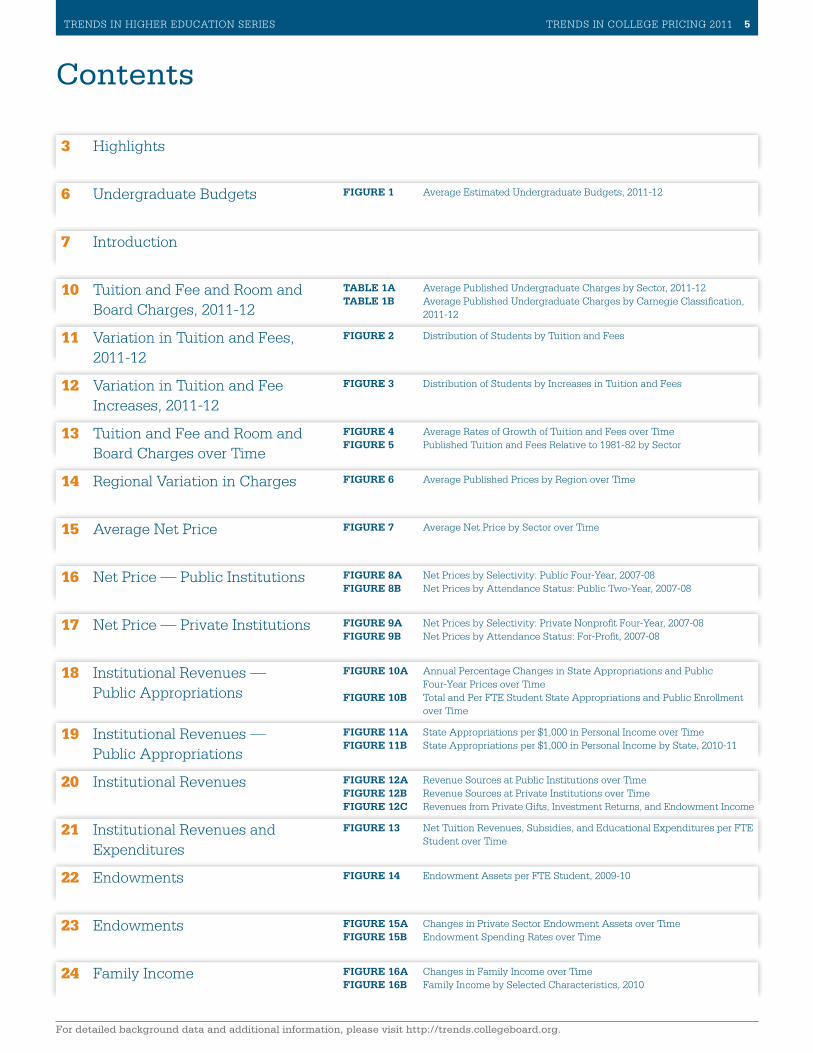
Contents
3 Highlights
6 Undergraduate Budgets FIGURE 1 Average Estimated Undergraduate Budgets, 2011-12
7 Introduction
10 Tuition and Fee and Room and Board Charges, 2011-12
TABLE 1A Average Published Undergraduate Charges by Sector, 2011-12TABLE 1B Average Published Undergraduate Charges by Carnegie Classification,
2011-12
11 Variation in Tuition and Fees, 2011-12
FIGURE 2 Distribution of Students by Tuition and Fees
12 Variation in Tuition and Fee Increases, 2011-12
FIGURE 3 Distribution of Students by Increases in Tuition and Fees
13 Tuition and Fee and Room and Board Charges over Time
FIGURE 4 Average Rates of Growth of Tuition and Fees over TimeFIGURE 5 Published Tuition and Fees Relative to 1981-82 by Sector
14 Regional Variation in Charges FIGURE 6 Average Published Prices by Region over Time
15 Average Net Price FIGURE 7 Average Net Price by Sector over Time
16 Net Price — Public Institutions FIGURE 8A Net Prices by Selectivity: Public Four-Year, 2007-08FIGURE 8B Net Prices by Attendance Status: Public Two-Year, 2007-08
17 Net Price — Private Institutions FIGURE 9A Net Prices by Selectivity: Private Nonprofit Four-Year, 2007-08FIGURE 9B Net Prices by Attendance Status: For-Profit, 2007-08
18 Institutional Revenues — Public Appropriations
FIGURE 10A Annual Percentage Changes in State Appropriations and Public Four-Year Prices over Time
FIGURE 10B Total and Per FTE Student State Appropriations and Public Enrollment over Time
19 Institutional Revenues — Public Appropriations
FIGURE 11A State Appropriations per $1,000 in Personal Income over TimeFIGURE 11B State Appropriations per $1,000 in Personal Income by State, 2010-11
20 Institutional Revenues FIGURE 12A Revenue Sources at Public Institutions over TimeFIGURE 12B Revenue Sources at Private Institutions over TimeFIGURE 12C Revenues from Private Gifts, Investment Returns, and Endowment Income
21 Institutional Revenues and Expenditures
FIGURE 13 Net Tuition Revenues, Subsidies, and Educational Expenditures per FTE Student over Time
22 Endowments FIGURE 14 Endowment Assets per FTE Student, 2009-10
23 Endowments FIGURE 15A Changes in Private Sector Endowment Assets over TimeFIGURE 15B Endowment Spending Rates over Time
24 Family Income FIGURE 16A Changes in Family Income over TimeFIGURE 16B Family Income by Selected Characteristics, 2010
6 TRENDS IN COLLEGE PRICING 2011 TRENDS IN HIGHER EDUCATION SERIES
For detailed background data and additional information, please visit http://trends.collegeboard.org.
Contents — Continued
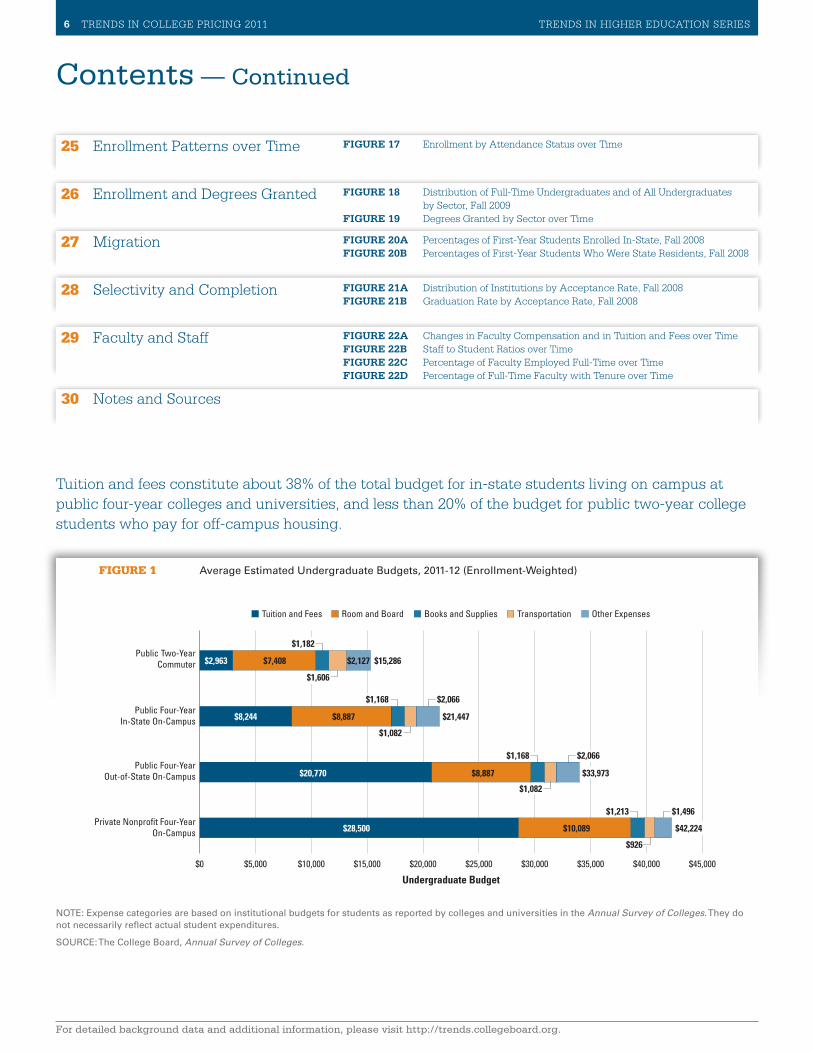
FIGURE 1 Average Estimated Undergraduate Budgets, 2011-12 (Enrollment-Weighted)
Tuition and fees constitute about 38% of the total budget for in-state students living on campus at public four-year colleges and universities, and less than 20% of the budget for public two-year college students who pay for off-campus housing.
NOTE: Expense categories are based on institutional budgets for students as reported by colleges and universities in the Annual Survey of Colleges. They do not necessarily reflect actual student expenditures.
SOURCE: The College Board, Annual Survey of Colleges.
$0 $5,000 $10,000 $15,000 $20,000 $25,000 $30,000 $35,000 $40,000 $45,000
Other ExpensesTransportationBooks and SuppliesRoom and BoardTuition and Fees
Private Nonpro�t Four-YearOn-Campus
Public Four-YearOut-of-State On-Campus
Public Four-YearIn-State On-Campus
Public Two-YearCommuter
Undergraduate Budget
$28,500
$20,770
$8,244
$2,963
$10,089
$8,887
$8,887
$7,408
$1,213
$1,168
$1,168
$1,182
$926
$1,082
$1,082
$1,606
$1,496
$2,066
$2,066
$2,127
$21,447
$15,286
$33,973
$42,224
25 Enrollment Patterns over Time FIGURE 17 Enrollment by Attendance Status over Time
26 Enrollment and Degrees Granted FIGURE 18 Distribution of Full-Time Undergraduates and of All Undergraduates by Sector, Fall 2009
FIGURE 19 Degrees Granted by Sector over Time
27 Migration FIGURE 20A Percentages of First-Year Students Enrolled In-State, Fall 2008FIGURE 20B Percentages of First-Year Students Who Were State Residents, Fall 2008
28 Selectivity and Completion FIGURE 21A Distribution of Institutions by Acceptance Rate, Fall 2008FIGURE 21B Graduation Rate by Acceptance Rate, Fall 2008
29 Faculty and Staff FIGURE 22A Changes in Faculty Compensation and in Tuition and Fees over TimeFIGURE 22B Staff to Student Ratios over TimeFIGURE 22C Percentage of Faculty Employed Full-Time over TimeFIGURE 22D Percentage of Full-Time Faculty with Tenure over Time
30 Notes and Sources
TRENDS IN HIGHER EDUCATION SERIES TRENDS IN COLLEGE PRICING 2011 7
For detailed background data and additional information, please visit http://trends.collegeboard.org.
Introduction
As the 2011-12 academic year begins, the challenging conditions of recent years continue. Persistently high unemployment and weak state economies put increasing pressures on state and institutional budgets as well as student and family resources. College prices continue to rise more rapidly than the amount institutions spend to educate students, with tuition carrying a growing share of the financing of postsecondary education at a time when students and families are ill-equipped to manage additional expenses.
Federal stimulus funds augmented state funding to institutions for three years. In addition, federal student aid — particularly Pell Grants, veterans benefits, and tuition tax credits — has become more generous in recent years. But concerns over the deficit make it difficult to be optimistic about the federal government continuing to increase its contribution to college financing. New solutions will be required if the United States is to have any measurable success in increasing its overall educational attainment and reversing the decline in the economic opportunities available to the least advantaged members of our society.
Trends in College Pricing provides detailed information about college prices and some of the factors affecting those prices. The cost of producing education is a major factor, and the report includes data on institutional expenditure patterns. But prices also depend on the nontuition revenues available to colleges and universities. Data on state appropriations, endowments, and other revenue sources provide insight into the forces affecting the share of costs borne by tuition revenues. Developing a more thorough understanding of all the forces affecting prices would require better historical data on the expenditure patterns of colleges and universities than is currently available, as well as careful empirical analysis of all contributing forces, and is beyond the scope of this report.
Providing high-quality higher education is expensive. We must find ways to stem the growth in both the costs — the resources invested — and the prices paid by students and families. But even if that effort is successful, the priority placed on investing in education will have to be greater at all levels of government, as well as among students and families, in order to improve the quality of education, prepare a better-educated labor force, and create a stronger economy and a healthier society. Postsecondary institutions will have to find ways to offer high-quality education in a more cost-effective manner. State and federal governments will have to improve their systems for supporting both institutions and the students they educate. The data provided in Trends in College Pricing can inform policymakers, researchers, and others in their analyses of these issues.
The companion publication, Trends in Student Aid, contains detailed information about the financial aid that helps students
and families pay these prices. The website that accompanies the two publications makes data easily available for reference and downloading. The text that accompanies the graphs and tables in Trends in College Pricing does not summarize all of the information reported, but points to key ideas and should help readers interpret the data.
PUBLISHED PRICES
The published prices on which the analysis in Trends in College Pricing is based come from data reported by institutions on the College Board’s Annual Survey of Colleges. This survey, which is distributed to nearly 4,000 postsecondary institutions across the country, collects a wealth of data on enrollment, admission, degrees and majors, tuition, financial aid, and other aspects of undergraduate education.
The prices reported here are averages for one year of full-time enrollment. About 37% of all undergraduates and 59% of those attending public two-year colleges are enrolled part-time. Because of the variety of enrollment and pricing patterns, it is not possible to provide estimates of the charges facing these students that would be as accurate as the information we provide about full-time students. Data on full-time charges provide the best basis for comparison both over time and across sectors.
The prices included in Trends in College Pricing represent best estimates of average prices for all full-time undergraduate students. However, a growing number of institutions charge different prices for different years and/or for different programs of study. We are able to incorporate differences in prices by year of study reported to us by individual institutions, but not differences by programs. Another complexity that has developed in recent years concerns the division of institutions into the public two-year and public four-year sectors. More and more two-year colleges are offering a small number of four-year degrees or providing course work that leads to four-year degrees awarded on other campuses. While we make every effort to adjust our methodology to accommodate these changes, it is impossible to draw precise lines and to develop exact measures in all cases.
Trends in College Pricing 2011 presents detailed data on public two-year and four-year and private nonprofit four-year institutions for the 2011-12 academic year. Comparable information about the growing for-profit sector of postsecondary education, which enrolls about 13% of all full-time students, is not available. We do provide an estimate of the average charges at for-profit institutions, but because of the relatively small sample of those institutions from which we are able to collect data, it is important to interpret that information with caution.
8 TRENDS IN COLLEGE PRICING 2011 TRENDS IN HIGHER EDUCATION SERIES
For detailed background data and additional information, please visit http://trends.collegeboard.org.
Finally, when interpreting college prices, it is important to remember that Trends in College Pricing reports on the price of one year of college. Many students require more than two years of study to earn an associate degree or more than four years of study to earn a bachelor’s degree. It is critical to consider the total price for all years of study when thinking about what is required to pay for college. There is considerable variation across sectors as well as among institutions within sectors in both average time to degree and overall graduation rates.
TUITION AND FEES VERSUS TOTAL CHARGES
Some of the graphs in this report focus only on tuition and fee charges, but we also report room and board charges for residential students, living costs for commuter students, and other components of student budgets. Because tuition and fees are relevant for all enrolled students, they are easiest to compare. However, whether students live on or off campus, they all must also pay for housing and food, buy books and supplies, and cover transportation and other basic living costs.
Room and board and other living costs are not really part of the cost of attending college. These are expenses people face whether or not they are in school. The largest real cost many students face is forgone earnings. It is very difficult to succeed in college while working full-time. However, the cost of students’ time is difficult to measure, and we make no attempt to do so in this report. Because students tend to think of living expenses as part of the cost of going to college, and because they must come up with the funds to cover these outlays, it is useful to use these expenses as a proxy for forgone earnings.
The cost of living poses a significant hurdle for many students. Even those who receive grant aid sufficient to cover tuition and fee charges may struggle to cover living expenses. It is not so much the prices charged by institutions, but the very real costs students incur by devoting their time to school and forgoing the income needed to support themselves and their families while in school, that create the burden for these students.
NET PRICES: WHAT STUDENTS ACTUALLY PAY
Although it is generally the published prices that make headlines, it is the net prices paid by individual students that matter most for college access and affordability. This concept will become more familiar as students and families use the new net price calculators that all colleges and universities participating in federal student aid programs are required by Congress to post on their websites as of Oct. 29, 2011.
The definition of “net price” on which we rely is the average price paid by all full-time students — including those who do and do not receive student aid — after subtracting grant aid from all sources in addition to federal tax credits and deductions. Data on prices from the Annual Survey of Colleges and on student aid from Trends in Student Aid allow us to generate new, updated estimates for average net prices by sector each year. Data from the National Postsecondary Student Aid Study, released every four years, allow us to estimate net prices for students at different income levels and enrolled in different types of institutions. This year we include our annual average net price calculation, as well as comparisons of net prices at institutions with different levels of selectivity.
HOW COLLEGE PRICES ARE CHANGING
The data in this report confirm the widespread perception that published college prices are rising more rapidly than the prices of other goods and services. This is not a new phenomenon, but one that has persisted over the entire 30-year period documented here. The rate of increase in published prices in the four-year public sector has been higher over the past decade than in previous decades, but the same is not true for the public two-year and private nonprofit four-year sectors.
About one-third of full-time students pay the full published tuition price with no grant assistance. The prices these students pay have increased very rapidly. For example, students receiving neither grants nor tax benefits are paying an average of 8.3% more in tuition and fees at public four-year colleges this year than they paid last year. In addition, the nontuition expenses associated with going to college continue to rise, and grant aid is rarely sufficient to meet those costs. Another very significant issue is that, as documented in Figure 16A, incomes have declined over the past decade for families at all levels of the income distribution. In addition, the assets many families have saved to pay for college have diminished in value. In other words, rising tuition levels cause more problems because of the economic environment in which they are occurring.
Neither changes in average published prices nor changes in average net prices necessarily describe the circumstances facing individual students. There is considerable variation in prices across sectors and across states and regions as well as among institutions within these categories. College students in the United States have a wide variety of educational institutions from which to choose, and these come with many different price tags. Moreover, different students pay different prices at the same institution. One of the problems many students face is how to make sense of all the options and complex pricing structures.
TRENDS IN HIGHER EDUCATION SERIES TRENDS IN COLLEGE PRICING 2011 9
For detailed background data and additional information, please visit http://trends.collegeboard.org.
Annual percentage increases in tuition and fees consistently receive most of the attention, but the price level and the dollar increases in the price level matter most to students and families. Small percentage increases at colleges and universities with high tuition and fee levels may translate into large dollar increases. At lower-priced institutions, larger percentage increases have less impact on affordability.
Total postsecondary enrollment increased by about 22% between 2005-06 and 2010-11. Full-time enrollment increased more rapidly than part-time enrollment. The largest increases have been in public two-year colleges and for-profit institutions. The fact that students are finding ways to finance their education is largely explained by the understanding that more education generally leads to higher earnings throughout life. Nonetheless, the reality that more students and families are struggling to pay for higher education, both during the college years and in the following years when education loans must be repaid, suggests that the current path of increases in published college prices is not likely to be sustainable.
THE CONSUMER PRICE INDEX
We provide much of our data in constant dollars, adjusting values for changes in the Consumer Price Index (CPI). We use the change in the CPI from July 2010 to July 2011 to compare the price level for academic year 2011-12 to earlier prices. (Because Trends in College Pricing 2011 publishes data in fall 2011 for the current academic year, we must rely on the change in the price level in the year preceding the beginning of the term.) While the CPI adjustment is necessary to make meaningful comparisons of values over long periods of time, comparisons of one-year changes in constant dollars may be confusing. Large fluctuations in energy prices have led to an
unusually volatile CPI in recent years. The 5.6% increase in the CPI from July 2007 to July 2008 was the highest annual inflation rate since 1982. As a result, constant dollar increases for 2008 were small relative to current dollar increases. Between July 2008 and July 2009, the CPI declined by 2.1%, which resulted in constant dollar increases that were larger than current dollar increases. The CPI increased by 1.2% between July 2009 and July 2010, and by 3.6% from 2010 to 2011.
A NOTE ON TRENDS DATA
While the information reported here provides a best approximation of trends in college charges over time, we would caution readers about placing too much reliance on either precise dollar amounts or precise annual percentage changes. Each year we revise the average prices calculated the previous year to account for corrected data we receive from institutions and to provide an enrollment-weighted average based on the most recent available data on the number of full-time students attending each institution. If, over time, increasing numbers of students were to enroll in the lower-priced institutions within a sector, our measure of the average price increase would be lower than if enrollment were stable. Details relating to our methodology and to other technical issues and data reliability can be found at the end of the report, in the Notes and Sources section.
The tables supporting all of the graphs in the Trends publications, PDF versions of the publications, PowerPoint files containing individual slides for all of the graphs, and other detailed data on student aid and college pricing are available on our website at http://trends.collegeboard.org. Please feel free to cite or reproduce the data in Trends for noncommercial purposes with proper attribution.
10 TRENDS IN COLLEGE PRICING 2011 TRENDS IN HIGHER EDUCATION SERIES
For detailed background data and additional information, please visit http://trends.collegeboard.org.
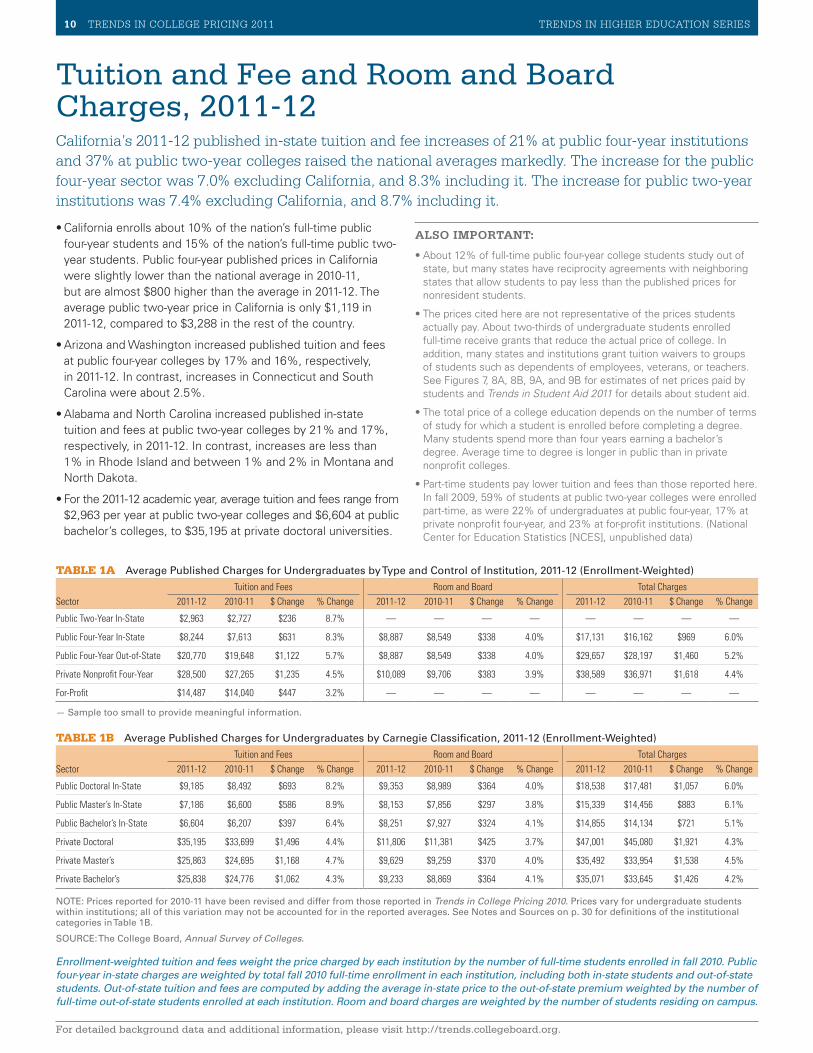
Tuition and Fee and Room and Board Charges, 2011-12California’s 2011-12 published in-state tuition and fee increases of 21% at public four-year institutions and 37% at public two-year colleges raised the national averages markedly. The increase for the public four-year sector was 7.0% excluding California, and 8.3% including it. The increase for public two-year institutions was 7.4% excluding California, and 8.7% including it.
•California enrolls about 10% of the nation’s full-time public four-year students and 15% of the nation’s full-time public two-year students. Public four-year published prices in California were slightly lower than the national average in 2010-11, but are almost $800 higher than the average in 2011-12. The average public two-year price in California is only $1,119 in 2011-12, compared to $3,288 in the rest of the country.
•Arizona and Washington increased published tuition and fees at public four-year colleges by 17% and 16%, respectively, in 2011-12. In contrast, increases in Connecticut and South Carolina were about 2.5%.
•Alabama and North Carolina increased published in-state tuition and fees at public two-year colleges by 21% and 17%, respectively, in 2011-12. In contrast, increases are less than 1% in Rhode Island and between 1% and 2% in Montana and North Dakota.
•For the 2011-12 academic year, average tuition and fees range from $2,963 per year at public two-year colleges and $6,604 at public bachelor’s colleges, to $35,195 at private doctoral universities.
ALSO IMPORTANT:
•About 12% of full-time public four-year college students study out of state, but many states have reciprocity agreements with neighboring states that allow students to pay less than the published prices for nonresident students.
•The prices cited here are not representative of the prices students actually pay. About two-thirds of undergraduate students enrolled full-time receive grants that reduce the actual price of college. In addition, many states and institutions grant tuition waivers to groups of students such as dependents of employees, veterans, or teachers. See Figures 7, 8A, 8B, 9A, and 9B for estimates of net prices paid by students and Trends in Student Aid 2011 for details about student aid.
•The total price of a college education depends on the number of terms of study for which a student is enrolled before completing a degree. Many students spend more than four years earning a bachelor’s degree. Average time to degree is longer in public than in private nonprofit colleges.
•Part-time students pay lower tuition and fees than those reported here. In fall 2009, 59% of students at public two-year colleges were enrolled part-time, as were 22% of undergraduates at public four-year, 17% at private nonprofit four-year, and 23% at for-profit institutions. (National Center for Education Statistics [NCES], unpublished data)
TABLE 1A Average Published Charges for Undergraduates by Type and Control of Institution, 2011-12 (Enrollment-Weighted)
Tuition and Fees Room and Board Total ChargesSector 2011-12 2010-11 $ Change % Change 2011-12 2010-11 $ Change % Change 2011-12 2010-11 $ Change % Change
Public Two-Year In-State $2,963 $2,727 $236 8.7% — — — — — — — —
Public Four-Year In-State $8,244 $7,613 $631 8.3% $8,887 $8,549 $338 4.0% $17,131 $16,162 $969 6.0%
Public Four-Year Out-of-State $20,770 $19,648 $1,122 5.7% $8,887 $8,549 $338 4.0% $29,657 $28,197 $1,460 5.2%
Private Nonprofit Four-Year $28,500 $27,265 $1,235 4.5% $10,089 $9,706 $383 3.9% $38,589 $36,971 $1,618 4.4%
For-Profit $14,487 $14,040 $447 3.2% — — — — — — — —
— Sample too small to provide meaningful information.
TABLE 1B Average Published Charges for Undergraduates by Carnegie Classification, 2011-12 (Enrollment-Weighted)
Tuition and Fees Room and Board Total ChargesSector 2011-12 2010-11 $ Change % Change 2011-12 2010-11 $ Change % Change 2011-12 2010-11 $ Change % Change
Public Doctoral In-State $9,185 $8,492 $693 8.2% $9,353 $8,989 $364 4.0% $18,538 $17,481 $1,057 6.0%
Public Master’s In-State $7,186 $6,600 $586 8.9% $8,153 $7,856 $297 3.8% $15,339 $14,456 $883 6.1%
Public Bachelor’s In-State $6,604 $6,207 $397 6.4% $8,251 $7,927 $324 4.1% $14,855 $14,134 $721 5.1%
Private Doctoral $35,195 $33,699 $1,496 4.4% $11,806 $11,381 $425 3.7% $47,001 $45,080 $1,921 4.3%
Private Master’s $25,863 $24,695 $1,168 4.7% $9,629 $9,259 $370 4.0% $35,492 $33,954 $1,538 4.5%
Private Bachelor’s $25,838 $24,776 $1,062 4.3% $9,233 $8,869 $364 4.1% $35,071 $33,645 $1,426 4.2%
NOTE: Prices reported for 2010-11 have been revised and differ from those reported in Trends in College Pricing 2010. Prices vary for undergraduate students within institutions; all of this variation may not be accounted for in the reported averages. See Notes and Sources on p. 30 for definitions of the institutional categories in Table 1B.
SOURCE: The College Board, Annual Survey of Colleges.
Enrollment-weighted tuition and fees weight the price charged by each institution by the number of full-time students enrolled in fall 2010. Public four-year in-state charges are weighted by total fall 2010 full-time enrollment in each institution, including both in-state students and out-of-state students. Out-of-state tuition and fees are computed by adding the average in-state price to the out-of-state premium weighted by the number of full-time out-of-state students enrolled at each institution. Room and board charges are weighted by the number of students residing on campus.
TRENDS IN STUDENT AID 2010 11TRENDS IN HIGHER EDUCATION SERIES TRENDS IN COLLEGE PRICING 2011 11
For detailed background data and additional information, please visit http://trends.collegeboard.org.
Variation in Tuition and Fees, 2011-12
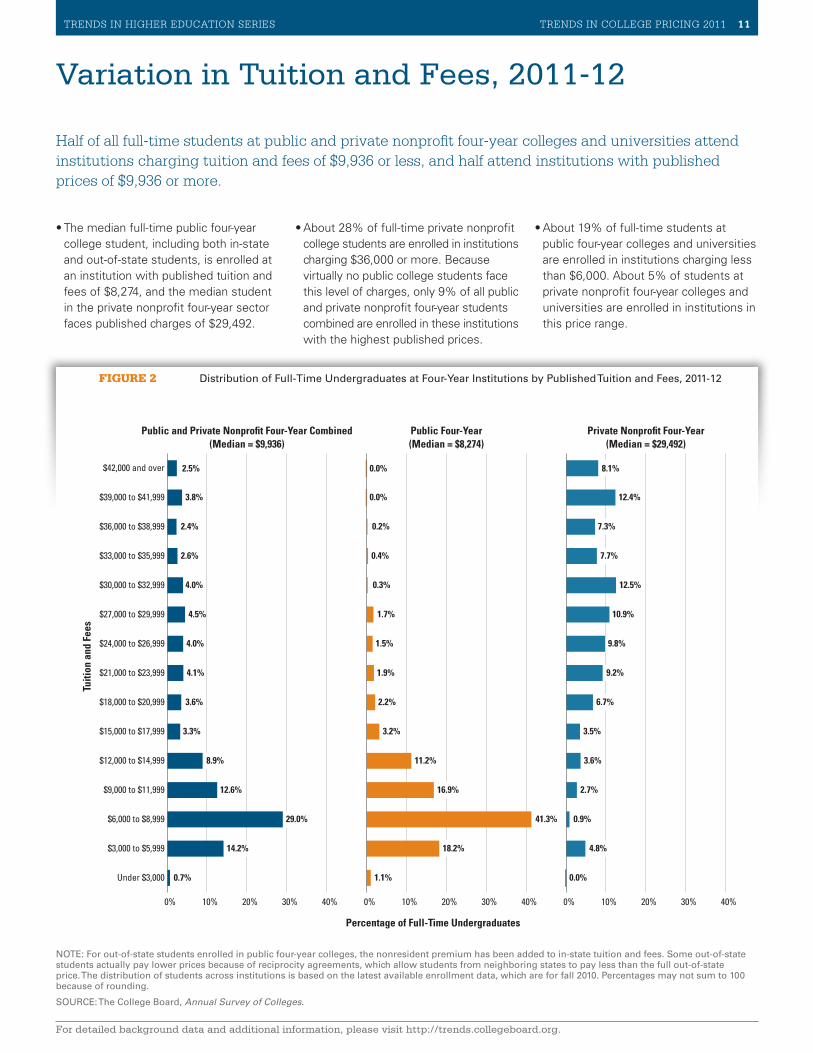
FIGURE 2 Distribution of Full-Time Undergraduates at Four-Year Institutions by Published Tuition and Fees, 2011-12
Half of all full-time students at public and private nonprofit four-year colleges and universities attend institutions charging tuition and fees of $9,936 or less, and half attend institutions with published prices of $9,936 or more.
•The median full-time public four-year college student, including both in-state and out-of-state students, is enrolled at an institution with published tuition and fees of $8,274, and the median student in the private nonprofit four-year sector faces published charges of $29,492.
•About 28% of full-time private nonprofit college students are enrolled in institutions charging $36,000 or more. Because virtually no public college students face this level of charges, only 9% of all public and private nonprofit four-year students combined are enrolled in these institutions with the highest published prices.
•About 19% of full-time students at public four-year colleges and universities are enrolled in institutions charging less than $6,000. About 5% of students at private nonprofit four-year colleges and universities are enrolled in institutions in this price range.
NOTE: For out-of-state students enrolled in public four-year colleges, the nonresident premium has been added to in-state tuition and fees. Some out-of-state students actually pay lower prices because of reciprocity agreements, which allow students from neighboring states to pay less than the full out-of-state price. The distribution of students across institutions is based on the latest available enrollment data, which are for fall 2010. Percentages may not sum to 100 because of rounding.
SOURCE: The College Board, Annual Survey of Colleges.
Percentage of Full-Time Undergraduates
Public and Private Nonpro�t Four-Year Combined Public Four-Year Private Nonpro�t Four-Year
Tuiti
on a
nd F
ees
0% 10% 20% 30% 40%0% 10% 20% 30% 40%0% 10% 20% 30% 40%
Under $3,000
$3,000 to $5,999
$6,000 to $8,999
$9,000 to $11,999
$12,000 to $14,999
$15,000 to $17,999
$18,000 to $20,999
$21,000 to $23,999
$24,000 to $26,999
$27,000 to $29,999
$30,000 to $32,999
$33,000 to $35,999
$36,000 to $38,999
$39,000 to $41,999
$42,000 and over
(Median = $9,936) (Median = $8,274) (Median = $29,492)
0.7%
14.2%
29.0%
12.6%
8.9%
3.3%
3.6%
4.1%
4.0%
4.5%
4.0%
2.6%
2.4%
3.8%
2.5%
1.1%
18.2%
41.3%
16.9%
11.2%
3.2%
2.2%
1.9%
1.5%
1.7%
0.3%
0.4%
0.2%
0.0%
0.0%
0.0%
4.8%
0.9%
2.7%
3.6%
3.5%
6.7%
9.2%
9.8%
10.9%
12.5%
7.7%
7.3%
12.4%
8.1%
12 TRENDS IN COLLEGE PRICING 2011 TRENDS IN HIGHER EDUCATION SERIES
For detailed background data and additional information, please visit http://trends.collegeboard.org.
Variation in Tuition and Fee Increases, 2011-12
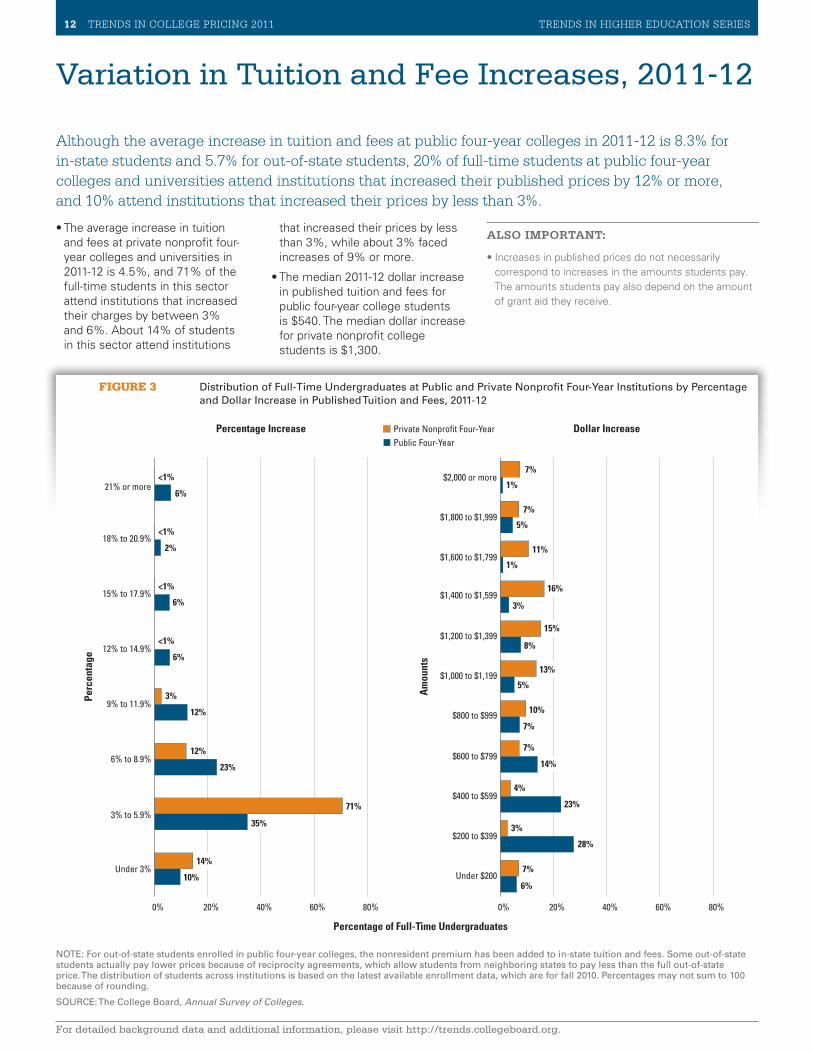
Although the average increase in tuition and fees at public four-year colleges in 2011-12 is 8.3% for in-state students and 5.7% for out-of-state students, 20% of full-time students at public four-year colleges and universities attend institutions that increased their published prices by 12% or more, and 10% attend institutions that increased their prices by less than 3%.
•The average increase in tuition and fees at private nonprofit four-year colleges and universities in 2011-12 is 4.5%, and 71% of the full-time students in this sector attend institutions that increased their charges by between 3% and 6%. About 14% of students in this sector attend institutions
that increased their prices by less than 3%, while about 3% faced increases of 9% or more.
•The median 2011-12 dollar increase in published tuition and fees for public four-year college students is $540. The median dollar increase for private nonprofit college students is $1,300.
ALSO IMPORTANT:
•Increases in published prices do not necessarily correspond to increases in the amounts students pay. The amounts students pay also depend on the amount of grant aid they receive.
FIGURE 3 Distribution of Full-Time Undergraduates at Public and Private Nonprofit Four-Year Institutions by Percentage and Dollar Increase in Published Tuition and Fees, 2011-12
NOTE: For out-of-state students enrolled in public four-year colleges, the nonresident premium has been added to in-state tuition and fees. Some out-of-state students actually pay lower prices because of reciprocity agreements, which allow students from neighboring states to pay less than the full out-of-state price. The distribution of students across institutions is based on the latest available enrollment data, which are for fall 2010. Percentages may not sum to 100 because of rounding.
SOURCE: The College Board, Annual Survey of Colleges.
0% 20% 40% 60% 80%
Under $200
$200 to $399
$400 to $599
$600 to $799
$800 to $999
$1,000 to $1,199
$1,200 to $1,399
$1,400 to $1,599
$1,600 to $1,799
$1,800 to $1,999
$2,000 or more
0% 20% 40% 60% 80%
Public Four-YearPrivate Nonpro�t Four-Year
Under 3%
3% to 5.9%
6% to 8.9%
9% to 11.9%
12% to 14.9%
15% to 17.9%
18% to 20.9%
21% or more
Percentage of Full-Time Undergraduates
Percentage Increase Dollar IncreaseA
mou
nts
Perc
enta
ge
10%
35%
23%
12%
6%
6%
2%
6%
14%
71%
12%
3%
<1%
<1%
<1%
<1%
6%
28%
23%
14%
7%
5%
8%
3%
1%
5%
1%
7%
3%
4%
7%
10%
13%
15%
16%
11%
7%
7%
TRENDS IN HIGHER EDUCATION SERIES TRENDS IN COLLEGE PRICING 2011 13
For detailed background data and additional information, please visit http://trends.collegeboard.org.
Tuition and Fee and Room and Board Charges over Time
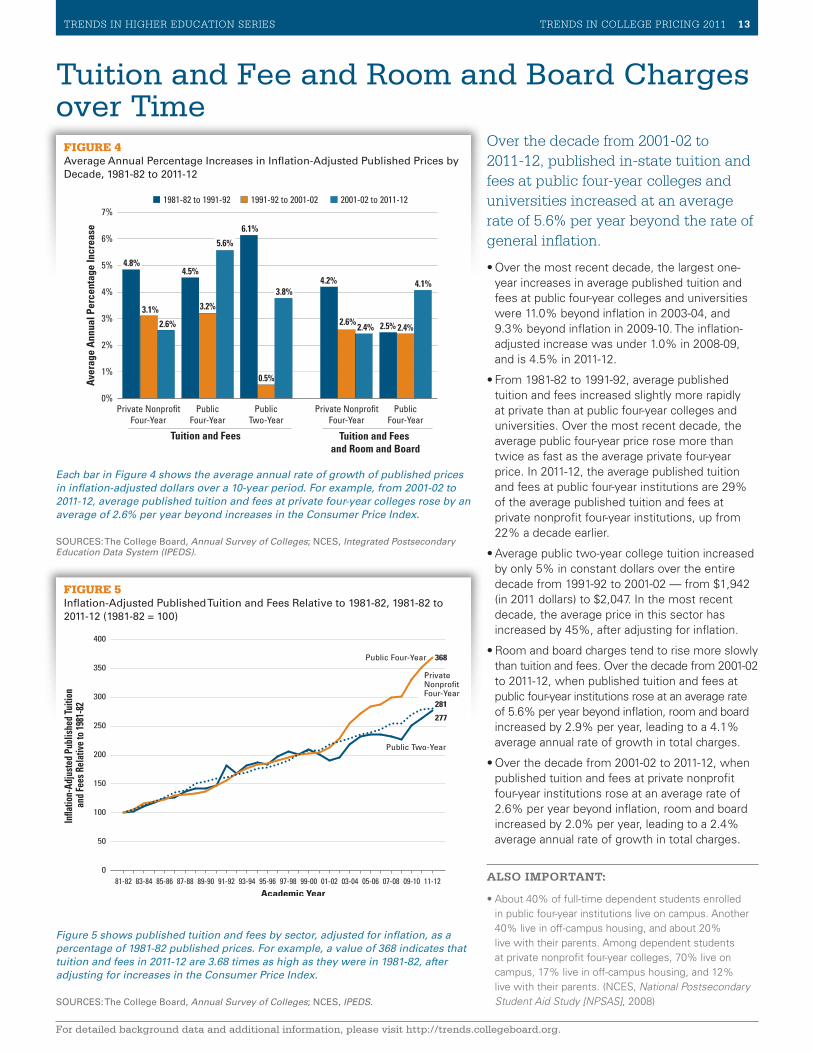
Over the decade from 2001-02 to 2011-12, published in-state tuition and fees at public four-year colleges and universities increased at an average rate of 5.6% per year beyond the rate of general inflation.
•Over the most recent decade, the largest one-year increases in average published tuition and fees at public four-year colleges and universities were 11.0% beyond inflation in 2003-04, and 9.3% beyond inflation in 2009-10. The inflation-adjusted increase was under 1.0% in 2008-09, and is 4.5% in 2011-12.
•From 1981-82 to 1991-92, average published tuition and fees increased slightly more rapidly at private than at public four-year colleges and universities. Over the most recent decade, the average public four-year price rose more than twice as fast as the average private four-year price. In 2011-12, the average published tuition and fees at public four-year institutions are 29% of the average published tuition and fees at private nonprofit four-year institutions, up from 22% a decade earlier.
•Average public two-year college tuition increased by only 5% in constant dollars over the entire decade from 1991-92 to 2001-02 — from $1,942 (in 2011 dollars) to $2,047. In the most recent decade, the average price in this sector has increased by 45%, after adjusting for inflation.
•Room and board charges tend to rise more slowly than tuition and fees. Over the decade from 2001-02 to 2011-12, when published tuition and fees at public four-year institutions rose at an average rate of 5.6% per year beyond inflation, room and board increased by 2.9% per year, leading to a 4.1% average annual rate of growth in total charges.
•Over the decade from 2001-02 to 2011-12, when published tuition and fees at private nonprofit four-year institutions rose at an average rate of 2.6% per year beyond inflation, room and board increased by 2.0% per year, leading to a 2.4% average annual rate of growth in total charges.
ALSO IMPORTANT:
•About 40% of full-time dependent students enrolled in public four-year institutions live on campus. Another 40% live in off-campus housing, and about 20% live with their parents. Among dependent students at private nonprofit four-year colleges, 70% live on campus, 17% live in off-campus housing, and 12% live with their parents. (NCES, National Postsecondary Student Aid Study [NPSAS], 2008)
FIGURE 4Average Annual Percentage Increases in Inflation-Adjusted Published Prices by Decade, 1981-82 to 2011-12
FIGURE 5Inflation-Adjusted Published Tuition and Fees Relative to 1981-82, 1981-82 to 2011-12 (1981-82 = 100)
Each bar in Figure 4 shows the average annual rate of growth of published prices in inflation-adjusted dollars over a 10-year period. For example, from 2001-02 to 2011-12, average published tuition and fees at private four-year colleges rose by an average of 2.6% per year beyond increases in the Consumer Price Index.
SOURCES: The College Board, Annual Survey of Colleges; NCES, Integrated Postsecondary Education Data System (IPEDS).
Figure 5 shows published tuition and fees by sector, adjusted for inflation, as a percentage of 1981-82 published prices. For example, a value of 368 indicates that tuition and fees in 2011-12 are 3.68 times as high as they were in 1981-82, after adjusting for increases in the Consumer Price Index.
SOURCES: The College Board, Annual Survey of Colleges; NCES, IPEDS.
In�a
tion-
Adju
sted
Pub
lishe
d Tu
ition
an
d Fe
es R
elat
ive
to 19
81-8
2
0
50
100
150
200
250
300
350
400
Academic Year11-1209-1007-0805-0603-0401-0299-0097-9895-9693-9491-9289-9087-8885-8683-8481-82
368
281
277
Public Two-Year
Public Four-Year
Private Nonpro�t Four-Year
0%
1%
2%
3%
4%
5%
6%
Aver
age
Ann
ual P
erce
ntag
e In
crea
se
Tuition and Fees Tuition and Fees and Room and Board
PublicFour-Year
Private Nonpro�tFour-Year
PublicTwo-Year
PublicFour-Year
Private Nonpro�tFour-Year
2001-02 to 2011-121991-92 to 2001-021981-82 to 1991-927%
4.8%4.5%
6.1%
4.2%
2.5%
3.1% 3.2%
0.5%
2.6%2.4%2.6%
5.6%
3.8%
2.4%
4.1%
14 TRENDS IN COLLEGE PRICING 2011 TRENDS IN HIGHER EDUCATION SERIES
For detailed background data and additional information, please visit http://trends.collegeboard.org.
Regional Variation in Charges
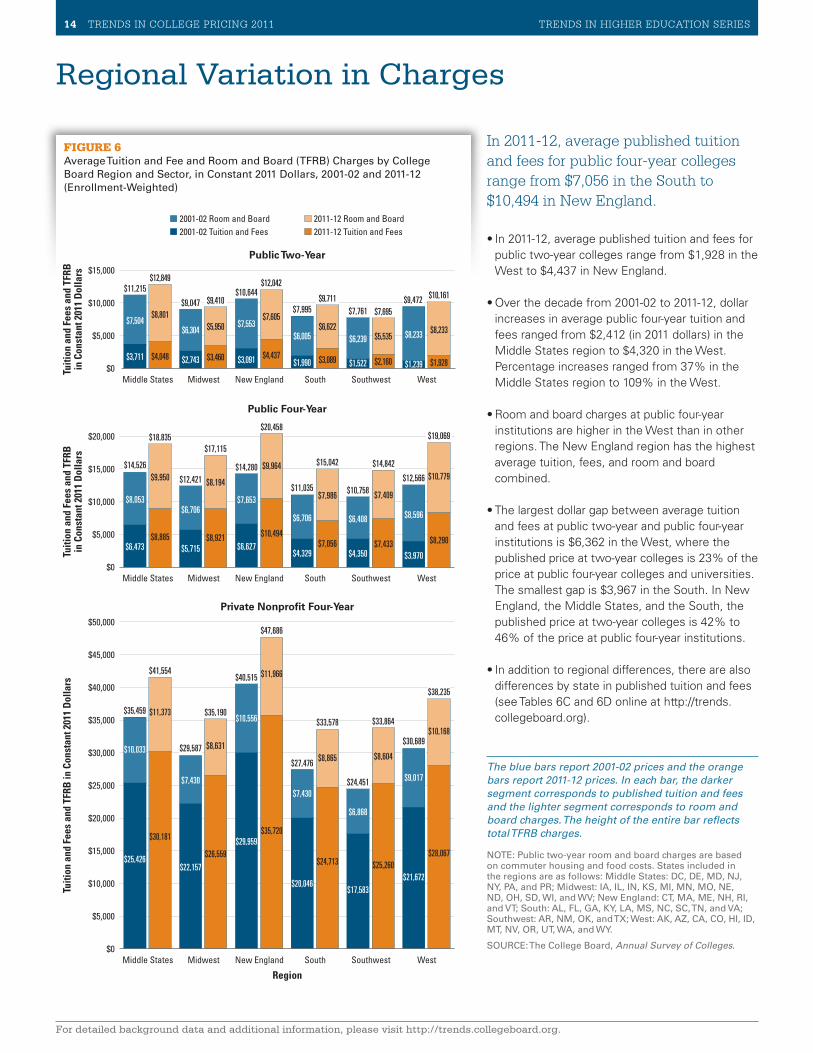
In 2011-12, average published tuition and fees for public four-year colleges range from $7,056 in the South to $10,494 in New England.
•In 2011-12, average published tuition and fees for public two-year colleges range from $1,928 in the West to $4,437 in New England.
•Over the decade from 2001-02 to 2011-12, dollar increases in average public four-year tuition and fees ranged from $2,412 (in 2011 dollars) in the Middle States region to $4,320 in the West. Percentage increases ranged from 37% in the Middle States region to 109% in the West.
•Room and board charges at public four-year institutions are higher in the West than in other regions. The New England region has the highest average tuition, fees, and room and board combined.
•The largest dollar gap between average tuition and fees at public two-year and public four-year institutions is $6,362 in the West, where the published price at two-year colleges is 23% of the price at public four-year colleges and universities. The smallest gap is $3,967 in the South. In New England, the Middle States, and the South, the published price at two-year colleges is 42% to 46% of the price at public four-year institutions.
•In addition to regional differences, there are also differences by state in published tuition and fees (see Tables 6C and 6D online at http://trends.collegeboard.org).
FIGURE 6Average Tuition and Fee and Room and Board (TFRB) Charges by College Board Region and Sector, in Constant 2011 Dollars, 2001-02 and 2011-12 (Enrollment-Weighted)
The blue bars report 2001-02 prices and the orange bars report 2011-12 prices. In each bar, the darker segment corresponds to published tuition and fees and the lighter segment corresponds to room and board charges. The height of the entire bar reflects total TFRB charges.
NOTE: Public two-year room and board charges are based on commuter housing and food costs. States included in the regions are as follows: Middle States: DC, DE, MD, NJ, NY, PA, and PR; Midwest: IA, IL, IN, KS, MI, MN, MO, NE, ND, OH, SD, WI, and WV; New England: CT, MA, ME, NH, RI, and VT; South: AL, FL, GA, KY, LA, MS, NC, SC, TN, and VA; Southwest: AR, NM, OK, and TX; West: AK, AZ, CA, CO, HI, ID, MT, NV, OR, UT, WA, and WY.
SOURCE: The College Board, Annual Survey of Colleges. $0
$5,000
$10,000
$15,000
$20,000
$25,000
$30,000
$35,000
$40,000
$45,000
$50,000
WestSouthwestSouthNew England
Region
Private Nonpro�t Four-Year
Public Four-Year
Public Two-Year
MidwestMiddle States
$0
$5,000
$10,000
$15,000
$20,000
WestSouthwestSouthNew EnglandMidwestMiddle States
$0
$5,000
$10,000
$15,000
WestSouthwestSouthNew EnglandMidwestMiddle States
2001-02 Room and Board2001-02 Tuition and Fees
2011-12 Room and Board2011-12 Tuition and Fees
Tuiti
on a
nd F
ees
and
TFRB
in C
onst
ant 2
011
Dol
lars
Tuiti
on a
nd F
ees
and
TFRB
in C
onst
ant 2
011
Dol
lars
Tuiti
on a
nd F
ees
and
TFRB
in C
onst
ant 2
011
Dol
lars
$3,711 $4,048
$8,801
$12,849
$2,743 $3,460
$5,950
$9,410
$3,091 $4,437
$7,605
$12,042
$1,990 $3,089
$6,622
$9,711
$1,522 $2,160
$5,535
$7,695
$1,239 $1,928
$8,233
$10,161
$6,473$8,885
$8,053
$9,950$14,526
$18,835
$5,715$8,921
$6,706
$8,194$12,421
$17,115
$6,627
$10,494
$7,653
$9,964$14,280
$20,458
$4,329$7,056
$6,706
$7,986$11,035
$15,042
$4,350$7,433
$6,408
$7,409$10,758
$14,842
$3,970
$8,290
$8,596
$10,779$12,566
$19,069
$25,426
$30,181
$10,033
$11,373$35,459
$41,554
$22,157
$26,559
$7,430
$8,631$29,587
$35,190
$29,959$35,720
$10,556
$11,966$40,515
$47,686
$20,046
$24,713
$7,430
$8,865$27,476
$33,578
$17,583
$25,260
$6,868
$8,604
$24,451
$33,864
$21,672
$28,067
$9,017
$10,168$30,689
$38,235
$7,504$6,304
$7,553$6,005 $6,239 $8,233
$11,215
$9,047$10,644
$7,995 $7,761$9,472
TRENDS IN STUDENT AID 2010 15TRENDS IN HIGHER EDUCATION SERIES TRENDS IN COLLEGE PRICING 2011 15
For detailed background data and additional information, please visit http://trends.collegeboard.org.
Average Net Price
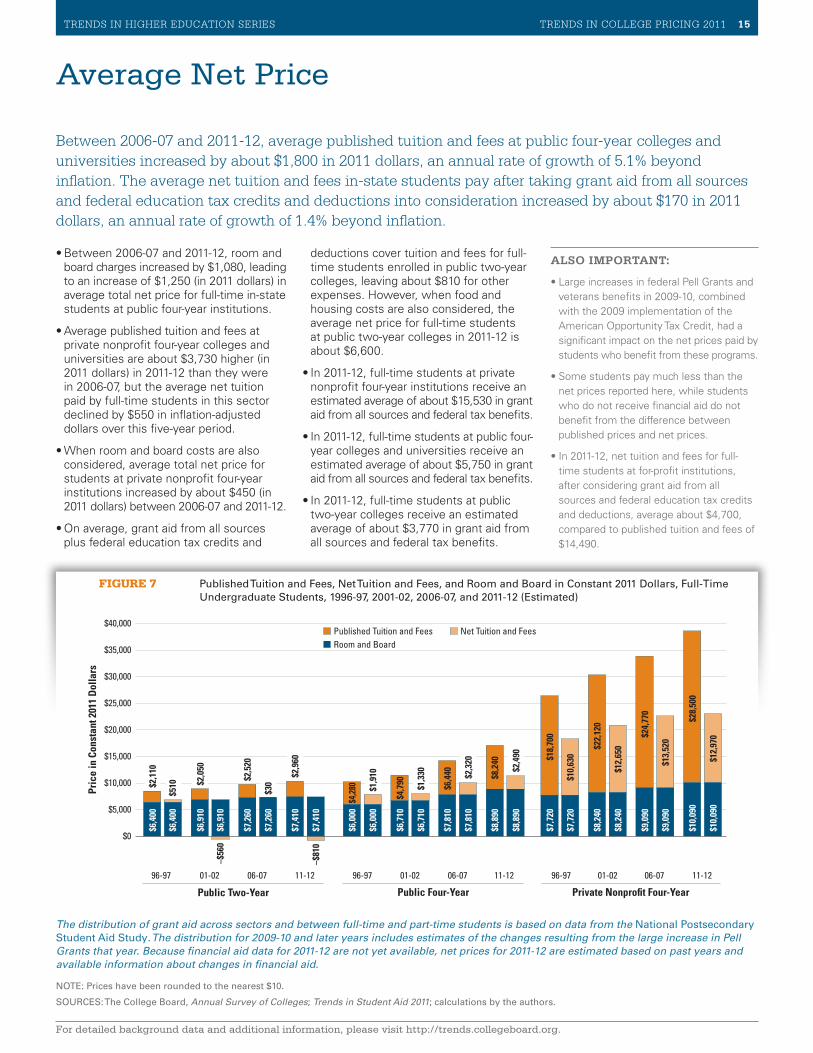
Between 2006-07 and 2011-12, average published tuition and fees at public four-year colleges and universities increased by about $1,800 in 2011 dollars, an annual rate of growth of 5.1% beyond inflation. The average net tuition and fees in-state students pay after taking grant aid from all sources and federal education tax credits and deductions into consideration increased by about $170 in 2011 dollars, an annual rate of growth of 1.4% beyond inflation.
FIGURE 7 Published Tuition and Fees, Net Tuition and Fees, and Room and Board in Constant 2011 Dollars, Full-Time Undergraduate Students, 1996-97, 2001-02, 2006-07, and 2011-12 (Estimated)
Pric
e in
Con
stan
t 201
1 D
olla
rs
$5,000
$10,000
$15,000
$20,000
$25,000
$30,000
$35,000
$40,000
Private Nonpro�t Four-YearPublic Four-YearPublic Two-Year
11-1206-0701-0296-9711-1206-0701-0296-9711-1206-0701-0296-97
Net Tuition and FeesPublished Tuition and FeesRoom and Board
$0
$6,4
00
$6,9
10
$7,2
60
$7,4
10
$6,0
00
$6,7
10
$7,8
10
$8,8
90
$7,7
20
$8,2
40
$9,0
90
$10,
090
$2,1
10
$510 $2
,050
–$56
0
$2,5
20
$30
$2,9
60
–$81
0
$4,28
0 $1,9
10
$4,7
90 $1,3
30
$6,4
40 $2,3
20
$8,2
40
$2,4
90 $18,
700
$10,
630
$22,
120
$12,
650
$24,
770
$13,
520
$28,
500
$12,
970
$6,4
00
$6,9
10
$7,2
60
$7,4
10
$6,0
00
$6,7
10
$7,8
10
$8,8
90
$7,7
20
$8,2
40
$9,0
90
$10,
090
The distribution of grant aid across sectors and between full-time and part-time students is based on data from the National Postsecondary Student Aid Study. The distribution for 2009-10 and later years includes estimates of the changes resulting from the large increase in Pell Grants that year. Because financial aid data for 2011-12 are not yet available, net prices for 2011-12 are estimated based on past years and available information about changes in financial aid.
NOTE: Prices have been rounded to the nearest $10.
SOURCES: The College Board, Annual Survey of Colleges; Trends in Student Aid 2011; calculations by the authors.
•Between 2006-07 and 2011-12, room and board charges increased by $1,080, leading to an increase of $1,250 (in 2011 dollars) in average total net price for full-time in-state students at public four-year institutions.
•Average published tuition and fees at private nonprofit four-year colleges and universities are about $3,730 higher (in 2011 dollars) in 2011-12 than they were in 2006-07, but the average net tuition paid by full-time students in this sector declined by $550 in inflation-adjusted dollars over this five-year period.
•When room and board costs are also considered, average total net price for students at private nonprofit four-year institutions increased by about $450 (in 2011 dollars) between 2006-07 and 2011-12.
•On average, grant aid from all sources plus federal education tax credits and
deductions cover tuition and fees for full-time students enrolled in public two-year colleges, leaving about $810 for other expenses. However, when food and housing costs are also considered, the average net price for full-time students at public two-year colleges in 2011-12 is about $6,600.
•In 2011-12, full-time students at private nonprofit four-year institutions receive an estimated average of about $15,530 in grant aid from all sources and federal tax benefits.
•In 2011-12, full-time students at public four-year colleges and universities receive an estimated average of about $5,750 in grant aid from all sources and federal tax benefits.
•In 2011-12, full-time students at public two-year colleges receive an estimated average of about $3,770 in grant aid from all sources and federal tax benefits.
ALSO IMPORTANT:
•Large increases in federal Pell Grants and veterans benefits in 2009-10, combined with the 2009 implementation of the American Opportunity Tax Credit, had a significant impact on the net prices paid by students who benefit from these programs.
•Some students pay much less than the net prices reported here, while students who do not receive financial aid do not benefit from the difference between published prices and net prices.
•In 2011-12, net tuition and fees for full-time students at for-profit institutions, after considering grant aid from all sources and federal education tax credits and deductions, average about $4,700, compared to published tuition and fees of $14,490.
16 TRENDS IN COLLEGE PRICING 2011 TRENDS IN HIGHER EDUCATION SERIES
For detailed background data and additional information, please visit http://trends.collegeboard.org.
Net Price — Public Institutions
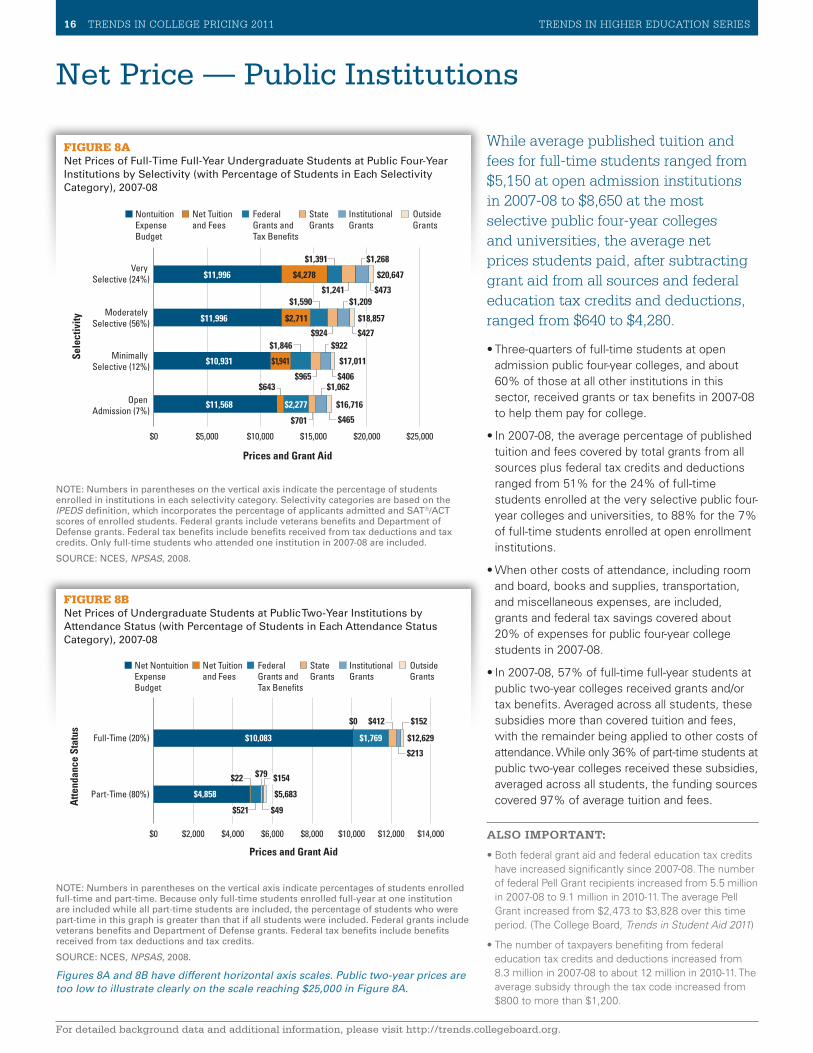
While average published tuition and fees for full-time students ranged from $5,150 at open admission institutions in 2007-08 to $8,650 at the most selective public four-year colleges and universities, the average net prices students paid, after subtracting grant aid from all sources and federal education tax credits and deductions, ranged from $640 to $4,280.
•Three-quarters of full-time students at open admission public four-year colleges, and about 60% of those at all other institutions in this sector, received grants or tax benefits in 2007-08 to help them pay for college.
•In 2007-08, the average percentage of published tuition and fees covered by total grants from all sources plus federal tax credits and deductions ranged from 51% for the 24% of full-time students enrolled at the very selective public four-year colleges and universities, to 88% for the 7% of full-time students enrolled at open enrollment institutions.
•When other costs of attendance, including room and board, books and supplies, transportation, and miscellaneous expenses, are included, grants and federal tax savings covered about 20% of expenses for public four-year college students in 2007-08.
•In 2007-08, 57% of full-time full-year students at public two-year colleges received grants and/or tax benefits. Averaged across all students, these subsidies more than covered tuition and fees, with the remainder being applied to other costs of attendance. While only 36% of part-time students at public two-year colleges received these subsidies, averaged across all students, the funding sources covered 97% of average tuition and fees.
ALSO IMPORTANT:
•Both federal grant aid and federal education tax credits have increased significantly since 2007-08. The number of federal Pell Grant recipients increased from 5.5 million in 2007-08 to 9.1 million in 2010-11. The average Pell Grant increased from $2,473 to $3,828 over this time period. (The College Board, Trends in Student Aid 2011)
•The number of taxpayers benefiting from federal education tax credits and deductions increased from 8.3 million in 2007-08 to about 12 million in 2010-11. The average subsidy through the tax code increased from $800 to more than $1,200.
FIGURE 8ANet Prices of Full-Time Full-Year Undergraduate Students at Public Four-Year Institutions by Selectivity (with Percentage of Students in Each Selectivity Category), 2007-08
FIGURE 8BNet Prices of Undergraduate Students at Public Two-Year Institutions by Attendance Status (with Percentage of Students in Each Attendance Status Category), 2007-08
NOTE: Numbers in parentheses on the vertical axis indicate percentages of students enrolled full-time and part-time. Because only full-time students enrolled full-year at one institution are included while all part-time students are included, the percentage of students who were part-time in this graph is greater than that if all students were included. Federal grants include veterans benefits and Department of Defense grants. Federal tax benefits include benefits received from tax deductions and tax credits.
SOURCE: NCES, NPSAS, 2008.
Figures 8A and 8B have different horizontal axis scales. Public two-year prices are too low to illustrate clearly on the scale reaching $25,000 in Figure 8A.
$0 $5,000 $10,000 $15,000 $20,000 $25,000
Moderately Selective (56%)
Sele
ctiv
ity
Prices and Grant Aid
Open Admission (7%)
Minimally Selective (12%)
Very Selective (24%)
Outside Grants
Institutional Grants
State Grants
Federal Grants and Tax Bene�ts
Net Tuition and Fees
Nontuition Expense Budget
$11,568
$643
$2,277
$1,062
$701 $465
$16,716
$10,931 $1,941
$1,846
$965
$922
$406
$17,011
$11,996 $2,711
$1,590
$924
$1,209
$427
$18,857
$11,996 $4,278
$1,391
$1,241
$1,268
$473
$20,647
$0 $2,000 $4,000 $6,000 $8,000 $10,000 $12,000
Prices and Grant Aid
Atte
ndan
ce S
tatu
s
$14,000
Full-Time (20%)
Part-Time (80%)
Outside Grants
Institutional Grants
State Grants
Federal Grants and Tax Bene�ts
Net Tuition and Fees
Net Nontuition Expense Budget
$4,858
$22
$521 $49
$79 $154
$5,683
$10,083
$0
$1,769
$412 $152
$213
$12,629
NOTE: Numbers in parentheses on the vertical axis indicate the percentage of students enrolled in institutions in each selectivity category. Selectivity categories are based on the IPEDS definition, which incorporates the percentage of applicants admitted and SAT®/ACT scores of enrolled students. Federal grants include veterans benefits and Department of Defense grants. Federal tax benefits include benefits received from tax deductions and tax credits. Only full-time students who attended one institution in 2007-08 are included.
SOURCE: NCES, NPSAS, 2008.
TRENDS IN HIGHER EDUCATION SERIES TRENDS IN COLLEGE PRICING 2011 17
For detailed background data and additional information, please visit http://trends.collegeboard.org.
Net Price — Private Institutions
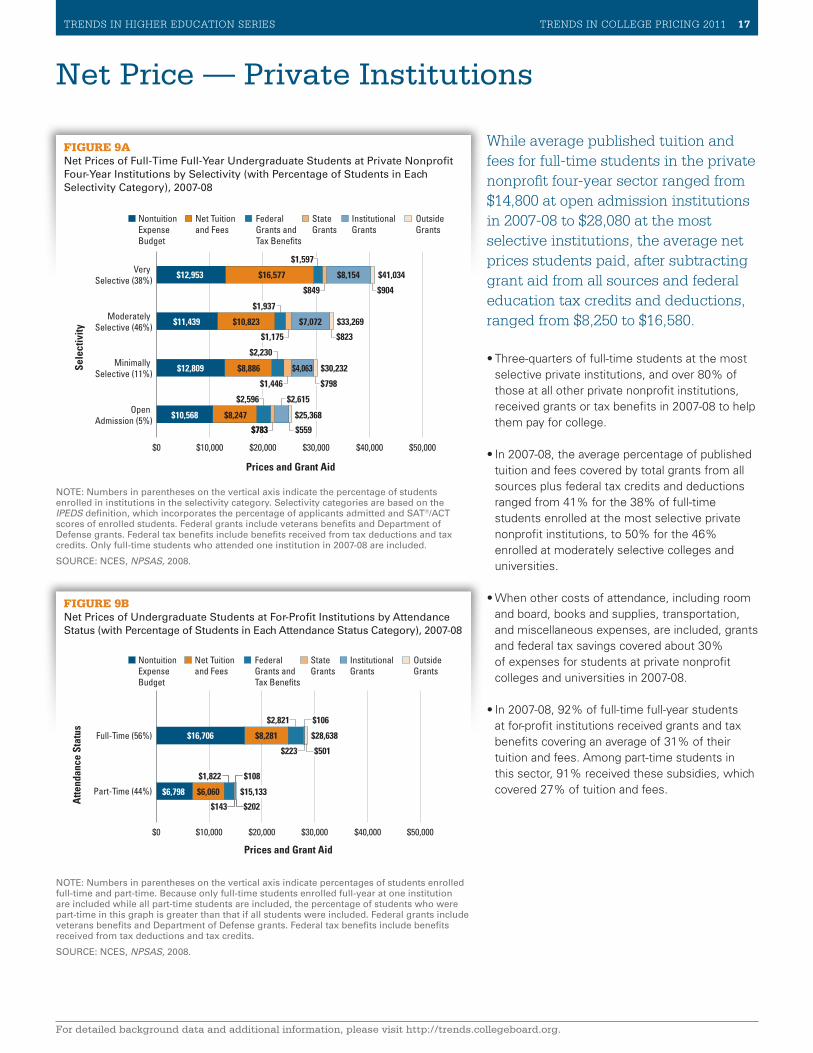
While average published tuition and fees for full-time students in the private nonprofit four-year sector ranged from $14,800 at open admission institutions in 2007-08 to $28,080 at the most selective institutions, the average net prices students paid, after subtracting grant aid from all sources and federal education tax credits and deductions, ranged from $8,250 to $16,580.
•Three-quarters of full-time students at the most selective private institutions, and over 80% of those at all other private nonprofit institutions, received grants or tax benefits in 2007-08 to help them pay for college.
•In 2007-08, the average percentage of published tuition and fees covered by total grants from all sources plus federal tax credits and deductions ranged from 41% for the 38% of full-time students enrolled at the most selective private nonprofit institutions, to 50% for the 46% enrolled at moderately selective colleges and universities.
•When other costs of attendance, including room and board, books and supplies, transportation, and miscellaneous expenses, are included, grants and federal tax savings covered about 30% of expenses for students at private nonprofit colleges and universities in 2007-08.
•In 2007-08, 92% of full-time full-year students at for-profit institutions received grants and tax benefits covering an average of 31% of their tuition and fees. Among part-time students in this sector, 91% received these subsidies, which covered 27% of tuition and fees.
FIGURE 9ANet Prices of Full-Time Full-Year Undergraduate Students at Private Nonprofit Four-Year Institutions by Selectivity (with Percentage of Students in Each Selectivity Category), 2007-08
FIGURE 9BNet Prices of Undergraduate Students at For-Profit Institutions by Attendance Status (with Percentage of Students in Each Attendance Status Category), 2007-08
NOTE: Numbers in parentheses on the vertical axis indicate percentages of students enrolled full-time and part-time. Because only full-time students enrolled full-year at one institution are included while all part-time students are included, the percentage of students who were part-time in this graph is greater than that if all students were included. Federal grants include veterans benefits and Department of Defense grants. Federal tax benefits include benefits received from tax deductions and tax credits.
SOURCE: NCES, NPSAS, 2008.
$0 $10,000 $20,000 $30,000 $40,000 $50,000
Sele
ctiv
ity
Prices and Grant Aid
Very Selective (38%)
Moderately Selective (46%)
Minimally Selective (11%)
Open Admission (5%)
Outside Grants
Institutional Grants
State Grants
Federal Grants and Tax Bene�ts
Net Tuition and Fees
Nontuition Expense Budget
$12,953
$11,439
$12,809
$10,568
$16,577
$10,823
$8,886
$8,247
$1,597
$1,937
$2,230
$2,596
$849
$1,175
$1,446
$783
$8,154
$7,072
$4,063
$2,615
$904
$823
$798
$559
$41,034
$33,269
$30,232
$25,368
$783
Prices and Grant Aid
Atte
ndan
ce S
tatu
s
$10,000 $20,000 $30,000 $40,000 $50,000
Full-Time (56%)
Part-Time (44%)
$0
Outside Grants
Institutional Grants
State Grants
Federal Grants and Tax Bene�ts
Net Tuition and Fees
Nontuition Expense Budget
$16,706
$6,798
$8,281
$6,060
$2,821
$1,822
$223
$143
$106
$108
$501
$202
$28,638
$15,133
NOTE: Numbers in parentheses on the vertical axis indicate the percentage of students enrolled in institutions in the selectivity category. Selectivity categories are based on the IPEDS definition, which incorporates the percentage of applicants admitted and SAT®/ACT scores of enrolled students. Federal grants include veterans benefits and Department of Defense grants. Federal tax benefits include benefits received from tax deductions and tax credits. Only full-time students who attended one institution in 2007-08 are included.
SOURCE: NCES, NPSAS, 2008.
18 TRENDS IN COLLEGE PRICING 2011 TRENDS IN HIGHER EDUCATION SERIES
For detailed background data and additional information, please visit http://trends.collegeboard.org.
Institutional Revenues — Public Appropriations
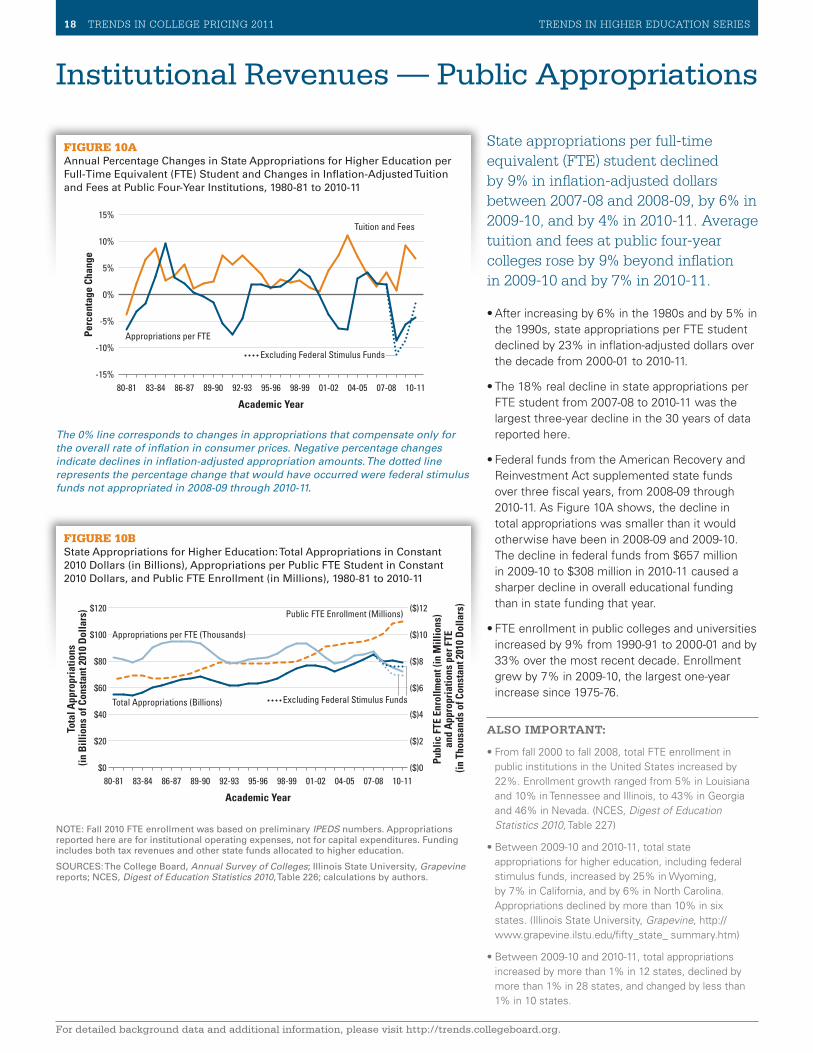
State appropriations per full-time equivalent (FTE) student declined by 9% in inflation-adjusted dollars between 2007-08 and 2008-09, by 6% in 2009-10, and by 4% in 2010-11. Average tuition and fees at public four-year colleges rose by 9% beyond inflation in 2009-10 and by 7% in 2010-11.
•After increasing by 6% in the 1980s and by 5% in the 1990s, state appropriations per FTE student declined by 23% in inflation-adjusted dollars over the decade from 2000-01 to 2010-11.
•The 18% real decline in state appropriations per FTE student from 2007-08 to 2010-11 was the largest three-year decline in the 30 years of data reported here.
•Federal funds from the American Recovery and Reinvestment Act supplemented state funds over three fiscal years, from 2008-09 through 2010-11. As Figure 10A shows, the decline in total appropriations was smaller than it would otherwise have been in 2008-09 and 2009-10. The decline in federal funds from $657 million in 2009-10 to $308 million in 2010-11 caused a sharper decline in overall educational funding than in state funding that year.
•FTE enrollment in public colleges and universities increased by 9% from 1990-91 to 2000-01 and by 33% over the most recent decade. Enrollment grew by 7% in 2009-10, the largest one-year increase since 1975-76.
ALSO IMPORTANT:
•From fall 2000 to fall 2008, total FTE enrollment in public institutions in the United States increased by 22%. Enrollment growth ranged from 5% in Louisiana and 10% in Tennessee and Illinois, to 43% in Georgia and 46% in Nevada. (NCES, Digest of Education Statistics 2010, Table 227)
•Between 2009-10 and 2010-11, total state appropriations for higher education, including federal stimulus funds, increased by 25% in Wyoming, by 7% in California, and by 6% in North Carolina. Appropriations declined by more than 10% in six states. (Illinois State University, Grapevine, http:// www.grapevine.ilstu.edu/fifty_state_ summary.htm)
•Between 2009-10 and 2010-11, total appropriations increased by more than 1% in 12 states, declined by more than 1% in 28 states, and changed by less than 1% in 10 states.
FIGURE 10AAnnual Percentage Changes in State Appropriations for Higher Education per Full-Time Equivalent (FTE) Student and Changes in Inflation-Adjusted Tuition and Fees at Public Four-Year Institutions, 1980-81 to 2010-11
FIGURE 10BState Appropriations for Higher Education: Total Appropriations in Constant 2010 Dollars (in Billions), Appropriations per Public FTE Student in Constant 2010 Dollars, and Public FTE Enrollment (in Millions), 1980-81 to 2010-11
NOTE: Fall 2010 FTE enrollment was based on preliminary IPEDS numbers. Appropriations reported here are for institutional operating expenses, not for capital expenditures. Funding includes both tax revenues and other state funds allocated to higher education.
SOURCES: The College Board, Annual Survey of Colleges; Illinois State University, Grapevine reports; NCES, Digest of Education Statistics 2010, Table 226; calculations by authors.
The 0% line corresponds to changes in appropriations that compensate only for the overall rate of inflation in consumer prices. Negative percentage changes indicate declines in inflation-adjusted appropriation amounts. The dotted line represents the percentage change that would have occurred were federal stimulus funds not appropriated in 2008-09 through 2010-11.
-15%
-10%
-5%
0%
5%
10%
15%
10-1104-0598-9992-9386-87 07-0801-0295-9689-9083-8480-81
Perc
enta
ge C
hang
e
Academic Year
Excluding Federal Stimulus Funds
Tuition and Fees
Appropriations per FTE
$0
$20
$40
$60
$80
$100
($)0
($)2
($)4
($)6
($)8
($)10
$120 ($)12
Publ
ic F
TE E
nrol
lmen
t (in
Mill
ions
) an
d A
ppro
pria
tions
per
FTE
(in
Tho
usan
ds o
f Con
stan
t 201
0 D
olla
rs)
Tota
l App
ropr
iatio
ns
(in B
illio
ns o
f Con
stan
t 201
0 D
olla
rs)
10-1104-0598-9992-9386-87 07-0801-0295-9689-9083-8480-81
Academic Year
Total Appropriations (Billions) Excluding Federal Stimulus Funds
Public FTE Enrollment (Millions)
Appropriations per FTE (Thousands)
TRENDS IN HIGHER EDUCATION SERIES TRENDS IN COLLEGE PRICING 2011 19
For detailed background data and additional information, please visit http://trends.collegeboard.org.
Institutional Revenues — Public Appropriations
FIGURE 11AAverage State Appropriations for Higher Education per $1,000 in Personal Income, 1990-91 to 2010-11
SOURCES: Illinois State University, Grapevine reports; calculations by the authors.
SOURCE: Illinois State University, 2010-11 Grapevine data, Table 5.
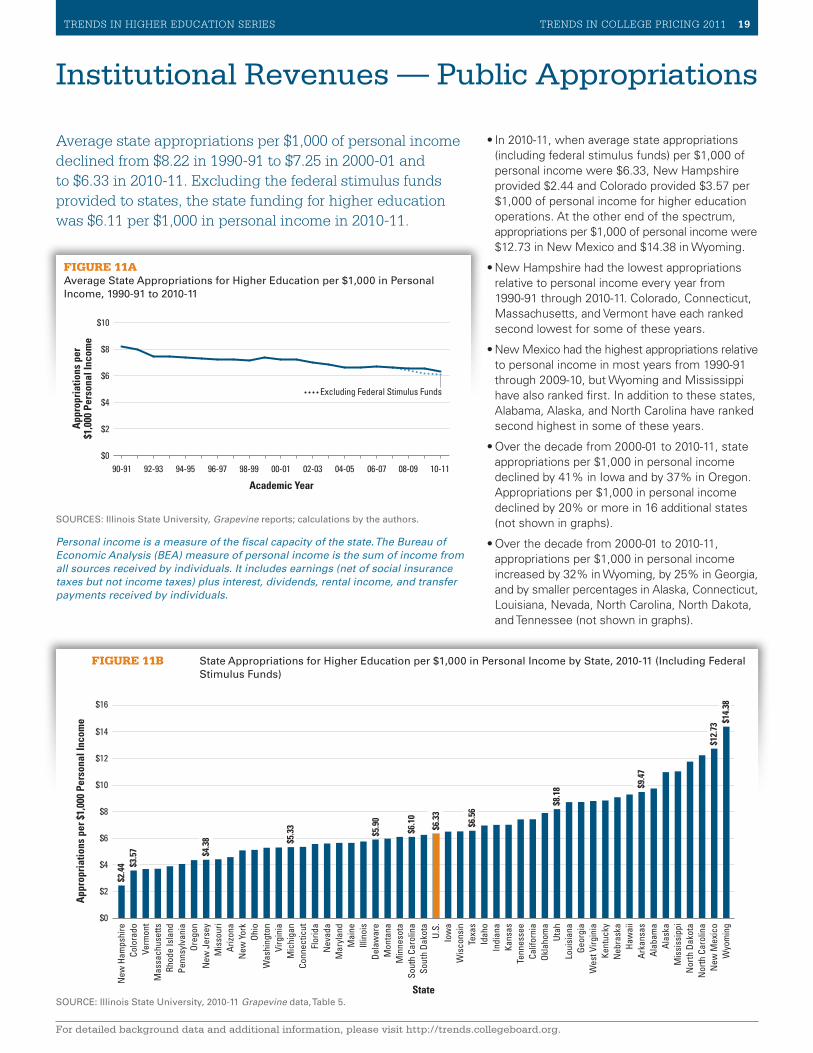
Average state appropriations per $1,000 of personal income declined from $8.22 in 1990-91 to $7.25 in 2000-01 and to $6.33 in 2010-11. Excluding the federal stimulus funds provided to states, the state funding for higher education was $6.11 per $1,000 in personal income in 2010-11.
•In 2010-11, when average state appropriations (including federal stimulus funds) per $1,000 of personal income were $6.33, New Hampshire provided $2.44 and Colorado provided $3.57 per $1,000 of personal income for higher education operations. At the other end of the spectrum, appropriations per $1,000 of personal income were $12.73 in New Mexico and $14.38 in Wyoming.
•New Hampshire had the lowest appropriations relative to personal income every year from 1990-91 through 2010-11. Colorado, Connecticut, Massachusetts, and Vermont have each ranked second lowest for some of these years.
•New Mexico had the highest appropriations relative to personal income in most years from 1990-91 through 2009-10, but Wyoming and Mississippi have also ranked first. In addition to these states, Alabama, Alaska, and North Carolina have ranked second highest in some of these years.
•Over the decade from 2000-01 to 2010-11, state appropriations per $1,000 in personal income declined by 41% in Iowa and by 37% in Oregon. Appropriations per $1,000 in personal income declined by 20% or more in 16 additional states (not shown in graphs).
•Over the decade from 2000-01 to 2010-11, appropriations per $1,000 in personal income increased by 32% in Wyoming, by 25% in Georgia, and by smaller percentages in Alaska, Connecticut, Louisiana, Nevada, North Carolina, North Dakota, and Tennessee (not shown in graphs).
FIGURE 11B State Appropriations for Higher Education per $1,000 in Personal Income by State, 2010-11 (Including Federal Stimulus Funds)
$0
$2
$4
$6
$8
$10
10-1102-03 06-0798-9994-95 04-05 08-0900-01
Academic Year
96-9792-9390-91
App
ropr
iatio
ns p
er$1
,000
Per
sona
l Inc
ome
Excluding Federal Stimulus Funds
$0
$2
$4
$6
$8
$10
$12
$14
App
ropr
iatio
ns p
er $
1,00
0 Pe
rson
al In
com
e
State
$16
Wyo
min
gN
ew M
exic
oN
orth
Car
olin
aN
orth
Dak
ota
Mis
siss
ippi
Alas
kaAl
abam
aAr
kans
asHa
wai
iN
ebra
ska
Kent
ucky
Wes
t Virg
inia
Geor
gia
Loui
sian
aUt
ahOk
laho
ma
Calif
orni
aTe
nnes
see
Kans
asIn
dian
aId
aho
Texa
sW
isco
nsin
Iow
aU.
S.So
uth
Dako
taSo
uth
Caro
lina
Min
neso
taM
onta
naDe
law
are
Illin
ois
Mai
neM
aryl
and
Nev
ada
Flor
ida
Conn
ectic
utM
ichi
gan
Virg
inia
Was
hing
ton
Ohio
New
Yor
kAr
izona
Mis
sour
iN
ew J
erse
yOr
egon
Penn
sylv
ania
Rhod
e Is
land
Mas
sach
uset
tsVe
rmon
tCo
lora
doN
ew H
amps
hire
$14.
38$1
2.73
$9.4
7
$8.1
8
$6.5
6
$6.1
0
$6.3
3
$5.3
3
$5.9
0
$4.3
8
$2.4
4 $3.5
7
Personal income is a measure of the fiscal capacity of the state. The Bureau of Economic Analysis (BEA) measure of personal income is the sum of income from all sources received by individuals. It includes earnings (net of social insurance taxes but not income taxes) plus interest, dividends, rental income, and transfer payments received by individuals.
20 TRENDS IN COLLEGE PRICING 2011 TRENDS IN HIGHER EDUCATION SERIES
For detailed background data and additional information, please visit http://trends.collegeboard.org.
Institutional Revenues
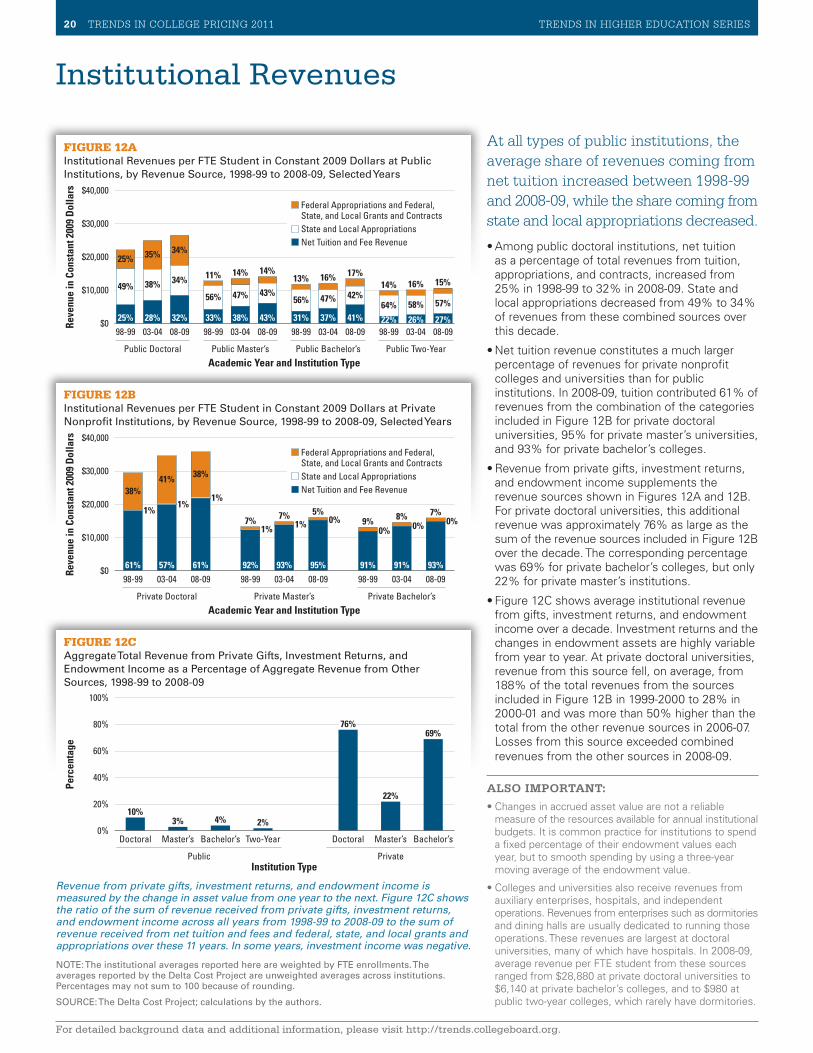
At all types of public institutions, the average share of revenues coming from net tuition increased between 1998-99 and 2008-09, while the share coming from state and local appropriations decreased.
•Among public doctoral institutions, net tuition as a percentage of total revenues from tuition, appropriations, and contracts, increased from 25% in 1998-99 to 32% in 2008-09. State and local appropriations decreased from 49% to 34% of revenues from these combined sources over this decade.
•Net tuition revenue constitutes a much larger percentage of revenues for private nonprofit colleges and universities than for public institutions. In 2008-09, tuition contributed 61% of revenues from the combination of the categories included in Figure 12B for private doctoral universities, 95% for private master’s universities, and 93% for private bachelor’s colleges.
•Revenue from private gifts, investment returns, and endowment income supplements the revenue sources shown in Figures 12A and 12B. For private doctoral universities, this additional revenue was approximately 76% as large as the sum of the revenue sources included in Figure 12B over the decade. The corresponding percentage was 69% for private bachelor’s colleges, but only 22% for private master’s institutions.
•Figure 12C shows average institutional revenue from gifts, investment returns, and endowment income over a decade. Investment returns and the changes in endowment assets are highly variable from year to year. At private doctoral universities, revenue from this source fell, on average, from 188% of the total revenues from the sources included in Figure 12B in 1999-2000 to 28% in 2000-01 and was more than 50% higher than the total from the other revenue sources in 2006-07. Losses from this source exceeded combined revenues from the other sources in 2008-09.
ALSO IMPORTANT:
•Changes in accrued asset value are not a reliable measure of the resources available for annual institutional budgets. It is common practice for institutions to spend a fixed percentage of their endowment values each year, but to smooth spending by using a three-year moving average of the endowment value.
•Colleges and universities also receive revenues from auxiliary enterprises, hospitals, and independent operations. Revenues from enterprises such as dormitories and dining halls are usually dedicated to running those operations. These revenues are largest at doctoral universities, many of which have hospitals. In 2008-09, average revenue per FTE student from these sources ranged from $28,880 at private doctoral universities to $6,140 at private bachelor’s colleges, and to $980 at public two-year colleges, which rarely have dormitories.
Revenue from private gifts, investment returns, and endowment income is measured by the change in asset value from one year to the next. Figure 12C shows the ratio of the sum of revenue received from private gifts, investment returns, and endowment income across all years from 1998-99 to 2008-09 to the sum of revenue received from net tuition and fees and federal, state, and local grants and appropriations over these 11 years. In some years, investment income was negative.
NOTE: The institutional averages reported here are weighted by FTE enrollments. The averages reported by the Delta Cost Project are unweighted averages across institutions. Percentages may not sum to 100 because of rounding.
SOURCE: The Delta Cost Project; calculations by the authors.
$0
$10,000
$20,000
$30,000
$40,000
Reve
nue
in C
onst
ant 2
009
Dol
lars
Academic Year and Institution TypePublic Two-YearPublic Bachelor’sPublic Master’sPublic Doctoral
08-0903-0498-9908-0903-0498-9908-0903-0498-9908-0903-0498-9927%26%22%41%37%31%43%38%33%32%28%25%
57%58%64%42%47%56%
43%47%56%
34%38%49% 15%16%14%17%16%13%
14%14%11%
34%35%25%
State and Local Appropriations
Federal Appropriations and Federal, State, and Local Grants and Contracts
Net Tuition and Fee Revenue
$0
$10,000
$20,000
$30,000
$40,000
Reve
nue
in C
onst
ant 2
009
Dol
lars
Academic Year and Institution TypePrivate Bachelor’sPrivate Master’sPrivate Doctoral
08-0903-0498-9908-0903-0498-9908-0903-0498-9993%91%91%95%93%92%61%57%61%
0%0%0%0%1%1%
1%1%
1% 7%8%9%5%7%7%
38%41%38%
State and Local Appropriations
Federal Appropriations and Federal, State, and Local Grants and Contracts
Net Tuition and Fee Revenue
0%
20%
40%
80%
60%
100%
Perc
enta
ge
Institution TypePrivatePublic
Bachelor’sMaster’sDoctoralTwo-YearBachelor’sMaster’sDoctoral
69%
22%
76%
2%4%3%10%
FIGURE 12CAggregate Total Revenue from Private Gifts, Investment Returns, and Endowment Income as a Percentage of Aggregate Revenue from Other Sources, 1998-99 to 2008-09
FIGURE 12BInstitutional Revenues per FTE Student in Constant 2009 Dollars at Private Nonprofit Institutions, by Revenue Source, 1998-99 to 2008-09, Selected Years
FIGURE 12AInstitutional Revenues per FTE Student in Constant 2009 Dollars at Public Institutions, by Revenue Source, 1998-99 to 2008-09, Selected Years
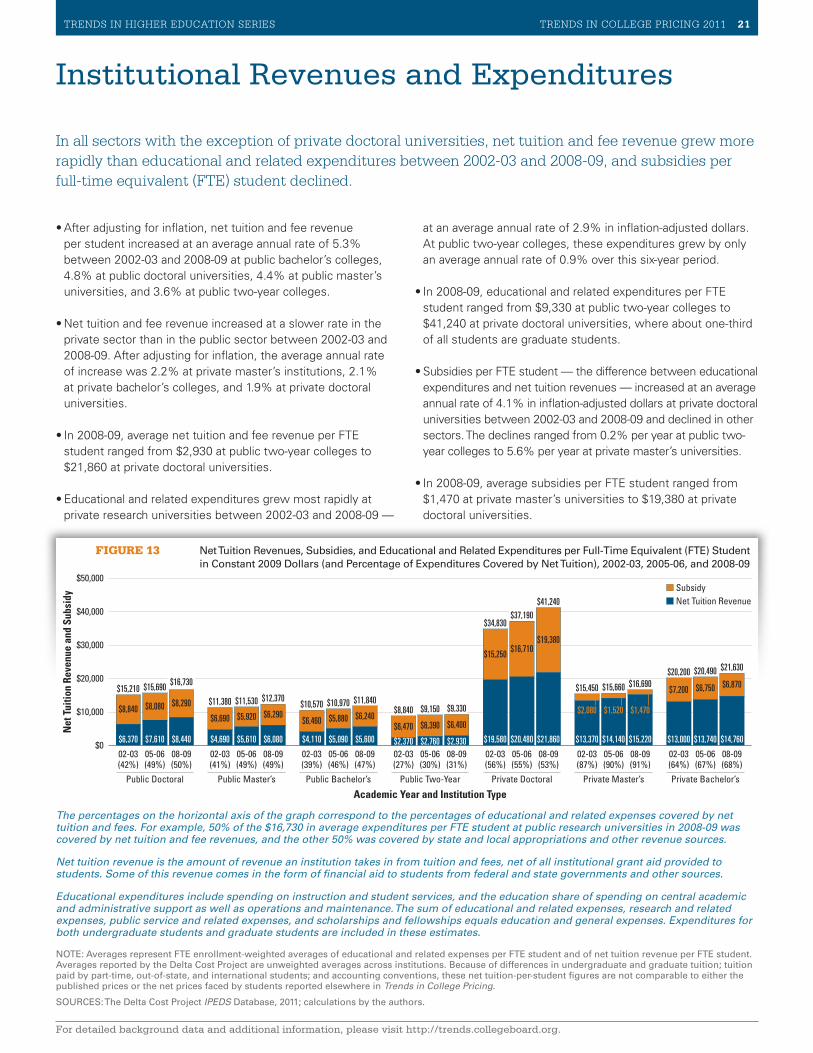
TRENDS IN STUDENT AID 2010 21TRENDS IN HIGHER EDUCATION SERIES TRENDS IN COLLEGE PRICING 2011 21
For detailed background data and additional information, please visit http://trends.collegeboard.org.
Institutional Revenues and Expenditures
In all sectors with the exception of private doctoral universities, net tuition and fee revenue grew more rapidly than educational and related expenditures between 2002-03 and 2008-09, and subsidies per full-time equivalent (FTE) student declined.
•After adjusting for inflation, net tuition and fee revenue per student increased at an average annual rate of 5.3% between 2002-03 and 2008-09 at public bachelor’s colleges, 4.8% at public doctoral universities, 4.4% at public master’s universities, and 3.6% at public two-year colleges.
•Net tuition and fee revenue increased at a slower rate in the private sector than in the public sector between 2002-03 and 2008-09. After adjusting for inflation, the average annual rate of increase was 2.2% at private master’s institutions, 2.1% at private bachelor’s colleges, and 1.9% at private doctoral universities.
•In 2008-09, average net tuition and fee revenue per FTE student ranged from $2,930 at public two-year colleges to $21,860 at private doctoral universities.
•Educational and related expenditures grew most rapidly at private research universities between 2002-03 and 2008-09 —
The percentages on the horizontal axis of the graph correspond to the percentages of educational and related expenses covered by net tuition and fees. For example, 50% of the $16,730 in average expenditures per FTE student at public research universities in 2008-09 was covered by net tuition and fee revenues, and the other 50% was covered by state and local appropriations and other revenue sources.
Net tuition revenue is the amount of revenue an institution takes in from tuition and fees, net of all institutional grant aid provided to students. Some of this revenue comes in the form of financial aid to students from federal and state governments and other sources.
Educational expenditures include spending on instruction and student services, and the education share of spending on central academic and administrative support as well as operations and maintenance. The sum of educational and related expenses, research and related expenses, public service and related expenses, and scholarships and fellowships equals education and general expenses. Expenditures for both undergraduate students and graduate students are included in these estimates.
NOTE: Averages represent FTE enrollment-weighted averages of educational and related expenses per FTE student and of net tuition revenue per FTE student. Averages reported by the Delta Cost Project are unweighted averages across institutions. Because of differences in undergraduate and graduate tuition; tuition paid by part-time, out-of-state, and international students; and accounting conventions, these net tuition-per-student figures are not comparable to either the published prices or the net prices faced by students reported elsewhere in Trends in College Pricing.
SOURCES: The Delta Cost Project IPEDS Database, 2011; calculations by the authors.
FIGURE 13 Net Tuition Revenues, Subsidies, and Educational and Related Expenditures per Full-Time Equivalent (FTE) Student in Constant 2009 Dollars (and Percentage of Expenditures Covered by Net Tuition), 2002-03, 2005-06, and 2008-09
$0
$10,000
$20,000
$30,000
$40,000
$50,000
Net
Tui
tion
Reve
nue
and
Subs
idy
Academic Year and Institution TypePrivate Bachelor’sPrivate Master’sPrivate DoctoralPublic Two-YearPublic Bachelor’sPublic Master’sPublic Doctoral
08-09(68%)
05-06(67%)
02-03(64%)
08-09(91%)
05-06(90%)
02-03(87%)
08-09(53%)
05-06(55%)
02-03(56%)
08-09(31%)
05-06(30%)
02-03(27%)
08-09(47%)
05-06(46%)
02-03(39%)
08-09(49%)
05-06(49%)
02-03(41%)
08-09(50%)
05-06(49%)
02-03(42%)
SubsidyNet Tuition Revenue
$14,760$13,740$13,000$15,220$14,140$13,370$21,860$20,480$19,580$2,930$2,760$2,370$5,600$5,090$4,110$6,080$5,610$4,690$8,440$7,610$6,370
$21,630$20,490$20,200$16,690$15,660$15,450
$41,240
$37,190$34,830
$9,330$9,150$8,840$11,840$10,970$10,570
$12,370$11,530$11,380
$16,730$15,690$15,210 $6,870$6,750$7,200
$1,470$1,520$2,080
$19,380$16,710
$15,250
$6,400$6,390$6,470$6,240$5,880$6,460
$6,290$5,920$6,690
$8,290$8,080$8,840
at an average annual rate of 2.9% in inflation-adjusted dollars. At public two-year colleges, these expenditures grew by only an average annual rate of 0.9% over this six-year period.
•In 2008-09, educational and related expenditures per FTE student ranged from $9,330 at public two-year colleges to $41,240 at private doctoral universities, where about one-third of all students are graduate students.
•Subsidies per FTE student — the difference between educational expenditures and net tuition revenues — increased at an average annual rate of 4.1% in inflation-adjusted dollars at private doctoral universities between 2002-03 and 2008-09 and declined in other sectors. The declines ranged from 0.2% per year at public two-year colleges to 5.6% per year at private master’s universities.
•In 2008-09, average subsidies per FTE student ranged from $1,470 at private master’s universities to $19,380 at private doctoral universities.
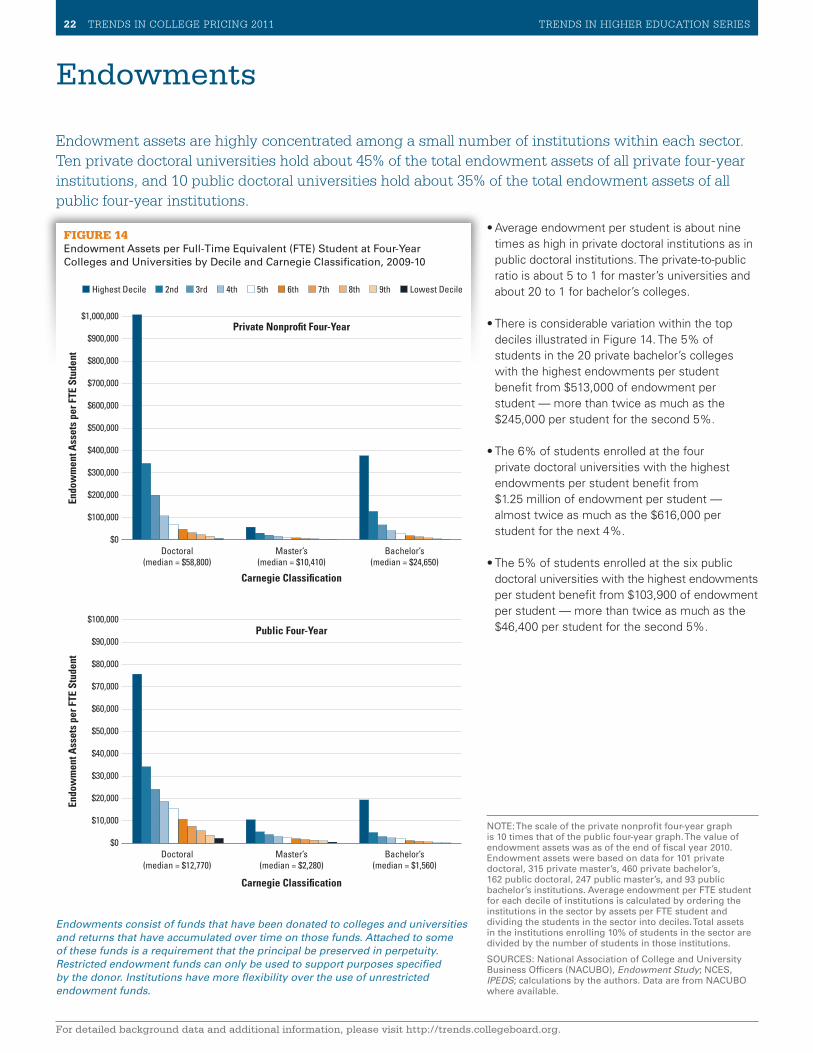
22 TRENDS IN COLLEGE PRICING 2011 TRENDS IN HIGHER EDUCATION SERIES
For detailed background data and additional information, please visit http://trends.collegeboard.org.
Endowments
FIGURE 14Endowment Assets per Full-Time Equivalent (FTE) Student at Four-Year Colleges and Universities by Decile and Carnegie Classification, 2009-10
•Average endowment per student is about nine times as high in private doctoral institutions as in public doctoral institutions. The private-to-public ratio is about 5 to 1 for master’s universities and about 20 to 1 for bachelor’s colleges.
•There is considerable variation within the top deciles illustrated in Figure 14. The 5% of students in the 20 private bachelor’s colleges with the highest endowments per student benefit from $513,000 of endowment per student — more than twice as much as the $245,000 per student for the second 5%.
•The 6% of students enrolled at the four private doctoral universities with the highest endowments per student benefit from $1.25 million of endowment per student — almost twice as much as the $616,000 per student for the next 4%.
•The 5% of students enrolled at the six public doctoral universities with the highest endowments per student benefit from $103,900 of endowment per student — more than twice as much as the $46,400 per student for the second 5%.
Endo
wm
ent A
sset
s pe
r FTE
Stu
dent
$0
$100,000
$200,000
$300,000
$400,000
$500,000
$600,000
$700,000
$800,000
$900,000
$1,000,000
Carnegie Classi�cation
Bachelor’s(median = $24,650)
Master’s(median = $10,410)
Doctoral(median = $58,800)
Endo
wm
ent A
sset
s pe
r FTE
Stu
dent
Carnegie Classi�cation
$0
$10,000
$20,000
$30,000
$40,000
$50,000
$60,000
$70,000
$80,000
$90,000
$100,000
Bachelor’s(median = $1,560)
Master’s(median = $2,280)
Doctoral(median = $12,770)
Private Nonpro�t Four-Year
Public Four-Year
Highest Decile 2nd 3rd 4th 5th 6th 7th 8th 9th Lowest Decile
Endowment assets are highly concentrated among a small number of institutions within each sector. Ten private doctoral universities hold about 45% of the total endowment assets of all private four-year institutions, and 10 public doctoral universities hold about 35% of the total endowment assets of all public four-year institutions.
Endowments consist of funds that have been donated to colleges and universities and returns that have accumulated over time on those funds. Attached to some of these funds is a requirement that the principal be preserved in perpetuity. Restricted endowment funds can only be used to support purposes specified by the donor. Institutions have more flexibility over the use of unrestricted endowment funds.
NOTE: The scale of the private nonprofit four-year graph is 10 times that of the public four-year graph. The value of endowment assets was as of the end of fiscal year 2010. Endowment assets were based on data for 101 private doctoral, 315 private master’s, 460 private bachelor’s, 162 public doctoral, 247 public master’s, and 93 public bachelor’s institutions. Average endowment per FTE student for each decile of institutions is calculated by ordering the institutions in the sector by assets per FTE student and dividing the students in the sector into deciles. Total assets in the institutions enrolling 10% of students in the sector are divided by the number of students in those institutions.
SOURCES: National Association of College and University Business Officers (NACUBO), Endowment Study; NCES, IPEDS; calculations by the authors. Data are from NACUBO where available.
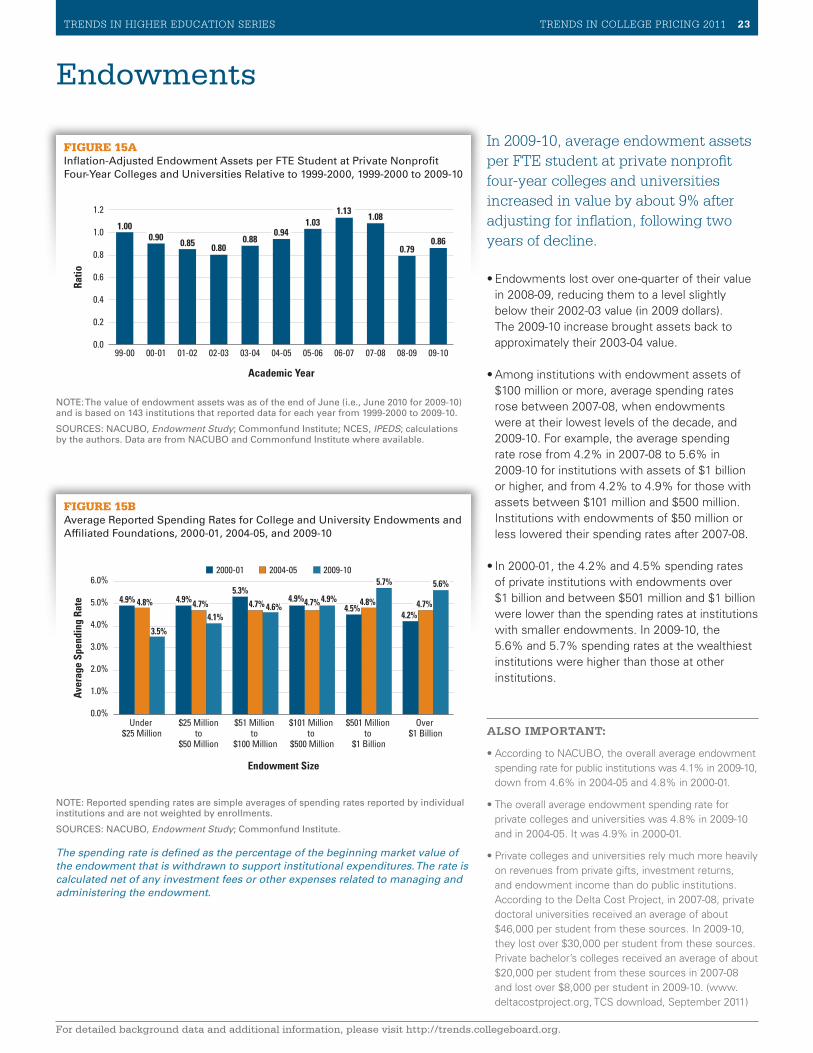
TRENDS IN HIGHER EDUCATION SERIES TRENDS IN COLLEGE PRICING 2011 23
For detailed background data and additional information, please visit http://trends.collegeboard.org.
Endowments
In 2009-10, average endowment assets per FTE student at private nonprofit four-year colleges and universities increased in value by about 9% after adjusting for inflation, following two years of decline.
•Endowments lost over one-quarter of their value in 2008-09, reducing them to a level slightly below their 2002-03 value (in 2009 dollars). The 2009-10 increase brought assets back to approximately their 2003-04 value.
•Among institutions with endowment assets of $100 million or more, average spending rates rose between 2007-08, when endowments were at their lowest levels of the decade, and 2009-10. For example, the average spending rate rose from 4.2% in 2007-08 to 5.6% in 2009-10 for institutions with assets of $1 billion or higher, and from 4.2% to 4.9% for those with assets between $101 million and $500 million. Institutions with endowments of $50 million or less lowered their spending rates after 2007-08.
•In 2000-01, the 4.2% and 4.5% spending rates of private institutions with endowments over $1 billion and between $501 million and $1 billion were lower than the spending rates at institutions with smaller endowments. In 2009-10, the 5.6% and 5.7% spending rates at the wealthiest institutions were higher than those at other institutions.
ALSO IMPORTANT:
•According to NACUBO, the overall average endowment spending rate for public institutions was 4.1% in 2009-10, down from 4.6% in 2004-05 and 4.8% in 2000-01.
•The overall average endowment spending rate for private colleges and universities was 4.8% in 2009-10 and in 2004-05. It was 4.9% in 2000-01.
•Private colleges and universities rely much more heavily on revenues from private gifts, investment returns, and endowment income than do public institutions. According to the Delta Cost Project, in 2007-08, private doctoral universities received an average of about $46,000 per student from these sources. In 2009-10, they lost over $30,000 per student from these sources. Private bachelor’s colleges received an average of about $20,000 per student from these sources in 2007-08 and lost over $8,000 per student in 2009-10. (www.deltacostproject.org, TCS download, September 2011)
FIGURE 15BAverage Reported Spending Rates for College and University Endowments and Affiliated Foundations, 2000-01, 2004-05, and 2009-10
FIGURE 15AInflation-Adjusted Endowment Assets per FTE Student at Private Nonprofit Four-Year Colleges and Universities Relative to 1999-2000, 1999-2000 to 2009-10
NOTE: The value of endowment assets was as of the end of June (i.e., June 2010 for 2009-10) and is based on 143 institutions that reported data for each year from 1999-2000 to 2009-10.
SOURCES: NACUBO, Endowment Study; Commonfund Institute; NCES, IPEDS; calculations by the authors. Data are from NACUBO and Commonfund Institute where available.
0.0
0.2
0.4
0.6
0.8
1.0
1.2
Ratio
Academic Year
09-1008-0907-0806-0705-0604-0503-0402-0301-0200-0199-00
1.000.90 0.85 0.80
0.880.94
1.031.13
1.08
0.790.86
Aver
age
Spen
ding
Rat
e
0.0%
1.0%
2.0%
3.0%
4.0%
5.0%
6.0%
Endowment Size
Over $1 Billion
$501 Million to
$1 Billion
$101 Million to
$500 Million
$51 Million to
$100 Million
$25 Million to
$50 Million
Under $25 Million
2009-102004-052000-01
4.9% 4.9%5.3%
4.9%4.5%
4.2%4.8% 4.7% 4.7% 4.7% 4.8% 4.7%
3.5%4.1%
4.6%4.9%
5.7% 5.6%
NOTE: Reported spending rates are simple averages of spending rates reported by individual institutions and are not weighted by enrollments.
SOURCES: NACUBO, Endowment Study; Commonfund Institute.
The spending rate is defined as the percentage of the beginning market value of the endowment that is withdrawn to support institutional expenditures. The rate is calculated net of any investment fees or other expenses related to managing and administering the endowment.
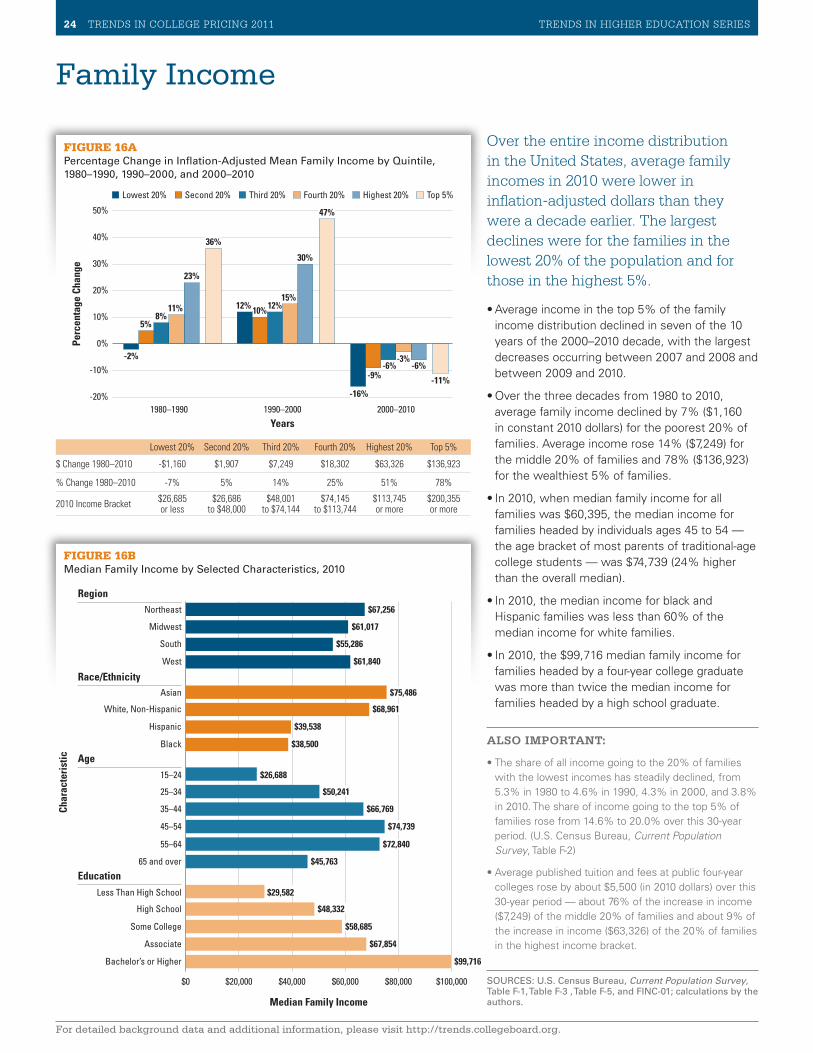
24 TRENDS IN COLLEGE PRICING 2011 TRENDS IN HIGHER EDUCATION SERIES
For detailed background data and additional information, please visit http://trends.collegeboard.org.
Family Income
Over the entire income distribution in the United States, average family incomes in 2010 were lower in inflation-adjusted dollars than they were a decade earlier. The largest declines were for the families in the lowest 20% of the population and for those in the highest 5%.
•Average income in the top 5% of the family income distribution declined in seven of the 10 years of the 2000–2010 decade, with the largest decreases occurring between 2007 and 2008 and between 2009 and 2010.
•Over the three decades from 1980 to 2010, average family income declined by 7% ($1,160 in constant 2010 dollars) for the poorest 20% of families. Average income rose 14% ($7,249) for the middle 20% of families and 78% ($136,923) for the wealthiest 5% of families.
•In 2010, when median family income for all families was $60,395, the median income for families headed by individuals ages 45 to 54 — the age bracket of most parents of traditional-age college students — was $74,739 (24% higher than the overall median).
•In 2010, the median income for black and Hispanic families was less than 60% of the median income for white families.
•In 2010, the $99,716 median family income for families headed by a four-year college graduate was more than twice the median income for families headed by a high school graduate.
ALSO IMPORTANT:
•The share of all income going to the 20% of families with the lowest incomes has steadily declined, from 5.3% in 1980 to 4.6% in 1990, 4.3% in 2000, and 3.8% in 2010. The share of income going to the top 5% of families rose from 14.6% to 20.0% over this 30-year period. (U.S. Census Bureau, Current Population Survey, Table F-2)
•Average published tuition and fees at public four-year colleges rose by about $5,500 (in 2010 dollars) over this 30-year period — about 76% of the increase in income ($7,249) of the middle 20% of families and about 9% of the increase in income ($63,326) of the 20% of families in the highest income bracket.
FIGURE 16APercentage Change in Inflation-Adjusted Mean Family Income by Quintile, 1980–1990, 1990–2000, and 2000–2010
FIGURE 16BMedian Family Income by Selected Characteristics, 2010
SOURCES: U.S. Census Bureau, Current Population Survey, Table F-1, Table F-3 , Table F-5, and FINC-01; calculations by the authors.
Lowest 20% Second 20% Third 20% Fourth 20% Highest 20% Top 5%
$ Change 1980–2010 -$1,160 $1,907 $7,249 $18,302 $63,326 $136,923
% Change 1980–2010 -7% 5% 14% 25% 51% 78%
2010 Income Bracket $26,685 or less
$26,686 to $48,000
$48,001 to $74,144
$74,145 to $113,744
$113,745 or more
$200,355 or more
Years
Perc
enta
ge C
hang
e
-10%
0%
10%
20%
30%
2000–20101990–20001980–1990
40%
50%
-20%
Top 5%Highest 20%Fourth 20%Third 20%Second 20%Lowest 20%
-2%
12%
-16%
5%10%
-9%
8%12%
-6%
11%15%
-3%
23%
30%
-6%
36%
47%
-11%
$0 $20,000 $40,000 $60,000 $80,000 $100,000
Bachelor’s or Higher
Associate
Some College
High School
Less Than High School
65 and over
55–64
45–54
35–44
25–34
15–24
Black
Hispanic
White, Non-Hispanic
Asian
West
South
Midwest
Northeast
Education
Age
Race/Ethnicity
Region
Char
acte
rist
ic
Median Family Income
$67,256
$61,017
$55,286
$61,840
$75,486
$68,961
$39,538
$38,500
$26,688
$50,241
$66,769
$74,739
$72,840
$45,763
$29,582
$48,332
$58,685
$67,854
$99,716
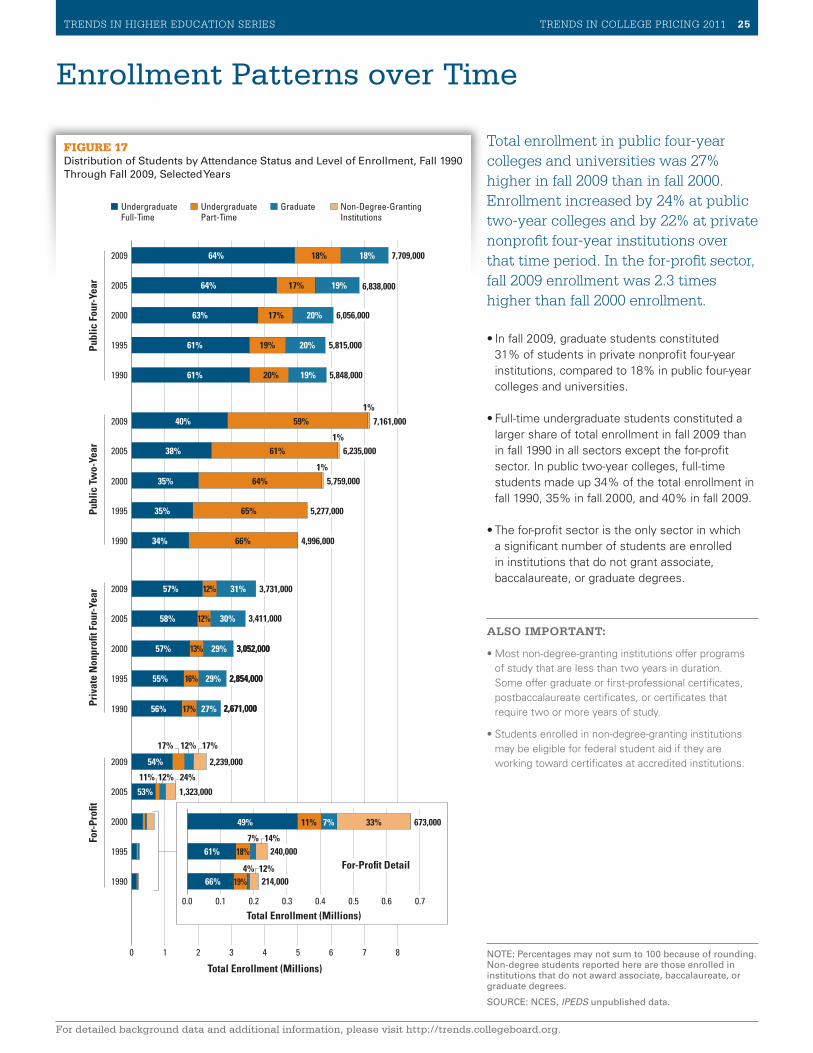
TRENDS IN HIGHER EDUCATION SERIES TRENDS IN COLLEGE PRICING 2011 25
For detailed background data and additional information, please visit http://trends.collegeboard.org.
Enrollment Patterns over Time
NOTE: Percentages may not sum to 100 because of rounding. Non-degree students reported here are those enrolled in institutions that do not award associate, baccalaureate, or graduate degrees.
SOURCE: NCES, IPEDS unpublished data.
Total enrollment in public four-year colleges and universities was 27% higher in fall 2009 than in fall 2000. Enrollment increased by 24% at public two-year colleges and by 22% at private nonprofit four-year institutions over that time period. In the for-profit sector, fall 2009 enrollment was 2.3 times higher than fall 2000 enrollment.
•In fall 2009, graduate students constituted 31% of students in private nonprofit four-year institutions, compared to 18% in public four-year colleges and universities.
•Full-time undergraduate students constituted a larger share of total enrollment in fall 2009 than in fall 1990 in all sectors except the for-profit sector. In public two-year colleges, full-time students made up 34% of the total enrollment in fall 1990, 35% in fall 2000, and 40% in fall 2009.
•The for-profit sector is the only sector in which a significant number of students are enrolled in institutions that do not grant associate, baccalaureate, or graduate degrees.
ALSO IMPORTANT:
•Most non-degree-granting institutions offer programs of study that are less than two years in duration. Some offer graduate or first-professional certificates, postbaccalaureate certificates, or certificates that require two or more years of study.
•Students enrolled in non-degree-granting institutions may be eligible for federal student aid if they are working toward certificates at accredited institutions.
FIGURE 17Distribution of Students by Attendance Status and Level of Enrollment, Fall 1990 Through Fall 2009, Selected Years
Non-Degree-GrantingInstitutions
GraduateUndergraduate Part-Time
Undergraduate Full-Time
Total Enrollment (Millions)
0 1 2 3 4 5 6 7 8
Publ
ic F
our-
Year
Publ
ic T
wo-
Year
Priv
ate
Non
pro�
t Fou
r-Ye
arFo
r-Pr
o�t
1990
1995
2000
2005
2009
1990
1995
2000
2005
2009
1990
1995
2000
2005
2009
1990
1995
2000
2005
2009
0.0 0.1 0.2 0.3 0.4 0.5 0.6 0.7
Total Enrollment (Millions)
For-Pro�t Detail66%
61%
49%
18%
19%
11%
4%
7%
7%
12%
14%
33% 673,000
240,000
214,000
61%
61%
63%
64%
64%
20%
19%
17%
17%
18%
19%
20%
20%
19%
18%
34%
35%
35%
38%
40%
66%
65%
64%
61%
59%
1%
1%
1%
53%
54%
11%
17%
12%
12%
24%
17%
56%
55%
57%
58%
57%
17%
16%
13%
12%
12%
27%
29%
29%
30%
31%
7,709,000
6,838,000
6,056,000
5,815,000
5,848,000
7,161,000
6,235,000
5,759,000
5,277,000
4,996,000
3,731,000
3,411,000
3,052,000
2,854,000
2,671,000
2,239,000
1,323,000
3,052,000
2,854,000
2,671,000
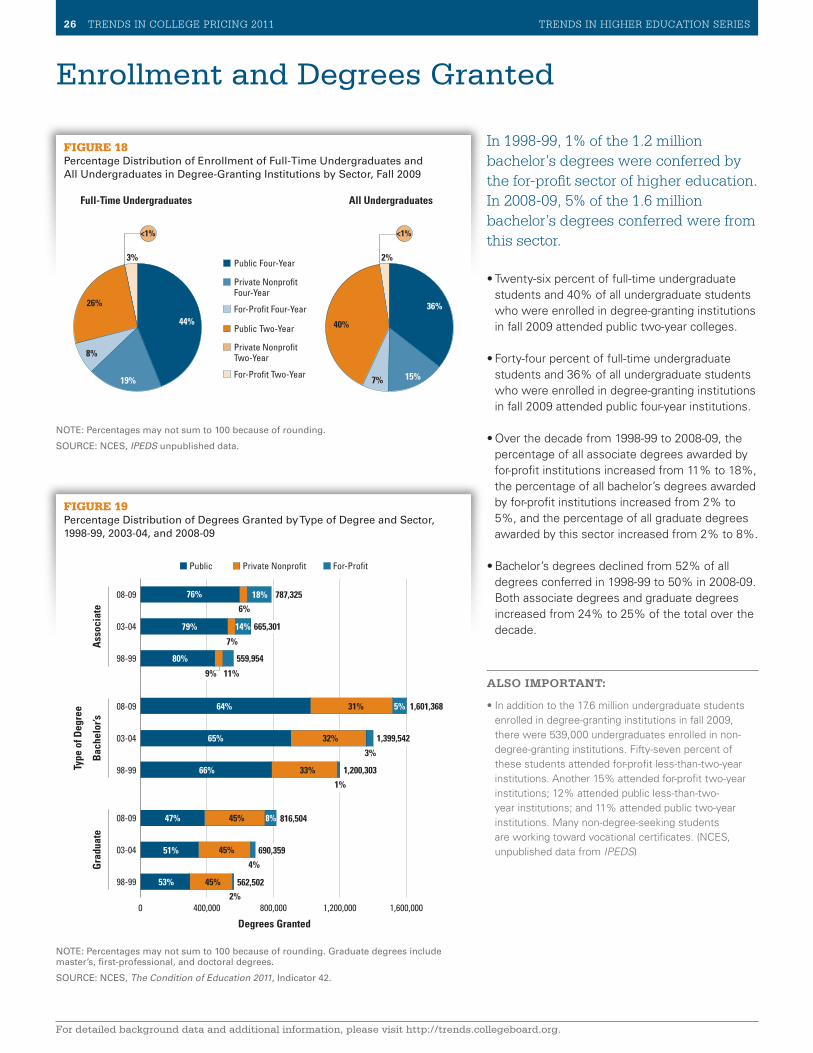
26 TRENDS IN COLLEGE PRICING 2011 TRENDS IN HIGHER EDUCATION SERIES
For detailed background data and additional information, please visit http://trends.collegeboard.org.
Enrollment and Degrees Granted
In 1998-99, 1% of the 1.2 million bachelor’s degrees were conferred by the for-profit sector of higher education. In 2008-09, 5% of the 1.6 million bachelor’s degrees conferred were from this sector.
•Twenty-six percent of full-time undergraduate students and 40% of all undergraduate students who were enrolled in degree-granting institutions in fall 2009 attended public two-year colleges.
•Forty-four percent of full-time undergraduate students and 36% of all undergraduate students who were enrolled in degree-granting institutions in fall 2009 attended public four-year institutions.
•Over the decade from 1998-99 to 2008-09, the percentage of all associate degrees awarded by for-profit institutions increased from 11% to 18%, the percentage of all bachelor’s degrees awarded by for-profit institutions increased from 2% to 5%, and the percentage of all graduate degrees awarded by this sector increased from 2% to 8%.
•Bachelor’s degrees declined from 52% of all degrees conferred in 1998-99 to 50% in 2008-09. Both associate degrees and graduate degrees increased from 24% to 25% of the total over the decade.
ALSO IMPORTANT:
•In addition to the 17.6 million undergraduate students enrolled in degree-granting institutions in fall 2009, there were 539,000 undergraduates enrolled in non-degree-granting institutions. Fifty-seven percent of these students attended for-profit less-than-two-year institutions. Another 15% attended for-profit two-year institutions; 12% attended public less-than-two-year institutions; and 11% attended public two-year institutions. Many non-degree-seeking students are working toward vocational certificates. (NCES, unpublished data from IPEDS)
FIGURE 18Percentage Distribution of Enrollment of Full-Time Undergraduates and All Undergraduates in Degree-Granting Institutions by Sector, Fall 2009
FIGURE 19Percentage Distribution of Degrees Granted by Type of Degree and Sector, 1998-99, 2003-04, and 2008-09
2%
15%
40%
7%
<1%
3%
19%
26%
8%
For-Pro�t Four-Year
Private Nonpro�t Four-Year
Public Four-Year
For-Pro�t Two-Year
Private Nonpro�t Two-Year
Public Two-Year44%
36%
All UndergraduatesFull-Time Undergraduates
<1%
NOTE: Percentages may not sum to 100 because of rounding.
SOURCE: NCES, IPEDS unpublished data.
NOTE: Percentages may not sum to 100 because of rounding. Graduate degrees include master’s, first-professional, and doctoral degrees.
SOURCE: NCES, The Condition of Education 2011, Indicator 42.
Degrees Granted
Ass
ocia
teB
ache
lor’s
Type
of D
egre
e
Gra
duat
e
0 400,000 800,000 1,200,000 1,600,000
98-99
03-04
08-09
98-99
03-04
08-09
98-99
03-04
08-09
For-Pro�tPrivate Nonpro�tPublic
53%
51%
47%
66%
65%
64%
80%
79%
76%
45%
45%
45%
33%
32%
31%
9%
7%
6%
2%
4%
8%
1%
3%
5%
11%
14%
18% 787,325
665,301
559,954
1,601,368
1,399,542
1,200,303
816,504
690,359
562,502
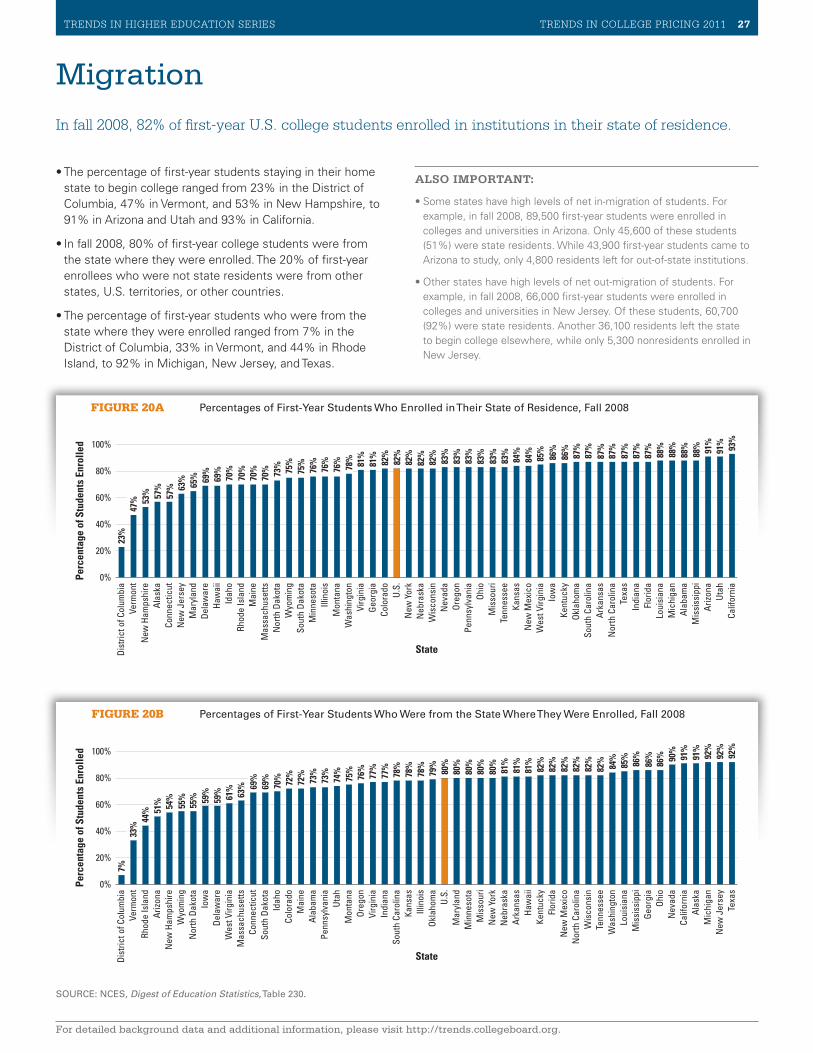
TRENDS IN HIGHER EDUCATION SERIES TRENDS IN COLLEGE PRICING 2011 27
For detailed background data and additional information, please visit http://trends.collegeboard.org.
Migration
SOURCE: NCES, Digest of Education Statistics, Table 230.
In fall 2008, 82% of first-year U.S. college students enrolled in institutions in their state of residence.
•The percentage of first-year students staying in their home state to begin college ranged from 23% in the District of Columbia, 47% in Vermont, and 53% in New Hampshire, to 91% in Arizona and Utah and 93% in California.
•In fall 2008, 80% of first-year college students were from the state where they were enrolled. The 20% of first-year enrollees who were not state residents were from other states, U.S. territories, or other countries.
•The percentage of first-year students who were from the state where they were enrolled ranged from 7% in the District of Columbia, 33% in Vermont, and 44% in Rhode Island, to 92% in Michigan, New Jersey, and Texas.
ALSO IMPORTANT:
•Some states have high levels of net in-migration of students. For example, in fall 2008, 89,500 first-year students were enrolled in colleges and universities in Arizona. Only 45,600 of these students (51%) were state residents. While 43,900 first-year students came to Arizona to study, only 4,800 residents left for out-of-state institutions.
•Other states have high levels of net out-migration of students. For example, in fall 2008, 66,000 first-year students were enrolled in colleges and universities in New Jersey. Of these students, 60,700 (92%) were state residents. Another 36,100 residents left the state to begin college elsewhere, while only 5,300 nonresidents enrolled in New Jersey.
FIGURE 20B Percentages of First-Year Students Who Were from the State Where They Were Enrolled, Fall 2008
FIGURE 20A Percentages of First-Year Students Who Enrolled in Their State of Residence, Fall 2008
0%
20%
40%
60%
80%
100%
Perc
enta
ge o
f Stu
dent
s En
rolle
d
State
U.S.
Calif
orni
aUt
ahAr
izona
Mis
siss
ippi
Alab
ama
Mic
higa
nLo
uisi
ana
Flor
ida
Indi
ana
Texa
sN
orth
Car
olin
aAr
kans
asSo
uth
Caro
lina
Okla
hom
aKe
ntuc
kyIo
wa
Wes
t Virg
inia
New
Mex
ico
Kans
asTe
nnes
see
Mis
sour
iOh
ioPe
nnsy
lvan
iaOr
egon
Nev
ada
Wis
cons
inN
ebra
ska
New
Yor
k
Colo
rado
Geor
gia
Virg
inia
Was
hing
ton
Mon
tana
Illin
ois
Min
neso
taSo
uth
Dako
taW
yom
ing
Nor
th D
akot
aM
assa
chus
etts
Mai
neRh
ode
Isla
ndId
aho
Haw
aii
Dela
war
eM
aryl
and
New
Jer
sey
Conn
ectic
utAl
aska
New
Ham
pshi
reVe
rmon
tDi
stric
t of C
olum
bia
23%
47% 53
% 57%
57% 63
% 65% 69
%69
%70
%70
%70
%70
% 73% 75%
75%
76%
76%
76%
78% 81%
81%
82%
82%
82%
82%
82%
83%
83%
83%
83%
83%
83%
84%
84%
85%
86%
86%
87%
87%
87%
87%
87%
87%
87%
88%
88%
88%
88% 91%
91% 93%
0%
20%
40%
60%
80%
100%
Perc
enta
ge o
f Stu
dent
s En
rolle
d
State
Texa
sN
ew J
erse
yM
ichi
gan
Alas
kaCa
lifor
nia
Nev
ada
Ohio
Geor
gia
Mis
siss
ippi
Loui
sian
aW
ashi
ngto
nTe
nnes
see
Wis
cons
inN
orth
Car
olin
aN
ew M
exic
oFl
orid
aKe
ntuc
kyHa
wai
iAr
kans
asN
ebra
ska
New
Yor
kM
isso
uri
Min
neso
taM
aryl
and
U.S.
Okla
hom
aIll
inoi
sKa
nsas
Sout
h Ca
rolin
aIn
dian
aVi
rgin
iaOr
egon
Mon
tana
Utah
Penn
sylv
ania
Alab
ama
Mai
neCo
lora
doId
aho
Sout
h Da
kota
Conn
ectic
utM
assa
chus
etts
Wes
t Virg
inia
Dela
war
eIo
wa
Nor
th D
akot
aW
yom
ing
New
Ham
pshi
reAr
izona
Rhod
e Is
land
Verm
ont
Dist
rict o
f Col
umbi
a7%
33%
44% 51
% 54%
55%
55% 59
%59
% 61%
63% 69
%69
%70
% 72%
72%
73%
73%
74%
75%
76%
77%
77%
78%
78%
78%
79%
80%
80%
80%
80%
80%
81%
81%
81%
82%
82%
82%
82%
82%
82% 84%
85%
86%
86%
86% 90
%91
%91
%92
%92
%92
%
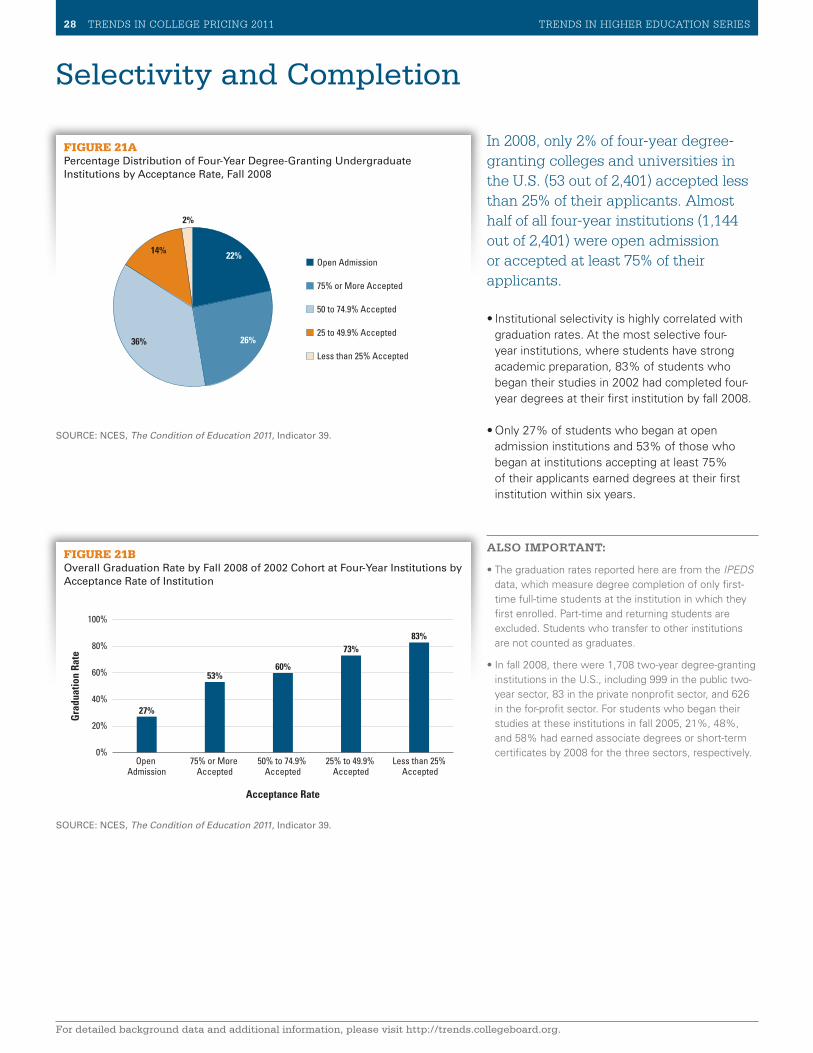
28 TRENDS IN COLLEGE PRICING 2011 TRENDS IN HIGHER EDUCATION SERIES
For detailed background data and additional information, please visit http://trends.collegeboard.org.
Selectivity and Completion
In 2008, only 2% of four-year degree-granting colleges and universities in the U.S. (53 out of 2,401) accepted less than 25% of their applicants. Almost half of all four-year institutions (1,144 out of 2,401) were open admission or accepted at least 75% of their applicants.
•Institutional selectivity is highly correlated with graduation rates. At the most selective four-year institutions, where students have strong academic preparation, 83% of students who began their studies in 2002 had completed four-year degrees at their first institution by fall 2008.
•Only 27% of students who began at open admission institutions and 53% of those who began at institutions accepting at least 75% of their applicants earned degrees at their first institution within six years.
ALSO IMPORTANT:
•The graduation rates reported here are from the IPEDS data, which measure degree completion of only first-time full-time students at the institution in which they first enrolled. Part-time and returning students are excluded. Students who transfer to other institutions are not counted as graduates.
•In fall 2008, there were 1,708 two-year degree-granting institutions in the U.S., including 999 in the public two-year sector, 83 in the private nonprofit sector, and 626 in the for-profit sector. For students who began their studies at these institutions in fall 2005, 21%, 48%, and 58% had earned associate degrees or short-term certificates by 2008 for the three sectors, respectively.
FIGURE 21APercentage Distribution of Four-Year Degree-Granting Undergraduate Institutions by Acceptance Rate, Fall 2008
FIGURE 21BOverall Graduation Rate by Fall 2008 of 2002 Cohort at Four-Year Institutions by Acceptance Rate of Institution
SOURCE: NCES, The Condition of Education 2011, Indicator 39.
2%
26%
14%
36%
22%
50 to 74.9% Accepted
75% or More Accepted
Open Admission
Less than 25% Accepted
25 to 49.9% Accepted
Acceptance Rate
Gra
duat
ion
Rate
0%
20%
40%
60%
80%
100%
Less than 25% Accepted
25% to 49.9% Accepted
50% to 74.9% Accepted
75% or More Accepted
Open Admission
53%
27%
73%
60%
83%
SOURCE: NCES, The Condition of Education 2011, Indicator 39.
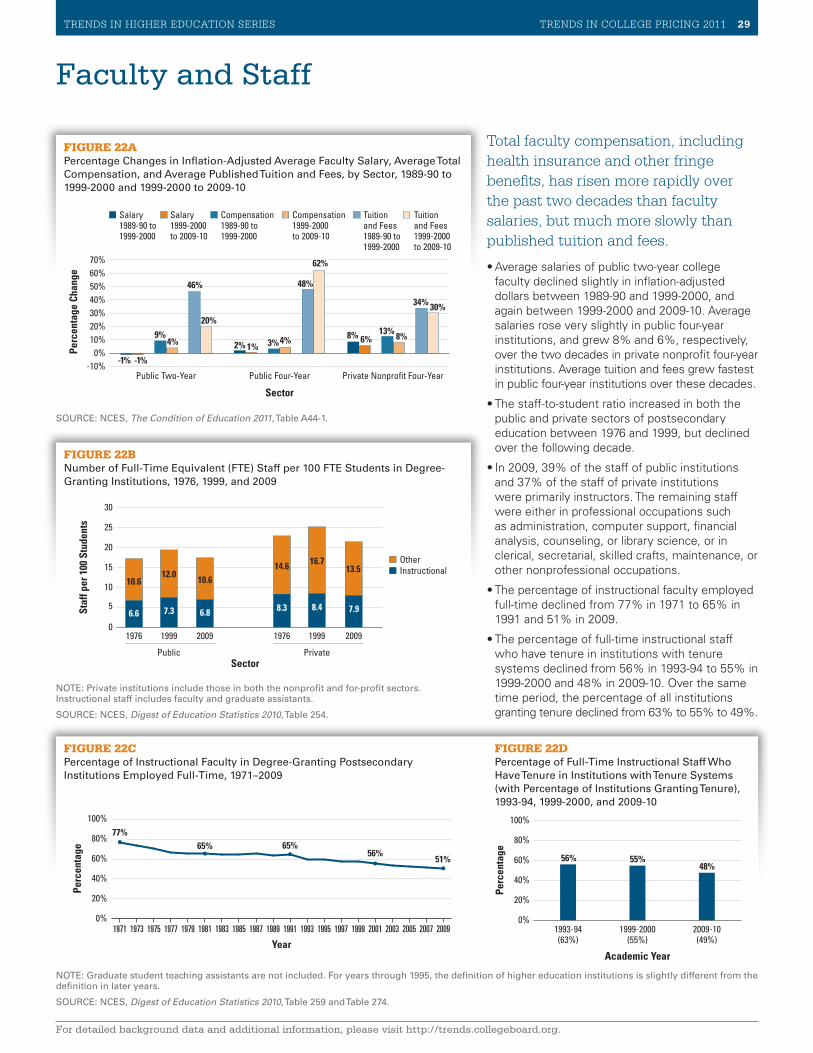
TRENDS IN STUDENT AID 2010 29TRENDS IN HIGHER EDUCATION SERIES TRENDS IN COLLEGE PRICING 2011 29
For detailed background data and additional information, please visit http://trends.collegeboard.org.
Total faculty compensation, including health insurance and other fringe benefits, has risen more rapidly over the past two decades than faculty salaries, but much more slowly than published tuition and fees.
•Average salaries of public two-year college faculty declined slightly in inflation-adjusted dollars between 1989-90 and 1999-2000, and again between 1999-2000 and 2009-10. Average salaries rose very slightly in public four-year institutions, and grew 8% and 6%, respectively, over the two decades in private nonprofit four-year institutions. Average tuition and fees grew fastest in public four-year institutions over these decades.
•The staff-to-student ratio increased in both the public and private sectors of postsecondary education between 1976 and 1999, but declined over the following decade.
•In 2009, 39% of the staff of public institutions and 37% of the staff of private institutions were primarily instructors. The remaining staff were either in professional occupations such as administration, computer support, financial analysis, counseling, or library science, or in clerical, secretarial, skilled crafts, maintenance, or other nonprofessional occupations.
•The percentage of instructional faculty employed full-time declined from 77% in 1971 to 65% in 1991 and 51% in 2009.
•The percentage of full-time instructional staff who have tenure in institutions with tenure systems declined from 56% in 1993-94 to 55% in 1999-2000 and 48% in 2009-10. Over the same time period, the percentage of all institutions granting tenure declined from 63% to 55% to 49%.
Faculty and Staff
FIGURE 22CPercentage of Instructional Faculty in Degree-Granting Postsecondary Institutions Employed Full-Time, 1971–2009
FIGURE 22BNumber of Full-Time Equivalent (FTE) Staff per 100 FTE Students in Degree-Granting Institutions, 1976, 1999, and 2009
FIGURE 22APercentage Changes in Inflation-Adjusted Average Faculty Salary, Average Total Compensation, and Average Published Tuition and Fees, by Sector, 1989-90 to 1999-2000 and 1999-2000 to 2009-10
FIGURE 22DPercentage of Full-Time Instructional Staff Who Have Tenure in Institutions with Tenure Systems (with Percentage of Institutions Granting Tenure), 1993-94, 1999-2000, and 2009-10
SOURCE: NCES, The Condition of Education 2011, Table A44-1.
NOTE: Graduate student teaching assistants are not included. For years through 1995, the definition of higher education institutions is slightly different from the definition in later years.
SOURCE: NCES, Digest of Education Statistics 2010, Table 259 and Table 274.
NOTE: Private institutions include those in both the nonprofit and for-profit sectors. Instructional staff includes faculty and graduate assistants.
SOURCE: NCES, Digest of Education Statistics 2010, Table 254.
Perc
enta
ge C
hang
e
-10%
10%
30%
50%
70%
0%
20%
40%
60%
Sector
Tuition and Fees 1999-2000to 2009-10
Tuition and Fees 1989-90 to1999-2000
Compensation 1999-2000to 2009-10
Compensation 1989-90 to 1999-2000
Salary 1999-2000to 2009-10
Salary 1989-90 to 1999-2000
Private Nonpro�t Four-YearPublic Four-YearPublic Two-Year
-1%
2%8%
-1%1%
6%9%3%
13%4% 4% 8%
46% 48%
34%
20%
62%
30%
Staf
f per
100
Stu
dent
s
Sector
200919991976200919991976
PrivatePublic
5
15
25
0
10
20
30
OtherInstructional
6.6 7.3 6.8 8.3 8.4 7.9
10.612.0
10.614.6 16.7
13.5
Perc
enta
ge
Year
0%
20%
40%
60%
80%
100%
20092007200520032001199919971995199319911989198719851983198119791977197519731971
77%65% 65%
56%51%
Perc
enta
ge
Academic Year
0%
20%
40%
60%
80%
100%
2009-10(49%)
1999-2000(55%)
1993-94(63%)
56% 55%48%
30 TRENDS IN COLLEGE PRICING 2011 TRENDS IN HIGHER EDUCATION SERIES
For detailed background data and additional information, please visit http://trends.collegeboard.org.
Notes and Sources
THE ANNUAL SURVEY OF COLLEGESPrices described in this report are based on data reported to the College Board by colleges and universities in the Annual Survey of Colleges. Data for 2011-12 are from an online questionnaire distributed in October 2010, with data collected and reviewed through early September 2011. Tuition and fee figures are based on charges to full-time students over the course of a nine-month academic year of 30 semester hours or 45 quarter hours. For those institutions with tuition and fees that vary by year of study, weighted average undergraduate tuition levels are used in the analysis. We are not able to estimate differences in tuition and fees by program, but rely on average prices reported by institutions.
ENROLLMENT-WEIGHTED AND UNWEIGHTED DATAThis report provides enrollment-weighted average prices. Charges reported by colleges with larger full-time enrollments are weighted more heavily than those of institutions with smaller enrollments. Unweighted average prices, with the charges of all reporting institutions treated equally, are available online at http://trends.collegeboard.org. The most recent enrollment data available are for fall 2010. For 2010-11 and earlier years, prices are weighted by same-year enrollments. For 2011-12, prices are weighted by fall 2010 enrollments. In other words, the percentage changes reported in Tables 1A and 1B reflect only price changes, not changes in enrollment patterns. In contrast, the historical data on changes in enrollment-weighted prices illustrated in Figures 4 and 5 reflect changes in both prices charged and in the distribution of full-time students across institutions.
IN-STATE AND OUT-OF-STATE TUITION AND FEESIn-state tuition and fees are weighted by full-time enrollment. Out-of-state tuition and fees are calculated by adding the nonresident premium, weighted by full-time out-of-state enrollment, to average in-state tuition and fees.
INSTITUTIONS INCLUDED IN CALCULATIONSOut of the 3,423 public two-year, public four-year, private nonprofit four-year, and for-profit institutions that were surveyed in both 2010 and 2011, 3,068 were included in this year’s analysis, including over 98% of the surveyed schools in the public and private nonprofit sectors and 51% of those in the for-profit sector. Our imputation process allows us to include schools for which we are missing one year of data. We exclude from our calculations military academies and other institutions that report zero tuition. Detailed information on the number of institutions included in the analysis for each sector is available online.
REVISION OF BASE-YEAR VALUESThe prices for 2010-11 used in this analysis differ somewhat from the 2010-11 averages reported last year. One factor contributing to the revision is the reweighting of the prices, shifting from fall 2009 to fall 2010 full-time enrollment figures. The base-year numbers also shift because several hundred institutions submit revised tuition figures for the previous year. The recomputed average for 2010-11 tuition and fees at public four-year institutions is $8 higher than the level we reported last year for in-state students and $53 higher for out-of-state students. The recomputed average for 2010-11 tuition and fees is $28 lower than the level we reported last year for private nonprofit four-year institutions and $14 higher for public two-year institutions. Our estimate of the average 2010-11 price for for-profit students is $105 higher than it was last year because of changes in full-time enrollment and changes in the number of institutions included in the calculations.
NET PRICE CALCULATIONSThe calculations of average net price in Figure 7 for full-time undergraduate students are a best approximation and are based on the aggregate amounts of each type of aid reported in Trends in Student Aid 2011 and on the allocation of each type of aid across institution types and between part-time and full-time students reported in 1993, 1996, 2000, 2004, and 2008 National Postsecondary Student Aid Study (NPSAS) data. The distribution of aid for 2009-10 and after was modified to account for the large increase in Pell Grants in 2009-10. Because financial aid data for 2011-12 are not yet available, amounts for that year are estimated based on past years and information about changes in grant policies. Total charges for public two-year students include an estimate of housing and food expenses for students not living with their parents, based on commuter room and board expenses reported by institutions when available and derived from public four-year room and board charges for earlier years in the analysis. The net price estimates reported here are not exactly comparable to those that appeared in 2010 because some figures have been updated. Calculations of net price by selectivity for public and private nonprofit four-year institutions and by attendance status for public two-year and for-profit institutions in Figures 8A, 8B, 9A, and 9B are based on NPSAS data. Grant totals do not match precisely those used in Figure 7, because NPSAS estimates differ somewhat from the data reported in Trends in Student Aid 2011.
INSTITUTIONAL REVENUES AND EXPENDITURESFigures 12A–C and 13 are based on data from the Delta Cost Project. Delta data combine Integrated Postsecondary Education Data System (IPEDS) data with information from the Financial Institution Shared Assessment Program database beginning in 1994. Further details and the entire database are available at www.deltacostproject.org.
ENDOWMENTSData on endowments are from the National Association of College and University Business Officers (NACUBO) and Commonfund Institute, supplemented by data from IPEDS for institutions for which NACUBO or Commonfund data are not available. Public university foundation endowment assets are included.
INFLATION ADJUSTMENTThe Consumer Price Index for all urban consumers (CPI-U) is used to adjust for inflation. We use the CPI-U in July of the year in which the academic year begins. See ftp://ftp.bls.gov/pub/special.requests/cpi/cpiai.txt for changes in the CPI-U over time.
CARNEGIE CLASSIFICATION 2005: BASIC CLASSIFICATION“Doctoral universities” include institutions that award at least 20 doctoral degrees per year (excluding doctoral degrees that qualify recipients for entry into professional practice, such as the J.D., M.D., Pharm.D., DPT, etc.); “master’s colleges and universities” include institutions that award at least 50 master’s degrees per year; “bachelor’s colleges” include institutions where bachelor’s degrees represent at least 10% of all undergraduate degrees and that award fewer than 50 master’s degrees or fewer than 20 doctoral degrees per year. All of the categories above exclude “special focus institutions” and “tribal colleges.” For more details on data sources and methodology, please see the Trends in College Pricing website at http://trends.collegeboard.org.
TRENDS IN HIGHER EDUCATION SERIES TRENDS IN COLLEGE PRICING 2011 31
For detailed background data and additional information, please visit http://trends.collegeboard.org.
Trends in College Pricing was authored by College Board independent policy analysts Sandy Baum and Jennifer Ma, with invaluable assistance from Michael Hurwitz, Kathleen Little, Kathleen Payea, and Anne Sturtevant.
Contact Information for the AuthorsSandy Baum, [email protected] Jennifer Ma, [email protected]
Trends in College Pricing and its companion report, Trends in Student Aid, are supplemented by a website that makes detailed data available for reference and downloading. The PDF versions of these reports, along with PowerPoint slides of all the graphs, are available on the Web: http://trends.collegeboard.org.
Hard copies may be ordered by contacting [email protected].
Tables, graphs, and data in this report or excerpts thereof may be reproduced or cited, for noncommercial purposes only, provided that the following attribution is included:
Source: Trends in College Pricing. © 2011 The College Board.www.collegeboard.org
ACKNOWLEDGMENTS
The publication would not have been possible without the cooperation and support of many people at the College Board, including Stan Bernstein and the Annual Survey of Colleges staff, Marilyn Cushman, Tara Goldman, Carly Lindauer, Annika Many, Christen Pollock, Tom Rudin, and Leanne Snoeck. We are very grateful to Natesh Daniel, Barbara Kridl, John Vavricka, and the staff at MPR Associates for their expert graphic and Web design work.
DEFINING TERMS
According to the 1997 National Commission on the Cost of Higher Education, defining “cost,” “price,” and “subsidy” is critical to clarifying the issues in financing postsecondary education.
“Costs” refer to the expenditures associated with delivering instruction, including physical plant and salaries.
“Prices” are the expenses that students and parents face.
“Published price” is the price institutions charge for tuition and fees as well as room and board, in the case of students residing on campus. A full student expense budget also includes books, supplies, transportation, and other basic living costs.
“Net price” is what the student and/or family must cover after grant aid and savings from tax credits and deductions are subtracted.
“General subsidies” make it possible for institutions to charge less than the actual costs of instruction. State, federal, and local appropriations, as well as private philanthropy, reduce the prices faced by all students — whether or not they receive financial aid.
www.collegeboard.org
advocacy.collegeboard.org
11b-3631
110504622