Embed Size (px)
Citation preview

Trends, drivers of change and
possible solutions to address
deforestation and loss of
forest habitat in the Kenya-
Somalia cross-border area


ITrends, drivers of change and possible solutions to address deforestation and loss of forest
habitat in the Kenya-Somalia cross-border area
Jan De Leeuw, Grace Koech, Jane Wanjara, Leon Kihungi, Sharon Okoth, Muhammad Ahmed, Wilfred
Muriithi, Josephat Nyongesa and Maimbo Malesu
Published by: The World Agroforestry Centre, Nairobi, Kenya
DisclaimersThis report is made available with two disclaimers. First, the information provided by the World Agroforestry Centre (ICRAF) is to the best
of the Centres’ knowledge accurate, but we do not guarantee the information nor are we liable for any damages arising from the use of the
information. Second, the geographic designation employed in this report does not imply the expression of any opinion whatsoever on the
part of ICRAF, the Intergovernmental Authority on Development (IGAD) or the European Union (EU) concerning the legal status and the
delimitation of frontiers or boundaries of any country or administrative territories therein.
AcknowledgementsThis report is the result of a project to support the conservation of the biodiversity in the cross-border area between Kenya and Somalia that
was funded by the Biodiversity Management Programme (BMP) supported by IGAD and the European Union. The preparation of the
report was further supported by the CGIAR Research Programme on Forest, Trees and Agroforestry (CRP 6). Additional information on
the BMP project can be found at: http://www.worldagroforestry.org/igad-bmp/overview.
Copyright: The World Agroforestry Centre holds the copyright to
its publications and web pages, but encourages
reproduction without alteration of these materials for
non-commercial purposes. Acknowledgement of the
source of information is required in all instances.
Citation: De Leeuw J, Koech G, Wanjara J, Kihungi L, Okoth
S, Ahmed M, Muriithi W, Nyongesa J. and Maimbo
M. 2018. Trends, drivers of change and possible
solutions to address deforestation and loss of forest
habitat in the Kenya-Somalia cross-border area.
Nairobi: World Agroforestry Centre.
ISBN: 978-9966-108-04-3
Copies available from: A digital copy of this report is available for download
from http://www.worldagroforestry.org/igad-bmp
Trends, drivers of change and possible solutions to address deforestation and loss of forest
habitat in the Kenya-Somalia cross-border areaII
Table of contents
LIST OF FIGURES………………………………………………………………………………………………………...III
LIST OF TABLES………………………………………………………………………………………………………… III
LIST OF ABBREVIATIONS……………………………………………………………………………………………... I
SUMMARY……………………………………………………………………………………………………………….. 1
1. INTRODUCTION………………………………………………………………………………………………………. 2
2. METHODS………………………………………………………………………………………………………………3
2.1 PROJECT AREA……………………………………………………………………………………………………… 3
2.2 POTENTIAL VEGETATION………………………………………………………………………………………… 4
2.3 DATA SOURCES; HISTORIC MAPS OF ACTUAL VEGETATION……………………………………………….4
2.4 MAPPING TREE COVER AND TREE COVER LOSS…………………………………………………………...… 4
2.5 DRIVERS OF CHANGE……………………………………………………………………………………………… 4
2.6 POSSIBLE SOLUTIONS AND OPPORTUNITIES FOR MITIGATION AND RESTORATION…………………..4
2.7 DISSEMINATION OF THE REPORT FINDINGS TO DECISION MAKERS……………………………………... 11
3. RESULTS………………………………………………………………………………………………………............. 12
3.1 HISTORIC VEGETATION MAPS…………………………………………………………………………………… 12
3.2 MONITORING TREE COVER AND DEFORESTATION..………………………………………………………… 16
3.3 DRIVERS OF CHANGE.…………………………………………………………… ……………………………….. 20
3.4 A REVIEW OF POSSIBLE SOLUTIONS…………………………………………………………………………… 22
3.5 CONSERVATION MEASURES………………………………………………………………………………………27
3.6 SOLUTION TO REVERSE THE TREND OF FOREST COVERS LOS……………………………………………. 27
3.7 THREATS FACED BY FOREST STAKEHOLDERS IN IMPLEMENTATION OF CONSERVATION………….. 28
3.8 OPPORTUNITIES PRESENTED BY RESTORATION OF DEGRADED
LANDS……………………………………………………………………………………………………………………..29
3.9 ROLE OF BMP IN MANAGING FOREST COVER LOSS IN THE CROSS-BORDER AREA…………………… 29
5 DISCUSSION AND CONCLUSION…………………………………………………………………………………… 29
6 RECOMMENDATIONS………………………………………………………………………………………………... 30
6.1 POLICY RECOMMENDATIONS……………………………………………………………………………………. 31
6 ANNEXES………………………………………………………………………………………………………..............32
ANNEX A. DESCRIPTION OF THE
QUESTIONNAIRE………………………………………………………………………………………………………...32
7 REFERENCES…………………………………………………………………………………………………………. 40
Trends, drivers of change and possible solutions to address deforestation and loss of forest
habitat in the Kenya-Somalia cross-border areaIII

List of figuresFigure 1: Map of the Tana Kipini Lag Badana cross-border area………………………………………………………... 3
Figure 2: Average annual rainfall (mm) in the cross-border area………………………………………………………... 4
Figure 3: Location and gender of the respondents interviewed on the status, drivers of change, threats and opportunities presented by
restored forest cover…………………………………………….………………………………………………………... 4
Figure 4: Level of education and occupation of the respondents interviewed on the status, drivers of change, threats and opportunities
presented by restored forest cover……………………………….………………………………………………………... 5
Figure 5: Vegetation map of the northern part of the cross-border area. (Source: Abel (1976) for South Somalia and Oduori (1990) for the
Boni and Dodori National Reserves)…………………………….………………………………………………………... 6
Figure 6: Vegetation map for Lamu district based on the vegetation map presented in the Lamu District Environmental Assessment Report.
Source: National Environment Secretariat 1985..……………….………………………………………………………... 7
Figure 7: Map of tree cover in 2000 in the cross-border area. Source: Global Forest Watch…..………………………... 8
Figure 8: Tree cover in 2000 and areas affected by complete tree loss in North Eastern Kenya between 2000 and 2014. Source: Global
Forest Watch accessed 12-2012………………………………….………………………………………………………...8
Figure 9: Detailed map of tree cover in 2000 and areas affected by tree cover loss for the area around Witu National Forest Reserve.
Source: Global Forest Watch accessed 12-2012…………………………………………………………………………...8
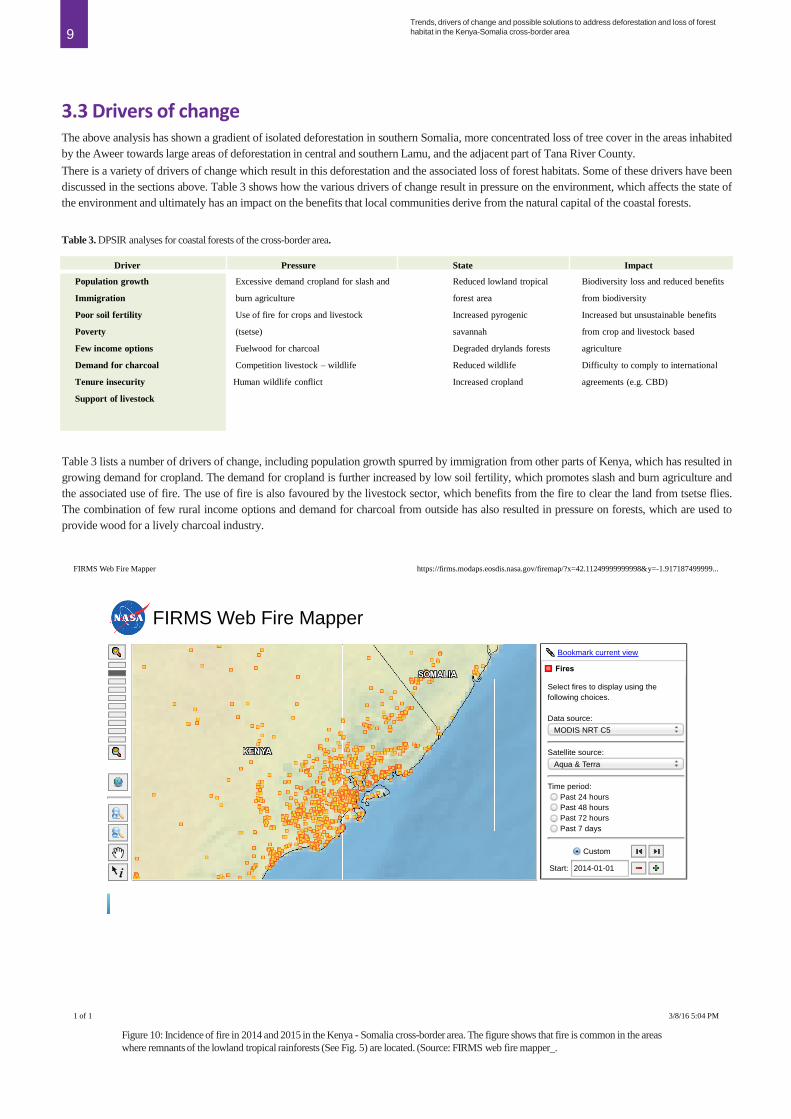
Figure 10: Incidence of fire in 2014 and 2015 in the Kenya - Somalia cross-border area. The figure shows that fire is common in the areas
where remnants of the lowland tropical rainforests (See Fig. 5) are located. Source: FIRMS web fire
mapper……………………………………………………………………………………………………………………...9
Trends, drivers of change and possible solutions to address deforestation and loss of forest
habitat in the Kenya-Somalia cross-border area
List of tablesTable 1: Description of the vegetation of the lag Badana area…………………………………………………………... 6
Table 2. Description of the vegetation of Boni and Dodori Reserves……………………………………………………...7
Table 3. DPSIR analyses for coastal forests of the cross-border area……………………………………………………...9
Table 4: Threats and possible solutions to address deforestation for various categories of land………………………... 10
Table 5: Drivers of change based on stakeholder perspective (source field workshops and interviews)………………... 12
IV
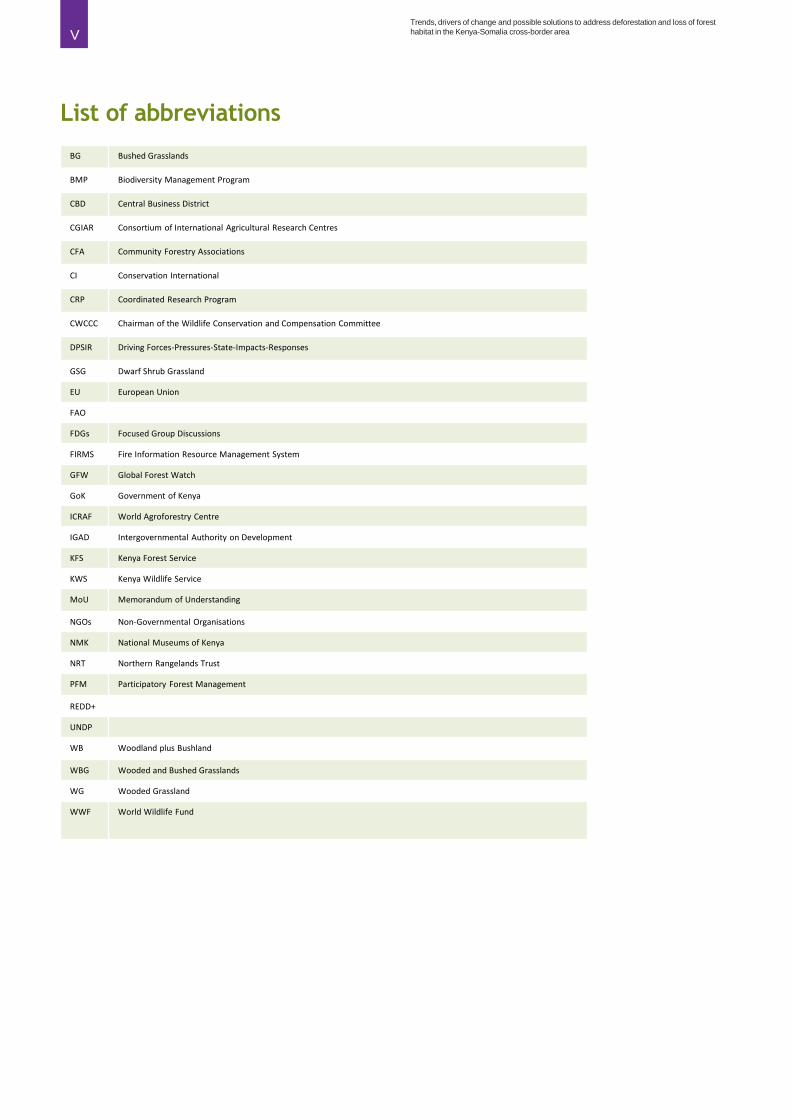
List of abbreviations
VTrends, drivers of change and possible solutions to address deforestation and loss of forest
habitat in the Kenya-Somalia cross-border area
BG Bushed Grasslands
BMP Biodiversity Management Program
CBD Central Business District
CGIAR Consortium of International Agricultural Research Centres
CFA Community Forestry Associations
CI Conservation International
CRP Coordinated Research Program
CWCCC Chairman of the Wildlife Conservation and Compensation Committee
DPSIR Driving Forces-Pressures-State-Impacts-Responses
GSG Dwarf Shrub Grassland
EU European Union
FAO
FDGs Focused Group Discussions
FIRMS Fire Information Resource Management System
GFW Global Forest Watch
GoK Government of Kenya
ICRAF World Agroforestry Centre
IGAD Intergovernmental Authority on Development
KFS Kenya Forest Service
KWS Kenya Wildlife Service
MoU Memorandum of Understanding
NGOs Non-Governmental Organisations
NMK National Museums of Kenya
NRT Northern Rangelands Trust
PFM Participatory Forest Management
REDD+
UNDP
WB Woodland plus Bushland
WBG Wooded and Bushed Grasslands
WG Wooded Grassland
WWF World Wildlife Fund
Trends, drivers of change and possible solutions to address deforestation and loss of forest
habitat in the Kenya-Somalia cross-border area1
The coastal forests of northeast coast of Kenya and southern Somalia
form the northern tip of the East African Coastal Forest Biodiversity
Hotspot. While this hotspot is considered threatened by deforestation
and forest degradation, there is little up-to-date information on the
status of these forests, their rates of deforestation and degradation, the
underlying drivers of change and the opportunities presented by
restoration of the degraded forest lands. The EU/IGAD-funded
Biodiversity Management Programme, which supports one project
that aims at the biodiversity conservation commissioned a study to
describe the loss of tree cover, the associated drivers of change and
reviewing possible solutions. This report first presents historic
vegetation maps that localize the lowland tropical rainforests and the
drylands forests that are the habitats of the biodiversity of the East
African Coastal Forest Biodiversity Hotspot. Next, using information
from Global Forest Watch (GFW), this study reports significant
deforestation in the lowland tropical rainforests in southern and
central Lamu County and adjacent Tana River County. We further
report isolated deforestation in the dryland forests in the Awer
Conservancy in the northern part of Lamu County. The GFW data
reveals only limited deforestation in the south of Somalia. The Fire
Information Resource Management System (FIRMS) active fire data
reveals frequent fires in the lowland savannas surrounding the
remaining tropical rainforest fragments. More isolated areas affected
by fires are reported from the dryland forests in South Somalia,
presumably reflecting the active charcoal industry in this area. Our
analysis thus reveals that few fragments of indigenous lowland
tropical rainforest remain in Lamu and Tana River Counties, while
charcoal production is affecting the dryland forests in southern
Somalia and the drier areas across the border in Kenya.
Key informant surveys among stakeholders from Lamu County
revealed that increase in human population is the primary factor
driving the loss of tree cover in southern and central Lamu and
adjacent Tana River Counties. Fire and infrastructure development are
secondary drivers of change further degrading the biodiversity in
areas where forest canopies have been opened by agricultural
encroachment such as the land around Witu Forest. Damage caused
by fire to vegetation, particularly anthropogenic wildfires is damaging
to trees due to increased fire frequency while overgrazing and over-
harvesting reduce the natural regeneration of degraded lands. In Witu
Forest, wildlife damage to natural vegetation and plantation species
through bulk feeding and trampling by elephants is a well-
documented phenomenon, and is linked to an increase in the
population. To reverse the negative trend in forest cover change, key
informants and focus group discussions proposed the need for Kenya
Wildlife Service (KWS), Kenya Forest Service (KFS) and non-
governmental organizations to collaborate in conservation, making
sure the local community is adequately engaged in the process;
promote the formation of community forestry associations and
encourage their participation in forest management and conservation;
allocate land to new entrants in the area, away from the forest; sign a
Memorandum of Understanding (MoU) between farmers and
herdsmen to prevent encroachment into the forest; designate an area
for the grazing community; support KFS and KWS to partner with
private companies, to regenerate, manage and sustainably utilize
forest resources; and set up a partnership between the county
government and KFS to implement charcoal rules to regulate the
industry in order to address and reverse the loss of biodiversity.
Effective policies that halt encroachment, development of
infrastructure and bushfires are required to support the conservation of
remnant forest fragments outside the protected area.
Summary
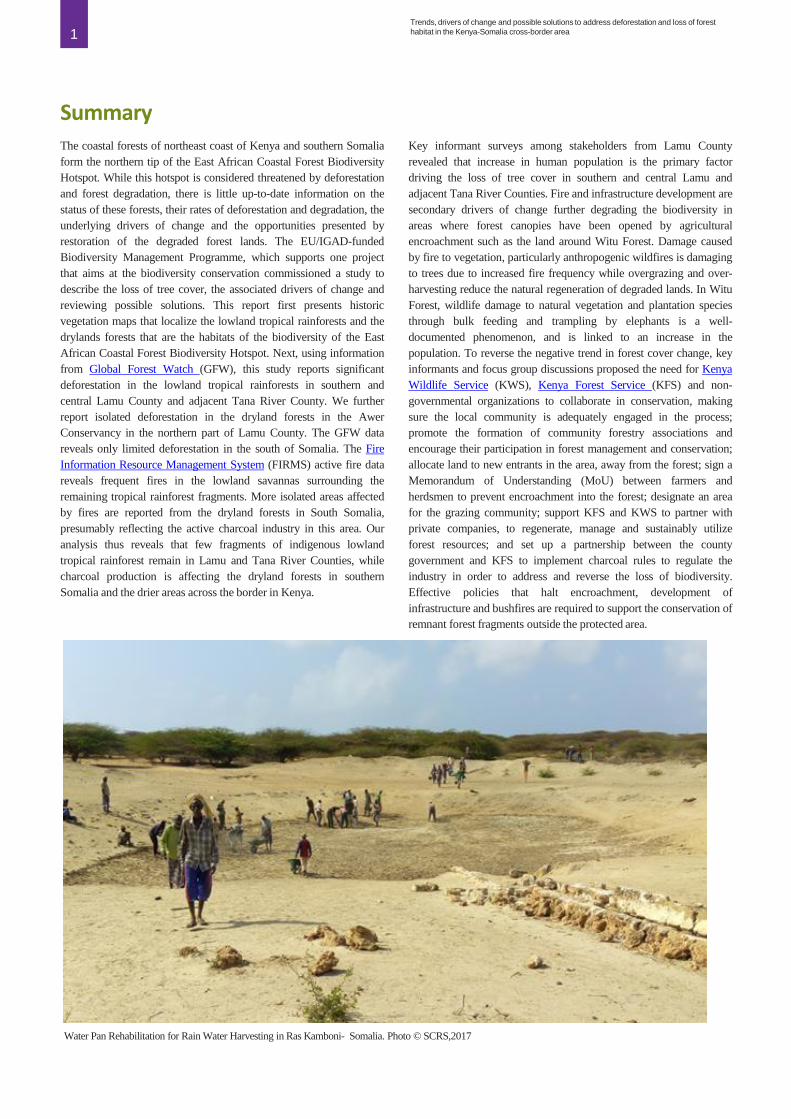
Water Pan Rehabilitation for Rain Water Harvesting in Ras Kamboni- Somalia. Photo © SCRS,2017

Trends, drivers of change and possible solutions to address deforestation and loss of forest
habitat in the Kenya-Somalia cross-border area2
The coastal forests of northern Kenya and southern Somalia form the
northern tip of the East African Coastal Forest Biodiversity Hotspot,
one of the 35 global biodiversity hotspots recognized by Conservation
International (CI). This biodiversity hotspot, which extends from
southern Somalia to northern Mozambique, hosts 1,750 endemic plant
species (Myers et al. 2000). It also has a number of endemic animal
species, including three monkey species, the Tana River red colobus,
the Tana River Mangabey and the Zanzibar red colobus (WWF,
2006). The drylands forests and savannas of this biodiversity hotspot
host the entire world population of the Hirola or Hunter’s Hartebeest
(Beatragus hunteri). The Hirola is an endemic antelope species, which
is the only remaining representative of the once more widespread and
species rich genus of Beatragus . Aside from being the centre of
endemism. Also these forested lands area are critical for growth of the
tourism industry and water catchment.
The forest habitats in Kenya and Somalia cross-border area
mainstream various livelihood activities such as fishing within the
creek and mangrove, wood carving, agriculture, marine culture,
tourism, wildlife harvesting and harvesting of medicinal plants
(Matiku, 2005). The forest habitats are however faced with threats
due to increased population, unregulated harvesting of timber and
non-timber products, insufficient local and institutional capacity and
policy gaps (Matiku, 2005; GOK, 2010). The main threats are
deforestation and forest degradation through activities such as
overgrazing and charcoal burning.
Deforestation and forest degradation threatens the biodiversity in the
East African Coastal Forest Hotspot. In 2011, during the International
Year of Forests, Conservation International ranked the East African
Coastal Forest Biodiversity Hotspot, with around 10% of the original
forest habitat remaining, among the ten most threatened forest areas in
the world.
Conservation International considers agricultural expansion and
unsustainable agricultural land use that revolves around short-term
shifting cultivation as major threats to these forests. Further threats
identified by Conservation International include unsustainable
charcoal production, extraction of wood for carving and as timber, the
excessive use of fire to clear farmland, collect honey and to reduce
tsetse flies and increasingly, mining. Together, these processes result
in deforestation and habitat loss, which challenges the preservation of
this rich biodiversity. Yet, so far there is little information on the rates
of deforestation and forest degradation in the coastal forests in
northern Kenya and southern Somalia, their drivers of change and the
current status of these forests and the possible solutions to mitigate or
reverse possible negative trends.
The World Agroforestry Centre manages one of the projects of the
EU/IGAD Biodiversity Management Programme (BMP) in the Horn
of Africa. The project aims to support the conservation of biodiversity
in the coastal cross-border area between North-Eastern Kenya and
South Somalia. One of the activities of the BMP project aims to
monitor the tree cover loss in order to better understand the forest
habitat loss and its drivers of change in the projects’ demonstration
sites to allow better management through targeted interventions
supported by the BMP project and communicate solutions to decision
makers.
This report addresses the objectives of the above-described activity of
the BMP project. It aims at describing the loss of tree cover, analyse
the drivers of change and reviews possible solutions. The study
reports significant loss of tree cover particularly in the southern parts
of the cross-border area, in the region surrounding the Witu National
Forest Reserve, Boni Dondori National forest reserve and the Lag
Badana proposed protected area. Finally, we report the results of
interviews with key stakeholders and their suggestions for possible
solutions.
1. Introduction
A tree nursery established by the project in Lamu west, Kenya. Photo © World Agroforestry Centre/ IGAD-BMP project

Trends, drivers of change and possible solutions to address deforestation and loss of forest
habitat in the Kenya-Somalia cross-border area3
This study describes the state and habitat change of the forests in the
Tana Kipini Laga Badana Landscape (figure 1), one of the cross-
border areas of the EU-IGAD-funded Biodiversity Management
Program (BMP). The cross-border area extends from the Tana River
in Kenya to Laga Badana in Somalia.
The cross-border area includes an area of 20,286 km2 of land and
seascape of which 17,179 km2 (85%) is located in Kenya and 3,107
km2 (15%) in Somalia. Administratively, the area includes the whole
of Lamu County and parts of Tana River and Garissa County in
Kenya, as well as part of Badadhe District in Somalia. Transport
infrastructure in the terrestrial part is poor, with no tarmacked roads.
There is only one airport on Lamu Island. The coastal area is more
accessible from the sea. Larger settlements offering basic social
amenities include Lamu, Mpeketoni, Witu, Hindi and Mokowe in
Kenya and Badadhe in Somalia, while smaller settlements without
these facilities are dispersed throughout the area.
The climate of the area is tropical with two rainy seasons. The long
rainy season is associated with the Northern Monsoon and extends
from April to June, while the short rains come with the South-West
Monsoon and extend from October to December. The area is
characterized by a steep gradient in average annual rainfall ranging
from over 1,000 mm in the south to 450 mm in the north (figure 2).
The combination of these rainfall amounts with a potential
evaporation of about 2,200 mm (Ali, 1985) results in an aridity index
of 0.2 in the north to 0.45 in the south, which classifies the entire
cross-border area as a semi-arid dryland. Temperatures in this area are
affected by the sea breeze from the Indian Ocean. Average annual
daily temperatures range from 15°C to 32°C, with higher
temperatures during the dry season from December to April, and
lower temperatures from May to July.
2. Methods
2.1 Project area
Figure 1. Tana Kipini Laga Badana cross-border area
Figure 2. Average annual rainfall (mm) in the cross-border area..
Trends, drivers of change and possible solutions to address deforestation and loss of forest
habitat in the Kenya-Somalia cross-border area
The potential vegetation of the cross-border can be classified into
three main categories (Whyte, 1993). Near the Tana River delta,
grassland is dominant, mangroves form the coastal vegetation but are
normally affected by tides and Zanzibar-Inhambane regional mosaic
form the remainder of the area. The regional mosaic consists of a
mixture of vegetation types including lowland rain forest, woodland
and scrub forest.
The DPSIR approach (EEA, 2007) was used to analyse how the
various drivers of change affect the biodiversity of the area and the
benefits that people derive from this. The approach is commonly used
by the European Union and other organizations to analyse
environmental problems. We have analysed the effects of various
drivers of change on the biodiversity of the cross-border area and the
benefits that people derive from this biodiversity, while making use of
the insights that the ICRAF team has gained on the various processes
that are causing the loss of biodiversity.
The narrative thus developed was written out and shared with partners
and stakeholders, who were invited to provide their comments and
propose modifications. These were used to further develop, enrich and
revise the DPSIR analysis, which is presented in table 3. While fire
was considered a major factor affecting biodiversity in the area, the
FIRMS web fire mapping facility mapped the historic incidence of
fire in the cross-border area.
2.2 Potential vegetation
There are various vegetation maps, which describe the actual
vegetation for various parts of the cross-border area in the second half
of the 20th century. These historic legacy maps include a vegetation
map of Lamu District that was presented in the 1985 Lamu District
Environmental Assessment Report (National Environment
Secretariat, 1985) , a vegetation map of the Boni and Dodori National
Reserves produced by Simon M. Oduori of the Drivers, Pressures,
State, Impact and Response (DRSRS) approach (Oduori 1990) based
on a Landsat MSS satellite image of 1972 complemented with sample
aerial photography and field surveys and a vegetation map of the area
of the proposed Laga Badana National Park based on aerial
photography of 1950 (Abel, 1976). These legacy vegetation maps
have been digitized by ICRAF staff and are presented with a
description of the map units in section 3.1 of this report.
2.3 Data sources; historic maps of actual vegetation
The Global Forest Watch (http://www.globalforestwatch.org/)
provides a global record of tree cover in the year 2000 and the
deforestation losses from 2000 until 2014. The forest cover data of
2,000 and the forest and deforestation loss estimates are based on the
Landsat record, with imagery being processed by the University of
Maryland according to procedures described by Hansen et al. (2013)
and data downloadable from the Global Forest Cover Change Data
portal. The ICRAF Geoscience lab downloaded the data from the site
to produce maps on tree cover in the year 2000 as well as areas
affected by deforestation between 2000 till 2014.
2.4 Mapping tree cover and tree cover loss
2.5 Drivers of change
Following the analyses described above, a team from ICRAF
organized Focused Group Discussions (FGDs) and key informant
interviews to collect the primary sources of information on
stakeholder perspectives on the trends, drivers of change and possible
solutions to deforestation and forest degradation at the Kenya Somalia
cross-border area. Stakeholders from selected forestry regions and
conservancies were given opportunities to give information and their
insights on the historical and current drivers of deforestation and
forest degradation.
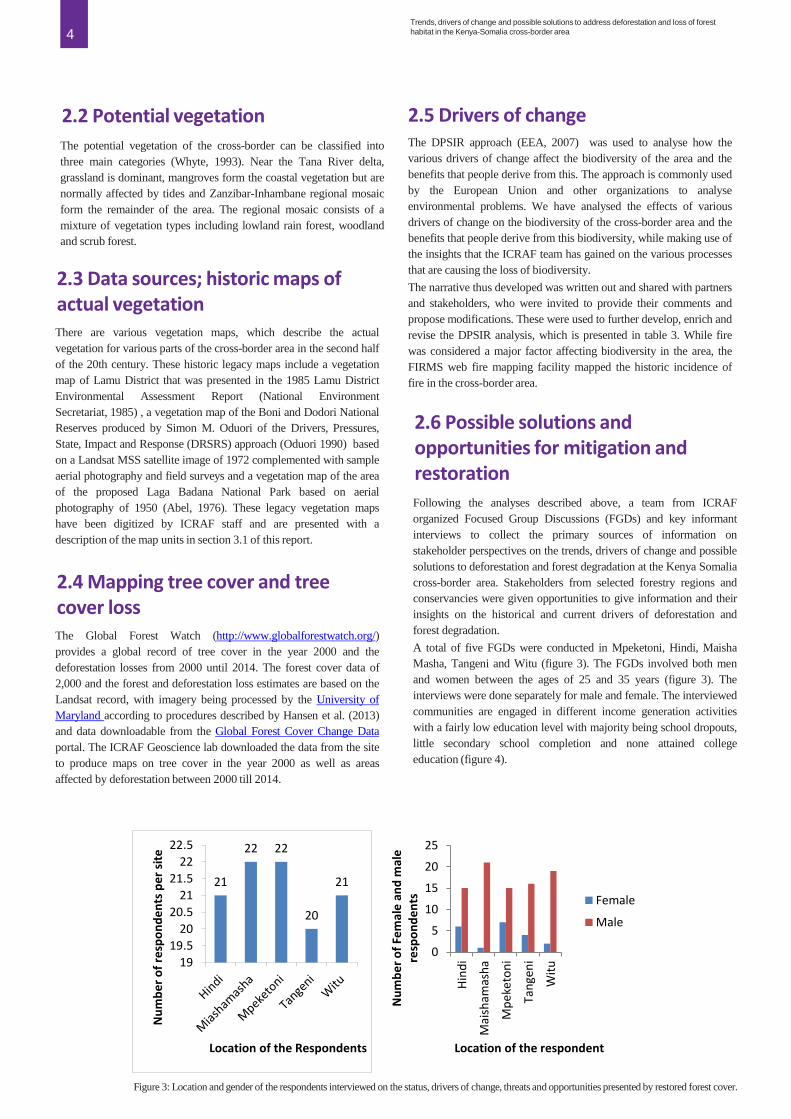
A total of five FGDs were conducted in Mpeketoni, Hindi, Maisha
Masha, Tangeni and Witu (figure 3). The FGDs involved both men
and women between the ages of 25 and 35 years (figure 3). The
interviews were done separately for male and female. The interviewed
communities are engaged in different income generation activities
with a fairly low education level with majority being school dropouts,
little secondary school completion and none attained college
education (figure 4).
2.6 Possible solutions and opportunities for mitigation and restoration
21
22 22
20
21
19
19.5
20
20.5
21
21.5
22
22.5
Nu
mb
er
of
resp
on
de
nts
pe
r si
te
Location of the Respondents
0
5
10
15
20
25
Hin
di
Mai
sham
ash
a
Mp
eke
ton
i
Tan
gen
i
Wit
u
Nu
mb
er
of
Fem
ale
an
d m
ale
re
spo
nd
en
ts
Location of the respondent
Female
Male
Figure 3: Location and gender of the respondents interviewed on the status, drivers of change, threats and opportunities presented by restored forest cover.
4

Trends, drivers of change and possible solutions to address deforestation and loss of forest
habitat in the Kenya-Somalia cross-border area
0%
25%
50%
75%
100%
Hin
di
mai
sham
ash
a
Mp
eket
on
i
Tan
gen
i
wit
u
Pe
rce
nta
ge le
vel o
f e
du
cati
on
Location of the respondents
Secondary
Primary
No education 0
5
10
15
Hin
di
Mai
sham
ash
a
Mp
eket
on
i
Tan
gen
i
Wit
uNu
mb
er
of
resp
on
de
nts
pe
r o
ccu
pat
ion
Location of the respondents
Business
Carpenter
Farmers
fishing
Herdsman
Figure 4: Level of education and occupation of the respondents interviewed on the status, drivers of change, threats and opportunities presented by
restored forest cover.
Key informants included forest managers, conservancy managers,
personnel from KWS and the Northern Rangelands Trust (NRT-
Coast), the Chairman of the Wildlife Conservation and Compensation
Committee (CWCCC), local administration and opinion leaders.
Prior to the interviews, stakeholders were informed that deforestation
is happening inside and outside protected areas based on the Global
Forest Watch and FIRMS websites. The stakeholders were informed
that from the Global Forest Watch, no evidence of extensive
deforestation was recorded in south Somalia. Charcoal burning was
identified as the main driver of forest degradation in the area but it
does not translate to complete deforestation. Agricultural expansion is
not of concern in south Somalia for the area is extremely dry with
little or no cropland. In Lamu County, some localized deforestation to
the north in public lands between Boni and Dodori National Reserves
was recorded. These areas of deforestation are located adjacent to
where the Aweer community lives. This can be explained by the
community’s shift from hunting and gathering to subsistence
agriculture practicing mainly shift cultivation and slash and burn
agriculture. Witu Forest and neighbouring areas in Tana River County
have recorded loss in forest cover due to increased population which
put pressure on the existing but limited resources. Encroachment to
the extraction of timber and firewood, forest fires, charcoal burning,
illegal logging and insecurity has a significant impact on tree cover in
these areas. Forest fires are becoming a concern as they clears large
portions of forest land including the indigenous tree species which
take a lot of time to regenerate due to intense livestock grazing and
trampling by wildlife.
One of the objectives of the BMP project was to convey copies of this
report to relevant decision makers. ICRAF considers that there is no
single decision maker with the mandate or means to implement the
solutions that the stakeholders proposed. Instead, there are multiple
actors who each may have a role to play in halting the deforestation
and unsustainable use of land and promoting the conservation and
restoration of forest habitats to host the biodiversity of the East
African Coastal Forest Hotspot.
Therefore, ICRAF has chosen to transmit the report to multiple actors
with the possibility of influencing decisions on land use and forest
conservation. These include the Kenya Representative to the CBD as
well as national and county level representatives of KFS, KWS,
National Museums of Kenya (NMK) and the ministries of Lands,
Natural Resources and Agriculture and several non-Governmental
Organisations active in Lamu and Tana River Counties, including
North Coast Land Conservancy (NRT), World Wildlife Fund
(WWF), the David Sheldrick Wildlife Trust and the Lamu
Conservation Trust in Kenya. In Somalia, the report will be shared
with the Ministry of Livestock, Forestry and Range of the Federal
Government of Somalia and the Ministry of Water, Energy,
Environment & Mineral Resources of the Jubbaland Administration.
5
2.7 Dissemination of the report findings to decision makers
Capacity building on NRM and RWH – Somalia: Burgabo (right) and Ras Kamboni (left)

Trends, drivers of change and possible solutions to address deforestation and loss of forest
habitat in the Kenya-Somalia cross-border area
Figure 5 presents the vegetation in southern Somalia and the adjacent
areas in Kenya. The vegetation classes are based on the physiognomy
(vertical structure) of the vegetation, with classes ranging from forests
(mangroves), woodlands and shrublands to grasslands. The map
describes the vegetation in the 1950s for Somalia and around 1990 for
Kenya.
Based on further information in Abel (1976), table 1 complements the
description of the vegetation types displayed in figure 7, including
descriptions of the location and environmental conditions and more
information on species present in the canopy and undergrowth.
According to Abel (1976), past livestock grazing influenced the
vegetation of the Laga Badana area. He considered that the woody
species in the shrublands that dominate the area had been promoted
by grazing of livestock in the past which prevented late season fires
that would have supressed the dominance of woody species. He
further noted that vegetation closer to water points consisted of annual
grasses such as Chloris and Dactyloctenium. Finally, he noted that the
grasslands at the south-west part of the park were in fine condition,
due to underutilisation by livestock due to heavy tsetse fly infestation.
3. Results3.1 Historic vegetation hacks
6
Figure 5: Vegetation map of the northern part of the cross-border area.
(Source: Abel (1976) for South Somalia and Oduori (1990) for the Boni and
Dodori National Reserves) .
Class & symbol Location and environment Undergrowth species Canopy species
Bushland [B] Lag Dera Flood Plain Annual and perennial grasses Combretum spp.
Bushland [BCr] On red sands over limestone Perennial grasses where light permits Dense shrub cover
Bushland [Bc] On coastal dunes and hills, near settlements,
modified by shifting cultivation and livestock
Annual grasses such as Chloris and
Dactyloctenium spp.
Acacia tortilis in stunted form
Woodland [W] A form of Manilkara Diosporos woodland, with
trees up to 18 m tall, and canopy cover > 20% but
not interlaced
Understory of Sideroxylon, Croton, Euclea,
Lannea, Combretum, Grewia and Notobuxus
Manilkara, Afzelia, Diosporos, Olea,
Oldfieldia, Brachylaena, Terminalai and
Combretum
Grassland [G] Seasonally waterlogged grasslands with grass
height of 50 to 150 cm
Setaria sphacelata and Echinochloa haploclada Isolated trees and shrubs (A. seyal) with < 2%
canopy cover
Bushed grassland [BG] Grassland with scattered or grouped shrubs Setaria sphacelata and Echinochloa haploclada Canopy cover of trees and shrubs (A. seyal) 2-
20%
Dwarf shrub grassland
[dSG]
Open vegetation on recently deposited white
sands in coastal strip
Short perennial forbs Open canopy of short shrubs
Woodland plus bushland
[WB]
A mixed vegetation type. Considerably modified
by elephants and people.
Shrub layer of Combretum and Acacia spp.,
perennial grasses in ground layer
Canopy cover > 20%. Terminalia, Delonix,
Adanasonia digitata
Wooded and bushed
grassland [WBG]
On free draining sandy soils, the openness of the
vegetation might be the result of past human
activity.
A perennial grass layer dominated by
Sporobolus sp.
Canopy cover 2-40%. Terminalia sp.
Riparian Forest Strip of forest growing along the banks and in the
beds of the streams
Diosporos, Garcenia and Ficus spp.
Table 1: Description of the vegetation of the lag Badana area
Trends, drivers of change and possible solutions to address deforestation and loss of forest
habitat in the Kenya-Somalia cross-border area
Table 2: Description of the vegetation of Boni and Dodori Reserves
Class & symbol Location and environment Undergrowth species Canopy species
Bushland [B] Occupies 35% of the mapped area
Bushed woodland Covered 26% of the area. Digitaria pearsonii, Striga hermonthica,
Hermannia kirkii, Cassia mimosoides
Securingia virosa, Acacia nilotica, Combretum sp.,
hyphaene coriacea,
Woodland [W] Occupies 30% of the mapped area, mostly in
Boni National Reserve
Hyphaene coriacea, Dyosyros sp., Albizia sp.,
Celesia madagascarensis, Acacia tortilis, Asteranthe
asteris (NT)
Wooded grassland [WG] Occupies 14% of the area, grassland with
scattered and grouped trees
Hyparrhenia palillipes, Digitaria Milanjiana,
Digitaria abyssinica and Sprobolus sp.
Combretum sp,, Canthium sp., Afzelia sp., and
Grewia plagiophylla
Riparian Forest Along the Dodori River Afzelia,
Source: Modified according to Oduori (1990).
7
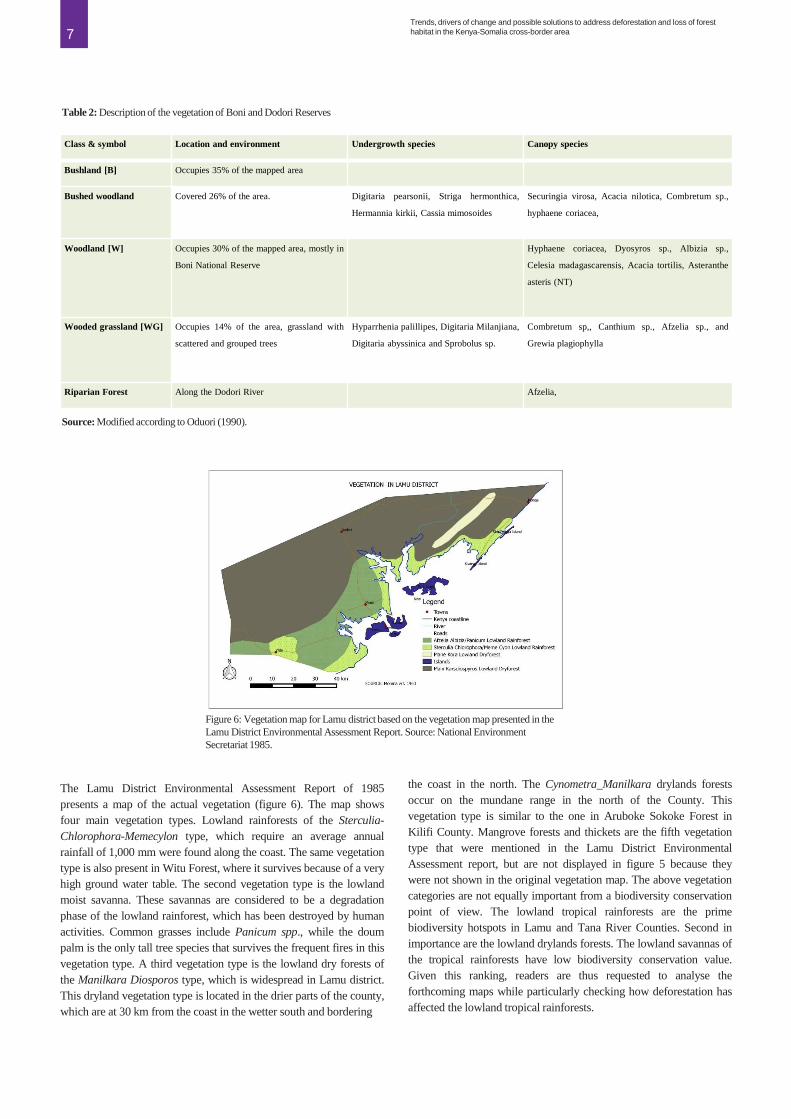
Figure 6: Vegetation map for Lamu district based on the vegetation map presented in the
Lamu District Environmental Assessment Report. Source: National Environment
Secretariat 1985.
The Lamu District Environmental Assessment Report of 1985
presents a map of the actual vegetation (figure 6). The map shows
four main vegetation types. Lowland rainforests of the Sterculia-
Chlorophora-Memecylon type, which require an average annual
rainfall of 1,000 mm were found along the coast. The same vegetation
type is also present in Witu Forest, where it survives because of a very
high ground water table. The second vegetation type is the lowland
moist savanna. These savannas are considered to be a degradation
phase of the lowland rainforest, which has been destroyed by human
activities. Common grasses include Panicum spp., while the doum
palm is the only tall tree species that survives the frequent fires in this
vegetation type. A third vegetation type is the lowland dry forests of
the Manilkara Diosporos type, which is widespread in Lamu district.
This dryland vegetation type is located in the drier parts of the county,
which are at 30 km from the coast in the wetter south and bordering
the coast in the north. The Cynometra_Manilkara drylands forests
occur on the mundane range in the north of the County. This
vegetation type is similar to the one in Aruboke Sokoke Forest in
Kilifi County. Mangrove forests and thickets are the fifth vegetation
type that were mentioned in the Lamu District Environmental
Assessment report, but are not displayed in figure 5 because they
were not shown in the original vegetation map. The above vegetation
categories are not equally important from a biodiversity conservation
point of view. The lowland tropical rainforests are the prime
biodiversity hotspots in Lamu and Tana River Counties. Second in
importance are the lowland drylands forests. The lowland savannas of
the tropical rainforests have low biodiversity conservation value.
Given this ranking, readers are thus requested to analyse the
forthcoming maps while particularly checking how deforestation has
affected the lowland tropical rainforests.
Trends, drivers of change and possible solutions to address deforestation and loss of forest
habitat in the Kenya-Somalia cross-border area
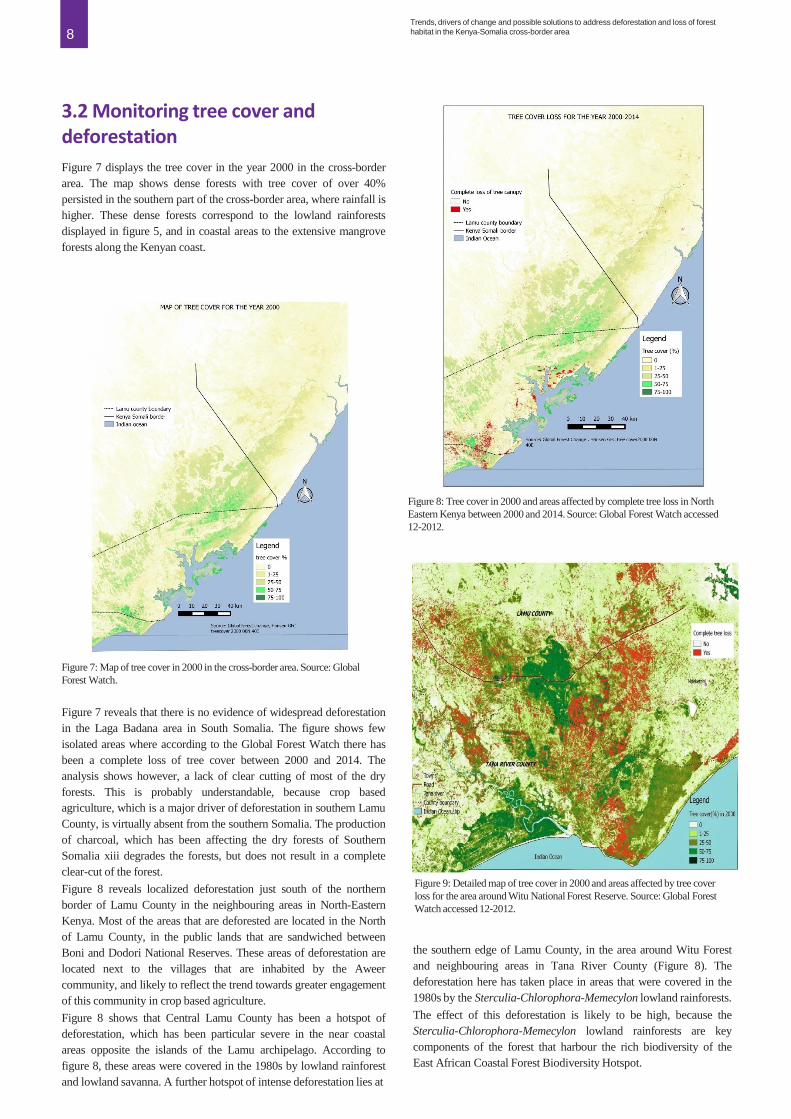
Figure 7 displays the tree cover in the year 2000 in the cross-border
area. The map shows dense forests with tree cover of over 40%
persisted in the southern part of the cross-border area, where rainfall is
higher. These dense forests correspond to the lowland rainforests
displayed in figure 5, and in coastal areas to the extensive mangrove
forests along the Kenyan coast.
3.2 Monitoring tree cover and deforestation
Figure 7: Map of tree cover in 2000 in the cross-border area. Source: Global
Forest Watch.
Figure 7 reveals that there is no evidence of widespread deforestation
in the Laga Badana area in South Somalia. The figure shows few
isolated areas where according to the Global Forest Watch there has
been a complete loss of tree cover between 2000 and 2014. The
analysis shows however, a lack of clear cutting of most of the dry
forests. This is probably understandable, because crop based
agriculture, which is a major driver of deforestation in southern Lamu
County, is virtually absent from the southern Somalia. The production
of charcoal, which has been affecting the dry forests of Southern
Somalia xiii degrades the forests, but does not result in a complete
clear-cut of the forest.
Figure 8 reveals localized deforestation just south of the northern
border of Lamu County in the neighbouring areas in North-Eastern
Kenya. Most of the areas that are deforested are located in the North
of Lamu County, in the public lands that are sandwiched between
Boni and Dodori National Reserves. These areas of deforestation are
located next to the villages that are inhabited by the Aweer
community, and likely to reflect the trend towards greater engagement
of this community in crop based agriculture.
Figure 8 shows that Central Lamu County has been a hotspot of
deforestation, which has been particular severe in the near coastal
areas opposite the islands of the Lamu archipelago. According to
figure 8, these areas were covered in the 1980s by lowland rainforest
and lowland savanna. A further hotspot of intense deforestation lies at
8
Figure 8: Tree cover in 2000 and areas affected by complete tree loss in North
Eastern Kenya between 2000 and 2014. Source: Global Forest Watch accessed
12-2012.
Figure 9: Detailed map of tree cover in 2000 and areas affected by tree cover
loss for the area around Witu National Forest Reserve. Source: Global Forest
Watch accessed 12-2012.
the southern edge of Lamu County, in the area around Witu Forest
and neighbouring areas in Tana River County (Figure 8). The
deforestation here has taken place in areas that were covered in the
1980s by the Sterculia-Chlorophora-Memecylon lowland rainforests.
The effect of this deforestation is likely to be high, because the
Sterculia-Chlorophora-Memecylon lowland rainforests are key
components of the forest that harbour the rich biodiversity of the
East African Coastal Forest Biodiversity Hotspot.
Trends, drivers of change and possible solutions to address deforestation and loss of forest
habitat in the Kenya-Somalia cross-border area
The above analysis has shown a gradient of isolated deforestation in southern Somalia, more concentrated loss of tree cover in the areas inhabited
by the Aweer towards large areas of deforestation in central and southern Lamu, and the adjacent part of Tana River County.
There is a variety of drivers of change which result in this deforestation and the associated loss of forest habitats. Some of these drivers have been
discussed in the sections above. Table 3 shows how the various drivers of change result in pressure on the environment, which affects the state of
the environment and ultimately has an impact on the benefits that local communities derive from the natural capital of the coastal forests.
3.3 Drivers of change
Driver Pressure State Impact
Population growth
Immigration
Poor soil fertility
Poverty
Few income options
Demand for charcoal
Tenure insecurity
Support of livestock
Excessive demand cropland for slash and
burn agriculture
Use of fire for crops and livestock
(tsetse)
Fuelwood for charcoal
Competition livestock – wildlife
Human wildlife conflict
Reduced lowland tropical
forest area
Increased pyrogenic
savannah
Degraded drylands forests
Reduced wildlife
Increased cropland
Biodiversity loss and reduced benefits
from biodiversity
Increased but unsustainable benefits
from crop and livestock based
agriculture
Difficulty to comply to international
agreements (e.g. CBD)
Table 3. DPSIR analyses for coastal forests of the cross-border area.
Table 3 lists a number of drivers of change, including population growth spurred by immigration from other parts of Kenya, which has resulted in
growing demand for cropland. The demand for cropland is further increased by low soil fertility, which promotes slash and burn agriculture and
the associated use of fire. The use of fire is also favoured by the livestock sector, which benefits from the fire to clear the land from tsetse flies.
The combination of few rural income options and demand for charcoal from outside has also resulted in pressure on forests, which are used to
provide wood for a lively charcoal industry.
9
FIRMS Web Fire Mapper
Bookmark current view
Fires
Select fires to display using the
following choices.
Data source:
MODIS NRT C5
Satellite source:
Aqua & Terra
Time period:
Past 24 hours
Past 48 hours
Past 72 hours
Past 7 days
Custom
Start: 2014-01-01
FIRMS Web Fire Mapper https://firms.modaps.eosdis.nasa.gov/firemap/?x=42.11249999999998&y=-1.917187499999...
1 of 1 3/8/16 5:04 PM
Figure 10: Incidence of fire in 2014 and 2015 in the Kenya - Somalia cross-border area. The figure shows that fire is common in the areas
where remnants of the lowland tropical rainforests (See Fig. 5) are located. (Source: FIRMS web fire mapper_.

Trends, drivers of change and possible solutions to address deforestation and loss of forest
habitat in the Kenya-Somalia cross-border area
As indicated on the previous page, the encroachment of croplands and
the management of savanna with fire are significant pressures that
affect the forests and grasslands that harbour the biodiversity of the
East African Coastal Forest Biodiversity Hotspot. Figure 10 shows
that fire is common in the coastal areas of the cross-border area,
particularly in the southern part where rainfall is higher. The reason
for this geographical limitation of fire to the wetter parts of the area is
the production of biomass and fuel-load, which is required to keep fire
going.
While we did not consider it as a primary driver of vegetation
degradation, fire plays a particularly important role. It is used as a tool
to manage man-made vegetation in such a way as to promote the
production of crops and livestock. Fire is used in slash and burn
agriculture to release nutrients from vegetation. This has an
immediate but short-lived effect on fertilizing the soil, and when
nutrients are depleted, farmers are forced to turn to other areas to burn
vegetation and release nutrients. Slash and burn agriculture has been
practiced sustainably for years in areas with low population densities .
However, it becomes a source of land degradation and biodiversity
loss when continued at higher population densities.
Fire is also used to support livestock production. It is used to burn
down the tall grasses that may extend over two metres high when
there is sufficient rainfall. This practice promotes the spread of shorter
grasses that are easily accessible and more palatable to livestock. Fire
is also used to suppress tsetse flies, which are impediment to livestock
production in the coastal areas of Lamu and Tana River Counties.
Tsetse flies thrive particularly well in wooded and bush areas, and
livestock keepers use fire to suppress the woody vegetation where
tsetse flies reproduce.
Together, these drivers and pressures are resulting in a rapid decline
lowland tropical forest areas a degradation of the dryland forests,
where charcoal production is common, an increase of cropland and
pyrogenic savannah and reduced wildlife. These trends are having
impacts on the benefits that people derive from nature. There is a loss
of biodiversity and the benefits associated with this. Instead, people
increasingly rely on benefits from crop and livestock-based
agriculture, which is not always sustainable.
10
The previous analysis revealed a rapid deforestation in the cross-
border area, the drivers of change and the impacts on the state of
forests and the benefits that people derive from these.
We next interviewed the groups of local actors and key informants on
possible solutions they were envisioned to conserve the forests in the
Tana Kipini Laga Badana cross-border area. During preparation of
these interviews, it was realized that the threats and possible solutions
differ between various categories of lands. For example, the threats
and possible solutions to high biodiversity forests inside protected
areas are fundamentally different from those in agricultural lands. The
questionnaires were therefore stratified to ask stakeholders for threats
and possible solutions for the five categories of land.
3.4 A review of possible solutions
Table 4: Threats and possible solutions to address deforestation
Land categories Threats Proposed solution Actors
High biodiversity forest inside
protected area
1. Encroachment,
2. logging,
3. charcoal production,
4. Collection of NTFPs etc.
KFS, KWS and County government to collaborate in conserving forest.
The rangers should be supported with equipment to improve their efficiency
in addressing security issues
Encourage local communities to plant trees on farm to allow them collect
NTFPs from their lands, Increase community awareness on benefits of forest
and its conservation. rehabilitation and restoration of degraded lands, support
the local communities with seedling and rainwater harvesting materials to
help them store water for watering trees during dry seasons
KFS, KWS, County
government, NGOs,
Immigrants, charcoal
producers, Local
community, Rangers and
People carrying out
Illegal activities
High biodiversity forest outside
protected areas
Competing claims for land for
cultivation, grazing and
infrastructure development
crops, lack of responsibility due to
land tenure issues, tragedy of the
commons and mega projects e.g. the
LAPSSET corridor
Promoting Participatory Forest Management, encourage community based
forest conservation
Provision of tittle deeds,
Proper environment impact analysis prior to execution of mega projects such
as the LAPSSET corridor
County government,
local community, KFS,
KWS and NGO’s
Degraded and plantation forest
outside protected areas
Competing claims for land Range land Management
Controlled grazing
Signing of MoU between farmers and pastoralists to reduce degradation
KFS, KWS, County
government, NGOs,
Farmers and Pastoralists
Agricultural lands Destruction of tree cover in
croplands and grazing lands causing
a footprint for tree resources in areas
outside these lands
Agroforestry interventions in croplands and grazing lands to ensure that these
areas can supply tree resources and thus reduce demand for tree resources
from adjacent lands
KFS, supported by the
IGAD BMP project
Degraded and plantation forest
inside protected areas
Invasive species, lost opportunity
for contributing high biodiversity
forest
Forest restoration and promote regeneration and re-establishment of
native species
Control and possible elimination of invasive species
KFS, KWS, IGAD BMP
supporting
Trends, drivers of change and possible solutions to address deforestation and loss of forest
habitat in the Kenya-Somalia cross-border area
Results indicated that forest cover has been decreasing in quality and
quantity. Deforestation and forest degradation is happening both in
protected areas and non-protected areas. What was interesting is that
despite regions sharing the same direct drivers of deforestation and
forest degradation, the underlying ones tended to differ from zone to
zone.
Indigenous forests managed by KFS and KWS have been degraded
by logging of valuable timber trees resulting in reduced carbon stocks
and degraded biodiversity values. Forests in community trust lands
under the control of local authorities continue to be degraded and
destroyed through over-exploitation for timber, poles, charcoal and
fuel wood, and through unregulated grazing and clearance for
agriculture. Tree cover in agricultural farms either as isolated groves
of woodlots has increased.
The respondents listed forest products dealers, local community,
immigrants, smokers and charcoal burners as the main persons
involved in forest degradation and deforestation. Dealers cut down
trees to obtain timber, poles and other construction materials for sale,
local community carry out forest degradation and deforestation to
create land for cultivation, construction materials and for provision
services such as food and medicine. On the other hand, the
immigrants are involved in degradation and deforestation activities to
create land for settlement, obtain construction materials, and land for
cultivation. Smokers do not obtain any benefit from forest
degradation and deforestation. The above mentioned actors are able to
improve their livelihood through agricultural expansion when the
surplus is sold to purchase things they do not produce, which
translates to better living standards. Forest degradation and
deforestation on the other hand negatively affects their livelihood in
that, their access to fresh air is reduced, water catchment area is
destroyed, climate change has resulted in increased temperature and
reduced rainfall hence low agricultural production and loss of
endemic species in the area. Destruction of wildlife corridors has
resulted to increased human wildlife conflict.
The respondents noted that in the year 2000, the forest cover was very
thick such that one had to use a source of light to allow them see the
path in the forested area but currently the forest cover has reduced
both in quality and quantity. In protected areas of encroachment, wild
fires and illegal logging of timber are the main drivers of change,
while transport infrastructure (roads, railway, and sea and airports),
public utilities (water, sanitation) and the planned transport corridor to
Southern Sudan (LAPSSET) is expected to have its greatest effects on
forest cover loss in the northern rangelands of Kenya. The
respondents outlined: increasing human populations in Mombasa and
reliance on firewood and charcoal for energy, and demand from
industries manufacturing soap and vegetable oils and salt mines, as
the key underlying factors contributing to forest degradation. In the
Tana Delta, commercial agriculture for white sugar and other bio-fuel
crops claim more forest land, and also threaten fragile and
ecologically important riverine and delta ecosystems. The
communities noted that forest cover has been decreasing in the Witu
and Boni area due to;
Human encroachment on to forest lands. Human settlements are
closely linked to agricultural expansion as the rural poor create new
dwellings in proximity to newly opened-up forest areas. At the coast
where rural poverty is comparatively high, subsistence farming has
increased over time with increasing populations and the markets in
the urban areas of Malindi, Kilifi, Mombasa, Voi and Wundanyi.
Damage caused by fire to vegetation, particularly anthropogenic
wildfires is damaging to trees due to increased fire frequency, while
overgrazing and over-harvesting reduce the natural regeneration of
degraded lands. In Witu forest, wildlife damage to natural vegetation
and plantation species through bulk feeding and trampling by
elephants is a well-documented phenomenon, and related to increases
in their populations.
Extraction of wood for fuel in the unprocessed form and for
charcoal production is the biggest consumer of wood. Charcoal and
firewood are supplied from the drier woodlands to Mombasa and
other coastal urban areas. From personal communication with local
administration during the interview, an estimated 9,500 bags of
charcoal is supplied to Mombasa on a weekly basis from Lamu,
making it a key source of both domestic and industrial energy source,
worthy of systematic and sustainable management.
Production of poles for house construction and fencing is another use
which drives degradation. The mangroves despite the remaining
blocks and fragments being largely protected have been harvested for
years for construction poles and even charcoal production.
Public infrastructure such as roads and dams directly cause
deforestation and, in addition, create opportunities for new settlements
which put pressure on forest land and its resources. The LAPPSET
project which aims to link the future Lamu Port on Kenya’s Coast to
the South Sudan oil fields by railway and pipeline will certainly create
opportunities for forest cover loss. .
Insecurity is also an underlying factor as people are being forced to
live in the surrounding forest to hide from bandits and other perennial
attackers, hence aggravating forest degradation. On the contrary, KFS
noted that insecurity has increased forest cover as people are afraid to
go into the forest as the attackers could be hiding in there.
Increased sedenterization of pastoralists and change in land use has
seen many of the residents shift from pure pastoralism to mixed crop
and livestock production.
Weak institutional presence which generally translates into weak
law enforcement coupled with low fines for forest related offences
contribute to degradation and deforestation.
11

Trends, drivers of change and possible solutions to address deforestation and loss of forest
habitat in the Kenya-Somalia cross-border area
The respondents mentioned that they are aware that the government
through KFS and KWS, NGOs such as Save Lamu and Lamu
Conservation Trust is interested in conserving forests. They supported
these initiatives as they will not like to see a “Sahara Desert” in their
area. They noted that even as they play a role in conservation of their
forest resources, they inform the conservation unit of any element of
forest degradation and deforestation. They called upon the
conservation agencies to improve their efficiency in responding to
forest degradation and deforestation as there are situations when
dealers harvesting timber and poles from the forest are reported and
no one takes immediate action which demoralizes the community.
The community highlighted that their role in conservation is to:
• Practice reforestation
• Join in seedling raising and group farming
• Plant trees on their farms
The role of government in conservation is:
• Penalise those found misusing natural resources
• Tree planting and reforestation
• Educating farmers on prevailing laws governing forests and other
natural resources
• Training the community on the importance of natural resources
• Advocate for proper use of natural resources to avoid
overexploitation
The respondents proposed the following as the key issues to reverse
the negative trend of forest cover loss and restore degraded lands:
• Promote the formation of community forest associations and
encourage their participation in forest management and protection
• KFS and KWS to partner with private companies, to regenerate,
manage and sustainably utilize forest resources.
• County governments to collaborate with KFS to implement
charcoal rules to regulate the industry.
• Currently the KFS itself has increased its efforts in the
regeneration or re-planting of trees in areas which have been
clear-cut.
• Government to issue title deeds
• KWS, KFS and NGOs to collaborate in conservation making sure
that the local community is engaged in the process
• Define boundaries between human, wildlife and among villages
• New entrants into the area to be allocated new land away from the
forest
• Signing of MoUs between farmers and herdsmen to prevent
encroachment to the forest
• Designate different land for the grazing community
Table 5: Threats and possible solutions to address deforestation
Forest Types Direct Drivers Indirect Drivers Proposed mitigation strategies
Mangroves
Coastal Forests
Dry woodlands
Plantations
Encroachment
Wood extraction
Poles
Charcoal production
Firewood
Timber
Agricultural expansion
Subsistence agriculture
Infra-structure, Grazing and browsing
Wildlife damage – elephants
Industrial demand for fuel wood – salt, soap,
vegetable oil industries
High costs of electricity for industry and LPG
for domestic use
Urban over-dependence on charcoal
Rural Poverty
Absence of industrial plantations
Support training of communities on benefits of biodiversity
provide seed and seedling for restoring degraded lands
support in fencing PA to reduce interference with natural
regeneration
support water harvesting techniques to address water problem
for establishment of nursery
support government agencies working on security to restore
peace in the area
support establishment of community nurseries
Train community on alternative livelihood options which are
environmentally sustainable
Collaborate with KFS, KWS and other NGOs working on
conservation of biodiversity.
3.5 Conservation measures 3.6 Solution to reverse the trend of forest covers loss
12
A local conservationist shares his experiences with other
stakeholders during a biodiversity sensitization and exhibition
event in Lamu, Kenya. Photo © World Agroforestry Centre/
IGAD-BMP project
Trends, drivers of change and possible solutions to address deforestation and loss of forest
habitat in the Kenya-Somalia cross-border area
The respondent outlined the following as the key threats to forest
conservation:
• Average population density and growth rates are significantly
greater in areas with high biodiversity than in other habitable parts
• Some of the greatest drivers of change are from outside the forest
sector hence difficult to manage
• The identification of underlying causes is one thing, estimating
their likely effects is yet another challenge for which there is no
standard approach.
• The drivers of deforestation and forest degradation tend to vary in
type and magnitude from one forest area to another within a given
country or even within a county.
• High illiteracy levels among community members, translates to
insufficient knowledge to allow them conserve resources
• Wildfires which are unpredictable hence difficult to manage
• Insecurity in the forested area making it difficult for the scouts
and forest managers to access the forest to monitor logging and
charcoal burning
Increase in population was cited as the key underlying factor
contributing to deforestation and forest degradation in cross-border
areas. This observation is consistent with observations recorded in
other countries e.g. Central America, East and West Africa, and South
Asia, but a much less clear association in Amazonia (South America)
and Central Africa (Rudel, Flesher, Bates, & Baptista, 2000). With
increase in population results in, encroachment, increased demand for
more timber and non-timber products, land for cultivation hence
deforestation and forest degradation. As farming based population
density increases in, and adjacent to forested areas, the strongest
relationship between population growth and deforestation occurs, as
local people and young migrant families arrive at the forest frontier
and clear land to provide more area for subsistence farming
(Meyerson, 2004). This is usually the case when the population has
low education and limited livelihood options. Similar results were
seen in Central America, population density and loss of forest cover is
closely related.
The influence of infrastructure development on forest cover losses is
not well documented but the current national REDD+ process has
drawn attention to it. The LAPPSET Project starting from Lamu Port
should therefore be under close scrutiny. Kenya as a country relies
heavily on biomass fuels and this will continue to be the case in the
foreseeable future unless drastic measures are taken to meet domestic
energy demand. This is consistent with the observation that in the
early and late transition phases of a country when agricultural
expansion is stable, wood extraction for energy becomes a major
driver. Charcoal production and firewood harvesting is not sustainable
and even though the drivers were identified, there is virtually no
readily available data to estimate their relative share in causing, either
deforestation or forest degradation.
The supply of energy to urban households in rapidly growing urban
areas should be a cause for concern but also an opportunity for
constructive engagement with both suppliers and consumers. It is
critical that the supply of energy is officially recognized as an
important contribution of the forest sector to Kenya’s economy.
Furthermore the fact that some industries at the coast consume what
would appear to be significant amounts of firewood and charcoal
from currently non-certified sources also forest products/ charcoal
certification could be another alternative presenting an opportunity for
the forest and energy sectors to look at how to promote and provide
incentives for urban households to switch to electricity and gas for
their domestic energy needs, as a way to reduce over-dependence on
firewood and charcoal. Sustainable charcoal production, coupled with
affordable alternatives seems like a potentially viable way to ease
harvesting pressure, especially in the dry woodlands, the sustainable
management of which has been historically weak or non-existent.
3.7 Threats faced by forest stakeholders in implementation of conservation
• Reduced human wildlife conflict
• Increased agricultural yield due to increased rainfall
• Restoration of catchment areas hence water availability
• Regeneration of indigenous species which could have been
endangered
• Increased soil fertility
• Tourist attraction sites once security is addressed
3.8 Opportunities presented by restoration of degraded lands
• Support training of communities on benefits of biodiversity
especially the ecosystem services
• Provide seed and seedling for establishment of community
nurseries to be used in enrichment planting to restore degraded
lands
• Support water harvesting techniques to address water challenges
faced by nursery establishments and reduce natural resource
conflict
• Support livelihood options which are environmentally sustainable
• Promote multi-sector and multi-stakeholder approaches in
biodiversity conservation
3.9 Role of BMP in managing forest cover loss in the cross-border area
4. Discussion and conclusion
13
Trends, drivers of change and possible solutions to address deforestation and loss of forest
habitat in the Kenya-Somalia cross-border area
The following factors will immensely contribute to reversing the
trends in forest cover change:
• Afforestation and restoration of degraded forests to restore
degraded lands
• Promote on-farm tree plantations where large scale afforestation is
not possible
• Promotion and support to local natural resource institutions
• Strengthening Community Forestry Associations (CFAs) and
NGOs to participate in Forest Management
• Affordable Energy for Industry – particularly at the Coast requires
a comprehensive policy on affordable energy for Kenya
An appreciation of the policy environment that has influenced and
nurtured forest cover change particularly deforestation and forest
degradation, calls for, an understanding of how forest policies have
evolved over time:
• Promoting sustainable charcoal and fuel use efficiency; this could
be use of energy saving jikos, rocket stoves and fireless cooking
technologies, in Witu forest
• Promoting on-farm tree planting given the high demand of wood
products and land availability
• Incentivising wood energy from sustainable sources to drive
market led mitigation
5.1 Policy recommendations5. Recommendations
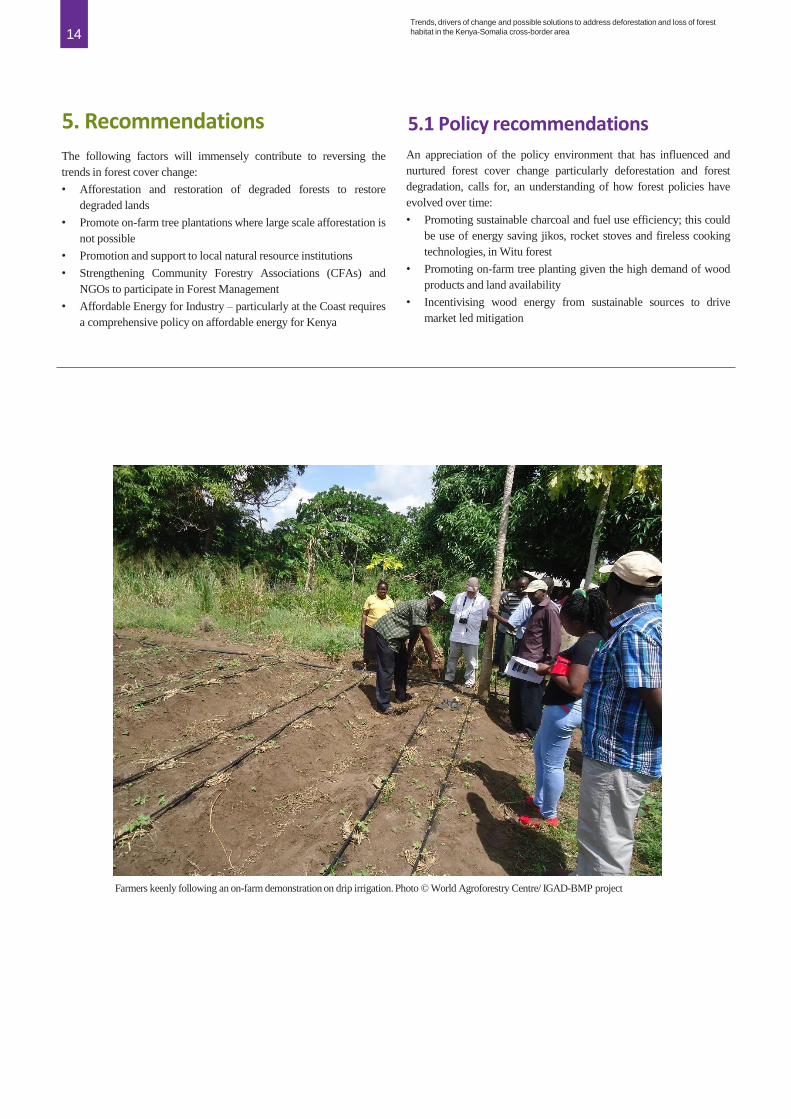
Farmers keenly following an on-farm demonstration on drip irrigation. Photo © World Agroforestry Centre/ IGAD-BMP project
14
15Trends, drivers of change and possible solutions to address deforestation and loss of forest
habitat in the Kenya-Somalia cross-border area
References
Myers, N., R.A., C.G. Mittermeier, G.A.B. Mittermeier da Fonseca,
and J. Kent. 2000. Biodiversity hotspots for conservation priorities.
Nature 403 (6772): 853-858.
NASA. FIRMS web fire mapper.
https://firms.modaps.eosdis.nasa.gov/firemap/
xiii Review and Identification of The Agriculture Programme for
Somalia, 2010
National Environment Secretariat, 1985. Lamu District Environmental
Assessment Report. National Environment Secretariat, Ministry of
Environment and Natural Resources, Nairobi, Kenya, 127 pp.
http://pdf.usaid.gov/pdf_docs/PNAAU555.pdf
Oduori, S.M., 1990. The vegetation of Boni and Dodori Game
Reserves and adjoining areas. Technical report 139, Department for
Resource Surveys and Remote Sensing (DRSRS), Nairobi, Kenya, 25
+ iv pp.
Rudel, T., Flesher, K., Bates, D., & Baptista, S. (2000). Tropical
deforestation literature: geographical and historical patterns in the
availability of information and the analysis of causes. Forest Resources
Assessment Programme. Working paper 27.
Vacik, H., Wolfslehner, B., Seidl, R., Lexer, M. J., Reynolds, K.,
Thomson, A., Rennolls, K. (2007). Integrating the DPSIR approach
and the analytic network process for the assessment of forest
management strategies. Sustainable Forestry: From Monitoring and
Modelling to Knowledge Management and Policy Science, 393-411.
Wikipedia, Hirola, accessed 9-03-2016.
https://en.wikipedia.org/wiki/Hirola
WWF-EARPO (2006). Coastal Forests of Eastern Africa:
Conservation Strategy and Action Plan. WWF East Africa Regional
Project Office, Nairobi.
Abel, N.O.J., 1976a. Management Plan for the proposed National Park
in Badade District. Field Document No. 3. UNDP/FAO Strengthening
of Forestry and Wildlife Management Project, Mogadishu, DR
Somalia;
Conservation International, 2011. The Worlds ten Most Threatened
Forest Hotspots,
http://www.conservation.org/NewsRoom/pressreleases/Pages/The-
Worlds-10-Most-Threatened-Forest-Hotspots.aspx
Conservation International. Coastal Forests of Eastern Africa.
http://www.cepf.net/resources/hotspots/africa/Pages/Coastal-Forests-
of-Eastern-Africa.aspx
EEA, 2007. The DPSIR framework used by the European
Environmental Agency. EEA Integrated Assessment Portal.
http://ia2dec.pbe.eea.europa.eu/knowledge_base/Frameworks/doc1011
82
Hansen, M. C., P. V. Potapov, R. Moore, M. Hancher, S. A.
Turubanova, A. Tyukavina, D. Thau, S. V. Stehman, S. J. Goetz, T. R.
Loveland, A. Kommareddy, A. Egorov, L. Chini, C. O. Justice, and J.
R. G. Townshend. 2013. “High-Resolution Global Maps of 21st-
Century Forest Cover Change.” Science 342: 850–53.
Global Forest Cover Change Data Download
http://earthenginepartners.appspot.com/science-2013-global-
forest/download_v1.2.html
Matiku, P. (2005). The Coastal Forests of Kenya: Forests data, threats,
socio-economic issues, values, stakeholders, challenges, strategies,
investment and enabling environment--A national synthesis report for
the development of the WWF-EARPO Eastern Africa Coastal Forests
Ecoregion Programme.
Meyerson, F. A. (2004). Population growth and deforestation: a critical
and complex relationship. Population Reference Bureau, Washington,
DC.
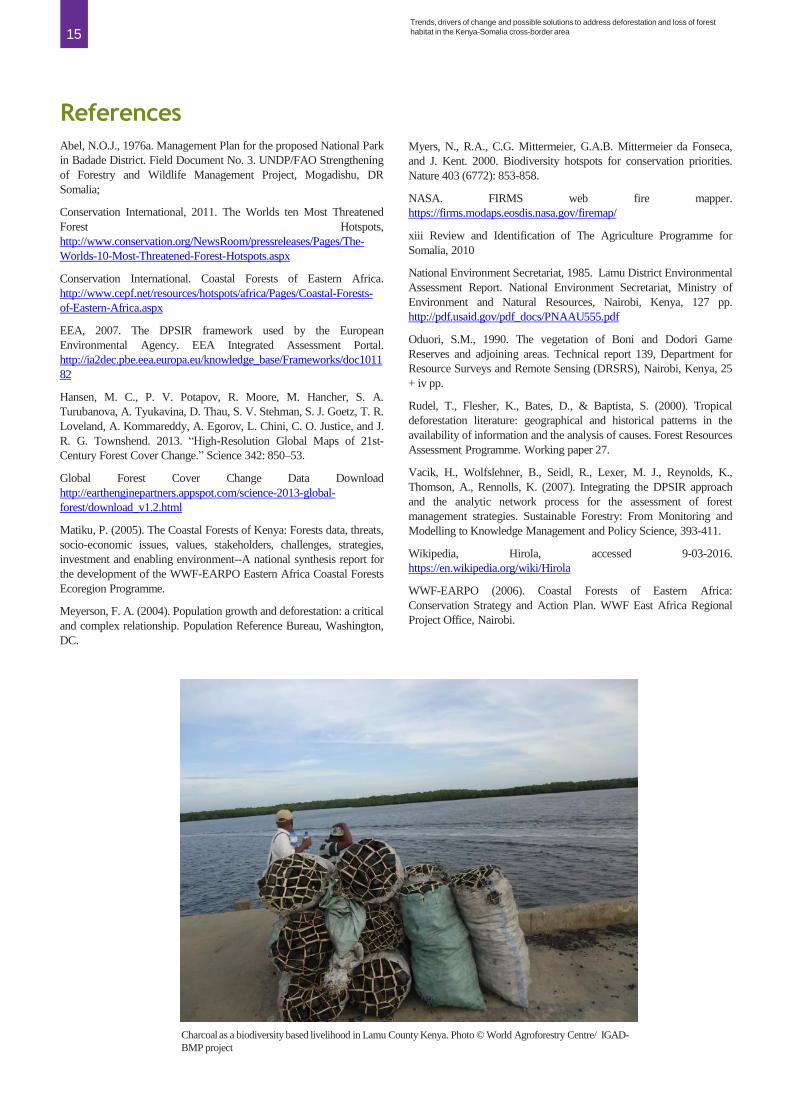
Charcoal as a biodiversity based livelihood in Lamu County Kenya. Photo © World Agroforestry Centre/ IGAD-
BMP project