Embed Size (px)
Citation preview
“Trends and Vision”I. New Data Driven Business Models
Moderator: John CallanCo-Founder/Chairman
PostalVision 2020
The New Delivery RealityAaron JacksonManaging Director, Accenture Federal Services
Accenture
The Prime Membership EcosystemCooper SmithDirector of Research
L2

Copyright © 2017 Accenture All rights reserved. |
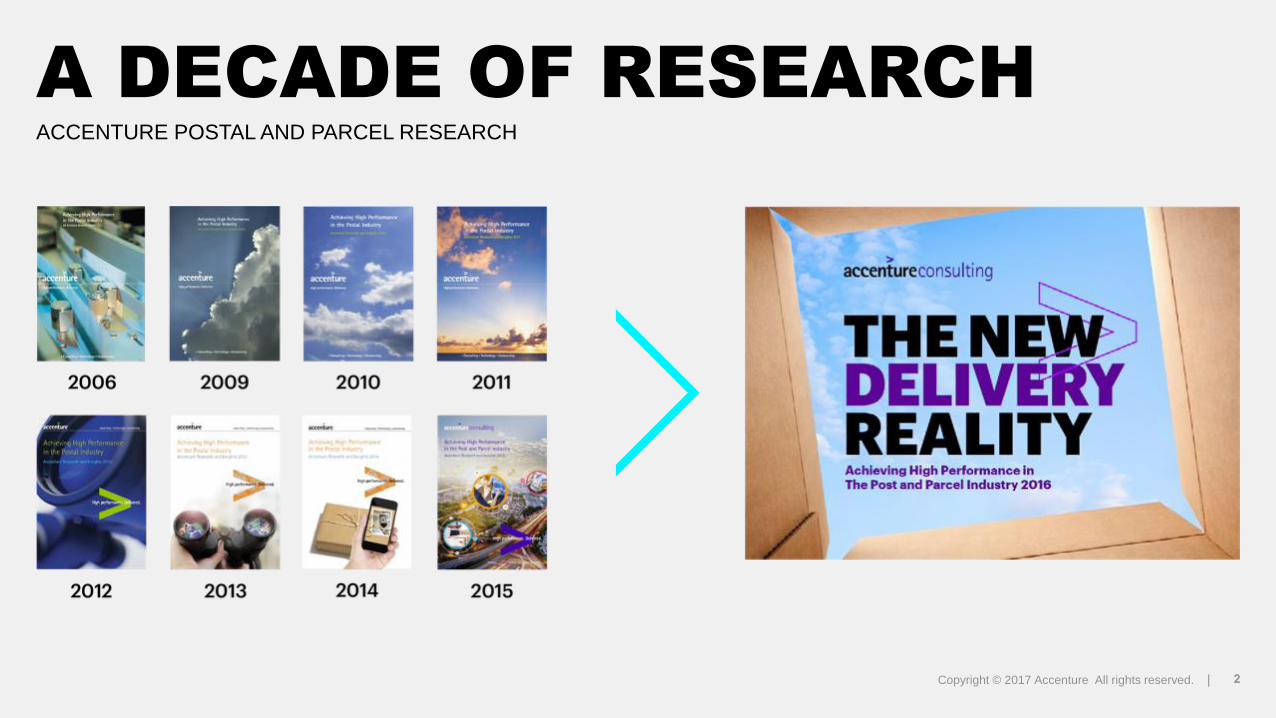
Achieving High Performance in
The Post and Parcel Industry
Copyright © 2017 Accenture All rights reserved. | 2
A DECADE OF RESEARCHACCENTURE POSTAL AND PARCEL RESEARCH
Copyright © 2017 Accenture All rights reserved. |Copyright © 2017 Accenture All rights reserved. | 3
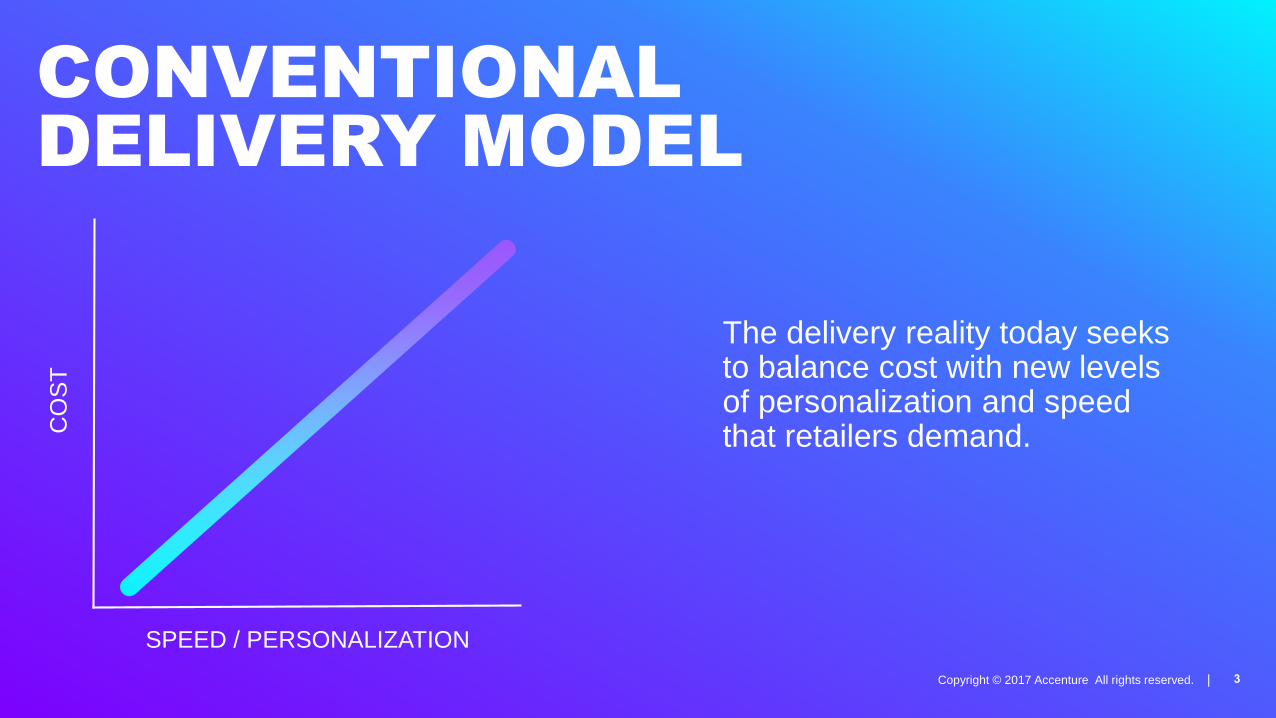
The delivery reality today seeks to balance cost with new levels of personalization and speed that retailers demand.
CONVENTIONAL
DELIVERY MODEL
SPEED / PERSONALIZATION
CO
ST
Copyright © 2017 Accenture All rights reserved. | 4
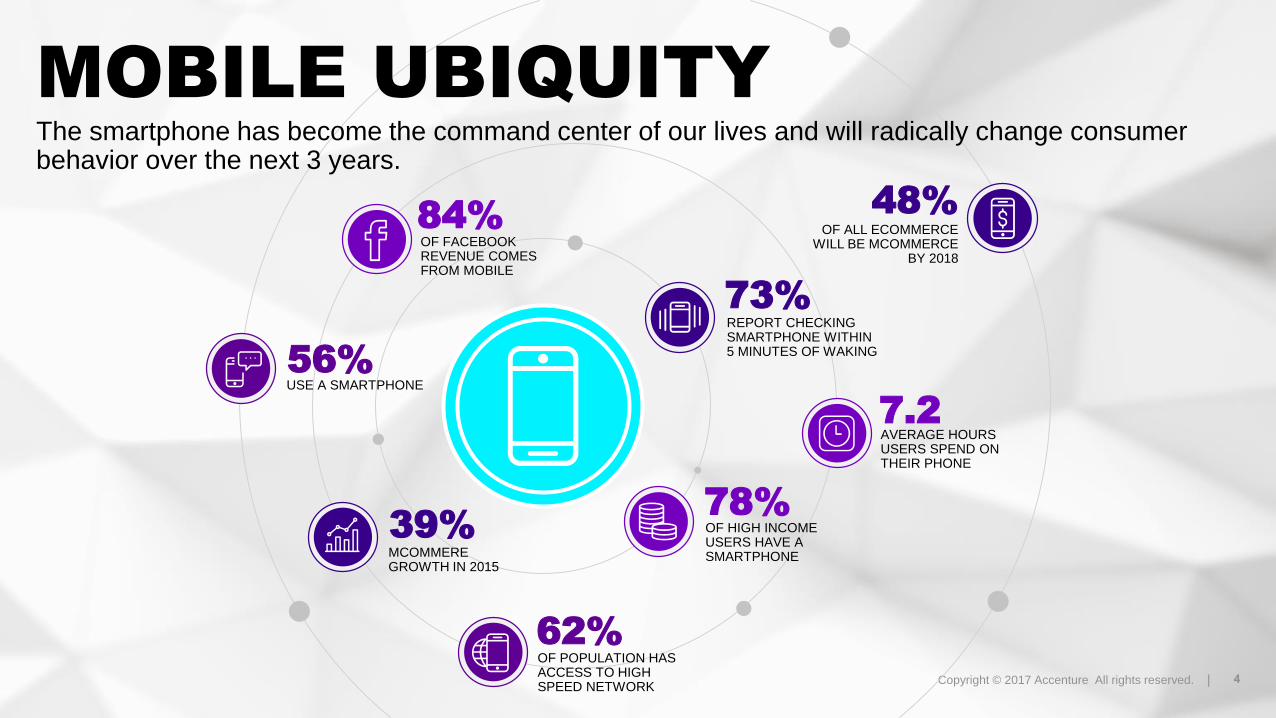
MOBILE UBIQUITYThe smartphone has become the command center of our lives and will radically change consumer behavior over the next 3 years.
56%
48%OF ALL ECOMMERCE
WILL BE MCOMMERCE BY 2018
73%
39%
84%
AVERAGE HOURS USERS SPEND ON THEIR PHONE
OF FACEBOOK REVENUE COMES FROM MOBILE
USE A SMARTPHONE
MCOMMERE GROWTH IN 2015
78%OF HIGH INCOME USERS HAVE A SMARTPHONE
REPORT CHECKING SMARTPHONE WITHIN5 MINUTES OF WAKING
7.2
62%OF POPULATION HAS ACCESS TO HIGH SPEED NETWORK
Copyright © 2017 Accenture All rights reserved. | 5
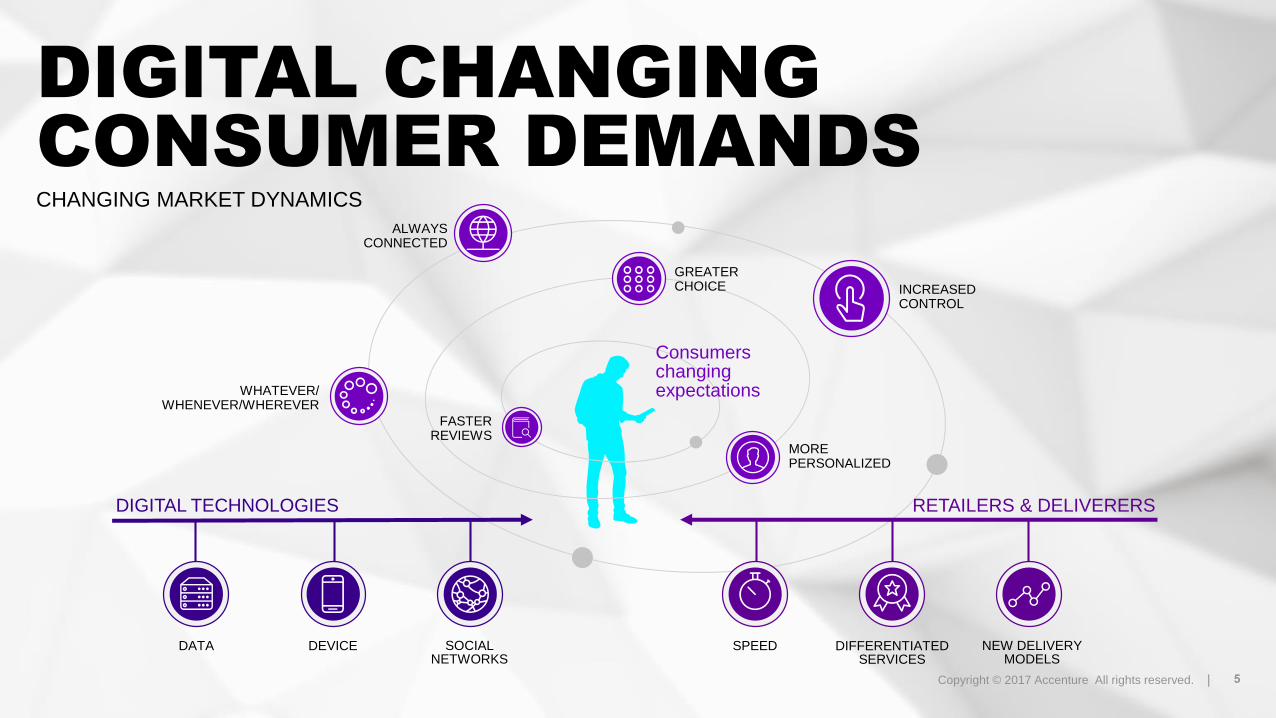
DIGITAL TECHNOLOGIES
DATA DEVICE SOCIAL NETWORKS
SPEED DIFFERENTIATED SERVICES
NEW DELIVERY MODELS
ALWAYS CONNECTED
INCREASED CONTROL
WHATEVER/WHENEVER/WHEREVER
MORE PERSONALIZED
GREATER CHOICE
FASTER REVIEWS
Consumers changing expectations
CHANGING MARKET DYNAMICS
DIGITAL CHANGING
CONSUMER DEMANDS
RETAILERS & DELIVERERS
Copyright © 2017 Accenture All rights reserved. | 6
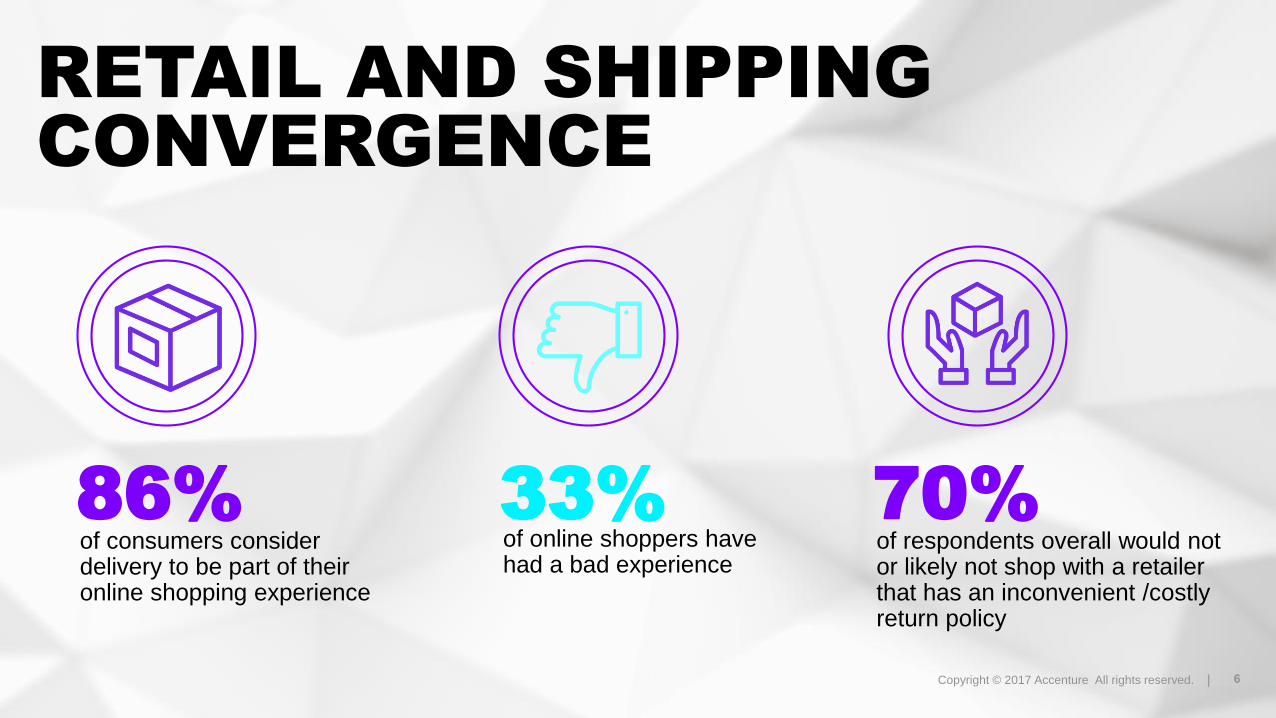
RETAIL AND SHIPPING
CONVERGENCE
86%of consumers consider delivery to be part of their online shopping experience
70%of respondents overall would not or likely not shop with a retailer that has an inconvenient /costly return policy
33%of online shoppers have had a bad experience
Copyright © 2017 Accenture All rights reserved. | 7
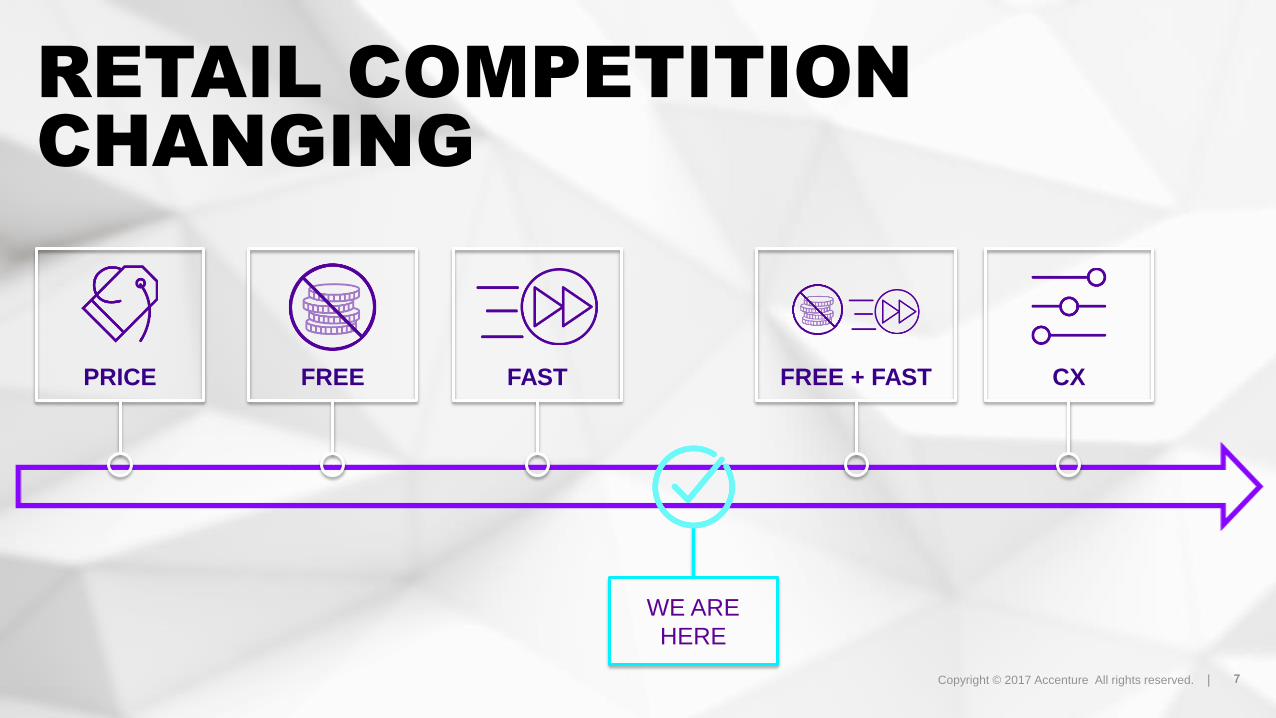
RETAIL COMPETITION
CHANGING
WE ARE
HERE
PRICE FREE FAST FREE + FAST CX
Copyright © 2017 Accenture All rights reserved. |
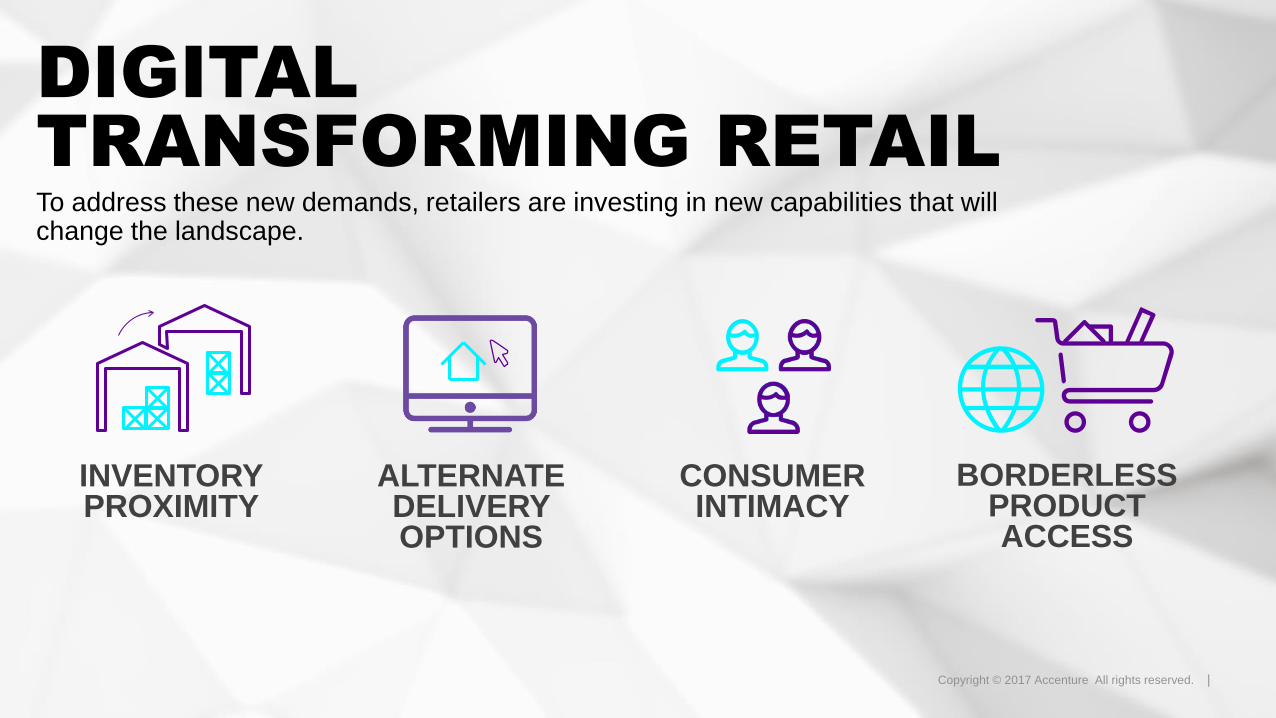
DIGITAL
TRANSFORMING RETAILTo address these new demands, retailers are investing in new capabilities that will change the landscape.
INVENTORY PROXIMITY
ALTERNATE DELIVERY OPTIONS
CONSUMER INTIMACY
BORDERLESS PRODUCT ACCESS
Copyright © 2017 Accenture All rights reserved. | 9
5
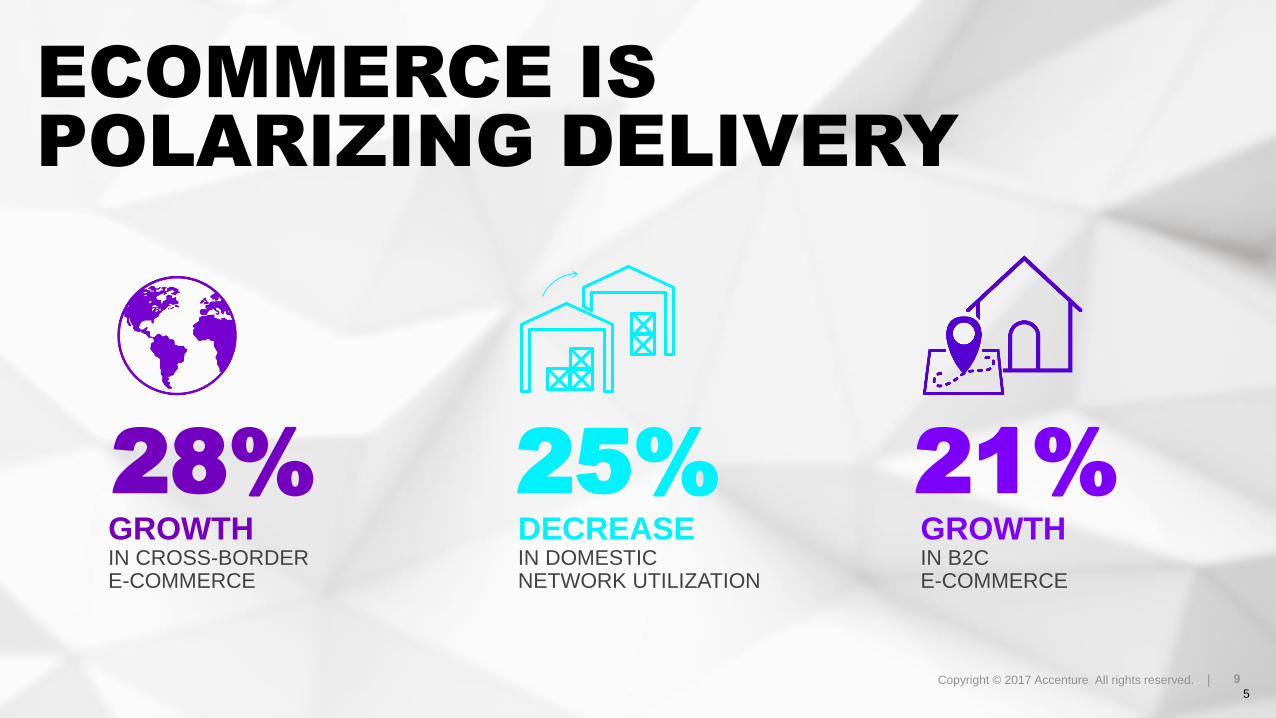
ECOMMERCE IS
POLARIZING DELIVERY
28%GROWTHIN CROSS-BORDER E-COMMERCE
21%GROWTHIN B2C E-COMMERCE
25%DECREASEIN DOMESTIC NETWORK UTILIZATION
Copyright © 2017 Accenture All rights reserved. | 10
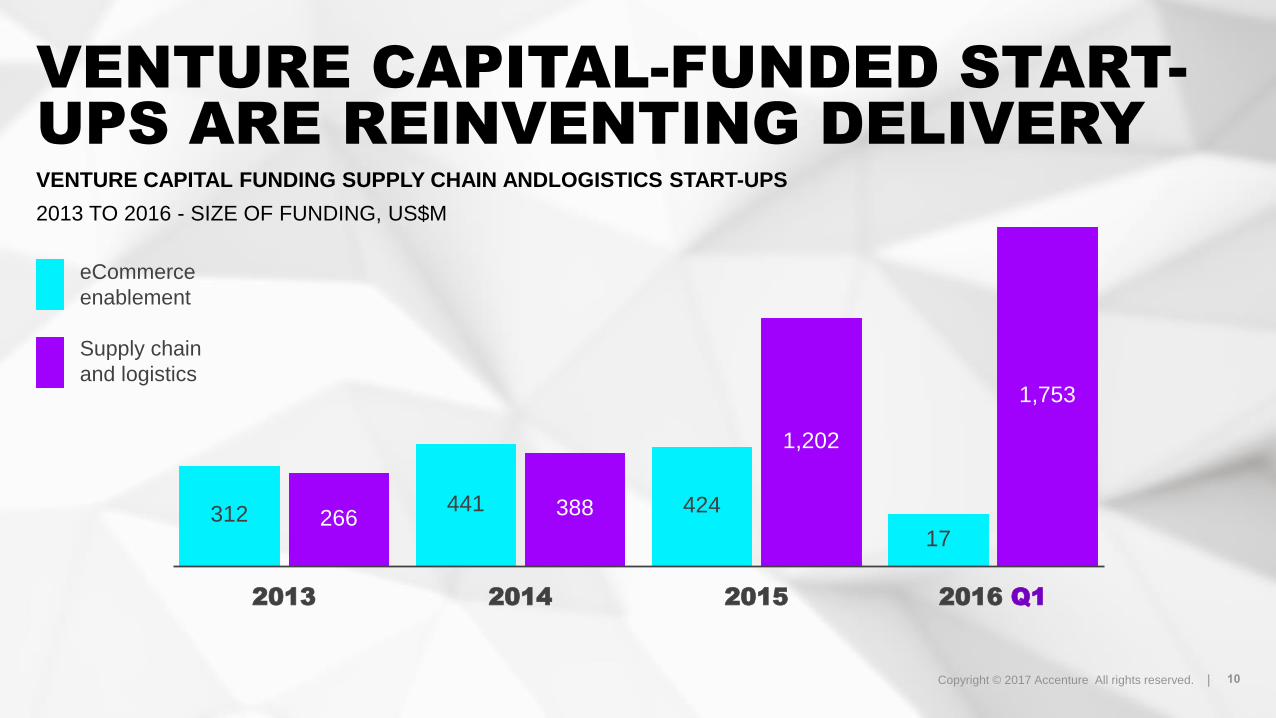
2013 2014 2015 2016 Q1
312 266441 388 424
1,202
1,753
17
eCommerce
enablement
Supply chain
and logistics
VENTURE CAPITAL-FUNDED START-
UPS ARE REINVENTING DELIVERY
VENTURE CAPITAL FUNDING SUPPLY CHAIN ANDLOGISTICS START-UPS
2013 TO 2016 - SIZE OF FUNDING, US$M
Copyright © 2017 Accenture All rights reserved. | 11
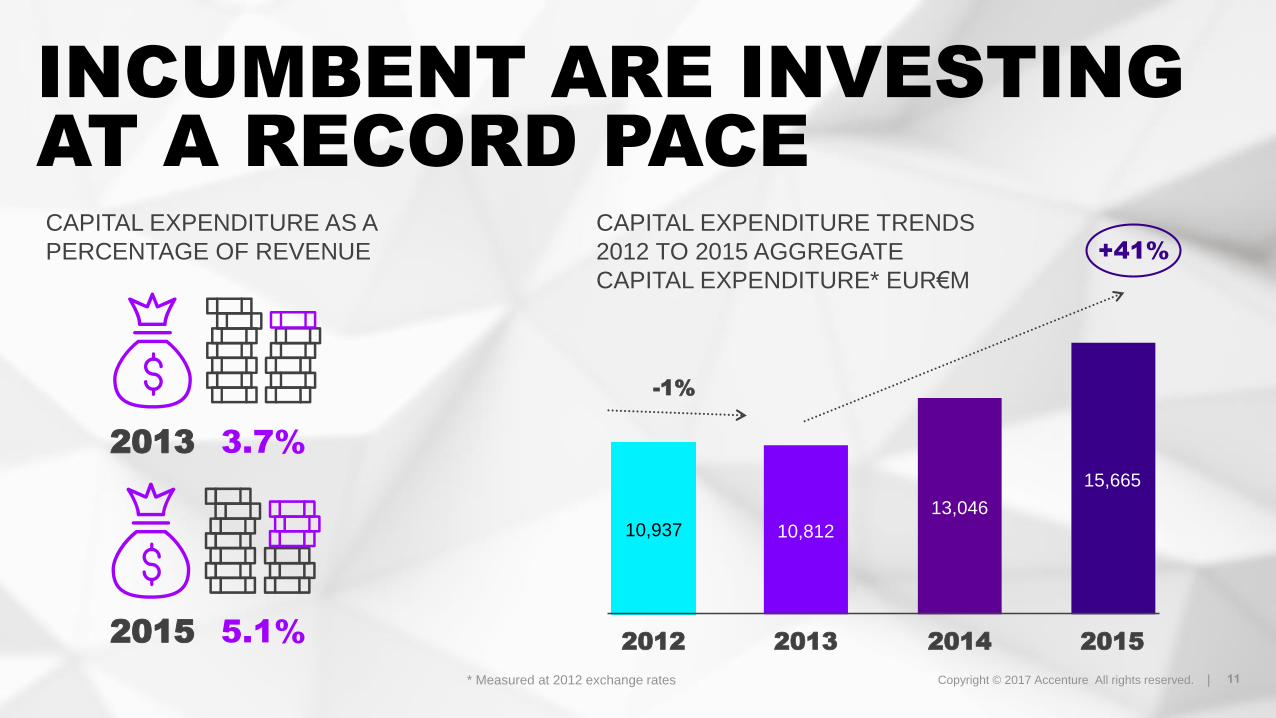
CAPITAL EXPENDITURE TRENDS
2012 TO 2015 AGGREGATE
CAPITAL EXPENDITURE* EUR€M
* Measured at 2012 exchange rates
2012 2013 2014 2015
+41%
-1%
15,665
13,046
10,81210,937
2013 3.7%
CAPITAL EXPENDITURE AS A
PERCENTAGE OF REVENUE
INCUMBENT ARE INVESTING
AT A RECORD PACE
2015 5.1%
Copyright © 2017 Accenture All rights reserved. | 12
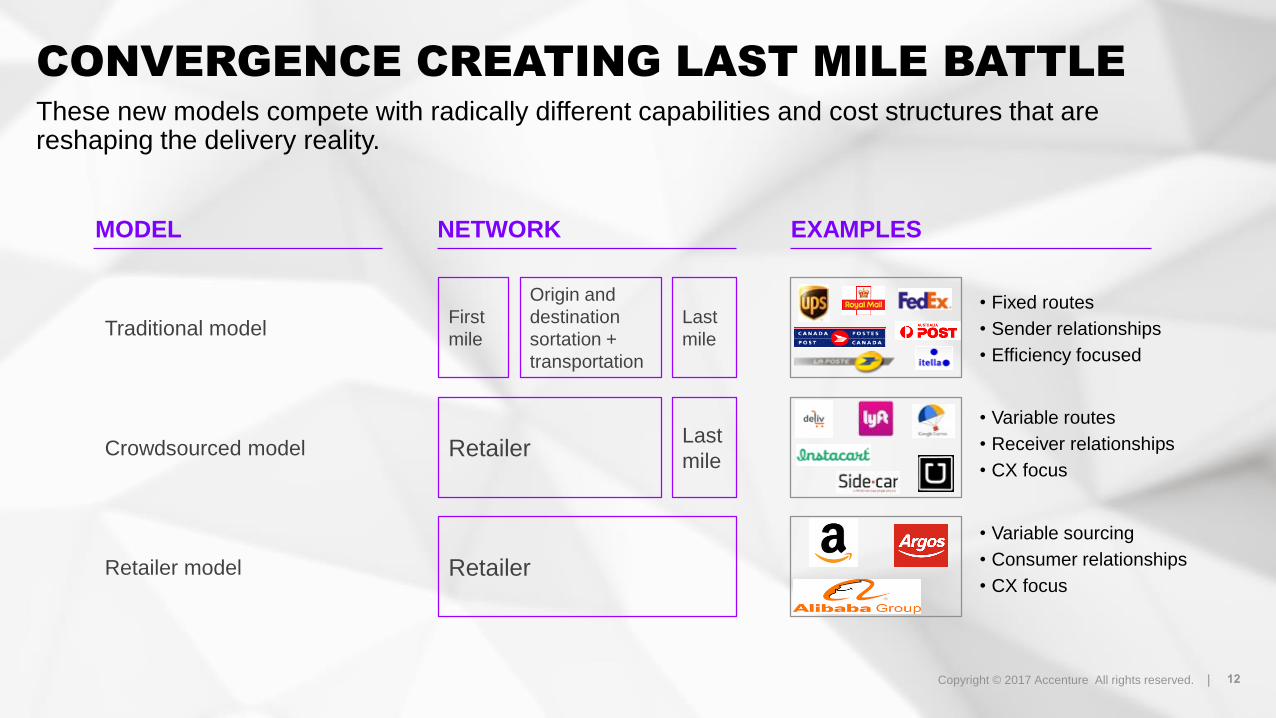
Traditional model
Retailer model
First
mile
Last
mile
Origin and
destination
sortation +
transportation
Retailer
MODEL NETWORK EXAMPLES
CONVERGENCE CREATING LAST MILE BATTLE
These new models compete with radically different capabilities and cost structures that are reshaping the delivery reality.
• Fixed routes
• Sender relationships
• Efficiency focused
• Variable routes
• Receiver relationships
• CX focus
• Variable sourcing
• Consumer relationships
• CX focus
Crowdsourced modelLast
mileRetailer
Copyright © 2017 Accenture All rights reserved. | 13
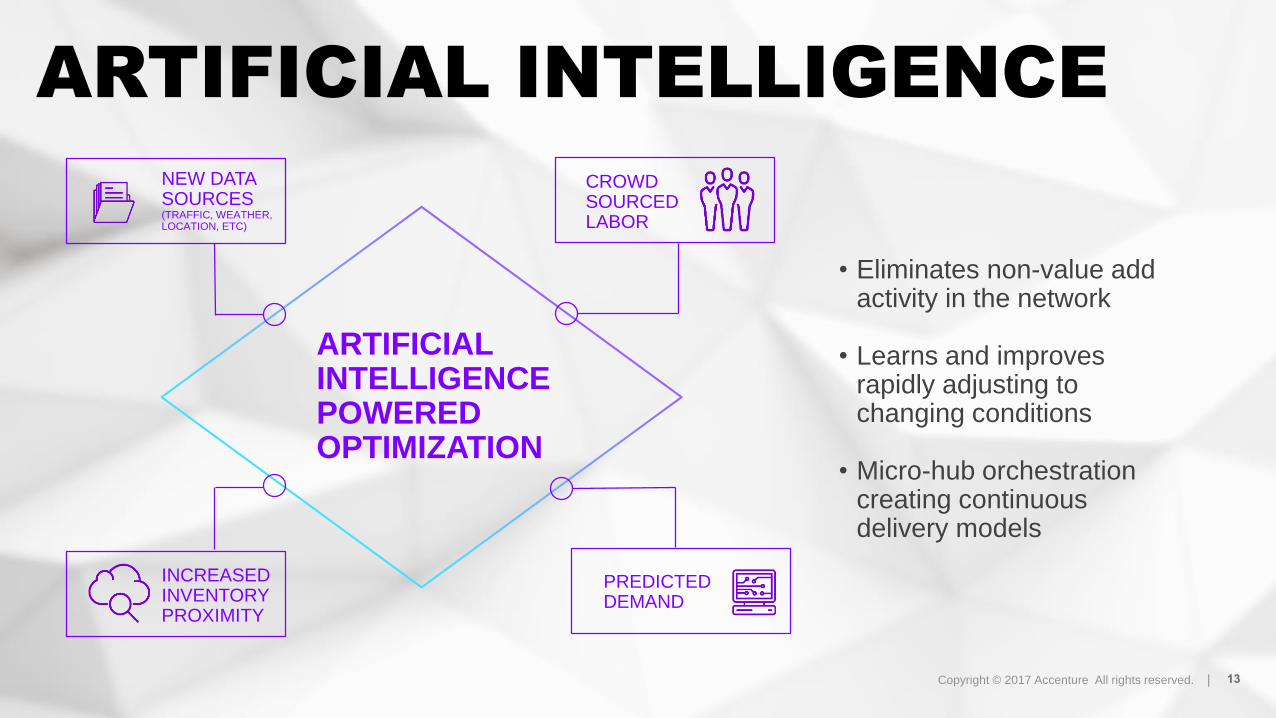
• Eliminates non-value add activity in the network
• Learns and improves rapidly adjusting to changing conditions
• Micro-hub orchestration creating continuous delivery models
ARTIFICIAL INTELLIGENCE
ARTIFICIAL INTELLIGENCE POWERED OPTIMIZATION
INCREASED INVENTORY PROXIMITY
NEW DATA SOURCES (TRAFFIC, WEATHER, LOCATION, ETC)
CROWDSOURCED LABOR
PREDICTED DEMAND
Copyright © 2017 Accenture All rights reserved. |Copyright © 2017 Accenture All rights reserved. | 14
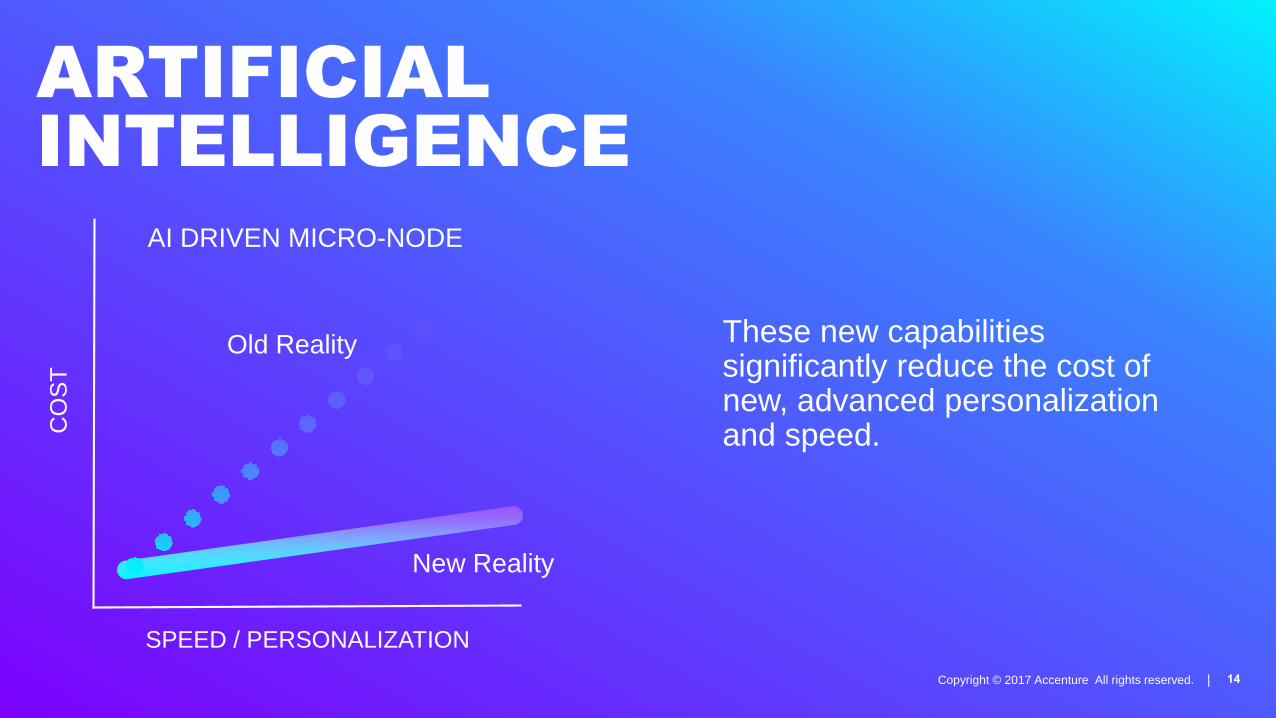
These new capabilities significantly reduce the cost of new, advanced personalization and speed.
ARTIFICIAL
INTELLIGENCE
AI DRIVEN MICRO-NODE
New Reality
Old Reality
SPEED / PERSONALIZATION
CO
ST
Copyright © 2017 Accenture All rights reserved. | 15
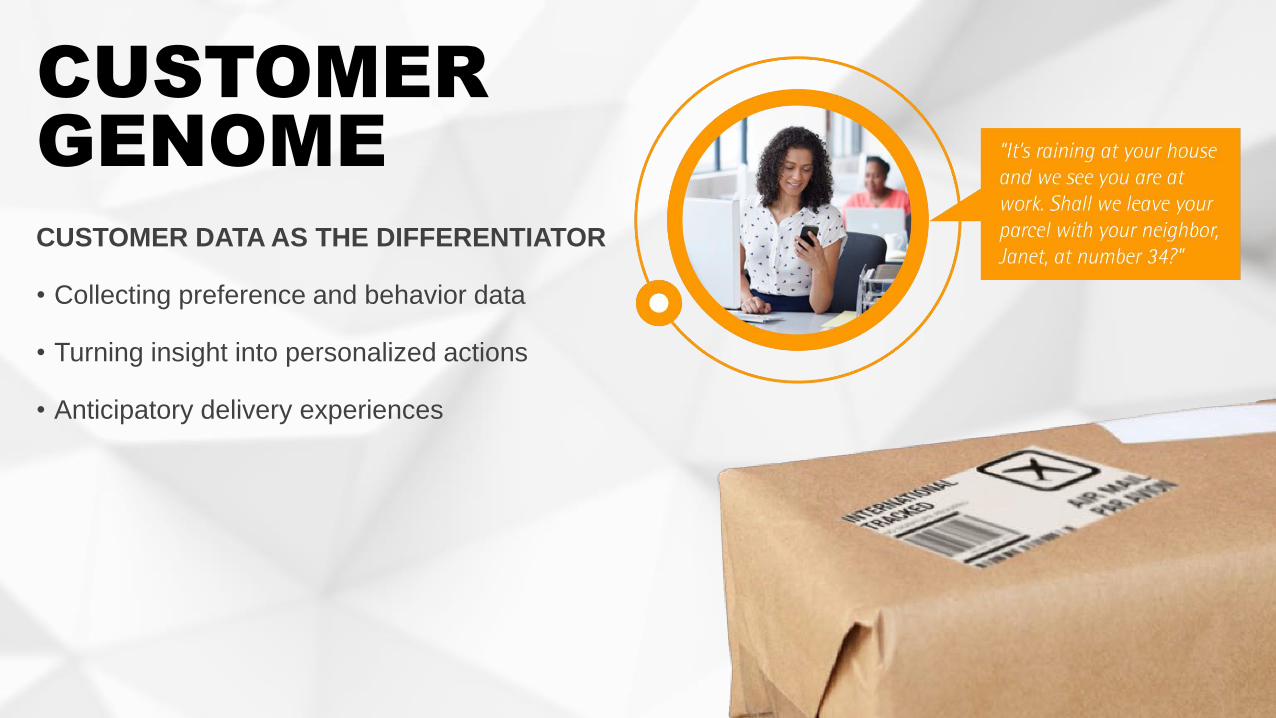
CUSTOMER DATA AS THE DIFFERENTIATOR
• Collecting preference and behavior data
• Turning insight into personalized actions
• Anticipatory delivery experiences
CUSTOMER
GENOME
Copyright © 2017 Accenture All rights reserved. |Copyright © 2017 Accenture All rights reserved. | 16
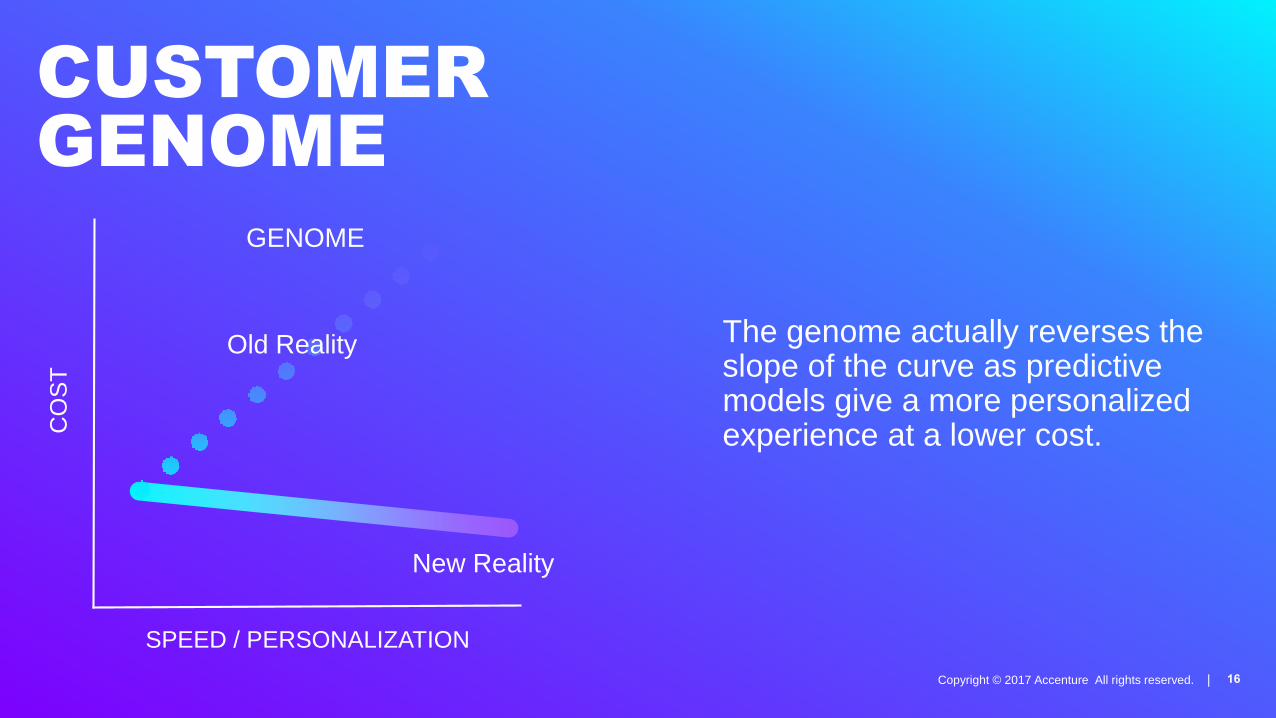
The genome actually reverses the slope of the curve as predictive models give a more personalized experience at a lower cost.
CUSTOMER
GENOME
SPEED / PERSONALIZATION
CO
ST
GENOME
New Reality
Old Reality
Copyright © 2017 Accenture All rights reserved. | 17
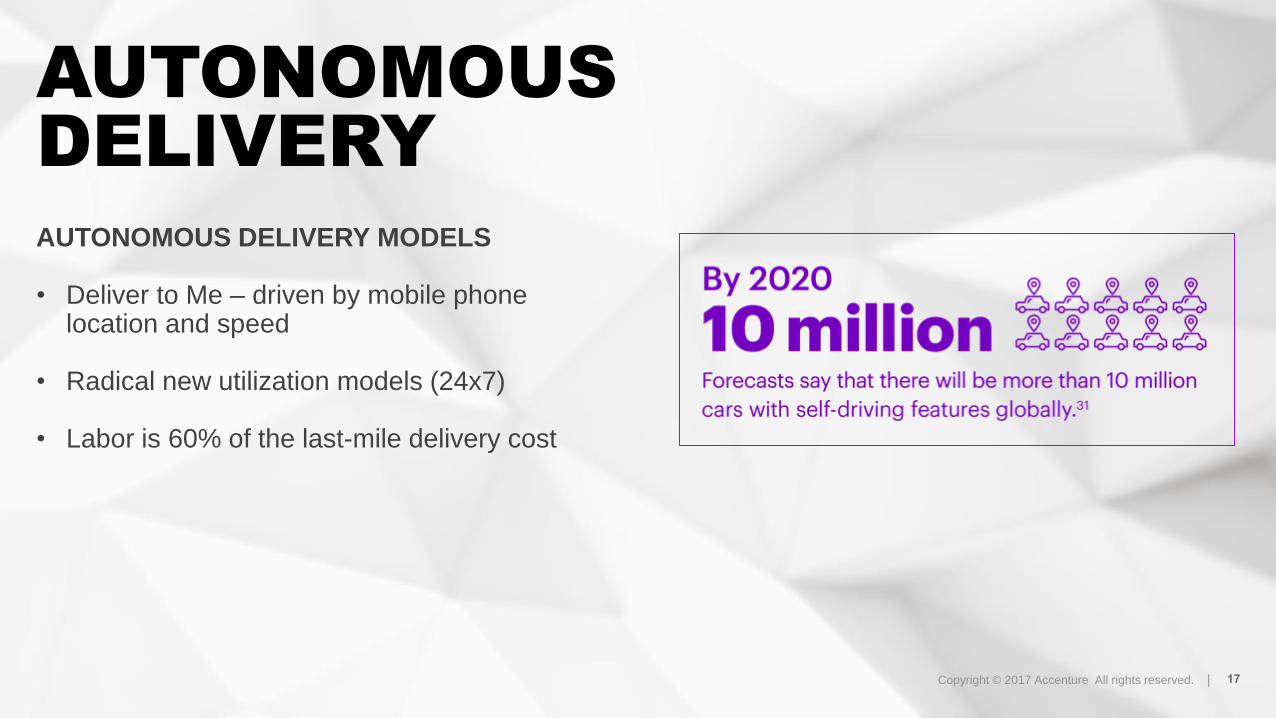
AUTONOMOUS
DELIVERY
AUTONOMOUS DELIVERY MODELS
• Deliver to Me – driven by mobile phone location and speed
• Radical new utilization models (24x7)
• Labor is 60% of the last-mile delivery cost
Copyright © 2017 Accenture All rights reserved. |Copyright © 2017 Accenture All rights reserved. | 18
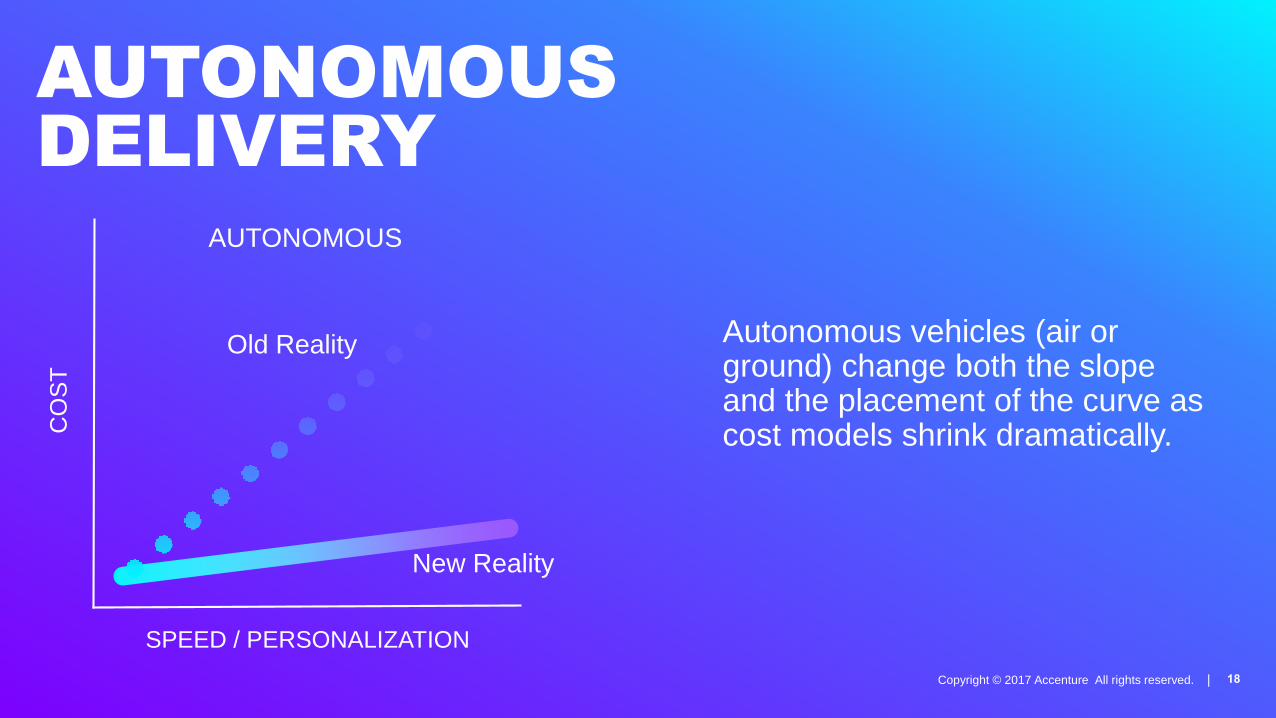
Autonomous vehicles (air or ground) change both the slope and the placement of the curve as cost models shrink dramatically.
AUTONOMOUS
DELIVERY
AUTONOMOUS
SPEED / PERSONALIZATION
CO
ST
New Reality
Old Reality
Copyright © 2017 Accenture All rights reserved. | 19
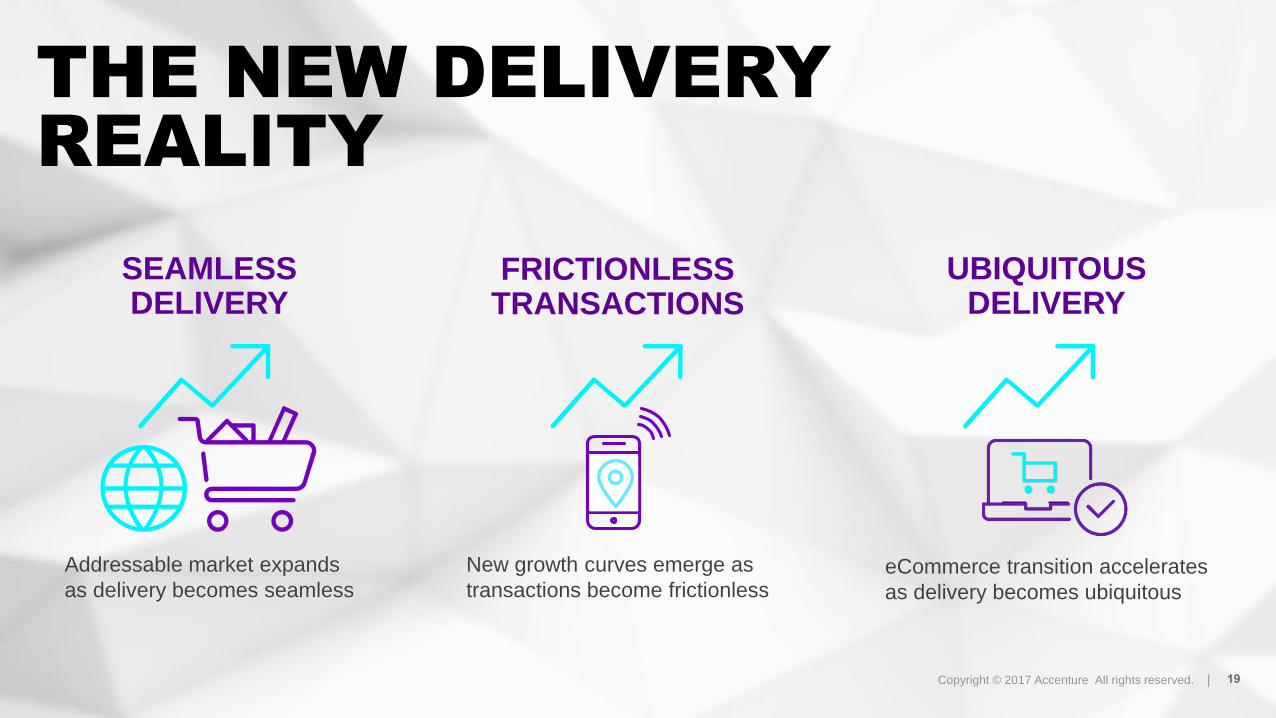
THE NEW DELIVERY
REALITY
New growth curves emerge as
transactions become frictionless
FRICTIONLESS TRANSACTIONS
Addressable market expands
as delivery becomes seamless
SEAMLESS DELIVERY
eCommerce transition accelerates
as delivery becomes ubiquitous
UBIQUITOUS DELIVERY

Copyright © 2017 Accenture All rights reserved. | 20
THANK YOU
Aaron
JacksonManaging DirectorAccenture Federal Services
Aaron Jackson
AMAZON
THE FOURTH HORSEMANCOOPER SMITH
AGENDA
1. AMAZON VS. RETAIL
2. UNDERSTANDING AMAZON
3. DEEP DIVE: APPAREL

AMAZON VS. RETAIL
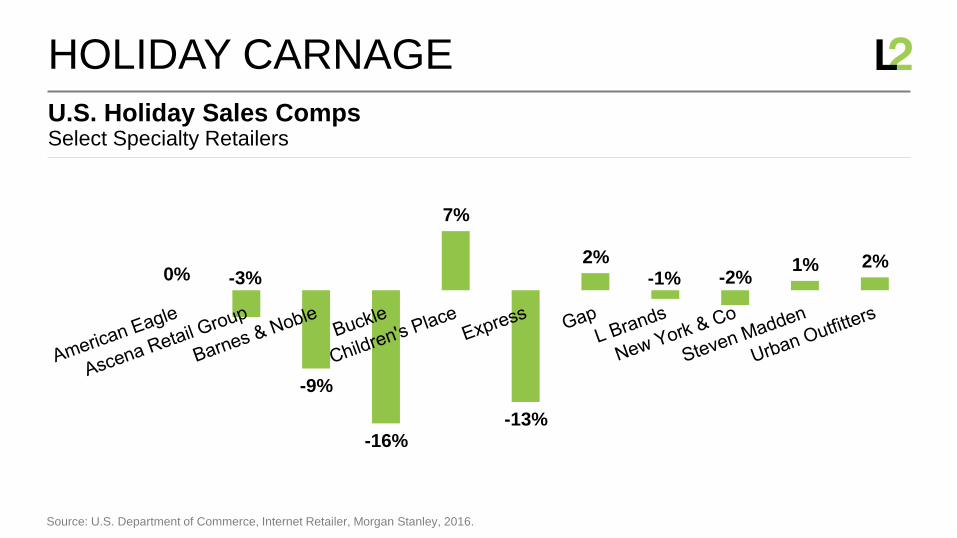
Select Specialty RetailersU.S. Holiday Sales Comps
HOLIDAY CARNAGE
Source: U.S. Department of Commerce, Internet Retailer, Morgan Stanley, 2016.
0% -3%
-9%
-16%
7%
-13%
2%-1% -2%
1% 2%
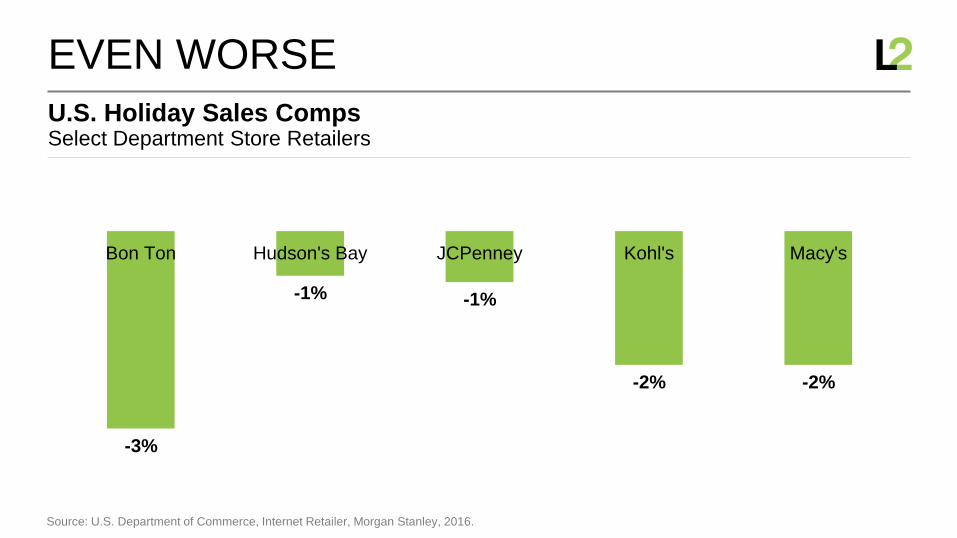
Select Department Store RetailersU.S. Holiday Sales Comps
EVEN WORSE
Source: U.S. Department of Commerce, Internet Retailer, Morgan Stanley, 2016.
-3%
-1% -1%
-2% -2%
Bon Ton Hudson's Bay JCPenney Kohl's Macy's
“We have had our best
holiday ever”
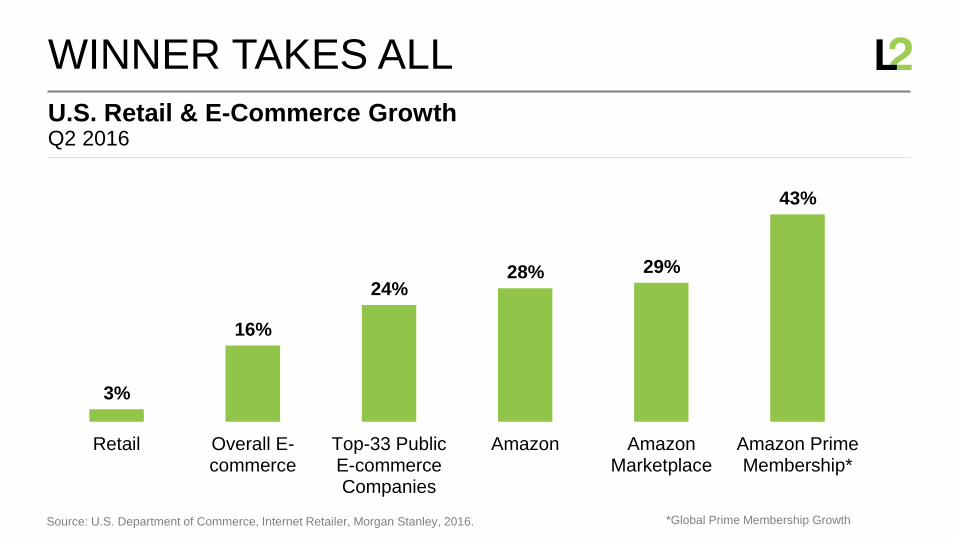
Q2 2016U.S. Retail & E-Commerce Growth
WINNER TAKES ALL
Source: U.S. Department of Commerce, Internet Retailer, Morgan Stanley, 2016. *Global Prime Membership Growth
3%
16%
24%28% 29%
43%
Retail Overall E-commerce
Top-33 PublicE-commerceCompanies
Amazon AmazonMarketplace
Amazon PrimeMembership*

Amazon vs. Walmart, Gap, Nordstrom, Home Depot, Best Buy & Macy’s10-Year Stock Price Appreciation
RETAIL PERFORMANCE
Source: NYSE, 2017.
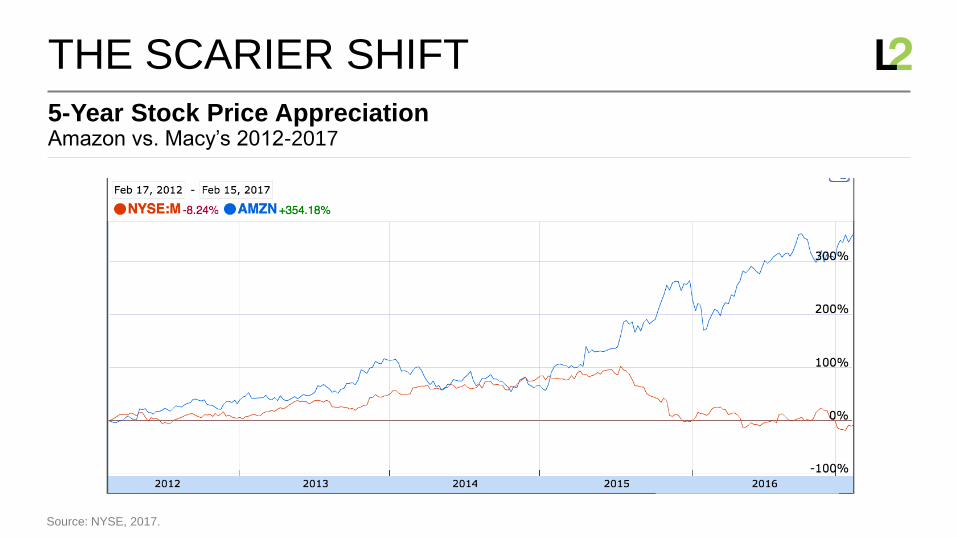
Amazon vs. Macy’s 2012-20175-Year Stock Price Appreciation
THE SCARIER SHIFT
Source: NYSE, 2017.
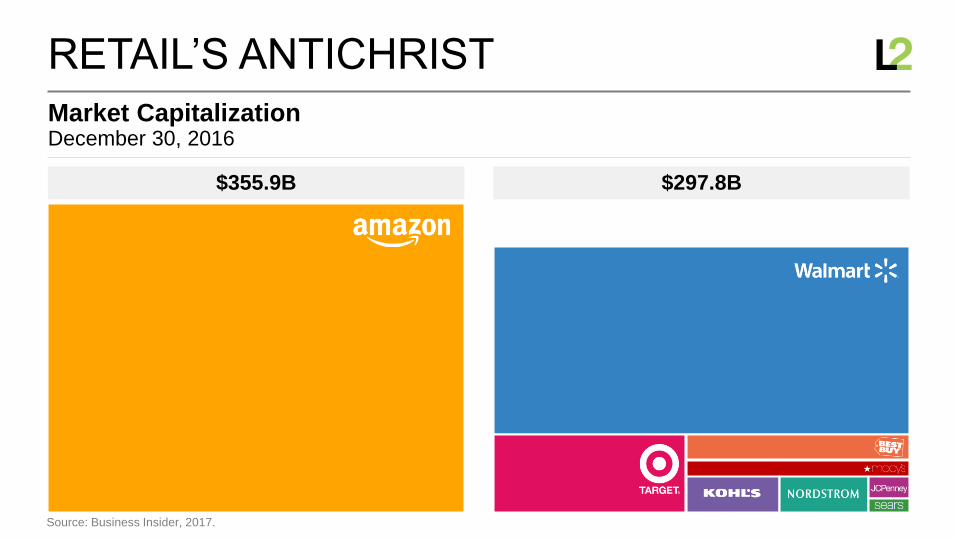
December 30, 2016 Market Capitalization
RETAIL’S ANTICHRIST
Source: Business Insider, 2017.
$355.9B $297.8B
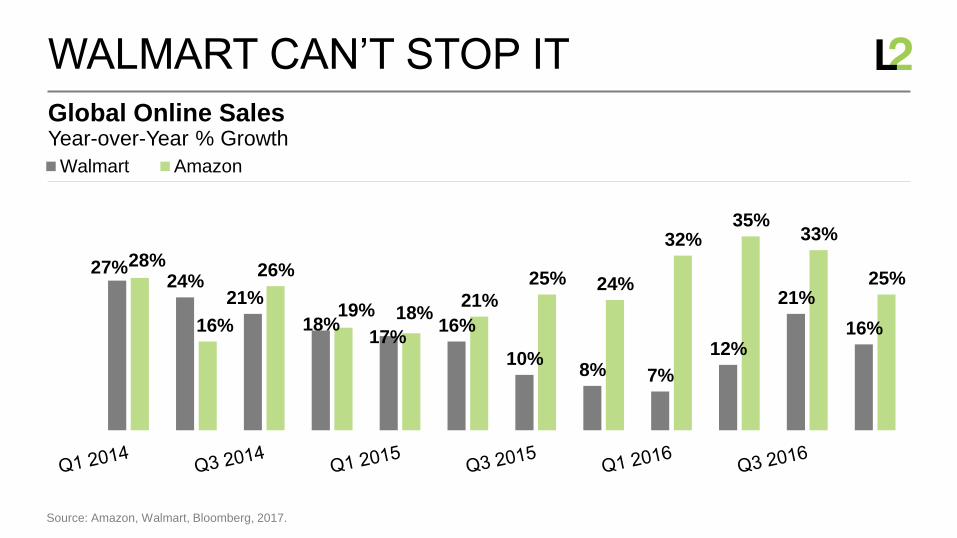
Year-over-Year % GrowthGlobal Online Sales
WALMART CAN’T STOP IT
Source: Amazon, Walmart, Bloomberg, 2017.
27%24%
21%
18%17%
16%
10%8% 7%
12%
21%
16%
28%
16%
26%
19% 18%21%
25% 24%
32%35%
33%
25%
Walmart Amazon
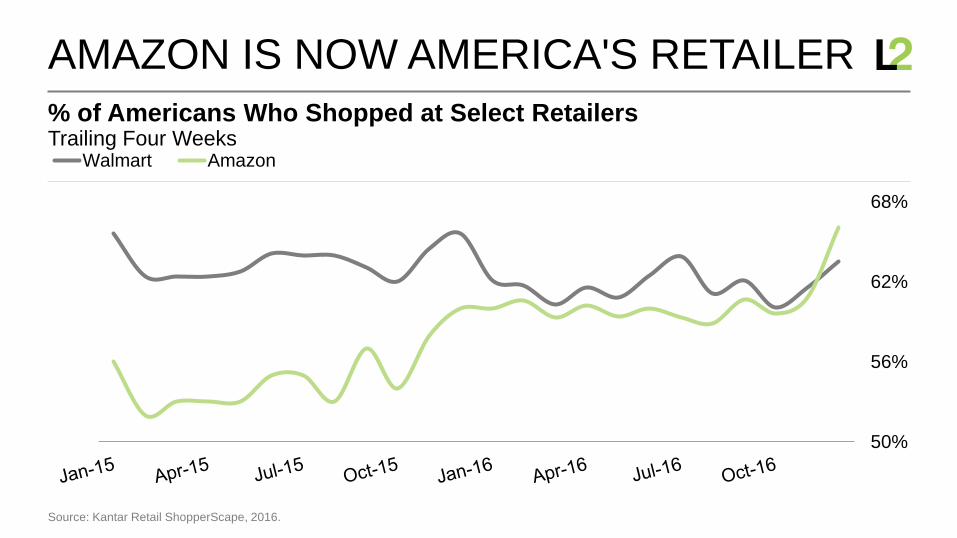
Trailing Four Weeks% of Americans Who Shopped at Select Retailers
AMAZON IS NOW AMERICA'S RETAILER
Source: Kantar Retail ShopperScape, 2016.
50%
56%
62%
68%
Walmart Amazon
UNDERSTANDING AMAZON
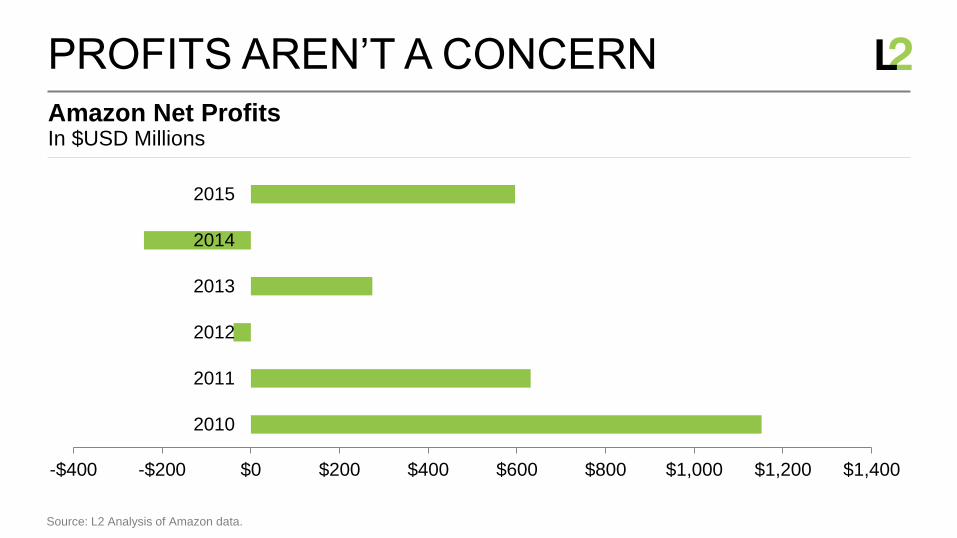
In $USD MillionsAmazon Net Profits
PROFITS AREN’T A CONCERN
Source: L2 Analysis of Amazon data.
-$400 -$200 $0 $200 $400 $600 $800 $1,000 $1,200 $1,400
2010
2011
2012
2013
2014
2015
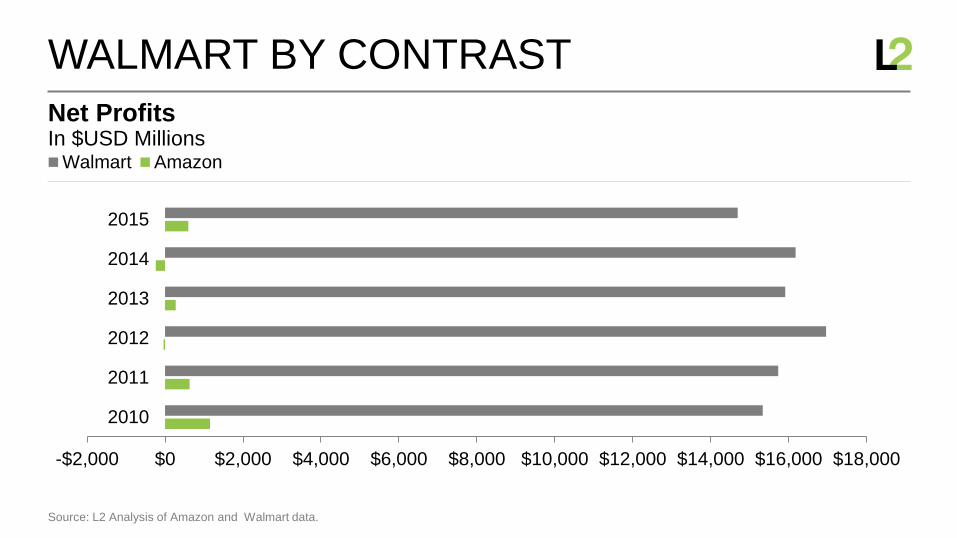
In $USD MillionsNet Profits
WALMART BY CONTRAST
Source: L2 Analysis of Amazon and Walmart data.
-$2,000 $0 $2,000 $4,000 $6,000 $8,000 $10,000 $12,000 $14,000 $16,000 $18,000
2010
2011
2012
2013
2014
2015
Walmart Amazon
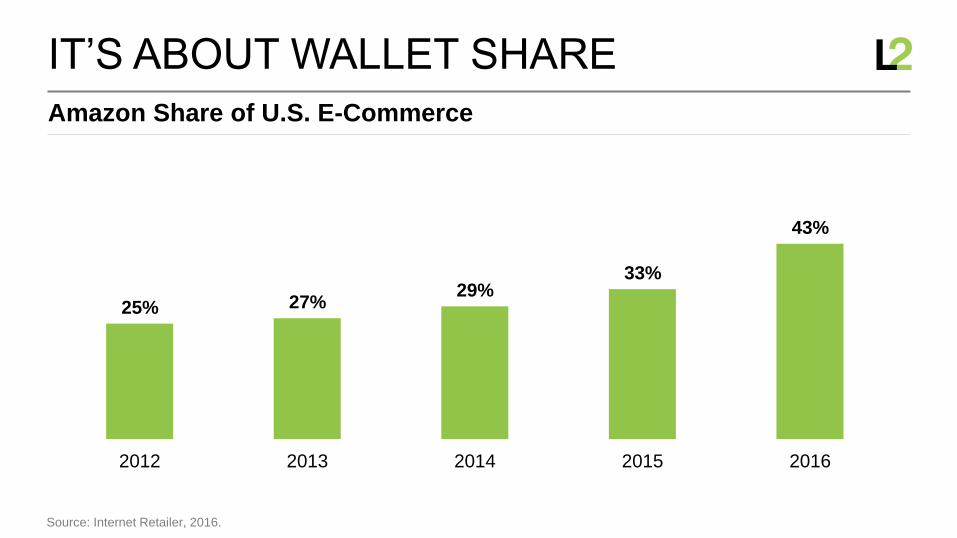
Amazon Share of U.S. E-Commerce
IT’S ABOUT WALLET SHARE
Source: Internet Retailer, 2016.
25% 27%29%
33%
43%
2012 2013 2014 2015 2016
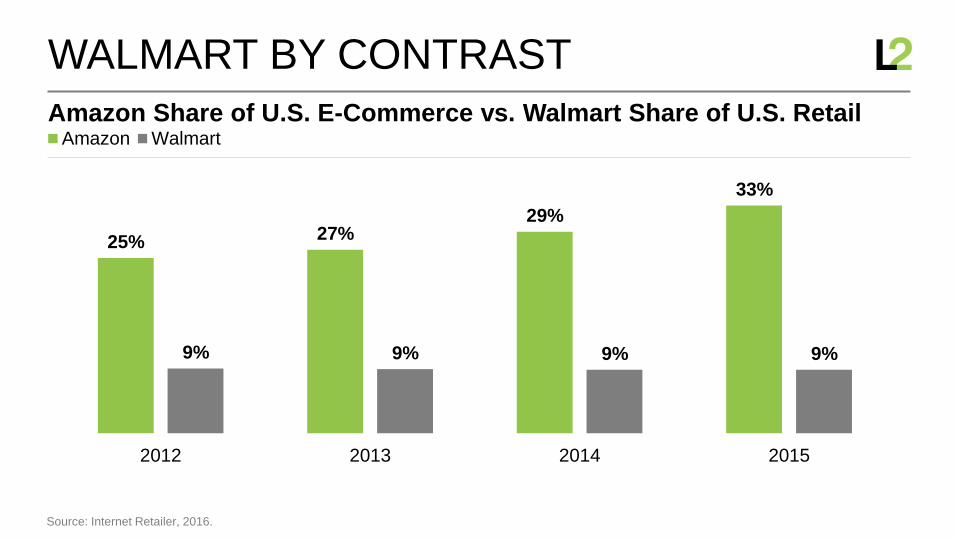
Amazon Share of U.S. E-Commerce vs. Walmart Share of U.S. Retail
WALMART BY CONTRAST
Source: Internet Retailer, 2016.
25% 27%29%
33%
9% 9% 9% 9%
2012 2013 2014 2015
Amazon Walmart
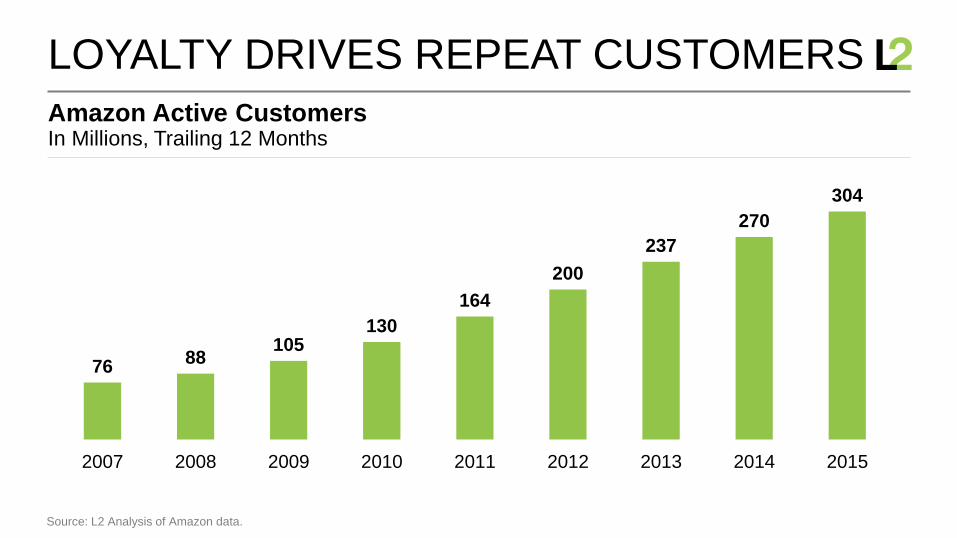
In Millions, Trailing 12 MonthsAmazon Active Customers
LOYALTY DRIVES REPEAT CUSTOMERS
Source: L2 Analysis of Amazon data.
7688
105130
164
200
237
270
304
2007 2008 2009 2010 2011 2012 2013 2014 2015
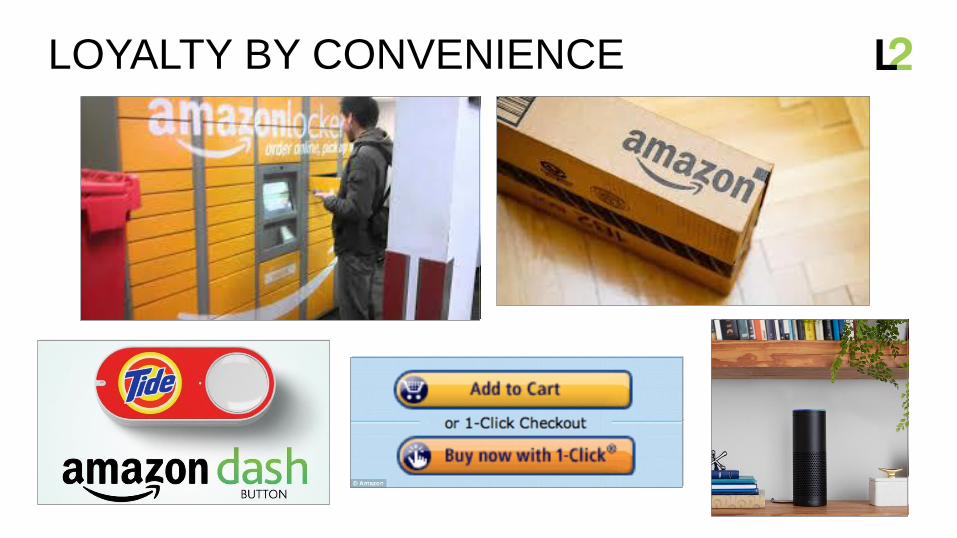
LOYALTY BY CONVENIENCE
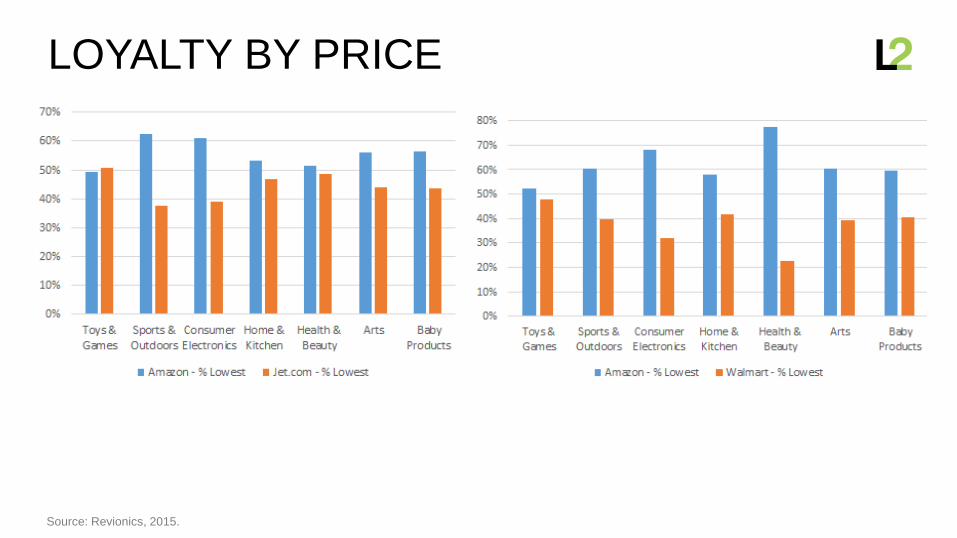
LOYALTY BY PRICE
Source: Revionics, 2015.
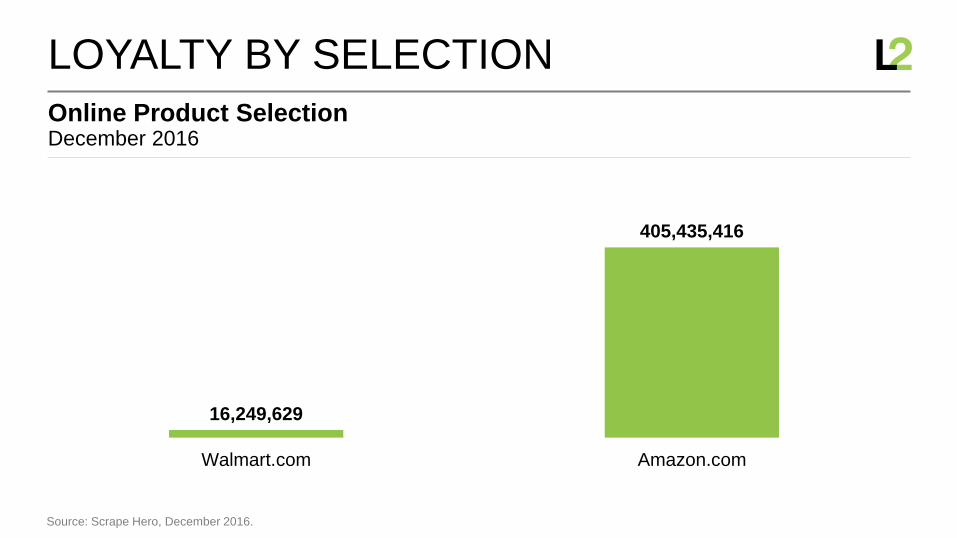
December 2016Online Product Selection
LOYALTY BY SELECTION
Source: Scrape Hero, December 2016.
16,249,629
405,435,416
Walmart.com Amazon.com
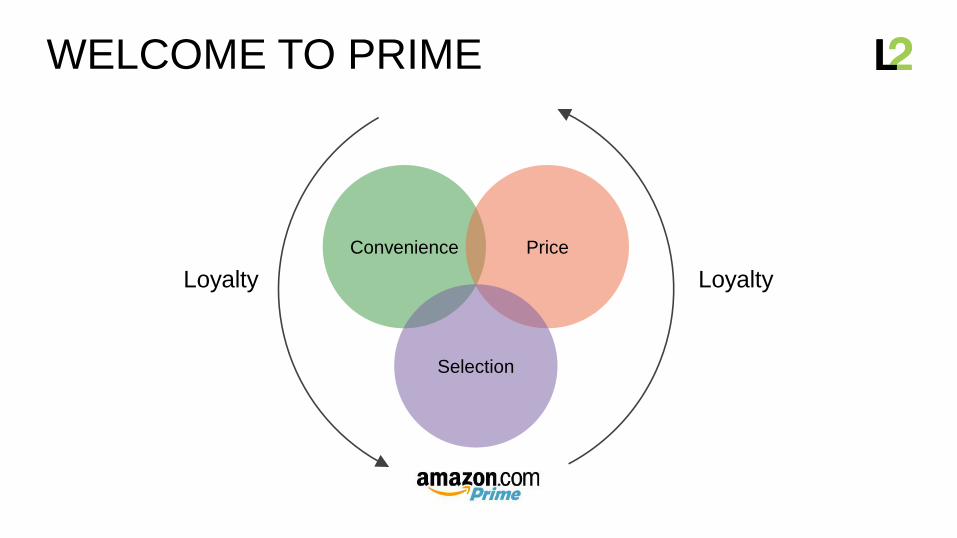
WELCOME TO PRIME
LoyaltyLoyalty
Convenience Price
Selection
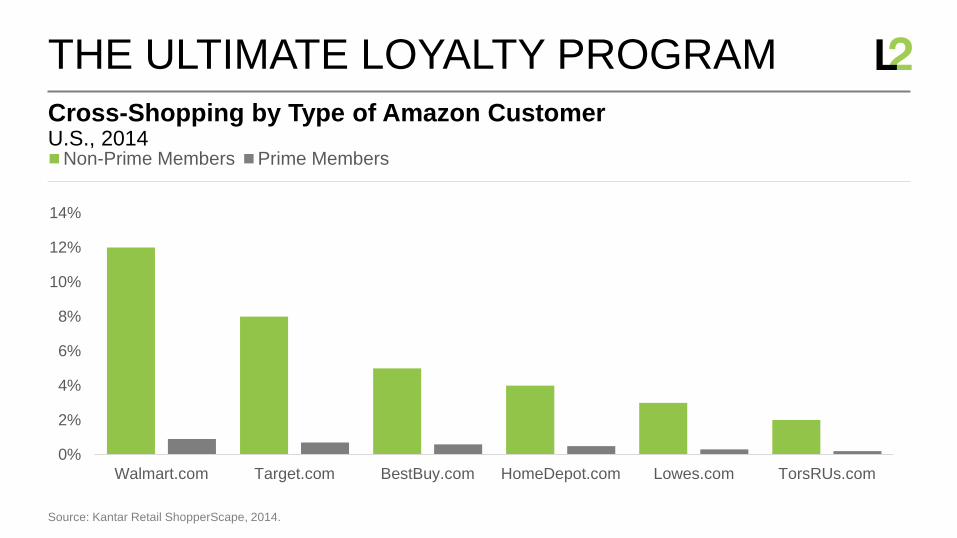
U.S., 2014Cross-Shopping by Type of Amazon Customer
THE ULTIMATE LOYALTY PROGRAM
Source: Kantar Retail ShopperScape, 2014.
0%
2%
4%
6%
8%
10%
12%
14%
Walmart.com Target.com BestBuy.com HomeDepot.com Lowes.com TorsRUs.com
Non-Prime Members Prime Members
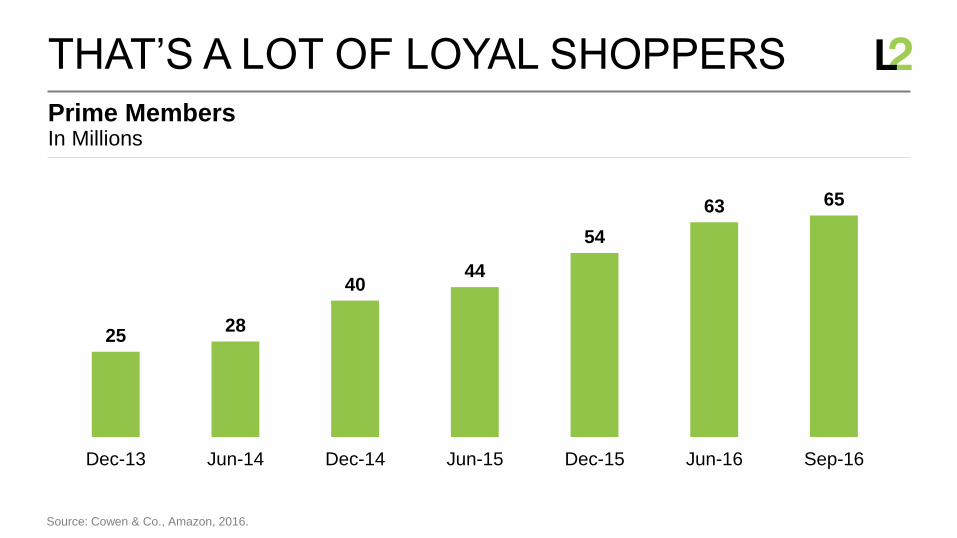
In MillionsPrime Members
THAT’S A LOT OF LOYAL SHOPPERS
Source: Cowen & Co., Amazon, 2016.
2528
4044
54
63 65
Dec-13 Jun-14 Dec-14 Jun-15 Dec-15 Jun-16 Sep-16
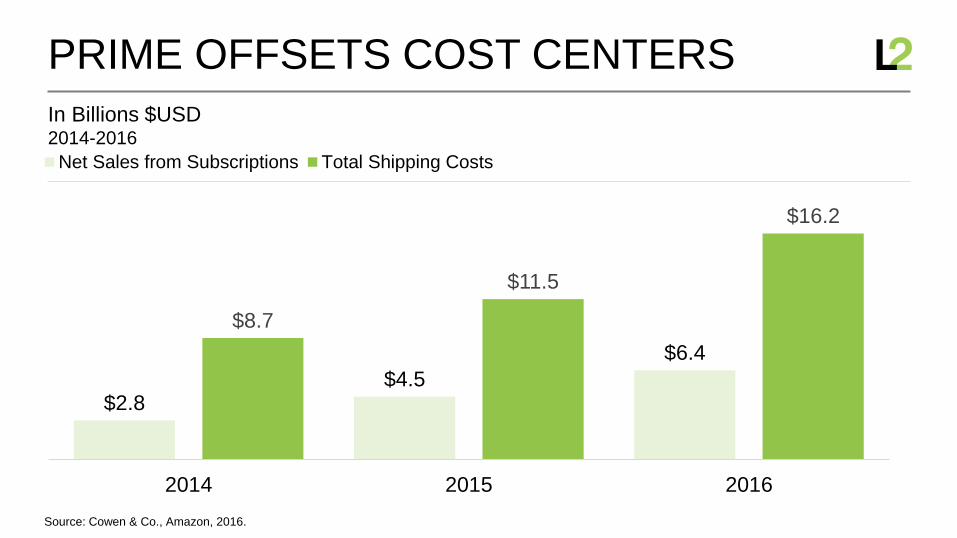
In Billions $USD
Source: Cowen & Co., Amazon, 2016.
PRIME OFFSETS COST CENTERS
2014-2016
$2.8$4.5
$6.4
$8.7
$11.5
$16.2
2014 2015 2016
Net Sales from Subscriptions Total Shipping Costs
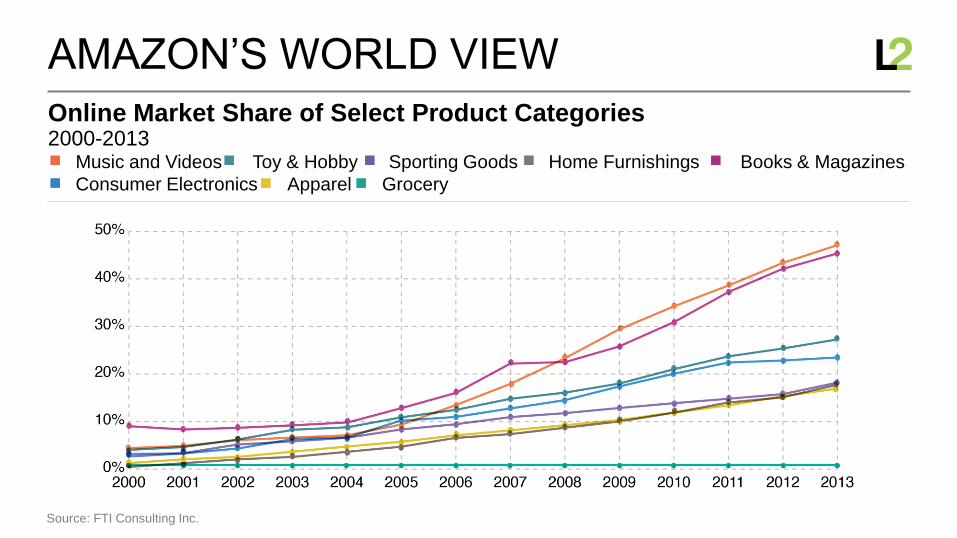
2000-2013Online Market Share of Select Product Categories
AMAZON’S WORLD VIEW
Source: FTI Consulting Inc.
Music and Videos Toy & Hobby Sporting Goods Home Furnishings Books & Magazines
Consumer Electronics Apparel Grocery
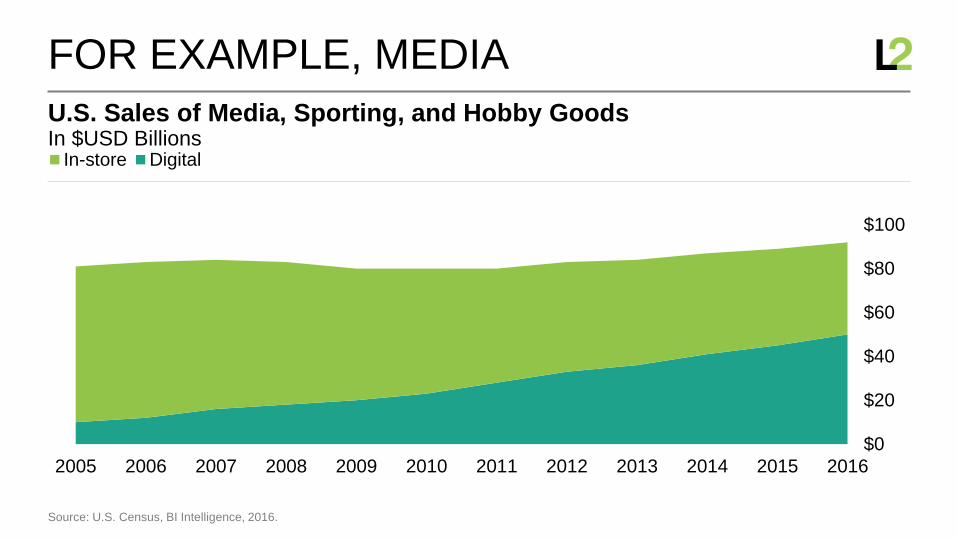
In $USD BillionsU.S. Sales of Media, Sporting, and Hobby Goods
FOR EXAMPLE, MEDIA
Source: U.S. Census, BI Intelligence, 2016.
$0
$20
$40
$60
$80
$100
2005 2006 2007 2008 2009 2010 2011 2012 2013 2014 2015 2016
In-store Digital
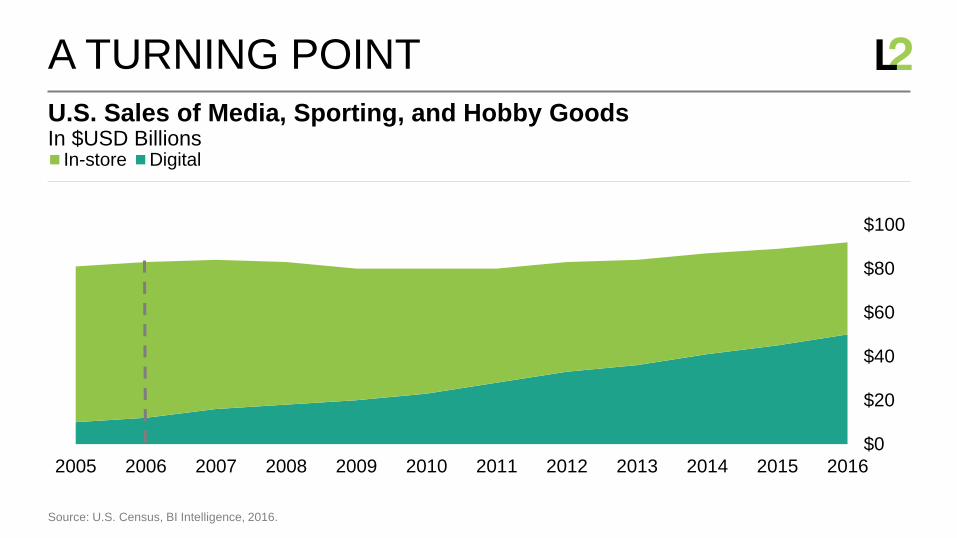
In $USD BillionsU.S. Sales of Media, Sporting, and Hobby Goods
A TURNING POINT
Source: U.S. Census, BI Intelligence, 2016.
$0
$20
$40
$60
$80
$100
2005 2006 2007 2008 2009 2010 2011 2012 2013 2014 2015 2016
In-store Digital
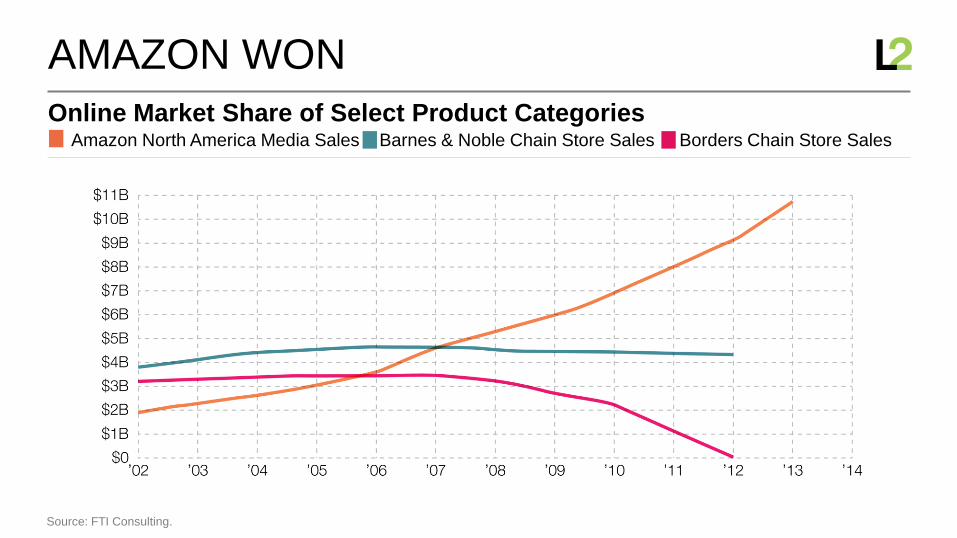
Online Market Share of Select Product Categories
AMAZON WON
Source: FTI Consulting.
Amazon North America Media Sales Barnes & Noble Chain Store Sales Borders Chain Store Sales
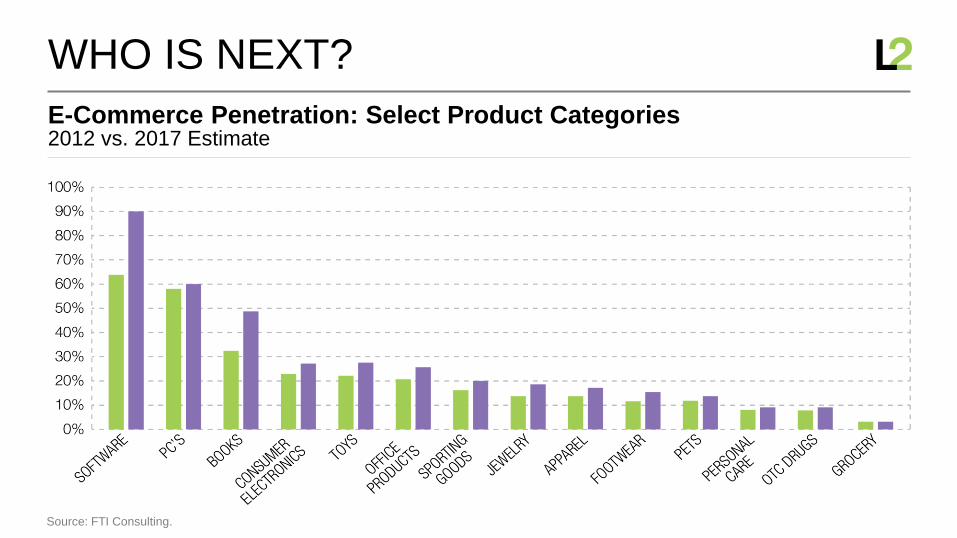
E-Commerce Penetration: Select Product Categories
WHO IS NEXT?
Source: FTI Consulting.
2012 vs. 2017 Estimate
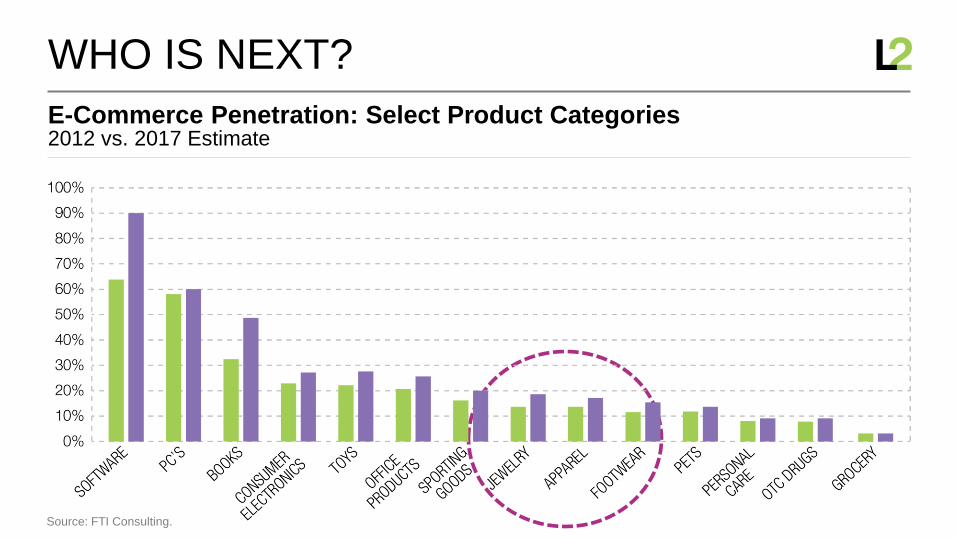
E-Commerce Penetration: Select Product Categories
WHO IS NEXT?
Source: FTI Consulting.
2012 vs. 2017 Estimate
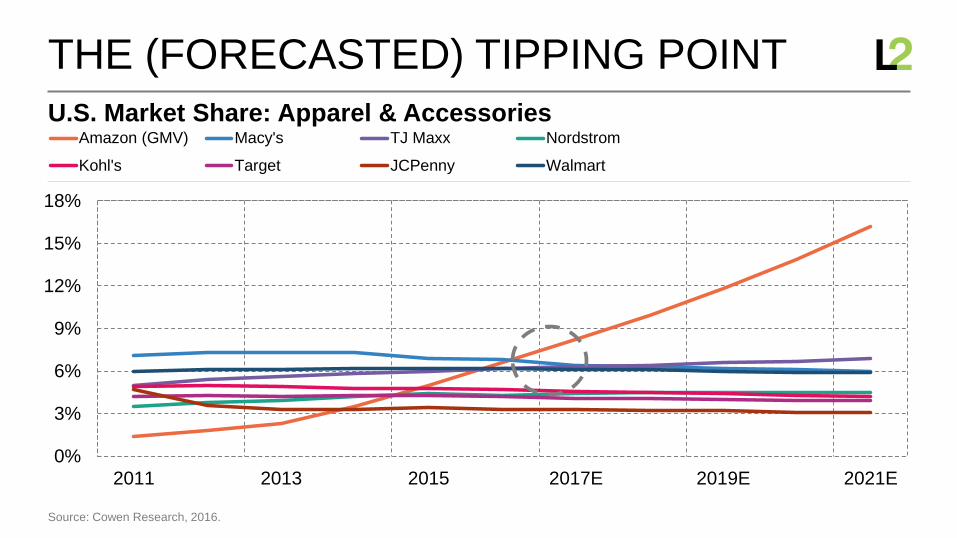
U.S. Market Share: Apparel & Accessories
THE (FORECASTED) TIPPING POINT
Source: Cowen Research, 2016.
0%
3%
6%
9%
12%
15%
18%
2011 2013 2015 2017E 2019E 2021E
Amazon (GMV) Macy's TJ Maxx Nordstrom
Kohl's Target JCPenny Walmart

DEEP DIVE: APPAREL
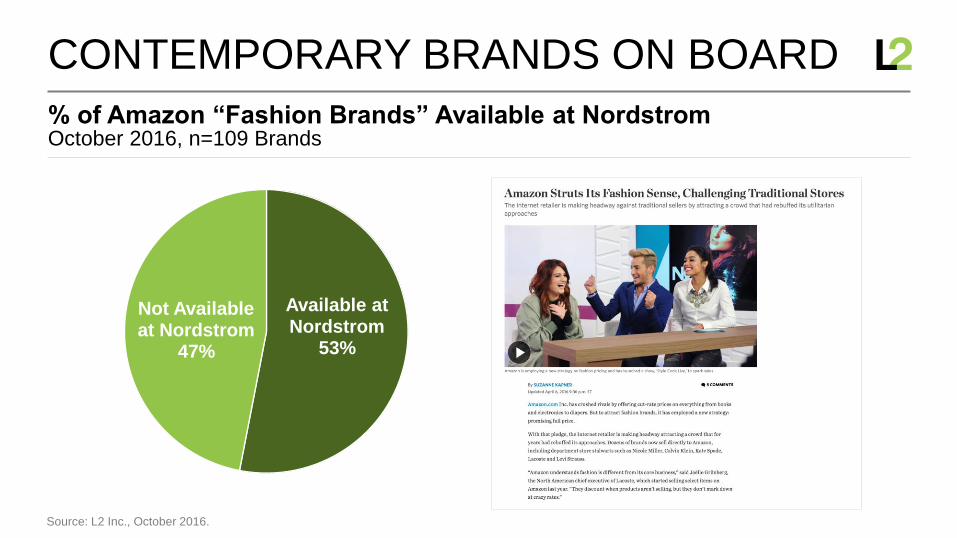
% of Amazon “Fashion Brands” Available at Nordstrom
CONTEMPORARY BRANDS ON BOARD
Source: L2 Inc., October 2016.
October 2016, n=109 Brands
Available at Nordstrom
53%
Not Available at Nordstrom
47%
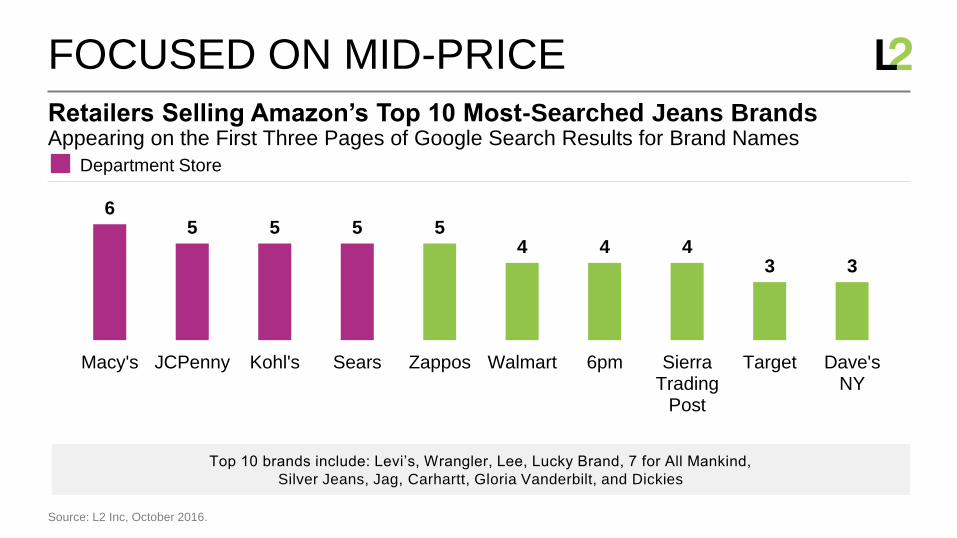
Appearing on the First Three Pages of Google Search Results for Brand NamesRetailers Selling Amazon’s Top 10 Most-Searched Jeans Brands
FOCUSED ON MID-PRICE
Source: L2 Inc, October 2016.
65 5 5 5
4 4 43 3
Macy's JCPenny Kohl's Sears Zappos Walmart 6pm SierraTrading
Post
Target Dave'sNY
Top 10 brands include: Levi’s, Wrangler, Lee, Lucky Brand, 7 for All Mankind,
Silver Jeans, Jag, Carhartt, Gloria Vanderbilt, and Dickies
Department Store
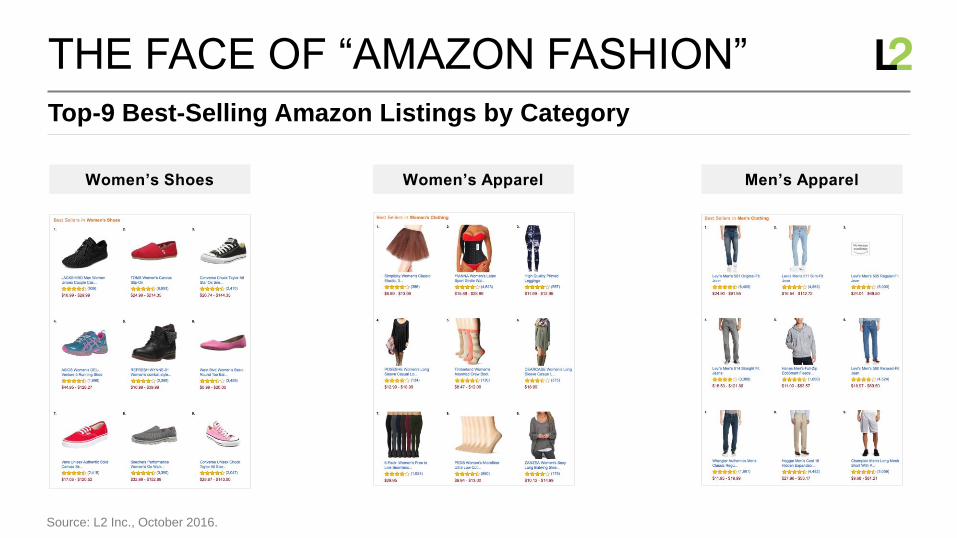
Top-9 Best-Selling Amazon Listings by Category
THE FACE OF “AMAZON FASHION”
Source: L2 Inc., October 2016.
Women’s Shoes Women’s Apparel Men’s Apparel
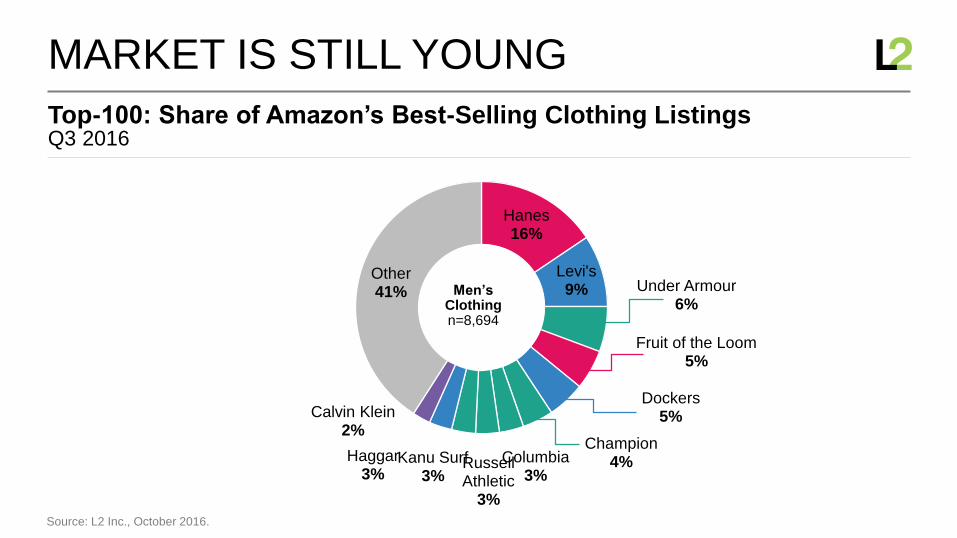
Top-100: Share of Amazon’s Best-Selling Clothing Listings
MARKET IS STILL YOUNG
Source: L2 Inc., October 2016.
Q3 2016
Hanes16%
Levi's9% Under Armour
6%
Fruit of the Loom5%
Dockers5%
Champion4%Columbia
3%Russell Athletic
3%
Kanu Surf3%
Haggar3%
Calvin Klein 2%
Other41% Men’s
Clothingn=8,694
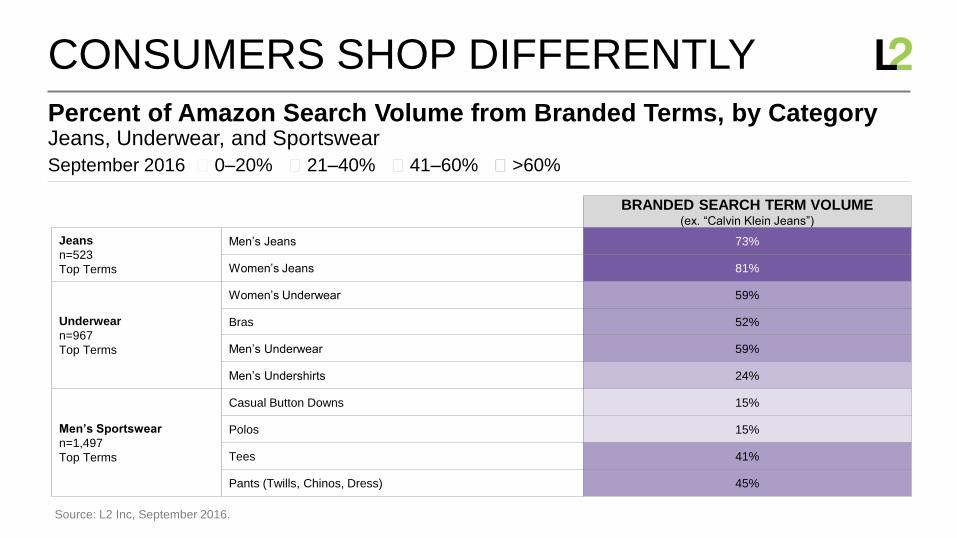
Jeans, Underwear, and SportswearPercent of Amazon Search Volume from Branded Terms, by Category
CONSUMERS SHOP DIFFERENTLY
Source: L2 Inc, September 2016.
BRANDED SEARCH TERM VOLUME(ex. “Calvin Klein Jeans”)
Jeans
n=523
Top Terms
Men’s Jeans 73%
Women’s Jeans 81%
Underwear
n=967
Top Terms
Women’s Underwear 59%
Bras 52%
Men’s Underwear 59%
Men’s Undershirts 24%
Men’s Sportswear
n=1,497
Top Terms
Casual Button Downs 15%
Polos 15%
Tees 41%
Pants (Twills, Chinos, Dress) 45%
September 2016 ◼ 0–20% ◼ 21–40% ◼ 41–60% ◼ >60%
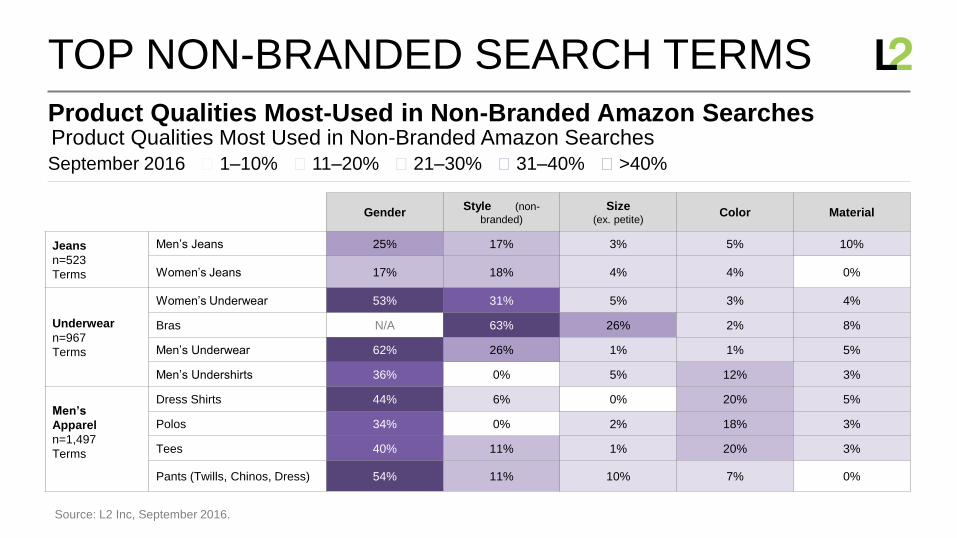
Product Qualities Most Used in Non-Branded Amazon SearchesProduct Qualities Most-Used in Non-Branded Amazon Searches
TOP NON-BRANDED SEARCH TERMS
Source: L2 Inc, September 2016.
GenderStyle (non-
branded)
Size (ex. petite)
Color Material
Jeans
n=523
Terms
Men’s Jeans 25% 17% 3% 5% 10%
Women’s Jeans 17% 18% 4% 4% 0%
Underwear
n=967
Terms
Women’s Underwear 53% 31% 5% 3% 4%
Bras N/A 63% 26% 2% 8%
Men’s Underwear 62% 26% 1% 1% 5%
Men’s Undershirts 36% 0% 5% 12% 3%
Men’s
Apparel
n=1,497
Terms
Dress Shirts 44% 6% 0% 20% 5%
Polos 34% 0% 2% 18% 3%
Tees 40% 11% 1% 20% 3%
Pants (Twills, Chinos, Dress) 54% 11% 10% 7% 0%
September 2016 ◼ 1–10% ◼ 11–20% ◼ 21–30% ◼ 31–40% ◼ >40%
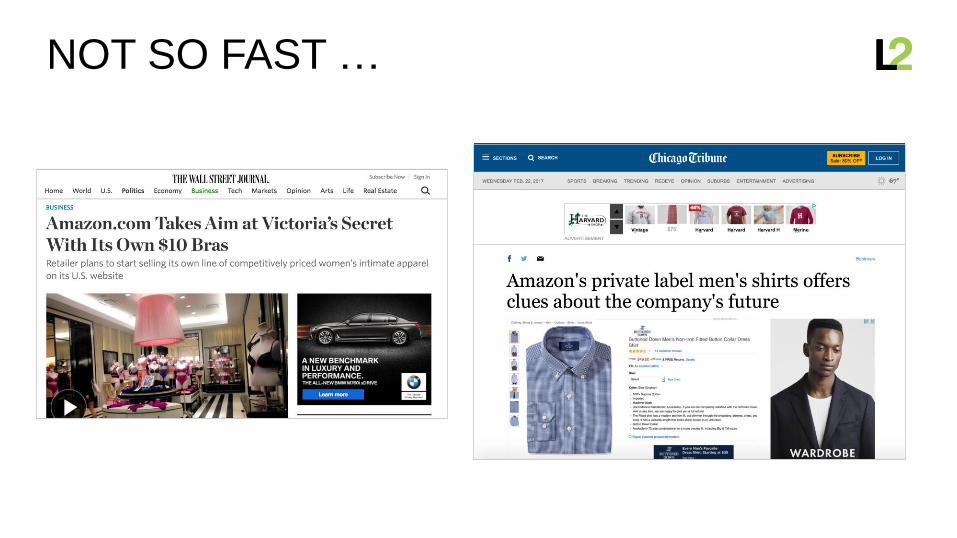
NOT SO FAST …
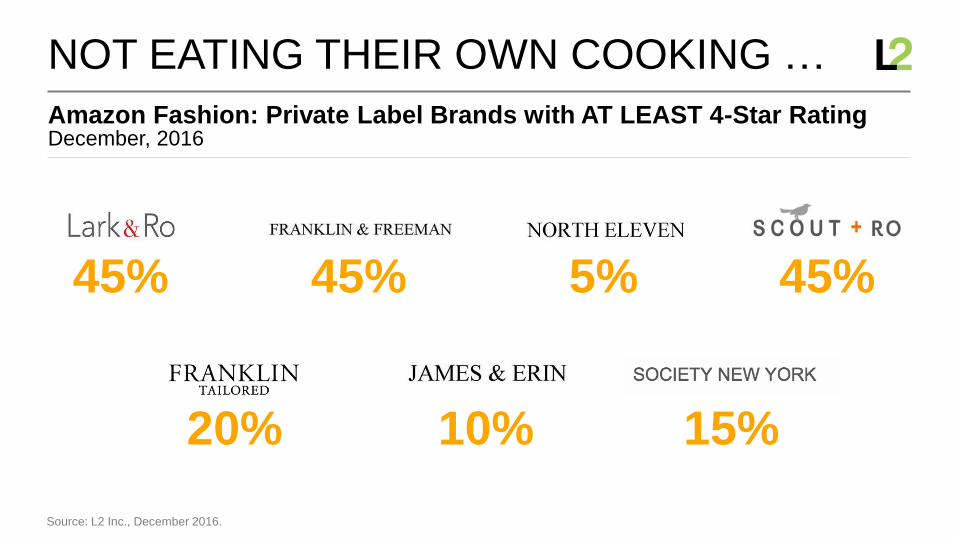
Amazon Fashion: Private Label Brands with AT LEAST 4-Star Rating
NOT EATING THEIR OWN COOKING …
Source: L2 Inc., December 2016.
December, 2016
45% 45% 5% 45%
20% 10% 15%

CONCLUSION
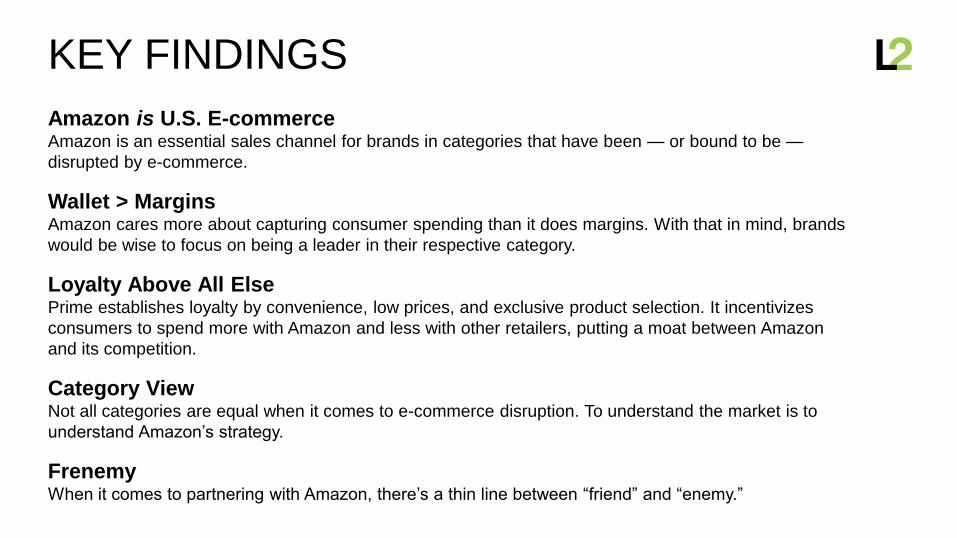
KEY FINDINGS
Amazon is U.S. E-commerceAmazon is an essential sales channel for brands in categories that have been — or bound to be —
disrupted by e-commerce.
Wallet > MarginsAmazon cares more about capturing consumer spending than it does margins. With that in mind, brands
would be wise to focus on being a leader in their respective category.
Loyalty Above All ElsePrime establishes loyalty by convenience, low prices, and exclusive product selection. It incentivizes
consumers to spend more with Amazon and less with other retailers, putting a moat between Amazon
and its competition.
Category ViewNot all categories are equal when it comes to e-commerce disruption. To understand the market is to
understand Amazon’s strategy.
FrenemyWhen it comes to partnering with Amazon, there’s a thin line between “friend” and “enemy.”


![Amazon’s ecommerce Empire_FINAL [Autosaved]](https://img.pdfslide.us/doc/110x75/587091c91a28ab412b8b59f3/amazons-ecommerce-empirefinal-autosaved.jpg)