Embed Size (px)
Citation preview

Trends and Disparities in Premature Mortality
in North Carolina
Matthew D. Curry, MAChristopher J. Mansfield, PhD
Denise Kirk, MSKevin H. Gross, PhD
Center for Health Services Research and Development
East Carolina University

Background
• The two main goals of HP 2010 are to increase lifespan and eliminate racial disparities.
• Counties and states will use mortality rates to monitor progress towards many of the specific objectives in HP 2010.
• Though not routinely monitored, race-sex specific premature mortality rates could be used to track progress toward HP 2010 goals.

Purpose
• Identify the leading causes of premature mortality in North Carolina
• Examine trends in premature mortality for major contributors to early death
• Compare and contrast race-sex specific trends in premature mortality
• Highlight race and gender disparities in premature mortality

Metric
• Years of life lost before age 75 (YLL-75)
• Expressed as a rate per 10,000 population under age 75
• “Best single proxy for reflecting differences in health status” (US GAO, 1996)
• Crude rates demonstrate burden of early death among different groups for specific causes
Methods
• Identify leading causes of premature mortality in North Carolina between 1979 and 1998
• Calculate premature mortality rates for leading causes over the 20 year period • Use the same approach to calculate race-sex specific premature mortality rates

Comparison of Mortality and Premature Mortality Rates
North Carolina, 1994-1998Mortality Premature Mortality
All-Cause Mortality Rate:879 deaths per 100,000 population
All-Cause Premature Mortality Rate:920 YLL-75 per 10,000 population < 75
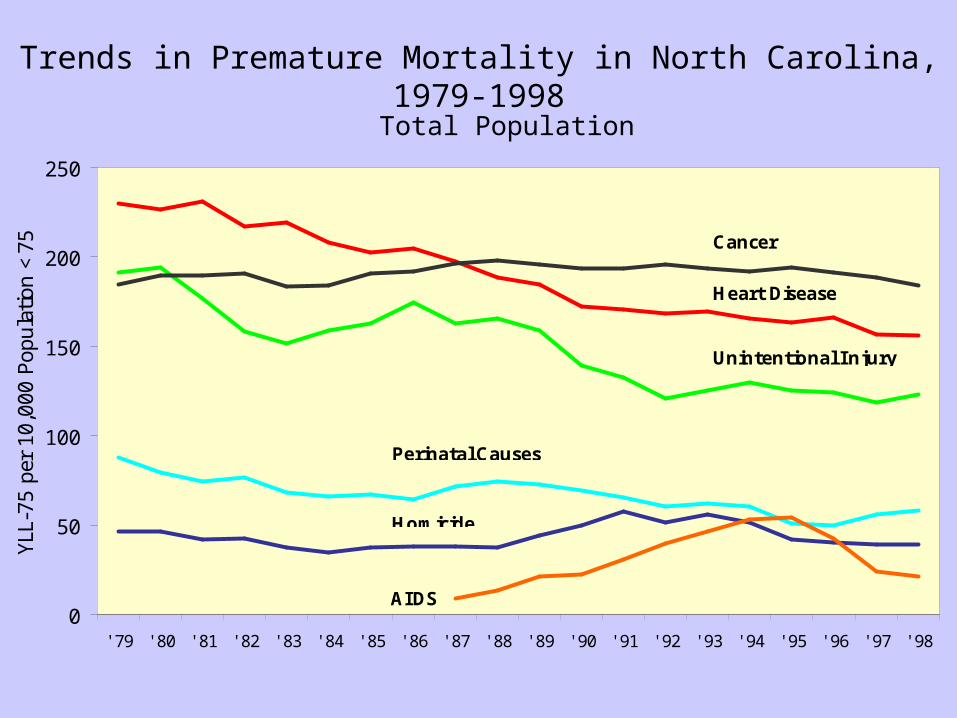
Trends in Premature Mortality in North Carolina, 1979-1998
0
50
100
150
200
250
' 79 ' 80 ' 81 ' 82 ' 83 ' 84 ' 85 ' 86 ' 87 ' 88 ' 89 ' 90 ' 91 ' 92 ' 93 ' 94 ' 95 ' 96 ' 97 ' 98
YLL-
75 p
er 1
0,00
0 Po
pula
tion
<75 Cancer
Heart Disease
Unintentional Injury
Perinatal Causes
AIDS
Homicide
Total Population

0
50
100
150
200
250
300
350
400
' 79 ' 80 ' 81 ' 82 ' 83 ' 84 ' 85 ' 86 ' 87 ' 88 ' 89 ' 90 ' 91 ' 92 ' 93 ' 94 ' 95 ' 96 ' 97 ' 98
YLL-
75 p
er 1
0,00
0 Po
pula
tion
<75
Unintentional Injury
Heart Disease
Cancer
AIDS
Homicide
Perinatal Causes
Trends in Premature Mortality in North Carolina, 1979-1998
Non-White Males

Trends in Premature Mortality in North Carolina, 1979-1998
White Males
0
50
100
150
200
250
300
350
400
' 79 ' 80 ' 81 ' 82 ' 83 ' 84 ' 85 ' 86 ' 87 ' 88 ' 89 ' 90 ' 91 ' 92 ' 93 ' 94 ' 95 ' 96 ' 97 ' 98
YLL-
75 p
er 1
0,00
0 Po
pula
tion
<75 Heart Disease
Cancer
Unintentional Injury
Suicide
Perinatal CausesAIDS

Trends in Premature Mortality in North Carolina, 1979-1998
Non-White Females
0
50
100
150
200
250
300
350
400
' 79 ' 80 ' 81 ' 82 ' 83 ' 84 ' 85 ' 86 ' 87 ' 88 ' 89 ' 90 ' 91 ' 92 ' 93 ' 94 ' 95 ' 96 ' 97 ' 98
YLL-
75 p
er 1
0,00
0 Po
pula
tion
<75
Heart Disease Cancer
Perinatal Causes
Unintentional Injury
AIDSStroke

Trends in Premature Mortality in North Carolina, 1979-1998
White Females
0
50
100
150
200
250
300
350
400
' 79 ' 80 ' 81 ' 82 ' 83 ' 84 ' 85 ' 86 ' 87 ' 88 ' 89 ' 90 ' 91 ' 92 ' 93 ' 94 ' 95 ' 96 ' 97 ' 98
YLL-
75 p
er 1
0,00
0 Po
pula
tion
<75
Cancer
Heart Disease
Unintentional Injury
Perinatal Causes
Suicide

Comparison of Leading Contributors to Premature Mortality
NWM WM NWF WF
Heart Disease Cancer Cancer Cancer
Un. Injury Heart Disease Heart Disease Heart Disease
Cancer Un. Injury Perinatal Cond. Un. Injury
Homicide Suicide Un. Injury Perinatal Cond.
Perinatal Cond. Perinatal Cond. Stroke Suicide
North Carolina, 1999

Trends in Premature Mortality in North Carolina, 1979-1998
Comparison of Heart Disease Trends
0
50
100
150
200
250
300
350
400
' 79 ' 80 ' 81 ' 82 ' 83 ' 84 ' 85 ' 86 ' 87 ' 88 ' 89 ' 90 ' 91 ' 92 ' 93 ' 94 ' 95 ' 96 ' 97 ' 98
YLL-
75 p
er 1
0,00
0 Po
pula
tion
<75
NWM
NWF
WM
WF

Trends in Premature Mortality in North Carolina, 1979-1998
Comparison of Cancer Trends
0
50
100
150
200
250
300
' 79 ' 80 ' 81 ' 82 ' 83 ' 84 ' 85 ' 86 ' 87 ' 88 ' 89 ' 90 ' 91 ' 92 ' 93 ' 94 ' 95 ' 96 ' 97 ' 98
YLL-
75 p
er 1
0,00
0 Po
pula
tion
<75 NWM
NWF
WM
WF

Trends in Premature Mortality in North Carolina, 1979-1998
Comparison of Unintentional Injury Trends
0
50
100
150
200
250
300
350
400
' 79 ' 80 ' 81 ' 82 ' 83 ' 84 ' 85 ' 86 ' 87 ' 88 ' 89 ' 90 ' 91 ' 92 ' 93 ' 94 ' 95 ' 96 ' 97 ' 98
YLL-
75 p
er 1
0,00
0 Po
pula
tion
<75 NWM
NWF
WM
WF

Trends in Premature Mortality in North Carolina, 1979-1998
Comparison of AIDS Trends
0
50
100
150
200
250
' 79 ' 80 ' 81 ' 82 ' 83 ' 84 ' 85 ' 86 ' 87 ' 88 ' 89 ' 90 ' 91 ' 92 ' 93 ' 94 ' 95 ' 96 ' 97 ' 98
YLL-
75 p
er 1
0,00
0 Po
pula
tion
<75
NWM
NWF
WM
WF

Summary of State Trends
• Cancer, heart disease, unintentional injuries, perinatal conditions and homicide are the leading causes of premature mortality in NC.
• In 1988, cancer replaced heart disease as the leading contributor to premature mortality.
• AIDS emerged as a major contributor to premature mortality during the early 1990s, but has since declined.
• Premature mortality rates have declined substantially for all causes except cancer and homicide.

Summary of Race-Sex Specific Trends
• Premature mortality from homicide increased dramatically for non- white males during the early 1990s .
• White males have experienced large reductions in premature mortality from heart disease and unintentional injuries.
• Stroke is a major contributor to premature mortality for non-white females, but not for other groups.
• HIV did not emerge as a major contributor to premature mortality for white females.
• Suicide has historically been a major contributor to premature mortality for whites, but not non-whites.

Summary of Disparities
• Major gender disparities were found for unintentional injuries, heart disease, and cancer, with men having higher rates of premature mortality than women.
• Large racial disparities were found for heart disease and AIDS among both men and women.
• Racial disparities among men were also identified for unintentional injuries and cancer, with non-whites having higher premature mortality rates than whites.
• HIV did not emerge as a major contributor to premature mortality for white females.
• The greatest racial disparity was seen in the AIDS premature mortality rates, with non-white males having excessively high rates as compared to other groups.

Conclusions
• Premature mortality rates suggest different priorities for public health intervention than traditional mortality rates.
• Premature mortality provides a measure of the burden of early death, and may be a better metric than traditional mortality rates for monitoring progress towards the goal of increasing lifespan.
• Premature mortality rates can also be used to track trends for specific disease, as well as racial disparities.
• Greater attention to race-gender specific trends in premature mortality could lead to further gains in lifespan and reduced health inequities.

Suggested Reading
Haenszel W (1950). A standardized rate for mortality defined in units of lost years of life. American Journal of Public Health, 40: 17-26.
Mansfield CJ, Wilson JL, Kobrinski EJ, Mitchell J (1999). Premature mortality in the United States: The role of geographic area, socioeconomic status, household type, and availability of medical care. American Journal of Public Health, 89: 893-898.
McDonnell S, Vossberg K, Hopkins RS, Mittan B (1998). Using YPLL in health planning. Public Health Reports, 113: 55-61.
Romeder JM and McWhinnie JR (1997). Potential years of life lost between ages 1 and 70: An indicator of premature mortality for health planning. International Journal of Epidemiology, 6: 143-151.
Selik RM and Chu SY (1997). Years of potential life lost due to HIV infection in the United States. AIDS, 11: 1635-1639.

Contact Information
Matt Curry: [email protected]
Chris Mansfield: [email protected]
Center for Health Services Research and Developmentwww.chsrd.med.ecu.edu