Embed Size (px)
Citation preview
CitiFX® Risk Advisory Group
Trend Modelscan simple trend strategies work long term?
Dr Jessica James
Investor Risk Advisory Group
CitiFX® Risk Advisory Group
2
OverviewTrend models – general overviewIn- and out-of-sample testingTrend model enhancements
CitiFX® Risk Advisory Group
Trend models overview
CitiFX® Risk Advisory Group
4
Trend is popular85% of CTA returns are explained by simple trend followingThe figure rises to almost 100% when carry and option trading are includedThey are without doubt the most popular systematic rule-based strategies used by overlay managers and currency alpha fundsThey may be backtested relatively easily
CitiFX® Risk Advisory Group
5
Trend modelsThe idea of a trend is intimately connected with that of momentum – if a currency moves in one direction in one period, it is likely to continue that direction in the nextHowever, there will be reversals within larger trends, and the key to successful trend following is to discover when a trend starts and ends, and not be taken in by false signalsMoving average models are historically very successful at capturing trends and they have many different variations• simple MA• multiple MA• exponential• Garch• fade in/outWe use the simplest possible – a simple single MA – for research purposes.• further complexity may be added if a principle is established
CitiFX® Risk Advisory Group
6
Historical returns to trend modelsHistorically, long term trends are displayed in currency pairs which are the exchange rates between disparate economies – USD/JPY, EUR/USD etc.Interestingly, those pairs which do display a marked tendency to trend all have their optimal moving average at about 70 daysThose currencies which historically have not trended are the pairs which are the exchange rates between closely linked economies – EUR/CHF, GBP/USD etc.The majority of trend models give very similar results
CitiFX® Risk Advisory Group
7
Trending or not?We sought to establish which currencies ‘trend’ or not by looking at the results of the simplest possible trend following strategy – that of a single moving averageBy buying when the rate was above a simple arithmetic moving average, and selling when it was below, we obtained a P/L curve for the trading strategy since the start of the data set, in 1992We looked at every length of moving average strategy from 5 to 130 daysWe use USD/JPY and USD/CAD as opposite examplesForwards are not included but tests with full MTM calculations indicate that they make little difference, even to USD/JPY
CitiFX® Risk Advisory Group
8
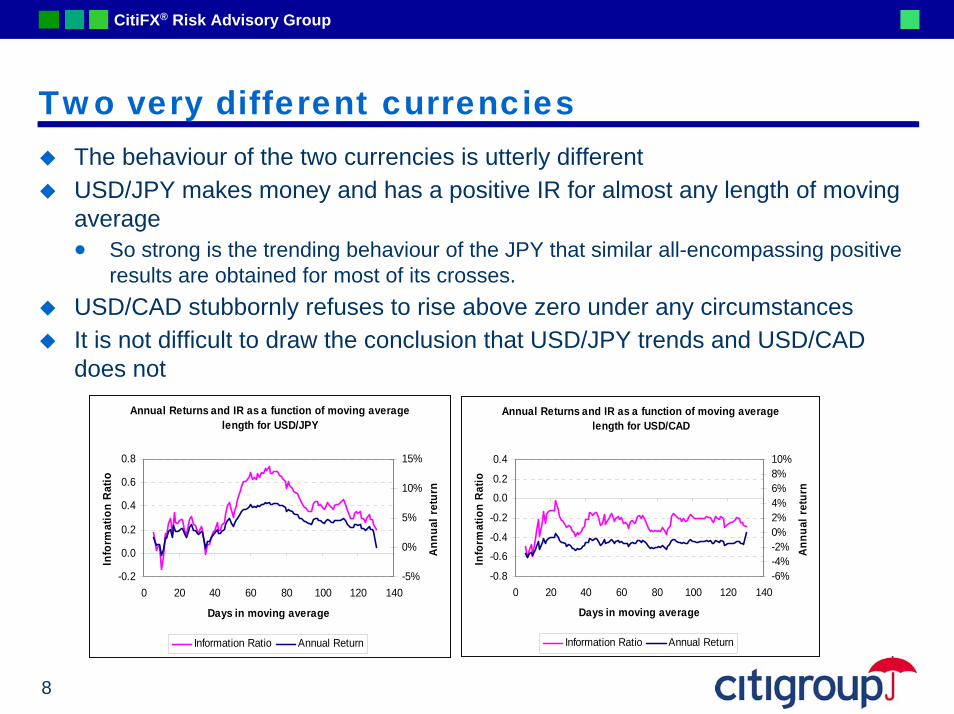
Two very different currenciesThe behaviour of the two currencies is utterly differentUSD/JPY makes money and has a positive IR for almost any length of moving average• So strong is the trending behaviour of the JPY that similar all-encompassing positive
results are obtained for most of its crosses.USD/CAD stubbornly refuses to rise above zero under any circumstancesIt is not difficult to draw the conclusion that USD/JPY trends and USD/CAD does not
Annual Returns and IR as a function of moving average length for USD/JPY
-0.2
0.0
0.2
0.4
0.6
0.8
0 20 40 60 80 100 120 140
Days in moving average
Info
rmat
ion
Rat
io
-5%
0%
5%
10%
15%
Ann
ual r
etur
n
Information Ratio Annual Return
Annual Returns and IR as a function of moving average length for USD/CAD
-0.8
-0.6
-0.4
-0.2
0.0
0.2
0.4
0 20 40 60 80 100 120 140
Days in moving average
Info
rmat
ion
Ratio
-6%-4%-2%0%2%4%6%8%10%
Annu
al re
turn
Information Ratio Annual Return
CitiFX® Risk Advisory Group
9
More currencies Annual Returns and IR as a function of moving average
length for USD/CHF
-1.0-0.8-0.6-0.4-0.20.00.20.4
0 20 40 60 80 100 120 140
Days in moving average
Info
rmat
ion
Ratio
-10%
-5%
0%
5%
10%
Annu
al re
turn
Information Ratio Annual Return
Annual Returns and IR as a function of moving average length for USD/AUD
-0.6
-0.4
-0.2
0.0
0.2
0.4
0 20 40 60 80 100 120 140
Days in moving average
Info
rmat
ion
Ratio
-6%-4%-2%0%2%4%6%8%10%
Annu
al r
etur
n
Information Ratio Annual Return
Annual Returns and IR as a function of moving average length for EUR/USD
-0.6
-0.4
-0.2
0.0
0.2
0.4
0.6
0 20 40 60 80 100 120 140
Days in moving average
Info
rmat
ion
Ratio
-6%-4%-2%0%2%4%6%8%10%
Annu
al re
turn
Information Ratio Annual Return
Annual Returns and IR as a function of moving average length for EUR/JPY
-0.10.00.10.20.30.40.50.6
0 20 40 60 80 100 120 140
Days in moving average
Info
rmat
ion
Ratio
-2%
0%
2%
4%
6%
8%
10%
Annu
al re
turn
Information Ratio Annual Return
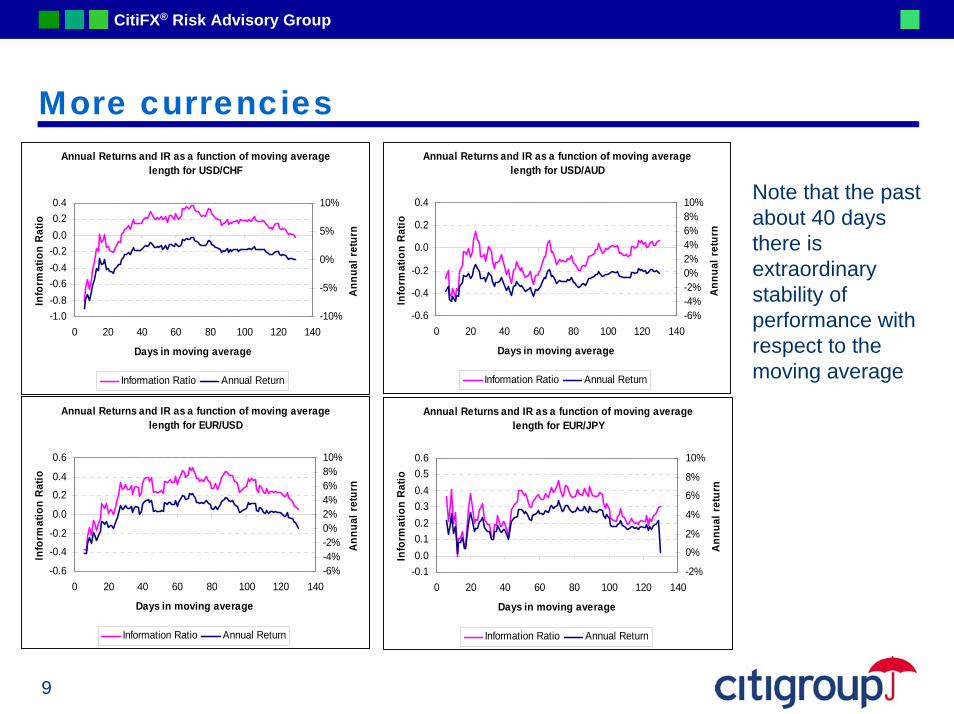
Note that the past about 40 days there is extraordinary stability of performance with respect to the moving average
CitiFX® Risk Advisory Group
10
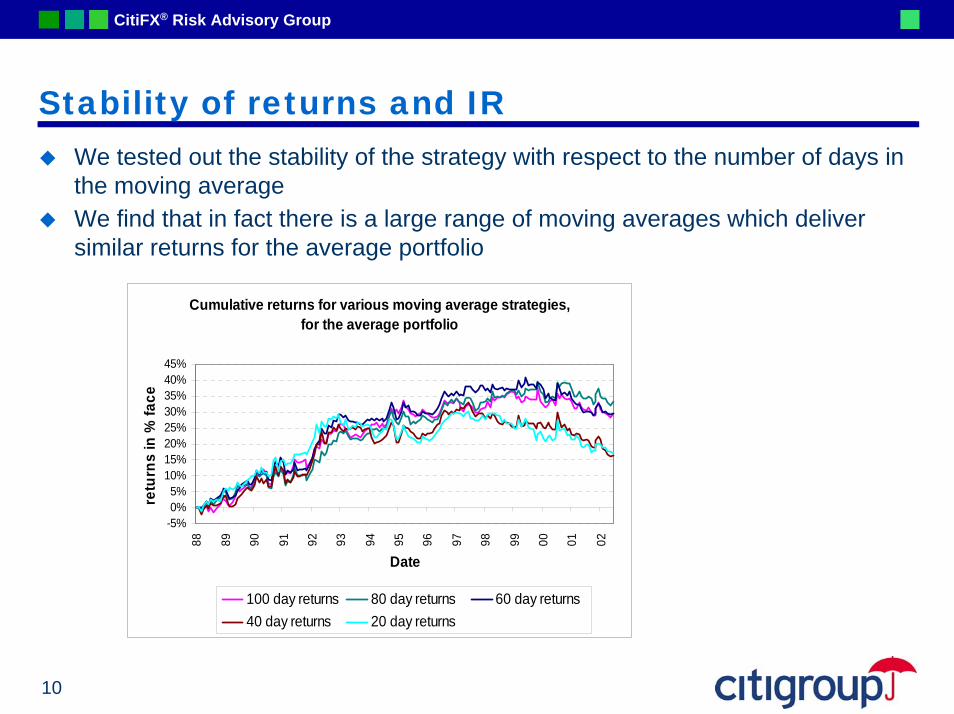
Stability of returns and IRWe tested out the stability of the strategy with respect to the number of days in the moving averageWe find that in fact there is a large range of moving averages which deliver similar returns for the average portfolio
Cumulative returns for various moving average strategies, for the average portfolio
-5%0%5%
10%15%20%25%30%35%40%45%
88 89 90 91 92 93 94 95 96 97 98 99 00 01 02
Date
retu
rns
in %
face
100 day returns 80 day returns 60 day returns40 day returns 20 day returns
CitiFX® Risk Advisory Group
11
The ‘best’ moving averageIt is interesting to find the ‘best’ moving average • obviously this is an optimisation, but only of a single parameterAccordingly we repeated the analysis with finer granularity, creating returns
and information ratios for moving averages between 20 and 100 days with ‘steps’ of 5 daysThe following graphs reveal the optimal region.
CitiFX® Risk Advisory Group
12
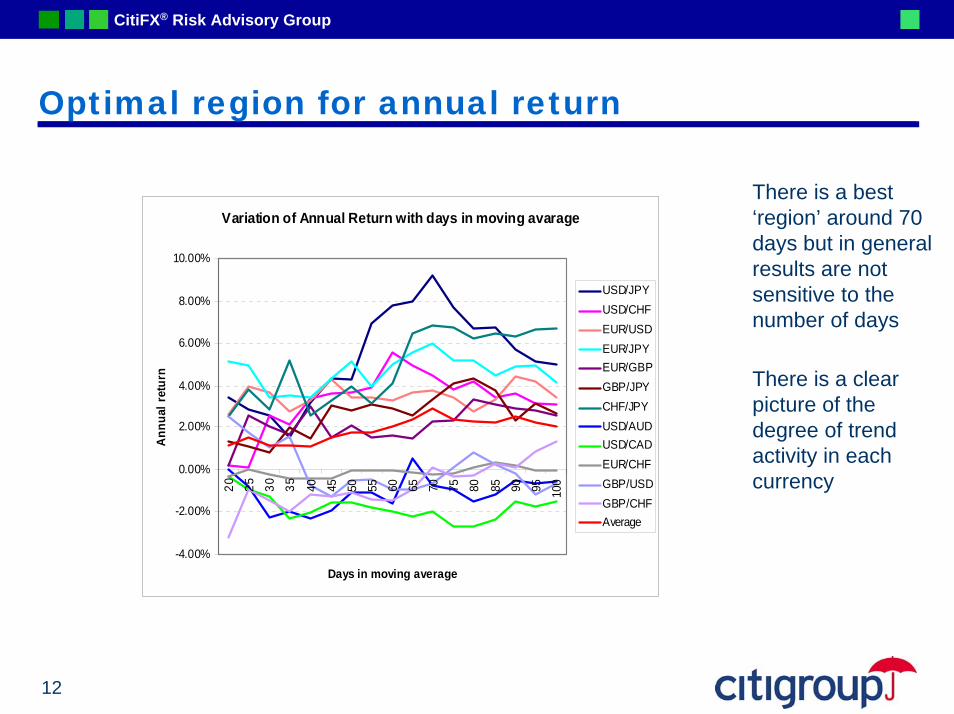
Optimal region for annual return
There is a best ‘region’ around 70 days but in general results are not sensitive to the number of days
There is a clear picture of the degree of trend activity in each currency
Variation of Annual Return with days in moving avarage
-4.00%
-2.00%
0.00%
2.00%
4.00%
6.00%
8.00%
10.00%
20 25 30 35 40 45 50 55 60 65 70 75 80 85 90 95 100
Days in moving average
Ann
ual r
etur
n
USD/JPYUSD/CHFEUR/USDEUR/JPYEUR/GBPGBP/JPYCHF/JPYUSD/AUDUSD/CADEUR/CHFGBP/USDGBP/CHFAverage
CitiFX® Risk Advisory Group
13
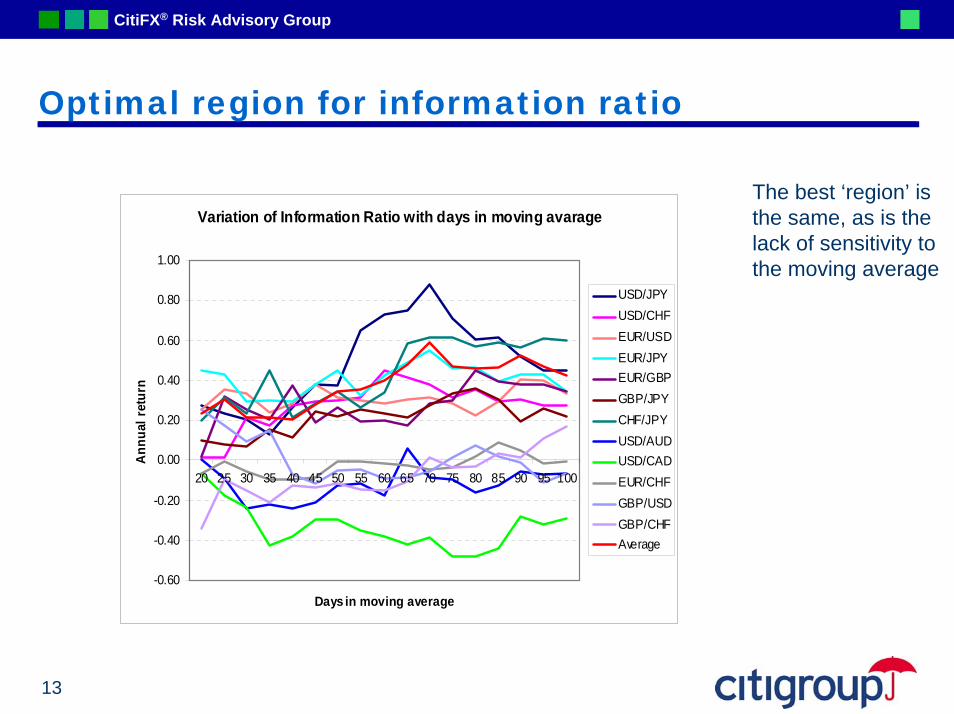
Optimal region for information ratio
The best ‘region’ is the same, as is the lack of sensitivity to the moving average
Variation of Information Ratio with days in moving avarage
-0.60
-0.40
-0.20
0.00
0.20
0.40
0.60
0.80
1.00
20 25 30 35 40 45 50 55 60 65 70 75 80 85 90 95 100
Days in moving average
Ann
ual r
etur
n
USD/JPYUSD/CHFEUR/USDEUR/JPYEUR/GBPGBP/JPYCHF/JPYUSD/AUDUSD/CADEUR/CHFGBP/USDGBP/CHFAverage
CitiFX® Risk Advisory Group
14
Single moving average vs multiple moving average
Strategies with multiple moving averages are popular in the FX modelling world. This is for several reasons. • (1) As a trend establishes itself then the moving averages will gradually cross over the
actual rate and each other, the shorter followed by the longer, until all of them lie below the actual rate. There is thus the possibility to ‘fade in’ and gradually take increasing positions as the trend becomes stronger
• (2) By optimising the fade levels and the numbers of days in the moving averages, backtested returns can be greatly improved over simpler models
• (3)For advisory rather than strict model following approaches, there are a number of different strength signals for trends
While (1) has some merits, (2) has to be regarded with caution because over-optimisation is very easy to achieve with this method• In general, if a currency is not tradable with a simple single moving average, then
‘improving’ its backtested performance by optimising additional moving averages is unlikely to improve returns in the future
• On the other hand, a currency which already works reasonably well with a single MA might have some robust improvements from the introduction of another. Some kind of plateau optimisation should be performed to reduce the chances of over-optimisation.
CitiFX® Risk Advisory Group
15
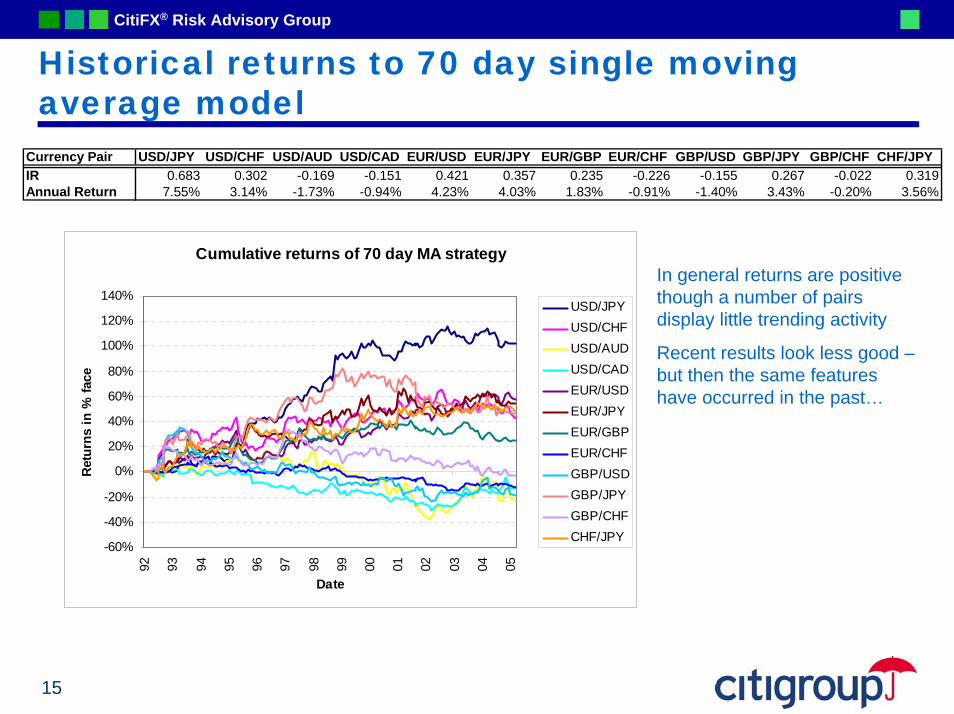
Historical returns to 70 day single moving average model
Currency Pair USD/JPY USD/CHF USD/AUD USD/CAD EUR/USD EUR/JPY EUR/GBP EUR/CHF GBP/USD GBP/JPY GBP/CHF CHF/JPYIR 0.683 0.302 -0.169 -0.151 0.421 0.357 0.235 -0.226 -0.155 0.267 -0.022 0.319Annual Return 7.55% 3.14% -1.73% -0.94% 4.23% 4.03% 1.83% -0.91% -1.40% 3.43% -0.20% 3.56%
Cumulative returns of 70 day MA strategy
-60%
-40%
-20%
0%
20%
40%
60%
80%
100%
120%
140%
92 93 94 95 96 97 98 99 00 01 02 03 04 05
Date
Ret
urns
in %
face
USD/JPYUSD/CHFUSD/AUDUSD/CADEUR/USDEUR/JPYEUR/GBPEUR/CHFGBP/USDGBP/JPYGBP/CHFCHF/JPY
In general returns are positive though a number of pairs display little trending activity
Recent results look less good –but then the same features have occurred in the past…
CitiFX® Risk Advisory Group
16
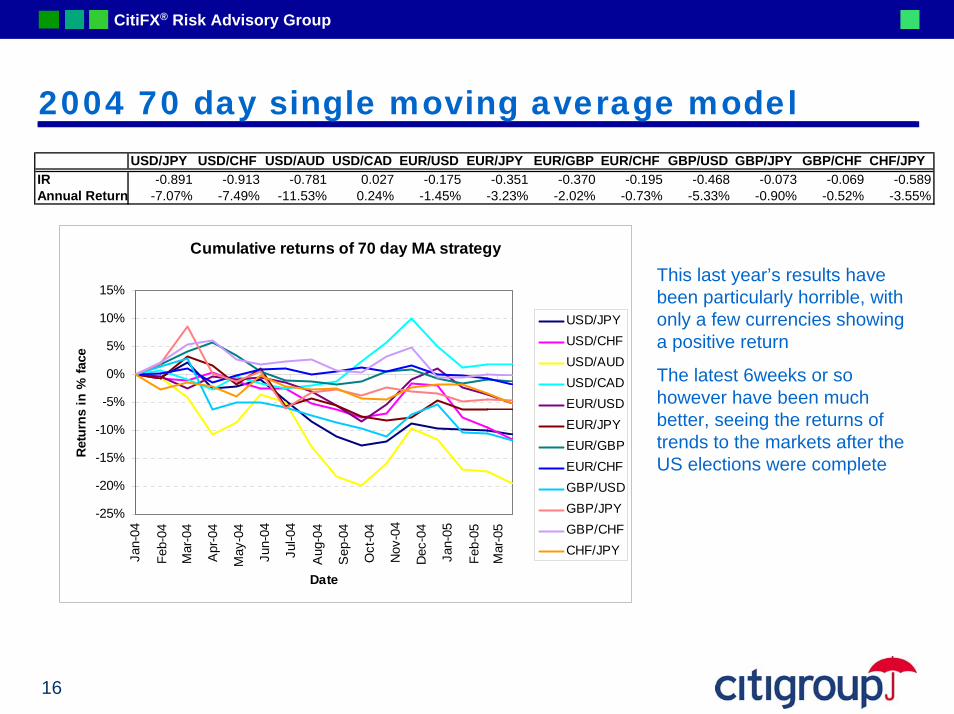
2004 70 day single moving average modelUSD/JPY USD/CHF USD/AUD USD/CAD EUR/USD EUR/JPY EUR/GBP EUR/CHF GBP/USD GBP/JPY GBP/CHF CHF/JPY
IR -0.891 -0.913 -0.781 0.027 -0.175 -0.351 -0.370 -0.195 -0.468 -0.073 -0.069 -0.589Annual Return -7.07% -7.49% -11.53% 0.24% -1.45% -3.23% -2.02% -0.73% -5.33% -0.90% -0.52% -3.55%
Cumulative returns of 70 day MA strategy
-25%
-20%
-15%
-10%
-5%
0%
5%
10%
15%
Jan-
04
Feb-
04
Mar
-04
Apr
-04
May
-04
Jun-
04
Jul-0
4
Aug
-04
Sep
-04
Oct
-04
Nov
-04
Dec
-04
Jan-
05
Feb-
05
Mar
-05
Date
Ret
urns
in %
face
USD/JPYUSD/CHFUSD/AUDUSD/CADEUR/USDEUR/JPYEUR/GBPEUR/CHFGBP/USDGBP/JPYGBP/CHFCHF/JPY
This last year’s results have been particularly horrible, with only a few currencies showing a positive return
The latest 6weeks or so however have been much better, seeing the returns of trends to the markets after the US elections were complete
CitiFX® Risk Advisory Group
In- and out-of-sample tests
The results we find are surprising…
CitiFX® Risk Advisory Group
18
Test methodology – 2-stage approachInitially, we select data periods of different lengths and find the best moving averages, over a variety of currency pairs. • We examine cases from one to four moving averages. • We wish to see what improvement is found in-sample by more moving averages• At some point improvement may be purely due to noise fitting, but we would hope to
be able to detect this point by looking at the magnitude of changes in IR.Next, we find the optimal moving averages for various in-sample periods, and apply them to subsequent out-of-sample periods• This will tell us whether the best moving averages are useful for forecasting purposes• We also hope to gain information about the time period necessary for such
information to emerge• Additionally, we may learn how many moving averages may usefully be extracted
from different data periods and applied to future periods. It is entirely feasible that one could extract 2 useful parameters from a data set of a given length but not 3. In this case we would expect to see in- and out-of-sample results show the smallest difference at the ‘right’ number of parameters
CitiFX® Risk Advisory Group
19
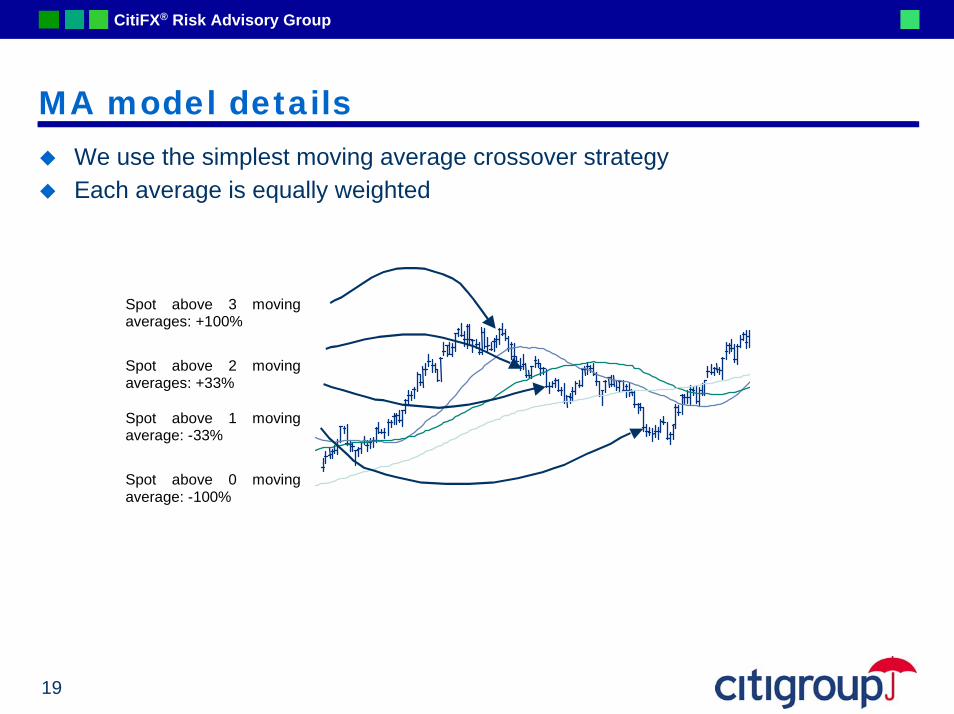
MA model detailsWe use the simplest moving average crossover strategyEach average is equally weighted
Spot above 3 moving averages: +100%
Spot above 2 moving averages: +33%
Spot above 1 moving average: -33%
Spot above 0 moving average: -100%
CitiFX® Risk Advisory Group
20
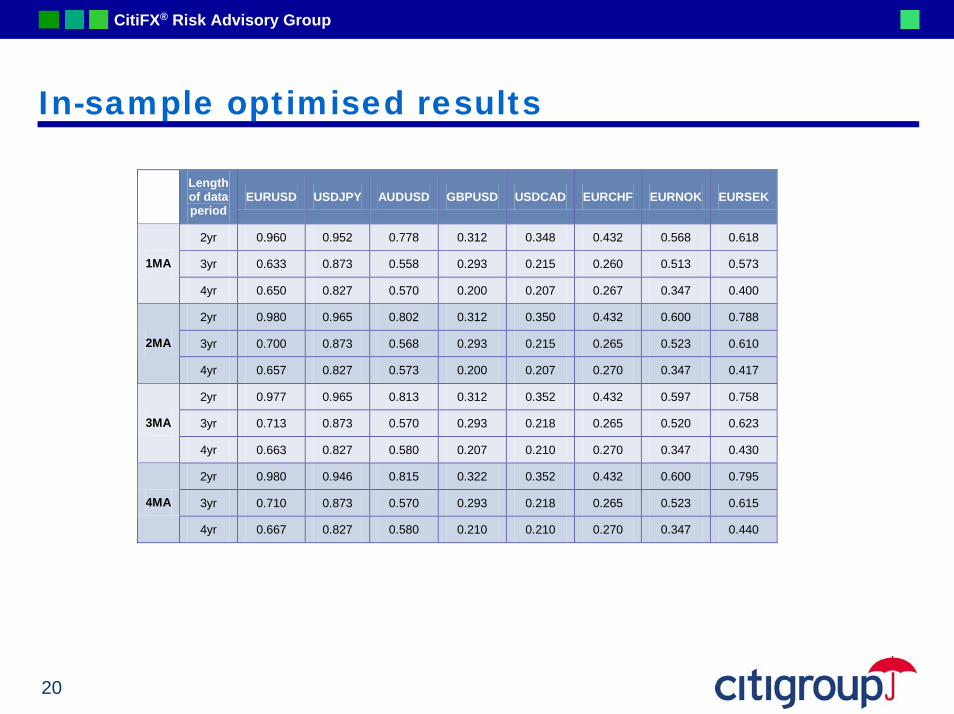
In-sample optimised results
Length of data period
EURUSD USDJPY AUDUSD GBPUSD USDCAD EURCHF EURNOK EURSEK
2yr 0.960 0.952 0.778 0.312 0.348 0.432 0.568 0.618
3yr 0.633 0.873 0.558 0.293 0.215 0.260 0.513 0.573 1MA
4yr 0.650 0.827 0.570 0.200 0.207 0.267 0.347 0.400
2yr 0.980 0.965 0.802 0.312 0.350 0.432 0.600 0.788
3yr 0.700 0.873 0.568 0.293 0.215 0.265 0.523 0.610 2MA
4yr 0.657 0.827 0.573 0.200 0.207 0.270 0.347 0.417
2yr 0.977 0.965 0.813 0.312 0.352 0.432 0.597 0.758
3yr 0.713 0.873 0.570 0.293 0.218 0.265 0.520 0.623 3MA
4yr 0.663 0.827 0.580 0.207 0.210 0.270 0.347 0.430
2yr 0.980 0.946 0.815 0.322 0.352 0.432 0.600 0.795
3yr 0.710 0.873 0.570 0.293 0.218 0.265 0.523 0.615 4MA
4yr 0.667 0.827 0.580 0.210 0.210 0.270 0.347 0.440
CitiFX® Risk Advisory Group
21
In-sample resultsEven in-sample, there is very little to be gained from moving to more than one moving averageThe results in the 4MA section are barely better than those in the 1MA sectionThis begs the question, why do users ever have more than one moving average?• Possibly multiple strategies are easier to trade in that positions are built up gradually
rather than put on all at once. • There seems no reason to do with performance which would lead us to use many
rather than one.The second feature of the table worth discussing is that universally, the IRs are better for the shorter data periodsThis finding is consistent with a lack of stationarity in moving average models
CitiFX® Risk Advisory Group
22
Out-of-sample testing
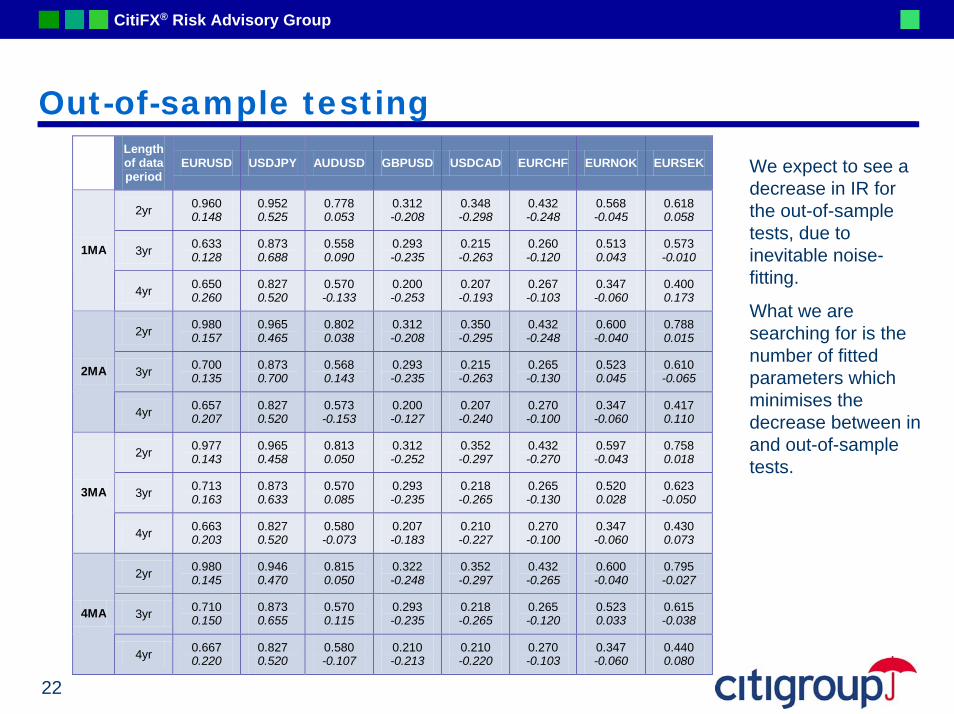
Length of data period
EURUSD USDJPY AUDUSD GBPUSD USDCAD EURCHF EURNOK EURSEK
2yr 0.960 0.148
0.952 0.525
0.778 0.053
0.312 -0.208
0.348 -0.298
0.432 -0.248
0.568 -0.045
0.618 0.058
3yr 0.633 0.128
0.873 0.688
0.558 0.090
0.293 -0.235
0.215 -0.263
0.260 -0.120
0.513 0.043
0.573 -0.010 1MA
4yr 0.650 0.260
0.827 0.520
0.570 -0.133
0.200 -0.253
0.207 -0.193
0.267 -0.103
0.347 -0.060
0.400 0.173
2yr 0.980 0.157
0.965 0.465
0.802 0.038
0.312 -0.208
0.350 -0.295
0.432 -0.248
0.600 -0.040
0.788 0.015
3yr 0.700 0.135
0.873 0.700
0.568 0.143
0.293 -0.235
0.215 -0.263
0.265 -0.130
0.523 0.045
0.610 -0.065 2MA
4yr 0.657 0.207
0.827 0.520
0.573 -0.153
0.200 -0.127
0.207 -0.240
0.270 -0.100
0.347 -0.060
0.417 0.110
2yr 0.977 0.143
0.965 0.458
0.813 0.050
0.312 -0.252
0.352 -0.297
0.432 -0.270
0.597 -0.043
0.758 0.018
3yr 0.713 0.163
0.873 0.633
0.570 0.085
0.293 -0.235
0.218 -0.265
0.265 -0.130
0.520 0.028
0.623 -0.050 3MA
4yr 0.663 0.203
0.827 0.520
0.580 -0.073
0.207 -0.183
0.210 -0.227
0.270 -0.100
0.347 -0.060
0.430 0.073
2yr 0.980 0.145
0.946 0.470
0.815 0.050
0.322 -0.248
0.352 -0.297
0.432 -0.265
0.600 -0.040
0.795 -0.027
3yr 0.710 0.150
0.873 0.655
0.570 0.115
0.293 -0.235
0.218 -0.265
0.265 -0.120
0.523 0.033
0.615 -0.038 4MA
4yr 0.667 0.220
0.827 0.520
0.580 -0.107
0.210 -0.213
0.210 -0.220
0.270 -0.103
0.347 -0.060
0.440 0.080
We expect to see a decrease in IR for the out-of-sample tests, due to inevitable noise-fitting.
What we are searching for is the number of fitted parameters which minimises the decrease between in and out-of-sample tests.
CitiFX® Risk Advisory Group
23
Out-of-sample resultsUnfortunately, it is not possible to draw any firm conclusions about the ideal number of parameters in a trend modelIt can be said that nothing performs significantly better out-of-sample than the 1MA modelThere are only two currency pairs for which the out-of-sample results are significantly positive• USD/JPY yields good information ratios both in and out-of-sample• EUR/USD results are also all positive for out of sample periods, though not quite as
highThe results for the other currency pairs are either negative or little different from zero for all out-of-sample periods, regardless of the number of MAs used or the length of the sample under test
CitiFX® Risk Advisory Group
24
Is trend dead??We find that to our surprise there is no evidence that more than one moving average is useful or necessaryOnly USD/JPY and EUR/USD show positive out-of-sample results for any trend strategy variant! This does not necessarily mean that trend models are useless for currency pairs other than these two, but it does suggest that they should not be applied blindlyAn indicator which allowed investors to judge when trend models were likely to work or not would undoubtedly improve their performanceOur results indicate that investors should think carefully when designing trend-following strategies, and use these techniques in conjunction with other signals rather than as simple stand-alone strategies.
CitiFX® Risk Advisory Group
A Model Example
Combining trend and option strategies to enhance the results
CitiFX® Risk Advisory Group
26
Trends and optionsSelling options – carefully – seems to work but only in certain currenciesSimilarly, using trend following models has for decades been a robust and successful strategy – but not for all currencies• Anything with the JPY in it seems to follow trends with great enthusiasm, but some
currencies like USD/CAD have proved to be almost impossible to trade in a trend following way.
We investigated the joint behaviour of the two strategy types and show that some interesting portfolios may be constructed.
CitiFX® Risk Advisory Group
27
Simple trend following strategiesWe look at the results of the simplest possible trend following strategy – that of a single moving averageBy buying when the rate was above a simple arithmetic moving average, and selling when it was below, we obtained a P/L curve for the trading strategy since the start of the data set, in 1988We looked at every length of moving average strategy from 5 to 130 days.
CitiFX® Risk Advisory Group
28
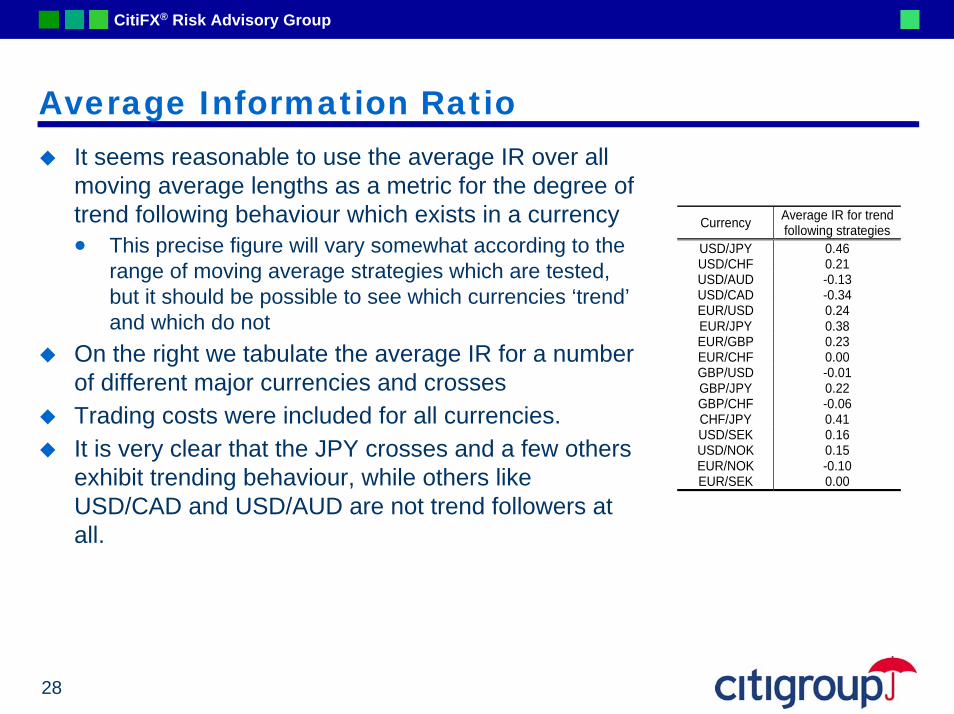
Average Information RatioIt seems reasonable to use the average IR over all moving average lengths as a metric for the degree of trend following behaviour which exists in a currency• This precise figure will vary somewhat according to the
range of moving average strategies which are tested, but it should be possible to see which currencies ‘trend’ and which do not
On the right we tabulate the average IR for a number of different major currencies and crossesTrading costs were included for all currencies.It is very clear that the JPY crosses and a few others exhibit trending behaviour, while others like USD/CAD and USD/AUD are not trend followers at all.
Currency Average IR for trend following strategies
USD/JPY 0.46 USD/CHF 0.21 USD/AUD -0.13 USD/CAD -0.34 EUR/USD 0.24 EUR/JPY 0.38 EUR/GBP 0.23 EUR/CHF 0.00 GBP/USD -0.01 GBP/JPY 0.22 GBP/CHF -0.06 CHF/JPY 0.41 USD/SEK 0.16 USD/NOK 0.15 EUR/NOK -0.10 EUR/SEK 0.00
CitiFX® Risk Advisory Group
29
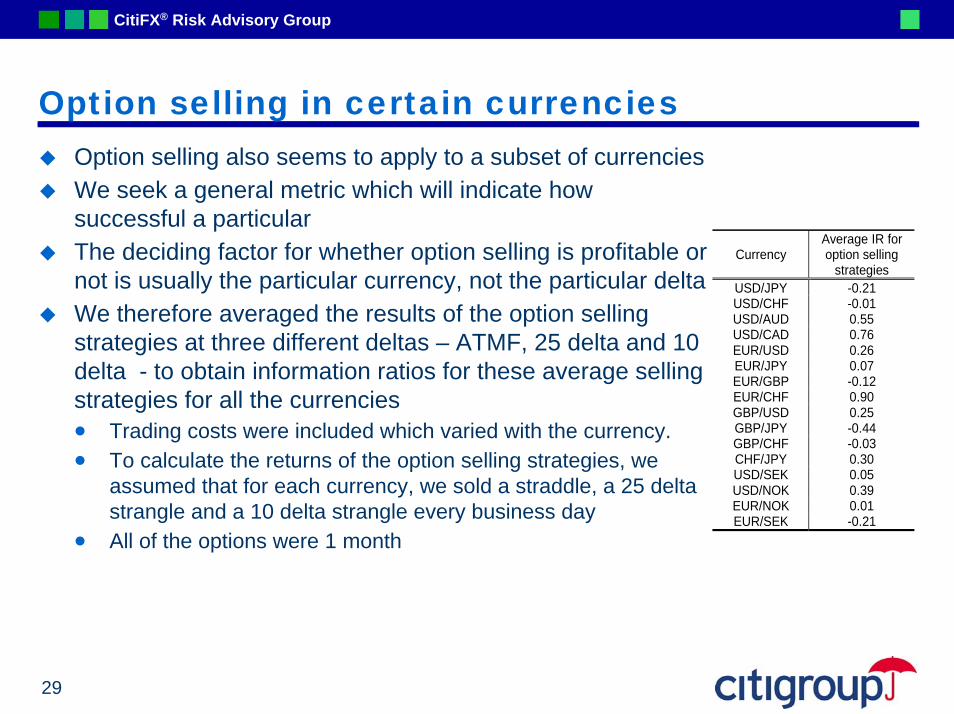
Option selling in certain currenciesOption selling also seems to apply to a subset of currenciesWe seek a general metric which will indicate how successful a particular The deciding factor for whether option selling is profitable or not is usually the particular currency, not the particular deltaWe therefore averaged the results of the option selling strategies at three different deltas – ATMF, 25 delta and 10 delta - to obtain information ratios for these average selling strategies for all the currencies• Trading costs were included which varied with the currency. • To calculate the returns of the option selling strategies, we
assumed that for each currency, we sold a straddle, a 25 delta strangle and a 10 delta strangle every business day
• All of the options were 1 month
Currency Average IR for option selling
strategies USD/JPY -0.21 USD/CHF -0.01 USD/AUD 0.55 USD/CAD 0.76 EUR/USD 0.26 EUR/JPY 0.07 EUR/GBP -0.12 EUR/CHF 0.90 GBP/USD 0.25 GBP/JPY -0.44 GBP/CHF -0.03 CHF/JPY 0.30 USD/SEK 0.05 USD/NOK 0.39 EUR/NOK 0.01 EUR/SEK -0.21
CitiFX® Risk Advisory Group
30
Comparing option selling and trend following
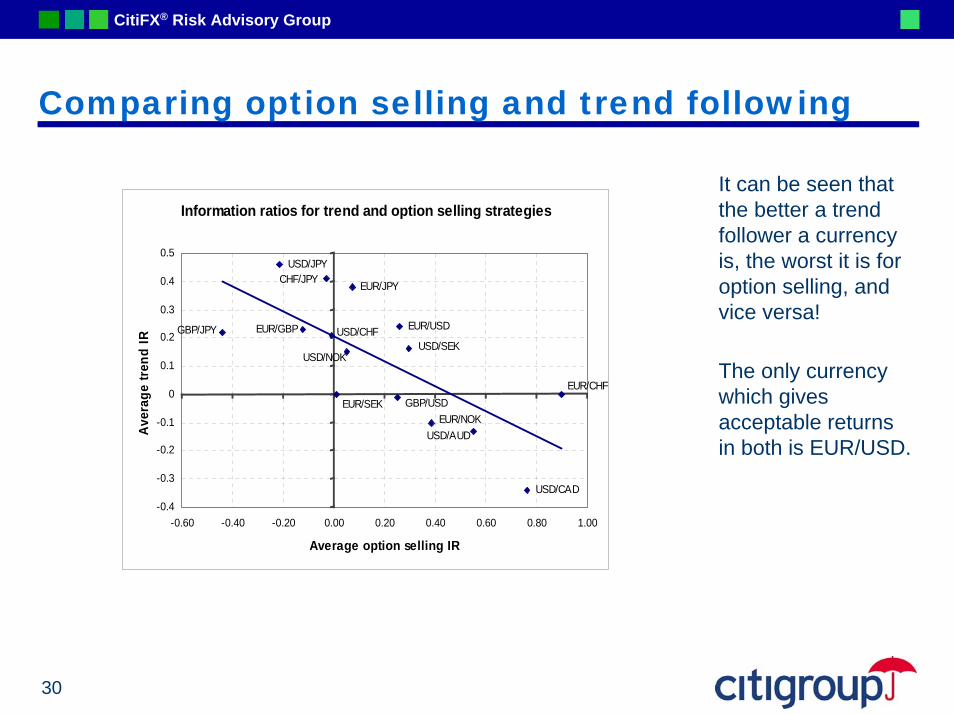
It can be seen that the better a trend follower a currency is, the worst it is for option selling, and vice versa!
The only currency which gives acceptable returns in both is EUR/USD.
Information ratios for trend and option selling strategies
CHF/JPY
GBP/USD
USD/NOK
USD/CHFEUR/GBPGBP/JPY EUR/USD
EUR/JPY
USD/SEK
USD/JPY
EUR/NOK
EUR/CHFEUR/SEK
USD/CAD
USD/AUD
-0.4
-0.3
-0.2
-0.1
0
0.1
0.2
0.3
0.4
0.5
-0.60 -0.40 -0.20 0.00 0.20 0.40 0.60 0.80 1.00
Average option selling IR
Aver
age
tren
d IR
CitiFX® Risk Advisory Group
31
Combining the two strategies into a portfolioThe previous graph strongly suggests that the returns of the two strategy types might well be anticorrelatedWe need to select specific examples of the two to useFor each trend following currency, we chose a 65 day moving average, and for each option selling currencies, we selected the 25 delta systematic selling strategy• These particular parameter values were selected as being representative of their
respective strategy types, rather than because they were optimal• It should be noted that this choice means that the precise trend following or option
selling strategies are not necessarily the optimal ones for their individual currencies.• However, selecting these very general parameters means that the results are also
generally applicable and would be expected to hold under a variety of scenarios.
CitiFX® Risk Advisory Group
32
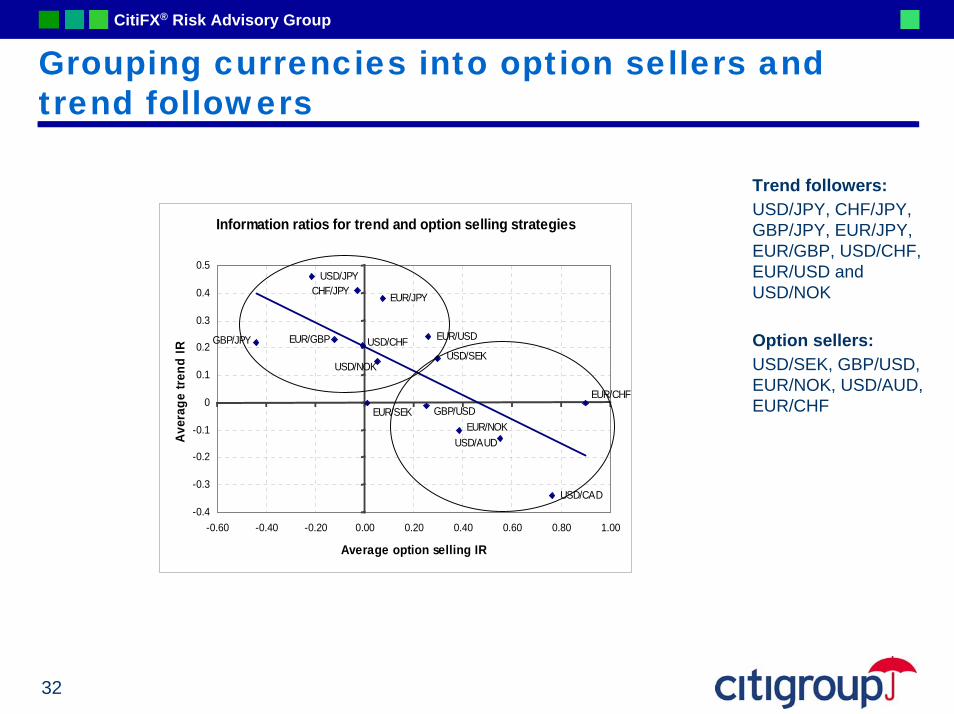
Grouping currencies into option sellers and trend followers
Trend followers:USD/JPY, CHF/JPY, GBP/JPY, EUR/JPY, EUR/GBP, USD/CHF, EUR/USD and USD/NOK
Option sellers: USD/SEK, GBP/USD, EUR/NOK, USD/AUD, EUR/CHF
Information ratios for trend and option selling strategies
CHF/JPY
GBP/USD
USD/NOK
USD/CHFEUR/GBPGBP/JPY EUR/USD
EUR/JPY
USD/SEK
USD/JPY
EUR/NOK
EUR/CHFEUR/SEK
USD/CAD
USD/AUD
-0.4
-0.3
-0.2
-0.1
0
0.1
0.2
0.3
0.4
0.5
-0.60 -0.40 -0.20 0.00 0.20 0.40 0.60 0.80 1.00
Average option selling IR
Aver
age
trend
IR
CitiFX® Risk Advisory Group
33
New portfolio using appropriate strategies for their currencies
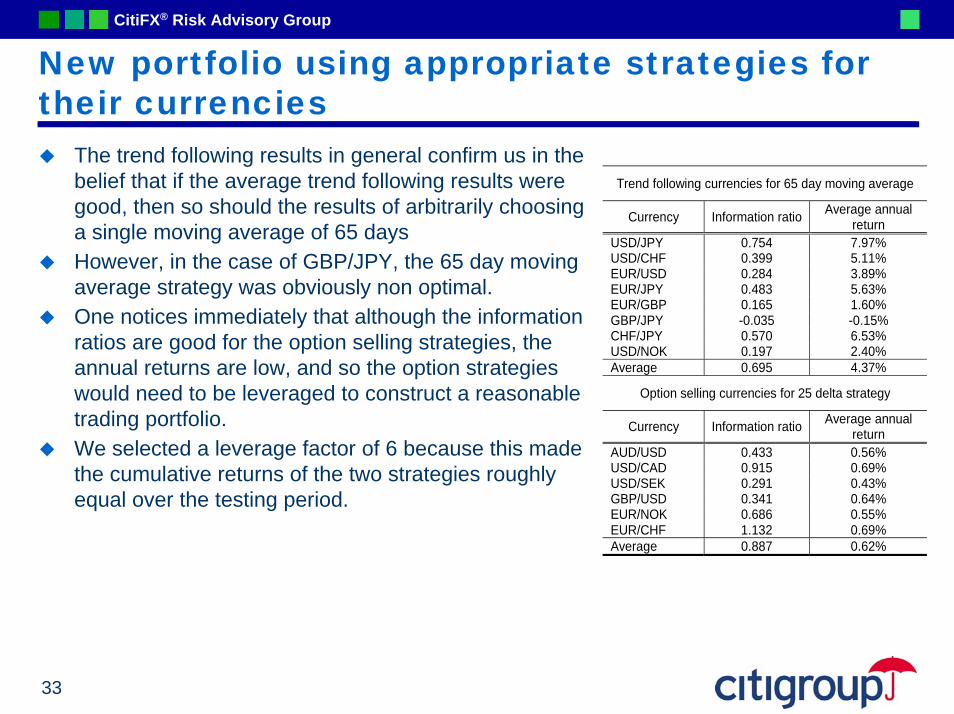
The trend following results in general confirm us in the belief that if the average trend following results were good, then so should the results of arbitrarily choosing a single moving average of 65 daysHowever, in the case of GBP/JPY, the 65 day moving average strategy was obviously non optimal.One notices immediately that although the information ratios are good for the option selling strategies, the annual returns are low, and so the option strategies would need to be leveraged to construct a reasonable trading portfolio. We selected a leverage factor of 6 because this made the cumulative returns of the two strategies roughly equal over the testing period.
Trend following currencies for 65 day moving average
Currency Information ratio Average annual return
USD/JPY 0.754 7.97% USD/CHF 0.399 5.11% EUR/USD 0.284 3.89% EUR/JPY 0.483 5.63% EUR/GBP 0.165 1.60% GBP/JPY -0.035 -0.15% CHF/JPY 0.570 6.53% USD/NOK 0.197 2.40% Average 0.695 4.37%
Option selling currencies for 25 delta strategy
Currency Information ratio Average annual return
AUD/USD 0.433 0.56% USD/CAD 0.915 0.69% USD/SEK 0.291 0.43% GBP/USD 0.341 0.64% EUR/NOK 0.686 0.55% EUR/CHF 1.132 0.69% Average 0.887 0.62%
CitiFX® Risk Advisory Group
34
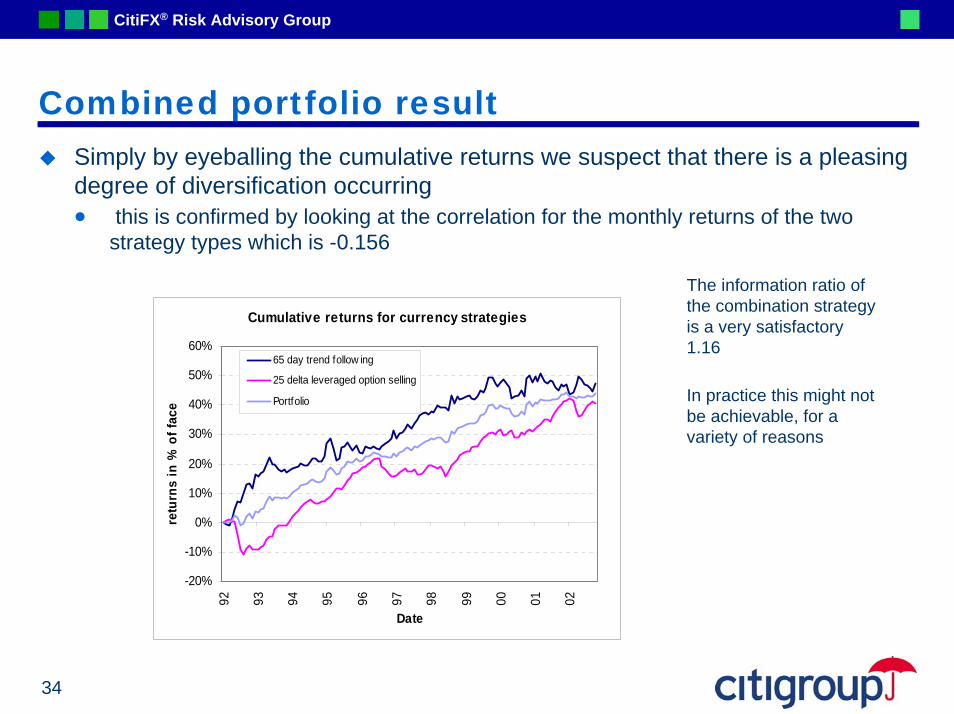
Combined portfolio resultSimply by eyeballing the cumulative returns we suspect that there is a pleasing degree of diversification occurring• this is confirmed by looking at the correlation for the monthly returns of the two
strategy types which is -0.156
The information ratio of the combination strategy is a very satisfactory 1.16
In practice this might not be achievable, for a variety of reasons
Cumulative returns for currency strategies
-20%
-10%
0%
10%
20%
30%
40%
50%
60%
92 93 94 95 96 97 98 99 00 01 02
Date
retu
rns
in %
of f
ace
65 day trend follow ing
25 delta leveraged option selling
Portfolio
CitiFX® Risk Advisory Group
35
Stationarity of behaviourA legitimate concern with this type of strategy is that the alpha-generating behaviour does not persist, and will not be there to exploit in the futureThese concerns may be minimised by using as little optimisation as possible, which we have done • there is only one moving average used for the whole time period, and only one option
selling strategyAlso, for those currencies which ‘work’ as either trend followers or option sellers, they seem to deliver a roughly constant performance over past yearsThere is nothing to suggest that results for 92 – 97 would be significantly different from results from 97 – 02.
CitiFX® Risk Advisory Group
Trend-option switching strategy
Using implied volatilty to say when to trend, and when to sell vol
CitiFX® Risk Advisory Group
37
The best of trends and optionsIt seems that these strategy types are mutual oppositesbut.... some currencies which are in general non trending have trending ‘periods’some currencies which don’t do well overall selling vol have profitable option selling periods.We wish to find a ‘switch’ to go from one strategy type to the otherAn obvious one to try is volatility
CitiFX® Risk Advisory Group
38
Which options? Which vol switch?We do not wish to get hurt by the switch to trend when holding written optionsThus short options are bestWeekly options are those which we have the best data for
Weekly vol however is too date-affected to use as a switchBut we find that all of 1, 2, 3, 6 month vols work well!
CitiFX® Risk Advisory Group
39
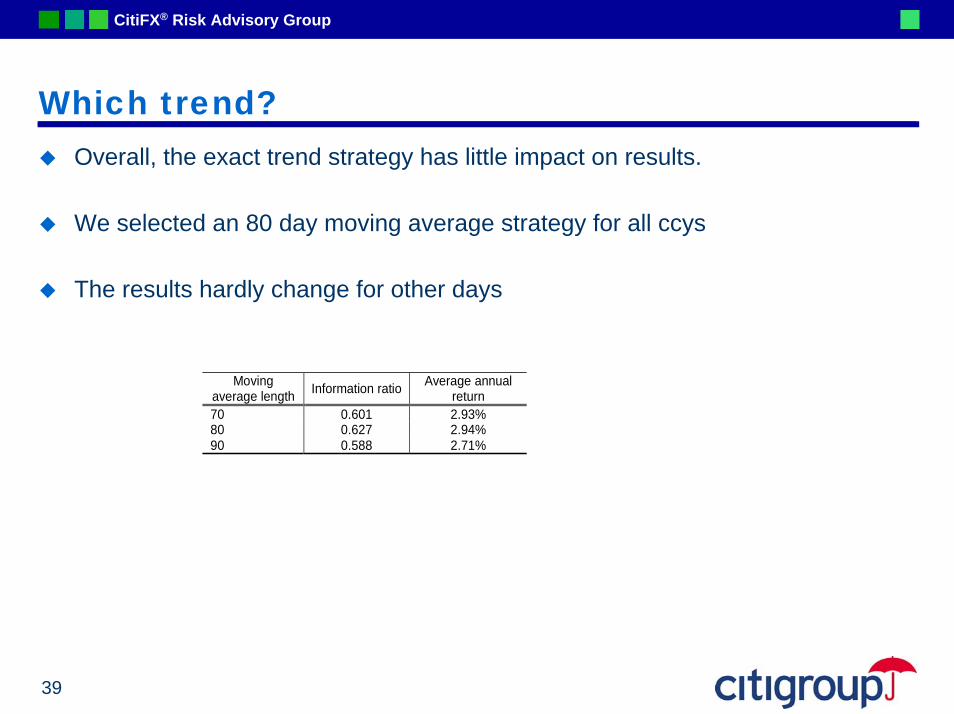
Which trend?Overall, the exact trend strategy has little impact on results.
We selected an 80 day moving average strategy for all ccys
The results hardly change for other days
Moving average length Information ratio Average annual
return 70 0.601 2.93% 80 0.627 2.94% 90 0.588 2.71%
CitiFX® Risk Advisory Group
40
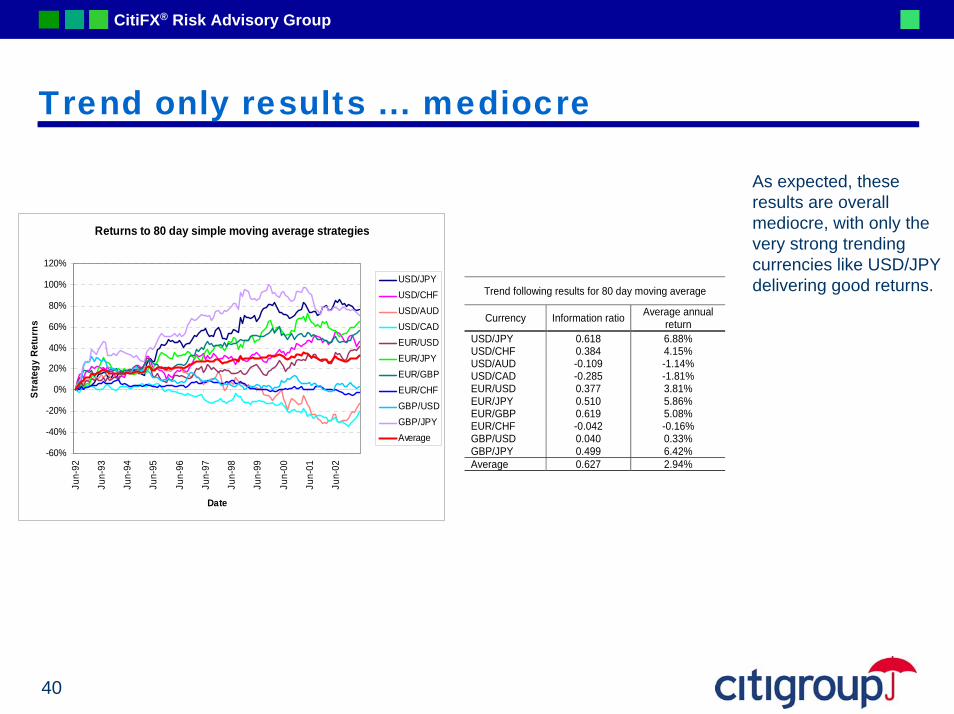
Trend only results ... mediocre
Returns to 80 day simple moving average strategies
-60%
-40%
-20%
0%
20%
40%
60%
80%
100%
120%
Jun-
92
Jun-
93
Jun-
94
Jun-
95
Jun-
96
Jun-
97
Jun-
98
Jun-
99
Jun-
00
Jun-
01
Jun-
02
Date
Stra
tegy
Ret
urns
USD/JPYUSD/CHFUSD/AUDUSD/CADEUR/USDEUR/JPYEUR/GBPEUR/CHFGBP/USDGBP/JPYAverage
As expected, these results are overall mediocre, with only the very strong trending currencies like USD/JPY delivering good returns. Trend following results for 80 day moving average
Currency Information ratio Average annual return
USD/JPY 0.618 6.88% USD/CHF 0.384 4.15% USD/AUD -0.109 -1.14% USD/CAD -0.285 -1.81% EUR/USD 0.377 3.81% EUR/JPY 0.510 5.86% EUR/GBP 0.619 5.08% EUR/CHF -0.042 -0.16% GBP/USD 0.040 0.33% GBP/JPY 0.499 6.42% Average 0.627 2.94%
CitiFX® Risk Advisory Group
41
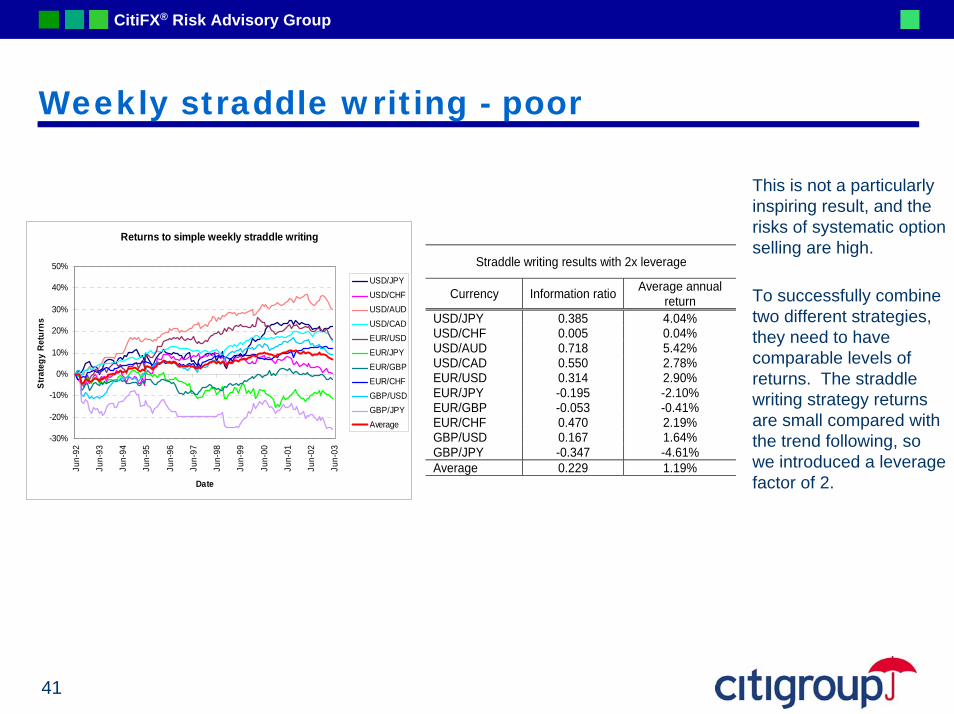
Weekly straddle writing - poor
Returns to simple weekly straddle writing
-30%
-20%
-10%
0%
10%
20%
30%
40%
50%
Jun-
92
Jun-
93
Jun-
94
Jun-
95
Jun-
96
Jun-
97
Jun-
98
Jun-
99
Jun-
00
Jun-
01
Jun-
02
Jun-
03
Date
Stra
tegy
Ret
urns
USD/JPYUSD/CHFUSD/AUDUSD/CADEUR/USDEUR/JPYEUR/GBPEUR/CHFGBP/USDGBP/JPYAverage
Straddle writing results with 2x leverage
Currency Information ratio Average annual return
USD/JPY 0.385 4.04% USD/CHF 0.005 0.04% USD/AUD 0.718 5.42% USD/CAD 0.550 2.78% EUR/USD 0.314 2.90% EUR/JPY -0.195 -2.10% EUR/GBP -0.053 -0.41% EUR/CHF 0.470 2.19% GBP/USD 0.167 1.64% GBP/JPY -0.347 -4.61% Average 0.229 1.19%
This is not a particularly inspiring result, and the risks of systematic option selling are high.
To successfully combine two different strategies, they need to have comparable levels of returns. The straddle writing strategy returns are small compared with the trend following, so we introduced a leverage factor of 2.
CitiFX® Risk Advisory Group
42
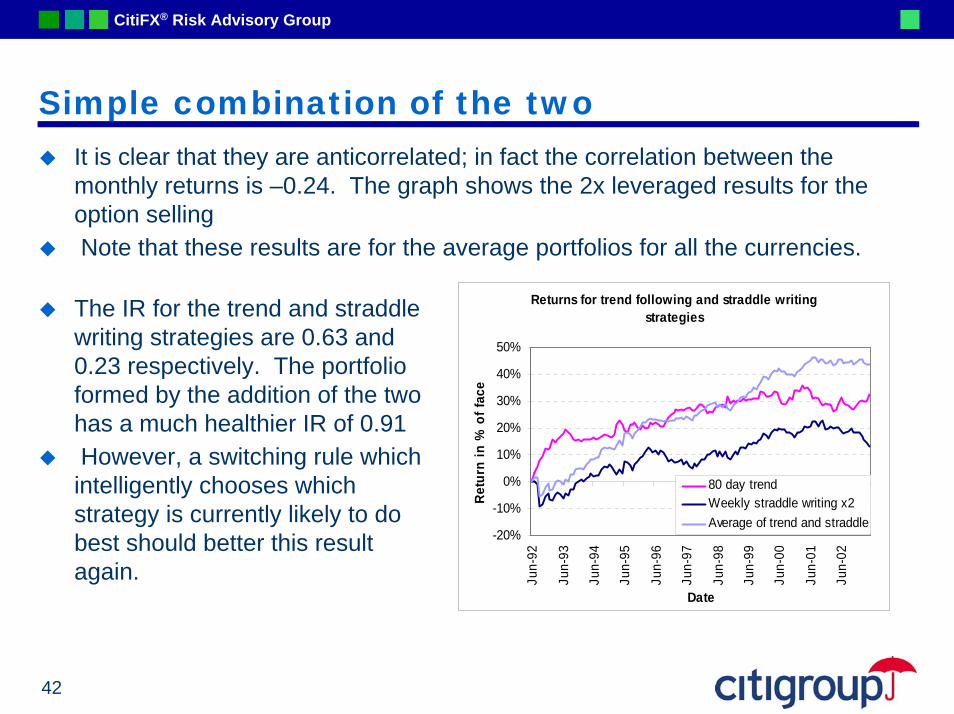
Simple combination of the twoIt is clear that they are anticorrelated; in fact the correlation between the monthly returns is –0.24. The graph shows the 2x leveraged results for the option sellingNote that these results are for the average portfolios for all the currencies.
Returns for trend following and straddle writing strategies
-20%
-10%
0%
10%
20%
30%
40%
50%
Jun-
92
Jun-
93
Jun-
94
Jun-
95
Jun-
96
Jun-
97
Jun-
98
Jun-
99
Jun-
00
Jun-
01
Jun-
02
Date
Ret
urn
in %
of f
ace
80 day trendWeekly straddle writing x2Average of trend and straddle
The IR for the trend and straddle writing strategies are 0.63 and 0.23 respectively. The portfolio formed by the addition of the two has a much healthier IR of 0.91However, a switching rule which intelligently chooses which strategy is currently likely to do best should better this result again.
CitiFX® Risk Advisory Group
43
Detailed strategy rules for switching1. Is 1m ATM volatility above the trailing 5 year average?2. If yes, sell a 1 week straddle every day with notional 2/5P (the factor of 2 comes from the leverage, the factor of 1/5 from the fact that we are dealing a 5 day product every day and need to normalise)3. If no, check whether the FX spot rate is above its 80 day trailing moving average4. If it is above, take a long position with notional amount P5. If it is below, take a short position with notional amount P6. If the 1m ATM volatility is initially below and rises above its trailing 5 year average, neutralise the spot position and sell a straddle7. If the 1m ATM volatility is initially above and falls below its trailing 5 year average, do not cut out the option position but allow it to expire. However, immediately put on a long or a short spot position to trend follow with the 80 day moving average.
CitiFX® Risk Advisory Group
44
Strategy implementationOption positions are allowed to expire naturally even when they are no longer appropriate – this is because the high costs of unwinding an oddly dated and probably out of the money option position are not worthwhile.
What actually happens in the market at the trend/volatility selling switchover points?
When the 1m implied volatility falls below its trailing average, there is a good chance that a trend will be starting or in place. But because volatility is low, the trend will in all likelihood not start aggressively.
CitiFX® Risk Advisory Group
45
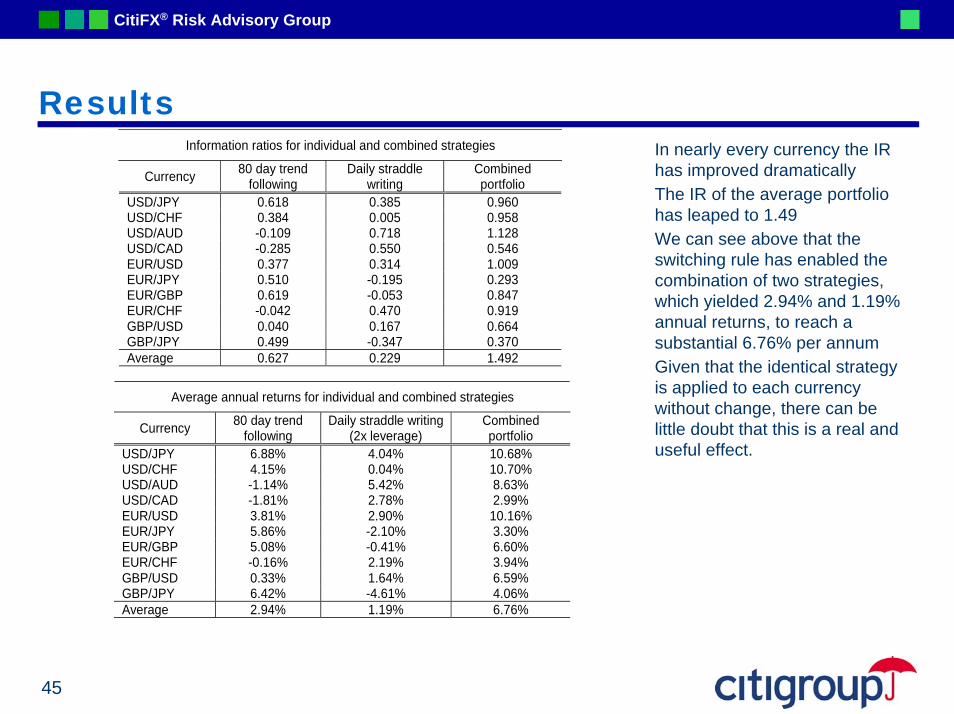
ResultsInformation ratios for individual and combined strategies
Currency 80 day trend following
Daily straddle writing
Combined portfolio
USD/JPY 0.618 0.385 0.960 USD/CHF 0.384 0.005 0.958 USD/AUD -0.109 0.718 1.128 USD/CAD -0.285 0.550 0.546 EUR/USD 0.377 0.314 1.009 EUR/JPY 0.510 -0.195 0.293 EUR/GBP 0.619 -0.053 0.847 EUR/CHF -0.042 0.470 0.919 GBP/USD 0.040 0.167 0.664 GBP/JPY 0.499 -0.347 0.370 Average 0.627 0.229 1.492
Average annual returns for individual and combined strategies
Currency 80 day trend following
Daily straddle writing (2x leverage)
Combined portfolio
USD/JPY 6.88% 4.04% 10.68% USD/CHF 4.15% 0.04% 10.70% USD/AUD -1.14% 5.42% 8.63% USD/CAD -1.81% 2.78% 2.99% EUR/USD 3.81% 2.90% 10.16% EUR/JPY 5.86% -2.10% 3.30% EUR/GBP 5.08% -0.41% 6.60% EUR/CHF -0.16% 2.19% 3.94% GBP/USD 0.33% 1.64% 6.59% GBP/JPY 6.42% -4.61% 4.06% Average 2.94% 1.19% 6.76%
In nearly every currency the IR has improved dramaticallyThe IR of the average portfolio has leaped to 1.49We can see above that the switching rule has enabled the combination of two strategies, which yielded 2.94% and 1.19% annual returns, to reach a substantial 6.76% per annumGiven that the identical strategy is applied to each currency without change, there can be little doubt that this is a real and useful effect.
CitiFX® Risk Advisory Group
46
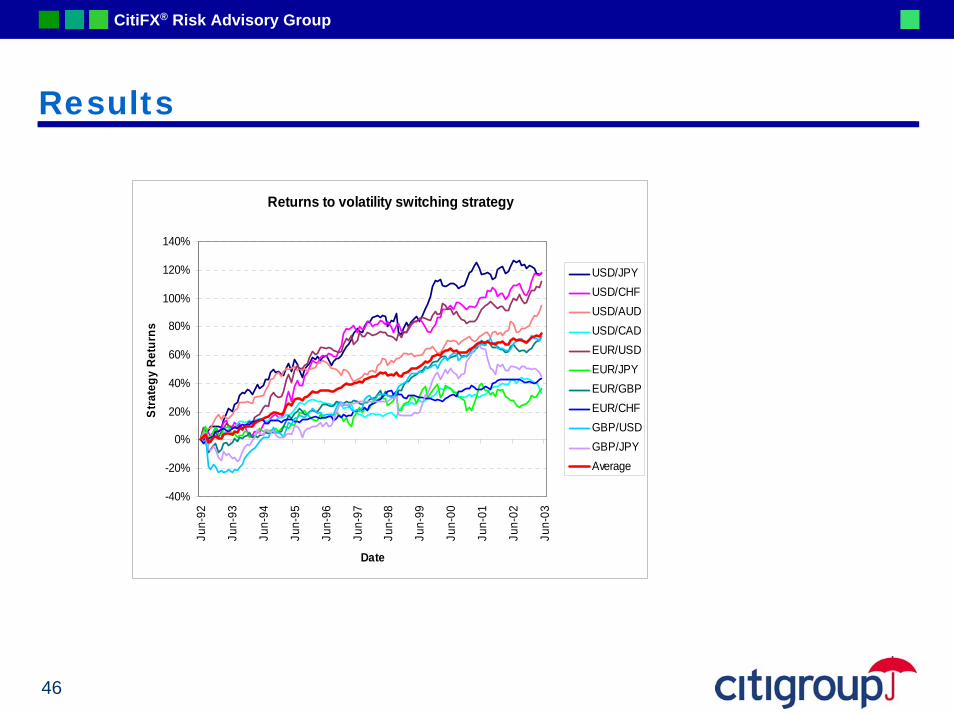
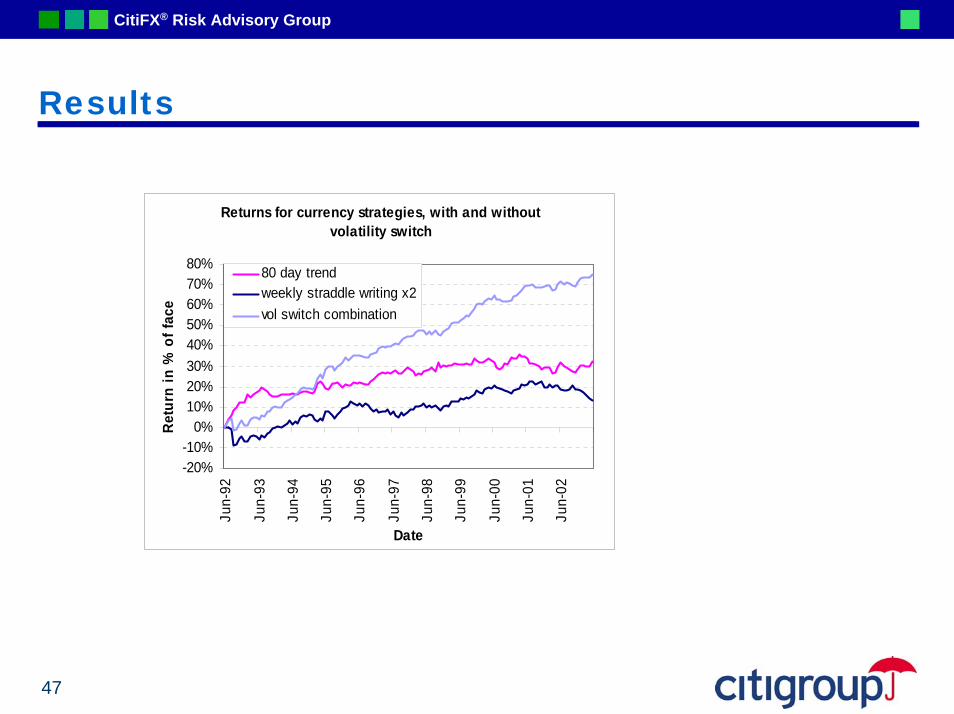
Results
Returns to volatility switching strategy
-40%
-20%
0%
20%
40%
60%
80%
100%
120%
140%
Jun-
92
Jun-
93
Jun-
94
Jun-
95
Jun-
96
Jun-
97
Jun-
98
Jun-
99
Jun-
00
Jun-
01
Jun-
02
Jun-
03Date
Stra
tegy
Ret
urns
USD/JPYUSD/CHFUSD/AUDUSD/CADEUR/USDEUR/JPYEUR/GBPEUR/CHFGBP/USDGBP/JPYAverage
CitiFX® Risk Advisory Group
47
Results
Returns for currency strategies, with and without volatility switch
-20%-10%
0%10%20%30%40%50%60%70%80%
Jun-
92
Jun-
93
Jun-
94
Jun-
95
Jun-
96
Jun-
97
Jun-
98
Jun-
99
Jun-
00
Jun-
01
Jun-
02
Date
Retu
rn in
% o
f fac
e
80 day trendweekly straddle writing x2vol switch combination
CitiFX® Risk Advisory Group
48
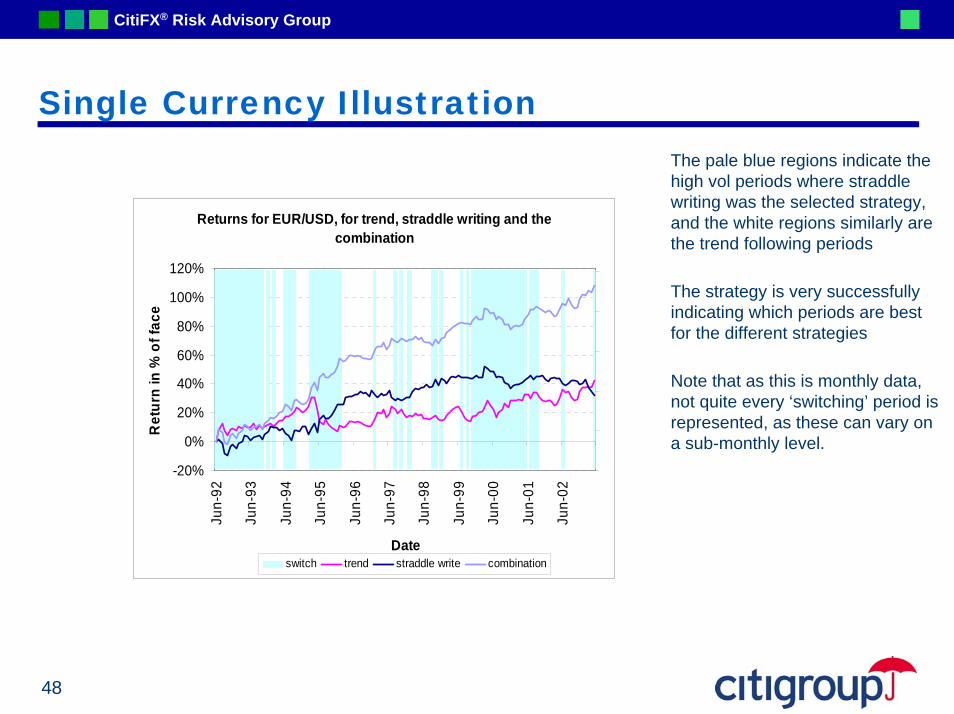
Single Currency IllustrationThe pale blue regions indicate the high vol periods where straddle writing was the selected strategy, and the white regions similarly are the trend following periods
The strategy is very successfully indicating which periods are best for the different strategies
Note that as this is monthly data, not quite every ‘switching’ period is represented, as these can vary on a sub-monthly level.
Returns for EUR/USD, for trend, straddle writing and the combination
-20%
0%
20%
40%
60%
80%
100%
120%
Jun-
92
Jun-
93
Jun-
94
Jun-
95
Jun-
96
Jun-
97
Jun-
98
Jun-
99
Jun-
00
Jun-
01
Jun-
02Date
Ret
urn
in %
of f
ace
switch trend straddle write combination
CitiFX® Risk Advisory Group
49
This document does not represent an accounting opinion. The Company should consult with their auditing firm for further accounting opinion on the proposed transactions.
ADDITIONAL INFORMATION AVAILABLE UPON REQUESTCitibank, N.A., London Branch and Citigroup Global Markets Inc, including their parent, subsidiaries and/or affiliates (“the Firm”), may make a market in the securities discussed in this report and may sell to or buy from customers, as principal, securities recommended in this report. The Firm may have a position in securities or options of any issuer recommended in this report. An employee of the Firm may be a director of an issuer recommended in this report. The Firm may perform or solicit investment banking or other services from any issuer recommended in this report.Although information has been obtained from and is based upon sources the Firm believes to be reliable, we do not guarantee its accuracy and it may be incomplete or condensed. All opinions and estimates constitute the Firm 's judgement as of the date of the report and are subject to change without notice. This report is for informational purposes only and is not intended as an offer or solicitation for the purchase or sale of a security.This report is distributed in the United Kingdom by Citibank, N.A., London Branch or Citigroup Global Markets Limited, Citigroup Centre, Canada Square, Canary Wharf, London E14 5LB, UK. This material is directed exclusively at market professional and institutional investor customers and is not for distribution to private customers, as defined by the rules of the Financial Services Authority, who should not rely on this material. Moreover, any investment or service to which the material may relate will not be made available to such private customers. This material may relate to investments or services of a person outside of the United Kingdom or to other matters which are not regulated by the Financial Services Authority and further details as to where this may be the case are available upon request in respect of this material. If this publication is being made available in certain provinces of Canada by Citigroup Global Markets (Canada) Inc. ("CGMI Canada"), CGMI Canada has approved this publication. This report was prepared by CGMI and distributed in Japan by NikkoCitigroup Limited, it is being so distributed under license. This report is made available in Australia through Citigroup Global Markets Australia Pty Limited (ABN 64 003 114 832), a Licensed Securities Dealer, and in New Zealand through Citigroup Global Markets New Zealand Limited , a member firm of the New Zealand Stock Exchange. This report does not take into account the investment objectives, financial situation or particular needs of any particular person. Investors should obtain advice based on their own individual circumstances before making an investment decision. Citigroup Global Markets (Pty) Limited is incorporated in the Republic of South Africa (company registration number 2000/025866/07) and its registered office is at Citibank Plaza, 145 West Street , Sandown, Sandton, 2196, Republic of South Africa. The investments and services contained herein are not available to private customers in South Africa. This publication is made available in Singapore through Citigroup Global Markets Singapore Holdings Pte Ltd, a licensed Dealer and Investment Advisor.Citigroup Global Markets Inc. is a member of the Securities Investor Protection Corporation (SIPC). © Citigroup Global Markets Inc., 2003. All rights reserved. Smith Barney is a division and service mark of Citigroup Global Markets Inc. and its affiliates and is used and registered throughout the world. Citigroup and the Umbrella Device are trademarks and service marks of Citicorp and its affiliates and are used and registered throughout the world. CitiFX ® is a service mark of Citicorp, Inc. Nikko is a service mark of Nikko Cordial Corporation. Any unauthorized use, duplication or disclosure is prohibited by law and may result in prosecution.
Issued by Citibank N.A., London Branch is regulated by the UK Financial Services Authority 33 Canada SquareCanary WharfLondon E14 5LB