Embed Size (px)
Citation preview

Attachment A
Trend Data for the WIC Agreement Addenda SFY 2010-2011
The overall purpose of trend data is to track patterns or changes in data over time. For purposes of the WIC Agreement Addenda, trend data is being used to track the performance of the State and Local WIC Programs with respect to seventeen identified program indicators and sub-indicators. The goal for both the State and Local WIC Programs is to implement or enhance activities which improve performance over time for each indicator.
Attached are two reports of WIC Program Quality Assurance Deliverables data. One report is WIC Local Agency specific and the other represents North Carolina state wide data. It may be useful to compare an agency’s performance with respect to the state as a whole. To compare local agency data with other agencies’ data, please refer to the website http://www.nutritionnc.com/wic/wicLAR.htm
Each report includes the following information.
Process Outcome Objectives This column includes a description of the Process Outcome Objectives (POO) data indicators of the WIC Program Quality Assurance Deliverable being assessed.
Trend Data The data displayed in these columns represent nine years of data divided into 3-year time periods (2000 to 2002, 2003 to 2005, and 2006 to 2008) with the average of each three year time period shown.
POO 1A,1B,1C, 4A, and 4B are calendar year (Jan – Dec) data. POO 2A, 2B, 3A, 3B, and 5A, are fiscal year (July – June) data, six months
more recent than calendar year data. POO 5B is fiscal year (July – June) data which is twelve months prior to
other fiscal year data.
% Change from 2000-2008 This column displays the percent change from the first three year period to the most recent three-year time period along with the direction of the change (i.e., increase, decrease or no change).
2008 Data This column displays the most recent year’s data including the numerator (Num) and denominator (Den) counts and the percent. Percentages calculated based on numbers less than 100 can show wide fluctuations from one year to the next.

North CarolinaATTACHMENT A: WIC QUALITY ASSURANCE DELIVERABLES
SFY 20102011 AGREEMENT ADDENDA DATA
Process Outcome Objectives
Percentage of pregnant women enrolled in Medicaid who received prenatal WIC Program services. (1) (2)
Percentage of pregnant women who participated in WIC and received WIC Program services during the first trimester of pregnancy.
Percentage of children less than 12 months of age who were served in the Child Health Clinic and received WIC Program services. (1)
Percentage of children 1 to 5 years of age who were served in the Child Health Clinic and received WIC Program Services. (1)
Percentage of children 1 to 5 years of age enrolled in Medicaid who received WIC Program Services.
Percentage of children less than 12 months of age enrolled in Medicaid who received WIC Program services.
Percentage of postpartum women who participated in WIC during pregnancy and were recertified for WIC by 6 weeks postpartum.
Percentage of women with live term singleton births who received WIC Program services during pregnancy and who gained recommended/excessive/inadequate weight according to the National Academy of Sciences ‐ Institute of Medicine 2009 recommended total weight gain ranges during pregnancy. (3)
Percentage of women who participated in WIC who initiated breastfeeding.
1C.
1A.
2A.
2B.
3A.
3B.
1B.
4B.
5A.
74.7% 71.8%
Num Den Percent
Percentage of children 2 to 4 years of age who received services from the health department and who, according to their Body Mass Index (BMI) for age and gender were:
4A.
Percentage of infants who participated in WIC who were: 5B.
71.5%
56.8%
35.1%
65.2%
86.7%
76.8%
68.0%
31.9%
45.8%
25.0%12.8%
71.2%
54.9%
31.2%
66.3%
86.4%
79.4%
65.7%
31.7%
49.7%
28.5%15.0%
71.0%
71.6%
52.8%
29.5%
68.8%
85.5%
78.2%
65.1%
31.5%
53.9%
32.0%16.7%
‐4.9%
0.1%
‐7.1%
‐16.0%
5.4%
‐1.4%
1.9%
‐4.2%
‐1.1%
17.7%
28.1%30.3%
37,376 51,958 71.9%
58,717 80,783 72.7%
163,200 293,513 55.6%
36,419 121,622 29.9%
48,358 69,469 69.6%
9,143 10,511 87.0%
16,276 20,511 79.4%
58,330 89,904 64.9%
15,835 31.8%49,872
48,467 88,187 55.0%
29,173 89,168 32.7%15,436 89,168 17.3%
46.0%22.1%
46.0%22.5%
0.0%1.5%
46.4%21.9%
22,811 45.7%11,226 22.5%
49,87249,872
At a healthy weight (BMI less than the 85th percentile but at or greater than the 5th percentile) (1)
a.
Overweight (BMI at or above the 85th percentile but less than the 95th percentile)
b.
Underweight (BMI less than the 5th percentile).
c.
Recommended prenatal weight gaina.
Excessive prenatal weight gainb.
Inadequate prenatal weight gainc.
Breastfeeding at 6 weeks of age (1)a.
Breastfeeding at 6 months of ageb.
14.0% 15.4% 15.9% 13.2% 14,633 89,904 16.3%
5.3% 4.3% 3.7% ‐30.8% 3,121 89,904 3.5%
2000 2008 Data
2002to
2003
2005to
2006
2008to
% Change from 2000
to 2008
Obese (BMI at or greater than the 95th percentile).
d.
12.6% 14.6% 15.3% 21.2% 13,820 89,904 15.4%
(2) These data exclude women enrolled in Medicaid only for emergency delivery.
(3) Recommended total prenatal weight gain range by prepregnancy weight category is 28-40 lbs. for underweight women (BMI<18.5); 25-35 lbs. for normal weight women (BMI 18.5 to 24.9); 15-25 lbs. for overweight women (BMI 25 to 29.9); and 11-20 lbs. for obese women (BMI >=30.0): Adapted from the National Academy of Sciences. Weight Gain During Pregnancy: Reexamining the Guidelines. Washington, DC : National Academy Press, 2009.
(1) Item appears also on other WCH Section Agreement Addenda.

Alamance CountyATTACHMENT A: WIC QUALITY ASSURANCE DELIVERABLES
SFY 20102011 AGREEMENT ADDENDA DATA
Process Outcome Objectives
Percentage of pregnant women enrolled in Medicaid who received prenatal WIC Program services. (1) (2)
Percentage of pregnant women who participated in WIC and received WIC Program services during the first trimester of pregnancy.
Percentage of children less than 12 months of age who were served in the Child Health Clinic and received WIC Program services. (1)
Percentage of children 1 to 5 years of age who were served in the Child Health Clinic and received WIC Program Services. (1)
Percentage of children 1 to 5 years of age enrolled in Medicaid who received WIC Program Services.
Percentage of children less than 12 months of age enrolled in Medicaid who received WIC Program services.
Percentage of postpartum women who participated in WIC during pregnancy and were recertified for WIC by 6 weeks postpartum.
Percentage of women with live term singleton births who received WIC Program services during pregnancy and who gained recommended/excessive/inadequate weight according to the National Academy of Sciences ‐ Institute of Medicine 2009 recommended total weight gain ranges during pregnancy. (3)
Percentage of women who participated in WIC who initiated breastfeeding.
1C.
1A.
2A.
2B.
3A.
3B.
1B.
4B.
5A.
74.3% 76.0%
Num Den Percent
Percentage of children 2 to 4 years of age who received services from the health department and who, according to their Body Mass Index (BMI) for age and gender were:
4A.
Percentage of infants who participated in WIC who were: 5B.
73.6%
50.2%
38.9%
29.4%
75.9%
69.2%
67.7%
34.1%
43.0%
26.9%13.3%
73.9%
51.9%
39.3%
37.3%
79.5%
64.3%
62.5%
33.6%
46.6%
30.6%16.2%
76.6%
76.0%
54.0%
42.6%
63.6%
48.1%
55.8%
64.1%
32.7%
48.4%
31.9%17.9%
3.1%
3.3%
7.6%
9.5%
116.5%
‐36.6%
‐19.3%
‐5.3%
‐4.2%
12.6%
18.6%34.3%
662 854 77.5%
1,037 1,339 77.4%
2,661 4,653 57.2%
829 1,976 42.0%
946 1,227 77.1%
5 10 50.0%
23 35 65.7%
792 1,237 64.0%
238 32.1%741
702 1,455 48.2%
461 1,380 33.4%268 1,380 19.4%
44.2%21.6%
45.5%21.8%
2.8%0.8%
47.6%18.9%
335 45.2%168 22.7%
741741
At a healthy weight (BMI less than the 85th percentile but at or greater than the 5th percentile) (1)
a.
Overweight (BMI at or above the 85th percentile but less than the 95th percentile)
b.
Underweight (BMI less than the 5th percentile).
c.
Recommended prenatal weight gaina.
Excessive prenatal weight gainb.
Inadequate prenatal weight gainc.
Breastfeeding at 6 weeks of age (1)a.
Breastfeeding at 6 months of ageb.
14.9% 18.6% 17.9% 20.3% 217 1,237 17.5%
3.3% 2.2% 2.1% ‐35.1% 26 1,237 2.1%
2000 2008 Data
2002to
2003
2005to
2006
2008to
% Change from 2000
to 2008
Obese (BMI at or greater than the 95th percentile).
d.
14.2% 16.7% 15.9% 12.2% 202 1,237 16.3%
(2) These data exclude women enrolled in Medicaid only for emergency delivery.
(3) Recommended total prenatal weight gain range by prepregnancy weight category is 28-40 lbs. for underweight women (BMI<18.5); 25-35 lbs. for normal weight women (BMI 18.5 to 24.9); 15-25 lbs. for overweight women (BMI 25 to 29.9); and 11-20 lbs. for obese women (BMI >=30.0): Adapted from the National Academy of Sciences. Weight Gain During Pregnancy: Reexamining the Guidelines. Washington, DC : National Academy Press, 2009.
(1) Item appears also on other WCH Section Agreement Addenda.

Albemarle Regional Health Services DistrictATTACHMENT A: WIC QUALITY ASSURANCE DELIVERABLES
SFY 20102011 AGREEMENT ADDENDA DATA
Process Outcome Objectives
Percentage of pregnant women enrolled in Medicaid who received prenatal WIC Program services. (1) (2)
Percentage of pregnant women who participated in WIC and received WIC Program services during the first trimester of pregnancy.
Percentage of children less than 12 months of age who were served in the Child Health Clinic and received WIC Program services. (1)
Percentage of children 1 to 5 years of age who were served in the Child Health Clinic and received WIC Program Services. (1)
Percentage of children 1 to 5 years of age enrolled in Medicaid who received WIC Program Services.
Percentage of children less than 12 months of age enrolled in Medicaid who received WIC Program services.
Percentage of postpartum women who participated in WIC during pregnancy and were recertified for WIC by 6 weeks postpartum.
Percentage of women with live term singleton births who received WIC Program services during pregnancy and who gained recommended/excessive/inadequate weight according to the National Academy of Sciences ‐ Institute of Medicine 2009 recommended total weight gain ranges during pregnancy. (3)
Percentage of women who participated in WIC who initiated breastfeeding.
1C.
1A.
2A.
2B.
3A.
3B.
1B.
4B.
5A.
81.8% 80.9%
Num Den Percent
Percentage of children 2 to 4 years of age who received services from the health department and who, according to their Body Mass Index (BMI) for age and gender were:
4A.
Percentage of infants who participated in WIC who were: 5B.
77.1%
68.0%
39.0%
59.0%
78.2%
59.4%
67.2%
31.9%
26.6%
13.6%5.7%
75.3%
61.4%
38.8%
37.6%
72.9%
72.5%
65.2%
32.2%
25.3%
9.6%3.8%
72.3%
72.8%
56.7%
33.7%
37.5%
67.5%
69.8%
64.8%
31.8%
20.4%
9.4%3.3%
‐11.6%
‐5.5%
‐16.6%
‐13.5%
‐36.5%
‐13.7%
17.5%
‐3.6%
‐0.4%
‐23.5%
‐31.1%‐41.5%
522 746 70.0%
747 1,030 72.5%
2,371 3,990 59.4%
667 1,917 34.8%
408 989 41.3%
133 181 73.5%
432 615 70.2%
1,035 1,616 64.0%
188 31.3%601
296 1,246 23.8%
135 1,255 10.8%44 1,255 3.5%
44.1%24.0%
44.6%23.5%
1.2%‐1.7%
43.7%24.1%
261 43.4%152 25.3%
601601
At a healthy weight (BMI less than the 85th percentile but at or greater than the 5th percentile) (1)
a.
Overweight (BMI at or above the 85th percentile but less than the 95th percentile)
b.
Underweight (BMI less than the 5th percentile).
c.
Recommended prenatal weight gaina.
Excessive prenatal weight gainb.
Inadequate prenatal weight gainc.
Breastfeeding at 6 weeks of age (1)a.
Breastfeeding at 6 months of ageb.
12.2% 14.8% 14.6% 20.1% 251 1,616 15.5%
8.5% 5.4% 4.1% ‐51.5% 54 1,616 3.3%
2000 2008 Data
2002to
2003
2005to
2006
2008to
% Change from 2000
to 2008
Obese (BMI at or greater than the 95th percentile).
d.
12.1% 14.5% 16.5% 35.7% 276 1,616 17.1%
(2) These data exclude women enrolled in Medicaid only for emergency delivery.
(3) Recommended total prenatal weight gain range by prepregnancy weight category is 28-40 lbs. for underweight women (BMI<18.5); 25-35 lbs. for normal weight women (BMI 18.5 to 24.9); 15-25 lbs. for overweight women (BMI 25 to 29.9); and 11-20 lbs. for obese women (BMI >=30.0): Adapted from the National Academy of Sciences. Weight Gain During Pregnancy: Reexamining the Guidelines. Washington, DC : National Academy Press, 2009.
(1) Item appears also on other WCH Section Agreement Addenda.

Alexander CountyATTACHMENT A: WIC QUALITY ASSURANCE DELIVERABLES
SFY 20102011 AGREEMENT ADDENDA DATA
Process Outcome Objectives
Percentage of pregnant women enrolled in Medicaid who received prenatal WIC Program services. (1) (2)
Percentage of pregnant women who participated in WIC and received WIC Program services during the first trimester of pregnancy.
Percentage of children less than 12 months of age who were served in the Child Health Clinic and received WIC Program services. (1)
Percentage of children 1 to 5 years of age who were served in the Child Health Clinic and received WIC Program Services. (1)
Percentage of children 1 to 5 years of age enrolled in Medicaid who received WIC Program Services.
Percentage of children less than 12 months of age enrolled in Medicaid who received WIC Program services.
Percentage of postpartum women who participated in WIC during pregnancy and were recertified for WIC by 6 weeks postpartum.
Percentage of women with live term singleton births who received WIC Program services during pregnancy and who gained recommended/excessive/inadequate weight according to the National Academy of Sciences ‐ Institute of Medicine 2009 recommended total weight gain ranges during pregnancy. (3)
Percentage of women who participated in WIC who initiated breastfeeding.
1C.
1A.
2A.
2B.
3A.
3B.
1B.
4B.
5A.
80.5% 74.3%
Num Den Percent
Percentage of children 2 to 4 years of age who received services from the health department and who, according to their Body Mass Index (BMI) for age and gender were:
4A.
Percentage of infants who participated in WIC who were: 5B.
77.2%
63.1%
47.4%
33.3%
96.8%
83.7%
61.0%
34.5%
24.3%
16.8%5.1%
79.1%
63.5%
44.5%
28.8%
96.0%
82.8%
61.2%
27.0%
30.3%
26.9%15.7%
71.5%
76.4%
59.6%
37.0%
76.7%
98.3%
90.0%
68.1%
31.5%
46.9%
28.1%16.6%
‐11.1%
‐0.9%
‐5.6%
‐21.8%
130.0%
1.6%
7.5%
11.5%
‐8.9%
93.2%
66.7%227.6%
157 210 74.8%
213 264 80.7%
555 966 57.5%
131 345 38.0%
188 234 80.3%
23 23 100.0%
36 40 90.0%
253 363 69.7%
60 29.6%203
148 305 48.5%
93 320 29.1%46 320 14.4%
44.8%20.7%
47.4%21.2%
5.8%2.3%
47.7%25.4%
108 53.2%35 17.2%
203203
At a healthy weight (BMI less than the 85th percentile but at or greater than the 5th percentile) (1)
a.
Overweight (BMI at or above the 85th percentile but less than the 95th percentile)
b.
Underweight (BMI less than the 5th percentile).
c.
Recommended prenatal weight gaina.
Excessive prenatal weight gainb.
Inadequate prenatal weight gainc.
Breastfeeding at 6 weeks of age (1)a.
Breastfeeding at 6 months of ageb.
17.9% 17.3% 15.1% ‐16.1% 51 363 14.0%
4.8% 4.5% 3.1% ‐35.6% 10 363 2.8%
2000 2008 Data
2002to
2003
2005to
2006
2008to
% Change from 2000
to 2008
Obese (BMI at or greater than the 95th percentile).
d.
16.3% 17.1% 13.8% ‐15.1% 49 363 13.5%
(2) These data exclude women enrolled in Medicaid only for emergency delivery.
(3) Recommended total prenatal weight gain range by prepregnancy weight category is 28-40 lbs. for underweight women (BMI<18.5); 25-35 lbs. for normal weight women (BMI 18.5 to 24.9); 15-25 lbs. for overweight women (BMI 25 to 29.9); and 11-20 lbs. for obese women (BMI >=30.0): Adapted from the National Academy of Sciences. Weight Gain During Pregnancy: Reexamining the Guidelines. Washington, DC : National Academy Press, 2009.
(1) Item appears also on other WCH Section Agreement Addenda.

Anson CountyATTACHMENT A: WIC QUALITY ASSURANCE DELIVERABLES
SFY 20102011 AGREEMENT ADDENDA DATA
Process Outcome Objectives
Percentage of pregnant women enrolled in Medicaid who received prenatal WIC Program services. (1) (2)
Percentage of pregnant women who participated in WIC and received WIC Program services during the first trimester of pregnancy.
Percentage of children less than 12 months of age who were served in the Child Health Clinic and received WIC Program services. (1)
Percentage of children 1 to 5 years of age who were served in the Child Health Clinic and received WIC Program Services. (1)
Percentage of children 1 to 5 years of age enrolled in Medicaid who received WIC Program Services.
Percentage of children less than 12 months of age enrolled in Medicaid who received WIC Program services.
Percentage of postpartum women who participated in WIC during pregnancy and were recertified for WIC by 6 weeks postpartum.
Percentage of women with live term singleton births who received WIC Program services during pregnancy and who gained recommended/excessive/inadequate weight according to the National Academy of Sciences ‐ Institute of Medicine 2009 recommended total weight gain ranges during pregnancy. (3)
Percentage of women who participated in WIC who initiated breastfeeding.
1C.
1A.
2A.
2B.
3A.
3B.
1B.
4B.
5A.
83.0% 81.7%
Num Den Percent
Percentage of children 2 to 4 years of age who received services from the health department and who, according to their Body Mass Index (BMI) for age and gender were:
4A.
Percentage of infants who participated in WIC who were: 5B.
80.6%
62.7%
48.8%
80.2%
95.7%
90.2%
70.4%
32.0%
30.0%
13.2%5.0%
75.6%
61.9%
50.8%
81.9%
94.7%
87.4%
66.9%
27.7%
31.2%
16.4%6.1%
83.3%
77.8%
59.2%
51.3%
80.5%
97.6%
90.7%
66.8%
28.5%
33.6%
18.3%5.6%
0.3%
‐3.5%
‐5.6%
5.0%
0.3%
2.1%
0.5%
‐5.2%
‐10.9%
11.9%
38.5%11.1%
174 203 85.7%
182 234 77.8%
541 843 64.2%
199 374 53.2%
177 225 78.7%
19 19 100.0%
59 63 93.7%
253 375 67.5%
56 29.9%187
99 280 35.4%
43 267 16.1%11 267 4.1%
44.4%23.6%
48.1%23.3%
8.4%‐1.1%
48.8%23.5%
88 47.1%43 23.0%
187187
At a healthy weight (BMI less than the 85th percentile but at or greater than the 5th percentile) (1)
a.
Overweight (BMI at or above the 85th percentile but less than the 95th percentile)
b.
Underweight (BMI less than the 5th percentile).
c.
Recommended prenatal weight gaina.
Excessive prenatal weight gainb.
Inadequate prenatal weight gainc.
Breastfeeding at 6 weeks of age (1)a.
Breastfeeding at 6 months of ageb.
12.5% 12.0% 10.6% ‐15.0% 31 375 8.3%
5.5% 7.8% 9.1% 66.3% 40 375 10.7%
2000 2008 Data
2002to
2003
2005to
2006
2008to
% Change from 2000
to 2008
Obese (BMI at or greater than the 95th percentile).
d.
11.6% 13.3% 13.5% 16.4% 51 375 13.6%
(2) These data exclude women enrolled in Medicaid only for emergency delivery.
(3) Recommended total prenatal weight gain range by prepregnancy weight category is 28-40 lbs. for underweight women (BMI<18.5); 25-35 lbs. for normal weight women (BMI 18.5 to 24.9); 15-25 lbs. for overweight women (BMI 25 to 29.9); and 11-20 lbs. for obese women (BMI >=30.0): Adapted from the National Academy of Sciences. Weight Gain During Pregnancy: Reexamining the Guidelines. Washington, DC : National Academy Press, 2009.
(1) Item appears also on other WCH Section Agreement Addenda.

Appalachian DistrictATTACHMENT A: WIC QUALITY ASSURANCE DELIVERABLES
SFY 20102011 AGREEMENT ADDENDA DATA
Process Outcome Objectives
Percentage of pregnant women enrolled in Medicaid who received prenatal WIC Program services. (1) (2)
Percentage of pregnant women who participated in WIC and received WIC Program services during the first trimester of pregnancy.
Percentage of children less than 12 months of age who were served in the Child Health Clinic and received WIC Program services. (1)
Percentage of children 1 to 5 years of age who were served in the Child Health Clinic and received WIC Program Services. (1)
Percentage of children 1 to 5 years of age enrolled in Medicaid who received WIC Program Services.
Percentage of children less than 12 months of age enrolled in Medicaid who received WIC Program services.
Percentage of postpartum women who participated in WIC during pregnancy and were recertified for WIC by 6 weeks postpartum.
Percentage of women with live term singleton births who received WIC Program services during pregnancy and who gained recommended/excessive/inadequate weight according to the National Academy of Sciences ‐ Institute of Medicine 2009 recommended total weight gain ranges during pregnancy. (3)
Percentage of women who participated in WIC who initiated breastfeeding.
1C.
1A.
2A.
2B.
3A.
3B.
1B.
4B.
5A.
83.2% 79.5%
Num Den Percent
Percentage of children 2 to 4 years of age who received services from the health department and who, according to their Body Mass Index (BMI) for age and gender were:
4A.
Percentage of infants who participated in WIC who were: 5B.
72.4%
74.0%
57.3%
66.0%
86.5%
83.0%
69.0%
29.4%
50.2%
33.7%20.1%
68.1%
68.7%
51.9%
66.2%
86.7%
83.5%
67.1%
31.5%
52.0%
33.7%18.4%
64.5%
70.8%
62.4%
47.8%
73.3%
92.1%
85.7%
66.4%
31.9%
58.7%
36.3%19.7%
‐22.4%
‐2.1%
‐15.6%
‐16.7%
11.0%
6.4%
3.2%
‐3.7%
8.4%
16.8%
7.8%‐2.3%
223 364 61.3%
367 523 70.2%
1,199 1,864 64.3%
376 832 45.2%
353 472 74.8%
69 71 97.2%
209 228 91.7%
465 706 65.9%
102 31.7%322
339 577 58.8%
198 530 37.4%107 530 20.2%
46.6%23.9%
48.6%19.5%
4.3%‐18.8%
47.9%20.6%
159 49.4%61 18.9%
322322
At a healthy weight (BMI less than the 85th percentile but at or greater than the 5th percentile) (1)
a.
Overweight (BMI at or above the 85th percentile but less than the 95th percentile)
b.
Underweight (BMI less than the 5th percentile).
c.
Recommended prenatal weight gaina.
Excessive prenatal weight gainb.
Inadequate prenatal weight gainc.
Breastfeeding at 6 weeks of age (1)a.
Breastfeeding at 6 months of ageb.
13.8% 15.1% 14.8% 7.5% 115 706 16.3%
5.4% 4.5% 3.4% ‐37.2% 21 706 3.0%
2000 2008 Data
2002to
2003
2005to
2006
2008to
% Change from 2000
to 2008
Obese (BMI at or greater than the 95th percentile).
d.
11.9% 13.4% 15.4% 29.6% 105 706 14.9%
(2) These data exclude women enrolled in Medicaid only for emergency delivery.
(3) Recommended total prenatal weight gain range by prepregnancy weight category is 28-40 lbs. for underweight women (BMI<18.5); 25-35 lbs. for normal weight women (BMI 18.5 to 24.9); 15-25 lbs. for overweight women (BMI 25 to 29.9); and 11-20 lbs. for obese women (BMI >=30.0): Adapted from the National Academy of Sciences. Weight Gain During Pregnancy: Reexamining the Guidelines. Washington, DC : National Academy Press, 2009.
(1) Item appears also on other WCH Section Agreement Addenda.

Beaufort CountyATTACHMENT A: WIC QUALITY ASSURANCE DELIVERABLES
SFY 20102011 AGREEMENT ADDENDA DATA
Process Outcome Objectives
Percentage of pregnant women enrolled in Medicaid who received prenatal WIC Program services. (1) (2)
Percentage of pregnant women who participated in WIC and received WIC Program services during the first trimester of pregnancy.
Percentage of children less than 12 months of age who were served in the Child Health Clinic and received WIC Program services. (1)
Percentage of children 1 to 5 years of age who were served in the Child Health Clinic and received WIC Program Services. (1)
Percentage of children 1 to 5 years of age enrolled in Medicaid who received WIC Program Services.
Percentage of children less than 12 months of age enrolled in Medicaid who received WIC Program services.
Percentage of postpartum women who participated in WIC during pregnancy and were recertified for WIC by 6 weeks postpartum.
Percentage of women with live term singleton births who received WIC Program services during pregnancy and who gained recommended/excessive/inadequate weight according to the National Academy of Sciences ‐ Institute of Medicine 2009 recommended total weight gain ranges during pregnancy. (3)
Percentage of women who participated in WIC who initiated breastfeeding.
1C.
1A.
2A.
2B.
3A.
3B.
1B.
4B.
5A.
82.6% 83.3%
Num Den Percent
Percentage of children 2 to 4 years of age who received services from the health department and who, according to their Body Mass Index (BMI) for age and gender were:
4A.
Percentage of infants who participated in WIC who were: 5B.
75.7%
59.1%
46.2%
72.7%
66.7%
65.9%
28.1%
40.5%
22.2%10.0%
75.5%
58.8%
38.7%
74.5%
64.6%
33.0%
43.7%
23.0%11.7%
80.0%
75.2%
58.5%
37.5%
70.4%
65.5%
33.5%
42.8%
27.4%13.5%
‐3.1%
‐0.7%
‐1.0%
‐18.7%
‐3.1%
‐0.6%
19.0%
5.7%
23.8%34.8%
237 293 80.9%
316 421 75.1%
966 1,616 59.8%
357 906 39.4%
328 453 72.4%
378 572 66.1%
96 31.3%307
230 538 42.8%
129 480 26.9%62 480 12.9%
47.4%24.4%
45.3%21.2%
‐4.4%‐13.3%
44.8%22.2%
149 48.5%62 20.2%
307307
At a healthy weight (BMI less than the 85th percentile but at or greater than the 5th percentile) (1)
a.
Overweight (BMI at or above the 85th percentile but less than the 95th percentile)
b.
Underweight (BMI less than the 5th percentile).
c.
Recommended prenatal weight gaina.
Excessive prenatal weight gainb.
Inadequate prenatal weight gainc.
Breastfeeding at 6 weeks of age (1)a.
Breastfeeding at 6 months of ageb.
14.1% 15.8% 15.6% 11.1% 91 572 15.9%
4.7% 2.7% 2.6% ‐43.9% 17 572 3.0%
2000 2008 Data
2002to
2003
2005to
2006
2008to
% Change from 2000
to 2008
Obese (BMI at or greater than the 95th percentile).
d.
15.4% 16.9% 16.3% 6.0% 86 572 15.0%
(2) These data exclude women enrolled in Medicaid only for emergency delivery.
(3) Recommended total prenatal weight gain range by prepregnancy weight category is 28-40 lbs. for underweight women (BMI<18.5); 25-35 lbs. for normal weight women (BMI 18.5 to 24.9); 15-25 lbs. for overweight women (BMI 25 to 29.9); and 11-20 lbs. for obese women (BMI >=30.0): Adapted from the National Academy of Sciences. Weight Gain During Pregnancy: Reexamining the Guidelines. Washington, DC : National Academy Press, 2009.
(1) Item appears also on other WCH Section Agreement Addenda.

Bladen CountyATTACHMENT A: WIC QUALITY ASSURANCE DELIVERABLES
SFY 20102011 AGREEMENT ADDENDA DATA
Process Outcome Objectives
Percentage of pregnant women enrolled in Medicaid who received prenatal WIC Program services. (1) (2)
Percentage of pregnant women who participated in WIC and received WIC Program services during the first trimester of pregnancy.
Percentage of children less than 12 months of age who were served in the Child Health Clinic and received WIC Program services. (1)
Percentage of children 1 to 5 years of age who were served in the Child Health Clinic and received WIC Program Services. (1)
Percentage of children 1 to 5 years of age enrolled in Medicaid who received WIC Program Services.
Percentage of children less than 12 months of age enrolled in Medicaid who received WIC Program services.
Percentage of postpartum women who participated in WIC during pregnancy and were recertified for WIC by 6 weeks postpartum.
Percentage of women with live term singleton births who received WIC Program services during pregnancy and who gained recommended/excessive/inadequate weight according to the National Academy of Sciences ‐ Institute of Medicine 2009 recommended total weight gain ranges during pregnancy. (3)
Percentage of women who participated in WIC who initiated breastfeeding.
1C.
1A.
2A.
2B.
3A.
3B.
1B.
4B.
5A.
81.1% 82.6%
Num Den Percent
Percentage of children 2 to 4 years of age who received services from the health department and who, according to their Body Mass Index (BMI) for age and gender were:
4A.
Percentage of infants who participated in WIC who were: 5B.
79.3%
60.6%
47.6%
70.5%
93.8%
89.6%
62.7%
30.4%
35.6%
24.1%12.1%
81.5%
62.5%
42.5%
74.8%
90.7%
92.2%
66.6%
29.1%
45.8%
28.1%16.3%
82.5%
83.2%
63.2%
46.9%
72.8%
94.1%
90.2%
63.4%
30.1%
58.7%
46.9%33.7%
1.7%
4.9%
4.2%
‐1.6%
3.3%
0.3%
0.7%
1.1%
‐1.1%
65.2%
94.5%178.1%
186 226 82.3%
269 321 83.8%
835 1,262 66.2%
300 600 50.0%
254 345 73.6%
87 92 94.6%
176 188 93.6%
344 562 61.2%
84 32.7%257
244 414 58.9%
224 399 56.1%168 399 42.1%
44.0%25.6%
42.9%27.1%
‐2.6%5.7%
44.5%26.4%
107 41.6%66 25.7%
257257
At a healthy weight (BMI less than the 85th percentile but at or greater than the 5th percentile) (1)
a.
Overweight (BMI at or above the 85th percentile but less than the 95th percentile)
b.
Underweight (BMI less than the 5th percentile).
c.
Recommended prenatal weight gaina.
Excessive prenatal weight gainb.
Inadequate prenatal weight gainc.
Breastfeeding at 6 weeks of age (1)a.
Breastfeeding at 6 months of ageb.
15.9% 14.4% 15.9% ‐0.2% 106 562 18.9%
4.9% 6.1% 4.7% ‐3.6% 17 562 3.0%
2000 2008 Data
2002to
2003
2005to
2006
2008to
% Change from 2000
to 2008
Obese (BMI at or greater than the 95th percentile).
d.
16.5% 12.8% 16.0% ‐2.9% 95 562 16.9%
(2) These data exclude women enrolled in Medicaid only for emergency delivery.
(3) Recommended total prenatal weight gain range by prepregnancy weight category is 28-40 lbs. for underweight women (BMI<18.5); 25-35 lbs. for normal weight women (BMI 18.5 to 24.9); 15-25 lbs. for overweight women (BMI 25 to 29.9); and 11-20 lbs. for obese women (BMI >=30.0): Adapted from the National Academy of Sciences. Weight Gain During Pregnancy: Reexamining the Guidelines. Washington, DC : National Academy Press, 2009.
(1) Item appears also on other WCH Section Agreement Addenda.

Brunswick CountyATTACHMENT A: WIC QUALITY ASSURANCE DELIVERABLES
SFY 20102011 AGREEMENT ADDENDA DATA
Process Outcome Objectives
Percentage of pregnant women enrolled in Medicaid who received prenatal WIC Program services. (1) (2)
Percentage of pregnant women who participated in WIC and received WIC Program services during the first trimester of pregnancy.
Percentage of children less than 12 months of age who were served in the Child Health Clinic and received WIC Program services. (1)
Percentage of children 1 to 5 years of age who were served in the Child Health Clinic and received WIC Program Services. (1)
Percentage of children 1 to 5 years of age enrolled in Medicaid who received WIC Program Services.
Percentage of children less than 12 months of age enrolled in Medicaid who received WIC Program services.
Percentage of postpartum women who participated in WIC during pregnancy and were recertified for WIC by 6 weeks postpartum.
Percentage of women with live term singleton births who received WIC Program services during pregnancy and who gained recommended/excessive/inadequate weight according to the National Academy of Sciences ‐ Institute of Medicine 2009 recommended total weight gain ranges during pregnancy. (3)
Percentage of women who participated in WIC who initiated breastfeeding.
1C.
1A.
2A.
2B.
3A.
3B.
1B.
4B.
5A.
75.9% 74.0%
Num Den Percent
Percentage of children 2 to 4 years of age who received services from the health department and who, according to their Body Mass Index (BMI) for age and gender were:
4A.
Percentage of infants who participated in WIC who were: 5B.
74.2%
55.4%
39.4%
57.2%
86.3%
80.5%
68.4%
33.3%
36.7%
24.6%12.1%
71.5%
52.3%
34.5%
69.9%
92.4%
80.4%
66.9%
31.8%
40.6%
25.6%14.6%
75.4%
72.6%
48.8%
32.4%
73.8%
90.3%
77.4%
64.6%
31.2%
37.4%
25.0%13.3%
‐0.6%
‐2.1%
‐11.9%
‐17.6%
29.2%
4.7%
‐3.8%
‐5.6%
‐6.2%
1.8%
1.4%10.0%
438 560 78.2%
555 764 72.6%
1,548 2,924 52.9%
361 1,124 32.1%
520 689 75.5%
140 152 92.1%
209 264 79.2%
603 933 64.6%
76 37.1%205
298 818 36.4%
208 900 23.1%104 900 11.6%
49.0%17.7%
51.2%17.5%
4.5%‐0.7%
50.2%18.1%
102 49.8%27 13.2%
205205
At a healthy weight (BMI less than the 85th percentile but at or greater than the 5th percentile) (1)
a.
Overweight (BMI at or above the 85th percentile but less than the 95th percentile)
b.
Underweight (BMI less than the 5th percentile).
c.
Recommended prenatal weight gaina.
Excessive prenatal weight gainb.
Inadequate prenatal weight gainc.
Breastfeeding at 6 weeks of age (1)a.
Breastfeeding at 6 months of ageb.
13.5% 15.6% 17.5% 29.7% 168 933 18.0%
4.8% 2.6% 3.0% ‐36.5% 28 933 3.0%
2000 2008 Data
2002to
2003
2005to
2006
2008to
% Change from 2000
to 2008
Obese (BMI at or greater than the 95th percentile).
d.
13.3% 14.9% 14.8% 11.7% 134 933 14.4%
(2) These data exclude women enrolled in Medicaid only for emergency delivery.
(3) Recommended total prenatal weight gain range by prepregnancy weight category is 28-40 lbs. for underweight women (BMI<18.5); 25-35 lbs. for normal weight women (BMI 18.5 to 24.9); 15-25 lbs. for overweight women (BMI 25 to 29.9); and 11-20 lbs. for obese women (BMI >=30.0): Adapted from the National Academy of Sciences. Weight Gain During Pregnancy: Reexamining the Guidelines. Washington, DC : National Academy Press, 2009.
(1) Item appears also on other WCH Section Agreement Addenda.

Buncombe CountyATTACHMENT A: WIC QUALITY ASSURANCE DELIVERABLES
SFY 20102011 AGREEMENT ADDENDA DATA
Process Outcome Objectives
Percentage of pregnant women enrolled in Medicaid who received prenatal WIC Program services. (1) (2)
Percentage of pregnant women who participated in WIC and received WIC Program services during the first trimester of pregnancy.
Percentage of children less than 12 months of age who were served in the Child Health Clinic and received WIC Program services. (1)
Percentage of children 1 to 5 years of age who were served in the Child Health Clinic and received WIC Program Services. (1)
Percentage of children 1 to 5 years of age enrolled in Medicaid who received WIC Program Services.
Percentage of children less than 12 months of age enrolled in Medicaid who received WIC Program services.
Percentage of postpartum women who participated in WIC during pregnancy and were recertified for WIC by 6 weeks postpartum.
Percentage of women with live term singleton births who received WIC Program services during pregnancy and who gained recommended/excessive/inadequate weight according to the National Academy of Sciences ‐ Institute of Medicine 2009 recommended total weight gain ranges during pregnancy. (3)
Percentage of women who participated in WIC who initiated breastfeeding.
1C.
1A.
2A.
2B.
3A.
3B.
1B.
4B.
5A.
74.8% 72.2%
Num Den Percent
Percentage of children 2 to 4 years of age who received services from the health department and who, according to their Body Mass Index (BMI) for age and gender were:
4A.
Percentage of infants who participated in WIC who were: 5B.
68.6%
57.0%
47.5%
75.4%
92.9%
72.6%
69.7%
33.6%
73.2%
32.3%16.1%
65.9%
54.3%
42.8%
76.4%
94.0%
87.9%
63.6%
34.3%
68.9%
34.9%19.2%
70.4%
66.5%
51.4%
35.9%
75.8%
92.9%
87.7%
64.5%
33.5%
69.1%
35.9%20.6%
‐5.9%
‐3.1%
‐9.8%
‐24.3%
0.5%
0.0%
20.8%
‐7.5%
‐0.4%
‐5.6%
11.4%28.0%
934 1,305 71.6%
1,249 1,880 66.4%
3,632 6,758 53.7%
1,034 2,695 38.4%
1,119 1,492 75.0%
319 351 90.9%
640 744 86.0%
1,202 1,865 64.5%
403 33.1%1,218
1,245 1,813 68.7%
660 1,791 36.9%363 1,791 20.3%
46.4%19.9%
47.4%19.1%
2.0%‐3.9%
45.2%20.5%
570 46.8%245 20.1%
1,2181,218
At a healthy weight (BMI less than the 85th percentile but at or greater than the 5th percentile) (1)
a.
Overweight (BMI at or above the 85th percentile but less than the 95th percentile)
b.
Underweight (BMI less than the 5th percentile).
c.
Recommended prenatal weight gaina.
Excessive prenatal weight gainb.
Inadequate prenatal weight gainc.
Breastfeeding at 6 weeks of age (1)a.
Breastfeeding at 6 months of ageb.
15.1% 16.5% 16.6% 10.1% 300 1,865 16.1%
3.8% 3.8% 2.5% ‐34.2% 49 1,865 2.6%
2000 2008 Data
2002to
2003
2005to
2006
2008to
% Change from 2000
to 2008
Obese (BMI at or greater than the 95th percentile).
d.
11.5% 16.0% 16.5% 43.7% 314 1,865 16.8%
(2) These data exclude women enrolled in Medicaid only for emergency delivery.
(3) Recommended total prenatal weight gain range by prepregnancy weight category is 28-40 lbs. for underweight women (BMI<18.5); 25-35 lbs. for normal weight women (BMI 18.5 to 24.9); 15-25 lbs. for overweight women (BMI 25 to 29.9); and 11-20 lbs. for obese women (BMI >=30.0): Adapted from the National Academy of Sciences. Weight Gain During Pregnancy: Reexamining the Guidelines. Washington, DC : National Academy Press, 2009.
(1) Item appears also on other WCH Section Agreement Addenda.

Burke CountyATTACHMENT A: WIC QUALITY ASSURANCE DELIVERABLES
SFY 20102011 AGREEMENT ADDENDA DATA
Process Outcome Objectives
Percentage of pregnant women enrolled in Medicaid who received prenatal WIC Program services. (1) (2)
Percentage of pregnant women who participated in WIC and received WIC Program services during the first trimester of pregnancy.
Percentage of children less than 12 months of age who were served in the Child Health Clinic and received WIC Program services. (1)
Percentage of children 1 to 5 years of age who were served in the Child Health Clinic and received WIC Program Services. (1)
Percentage of children 1 to 5 years of age enrolled in Medicaid who received WIC Program Services.
Percentage of children less than 12 months of age enrolled in Medicaid who received WIC Program services.
Percentage of postpartum women who participated in WIC during pregnancy and were recertified for WIC by 6 weeks postpartum.
Percentage of women with live term singleton births who received WIC Program services during pregnancy and who gained recommended/excessive/inadequate weight according to the National Academy of Sciences ‐ Institute of Medicine 2009 recommended total weight gain ranges during pregnancy. (3)
Percentage of women who participated in WIC who initiated breastfeeding.
1C.
1A.
2A.
2B.
3A.
3B.
1B.
4B.
5A.
77.3% 65.1%
Num Den Percent
Percentage of children 2 to 4 years of age who received services from the health department and who, according to their Body Mass Index (BMI) for age and gender were:
4A.
Percentage of infants who participated in WIC who were: 5B.
74.8%
56.8%
35.3%
81.6%
87.5%
75.2%
66.9%
33.0%
44.8%
22.6%9.0%
74.4%
55.9%
28.1%
83.0%
100.0%
71.8%
66.6%
34.0%
56.5%
22.8%9.4%
69.9%
75.6%
55.8%
20.1%
84.3%
83.3%
71.5%
63.7%
33.2%
60.9%
23.3%10.9%
‐9.6%
1.0%
‐1.7%
‐43.1%
3.3%
‐4.8%
‐4.9%
‐4.8%
0.5%
36.1%
3.2%21.1%
424 614 69.1%
602 811 74.2%
1,568 2,611 60.1%
200 1,043 19.2%
482 589 81.8%
7 9 77.8%
50 72 69.4%
487 797 61.1%
153 27.9%548
463 786 58.9%
167 838 19.9%80 838 9.5%
41.6%25.4%
42.2%24.6%
1.6%‐3.2%
42.5%23.5%
246 44.9%149 27.2%
548548
At a healthy weight (BMI less than the 85th percentile but at or greater than the 5th percentile) (1)
a.
Overweight (BMI at or above the 85th percentile but less than the 95th percentile)
b.
Underweight (BMI less than the 5th percentile).
c.
Recommended prenatal weight gaina.
Excessive prenatal weight gainb.
Inadequate prenatal weight gainc.
Breastfeeding at 6 weeks of age (1)a.
Breastfeeding at 6 months of ageb.
16.6% 16.0% 17.8% 7.7% 140 797 17.6%
3.1% 4.1% 2.4% ‐24.8% 23 797 2.9%
2000 2008 Data
2002to
2003
2005to
2006
2008to
% Change from 2000
to 2008
Obese (BMI at or greater than the 95th percentile).
d.
13.4% 13.3% 16.2% 20.5% 147 797 18.4%
(2) These data exclude women enrolled in Medicaid only for emergency delivery.
(3) Recommended total prenatal weight gain range by prepregnancy weight category is 28-40 lbs. for underweight women (BMI<18.5); 25-35 lbs. for normal weight women (BMI 18.5 to 24.9); 15-25 lbs. for overweight women (BMI 25 to 29.9); and 11-20 lbs. for obese women (BMI >=30.0): Adapted from the National Academy of Sciences. Weight Gain During Pregnancy: Reexamining the Guidelines. Washington, DC : National Academy Press, 2009.
(1) Item appears also on other WCH Section Agreement Addenda.

Cabarrus CountyATTACHMENT A: WIC QUALITY ASSURANCE DELIVERABLES
SFY 20102011 AGREEMENT ADDENDA DATA
Process Outcome Objectives
Percentage of pregnant women enrolled in Medicaid who received prenatal WIC Program services. (1) (2)
Percentage of pregnant women who participated in WIC and received WIC Program services during the first trimester of pregnancy.
Percentage of children less than 12 months of age who were served in the Child Health Clinic and received WIC Program services. (1)
Percentage of children 1 to 5 years of age who were served in the Child Health Clinic and received WIC Program Services. (1)
Percentage of children 1 to 5 years of age enrolled in Medicaid who received WIC Program Services.
Percentage of children less than 12 months of age enrolled in Medicaid who received WIC Program services.
Percentage of postpartum women who participated in WIC during pregnancy and were recertified for WIC by 6 weeks postpartum.
Percentage of women with live term singleton births who received WIC Program services during pregnancy and who gained recommended/excessive/inadequate weight according to the National Academy of Sciences ‐ Institute of Medicine 2009 recommended total weight gain ranges during pregnancy. (3)
Percentage of women who participated in WIC who initiated breastfeeding.
1C.
1A.
2A.
2B.
3A.
3B.
1B.
4B.
5A.
68.8% 67.3%
Num Den Percent
Percentage of children 2 to 4 years of age who received services from the health department and who, according to their Body Mass Index (BMI) for age and gender were:
4A.
Percentage of infants who participated in WIC who were: 5B.
67.8%
50.0%
25.6%
69.9%
86.6%
65.6%
65.2%
31.9%
53.0%
30.1%18.2%
71.4%
54.9%
29.2%
77.9%
79.9%
66.6%
64.8%
30.2%
55.8%
35.3%20.4%
71.8%
73.1%
55.2%
22.5%
82.0%
86.1%
72.6%
62.9%
30.1%
64.5%
39.0%21.9%
4.4%
7.8%
10.4%
‐12.0%
17.3%
‐0.5%
10.7%
‐3.6%
‐5.6%
21.6%
29.7%20.3%
654 947 69.1%
1,094 1,476 74.1%
2,826 4,908 57.6%
438 2,169 20.2%
1,007 1,236 81.5%
582 618 94.2%
731 954 76.6%
1,220 2,029 60.1%
320 30.4%1,053
1,062 1,581 67.2%
686 1,722 39.8%392 1,722 22.8%
40.6%27.5%
46.8%23.2%
15.1%‐15.8%
45.6%24.3%
488 46.3%245 23.3%
1,0531,053
At a healthy weight (BMI less than the 85th percentile but at or greater than the 5th percentile) (1)
a.
Overweight (BMI at or above the 85th percentile but less than the 95th percentile)
b.
Underweight (BMI less than the 5th percentile).
c.
Recommended prenatal weight gaina.
Excessive prenatal weight gainb.
Inadequate prenatal weight gainc.
Breastfeeding at 6 weeks of age (1)a.
Breastfeeding at 6 months of ageb.
17.0% 16.6% 17.0% 0.1% 366 2,029 18.0%
3.8% 4.6% 2.5% ‐34.5% 49 2,029 2.4%
2000 2008 Data
2002to
2003
2005to
2006
2008to
% Change from 2000
to 2008
Obese (BMI at or greater than the 95th percentile).
d.
14.0% 14.0% 17.6% 26.0% 394 2,029 19.4%
(2) These data exclude women enrolled in Medicaid only for emergency delivery.
(3) Recommended total prenatal weight gain range by prepregnancy weight category is 28-40 lbs. for underweight women (BMI<18.5); 25-35 lbs. for normal weight women (BMI 18.5 to 24.9); 15-25 lbs. for overweight women (BMI 25 to 29.9); and 11-20 lbs. for obese women (BMI >=30.0): Adapted from the National Academy of Sciences. Weight Gain During Pregnancy: Reexamining the Guidelines. Washington, DC : National Academy Press, 2009.
(1) Item appears also on other WCH Section Agreement Addenda.

Caldwell CountyATTACHMENT A: WIC QUALITY ASSURANCE DELIVERABLES
SFY 20102011 AGREEMENT ADDENDA DATA
Process Outcome Objectives
Percentage of pregnant women enrolled in Medicaid who received prenatal WIC Program services. (1) (2)
Percentage of pregnant women who participated in WIC and received WIC Program services during the first trimester of pregnancy.
Percentage of children less than 12 months of age who were served in the Child Health Clinic and received WIC Program services. (1)
Percentage of children 1 to 5 years of age who were served in the Child Health Clinic and received WIC Program Services. (1)
Percentage of children 1 to 5 years of age enrolled in Medicaid who received WIC Program Services.
Percentage of children less than 12 months of age enrolled in Medicaid who received WIC Program services.
Percentage of postpartum women who participated in WIC during pregnancy and were recertified for WIC by 6 weeks postpartum.
Percentage of women with live term singleton births who received WIC Program services during pregnancy and who gained recommended/excessive/inadequate weight according to the National Academy of Sciences ‐ Institute of Medicine 2009 recommended total weight gain ranges during pregnancy. (3)
Percentage of women who participated in WIC who initiated breastfeeding.
1C.
1A.
2A.
2B.
3A.
3B.
1B.
4B.
5A.
81.5% 78.8%
Num Den Percent
Percentage of children 2 to 4 years of age who received services from the health department and who, according to their Body Mass Index (BMI) for age and gender were:
4A.
Percentage of infants who participated in WIC who were: 5B.
75.8%
62.1%
44.0%
76.2%
85.9%
66.7%
70.2%
31.4%
47.1%
22.8%9.6%
77.4%
59.2%
34.7%
78.9%
77.8%
61.5%
63.9%
27.5%
51.2%
24.7%11.3%
72.1%
78.6%
57.8%
32.5%
77.6%
75.0%
65.3%
58.8%
30.2%
47.0%
26.8%12.6%
‐11.5%
3.6%
‐6.9%
‐26.2%
1.7%
‐12.7%
‐2.1%
‐16.2%
‐3.9%
‐0.1%
17.4%31.5%
350 488 71.7%
500 632 79.1%
1,503 2,484 60.5%
506 1,473 34.4%
484 596 81.2%
96 119 80.7%
449 774 58.0%
120 26.5%453
359 716 50.1%
194 703 27.6%90 703 12.8%
48.9%19.7%
51.5%18.4%
5.2%‐6.7%
53.3%19.2%
243 53.6%90 19.9%
453453
At a healthy weight (BMI less than the 85th percentile but at or greater than the 5th percentile) (1)
a.
Overweight (BMI at or above the 85th percentile but less than the 95th percentile)
b.
Underweight (BMI less than the 5th percentile).
c.
Recommended prenatal weight gaina.
Excessive prenatal weight gainb.
Inadequate prenatal weight gainc.
Breastfeeding at 6 weeks of age (1)a.
Breastfeeding at 6 months of ageb.
10.0% 17.7% 19.7% 96.8% 169 774 21.8%
8.1% 3.2% 2.4% ‐70.1% 16 774 2.1%
2000 2008 Data
2002to
2003
2005to
2006
2008to
% Change from 2000
to 2008
Obese (BMI at or greater than the 95th percentile).
d.
11.8% 15.2% 19.1% 62.2% 140 774 18.1%
(2) These data exclude women enrolled in Medicaid only for emergency delivery.
(3) Recommended total prenatal weight gain range by prepregnancy weight category is 28-40 lbs. for underweight women (BMI<18.5); 25-35 lbs. for normal weight women (BMI 18.5 to 24.9); 15-25 lbs. for overweight women (BMI 25 to 29.9); and 11-20 lbs. for obese women (BMI >=30.0): Adapted from the National Academy of Sciences. Weight Gain During Pregnancy: Reexamining the Guidelines. Washington, DC : National Academy Press, 2009.
(1) Item appears also on other WCH Section Agreement Addenda.

Carteret CountyATTACHMENT A: WIC QUALITY ASSURANCE DELIVERABLES
SFY 20102011 AGREEMENT ADDENDA DATA
Process Outcome Objectives
Percentage of pregnant women enrolled in Medicaid who received prenatal WIC Program services. (1) (2)
Percentage of pregnant women who participated in WIC and received WIC Program services during the first trimester of pregnancy.
Percentage of children less than 12 months of age who were served in the Child Health Clinic and received WIC Program services. (1)
Percentage of children 1 to 5 years of age who were served in the Child Health Clinic and received WIC Program Services. (1)
Percentage of children 1 to 5 years of age enrolled in Medicaid who received WIC Program Services.
Percentage of children less than 12 months of age enrolled in Medicaid who received WIC Program services.
Percentage of postpartum women who participated in WIC during pregnancy and were recertified for WIC by 6 weeks postpartum.
Percentage of women with live term singleton births who received WIC Program services during pregnancy and who gained recommended/excessive/inadequate weight according to the National Academy of Sciences ‐ Institute of Medicine 2009 recommended total weight gain ranges during pregnancy. (3)
Percentage of women who participated in WIC who initiated breastfeeding.
1C.
1A.
2A.
2B.
3A.
3B.
1B.
4B.
5A.
74.7% 60.6%
Num Den Percent
Percentage of children 2 to 4 years of age who received services from the health department and who, according to their Body Mass Index (BMI) for age and gender were:
4A.
Percentage of infants who participated in WIC who were: 5B.
73.8%
60.8%
42.6%
79.2%
77.8%
74.5%
64.7%
32.9%
45.6%
26.4%12.8%
73.6%
55.9%
35.7%
80.5%
50.0%
58.6%
63.4%
32.9%
52.0%
27.4%11.1%
69.1%
75.5%
53.6%
28.5%
71.8%
100.0%
65.1%
32.6%
57.7%
30.1%13.1%
‐7.5%
2.3%
‐11.9%
‐33.1%
‐9.4%
34.2%
0.8%
‐1.0%
26.6%
13.9%2.6%
207 292 70.9%
307 382 80.4%
795 1,441 55.2%
198 618 32.0%
197 334 59.0%
281 431 65.2%
85 32.0%266
251 431 58.2%
155 476 32.6%72 476 15.1%
50.2%16.9%
52.2%15.3%
3.9%‐9.7%
52.2%14.9%
133 50.0%48 18.0%
266266
At a healthy weight (BMI less than the 85th percentile but at or greater than the 5th percentile) (1)
a.
Overweight (BMI at or above the 85th percentile but less than the 95th percentile)
b.
Underweight (BMI less than the 5th percentile).
c.
Recommended prenatal weight gaina.
Excessive prenatal weight gainb.
Inadequate prenatal weight gainc.
Breastfeeding at 6 weeks of age (1)a.
Breastfeeding at 6 months of ageb.
17.9% 15.9% 16.4% ‐8.4% 68 431 15.8%
2.7% 3.1% 2.6% ‐5.2% 12 431 2.8%
2000 2008 Data
2002to
2003
2005to
2006
2008to
% Change from 2000
to 2008
Obese (BMI at or greater than the 95th percentile).
d.
14.7% 17.6% 15.9% 7.9% 70 431 16.2%
(2) These data exclude women enrolled in Medicaid only for emergency delivery.
(3) Recommended total prenatal weight gain range by prepregnancy weight category is 28-40 lbs. for underweight women (BMI<18.5); 25-35 lbs. for normal weight women (BMI 18.5 to 24.9); 15-25 lbs. for overweight women (BMI 25 to 29.9); and 11-20 lbs. for obese women (BMI >=30.0): Adapted from the National Academy of Sciences. Weight Gain During Pregnancy: Reexamining the Guidelines. Washington, DC : National Academy Press, 2009.
(1) Item appears also on other WCH Section Agreement Addenda.

Caswell CountyATTACHMENT A: WIC QUALITY ASSURANCE DELIVERABLES
SFY 20102011 AGREEMENT ADDENDA DATA
Process Outcome Objectives
Percentage of pregnant women enrolled in Medicaid who received prenatal WIC Program services. (1) (2)
Percentage of pregnant women who participated in WIC and received WIC Program services during the first trimester of pregnancy.
Percentage of children less than 12 months of age who were served in the Child Health Clinic and received WIC Program services. (1)
Percentage of children 1 to 5 years of age who were served in the Child Health Clinic and received WIC Program Services. (1)
Percentage of children 1 to 5 years of age enrolled in Medicaid who received WIC Program Services.
Percentage of children less than 12 months of age enrolled in Medicaid who received WIC Program services.
Percentage of postpartum women who participated in WIC during pregnancy and were recertified for WIC by 6 weeks postpartum.
Percentage of women with live term singleton births who received WIC Program services during pregnancy and who gained recommended/excessive/inadequate weight according to the National Academy of Sciences ‐ Institute of Medicine 2009 recommended total weight gain ranges during pregnancy. (3)
Percentage of women who participated in WIC who initiated breastfeeding.
1C.
1A.
2A.
2B.
3A.
3B.
1B.
4B.
5A.
75.8% 82.6%
Num Den Percent
Percentage of children 2 to 4 years of age who received services from the health department and who, according to their Body Mass Index (BMI) for age and gender were:
4A.
Percentage of infants who participated in WIC who were: 5B.
73.5%
63.0%
38.8%
77.0%
91.8%
86.7%
69.1%
34.7%
34.2%
18.2%6.9%
74.3%
57.4%
40.5%
77.7%
95.8%
86.4%
69.7%
34.0%
40.6%
21.9%7.2%
80.7%
77.0%
60.0%
41.6%
77.3%
97.4%
91.2%
68.7%
36.5%
52.9%
23.5%10.0%
6.5%
4.8%
‐4.7%
7.2%
0.5%
6.0%
5.3%
‐0.6%
5.0%
54.6%
29.5%45.0%
99 123 80.5%
145 181 80.1%
411 641 64.1%
118 282 41.8%
114 148 77.0%
75 78 96.2%
96 104 92.3%
214 289 74.0%
44 39.3%112
90 176 51.1%
46 185 24.9%17 185 9.2%
46.6%18.7%
45.8%17.7%
‐1.6%‐5.2%
41.3%24.7%
50 44.6%18 16.1%
112112
At a healthy weight (BMI less than the 85th percentile but at or greater than the 5th percentile) (1)
a.
Overweight (BMI at or above the 85th percentile but less than the 95th percentile)
b.
Underweight (BMI less than the 5th percentile).
c.
Recommended prenatal weight gaina.
Excessive prenatal weight gainb.
Inadequate prenatal weight gainc.
Breastfeeding at 6 weeks of age (1)a.
Breastfeeding at 6 months of ageb.
13.8% 12.4% 15.2% 10.5% 40 289 13.8%
5.1% 4.1% 3.6% ‐28.9% 7 289 2.4%
2000 2008 Data
2002to
2003
2005to
2006
2008to
% Change from 2000
to 2008
Obese (BMI at or greater than the 95th percentile).
d.
12.0% 13.8% 12.5% 3.8% 28 289 9.7%
(2) These data exclude women enrolled in Medicaid only for emergency delivery.
(3) Recommended total prenatal weight gain range by prepregnancy weight category is 28-40 lbs. for underweight women (BMI<18.5); 25-35 lbs. for normal weight women (BMI 18.5 to 24.9); 15-25 lbs. for overweight women (BMI 25 to 29.9); and 11-20 lbs. for obese women (BMI >=30.0): Adapted from the National Academy of Sciences. Weight Gain During Pregnancy: Reexamining the Guidelines. Washington, DC : National Academy Press, 2009.
(1) Item appears also on other WCH Section Agreement Addenda.

Catawba CountyATTACHMENT A: WIC QUALITY ASSURANCE DELIVERABLES
SFY 20102011 AGREEMENT ADDENDA DATA
Process Outcome Objectives
Percentage of pregnant women enrolled in Medicaid who received prenatal WIC Program services. (1) (2)
Percentage of pregnant women who participated in WIC and received WIC Program services during the first trimester of pregnancy.
Percentage of children less than 12 months of age who were served in the Child Health Clinic and received WIC Program services. (1)
Percentage of children 1 to 5 years of age who were served in the Child Health Clinic and received WIC Program Services. (1)
Percentage of children 1 to 5 years of age enrolled in Medicaid who received WIC Program Services.
Percentage of children less than 12 months of age enrolled in Medicaid who received WIC Program services.
Percentage of postpartum women who participated in WIC during pregnancy and were recertified for WIC by 6 weeks postpartum.
Percentage of women with live term singleton births who received WIC Program services during pregnancy and who gained recommended/excessive/inadequate weight according to the National Academy of Sciences ‐ Institute of Medicine 2009 recommended total weight gain ranges during pregnancy. (3)
Percentage of women who participated in WIC who initiated breastfeeding.
1C.
1A.
2A.
2B.
3A.
3B.
1B.
4B.
5A.
72.6% 70.5%
Num Den Percent
Percentage of children 2 to 4 years of age who received services from the health department and who, according to their Body Mass Index (BMI) for age and gender were:
4A.
Percentage of infants who participated in WIC who were: 5B.
74.4%
51.7%
33.6%
57.7%
64.7%
51.4%
66.2%
33.7%
48.2%
27.3%12.1%
76.6%
51.8%
28.9%
58.2%
68.8%
50.5%
61.7%
32.9%
53.0%
28.5%13.2%
75.4%
76.4%
51.7%
23.6%
56.5%
68.8%
41.3%
61.3%
31.4%
60.2%
30.6%14.4%
3.9%
2.7%
‐0.1%
‐29.7%
‐2.0%
6.2%
‐19.7%
‐7.4%
‐7.0%
24.9%
12.3%19.1%
722 953 75.8%
1,063 1,401 75.9%
2,811 5,100 55.1%
463 1,832 25.3%
673 1,110 60.6%
5 6 83.3%
25 65 38.5%
837 1,370 61.1%
302 30.2%1,000
864 1,327 65.1%
481 1,474 32.6%242 1,474 16.4%
44.1%22.2%
32.8%35.8%
‐25.5%61.4%
43.1%24.0%
317 31.7%381 38.1%
1,0001,000
At a healthy weight (BMI less than the 85th percentile but at or greater than the 5th percentile) (1)
a.
Overweight (BMI at or above the 85th percentile but less than the 95th percentile)
b.
Underweight (BMI less than the 5th percentile).
c.
Recommended prenatal weight gaina.
Excessive prenatal weight gainb.
Inadequate prenatal weight gainc.
Breastfeeding at 6 weeks of age (1)a.
Breastfeeding at 6 months of ageb.
16.6% 18.7% 19.2% 15.8% 285 1,370 20.8%
3.8% 2.8% 2.2% ‐43.3% 20 1,370 1.5%
2000 2008 Data
2002to
2003
2005to
2006
2008to
% Change from 2000
to 2008
Obese (BMI at or greater than the 95th percentile).
d.
13.4% 16.9% 17.4% 29.5% 228 1,370 16.6%
(2) These data exclude women enrolled in Medicaid only for emergency delivery.
(3) Recommended total prenatal weight gain range by prepregnancy weight category is 28-40 lbs. for underweight women (BMI<18.5); 25-35 lbs. for normal weight women (BMI 18.5 to 24.9); 15-25 lbs. for overweight women (BMI 25 to 29.9); and 11-20 lbs. for obese women (BMI >=30.0): Adapted from the National Academy of Sciences. Weight Gain During Pregnancy: Reexamining the Guidelines. Washington, DC : National Academy Press, 2009.
(1) Item appears also on other WCH Section Agreement Addenda.

Chatham CountyATTACHMENT A: WIC QUALITY ASSURANCE DELIVERABLES
SFY 20102011 AGREEMENT ADDENDA DATA
Process Outcome Objectives
Percentage of pregnant women enrolled in Medicaid who received prenatal WIC Program services. (1) (2)
Percentage of pregnant women who participated in WIC and received WIC Program services during the first trimester of pregnancy.
Percentage of children less than 12 months of age who were served in the Child Health Clinic and received WIC Program services. (1)
Percentage of children 1 to 5 years of age who were served in the Child Health Clinic and received WIC Program Services. (1)
Percentage of children 1 to 5 years of age enrolled in Medicaid who received WIC Program Services.
Percentage of children less than 12 months of age enrolled in Medicaid who received WIC Program services.
Percentage of postpartum women who participated in WIC during pregnancy and were recertified for WIC by 6 weeks postpartum.
Percentage of women with live term singleton births who received WIC Program services during pregnancy and who gained recommended/excessive/inadequate weight according to the National Academy of Sciences ‐ Institute of Medicine 2009 recommended total weight gain ranges during pregnancy. (3)
Percentage of women who participated in WIC who initiated breastfeeding.
1C.
1A.
2A.
2B.
3A.
3B.
1B.
4B.
5A.
67.1% 64.4%
Num Den Percent
Percentage of children 2 to 4 years of age who received services from the health department and who, according to their Body Mass Index (BMI) for age and gender were:
4A.
Percentage of infants who participated in WIC who were: 5B.
58.1%
53.5%
32.2%
61.1%
80.6%
59.8%
61.2%
35.6%
61.6%
45.5%26.5%
48.9%
45.4%
28.3%
60.5%
66.5%
63.3%
62.2%
30.1%
61.3%
49.8%29.7%
69.6%
48.3%
41.7%
28.2%
61.0%
68.4%
71.3%
61.1%
36.1%
68.4%
52.4%32.6%
3.7%
‐16.8%
‐22.1%
‐12.6%
‐0.2%
‐15.2%
19.2%
‐0.1%
1.4%
11.0%
15.2%22.8%
151 213 70.9%
236 463 51.0%
731 1,656 44.1%
678 2,222 30.5%
833 1,357 61.4%
40 66 60.6%
55 79 69.6%
474 770 61.6%
86 37.1%232
1,074 1,623 66.2%
900 1,665 54.1%552 1,665 33.2%
46.8%17.7%
43.1%20.9%
‐7.9%18.1%
48.4%21.5%
96 41.4%50 21.6%
232232
At a healthy weight (BMI less than the 85th percentile but at or greater than the 5th percentile) (1)
a.
Overweight (BMI at or above the 85th percentile but less than the 95th percentile)
b.
Underweight (BMI less than the 5th percentile).
c.
Recommended prenatal weight gaina.
Excessive prenatal weight gainb.
Inadequate prenatal weight gainc.
Breastfeeding at 6 weeks of age (1)a.
Breastfeeding at 6 months of ageb.
17.5% 17.0% 17.2% ‐1.8% 126 770 16.4%
3.1% 2.8% 2.4% ‐22.4% 15 770 1.9%
2000 2008 Data
2002to
2003
2005to
2006
2008to
% Change from 2000
to 2008
Obese (BMI at or greater than the 95th percentile).
d.
18.2% 18.1% 19.3% 5.8% 155 770 20.1%
(2) These data exclude women enrolled in Medicaid only for emergency delivery.
(3) Recommended total prenatal weight gain range by prepregnancy weight category is 28-40 lbs. for underweight women (BMI<18.5); 25-35 lbs. for normal weight women (BMI 18.5 to 24.9); 15-25 lbs. for overweight women (BMI 25 to 29.9); and 11-20 lbs. for obese women (BMI >=30.0): Adapted from the National Academy of Sciences. Weight Gain During Pregnancy: Reexamining the Guidelines. Washington, DC : National Academy Press, 2009.
(1) Item appears also on other WCH Section Agreement Addenda.

Cherokee CountyATTACHMENT A: WIC QUALITY ASSURANCE DELIVERABLES
SFY 20102011 AGREEMENT ADDENDA DATA
Process Outcome Objectives
Percentage of pregnant women enrolled in Medicaid who received prenatal WIC Program services. (1) (2)
Percentage of pregnant women who participated in WIC and received WIC Program services during the first trimester of pregnancy.
Percentage of children less than 12 months of age who were served in the Child Health Clinic and received WIC Program services. (1)
Percentage of children 1 to 5 years of age who were served in the Child Health Clinic and received WIC Program Services. (1)
Percentage of children 1 to 5 years of age enrolled in Medicaid who received WIC Program Services.
Percentage of children less than 12 months of age enrolled in Medicaid who received WIC Program services.
Percentage of postpartum women who participated in WIC during pregnancy and were recertified for WIC by 6 weeks postpartum.
Percentage of women with live term singleton births who received WIC Program services during pregnancy and who gained recommended/excessive/inadequate weight according to the National Academy of Sciences ‐ Institute of Medicine 2009 recommended total weight gain ranges during pregnancy. (3)
Percentage of women who participated in WIC who initiated breastfeeding.
1C.
1A.
2A.
2B.
3A.
3B.
1B.
4B.
5A.
83.3% 77.4%
Num Den Percent
Percentage of children 2 to 4 years of age who received services from the health department and who, according to their Body Mass Index (BMI) for age and gender were:
4A.
Percentage of infants who participated in WIC who were: 5B.
76.4%
66.0%
50.2%
81.5%
55.6%
73.6%
66.4%
28.0%
50.5%
29.5%13.7%
76.1%
66.0%
43.3%
82.8%
73.3%
83.2%
65.6%
29.9%
44.4%
28.5%13.4%
78.0%
74.2%
62.8%
42.7%
79.2%
70.0%
75.7%
71.3%
27.4%
50.1%
32.4%15.3%
‐6.3%
‐2.8%
‐4.8%
‐14.9%
‐2.9%
26.0%
2.9%
7.4%
‐2.2%
‐0.7%
9.6%12.1%
81 94 86.2%
182 225 80.9%
554 836 66.3%
168 337 49.9%
163 196 83.2%
1
55 65 84.6%
248 349 71.1%
24 25.8%93
132 231 57.1%
99 267 37.1%43 267 16.1%
45.9%26.1%
50.4%22.2%
9.9%‐14.9%
48.5%21.6%
50 53.8%19 20.4%
9393
At a healthy weight (BMI less than the 85th percentile but at or greater than the 5th percentile) (1)
a.
Overweight (BMI at or above the 85th percentile but less than the 95th percentile)
b.
Underweight (BMI less than the 5th percentile).
c.
Recommended prenatal weight gaina.
Excessive prenatal weight gainb.
Inadequate prenatal weight gainc.
Breastfeeding at 6 weeks of age (1)a.
Breastfeeding at 6 months of ageb.
18.9% 14.8% 14.4% ‐23.8% 45 349 12.9%
3.2% 3.9% 3.0% ‐4.8% 10 349 2.9%
2000 2008 Data
2002to
2003
2005to
2006
2008to
% Change from 2000
to 2008
Obese (BMI at or greater than the 95th percentile).
d.
11.5% 15.7% 11.2% ‐2.1% 46 349 13.2%
(2) These data exclude women enrolled in Medicaid only for emergency delivery.
(3) Recommended total prenatal weight gain range by prepregnancy weight category is 28-40 lbs. for underweight women (BMI<18.5); 25-35 lbs. for normal weight women (BMI 18.5 to 24.9); 15-25 lbs. for overweight women (BMI 25 to 29.9); and 11-20 lbs. for obese women (BMI >=30.0): Adapted from the National Academy of Sciences. Weight Gain During Pregnancy: Reexamining the Guidelines. Washington, DC : National Academy Press, 2009.
(1) Item appears also on other WCH Section Agreement Addenda.

Clay CountyATTACHMENT A: WIC QUALITY ASSURANCE DELIVERABLES
SFY 20102011 AGREEMENT ADDENDA DATA
Process Outcome Objectives
Percentage of pregnant women enrolled in Medicaid who received prenatal WIC Program services. (1) (2)
Percentage of pregnant women who participated in WIC and received WIC Program services during the first trimester of pregnancy.
Percentage of children less than 12 months of age who were served in the Child Health Clinic and received WIC Program services. (1)
Percentage of children 1 to 5 years of age who were served in the Child Health Clinic and received WIC Program Services. (1)
Percentage of children 1 to 5 years of age enrolled in Medicaid who received WIC Program Services.
Percentage of children less than 12 months of age enrolled in Medicaid who received WIC Program services.
Percentage of postpartum women who participated in WIC during pregnancy and were recertified for WIC by 6 weeks postpartum.
Percentage of women with live term singleton births who received WIC Program services during pregnancy and who gained recommended/excessive/inadequate weight according to the National Academy of Sciences ‐ Institute of Medicine 2009 recommended total weight gain ranges during pregnancy. (3)
Percentage of women who participated in WIC who initiated breastfeeding.
1C.
1A.
2A.
2B.
3A.
3B.
1B.
4B.
5A.
82.8% 80.0%
Num Den Percent
Percentage of children 2 to 4 years of age who received services from the health department and who, according to their Body Mass Index (BMI) for age and gender were:
4A.
Percentage of infants who participated in WIC who were: 5B.
77.9%
65.5%
51.8%
72.4%
59.3%
61.8%
68.2%
24.8%
44.4%
24.4%13.9%
77.0%
69.5%
47.2%
77.0%
73.3%
82.5%
60.2%
26.3%
43.8%
28.3%14.3%
83.8%
73.3%
67.2%
54.1%
69.0%
86.2%
81.6%
65.6%
24.3%
57.1%
37.5%22.7%
1.2%
‐5.9%
2.6%
4.3%
‐4.7%
45.5%
32.1%
‐3.7%
‐2.1%
28.6%
53.5%63.7%
20 24 83.3%
64 84 76.2%
217 310 70.0%
83 151 55.0%
56 85 65.9%
12 14 85.7%
67 87 77.0%
84 138 60.9%
8 30.8%26
50 97 51.5%
30 92 32.6%17 92 18.5%
49.6%25.6%
54.4%21.4%
9.6%‐16.6%
54.1%19.5%
12 46.2%6 23.1%
2626
At a healthy weight (BMI less than the 85th percentile but at or greater than the 5th percentile) (1)
a.
Overweight (BMI at or above the 85th percentile but less than the 95th percentile)
b.
Underweight (BMI less than the 5th percentile).
c.
Recommended prenatal weight gaina.
Excessive prenatal weight gainb.
Inadequate prenatal weight gainc.
Breastfeeding at 6 weeks of age (1)a.
Breastfeeding at 6 months of ageb.
14.9% 15.5% 13.9% ‐6.9% 24 138 17.4%
4.5% 4.5% 3.9% ‐12.8% 7 138 5.1%
2000 2008 Data
2002to
2003
2005to
2006
2008to
% Change from 2000
to 2008
Obese (BMI at or greater than the 95th percentile).
d.
12.4% 19.8% 16.6% 33.3% 23 138 16.7%
(2) These data exclude women enrolled in Medicaid only for emergency delivery.
(3) Recommended total prenatal weight gain range by prepregnancy weight category is 28-40 lbs. for underweight women (BMI<18.5); 25-35 lbs. for normal weight women (BMI 18.5 to 24.9); 15-25 lbs. for overweight women (BMI 25 to 29.9); and 11-20 lbs. for obese women (BMI >=30.0): Adapted from the National Academy of Sciences. Weight Gain During Pregnancy: Reexamining the Guidelines. Washington, DC : National Academy Press, 2009.
(1) Item appears also on other WCH Section Agreement Addenda.
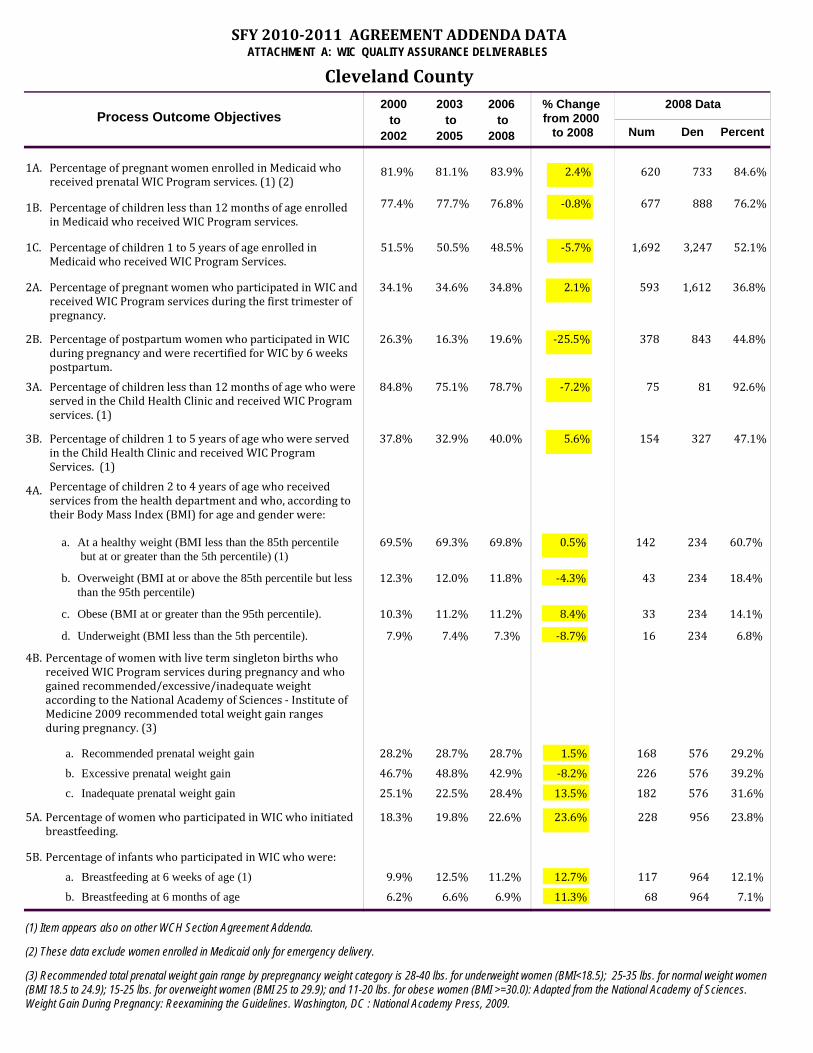
Cleveland CountyATTACHMENT A: WIC QUALITY ASSURANCE DELIVERABLES
SFY 20102011 AGREEMENT ADDENDA DATA
Process Outcome Objectives
Percentage of pregnant women enrolled in Medicaid who received prenatal WIC Program services. (1) (2)
Percentage of pregnant women who participated in WIC and received WIC Program services during the first trimester of pregnancy.
Percentage of children less than 12 months of age who were served in the Child Health Clinic and received WIC Program services. (1)
Percentage of children 1 to 5 years of age who were served in the Child Health Clinic and received WIC Program Services. (1)
Percentage of children 1 to 5 years of age enrolled in Medicaid who received WIC Program Services.
Percentage of children less than 12 months of age enrolled in Medicaid who received WIC Program services.
Percentage of postpartum women who participated in WIC during pregnancy and were recertified for WIC by 6 weeks postpartum.
Percentage of women with live term singleton births who received WIC Program services during pregnancy and who gained recommended/excessive/inadequate weight according to the National Academy of Sciences ‐ Institute of Medicine 2009 recommended total weight gain ranges during pregnancy. (3)
Percentage of women who participated in WIC who initiated breastfeeding.
1C.
1A.
2A.
2B.
3A.
3B.
1B.
4B.
5A.
81.9% 81.1%
Num Den Percent
Percentage of children 2 to 4 years of age who received services from the health department and who, according to their Body Mass Index (BMI) for age and gender were:
4A.
Percentage of infants who participated in WIC who were: 5B.
77.4%
51.5%
34.1%
26.3%
84.8%
37.8%
69.5%
28.2%
18.3%
9.9%6.2%
77.7%
50.5%
34.6%
16.3%
75.1%
32.9%
69.3%
28.7%
19.8%
12.5%6.6%
83.9%
76.8%
48.5%
34.8%
19.6%
78.7%
40.0%
69.8%
28.7%
22.6%
11.2%6.9%
2.4%
‐0.8%
‐5.7%
2.1%
‐25.5%
‐7.2%
5.6%
0.5%
1.5%
23.6%
12.7%11.3%
620 733 84.6%
677 888 76.2%
1,692 3,247 52.1%
593 1,612 36.8%
378 843 44.8%
75 81 92.6%
154 327 47.1%
142 234 60.7%
168 29.2%576
228 956 23.8%
117 964 12.1%68 964 7.1%
46.7%25.1%
42.9%28.4%
‐8.2%13.5%
48.8%22.5%
226 39.2%182 31.6%
576576
At a healthy weight (BMI less than the 85th percentile but at or greater than the 5th percentile) (1)
a.
Overweight (BMI at or above the 85th percentile but less than the 95th percentile)
b.
Underweight (BMI less than the 5th percentile).
c.
Recommended prenatal weight gaina.
Excessive prenatal weight gainb.
Inadequate prenatal weight gainc.
Breastfeeding at 6 weeks of age (1)a.
Breastfeeding at 6 months of ageb.
12.3% 12.0% 11.8% ‐4.3% 43 234 18.4%
7.9% 7.4% 7.3% ‐8.7% 16 234 6.8%
2000 2008 Data
2002to
2003
2005to
2006
2008to
% Change from 2000
to 2008
Obese (BMI at or greater than the 95th percentile).
d.
10.3% 11.2% 11.2% 8.4% 33 234 14.1%
(2) These data exclude women enrolled in Medicaid only for emergency delivery.
(3) Recommended total prenatal weight gain range by prepregnancy weight category is 28-40 lbs. for underweight women (BMI<18.5); 25-35 lbs. for normal weight women (BMI 18.5 to 24.9); 15-25 lbs. for overweight women (BMI 25 to 29.9); and 11-20 lbs. for obese women (BMI >=30.0): Adapted from the National Academy of Sciences. Weight Gain During Pregnancy: Reexamining the Guidelines. Washington, DC : National Academy Press, 2009.
(1) Item appears also on other WCH Section Agreement Addenda.

Columbus CountyATTACHMENT A: WIC QUALITY ASSURANCE DELIVERABLES
SFY 20102011 AGREEMENT ADDENDA DATA
Process Outcome Objectives
Percentage of pregnant women enrolled in Medicaid who received prenatal WIC Program services. (1) (2)
Percentage of pregnant women who participated in WIC and received WIC Program services during the first trimester of pregnancy.
Percentage of children less than 12 months of age who were served in the Child Health Clinic and received WIC Program services. (1)
Percentage of children 1 to 5 years of age who were served in the Child Health Clinic and received WIC Program Services. (1)
Percentage of children 1 to 5 years of age enrolled in Medicaid who received WIC Program Services.
Percentage of children less than 12 months of age enrolled in Medicaid who received WIC Program services.
Percentage of postpartum women who participated in WIC during pregnancy and were recertified for WIC by 6 weeks postpartum.
Percentage of women with live term singleton births who received WIC Program services during pregnancy and who gained recommended/excessive/inadequate weight according to the National Academy of Sciences ‐ Institute of Medicine 2009 recommended total weight gain ranges during pregnancy. (3)
Percentage of women who participated in WIC who initiated breastfeeding.
1C.
1A.
2A.
2B.
3A.
3B.
1B.
4B.
5A.
82.3% 74.1%
Num Den Percent
Percentage of children 2 to 4 years of age who received services from the health department and who, according to their Body Mass Index (BMI) for age and gender were:
4A.
Percentage of infants who participated in WIC who were: 5B.
80.4%
65.4%
37.9%
80.4%
90.5%
91.3%
69.4%
28.5%
13.9%
3.7%2.1%
79.6%
61.3%
30.1%
80.6%
93.3%
91.9%
66.7%
28.4%
42.4%
17.9%8.3%
69.6%
79.2%
59.0%
31.8%
83.1%
93.2%
92.4%
64.9%
26.0%
36.8%
22.6%13.3%
‐15.4%
‐1.5%
‐9.8%
‐16.2%
3.4%
3.0%
1.2%
‐6.5%
‐8.9%
164.6%
503.7%542.5%
353 477 74.0%
518 632 82.0%
1,549 2,457 63.0%
325 990 32.8%
461 539 85.5%
17 17 100.0%
157 174 90.2%
535 852 62.8%
106 24.7%430
251 684 36.7%
160 743 21.5%103 743 13.9%
46.4%25.0%
45.5%28.5%
‐1.9%13.7%
44.7%26.8%
188 43.7%136 31.6%
430430
At a healthy weight (BMI less than the 85th percentile but at or greater than the 5th percentile) (1)
a.
Overweight (BMI at or above the 85th percentile but less than the 95th percentile)
b.
Underweight (BMI less than the 5th percentile).
c.
Recommended prenatal weight gaina.
Excessive prenatal weight gainb.
Inadequate prenatal weight gainc.
Breastfeeding at 6 weeks of age (1)a.
Breastfeeding at 6 months of ageb.
13.4% 15.4% 15.3% 14.0% 137 852 16.1%
4.8% 4.7% 4.7% ‐1.8% 38 852 4.5%
2000 2008 Data
2002to
2003
2005to
2006
2008to
% Change from 2000
to 2008
Obese (BMI at or greater than the 95th percentile).
d.
12.4% 13.1% 15.1% 22.2% 142 852 16.7%
(2) These data exclude women enrolled in Medicaid only for emergency delivery.
(3) Recommended total prenatal weight gain range by prepregnancy weight category is 28-40 lbs. for underweight women (BMI<18.5); 25-35 lbs. for normal weight women (BMI 18.5 to 24.9); 15-25 lbs. for overweight women (BMI 25 to 29.9); and 11-20 lbs. for obese women (BMI >=30.0): Adapted from the National Academy of Sciences. Weight Gain During Pregnancy: Reexamining the Guidelines. Washington, DC : National Academy Press, 2009.
(1) Item appears also on other WCH Section Agreement Addenda.

Craven CountyATTACHMENT A: WIC QUALITY ASSURANCE DELIVERABLES
SFY 20102011 AGREEMENT ADDENDA DATA
Process Outcome Objectives
Percentage of pregnant women enrolled in Medicaid who received prenatal WIC Program services. (1) (2)
Percentage of pregnant women who participated in WIC and received WIC Program services during the first trimester of pregnancy.
Percentage of children less than 12 months of age who were served in the Child Health Clinic and received WIC Program services. (1)
Percentage of children 1 to 5 years of age who were served in the Child Health Clinic and received WIC Program Services. (1)
Percentage of children 1 to 5 years of age enrolled in Medicaid who received WIC Program Services.
Percentage of children less than 12 months of age enrolled in Medicaid who received WIC Program services.
Percentage of postpartum women who participated in WIC during pregnancy and were recertified for WIC by 6 weeks postpartum.
Percentage of women with live term singleton births who received WIC Program services during pregnancy and who gained recommended/excessive/inadequate weight according to the National Academy of Sciences ‐ Institute of Medicine 2009 recommended total weight gain ranges during pregnancy. (3)
Percentage of women who participated in WIC who initiated breastfeeding.
1C.
1A.
2A.
2B.
3A.
3B.
1B.
4B.
5A.
74.4% 78.8%
Num Den Percent
Percentage of children 2 to 4 years of age who received services from the health department and who, according to their Body Mass Index (BMI) for age and gender were:
4A.
Percentage of infants who participated in WIC who were: 5B.
75.3%
55.8%
32.3%
43.2%
91.7%
84.3%
69.6%
33.5%
56.6%
26.5%13.0%
77.8%
55.3%
30.2%
36.0%
85.0%
87.9%
66.4%
30.0%
49.7%
25.9%13.2%
79.6%
76.2%
53.5%
31.3%
31.9%
82.7%
82.3%
67.2%
34.2%
46.2%
24.7%13.0%
7.0%
1.3%
‐4.1%
‐3.3%
‐26.2%
‐9.8%
‐2.4%
‐3.4%
2.3%
‐18.3%
‐6.6%‐0.1%
515 641 80.3%
603 774 77.9%
1,522 2,677 56.9%
670 2,105 31.8%
378 1,129 33.5%
227 277 81.9%
440 547 80.4%
923 1,314 70.2%
244 34.4%710
587 1,363 43.1%
359 1,415 25.4%196 1,415 13.9%
46.6%19.9%
46.1%19.6%
‐1.0%‐1.5%
49.2%20.8%
316 44.5%150 21.1%
710710
At a healthy weight (BMI less than the 85th percentile but at or greater than the 5th percentile) (1)
a.
Overweight (BMI at or above the 85th percentile but less than the 95th percentile)
b.
Underweight (BMI less than the 5th percentile).
c.
Recommended prenatal weight gaina.
Excessive prenatal weight gainb.
Inadequate prenatal weight gainc.
Breastfeeding at 6 weeks of age (1)a.
Breastfeeding at 6 months of ageb.
13.6% 15.8% 15.5% 13.5% 185 1,314 14.1%
5.4% 4.5% 3.8% ‐28.6% 42 1,314 3.2%
2000 2008 Data
2002to
2003
2005to
2006
2008to
% Change from 2000
to 2008
Obese (BMI at or greater than the 95th percentile).
d.
11.5% 13.4% 13.5% 18.1% 164 1,314 12.5%
(2) These data exclude women enrolled in Medicaid only for emergency delivery.
(3) Recommended total prenatal weight gain range by prepregnancy weight category is 28-40 lbs. for underweight women (BMI<18.5); 25-35 lbs. for normal weight women (BMI 18.5 to 24.9); 15-25 lbs. for overweight women (BMI 25 to 29.9); and 11-20 lbs. for obese women (BMI >=30.0): Adapted from the National Academy of Sciences. Weight Gain During Pregnancy: Reexamining the Guidelines. Washington, DC : National Academy Press, 2009.
(1) Item appears also on other WCH Section Agreement Addenda.

Cumberland CountyATTACHMENT A: WIC QUALITY ASSURANCE DELIVERABLES
SFY 20102011 AGREEMENT ADDENDA DATA
Process Outcome Objectives
Percentage of pregnant women enrolled in Medicaid who received prenatal WIC Program services. (1) (2)
Percentage of pregnant women who participated in WIC and received WIC Program services during the first trimester of pregnancy.
Percentage of children less than 12 months of age who were served in the Child Health Clinic and received WIC Program services. (1)
Percentage of children 1 to 5 years of age who were served in the Child Health Clinic and received WIC Program Services. (1)
Percentage of children 1 to 5 years of age enrolled in Medicaid who received WIC Program Services.
Percentage of children less than 12 months of age enrolled in Medicaid who received WIC Program services.
Percentage of postpartum women who participated in WIC during pregnancy and were recertified for WIC by 6 weeks postpartum.
Percentage of women with live term singleton births who received WIC Program services during pregnancy and who gained recommended/excessive/inadequate weight according to the National Academy of Sciences ‐ Institute of Medicine 2009 recommended total weight gain ranges during pregnancy. (3)
Percentage of women who participated in WIC who initiated breastfeeding.
1C.
1A.
2A.
2B.
3A.
3B.
1B.
4B.
5A.
73.3% 74.4%
Num Den Percent
Percentage of children 2 to 4 years of age who received services from the health department and who, according to their Body Mass Index (BMI) for age and gender were:
4A.
Percentage of infants who participated in WIC who were: 5B.
76.0%
56.7%
31.4%
76.1%
65.0%
71.6%
73.0%
32.1%
49.3%
22.8%9.9%
78.6%
56.7%
31.9%
75.4%
72.4%
75.8%
72.7%
32.3%
53.5%
22.9%10.1%
74.8%
77.2%
53.9%
30.1%
76.1%
61.8%
68.6%
74.6%
28.9%
56.5%
26.5%11.3%
2.1%
1.5%
‐4.9%
‐4.2%
0.0%
‐4.9%
‐4.2%
2.1%
‐10.0%
14.6%
16.4%14.0%
1,592 2,079 76.6%
2,068 2,660 77.7%
5,541 9,805 56.5%
2,150 6,968 30.9%
2,856 3,783 75.5%
117 173 67.6%
254 380 66.8%
3,635 4,933 73.7%
773 29.1%2,654
3,039 5,175 58.7%
1,370 4,964 27.6%553 4,964 11.1%
50.7%17.1%
52.9%18.2%
4.3%6.1%
50.6%17.1%
1,423 53.6%458 17.3%
2,6542,654
At a healthy weight (BMI less than the 85th percentile but at or greater than the 5th percentile) (1)
a.
Overweight (BMI at or above the 85th percentile but less than the 95th percentile)
b.
Underweight (BMI less than the 5th percentile).
c.
Recommended prenatal weight gaina.
Excessive prenatal weight gainb.
Inadequate prenatal weight gainc.
Breastfeeding at 6 weeks of age (1)a.
Breastfeeding at 6 months of ageb.
12.6% 12.4% 10.0% ‐20.5% 487 4,933 9.9%
5.1% 6.1% 8.0% 58.9% 460 4,933 9.3%
2000 2008 Data
2002to
2003
2005to
2006
2008to
% Change from 2000
to 2008
Obese (BMI at or greater than the 95th percentile).
d.
9.3% 8.8% 7.4% ‐20.8% 351 4,933 7.1%
(2) These data exclude women enrolled in Medicaid only for emergency delivery.
(3) Recommended total prenatal weight gain range by prepregnancy weight category is 28-40 lbs. for underweight women (BMI<18.5); 25-35 lbs. for normal weight women (BMI 18.5 to 24.9); 15-25 lbs. for overweight women (BMI 25 to 29.9); and 11-20 lbs. for obese women (BMI >=30.0): Adapted from the National Academy of Sciences. Weight Gain During Pregnancy: Reexamining the Guidelines. Washington, DC : National Academy Press, 2009.
(1) Item appears also on other WCH Section Agreement Addenda.

Dare CountyATTACHMENT A: WIC QUALITY ASSURANCE DELIVERABLES
SFY 20102011 AGREEMENT ADDENDA DATA
Process Outcome Objectives
Percentage of pregnant women enrolled in Medicaid who received prenatal WIC Program services. (1) (2)
Percentage of pregnant women who participated in WIC and received WIC Program services during the first trimester of pregnancy.
Percentage of children less than 12 months of age who were served in the Child Health Clinic and received WIC Program services. (1)
Percentage of children 1 to 5 years of age who were served in the Child Health Clinic and received WIC Program Services. (1)
Percentage of children 1 to 5 years of age enrolled in Medicaid who received WIC Program Services.
Percentage of children less than 12 months of age enrolled in Medicaid who received WIC Program services.
Percentage of postpartum women who participated in WIC during pregnancy and were recertified for WIC by 6 weeks postpartum.
Percentage of women with live term singleton births who received WIC Program services during pregnancy and who gained recommended/excessive/inadequate weight according to the National Academy of Sciences ‐ Institute of Medicine 2009 recommended total weight gain ranges during pregnancy. (3)
Percentage of women who participated in WIC who initiated breastfeeding.
1C.
1A.
2A.
2B.
3A.
3B.
1B.
4B.
5A.
69.6% 61.2%
Num Den Percent
Percentage of children 2 to 4 years of age who received services from the health department and who, according to their Body Mass Index (BMI) for age and gender were:
4A.
Percentage of infants who participated in WIC who were: 5B.
59.1%
60.1%
34.3%
70.3%
83.3%
76.2%
64.9%
34.3%
59.0%
46.6%23.7%
59.0%
56.1%
26.3%
65.0%
83.6%
78.3%
65.8%
37.5%
59.1%
50.4%25.5%
64.1%
65.0%
51.8%
31.7%
71.9%
81.0%
78.6%
63.5%
36.1%
64.3%
60.4%32.4%
‐7.9%
9.8%
‐13.7%
‐7.5%
2.4%
‐2.9%
3.2%
‐2.2%
5.5%
8.8%
29.7%37.1%
86 128 67.2%
181 259 69.9%
506 896 56.5%
146 471 31.0%
175 238 73.5%
20 22 90.9%
71 85 83.5%
204 318 64.2%
57 37.3%153
196 290 67.6%
139 245 56.7%72 245 29.4%
48.4%17.3%
39.5%24.4%
‐18.5%40.8%
43.4%19.0%
52 34.0%44 28.8%
153153
At a healthy weight (BMI less than the 85th percentile but at or greater than the 5th percentile) (1)
a.
Overweight (BMI at or above the 85th percentile but less than the 95th percentile)
b.
Underweight (BMI less than the 5th percentile).
c.
Recommended prenatal weight gaina.
Excessive prenatal weight gainb.
Inadequate prenatal weight gainc.
Breastfeeding at 6 weeks of age (1)a.
Breastfeeding at 6 months of ageb.
17.2% 18.0% 16.1% ‐6.3% 51 318 16.0%
5.9% 1.5% 2.5% ‐57.3% 12 318 3.8%
2000 2008 Data
2002to
2003
2005to
2006
2008to
% Change from 2000
to 2008
Obese (BMI at or greater than the 95th percentile).
d.
12.0% 14.6% 17.9% 49.0% 51 318 16.0%
(2) These data exclude women enrolled in Medicaid only for emergency delivery.
(3) Recommended total prenatal weight gain range by prepregnancy weight category is 28-40 lbs. for underweight women (BMI<18.5); 25-35 lbs. for normal weight women (BMI 18.5 to 24.9); 15-25 lbs. for overweight women (BMI 25 to 29.9); and 11-20 lbs. for obese women (BMI >=30.0): Adapted from the National Academy of Sciences. Weight Gain During Pregnancy: Reexamining the Guidelines. Washington, DC : National Academy Press, 2009.
(1) Item appears also on other WCH Section Agreement Addenda.

Davidson CountyATTACHMENT A: WIC QUALITY ASSURANCE DELIVERABLES
SFY 20102011 AGREEMENT ADDENDA DATA
Process Outcome Objectives
Percentage of pregnant women enrolled in Medicaid who received prenatal WIC Program services. (1) (2)
Percentage of pregnant women who participated in WIC and received WIC Program services during the first trimester of pregnancy.
Percentage of children less than 12 months of age who were served in the Child Health Clinic and received WIC Program services. (1)
Percentage of children 1 to 5 years of age who were served in the Child Health Clinic and received WIC Program Services. (1)
Percentage of children 1 to 5 years of age enrolled in Medicaid who received WIC Program Services.
Percentage of children less than 12 months of age enrolled in Medicaid who received WIC Program services.
Percentage of postpartum women who participated in WIC during pregnancy and were recertified for WIC by 6 weeks postpartum.
Percentage of women with live term singleton births who received WIC Program services during pregnancy and who gained recommended/excessive/inadequate weight according to the National Academy of Sciences ‐ Institute of Medicine 2009 recommended total weight gain ranges during pregnancy. (3)
Percentage of women who participated in WIC who initiated breastfeeding.
1C.
1A.
2A.
2B.
3A.
3B.
1B.
4B.
5A.
66.2% 68.5%
Num Den Percent
Percentage of children 2 to 4 years of age who received services from the health department and who, according to their Body Mass Index (BMI) for age and gender were:
4A.
Percentage of infants who participated in WIC who were: 5B.
75.3%
58.5%
38.8%
72.2%
58.3%
79.7%
69.9%
30.6%
42.7%
24.2%11.7%
69.9%
52.3%
33.0%
74.2%
44.4%
77.1%
70.3%
30.8%
52.4%
27.7%14.2%
70.7%
73.3%
50.2%
30.4%
76.5%
70.7%
67.9%
33.6%
58.3%
27.9%14.0%
6.9%
‐2.6%
‐14.2%
‐21.6%
6.0%
‐11.2%
‐2.8%
9.8%
36.6%
15.2%19.5%
698 981 71.2%
998 1,336 74.7%
2,538 4,667 54.4%
531 1,688 31.5%
824 1,043 79.0%
13 20 65.0%
917 1,341 68.4%
300 35.2%852
875 1,376 63.6%
417 1,423 29.3%230 1,423 16.2%
49.5%19.9%
42.5%23.9%
‐14.2%20.4%
47.8%21.4%
342 40.1%210 24.6%
852852
At a healthy weight (BMI less than the 85th percentile but at or greater than the 5th percentile) (1)
a.
Overweight (BMI at or above the 85th percentile but less than the 95th percentile)
b.
Underweight (BMI less than the 5th percentile).
c.
Recommended prenatal weight gaina.
Excessive prenatal weight gainb.
Inadequate prenatal weight gainc.
Breastfeeding at 6 weeks of age (1)a.
Breastfeeding at 6 months of ageb.
14.6% 14.2% 14.7% 0.8% 199 1,341 14.8%
4.0% 3.7% 3.4% ‐16.9% 30 1,341 2.2%
2000 2008 Data
2002to
2003
2005to
2006
2008to
% Change from 2000
to 2008
Obese (BMI at or greater than the 95th percentile).
d.
11.5% 11.8% 14.0% 22.0% 195 1,341 14.5%
(2) These data exclude women enrolled in Medicaid only for emergency delivery.
(3) Recommended total prenatal weight gain range by prepregnancy weight category is 28-40 lbs. for underweight women (BMI<18.5); 25-35 lbs. for normal weight women (BMI 18.5 to 24.9); 15-25 lbs. for overweight women (BMI 25 to 29.9); and 11-20 lbs. for obese women (BMI >=30.0): Adapted from the National Academy of Sciences. Weight Gain During Pregnancy: Reexamining the Guidelines. Washington, DC : National Academy Press, 2009.
(1) Item appears also on other WCH Section Agreement Addenda.

Davie CountyATTACHMENT A: WIC QUALITY ASSURANCE DELIVERABLES
SFY 20102011 AGREEMENT ADDENDA DATA
Process Outcome Objectives
Percentage of pregnant women enrolled in Medicaid who received prenatal WIC Program services. (1) (2)
Percentage of pregnant women who participated in WIC and received WIC Program services during the first trimester of pregnancy.
Percentage of children less than 12 months of age who were served in the Child Health Clinic and received WIC Program services. (1)
Percentage of children 1 to 5 years of age who were served in the Child Health Clinic and received WIC Program Services. (1)
Percentage of children 1 to 5 years of age enrolled in Medicaid who received WIC Program Services.
Percentage of children less than 12 months of age enrolled in Medicaid who received WIC Program services.
Percentage of postpartum women who participated in WIC during pregnancy and were recertified for WIC by 6 weeks postpartum.
Percentage of women with live term singleton births who received WIC Program services during pregnancy and who gained recommended/excessive/inadequate weight according to the National Academy of Sciences ‐ Institute of Medicine 2009 recommended total weight gain ranges during pregnancy. (3)
Percentage of women who participated in WIC who initiated breastfeeding.
1C.
1A.
2A.
2B.
3A.
3B.
1B.
4B.
5A.
77.4% 72.2%
Num Den Percent
Percentage of children 2 to 4 years of age who received services from the health department and who, according to their Body Mass Index (BMI) for age and gender were:
4A.
Percentage of infants who participated in WIC who were: 5B.
68.7%
65.1%
33.1%
69.4%
87.3%
63.1%
65.6%
27.9%
51.9%
35.1%17.4%
71.3%
62.0%
27.4%
70.3%
89.8%
86.0%
64.0%
34.8%
50.1%
32.9%19.2%
72.2%
70.9%
57.1%
24.3%
67.1%
89.9%
88.6%
66.7%
29.7%
54.8%
32.9%17.1%
‐6.7%
3.3%
‐12.3%
‐26.6%
‐3.4%
3.0%
40.3%
1.7%
6.4%
5.6%
‐6.2%‐1.6%
121 178 68.0%
191 259 73.7%
531 924 57.5%
111 455 24.4%
139 210 66.2%
104 112 92.9%
194 217 89.4%
201 296 67.9%
57 32.0%178
146 278 52.5%
94 292 32.2%56 292 19.2%
46.7%25.5%
50.2%20.2%
7.6%‐20.8%
45.9%19.3%
88 49.4%33 18.5%
178178
At a healthy weight (BMI less than the 85th percentile but at or greater than the 5th percentile) (1)
a.
Overweight (BMI at or above the 85th percentile but less than the 95th percentile)
b.
Underweight (BMI less than the 5th percentile).
c.
Recommended prenatal weight gaina.
Excessive prenatal weight gainb.
Inadequate prenatal weight gainc.
Breastfeeding at 6 weeks of age (1)a.
Breastfeeding at 6 months of ageb.
16.7% 16.5% 15.7% ‐6.1% 43 296 14.5%
3.8% 1.8% 2.7% ‐29.0% 7 296 2.4%
2000 2008 Data
2002to
2003
2005to
2006
2008to
% Change from 2000
to 2008
Obese (BMI at or greater than the 95th percentile).
d.
13.9% 17.8% 14.9% 7.2% 45 296 15.2%
(2) These data exclude women enrolled in Medicaid only for emergency delivery.
(3) Recommended total prenatal weight gain range by prepregnancy weight category is 28-40 lbs. for underweight women (BMI<18.5); 25-35 lbs. for normal weight women (BMI 18.5 to 24.9); 15-25 lbs. for overweight women (BMI 25 to 29.9); and 11-20 lbs. for obese women (BMI >=30.0): Adapted from the National Academy of Sciences. Weight Gain During Pregnancy: Reexamining the Guidelines. Washington, DC : National Academy Press, 2009.
(1) Item appears also on other WCH Section Agreement Addenda.

Duplin CountyATTACHMENT A: WIC QUALITY ASSURANCE DELIVERABLES
SFY 20102011 AGREEMENT ADDENDA DATA
Process Outcome Objectives
Percentage of pregnant women enrolled in Medicaid who received prenatal WIC Program services. (1) (2)
Percentage of pregnant women who participated in WIC and received WIC Program services during the first trimester of pregnancy.
Percentage of children less than 12 months of age who were served in the Child Health Clinic and received WIC Program services. (1)
Percentage of children 1 to 5 years of age who were served in the Child Health Clinic and received WIC Program Services. (1)
Percentage of children 1 to 5 years of age enrolled in Medicaid who received WIC Program Services.
Percentage of children less than 12 months of age enrolled in Medicaid who received WIC Program services.
Percentage of postpartum women who participated in WIC during pregnancy and were recertified for WIC by 6 weeks postpartum.
Percentage of women with live term singleton births who received WIC Program services during pregnancy and who gained recommended/excessive/inadequate weight according to the National Academy of Sciences ‐ Institute of Medicine 2009 recommended total weight gain ranges during pregnancy. (3)
Percentage of women who participated in WIC who initiated breastfeeding.
1C.
1A.
2A.
2B.
3A.
3B.
1B.
4B.
5A.
74.6% 73.3%
Num Den Percent
Percentage of children 2 to 4 years of age who received services from the health department and who, according to their Body Mass Index (BMI) for age and gender were:
4A.
Percentage of infants who participated in WIC who were: 5B.
71.7%
65.0%
37.0%
82.7%
76.6%
84.6%
61.7%
32.9%
48.8%
26.7%14.6%
73.3%
63.0%
31.5%
83.1%
81.2%
82.9%
57.6%
34.2%
55.1%
26.1%13.0%
73.3%
78.0%
63.6%
30.6%
85.1%
88.3%
83.6%
57.9%
31.1%
51.6%
25.2%11.8%
‐1.7%
8.9%
‐2.2%
‐17.3%
2.9%
15.3%
‐1.2%
‐6.2%
‐5.5%
5.8%
‐5.5%‐19.3%
248 333 74.5%
494 631 78.3%
1,577 2,347 67.2%
346 1,053 32.9%
492 574 85.7%
159 179 88.8%
313 370 84.6%
259 429 60.4%
83 32.3%257
391 764 51.2%
215 795 27.0%105 795 13.2%
37.8%29.3%
40.7%28.2%
7.7%‐3.8%
41.6%24.2%
89 34.6%85 33.1%
257257
At a healthy weight (BMI less than the 85th percentile but at or greater than the 5th percentile) (1)
a.
Overweight (BMI at or above the 85th percentile but less than the 95th percentile)
b.
Underweight (BMI less than the 5th percentile).
c.
Recommended prenatal weight gaina.
Excessive prenatal weight gainb.
Inadequate prenatal weight gainc.
Breastfeeding at 6 weeks of age (1)a.
Breastfeeding at 6 months of ageb.
11.9% 14.3% 16.4% 38.4% 76 429 17.7%
11.2% 11.4% 6.7% ‐39.8% 14 429 3.3%
2000 2008 Data
2002to
2003
2005to
2006
2008to
% Change from 2000
to 2008
Obese (BMI at or greater than the 95th percentile).
d.
15.2% 16.8% 19.0% 24.4% 80 429 18.6%
(2) These data exclude women enrolled in Medicaid only for emergency delivery.
(3) Recommended total prenatal weight gain range by prepregnancy weight category is 28-40 lbs. for underweight women (BMI<18.5); 25-35 lbs. for normal weight women (BMI 18.5 to 24.9); 15-25 lbs. for overweight women (BMI 25 to 29.9); and 11-20 lbs. for obese women (BMI >=30.0): Adapted from the National Academy of Sciences. Weight Gain During Pregnancy: Reexamining the Guidelines. Washington, DC : National Academy Press, 2009.
(1) Item appears also on other WCH Section Agreement Addenda.

Durham CountyATTACHMENT A: WIC QUALITY ASSURANCE DELIVERABLES
SFY 20102011 AGREEMENT ADDENDA DATA
Process Outcome Objectives
Percentage of pregnant women enrolled in Medicaid who received prenatal WIC Program services. (1) (2)
Percentage of pregnant women who participated in WIC and received WIC Program services during the first trimester of pregnancy.
Percentage of children less than 12 months of age who were served in the Child Health Clinic and received WIC Program services. (1)
Percentage of children 1 to 5 years of age who were served in the Child Health Clinic and received WIC Program Services. (1)
Percentage of children 1 to 5 years of age enrolled in Medicaid who received WIC Program Services.
Percentage of children less than 12 months of age enrolled in Medicaid who received WIC Program services.
Percentage of postpartum women who participated in WIC during pregnancy and were recertified for WIC by 6 weeks postpartum.
Percentage of women with live term singleton births who received WIC Program services during pregnancy and who gained recommended/excessive/inadequate weight according to the National Academy of Sciences ‐ Institute of Medicine 2009 recommended total weight gain ranges during pregnancy. (3)
Percentage of women who participated in WIC who initiated breastfeeding.
1C.
1A.
2A.
2B.
3A.
3B.
1B.
4B.
5A.
67.0% 67.4%
Num Den Percent
Percentage of children 2 to 4 years of age who received services from the health department and who, according to their Body Mass Index (BMI) for age and gender were:
4A.
Percentage of infants who participated in WIC who were: 5B.
66.8%
54.1%
25.7%
70.2%
50.0%
74.1%
34.2%
51.7%
34.0%18.6%
66.7%
56.3%
21.2%
71.4%
63.7%
36.4%
54.0%
37.1%20.3%
60.4%
65.7%
52.3%
21.0%
75.4%
56.5%
33.7%
61.4%
42.9%23.7%
‐9.9%
‐1.6%
‐3.3%
‐18.3%
7.4%
‐23.7%
‐1.4%
18.9%
26.2%27.3%
864 1,351 64.0%
1,792 2,683 66.8%
4,749 8,576 55.4%
642 2,580 24.9%
1,318 1,719 76.7%
1,539 2,514 61.2%
449 32.5%1,381
1,460 2,523 57.9%
1,100 2,606 42.2%626 2,606 24.0%
43.9%21.9%
42.7%23.5%
‐2.6%7.3%
38.2%25.4%
615 44.5%317 23.0%
1,3811,381
At a healthy weight (BMI less than the 85th percentile but at or greater than the 5th percentile) (1)
a.
Overweight (BMI at or above the 85th percentile but less than the 95th percentile)
b.
Underweight (BMI less than the 5th percentile).
c.
Recommended prenatal weight gaina.
Excessive prenatal weight gainb.
Inadequate prenatal weight gainc.
Breastfeeding at 6 weeks of age (1)a.
Breastfeeding at 6 months of ageb.
10.6% 12.7% 17.1% 60.7% 369 2,514 14.7%
6.2% 6.0% 3.2% ‐48.9% 112 2,514 4.5%
2000 2008 Data
2002to
2003
2005to
2006
2008to
% Change from 2000
to 2008
Obese (BMI at or greater than the 95th percentile).
d.
9.2% 17.6% 23.3% 154.1% 494 2,514 19.6%
(2) These data exclude women enrolled in Medicaid only for emergency delivery.
(3) Recommended total prenatal weight gain range by prepregnancy weight category is 28-40 lbs. for underweight women (BMI<18.5); 25-35 lbs. for normal weight women (BMI 18.5 to 24.9); 15-25 lbs. for overweight women (BMI 25 to 29.9); and 11-20 lbs. for obese women (BMI >=30.0): Adapted from the National Academy of Sciences. Weight Gain During Pregnancy: Reexamining the Guidelines. Washington, DC : National Academy Press, 2009.
(1) Item appears also on other WCH Section Agreement Addenda.

Edgecombe CountyATTACHMENT A: WIC QUALITY ASSURANCE DELIVERABLES
SFY 20102011 AGREEMENT ADDENDA DATA
Process Outcome Objectives
Percentage of pregnant women enrolled in Medicaid who received prenatal WIC Program services. (1) (2)
Percentage of pregnant women who participated in WIC and received WIC Program services during the first trimester of pregnancy.
Percentage of children less than 12 months of age who were served in the Child Health Clinic and received WIC Program services. (1)
Percentage of children 1 to 5 years of age who were served in the Child Health Clinic and received WIC Program Services. (1)
Percentage of children 1 to 5 years of age enrolled in Medicaid who received WIC Program Services.
Percentage of children less than 12 months of age enrolled in Medicaid who received WIC Program services.
Percentage of postpartum women who participated in WIC during pregnancy and were recertified for WIC by 6 weeks postpartum.
Percentage of women with live term singleton births who received WIC Program services during pregnancy and who gained recommended/excessive/inadequate weight according to the National Academy of Sciences ‐ Institute of Medicine 2009 recommended total weight gain ranges during pregnancy. (3)
Percentage of women who participated in WIC who initiated breastfeeding.
1C.
1A.
2A.
2B.
3A.
3B.
1B.
4B.
5A.
80.7% 82.9%
Num Den Percent
Percentage of children 2 to 4 years of age who received services from the health department and who, according to their Body Mass Index (BMI) for age and gender were:
4A.
Percentage of infants who participated in WIC who were: 5B.
76.9%
58.8%
28.3%
68.5%
92.5%
49.8%
64.6%
35.9%
26.2%
15.2%7.8%
76.5%
58.9%
27.6%
71.6%
90.7%
86.6%
65.3%
34.2%
30.6%
16.3%8.8%
84.7%
72.6%
53.9%
28.1%
70.1%
72.5%
70.5%
66.1%
28.8%
29.1%
16.0%6.4%
5.0%
‐5.5%
‐8.4%
‐0.9%
2.3%
‐21.6%
41.6%
2.2%
‐19.9%
10.9%
5.5%‐18.1%
479 568 84.3%
501 712 70.4%
1,356 2,470 54.9%
319 1,078 29.6%
427 618 69.1%
29 39 74.4%
55 81 67.9%
145 227 63.9%
87 28.9%301
220 717 30.7%
117 722 16.2%43 722 6.0%
37.2%26.9%
43.7%27.5%
17.5%2.4%
39.4%26.4%
128 42.5%86 28.6%
301301
At a healthy weight (BMI less than the 85th percentile but at or greater than the 5th percentile) (1)
a.
Overweight (BMI at or above the 85th percentile but less than the 95th percentile)
b.
Underweight (BMI less than the 5th percentile).
c.
Recommended prenatal weight gaina.
Excessive prenatal weight gainb.
Inadequate prenatal weight gainc.
Breastfeeding at 6 weeks of age (1)a.
Breastfeeding at 6 months of ageb.
14.8% 15.7% 15.0% 1.4% 40 227 17.6%
3.5% 3.0% 3.4% ‐1.1% 6 227 2.6%
2000 2008 Data
2002to
2003
2005to
2006
2008to
% Change from 2000
to 2008
Obese (BMI at or greater than the 95th percentile).
d.
17.1% 16.0% 15.5% ‐9.2% 36 227 15.9%
(2) These data exclude women enrolled in Medicaid only for emergency delivery.
(3) Recommended total prenatal weight gain range by prepregnancy weight category is 28-40 lbs. for underweight women (BMI<18.5); 25-35 lbs. for normal weight women (BMI 18.5 to 24.9); 15-25 lbs. for overweight women (BMI 25 to 29.9); and 11-20 lbs. for obese women (BMI >=30.0): Adapted from the National Academy of Sciences. Weight Gain During Pregnancy: Reexamining the Guidelines. Washington, DC : National Academy Press, 2009.
(1) Item appears also on other WCH Section Agreement Addenda.

Forsyth CountyATTACHMENT A: WIC QUALITY ASSURANCE DELIVERABLES
SFY 20102011 AGREEMENT ADDENDA DATA
Process Outcome Objectives
Percentage of pregnant women enrolled in Medicaid who received prenatal WIC Program services. (1) (2)
Percentage of pregnant women who participated in WIC and received WIC Program services during the first trimester of pregnancy.
Percentage of children less than 12 months of age who were served in the Child Health Clinic and received WIC Program services. (1)
Percentage of children 1 to 5 years of age who were served in the Child Health Clinic and received WIC Program Services. (1)
Percentage of children 1 to 5 years of age enrolled in Medicaid who received WIC Program Services.
Percentage of children less than 12 months of age enrolled in Medicaid who received WIC Program services.
Percentage of postpartum women who participated in WIC during pregnancy and were recertified for WIC by 6 weeks postpartum.
Percentage of women with live term singleton births who received WIC Program services during pregnancy and who gained recommended/excessive/inadequate weight according to the National Academy of Sciences ‐ Institute of Medicine 2009 recommended total weight gain ranges during pregnancy. (3)
Percentage of women who participated in WIC who initiated breastfeeding.
1C.
1A.
2A.
2B.
3A.
3B.
1B.
4B.
5A.
69.3% 67.8%
Num Den Percent
Percentage of children 2 to 4 years of age who received services from the health department and who, according to their Body Mass Index (BMI) for age and gender were:
4A.
Percentage of infants who participated in WIC who were: 5B.
66.4%
51.5%
27.2%
78.9%
71.4%
56.8%
68.9%
34.0%
62.8%
34.7%18.9%
66.8%
52.4%
23.0%
81.2%
100.0%
59.0%
66.2%
32.9%
67.2%
40.6%25.7%
62.6%
69.5%
53.0%
29.5%
84.2%
41.9%
65.1%
32.4%
71.3%
45.0%24.7%
‐9.8%
4.7%
2.8%
8.7%
6.8%
‐26.4%
‐5.5%
‐4.7%
13.6%
29.9%30.6%
1,301 1,896 68.6%
2,399 3,292 72.9%
6,652 11,802 56.4%
1,454 4,261 34.1%
2,398 2,840 84.4%
7 26 26.9%
2,247 3,513 64.0%
645 31.0%2,079
2,504 3,510 71.3%
1,565 3,440 45.5%890 3,440 25.9%
41.4%24.6%
44.3%23.3%
7.0%‐5.3%
42.6%24.5%
935 45.0%499 24.0%
2,0792,079
At a healthy weight (BMI less than the 85th percentile but at or greater than the 5th percentile) (1)
a.
Overweight (BMI at or above the 85th percentile but less than the 95th percentile)
b.
Underweight (BMI less than the 5th percentile).
c.
Recommended prenatal weight gaina.
Excessive prenatal weight gainb.
Inadequate prenatal weight gainc.
Breastfeeding at 6 weeks of age (1)a.
Breastfeeding at 6 months of ageb.
14.2% 15.8% 16.8% 18.2% 624 3,513 17.8%
5.0% 3.5% 2.8% ‐44.4% 102 3,513 2.9%
2000 2008 Data
2002to
2003
2005to
2006
2008to
% Change from 2000
to 2008
Obese (BMI at or greater than the 95th percentile).
d.
11.8% 14.5% 15.3% 29.2% 540 3,513 15.4%
(2) These data exclude women enrolled in Medicaid only for emergency delivery.
(3) Recommended total prenatal weight gain range by prepregnancy weight category is 28-40 lbs. for underweight women (BMI<18.5); 25-35 lbs. for normal weight women (BMI 18.5 to 24.9); 15-25 lbs. for overweight women (BMI 25 to 29.9); and 11-20 lbs. for obese women (BMI >=30.0): Adapted from the National Academy of Sciences. Weight Gain During Pregnancy: Reexamining the Guidelines. Washington, DC : National Academy Press, 2009.
(1) Item appears also on other WCH Section Agreement Addenda.

Franklin CountyATTACHMENT A: WIC QUALITY ASSURANCE DELIVERABLES
SFY 20102011 AGREEMENT ADDENDA DATA
Process Outcome Objectives
Percentage of pregnant women enrolled in Medicaid who received prenatal WIC Program services. (1) (2)
Percentage of pregnant women who participated in WIC and received WIC Program services during the first trimester of pregnancy.
Percentage of children less than 12 months of age who were served in the Child Health Clinic and received WIC Program services. (1)
Percentage of children 1 to 5 years of age who were served in the Child Health Clinic and received WIC Program Services. (1)
Percentage of children 1 to 5 years of age enrolled in Medicaid who received WIC Program Services.
Percentage of children less than 12 months of age enrolled in Medicaid who received WIC Program services.
Percentage of postpartum women who participated in WIC during pregnancy and were recertified for WIC by 6 weeks postpartum.
Percentage of women with live term singleton births who received WIC Program services during pregnancy and who gained recommended/excessive/inadequate weight according to the National Academy of Sciences ‐ Institute of Medicine 2009 recommended total weight gain ranges during pregnancy. (3)
Percentage of women who participated in WIC who initiated breastfeeding.
1C.
1A.
2A.
2B.
3A.
3B.
1B.
4B.
5A.
75.2% 74.6%
Num Den Percent
Percentage of children 2 to 4 years of age who received services from the health department and who, according to their Body Mass Index (BMI) for age and gender were:
4A.
Percentage of infants who participated in WIC who were: 5B.
71.8%
58.8%
30.1%
77.3%
93.3%
87.0%
63.5%
34.2%
29.3%
19.2%10.2%
72.5%
55.3%
25.6%
78.2%
94.1%
88.3%
65.5%
34.9%
40.0%
26.0%12.8%
71.0%
75.0%
54.3%
23.5%
78.8%
94.0%
91.6%
57.8%
31.4%
41.6%
25.4%13.3%
‐5.6%
4.4%
‐7.7%
‐21.8%
1.9%
0.8%
5.3%
‐8.9%
‐8.2%
42.0%
32.1%29.7%
215 311 69.1%
358 479 74.7%
961 1,688 56.9%
191 783 24.4%
267 343 77.8%
303 319 95.0%
503 551 91.3%
250 544 46.0%
100 32.6%307
187 451 41.5%
130 517 25.1%72 517 13.9%
42.7%23.1%
42.7%25.9%
0.0%12.2%
40.7%24.4%
139 45.3%68 22.1%
307307
At a healthy weight (BMI less than the 85th percentile but at or greater than the 5th percentile) (1)
a.
Overweight (BMI at or above the 85th percentile but less than the 95th percentile)
b.
Underweight (BMI less than the 5th percentile).
c.
Recommended prenatal weight gaina.
Excessive prenatal weight gainb.
Inadequate prenatal weight gainc.
Breastfeeding at 6 weeks of age (1)a.
Breastfeeding at 6 months of ageb.
17.4% 16.4% 20.0% 15.0% 129 544 23.7%
4.0% 4.0% 2.6% ‐33.8% 12 544 2.2%
2000 2008 Data
2002to
2003
2005to
2006
2008to
% Change from 2000
to 2008
Obese (BMI at or greater than the 95th percentile).
d.
15.2% 14.2% 19.6% 28.7% 153 544 28.1%
(2) These data exclude women enrolled in Medicaid only for emergency delivery.
(3) Recommended total prenatal weight gain range by prepregnancy weight category is 28-40 lbs. for underweight women (BMI<18.5); 25-35 lbs. for normal weight women (BMI 18.5 to 24.9); 15-25 lbs. for overweight women (BMI 25 to 29.9); and 11-20 lbs. for obese women (BMI >=30.0): Adapted from the National Academy of Sciences. Weight Gain During Pregnancy: Reexamining the Guidelines. Washington, DC : National Academy Press, 2009.
(1) Item appears also on other WCH Section Agreement Addenda.

Gaston CountyATTACHMENT A: WIC QUALITY ASSURANCE DELIVERABLES
SFY 20102011 AGREEMENT ADDENDA DATA
Process Outcome Objectives
Percentage of pregnant women enrolled in Medicaid who received prenatal WIC Program services. (1) (2)
Percentage of pregnant women who participated in WIC and received WIC Program services during the first trimester of pregnancy.
Percentage of children less than 12 months of age who were served in the Child Health Clinic and received WIC Program services. (1)
Percentage of children 1 to 5 years of age who were served in the Child Health Clinic and received WIC Program Services. (1)
Percentage of children 1 to 5 years of age enrolled in Medicaid who received WIC Program Services.
Percentage of children less than 12 months of age enrolled in Medicaid who received WIC Program services.
Percentage of postpartum women who participated in WIC during pregnancy and were recertified for WIC by 6 weeks postpartum.
Percentage of women with live term singleton births who received WIC Program services during pregnancy and who gained recommended/excessive/inadequate weight according to the National Academy of Sciences ‐ Institute of Medicine 2009 recommended total weight gain ranges during pregnancy. (3)
Percentage of women who participated in WIC who initiated breastfeeding.
1C.
1A.
2A.
2B.
3A.
3B.
1B.
4B.
5A.
77.0% 72.1%
Num Den Percent
Percentage of children 2 to 4 years of age who received services from the health department and who, according to their Body Mass Index (BMI) for age and gender were:
4A.
Percentage of infants who participated in WIC who were: 5B.
74.3%
53.1%
26.2%
66.0%
87.2%
86.5%
67.7%
29.9%
35.2%
19.6%9.1%
74.6%
50.5%
19.2%
69.0%
86.8%
89.4%
67.3%
29.8%
39.3%
22.5%10.2%
71.5%
74.2%
49.4%
24.6%
81.3%
80.8%
86.3%
66.6%
29.0%
49.6%
24.1%11.8%
‐7.2%
0.0%
‐6.8%
‐6.2%
23.2%
‐7.3%
‐0.3%
‐1.6%
‐2.8%
40.9%
22.8%29.4%
999 1,370 72.9%
1,392 1,870 74.4%
3,511 6,734 52.1%
657 2,544 25.8%
1,294 1,582 81.8%
594 762 78.0%
791 916 86.4%
904 1,323 68.3%
413 29.4%1,407
1,096 1,942 56.4%
481 1,934 24.9%238 1,934 12.3%
48.2%21.9%
45.1%25.9%
‐6.4%18.0%
47.3%22.9%
614 43.6%380 27.0%
1,4071,407
At a healthy weight (BMI less than the 85th percentile but at or greater than the 5th percentile) (1)
a.
Overweight (BMI at or above the 85th percentile but less than the 95th percentile)
b.
Underweight (BMI less than the 5th percentile).
c.
Recommended prenatal weight gaina.
Excessive prenatal weight gainb.
Inadequate prenatal weight gainc.
Breastfeeding at 6 weeks of age (1)a.
Breastfeeding at 6 months of ageb.
14.9% 14.5% 15.9% 6.8% 209 1,323 15.8%
5.3% 3.6% 3.8% ‐29.2% 37 1,323 2.8%
2000 2008 Data
2002to
2003
2005to
2006
2008to
% Change from 2000
to 2008
Obese (BMI at or greater than the 95th percentile).
d.
12.1% 14.5% 13.8% 13.7% 173 1,323 13.1%
(2) These data exclude women enrolled in Medicaid only for emergency delivery.
(3) Recommended total prenatal weight gain range by prepregnancy weight category is 28-40 lbs. for underweight women (BMI<18.5); 25-35 lbs. for normal weight women (BMI 18.5 to 24.9); 15-25 lbs. for overweight women (BMI 25 to 29.9); and 11-20 lbs. for obese women (BMI >=30.0): Adapted from the National Academy of Sciences. Weight Gain During Pregnancy: Reexamining the Guidelines. Washington, DC : National Academy Press, 2009.
(1) Item appears also on other WCH Section Agreement Addenda.

Graham CountyATTACHMENT A: WIC QUALITY ASSURANCE DELIVERABLES
SFY 20102011 AGREEMENT ADDENDA DATA
Process Outcome Objectives
Percentage of pregnant women enrolled in Medicaid who received prenatal WIC Program services. (1) (2)
Percentage of pregnant women who participated in WIC and received WIC Program services during the first trimester of pregnancy.
Percentage of children less than 12 months of age who were served in the Child Health Clinic and received WIC Program services. (1)
Percentage of children 1 to 5 years of age who were served in the Child Health Clinic and received WIC Program Services. (1)
Percentage of children 1 to 5 years of age enrolled in Medicaid who received WIC Program Services.
Percentage of children less than 12 months of age enrolled in Medicaid who received WIC Program services.
Percentage of postpartum women who participated in WIC during pregnancy and were recertified for WIC by 6 weeks postpartum.
Percentage of women with live term singleton births who received WIC Program services during pregnancy and who gained recommended/excessive/inadequate weight according to the National Academy of Sciences ‐ Institute of Medicine 2009 recommended total weight gain ranges during pregnancy. (3)
Percentage of women who participated in WIC who initiated breastfeeding.
1C.
1A.
2A.
2B.
3A.
3B.
1B.
4B.
5A.
81.0% 80.1%
Num Den Percent
Percentage of children 2 to 4 years of age who received services from the health department and who, according to their Body Mass Index (BMI) for age and gender were:
4A.
Percentage of infants who participated in WIC who were: 5B.
79.5%
77.7%
70.7%
75.5%
92.8%
91.5%
66.7%
28.0%
47.2%
30.9%16.4%
76.2%
69.7%
62.0%
81.7%
91.4%
90.8%
68.8%
30.6%
26.2%
23.8%16.6%
77.6%
76.9%
67.7%
65.8%
73.0%
93.8%
94.7%
65.0%
29.9%
22.1%
12.6%56.8%
‐4.2%
‐3.2%
‐13.0%
‐6.9%
‐3.3%
1.1%
3.4%
‐2.4%
6.8%
‐53.1%
‐59.1%247.5%
43 62 69.4%
73 87 83.9%
220 302 72.8%
78 124 62.9%
56 74 75.7%
35 41 85.4%
84 87 96.6%
82 123 66.7%
19 27.1%70
36 82 43.9%
18 88 20.5%13 88 14.8%
54.5%17.5%
56.9%13.2%
4.3%‐24.4%
51.1%18.3%
40 57.1%11 15.7%
7070
At a healthy weight (BMI less than the 85th percentile but at or greater than the 5th percentile) (1)
a.
Overweight (BMI at or above the 85th percentile but less than the 95th percentile)
b.
Underweight (BMI less than the 5th percentile).
c.
Recommended prenatal weight gaina.
Excessive prenatal weight gainb.
Inadequate prenatal weight gainc.
Breastfeeding at 6 weeks of age (1)a.
Breastfeeding at 6 months of ageb.
10.6% 11.8% 15.7% 47.8% 19 123 15.4%
14.0% 5.6% 2.7% ‐81.0% 0 123 0.0%
2000 2008 Data
2002to
2003
2005to
2006
2008to
% Change from 2000
to 2008
Obese (BMI at or greater than the 95th percentile).
d.
8.7% 13.8% 16.6% 90.8% 22 123 17.9%
(2) These data exclude women enrolled in Medicaid only for emergency delivery.
(3) Recommended total prenatal weight gain range by prepregnancy weight category is 28-40 lbs. for underweight women (BMI<18.5); 25-35 lbs. for normal weight women (BMI 18.5 to 24.9); 15-25 lbs. for overweight women (BMI 25 to 29.9); and 11-20 lbs. for obese women (BMI >=30.0): Adapted from the National Academy of Sciences. Weight Gain During Pregnancy: Reexamining the Guidelines. Washington, DC : National Academy Press, 2009.
(1) Item appears also on other WCH Section Agreement Addenda.

GranvilleVance DistrictATTACHMENT A: WIC QUALITY ASSURANCE DELIVERABLES
SFY 20102011 AGREEMENT ADDENDA DATA
Process Outcome Objectives
Percentage of pregnant women enrolled in Medicaid who received prenatal WIC Program services. (1) (2)
Percentage of pregnant women who participated in WIC and received WIC Program services during the first trimester of pregnancy.
Percentage of children less than 12 months of age who were served in the Child Health Clinic and received WIC Program services. (1)
Percentage of children 1 to 5 years of age who were served in the Child Health Clinic and received WIC Program Services. (1)
Percentage of children 1 to 5 years of age enrolled in Medicaid who received WIC Program Services.
Percentage of children less than 12 months of age enrolled in Medicaid who received WIC Program services.
Percentage of postpartum women who participated in WIC during pregnancy and were recertified for WIC by 6 weeks postpartum.
Percentage of women with live term singleton births who received WIC Program services during pregnancy and who gained recommended/excessive/inadequate weight according to the National Academy of Sciences ‐ Institute of Medicine 2009 recommended total weight gain ranges during pregnancy. (3)
Percentage of women who participated in WIC who initiated breastfeeding.
1C.
1A.
2A.
2B.
3A.
3B.
1B.
4B.
5A.
75.5% 72.4%
Num Den Percent
Percentage of children 2 to 4 years of age who received services from the health department and who, according to their Body Mass Index (BMI) for age and gender were:
4A.
Percentage of infants who participated in WIC who were: 5B.
75.9%
62.7%
36.7%
78.5%
95.1%
95.3%
64.4%
31.5%
47.9%
26.9%18.3%
78.3%
58.7%
32.6%
81.7%
91.6%
92.9%
64.3%
29.0%
43.3%
28.7%20.9%
75.4%
74.8%
56.8%
32.7%
77.8%
93.0%
90.6%
65.9%
30.4%
52.9%
34.5%22.5%
‐0.1%
‐1.5%
‐9.4%
‐10.8%
‐0.9%
‐2.2%
‐4.8%
2.4%
‐3.6%
10.5%
27.9%22.9%
545 694 78.5%
716 930 77.0%
2,339 3,904 59.9%
495 1,426 34.7%
626 822 76.2%
44 46 95.7%
168 189 88.9%
865 1,332 64.9%
191 29.8%640
587 1,025 57.3%
480 1,069 44.9%317 1,069 29.7%
41.6%26.8%
43.2%26.4%
3.8%‐1.8%
39.8%31.2%
281 43.9%168 26.3%
640640
At a healthy weight (BMI less than the 85th percentile but at or greater than the 5th percentile) (1)
a.
Overweight (BMI at or above the 85th percentile but less than the 95th percentile)
b.
Underweight (BMI less than the 5th percentile).
c.
Recommended prenatal weight gaina.
Excessive prenatal weight gainb.
Inadequate prenatal weight gainc.
Breastfeeding at 6 weeks of age (1)a.
Breastfeeding at 6 months of ageb.
16.4% 16.1% 15.5% ‐5.6% 207 1,332 15.5%
3.0% 3.9% 4.7% 54.2% 67 1,332 5.0%
2000 2008 Data
2002to
2003
2005to
2006
2008to
% Change from 2000
to 2008
Obese (BMI at or greater than the 95th percentile).
d.
16.2% 15.7% 13.9% ‐13.9% 193 1,332 14.5%
(2) These data exclude women enrolled in Medicaid only for emergency delivery.
(3) Recommended total prenatal weight gain range by prepregnancy weight category is 28-40 lbs. for underweight women (BMI<18.5); 25-35 lbs. for normal weight women (BMI 18.5 to 24.9); 15-25 lbs. for overweight women (BMI 25 to 29.9); and 11-20 lbs. for obese women (BMI >=30.0): Adapted from the National Academy of Sciences. Weight Gain During Pregnancy: Reexamining the Guidelines. Washington, DC : National Academy Press, 2009.
(1) Item appears also on other WCH Section Agreement Addenda.

Greene CountyATTACHMENT A: WIC QUALITY ASSURANCE DELIVERABLES
SFY 20102011 AGREEMENT ADDENDA DATA
Process Outcome Objectives
Percentage of pregnant women enrolled in Medicaid who received prenatal WIC Program services. (1) (2)
Percentage of pregnant women who participated in WIC and received WIC Program services during the first trimester of pregnancy.
Percentage of children less than 12 months of age who were served in the Child Health Clinic and received WIC Program services. (1)
Percentage of children 1 to 5 years of age who were served in the Child Health Clinic and received WIC Program Services. (1)
Percentage of children 1 to 5 years of age enrolled in Medicaid who received WIC Program Services.
Percentage of children less than 12 months of age enrolled in Medicaid who received WIC Program services.
Percentage of postpartum women who participated in WIC during pregnancy and were recertified for WIC by 6 weeks postpartum.
Percentage of women with live term singleton births who received WIC Program services during pregnancy and who gained recommended/excessive/inadequate weight according to the National Academy of Sciences ‐ Institute of Medicine 2009 recommended total weight gain ranges during pregnancy. (3)
Percentage of women who participated in WIC who initiated breastfeeding.
1C.
1A.
2A.
2B.
3A.
3B.
1B.
4B.
5A.
82.5% 83.3%
Num Den Percent
Percentage of children 2 to 4 years of age who received services from the health department and who, according to their Body Mass Index (BMI) for age and gender were:
4A.
Percentage of infants who participated in WIC who were: 5B.
74.9%
67.1%
39.8%
70.0%
95.9%
93.8%
67.0%
36.0%
40.4%
25.0%13.5%
80.0%
65.6%
33.7%
76.3%
96.0%
93.2%
65.4%
31.3%
46.8%
31.3%13.6%
79.5%
77.3%
61.4%
29.0%
84.3%
96.6%
94.6%
65.7%
32.8%
53.6%
35.0%17.5%
‐3.6%
3.1%
‐8.5%
‐27.3%
20.6%
0.7%
0.9%
‐1.9%
‐9.0%
32.7%
40.0%29.5%
83 101 82.2%
146 186 78.5%
469 763 61.5%
122 439 27.8%
174 197 88.3%
102 103 99.0%
192 204 94.1%
209 333 62.8%
60 39.0%154
132 243 54.3%
96 280 34.3%43 280 15.4%
38.0%26.0%
39.8%27.4%
4.8%5.4%
42.9%25.9%
63 40.9%31 20.1%
154154
At a healthy weight (BMI less than the 85th percentile but at or greater than the 5th percentile) (1)
a.
Overweight (BMI at or above the 85th percentile but less than the 95th percentile)
b.
Underweight (BMI less than the 5th percentile).
c.
Recommended prenatal weight gaina.
Excessive prenatal weight gainb.
Inadequate prenatal weight gainc.
Breastfeeding at 6 weeks of age (1)a.
Breastfeeding at 6 months of ageb.
15.8% 16.2% 16.2% 2.1% 68 333 20.4%
2.6% 3.5% 3.2% 20.2% 6 333 1.8%
2000 2008 Data
2002to
2003
2005to
2006
2008to
% Change from 2000
to 2008
Obese (BMI at or greater than the 95th percentile).
d.
14.5% 14.9% 14.9% 2.9% 50 333 15.0%
(2) These data exclude women enrolled in Medicaid only for emergency delivery.
(3) Recommended total prenatal weight gain range by prepregnancy weight category is 28-40 lbs. for underweight women (BMI<18.5); 25-35 lbs. for normal weight women (BMI 18.5 to 24.9); 15-25 lbs. for overweight women (BMI 25 to 29.9); and 11-20 lbs. for obese women (BMI >=30.0): Adapted from the National Academy of Sciences. Weight Gain During Pregnancy: Reexamining the Guidelines. Washington, DC : National Academy Press, 2009.
(1) Item appears also on other WCH Section Agreement Addenda.
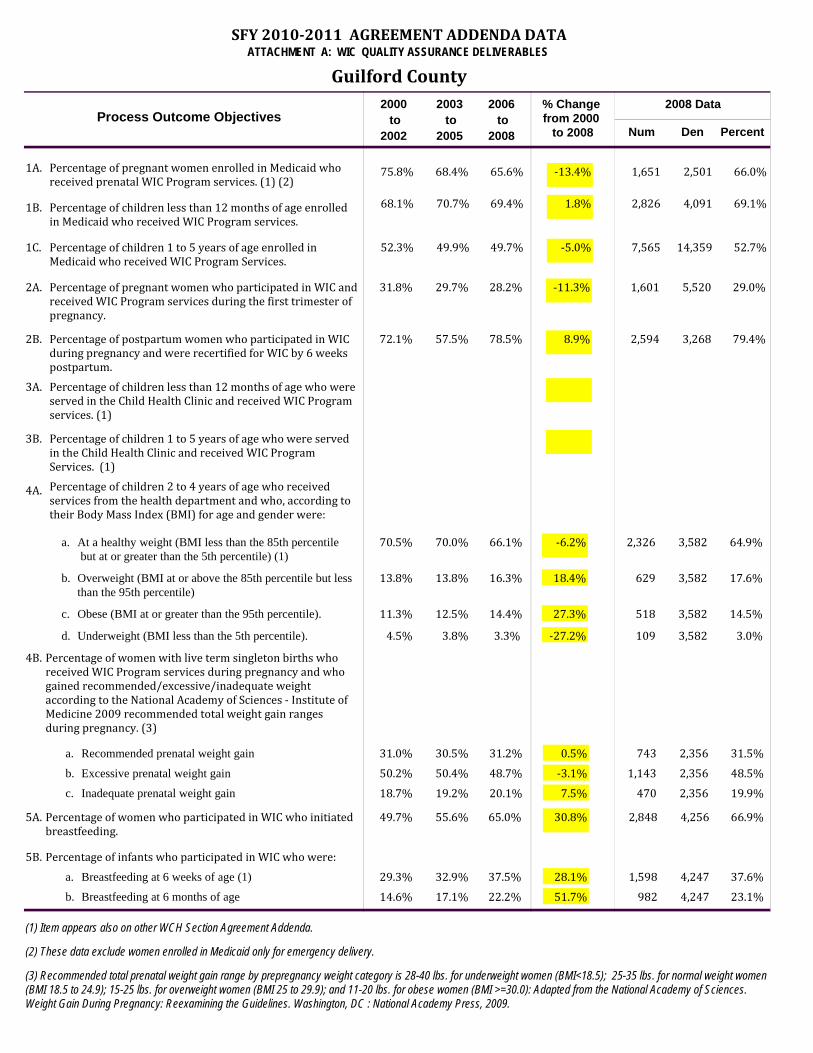
Guilford CountyATTACHMENT A: WIC QUALITY ASSURANCE DELIVERABLES
SFY 20102011 AGREEMENT ADDENDA DATA
Process Outcome Objectives
Percentage of pregnant women enrolled in Medicaid who received prenatal WIC Program services. (1) (2)
Percentage of pregnant women who participated in WIC and received WIC Program services during the first trimester of pregnancy.
Percentage of children less than 12 months of age who were served in the Child Health Clinic and received WIC Program services. (1)
Percentage of children 1 to 5 years of age who were served in the Child Health Clinic and received WIC Program Services. (1)
Percentage of children 1 to 5 years of age enrolled in Medicaid who received WIC Program Services.
Percentage of children less than 12 months of age enrolled in Medicaid who received WIC Program services.
Percentage of postpartum women who participated in WIC during pregnancy and were recertified for WIC by 6 weeks postpartum.
Percentage of women with live term singleton births who received WIC Program services during pregnancy and who gained recommended/excessive/inadequate weight according to the National Academy of Sciences ‐ Institute of Medicine 2009 recommended total weight gain ranges during pregnancy. (3)
Percentage of women who participated in WIC who initiated breastfeeding.
1C.
1A.
2A.
2B.
3A.
3B.
1B.
4B.
5A.
75.8% 68.4%
Num Den Percent
Percentage of children 2 to 4 years of age who received services from the health department and who, according to their Body Mass Index (BMI) for age and gender were:
4A.
Percentage of infants who participated in WIC who were: 5B.
68.1%
52.3%
31.8%
72.1%
70.5%
31.0%
49.7%
29.3%14.6%
70.7%
49.9%
29.7%
57.5%
70.0%
30.5%
55.6%
32.9%17.1%
65.6%
69.4%
49.7%
28.2%
78.5%
66.1%
31.2%
65.0%
37.5%22.2%
‐13.4%
1.8%
‐5.0%
‐11.3%
8.9%
‐6.2%
0.5%
30.8%
28.1%51.7%
1,651 2,501 66.0%
2,826 4,091 69.1%
7,565 14,359 52.7%
1,601 5,520 29.0%
2,594 3,268 79.4%
2,326 3,582 64.9%
743 31.5%2,356
2,848 4,256 66.9%
1,598 4,247 37.6%982 4,247 23.1%
50.2%18.7%
48.7%20.1%
‐3.1%7.5%
50.4%19.2%
1,143 48.5%470 19.9%
2,3562,356
At a healthy weight (BMI less than the 85th percentile but at or greater than the 5th percentile) (1)
a.
Overweight (BMI at or above the 85th percentile but less than the 95th percentile)
b.
Underweight (BMI less than the 5th percentile).
c.
Recommended prenatal weight gaina.
Excessive prenatal weight gainb.
Inadequate prenatal weight gainc.
Breastfeeding at 6 weeks of age (1)a.
Breastfeeding at 6 months of ageb.
13.8% 13.8% 16.3% 18.4% 629 3,582 17.6%
4.5% 3.8% 3.3% ‐27.2% 109 3,582 3.0%
2000 2008 Data
2002to
2003
2005to
2006
2008to
% Change from 2000
to 2008
Obese (BMI at or greater than the 95th percentile).
d.
11.3% 12.5% 14.4% 27.3% 518 3,582 14.5%
(2) These data exclude women enrolled in Medicaid only for emergency delivery.
(3) Recommended total prenatal weight gain range by prepregnancy weight category is 28-40 lbs. for underweight women (BMI<18.5); 25-35 lbs. for normal weight women (BMI 18.5 to 24.9); 15-25 lbs. for overweight women (BMI 25 to 29.9); and 11-20 lbs. for obese women (BMI >=30.0): Adapted from the National Academy of Sciences. Weight Gain During Pregnancy: Reexamining the Guidelines. Washington, DC : National Academy Press, 2009.
(1) Item appears also on other WCH Section Agreement Addenda.

Halifax CountyATTACHMENT A: WIC QUALITY ASSURANCE DELIVERABLES
SFY 20102011 AGREEMENT ADDENDA DATA
Process Outcome Objectives
Percentage of pregnant women enrolled in Medicaid who received prenatal WIC Program services. (1) (2)
Percentage of pregnant women who participated in WIC and received WIC Program services during the first trimester of pregnancy.
Percentage of children less than 12 months of age who were served in the Child Health Clinic and received WIC Program services. (1)
Percentage of children 1 to 5 years of age who were served in the Child Health Clinic and received WIC Program Services. (1)
Percentage of children 1 to 5 years of age enrolled in Medicaid who received WIC Program Services.
Percentage of children less than 12 months of age enrolled in Medicaid who received WIC Program services.
Percentage of postpartum women who participated in WIC during pregnancy and were recertified for WIC by 6 weeks postpartum.
Percentage of women with live term singleton births who received WIC Program services during pregnancy and who gained recommended/excessive/inadequate weight according to the National Academy of Sciences ‐ Institute of Medicine 2009 recommended total weight gain ranges during pregnancy. (3)
Percentage of women who participated in WIC who initiated breastfeeding.
1C.
1A.
2A.
2B.
3A.
3B.
1B.
4B.
5A.
72.4% 81.4%
Num Den Percent
Percentage of children 2 to 4 years of age who received services from the health department and who, according to their Body Mass Index (BMI) for age and gender were:
4A.
Percentage of infants who participated in WIC who were: 5B.
74.8%
63.5%
33.1%
63.5%
63.4%
77.6%
65.0%
28.7%
46.9%
13.9%5.1%
74.3%
62.0%
29.0%
70.8%
69.1%
76.9%
65.4%
30.1%
33.5%
13.6%4.7%
81.9%
74.4%
60.6%
29.2%
75.6%
68.2%
65.5%
66.2%
30.7%
32.4%
13.7%5.5%
13.2%
‐0.5%
‐4.6%
‐11.9%
18.9%
7.6%
‐15.6%
1.9%
7.2%
‐30.8%
‐1.1%7.0%
407 490 83.1%
396 541 73.2%
1,347 2,118 63.6%
244 853 28.6%
366 497 73.6%
60 90 66.7%
146 235 62.1%
596 909 65.6%
124 28.5%435
200 592 33.8%
98 664 14.8%43 664 6.5%
48.1%23.2%
47.5%21.8%
‐1.4%‐6.1%
46.0%23.9%
211 48.5%100 23.0%
435435
At a healthy weight (BMI less than the 85th percentile but at or greater than the 5th percentile) (1)
a.
Overweight (BMI at or above the 85th percentile but less than the 95th percentile)
b.
Underweight (BMI less than the 5th percentile).
c.
Recommended prenatal weight gaina.
Excessive prenatal weight gainb.
Inadequate prenatal weight gainc.
Breastfeeding at 6 weeks of age (1)a.
Breastfeeding at 6 months of ageb.
15.0% 14.2% 15.0% 0.3% 137 909 15.1%
5.2% 3.7% 4.5% ‐13.4% 38 909 4.2%
2000 2008 Data
2002to
2003
2005to
2006
2008to
% Change from 2000
to 2008
Obese (BMI at or greater than the 95th percentile).
d.
14.9% 16.7% 14.4% ‐3.7% 138 909 15.2%
(2) These data exclude women enrolled in Medicaid only for emergency delivery.
(3) Recommended total prenatal weight gain range by prepregnancy weight category is 28-40 lbs. for underweight women (BMI<18.5); 25-35 lbs. for normal weight women (BMI 18.5 to 24.9); 15-25 lbs. for overweight women (BMI 25 to 29.9); and 11-20 lbs. for obese women (BMI >=30.0): Adapted from the National Academy of Sciences. Weight Gain During Pregnancy: Reexamining the Guidelines. Washington, DC : National Academy Press, 2009.
(1) Item appears also on other WCH Section Agreement Addenda.

Harnett CountyATTACHMENT A: WIC QUALITY ASSURANCE DELIVERABLES
SFY 20102011 AGREEMENT ADDENDA DATA
Process Outcome Objectives
Percentage of pregnant women enrolled in Medicaid who received prenatal WIC Program services. (1) (2)
Percentage of pregnant women who participated in WIC and received WIC Program services during the first trimester of pregnancy.
Percentage of children less than 12 months of age who were served in the Child Health Clinic and received WIC Program services. (1)
Percentage of children 1 to 5 years of age who were served in the Child Health Clinic and received WIC Program Services. (1)
Percentage of children 1 to 5 years of age enrolled in Medicaid who received WIC Program Services.
Percentage of children less than 12 months of age enrolled in Medicaid who received WIC Program services.
Percentage of postpartum women who participated in WIC during pregnancy and were recertified for WIC by 6 weeks postpartum.
Percentage of women with live term singleton births who received WIC Program services during pregnancy and who gained recommended/excessive/inadequate weight according to the National Academy of Sciences ‐ Institute of Medicine 2009 recommended total weight gain ranges during pregnancy. (3)
Percentage of women who participated in WIC who initiated breastfeeding.
1C.
1A.
2A.
2B.
3A.
3B.
1B.
4B.
5A.
74.8% 72.1%
Num Den Percent
Percentage of children 2 to 4 years of age who received services from the health department and who, according to their Body Mass Index (BMI) for age and gender were:
4A.
Percentage of infants who participated in WIC who were: 5B.
74.7%
59.5%
39.1%
56.2%
78.9%
78.7%
68.3%
32.6%
35.2%
20.9%9.9%
76.5%
57.4%
35.3%
60.3%
84.8%
80.2%
66.5%
31.0%
38.6%
23.4%10.8%
70.3%
74.8%
56.6%
35.3%
69.8%
86.2%
80.9%
66.4%
30.0%
46.7%
26.8%11.6%
‐6.0%
0.1%
‐4.8%
‐9.8%
24.1%
9.3%
2.9%
‐2.9%
‐7.9%
32.8%
27.9%17.3%
450 651 69.1%
755 1,006 75.0%
2,155 3,640 59.2%
494 1,342 36.8%
557 760 73.3%
150 173 86.7%
487 610 79.8%
806 1,221 66.0%
204 30.6%666
475 971 48.9%
274 1,049 26.1%123 1,049 11.7%
44.7%22.8%
50.1%19.9%
12.1%‐12.5%
47.3%21.7%
339 50.9%123 18.5%
666666
At a healthy weight (BMI less than the 85th percentile but at or greater than the 5th percentile) (1)
a.
Overweight (BMI at or above the 85th percentile but less than the 95th percentile)
b.
Underweight (BMI less than the 5th percentile).
c.
Recommended prenatal weight gaina.
Excessive prenatal weight gainb.
Inadequate prenatal weight gainc.
Breastfeeding at 6 weeks of age (1)a.
Breastfeeding at 6 months of ageb.
15.2% 16.6% 15.7% 3.3% 189 1,221 15.5%
3.5% 3.5% 3.7% 5.8% 52 1,221 4.3%
2000 2008 Data
2002to
2003
2005to
2006
2008to
% Change from 2000
to 2008
Obese (BMI at or greater than the 95th percentile).
d.
13.0% 13.4% 14.3% 9.7% 174 1,221 14.3%
(2) These data exclude women enrolled in Medicaid only for emergency delivery.
(3) Recommended total prenatal weight gain range by prepregnancy weight category is 28-40 lbs. for underweight women (BMI<18.5); 25-35 lbs. for normal weight women (BMI 18.5 to 24.9); 15-25 lbs. for overweight women (BMI 25 to 29.9); and 11-20 lbs. for obese women (BMI >=30.0): Adapted from the National Academy of Sciences. Weight Gain During Pregnancy: Reexamining the Guidelines. Washington, DC : National Academy Press, 2009.
(1) Item appears also on other WCH Section Agreement Addenda.

Haywood CountyATTACHMENT A: WIC QUALITY ASSURANCE DELIVERABLES
SFY 20102011 AGREEMENT ADDENDA DATA
Process Outcome Objectives
Percentage of pregnant women enrolled in Medicaid who received prenatal WIC Program services. (1) (2)
Percentage of pregnant women who participated in WIC and received WIC Program services during the first trimester of pregnancy.
Percentage of children less than 12 months of age who were served in the Child Health Clinic and received WIC Program services. (1)
Percentage of children 1 to 5 years of age who were served in the Child Health Clinic and received WIC Program Services. (1)
Percentage of children 1 to 5 years of age enrolled in Medicaid who received WIC Program Services.
Percentage of children less than 12 months of age enrolled in Medicaid who received WIC Program services.
Percentage of postpartum women who participated in WIC during pregnancy and were recertified for WIC by 6 weeks postpartum.
Percentage of women with live term singleton births who received WIC Program services during pregnancy and who gained recommended/excessive/inadequate weight according to the National Academy of Sciences ‐ Institute of Medicine 2009 recommended total weight gain ranges during pregnancy. (3)
Percentage of women who participated in WIC who initiated breastfeeding.
1C.
1A.
2A.
2B.
3A.
3B.
1B.
4B.
5A.
78.4% 73.8%
Num Den Percent
Percentage of children 2 to 4 years of age who received services from the health department and who, according to their Body Mass Index (BMI) for age and gender were:
4A.
Percentage of infants who participated in WIC who were: 5B.
75.0%
59.2%
51.8%
58.3%
88.6%
85.3%
66.1%
31.2%
52.9%
29.7%15.1%
68.0%
55.2%
47.2%
58.1%
68.0%
77.7%
64.5%
30.4%
36.6%
25.7%12.1%
68.1%
71.2%
47.8%
43.2%
66.1%
75.0%
74.6%
65.5%
31.6%
43.0%
27.3%13.1%
‐13.2%
‐5.2%
‐19.2%
‐16.7%
13.4%
‐15.3%
‐12.6%
‐1.0%
1.4%
‐18.7%
‐7.9%‐12.7%
204 318 64.2%
318 437 72.8%
839 1,599 52.5%
259 628 41.2%
288 379 76.0%
2 2 100.0%
50 64 78.1%
255 399 63.9%
69 27.4%252
180 459 39.2%
112 428 26.2%56 428 13.1%
50.9%17.9%
48.6%19.8%
‐4.6%10.4%
50.9%18.7%
125 49.6%58 23.0%
252252
At a healthy weight (BMI less than the 85th percentile but at or greater than the 5th percentile) (1)
a.
Overweight (BMI at or above the 85th percentile but less than the 95th percentile)
b.
Underweight (BMI less than the 5th percentile).
c.
Recommended prenatal weight gaina.
Excessive prenatal weight gainb.
Inadequate prenatal weight gainc.
Breastfeeding at 6 weeks of age (1)a.
Breastfeeding at 6 months of ageb.
17.9% 18.0% 16.6% ‐6.9% 77 399 19.3%
3.8% 3.8% 3.7% ‐1.7% 13 399 3.3%
2000 2008 Data
2002to
2003
2005to
2006
2008to
% Change from 2000
to 2008
Obese (BMI at or greater than the 95th percentile).
d.
12.2% 13.7% 14.2% 16.0% 54 399 13.5%
(2) These data exclude women enrolled in Medicaid only for emergency delivery.
(3) Recommended total prenatal weight gain range by prepregnancy weight category is 28-40 lbs. for underweight women (BMI<18.5); 25-35 lbs. for normal weight women (BMI 18.5 to 24.9); 15-25 lbs. for overweight women (BMI 25 to 29.9); and 11-20 lbs. for obese women (BMI >=30.0): Adapted from the National Academy of Sciences. Weight Gain During Pregnancy: Reexamining the Guidelines. Washington, DC : National Academy Press, 2009.
(1) Item appears also on other WCH Section Agreement Addenda.

Henderson CountyATTACHMENT A: WIC QUALITY ASSURANCE DELIVERABLES
SFY 20102011 AGREEMENT ADDENDA DATA
Process Outcome Objectives
Percentage of pregnant women enrolled in Medicaid who received prenatal WIC Program services. (1) (2)
Percentage of pregnant women who participated in WIC and received WIC Program services during the first trimester of pregnancy.
Percentage of children less than 12 months of age who were served in the Child Health Clinic and received WIC Program services. (1)
Percentage of children 1 to 5 years of age who were served in the Child Health Clinic and received WIC Program Services. (1)
Percentage of children 1 to 5 years of age enrolled in Medicaid who received WIC Program Services.
Percentage of children less than 12 months of age enrolled in Medicaid who received WIC Program services.
Percentage of postpartum women who participated in WIC during pregnancy and were recertified for WIC by 6 weeks postpartum.
Percentage of women with live term singleton births who received WIC Program services during pregnancy and who gained recommended/excessive/inadequate weight according to the National Academy of Sciences ‐ Institute of Medicine 2009 recommended total weight gain ranges during pregnancy. (3)
Percentage of women who participated in WIC who initiated breastfeeding.
1C.
1A.
2A.
2B.
3A.
3B.
1B.
4B.
5A.
71.8% 53.5%
Num Den Percent
Percentage of children 2 to 4 years of age who received services from the health department and who, according to their Body Mass Index (BMI) for age and gender were:
4A.
Percentage of infants who participated in WIC who were: 5B.
65.8%
60.3%
38.8%
61.4%
87.6%
74.5%
69.2%
33.6%
64.7%
44.5%27.5%
63.0%
57.5%
36.2%
64.3%
88.0%
80.8%
66.5%
36.5%
68.9%
46.5%26.9%
45.4%
62.7%
50.3%
34.9%
66.0%
84.1%
75.1%
63.7%
33.0%
76.9%
48.7%28.5%
‐36.8%
‐4.7%
‐16.5%
‐10.1%
7.5%
‐4.0%
0.7%
‐7.9%
‐1.8%
18.8%
9.5%3.5%
221 480 46.0%
558 872 64.0%
1,658 3,085 53.7%
370 984 37.6%
459 638 71.9%
158 181 87.3%
225 306 73.5%
467 756 61.8%
153 35.2%435
685 849 80.7%
429 864 49.7%244 864 28.2%
43.9%22.6%
47.6%19.5%
8.5%‐13.8%
43.9%19.6%
206 47.4%76 17.5%
435435
At a healthy weight (BMI less than the 85th percentile but at or greater than the 5th percentile) (1)
a.
Overweight (BMI at or above the 85th percentile but less than the 95th percentile)
b.
Underweight (BMI less than the 5th percentile).
c.
Recommended prenatal weight gaina.
Excessive prenatal weight gainb.
Inadequate prenatal weight gainc.
Breastfeeding at 6 weeks of age (1)a.
Breastfeeding at 6 months of ageb.
14.1% 17.0% 18.3% 30.2% 139 756 18.4%
3.3% 2.7% 2.5% ‐24.4% 26 756 3.4%
2000 2008 Data
2002to
2003
2005to
2006
2008to
% Change from 2000
to 2008
Obese (BMI at or greater than the 95th percentile).
d.
13.5% 13.9% 15.5% 14.9% 124 756 16.4%
(2) These data exclude women enrolled in Medicaid only for emergency delivery.
(3) Recommended total prenatal weight gain range by prepregnancy weight category is 28-40 lbs. for underweight women (BMI<18.5); 25-35 lbs. for normal weight women (BMI 18.5 to 24.9); 15-25 lbs. for overweight women (BMI 25 to 29.9); and 11-20 lbs. for obese women (BMI >=30.0): Adapted from the National Academy of Sciences. Weight Gain During Pregnancy: Reexamining the Guidelines. Washington, DC : National Academy Press, 2009.
(1) Item appears also on other WCH Section Agreement Addenda.

Hertford CountyATTACHMENT A: WIC QUALITY ASSURANCE DELIVERABLES
SFY 20102011 AGREEMENT ADDENDA DATA
Process Outcome Objectives
Percentage of pregnant women enrolled in Medicaid who received prenatal WIC Program services. (1) (2)
Percentage of pregnant women who participated in WIC and received WIC Program services during the first trimester of pregnancy.
Percentage of children less than 12 months of age who were served in the Child Health Clinic and received WIC Program services. (1)
Percentage of children 1 to 5 years of age who were served in the Child Health Clinic and received WIC Program Services. (1)
Percentage of children 1 to 5 years of age enrolled in Medicaid who received WIC Program Services.
Percentage of children less than 12 months of age enrolled in Medicaid who received WIC Program services.
Percentage of postpartum women who participated in WIC during pregnancy and were recertified for WIC by 6 weeks postpartum.
Percentage of women with live term singleton births who received WIC Program services during pregnancy and who gained recommended/excessive/inadequate weight according to the National Academy of Sciences ‐ Institute of Medicine 2009 recommended total weight gain ranges during pregnancy. (3)
Percentage of women who participated in WIC who initiated breastfeeding.
1C.
1A.
2A.
2B.
3A.
3B.
1B.
4B.
5A.
78.4% 79.4%
Num Den Percent
Percentage of children 2 to 4 years of age who received services from the health department and who, according to their Body Mass Index (BMI) for age and gender were:
4A.
Percentage of infants who participated in WIC who were: 5B.
75.6%
60.0%
28.6%
81.5%
100.0%
92.2%
64.6%
29.2%
26.6%
12.9%4.9%
77.2%
58.3%
27.8%
74.8%
100.0%
61.4%
65.1%
29.7%
33.8%
13.9%4.2%
78.4%
72.2%
53.3%
28.2%
84.8%
100.0%
86.0%
66.5%
30.6%
32.5%
18.9%6.2%
‐0.1%
‐4.5%
‐11.2%
‐1.4%
4.0%
0.0%
‐6.8%
2.9%
4.7%
22.4%
46.7%27.5%
164 214 76.6%
191 275 69.5%
540 950 56.8%
122 446 27.4%
208 243 85.6%
3 3 100.0%
20 22 90.9%
232 339 68.4%
49 26.9%182
112 303 37.0%
59 304 19.4%23 304 7.6%
43.7%27.1%
47.1%22.3%
8.0%‐17.9%
50.4%19.9%
86 47.3%47 25.8%
182182
At a healthy weight (BMI less than the 85th percentile but at or greater than the 5th percentile) (1)
a.
Overweight (BMI at or above the 85th percentile but less than the 95th percentile)
b.
Underweight (BMI less than the 5th percentile).
c.
Recommended prenatal weight gaina.
Excessive prenatal weight gainb.
Inadequate prenatal weight gainc.
Breastfeeding at 6 weeks of age (1)a.
Breastfeeding at 6 months of ageb.
16.6% 16.6% 15.1% ‐8.6% 44 339 13.0%
5.1% 3.0% 5.5% 8.4% 14 339 4.1%
2000 2008 Data
2002to
2003
2005to
2006
2008to
% Change from 2000
to 2008
Obese (BMI at or greater than the 95th percentile).
d.
13.8% 15.2% 12.9% ‐6.3% 49 339 14.5%
(2) These data exclude women enrolled in Medicaid only for emergency delivery.
(3) Recommended total prenatal weight gain range by prepregnancy weight category is 28-40 lbs. for underweight women (BMI<18.5); 25-35 lbs. for normal weight women (BMI 18.5 to 24.9); 15-25 lbs. for overweight women (BMI 25 to 29.9); and 11-20 lbs. for obese women (BMI >=30.0): Adapted from the National Academy of Sciences. Weight Gain During Pregnancy: Reexamining the Guidelines. Washington, DC : National Academy Press, 2009.
(1) Item appears also on other WCH Section Agreement Addenda.

Hoke CountyATTACHMENT A: WIC QUALITY ASSURANCE DELIVERABLES
SFY 20102011 AGREEMENT ADDENDA DATA
Process Outcome Objectives
Percentage of pregnant women enrolled in Medicaid who received prenatal WIC Program services. (1) (2)
Percentage of pregnant women who participated in WIC and received WIC Program services during the first trimester of pregnancy.
Percentage of children less than 12 months of age who were served in the Child Health Clinic and received WIC Program services. (1)
Percentage of children 1 to 5 years of age who were served in the Child Health Clinic and received WIC Program Services. (1)
Percentage of children 1 to 5 years of age enrolled in Medicaid who received WIC Program Services.
Percentage of children less than 12 months of age enrolled in Medicaid who received WIC Program services.
Percentage of postpartum women who participated in WIC during pregnancy and were recertified for WIC by 6 weeks postpartum.
Percentage of women with live term singleton births who received WIC Program services during pregnancy and who gained recommended/excessive/inadequate weight according to the National Academy of Sciences ‐ Institute of Medicine 2009 recommended total weight gain ranges during pregnancy. (3)
Percentage of women who participated in WIC who initiated breastfeeding.
1C.
1A.
2A.
2B.
3A.
3B.
1B.
4B.
5A.
71.2% 78.4%
Num Den Percent
Percentage of children 2 to 4 years of age who received services from the health department and who, according to their Body Mass Index (BMI) for age and gender were:
4A.
Percentage of infants who participated in WIC who were: 5B.
76.3%
65.3%
34.4%
75.8%
96.6%
93.4%
67.2%
32.9%
45.8%
20.2%9.5%
77.1%
58.9%
33.1%
71.0%
97.3%
95.2%
64.6%
31.9%
45.8%
24.9%12.6%
76.4%
74.2%
54.6%
26.3%
73.1%
95.7%
92.8%
60.0%
33.7%
46.1%
27.3%14.3%
7.2%
‐2.8%
‐16.4%
‐23.4%
‐3.5%
‐0.9%
‐0.6%
‐10.8%
2.3%
0.7%
35.3%51.2%
208 266 78.2%
345 485 71.1%
984 1,771 55.6%
193 722 26.7%
319 427 74.7%
223 230 97.0%
458 483 94.8%
438 725 60.4%
61 36.5%167
262 548 47.8%
151 592 25.5%87 592 14.7%
44.5%22.6%
48.2%18.1%
8.3%‐19.8%
47.7%20.4%
77 46.1%29 17.4%
167167
At a healthy weight (BMI less than the 85th percentile but at or greater than the 5th percentile) (1)
a.
Overweight (BMI at or above the 85th percentile but less than the 95th percentile)
b.
Underweight (BMI less than the 5th percentile).
c.
Recommended prenatal weight gaina.
Excessive prenatal weight gainb.
Inadequate prenatal weight gainc.
Breastfeeding at 6 weeks of age (1)a.
Breastfeeding at 6 months of ageb.
15.1% 14.9% 17.3% 14.6% 132 725 18.2%
4.6% 4.1% 2.9% ‐37.1% 16 725 2.2%
2000 2008 Data
2002to
2003
2005to
2006
2008to
% Change from 2000
to 2008
Obese (BMI at or greater than the 95th percentile).
d.
13.0% 16.4% 19.8% 52.1% 139 725 19.2%
(2) These data exclude women enrolled in Medicaid only for emergency delivery.
(3) Recommended total prenatal weight gain range by prepregnancy weight category is 28-40 lbs. for underweight women (BMI<18.5); 25-35 lbs. for normal weight women (BMI 18.5 to 24.9); 15-25 lbs. for overweight women (BMI 25 to 29.9); and 11-20 lbs. for obese women (BMI >=30.0): Adapted from the National Academy of Sciences. Weight Gain During Pregnancy: Reexamining the Guidelines. Washington, DC : National Academy Press, 2009.
(1) Item appears also on other WCH Section Agreement Addenda.

Hyde CountyATTACHMENT A: WIC QUALITY ASSURANCE DELIVERABLES
SFY 20102011 AGREEMENT ADDENDA DATA
Process Outcome Objectives
Percentage of pregnant women enrolled in Medicaid who received prenatal WIC Program services. (1) (2)
Percentage of pregnant women who participated in WIC and received WIC Program services during the first trimester of pregnancy.
Percentage of children less than 12 months of age who were served in the Child Health Clinic and received WIC Program services. (1)
Percentage of children 1 to 5 years of age who were served in the Child Health Clinic and received WIC Program Services. (1)
Percentage of children 1 to 5 years of age enrolled in Medicaid who received WIC Program Services.
Percentage of children less than 12 months of age enrolled in Medicaid who received WIC Program services.
Percentage of postpartum women who participated in WIC during pregnancy and were recertified for WIC by 6 weeks postpartum.
Percentage of women with live term singleton births who received WIC Program services during pregnancy and who gained recommended/excessive/inadequate weight according to the National Academy of Sciences ‐ Institute of Medicine 2009 recommended total weight gain ranges during pregnancy. (3)
Percentage of women who participated in WIC who initiated breastfeeding.
1C.
1A.
2A.
2B.
3A.
3B.
1B.
4B.
5A.
86.4% 76.8%
Num Den Percent
Percentage of children 2 to 4 years of age who received services from the health department and who, according to their Body Mass Index (BMI) for age and gender were:
4A.
Percentage of infants who participated in WIC who were: 5B.
63.6%
70.2%
39.7%
74.3%
95.2%
90.2%
67.2%
44.2%
56.1%
32.3%13.2%
61.3%
67.0%
40.0%
64.5%
50.0%
88.6%
62.5%
25.8%
51.6%
30.3%16.8%
70.2%
70.4%
68.2%
33.8%
78.3%
100.0%
93.9%
68.7%
22.7%
47.2%
34.3%18.0%
‐18.7%
10.6%
‐2.8%
‐15.0%
5.4%
5.0%
4.2%
2.1%
‐48.6%
‐15.9%
6.0%36.5%
14 22 63.6%
31 43 72.1%
123 172 71.5%
22 69 31.9%
23 29 79.3%
5 5 100.0%
27 28 96.4%
50 66 75.8%
9 32.1%28
13 35 37.1%
20 57 35.1%9 57 15.8%
39.5%16.3%
52.3%25.0%
32.2%53.6%
51.7%22.5%
16 57.1%3 10.7%
2828
At a healthy weight (BMI less than the 85th percentile but at or greater than the 5th percentile) (1)
a.
Overweight (BMI at or above the 85th percentile but less than the 95th percentile)
b.
Underweight (BMI less than the 5th percentile).
c.
Recommended prenatal weight gaina.
Excessive prenatal weight gainb.
Inadequate prenatal weight gainc.
Breastfeeding at 6 weeks of age (1)a.
Breastfeeding at 6 months of ageb.
14.2% 11.6% 12.0% ‐15.3% 9 66 13.6%
5.2% 6.0% 8.0% 55.3% 4 66 6.1%
2000 2008 Data
2002to
2003
2005to
2006
2008to
% Change from 2000
to 2008
Obese (BMI at or greater than the 95th percentile).
d.
13.4% 19.8% 11.2% ‐15.8% 3 66 4.5%
(2) These data exclude women enrolled in Medicaid only for emergency delivery.
(3) Recommended total prenatal weight gain range by prepregnancy weight category is 28-40 lbs. for underweight women (BMI<18.5); 25-35 lbs. for normal weight women (BMI 18.5 to 24.9); 15-25 lbs. for overweight women (BMI 25 to 29.9); and 11-20 lbs. for obese women (BMI >=30.0): Adapted from the National Academy of Sciences. Weight Gain During Pregnancy: Reexamining the Guidelines. Washington, DC : National Academy Press, 2009.
(1) Item appears also on other WCH Section Agreement Addenda.

Iredell CountyATTACHMENT A: WIC QUALITY ASSURANCE DELIVERABLES
SFY 20102011 AGREEMENT ADDENDA DATA
Process Outcome Objectives
Percentage of pregnant women enrolled in Medicaid who received prenatal WIC Program services. (1) (2)
Percentage of pregnant women who participated in WIC and received WIC Program services during the first trimester of pregnancy.
Percentage of children less than 12 months of age who were served in the Child Health Clinic and received WIC Program services. (1)
Percentage of children 1 to 5 years of age who were served in the Child Health Clinic and received WIC Program Services. (1)
Percentage of children 1 to 5 years of age enrolled in Medicaid who received WIC Program Services.
Percentage of children less than 12 months of age enrolled in Medicaid who received WIC Program services.
Percentage of postpartum women who participated in WIC during pregnancy and were recertified for WIC by 6 weeks postpartum.
Percentage of women with live term singleton births who received WIC Program services during pregnancy and who gained recommended/excessive/inadequate weight according to the National Academy of Sciences ‐ Institute of Medicine 2009 recommended total weight gain ranges during pregnancy. (3)
Percentage of women who participated in WIC who initiated breastfeeding.
1C.
1A.
2A.
2B.
3A.
3B.
1B.
4B.
5A.
73.0% 72.5%
Num Den Percent
Percentage of children 2 to 4 years of age who received services from the health department and who, according to their Body Mass Index (BMI) for age and gender were:
4A.
Percentage of infants who participated in WIC who were: 5B.
69.6%
55.8%
25.5%
51.1%
85.5%
52.6%
70.4%
33.8%
40.5%
17.3%9.8%
70.4%
55.6%
24.6%
52.8%
85.2%
69.2%
69.4%
32.1%
48.1%
23.5%13.0%
75.7%
72.9%
56.7%
30.1%
58.1%
88.4%
75.3%
68.5%
30.2%
53.2%
32.6%17.8%
3.7%
4.7%
1.5%
17.9%
13.6%
3.3%
43.1%
‐2.7%
‐10.9%
31.4%
87.9%82.3%
664 849 78.2%
916 1,199 76.4%
2,656 4,427 60.0%
569 1,732 32.9%
568 969 58.6%
276 307 89.9%
306 365 83.8%
1,048 1,575 66.5%
253 29.8%849
696 1,225 56.8%
399 1,227 32.5%209 1,227 17.0%
45.4%20.8%
49.5%20.4%
9.0%‐1.9%
49.0%18.9%
424 49.9%172 20.3%
849849
At a healthy weight (BMI less than the 85th percentile but at or greater than the 5th percentile) (1)
a.
Overweight (BMI at or above the 85th percentile but less than the 95th percentile)
b.
Underweight (BMI less than the 5th percentile).
c.
Recommended prenatal weight gaina.
Excessive prenatal weight gainb.
Inadequate prenatal weight gainc.
Breastfeeding at 6 weeks of age (1)a.
Breastfeeding at 6 months of ageb.
14.1% 15.1% 13.9% ‐2.0% 253 1,575 16.1%
4.4% 2.9% 3.4% ‐23.7% 38 1,575 2.4%
2000 2008 Data
2002to
2003
2005to
2006
2008to
% Change from 2000
to 2008
Obese (BMI at or greater than the 95th percentile).
d.
11.0% 12.6% 14.3% 29.6% 236 1,575 15.0%
(2) These data exclude women enrolled in Medicaid only for emergency delivery.
(3) Recommended total prenatal weight gain range by prepregnancy weight category is 28-40 lbs. for underweight women (BMI<18.5); 25-35 lbs. for normal weight women (BMI 18.5 to 24.9); 15-25 lbs. for overweight women (BMI 25 to 29.9); and 11-20 lbs. for obese women (BMI >=30.0): Adapted from the National Academy of Sciences. Weight Gain During Pregnancy: Reexamining the Guidelines. Washington, DC : National Academy Press, 2009.
(1) Item appears also on other WCH Section Agreement Addenda.

Jackson CountyATTACHMENT A: WIC QUALITY ASSURANCE DELIVERABLES
SFY 20102011 AGREEMENT ADDENDA DATA
Process Outcome Objectives
Percentage of pregnant women enrolled in Medicaid who received prenatal WIC Program services. (1) (2)
Percentage of pregnant women who participated in WIC and received WIC Program services during the first trimester of pregnancy.
Percentage of children less than 12 months of age who were served in the Child Health Clinic and received WIC Program services. (1)
Percentage of children 1 to 5 years of age who were served in the Child Health Clinic and received WIC Program Services. (1)
Percentage of children 1 to 5 years of age enrolled in Medicaid who received WIC Program Services.
Percentage of children less than 12 months of age enrolled in Medicaid who received WIC Program services.
Percentage of postpartum women who participated in WIC during pregnancy and were recertified for WIC by 6 weeks postpartum.
Percentage of women with live term singleton births who received WIC Program services during pregnancy and who gained recommended/excessive/inadequate weight according to the National Academy of Sciences ‐ Institute of Medicine 2009 recommended total weight gain ranges during pregnancy. (3)
Percentage of women who participated in WIC who initiated breastfeeding.
1C.
1A.
2A.
2B.
3A.
3B.
1B.
4B.
5A.
82.0% 82.7%
Num Den Percent
Percentage of children 2 to 4 years of age who received services from the health department and who, according to their Body Mass Index (BMI) for age and gender were:
4A.
Percentage of infants who participated in WIC who were: 5B.
75.2%
72.7%
47.0%
67.1%
68.8%
68.1%
63.1%
32.0%
49.8%
33.7%17.0%
68.8%
68.1%
47.3%
61.2%
33.3%
70.9%
60.5%
33.0%
51.4%
33.6%16.7%
79.5%
69.4%
62.6%
49.6%
64.4%
50.0%
62.7%
59.6%
29.1%
46.6%
34.0%18.6%
‐3.0%
‐7.7%
‐13.9%
5.4%
‐4.1%
‐27.3%
‐7.9%
‐5.6%
‐9.3%
‐6.5%
1.0%9.5%
164 209 78.5%
195 269 72.5%
684 1,037 66.0%
227 423 53.7%
137 221 62.0%
1 1 100.0%
16 20 80.0%
165 268 61.6%
56 29.9%187
126 267 47.2%
87 249 34.9%52 249 20.9%
49.8%18.1%
54.2%16.8%
8.7%‐7.6%
49.7%17.3%
102 54.5%29 15.5%
187187
At a healthy weight (BMI less than the 85th percentile but at or greater than the 5th percentile) (1)
a.
Overweight (BMI at or above the 85th percentile but less than the 95th percentile)
b.
Underweight (BMI less than the 5th percentile).
c.
Recommended prenatal weight gaina.
Excessive prenatal weight gainb.
Inadequate prenatal weight gainc.
Breastfeeding at 6 weeks of age (1)a.
Breastfeeding at 6 months of ageb.
19.3% 18.9% 18.8% ‐2.5% 51 268 19.0%
1.6% 3.1% 3.1% 99.6% 5 268 1.9%
2000 2008 Data
2002to
2003
2005to
2006
2008to
% Change from 2000
to 2008
Obese (BMI at or greater than the 95th percentile).
d.
16.0% 17.5% 18.5% 15.1% 47 268 17.5%
(2) These data exclude women enrolled in Medicaid only for emergency delivery.
(3) Recommended total prenatal weight gain range by prepregnancy weight category is 28-40 lbs. for underweight women (BMI<18.5); 25-35 lbs. for normal weight women (BMI 18.5 to 24.9); 15-25 lbs. for overweight women (BMI 25 to 29.9); and 11-20 lbs. for obese women (BMI >=30.0): Adapted from the National Academy of Sciences. Weight Gain During Pregnancy: Reexamining the Guidelines. Washington, DC : National Academy Press, 2009.
(1) Item appears also on other WCH Section Agreement Addenda.

Johnston CountyATTACHMENT A: WIC QUALITY ASSURANCE DELIVERABLES
SFY 20102011 AGREEMENT ADDENDA DATA
Process Outcome Objectives
Percentage of pregnant women enrolled in Medicaid who received prenatal WIC Program services. (1) (2)
Percentage of pregnant women who participated in WIC and received WIC Program services during the first trimester of pregnancy.
Percentage of children less than 12 months of age who were served in the Child Health Clinic and received WIC Program services. (1)
Percentage of children 1 to 5 years of age who were served in the Child Health Clinic and received WIC Program Services. (1)
Percentage of children 1 to 5 years of age enrolled in Medicaid who received WIC Program Services.
Percentage of children less than 12 months of age enrolled in Medicaid who received WIC Program services.
Percentage of postpartum women who participated in WIC during pregnancy and were recertified for WIC by 6 weeks postpartum.
Percentage of women with live term singleton births who received WIC Program services during pregnancy and who gained recommended/excessive/inadequate weight according to the National Academy of Sciences ‐ Institute of Medicine 2009 recommended total weight gain ranges during pregnancy. (3)
Percentage of women who participated in WIC who initiated breastfeeding.
1C.
1A.
2A.
2B.
3A.
3B.
1B.
4B.
5A.
67.6% 64.4%
Num Den Percent
Percentage of children 2 to 4 years of age who received services from the health department and who, according to their Body Mass Index (BMI) for age and gender were:
4A.
Percentage of infants who participated in WIC who were: 5B.
72.6%
53.6%
36.5%
38.2%
75.1%
78.2%
63.9%
31.2%
34.1%
21.1%10.1%
70.5%
51.9%
24.8%
65.9%
72.9%
77.9%
62.4%
32.3%
34.2%
20.9%10.5%
56.3%
68.9%
46.8%
14.1%
63.0%
66.8%
60.8%
61.6%
37.4%
47.0%
28.2%15.1%
‐16.7%
‐5.1%
‐12.6%
‐61.2%
64.7%
‐11.0%
‐22.3%
‐3.6%
19.9%
38.0%
33.9%50.1%
493 874 56.4%
1,083 1,500 72.2%
2,896 5,750 50.4%
86 1,168 7.4%
620 810 76.5%
185 281 65.8%
250 404 61.9%
827 1,322 62.6%
268 39.5%679
648 1,268 51.1%
405 1,330 30.5%218 1,330 16.4%
31.6%37.1%
43.6%19.0%
37.6%‐48.8%
43.6%24.1%
309 45.5%102 15.0%
679679
At a healthy weight (BMI less than the 85th percentile but at or greater than the 5th percentile) (1)
a.
Overweight (BMI at or above the 85th percentile but less than the 95th percentile)
b.
Underweight (BMI less than the 5th percentile).
c.
Recommended prenatal weight gaina.
Excessive prenatal weight gainb.
Inadequate prenatal weight gainc.
Breastfeeding at 6 weeks of age (1)a.
Breastfeeding at 6 months of ageb.
16.8% 17.5% 16.8% 0.1% 222 1,322 16.8%
4.1% 3.3% 3.6% ‐13.5% 34 1,322 2.6%
2000 2008 Data
2002to
2003
2005to
2006
2008to
% Change from 2000
to 2008
Obese (BMI at or greater than the 95th percentile).
d.
15.2% 16.7% 18.0% 18.5% 239 1,322 18.1%
(2) These data exclude women enrolled in Medicaid only for emergency delivery.
(3) Recommended total prenatal weight gain range by prepregnancy weight category is 28-40 lbs. for underweight women (BMI<18.5); 25-35 lbs. for normal weight women (BMI 18.5 to 24.9); 15-25 lbs. for overweight women (BMI 25 to 29.9); and 11-20 lbs. for obese women (BMI >=30.0): Adapted from the National Academy of Sciences. Weight Gain During Pregnancy: Reexamining the Guidelines. Washington, DC : National Academy Press, 2009.
(1) Item appears also on other WCH Section Agreement Addenda.

Jones CountyATTACHMENT A: WIC QUALITY ASSURANCE DELIVERABLES
SFY 20102011 AGREEMENT ADDENDA DATA
Process Outcome Objectives
Percentage of pregnant women enrolled in Medicaid who received prenatal WIC Program services. (1) (2)
Percentage of pregnant women who participated in WIC and received WIC Program services during the first trimester of pregnancy.
Percentage of children less than 12 months of age who were served in the Child Health Clinic and received WIC Program services. (1)
Percentage of children 1 to 5 years of age who were served in the Child Health Clinic and received WIC Program Services. (1)
Percentage of children 1 to 5 years of age enrolled in Medicaid who received WIC Program Services.
Percentage of children less than 12 months of age enrolled in Medicaid who received WIC Program services.
Percentage of postpartum women who participated in WIC during pregnancy and were recertified for WIC by 6 weeks postpartum.
Percentage of women with live term singleton births who received WIC Program services during pregnancy and who gained recommended/excessive/inadequate weight according to the National Academy of Sciences ‐ Institute of Medicine 2009 recommended total weight gain ranges during pregnancy. (3)
Percentage of women who participated in WIC who initiated breastfeeding.
1C.
1A.
2A.
2B.
3A.
3B.
1B.
4B.
5A.
81.7% 87.8%
Num Den Percent
Percentage of children 2 to 4 years of age who received services from the health department and who, according to their Body Mass Index (BMI) for age and gender were:
4A.
Percentage of infants who participated in WIC who were: 5B.
83.0%
70.4%
41.2%
77.6%
89.1%
86.5%
70.7%
34.5%
46.9%
23.6%12.7%
79.1%
71.7%
47.1%
76.7%
90.8%
85.8%
68.3%
34.0%
44.8%
28.4%13.7%
81.8%
81.1%
68.5%
46.2%
76.9%
96.2%
86.5%
72.2%
35.7%
46.4%
30.2%17.1%
0.1%
‐2.3%
‐2.6%
12.3%
‐1.0%
7.9%
‐0.1%
2.1%
3.7%
‐1.0%
28.0%34.6%
41 50 82.0%
49 65 75.4%
229 315 72.7%
83 171 48.5%
62 89 69.7%
10 10 100.0%
61 66 92.4%
109 156 69.9%
21 33.3%63
49 111 44.1%
49 132 37.1%26 132 19.7%
43.1%22.4%
48.8%15.5%
13.2%‐31.0%
45.5%20.6%
35 55.6%7 11.1%
6363
At a healthy weight (BMI less than the 85th percentile but at or greater than the 5th percentile) (1)
a.
Overweight (BMI at or above the 85th percentile but less than the 95th percentile)
b.
Underweight (BMI less than the 5th percentile).
c.
Recommended prenatal weight gaina.
Excessive prenatal weight gainb.
Inadequate prenatal weight gainc.
Breastfeeding at 6 weeks of age (1)a.
Breastfeeding at 6 months of ageb.
12.3% 17.7% 14.2% 15.3% 23 156 14.7%
5.1% 2.9% 3.0% ‐40.3% 5 156 3.2%
2000 2008 Data
2002to
2003
2005to
2006
2008to
% Change from 2000
to 2008
Obese (BMI at or greater than the 95th percentile).
d.
11.9% 11.1% 10.5% ‐11.3% 19 156 12.2%
(2) These data exclude women enrolled in Medicaid only for emergency delivery.
(3) Recommended total prenatal weight gain range by prepregnancy weight category is 28-40 lbs. for underweight women (BMI<18.5); 25-35 lbs. for normal weight women (BMI 18.5 to 24.9); 15-25 lbs. for overweight women (BMI 25 to 29.9); and 11-20 lbs. for obese women (BMI >=30.0): Adapted from the National Academy of Sciences. Weight Gain During Pregnancy: Reexamining the Guidelines. Washington, DC : National Academy Press, 2009.
(1) Item appears also on other WCH Section Agreement Addenda.

Lee CountyATTACHMENT A: WIC QUALITY ASSURANCE DELIVERABLES
SFY 20102011 AGREEMENT ADDENDA DATA
Process Outcome Objectives
Percentage of pregnant women enrolled in Medicaid who received prenatal WIC Program services. (1) (2)
Percentage of pregnant women who participated in WIC and received WIC Program services during the first trimester of pregnancy.
Percentage of children less than 12 months of age who were served in the Child Health Clinic and received WIC Program services. (1)
Percentage of children 1 to 5 years of age who were served in the Child Health Clinic and received WIC Program Services. (1)
Percentage of children 1 to 5 years of age enrolled in Medicaid who received WIC Program Services.
Percentage of children less than 12 months of age enrolled in Medicaid who received WIC Program services.
Percentage of postpartum women who participated in WIC during pregnancy and were recertified for WIC by 6 weeks postpartum.
Percentage of women with live term singleton births who received WIC Program services during pregnancy and who gained recommended/excessive/inadequate weight according to the National Academy of Sciences ‐ Institute of Medicine 2009 recommended total weight gain ranges during pregnancy. (3)
Percentage of women who participated in WIC who initiated breastfeeding.
1C.
1A.
2A.
2B.
3A.
3B.
1B.
4B.
5A.
77.3% 69.4%
Num Den Percent
Percentage of children 2 to 4 years of age who received services from the health department and who, according to their Body Mass Index (BMI) for age and gender were:
4A.
Percentage of infants who participated in WIC who were: 5B.
76.8%
60.0%
32.9%
82.4%
75.0%
76.2%
49.2%
33.0%
44.4%
28.2%13.1%
77.0%
59.8%
30.1%
81.7%
95.8%
75.6%
63.6%
29.7%
50.6%
31.3%17.0%
71.5%
78.1%
59.5%
23.3%
73.2%
100.0%
79.4%
67.4%
30.8%
55.2%
31.7%15.9%
‐7.5%
1.7%
‐0.8%
‐29.1%
‐11.2%
33.3%
4.3%
37.0%
‐6.7%
24.5%
12.1%21.5%
270 392 68.9%
567 722 78.5%
1,536 2,468 62.2%
191 915 20.9%
367 491 74.7%
12 12 100.0%
60 78 76.9%
510 766 66.6%
130 31.0%419
360 624 57.7%
198 710 27.9%103 710 14.5%
42.4%24.6%
47.8%21.4%
12.8%‐13.2%
43.3%27.1%
205 48.9%84 20.0%
419419
At a healthy weight (BMI less than the 85th percentile but at or greater than the 5th percentile) (1)
a.
Overweight (BMI at or above the 85th percentile but less than the 95th percentile)
b.
Underweight (BMI less than the 5th percentile).
c.
Recommended prenatal weight gaina.
Excessive prenatal weight gainb.
Inadequate prenatal weight gainc.
Breastfeeding at 6 weeks of age (1)a.
Breastfeeding at 6 months of ageb.
23.9% 16.6% 14.8% ‐38.0% 114 766 14.9%
1.3% 2.2% 2.4% 77.0% 24 766 3.1%
2000 2008 Data
2002to
2003
2005to
2006
2008to
% Change from 2000
to 2008
Obese (BMI at or greater than the 95th percentile).
d.
25.5% 17.6% 15.4% ‐39.8% 118 766 15.4%
(2) These data exclude women enrolled in Medicaid only for emergency delivery.
(3) Recommended total prenatal weight gain range by prepregnancy weight category is 28-40 lbs. for underweight women (BMI<18.5); 25-35 lbs. for normal weight women (BMI 18.5 to 24.9); 15-25 lbs. for overweight women (BMI 25 to 29.9); and 11-20 lbs. for obese women (BMI >=30.0): Adapted from the National Academy of Sciences. Weight Gain During Pregnancy: Reexamining the Guidelines. Washington, DC : National Academy Press, 2009.
(1) Item appears also on other WCH Section Agreement Addenda.

Lenoir CountyATTACHMENT A: WIC QUALITY ASSURANCE DELIVERABLES
SFY 20102011 AGREEMENT ADDENDA DATA
Process Outcome Objectives
Percentage of pregnant women enrolled in Medicaid who received prenatal WIC Program services. (1) (2)
Percentage of pregnant women who participated in WIC and received WIC Program services during the first trimester of pregnancy.
Percentage of children less than 12 months of age who were served in the Child Health Clinic and received WIC Program services. (1)
Percentage of children 1 to 5 years of age who were served in the Child Health Clinic and received WIC Program Services. (1)
Percentage of children 1 to 5 years of age enrolled in Medicaid who received WIC Program Services.
Percentage of children less than 12 months of age enrolled in Medicaid who received WIC Program services.
Percentage of postpartum women who participated in WIC during pregnancy and were recertified for WIC by 6 weeks postpartum.
Percentage of women with live term singleton births who received WIC Program services during pregnancy and who gained recommended/excessive/inadequate weight according to the National Academy of Sciences ‐ Institute of Medicine 2009 recommended total weight gain ranges during pregnancy. (3)
Percentage of women who participated in WIC who initiated breastfeeding.
1C.
1A.
2A.
2B.
3A.
3B.
1B.
4B.
5A.
76.8% 74.3%
Num Den Percent
Percentage of children 2 to 4 years of age who received services from the health department and who, according to their Body Mass Index (BMI) for age and gender were:
4A.
Percentage of infants who participated in WIC who were: 5B.
82.6%
58.4%
35.5%
39.0%
97.5%
96.0%
70.3%
30.0%
32.8%
15.2%6.6%
76.5%
55.4%
35.5%
44.8%
86.2%
95.8%
69.8%
30.5%
32.4%
18.7%8.2%
71.9%
75.2%
51.9%
27.3%
57.9%
58.7%
79.5%
68.9%
27.2%
39.9%
20.0%9.5%
‐6.4%
‐8.9%
‐11.1%
‐23.2%
48.2%
‐39.8%
‐17.1%
‐2.0%
‐9.2%
21.7%
32.2%45.2%
315 456 69.1%
441 594 74.2%
1,292 2,421 53.4%
232 878 26.4%
334 470 71.1%
43 76 56.6%
212 278 76.3%
491 718 68.4%
80 25.6%313
293 637 46.0%
125 650 19.2%66 650 10.2%
43.4%26.6%
48.9%23.9%
12.7%‐10.2%
46.4%23.1%
149 47.6%84 26.8%
313313
At a healthy weight (BMI less than the 85th percentile but at or greater than the 5th percentile) (1)
a.
Overweight (BMI at or above the 85th percentile but less than the 95th percentile)
b.
Underweight (BMI less than the 5th percentile).
c.
Recommended prenatal weight gaina.
Excessive prenatal weight gainb.
Inadequate prenatal weight gainc.
Breastfeeding at 6 weeks of age (1)a.
Breastfeeding at 6 months of ageb.
13.0% 11.0% 10.3% ‐20.9% 76 718 10.6%
5.4% 8.8% 9.7% 79.0% 64 718 8.9%
2000 2008 Data
2002to
2003
2005to
2006
2008to
% Change from 2000
to 2008
Obese (BMI at or greater than the 95th percentile).
d.
11.3% 10.4% 11.1% ‐1.5% 87 718 12.1%
(2) These data exclude women enrolled in Medicaid only for emergency delivery.
(3) Recommended total prenatal weight gain range by prepregnancy weight category is 28-40 lbs. for underweight women (BMI<18.5); 25-35 lbs. for normal weight women (BMI 18.5 to 24.9); 15-25 lbs. for overweight women (BMI 25 to 29.9); and 11-20 lbs. for obese women (BMI >=30.0): Adapted from the National Academy of Sciences. Weight Gain During Pregnancy: Reexamining the Guidelines. Washington, DC : National Academy Press, 2009.
(1) Item appears also on other WCH Section Agreement Addenda.

Lincoln CountyATTACHMENT A: WIC QUALITY ASSURANCE DELIVERABLES
SFY 20102011 AGREEMENT ADDENDA DATA
Process Outcome Objectives
Percentage of pregnant women enrolled in Medicaid who received prenatal WIC Program services. (1) (2)
Percentage of pregnant women who participated in WIC and received WIC Program services during the first trimester of pregnancy.
Percentage of children less than 12 months of age who were served in the Child Health Clinic and received WIC Program services. (1)
Percentage of children 1 to 5 years of age who were served in the Child Health Clinic and received WIC Program Services. (1)
Percentage of children 1 to 5 years of age enrolled in Medicaid who received WIC Program Services.
Percentage of children less than 12 months of age enrolled in Medicaid who received WIC Program services.
Percentage of postpartum women who participated in WIC during pregnancy and were recertified for WIC by 6 weeks postpartum.
Percentage of women with live term singleton births who received WIC Program services during pregnancy and who gained recommended/excessive/inadequate weight according to the National Academy of Sciences ‐ Institute of Medicine 2009 recommended total weight gain ranges during pregnancy. (3)
Percentage of women who participated in WIC who initiated breastfeeding.
1C.
1A.
2A.
2B.
3A.
3B.
1B.
4B.
5A.
68.5% 75.2%
Num Den Percent
Percentage of children 2 to 4 years of age who received services from the health department and who, according to their Body Mass Index (BMI) for age and gender were:
4A.
Percentage of infants who participated in WIC who were: 5B.
69.6%
56.4%
31.5%
74.6%
48.6%
64.0%
68.6%
31.6%
45.7%
23.6%9.9%
74.3%
55.2%
37.4%
73.4%
65.2%
61.8%
67.2%
29.6%
49.2%
26.4%10.2%
74.2%
76.5%
59.3%
38.2%
72.9%
58.8%
59.4%
72.8%
30.3%
49.1%
28.3%11.5%
8.5%
10.0%
5.3%
21.3%
‐2.3%
20.9%
‐7.2%
6.2%
‐3.9%
7.5%
20.0%15.8%
285 385 74.0%
439 586 74.9%
1,337 2,184 61.2%
333 843 39.5%
376 525 71.6%
5 7 71.4%
24 41 58.5%
493 673 73.3%
121 31.9%379
311 672 46.3%
172 641 26.8%69 641 10.8%
52.3%16.2%
48.8%20.8%
‐6.6%28.9%
49.8%20.6%
172 45.4%86 22.7%
379379
At a healthy weight (BMI less than the 85th percentile but at or greater than the 5th percentile) (1)
a.
Overweight (BMI at or above the 85th percentile but less than the 95th percentile)
b.
Underweight (BMI less than the 5th percentile).
c.
Recommended prenatal weight gaina.
Excessive prenatal weight gainb.
Inadequate prenatal weight gainc.
Breastfeeding at 6 weeks of age (1)a.
Breastfeeding at 6 months of ageb.
14.4% 10.1% 9.4% ‐34.6% 68 673 10.1%
4.3% 14.0% 7.9% 85.0% 48 673 7.1%
2000 2008 Data
2002to
2003
2005to
2006
2008to
% Change from 2000
to 2008
Obese (BMI at or greater than the 95th percentile).
d.
12.7% 8.6% 9.8% ‐22.9% 64 673 9.5%
(2) These data exclude women enrolled in Medicaid only for emergency delivery.
(3) Recommended total prenatal weight gain range by prepregnancy weight category is 28-40 lbs. for underweight women (BMI<18.5); 25-35 lbs. for normal weight women (BMI 18.5 to 24.9); 15-25 lbs. for overweight women (BMI 25 to 29.9); and 11-20 lbs. for obese women (BMI >=30.0): Adapted from the National Academy of Sciences. Weight Gain During Pregnancy: Reexamining the Guidelines. Washington, DC : National Academy Press, 2009.
(1) Item appears also on other WCH Section Agreement Addenda.

Macon CountyATTACHMENT A: WIC QUALITY ASSURANCE DELIVERABLES
SFY 20102011 AGREEMENT ADDENDA DATA
Process Outcome Objectives
Percentage of pregnant women enrolled in Medicaid who received prenatal WIC Program services. (1) (2)
Percentage of pregnant women who participated in WIC and received WIC Program services during the first trimester of pregnancy.
Percentage of children less than 12 months of age who were served in the Child Health Clinic and received WIC Program services. (1)
Percentage of children 1 to 5 years of age who were served in the Child Health Clinic and received WIC Program Services. (1)
Percentage of children 1 to 5 years of age enrolled in Medicaid who received WIC Program Services.
Percentage of children less than 12 months of age enrolled in Medicaid who received WIC Program services.
Percentage of postpartum women who participated in WIC during pregnancy and were recertified for WIC by 6 weeks postpartum.
Percentage of women with live term singleton births who received WIC Program services during pregnancy and who gained recommended/excessive/inadequate weight according to the National Academy of Sciences ‐ Institute of Medicine 2009 recommended total weight gain ranges during pregnancy. (3)
Percentage of women who participated in WIC who initiated breastfeeding.
1C.
1A.
2A.
2B.
3A.
3B.
1B.
4B.
5A.
76.5% 78.6%
Num Den Percent
Percentage of children 2 to 4 years of age who received services from the health department and who, according to their Body Mass Index (BMI) for age and gender were:
4A.
Percentage of infants who participated in WIC who were: 5B.
69.1%
63.2%
51.7%
54.7%
84.0%
77.3%
68.8%
27.0%
56.2%
36.6%19.0%
73.1%
61.1%
49.9%
50.1%
76.5%
79.1%
64.7%
32.2%
65.0%
42.1%21.6%
72.3%
71.4%
57.7%
40.2%
71.3%
89.5%
77.7%
67.9%
38.5%
68.7%
39.0%22.5%
‐5.5%
3.4%
‐8.7%
‐22.2%
30.4%
6.5%
0.5%
‐1.2%
42.6%
22.3%
6.6%18.3%
126 195 64.6%
224 305 73.4%
720 1,169 61.6%
199 460 43.3%
231 287 80.5%
3 4 75.0%
48 51 94.1%
260 371 70.1%
79 42.7%185
247 338 73.1%
134 327 41.0%80 327 24.5%
52.6%20.4%
44.1%17.4%
‐16.0%‐15.0%
47.0%20.9%
76 41.1%30 16.2%
185185
At a healthy weight (BMI less than the 85th percentile but at or greater than the 5th percentile) (1)
a.
Overweight (BMI at or above the 85th percentile but less than the 95th percentile)
b.
Underweight (BMI less than the 5th percentile).
c.
Recommended prenatal weight gaina.
Excessive prenatal weight gainb.
Inadequate prenatal weight gainc.
Breastfeeding at 6 weeks of age (1)a.
Breastfeeding at 6 months of ageb.
15.2% 16.5% 16.8% 10.9% 62 371 16.7%
1.5% 2.8% 1.3% ‐13.7% 3 371 0.8%
2000 2008 Data
2002to
2003
2005to
2006
2008to
% Change from 2000
to 2008
Obese (BMI at or greater than the 95th percentile).
d.
14.5% 15.9% 13.9% ‐4.2% 46 371 12.4%
(2) These data exclude women enrolled in Medicaid only for emergency delivery.
(3) Recommended total prenatal weight gain range by prepregnancy weight category is 28-40 lbs. for underweight women (BMI<18.5); 25-35 lbs. for normal weight women (BMI 18.5 to 24.9); 15-25 lbs. for overweight women (BMI 25 to 29.9); and 11-20 lbs. for obese women (BMI >=30.0): Adapted from the National Academy of Sciences. Weight Gain During Pregnancy: Reexamining the Guidelines. Washington, DC : National Academy Press, 2009.
(1) Item appears also on other WCH Section Agreement Addenda.

Madison CountyATTACHMENT A: WIC QUALITY ASSURANCE DELIVERABLES
SFY 20102011 AGREEMENT ADDENDA DATA
Process Outcome Objectives
Percentage of pregnant women enrolled in Medicaid who received prenatal WIC Program services. (1) (2)
Percentage of pregnant women who participated in WIC and received WIC Program services during the first trimester of pregnancy.
Percentage of children less than 12 months of age who were served in the Child Health Clinic and received WIC Program services. (1)
Percentage of children 1 to 5 years of age who were served in the Child Health Clinic and received WIC Program Services. (1)
Percentage of children 1 to 5 years of age enrolled in Medicaid who received WIC Program Services.
Percentage of children less than 12 months of age enrolled in Medicaid who received WIC Program services.
Percentage of postpartum women who participated in WIC during pregnancy and were recertified for WIC by 6 weeks postpartum.
Percentage of women with live term singleton births who received WIC Program services during pregnancy and who gained recommended/excessive/inadequate weight according to the National Academy of Sciences ‐ Institute of Medicine 2009 recommended total weight gain ranges during pregnancy. (3)
Percentage of women who participated in WIC who initiated breastfeeding.
1C.
1A.
2A.
2B.
3A.
3B.
1B.
4B.
5A.
84.7% 80.7%
Num Den Percent
Percentage of children 2 to 4 years of age who received services from the health department and who, according to their Body Mass Index (BMI) for age and gender were:
4A.
Percentage of infants who participated in WIC who were: 5B.
75.8%
65.5%
53.9%
73.2%
91.7%
91.7%
61.2%
35.0%
80.5%
27.6%15.6%
70.6%
64.6%
46.3%
72.6%
62.3%
28.3%
57.4%
30.7%16.9%
73.3%
66.8%
53.7%
47.8%
69.1%
93.8%
84.6%
66.1%
33.1%
49.2%
39.3%24.0%
‐13.4%
‐11.9%
‐18.1%
‐11.3%
‐5.7%
2.3%
‐7.8%
8.0%
‐5.3%
‐38.9%
42.7%53.7%
75 107 70.1%
102 142 71.8%
337 611 55.2%
121 252 48.0%
83 132 62.9%
13 14 92.9%
13 16 81.3%
136 205 66.3%
34 32.7%104
124 165 75.2%
65 186 34.9%38 186 20.4%
43.6%21.5%
48.9%18.0%
12.2%‐16.2%
46.9%24.8%
53 51.0%17 16.3%
104104
At a healthy weight (BMI less than the 85th percentile but at or greater than the 5th percentile) (1)
a.
Overweight (BMI at or above the 85th percentile but less than the 95th percentile)
b.
Underweight (BMI less than the 5th percentile).
c.
Recommended prenatal weight gaina.
Excessive prenatal weight gainb.
Inadequate prenatal weight gainc.
Breastfeeding at 6 weeks of age (1)a.
Breastfeeding at 6 months of ageb.
20.3% 16.3% 15.7% ‐22.5% 29 205 14.1%
3.2% 2.2% 3.8% 18.1% 11 205 5.4%
2000 2008 Data
2002to
2003
2005to
2006
2008to
% Change from 2000
to 2008
Obese (BMI at or greater than the 95th percentile).
d.
15.3% 19.2% 14.4% ‐5.9% 29 205 14.1%
(2) These data exclude women enrolled in Medicaid only for emergency delivery.
(3) Recommended total prenatal weight gain range by prepregnancy weight category is 28-40 lbs. for underweight women (BMI<18.5); 25-35 lbs. for normal weight women (BMI 18.5 to 24.9); 15-25 lbs. for overweight women (BMI 25 to 29.9); and 11-20 lbs. for obese women (BMI >=30.0): Adapted from the National Academy of Sciences. Weight Gain During Pregnancy: Reexamining the Guidelines. Washington, DC : National Academy Press, 2009.
(1) Item appears also on other WCH Section Agreement Addenda.

MartinTyrrellWashington DistrictATTACHMENT A: WIC QUALITY ASSURANCE DELIVERABLES
SFY 20102011 AGREEMENT ADDENDA DATA
Process Outcome Objectives
Percentage of pregnant women enrolled in Medicaid who received prenatal WIC Program services. (1) (2)
Percentage of pregnant women who participated in WIC and received WIC Program services during the first trimester of pregnancy.
Percentage of children less than 12 months of age who were served in the Child Health Clinic and received WIC Program services. (1)
Percentage of children 1 to 5 years of age who were served in the Child Health Clinic and received WIC Program Services. (1)
Percentage of children 1 to 5 years of age enrolled in Medicaid who received WIC Program Services.
Percentage of children less than 12 months of age enrolled in Medicaid who received WIC Program services.
Percentage of postpartum women who participated in WIC during pregnancy and were recertified for WIC by 6 weeks postpartum.
Percentage of women with live term singleton births who received WIC Program services during pregnancy and who gained recommended/excessive/inadequate weight according to the National Academy of Sciences ‐ Institute of Medicine 2009 recommended total weight gain ranges during pregnancy. (3)
Percentage of women who participated in WIC who initiated breastfeeding.
1C.
1A.
2A.
2B.
3A.
3B.
1B.
4B.
5A.
81.4% 80.0%
Num Den Percent
Percentage of children 2 to 4 years of age who received services from the health department and who, according to their Body Mass Index (BMI) for age and gender were:
4A.
Percentage of infants who participated in WIC who were: 5B.
76.7%
65.0%
41.1%
77.5%
95.2%
94.1%
64.4%
30.3%
31.5%
16.0%8.4%
74.6%
65.0%
37.4%
79.1%
97.1%
94.7%
65.7%
29.4%
41.3%
24.6%11.9%
83.6%
70.4%
61.9%
32.3%
82.0%
94.8%
92.5%
65.5%
30.0%
38.1%
23.3%11.4%
2.7%
‐8.2%
‐4.8%
‐21.3%
5.8%
‐0.4%
‐1.7%
1.7%
‐0.9%
20.8%
45.2%35.7%
304 353 86.1%
308 450 68.4%
1,096 1,724 63.6%
292 859 34.0%
321 384 83.6%
153 159 96.2%
427 461 92.6%
473 725 65.2%
101 30.0%337
170 456 37.3%
105 505 20.8%51 505 10.1%
44.3%25.4%
43.3%26.6%
‐2.1%4.8%
42.9%27.7%
148 43.9%88 26.1%
337337
At a healthy weight (BMI less than the 85th percentile but at or greater than the 5th percentile) (1)
a.
Overweight (BMI at or above the 85th percentile but less than the 95th percentile)
b.
Underweight (BMI less than the 5th percentile).
c.
Recommended prenatal weight gaina.
Excessive prenatal weight gainb.
Inadequate prenatal weight gainc.
Breastfeeding at 6 weeks of age (1)a.
Breastfeeding at 6 months of ageb.
14.9% 13.8% 13.4% ‐10.4% 104 725 14.3%
5.5% 7.8% 7.0% 27.8% 41 725 5.7%
2000 2008 Data
2002to
2003
2005to
2006
2008to
% Change from 2000
to 2008
Obese (BMI at or greater than the 95th percentile).
d.
15.2% 12.7% 14.2% ‐6.9% 107 725 14.8%
(2) These data exclude women enrolled in Medicaid only for emergency delivery.
(3) Recommended total prenatal weight gain range by prepregnancy weight category is 28-40 lbs. for underweight women (BMI<18.5); 25-35 lbs. for normal weight women (BMI 18.5 to 24.9); 15-25 lbs. for overweight women (BMI 25 to 29.9); and 11-20 lbs. for obese women (BMI >=30.0): Adapted from the National Academy of Sciences. Weight Gain During Pregnancy: Reexamining the Guidelines. Washington, DC : National Academy Press, 2009.
(1) Item appears also on other WCH Section Agreement Addenda.

Mecklenburg CountyATTACHMENT A: WIC QUALITY ASSURANCE DELIVERABLES
SFY 20102011 AGREEMENT ADDENDA DATA
Process Outcome Objectives
Percentage of pregnant women enrolled in Medicaid who received prenatal WIC Program services. (1) (2)
Percentage of pregnant women who participated in WIC and received WIC Program services during the first trimester of pregnancy.
Percentage of children less than 12 months of age who were served in the Child Health Clinic and received WIC Program services. (1)
Percentage of children 1 to 5 years of age who were served in the Child Health Clinic and received WIC Program Services. (1)
Percentage of children 1 to 5 years of age enrolled in Medicaid who received WIC Program Services.
Percentage of children less than 12 months of age enrolled in Medicaid who received WIC Program services.
Percentage of postpartum women who participated in WIC during pregnancy and were recertified for WIC by 6 weeks postpartum.
Percentage of women with live term singleton births who received WIC Program services during pregnancy and who gained recommended/excessive/inadequate weight according to the National Academy of Sciences ‐ Institute of Medicine 2009 recommended total weight gain ranges during pregnancy. (3)
Percentage of women who participated in WIC who initiated breastfeeding.
1C.
1A.
2A.
2B.
3A.
3B.
1B.
4B.
5A.
61.4% 57.6%
Num Den Percent
Percentage of children 2 to 4 years of age who received services from the health department and who, according to their Body Mass Index (BMI) for age and gender were:
4A.
Percentage of infants who participated in WIC who were: 5B.
59.7%
45.7%
22.0%
46.9%
64.9%
31.2%
49.8%
20.7%12.1%
59.0%
44.4%
16.7%
49.6%
18.8%
20.8%
63.3%
31.2%
49.9%
29.7%15.8%
62.4%
61.9%
42.7%
16.4%
47.8%
36.4%
18.9%
62.8%
33.1%
55.5%
31.8%16.0%
1.7%
3.6%
‐6.5%
‐25.6%
2.0%
‐3.1%
6.3%
11.4%
53.5%32.7%
2,748 4,304 63.8%
5,188 8,043 64.5%
13,309 28,839 46.1%
1,354 7,827 17.3%
2,407 5,415 44.5%
1 3 33.3%
5 41 12.2%
3,958 6,384 62.0%
1,128 34.4%3,277
3,689 6,576 56.1%
2,723 7,884 34.5%1,393 7,884 17.7%
48.5%20.4%
47.4%19.5%
‐2.2%‐4.3%
49.5%19.2%
1,538 46.9%611 18.6%
3,2773,277
At a healthy weight (BMI less than the 85th percentile but at or greater than the 5th percentile) (1)
a.
Overweight (BMI at or above the 85th percentile but less than the 95th percentile)
b.
Underweight (BMI less than the 5th percentile).
c.
Recommended prenatal weight gaina.
Excessive prenatal weight gainb.
Inadequate prenatal weight gainc.
Breastfeeding at 6 weeks of age (1)a.
Breastfeeding at 6 months of ageb.
14.7% 17.0% 17.5% 19.4% 1,158 6,384 18.1%
5.6% 3.8% 3.0% ‐45.6% 172 6,384 2.7%
2000 2008 Data
2002to
2003
2005to
2006
2008to
% Change from 2000
to 2008
Obese (BMI at or greater than the 95th percentile).
d.
14.9% 16.0% 16.6% 11.7% 1,096 6,384 17.2%
(2) These data exclude women enrolled in Medicaid only for emergency delivery.
(3) Recommended total prenatal weight gain range by prepregnancy weight category is 28-40 lbs. for underweight women (BMI<18.5); 25-35 lbs. for normal weight women (BMI 18.5 to 24.9); 15-25 lbs. for overweight women (BMI 25 to 29.9); and 11-20 lbs. for obese women (BMI >=30.0): Adapted from the National Academy of Sciences. Weight Gain During Pregnancy: Reexamining the Guidelines. Washington, DC : National Academy Press, 2009.
(1) Item appears also on other WCH Section Agreement Addenda.

Montgomery CountyATTACHMENT A: WIC QUALITY ASSURANCE DELIVERABLES
SFY 20102011 AGREEMENT ADDENDA DATA
Process Outcome Objectives
Percentage of pregnant women enrolled in Medicaid who received prenatal WIC Program services. (1) (2)
Percentage of pregnant women who participated in WIC and received WIC Program services during the first trimester of pregnancy.
Percentage of children less than 12 months of age who were served in the Child Health Clinic and received WIC Program services. (1)
Percentage of children 1 to 5 years of age who were served in the Child Health Clinic and received WIC Program Services. (1)
Percentage of children 1 to 5 years of age enrolled in Medicaid who received WIC Program Services.
Percentage of children less than 12 months of age enrolled in Medicaid who received WIC Program services.
Percentage of postpartum women who participated in WIC during pregnancy and were recertified for WIC by 6 weeks postpartum.
Percentage of women with live term singleton births who received WIC Program services during pregnancy and who gained recommended/excessive/inadequate weight according to the National Academy of Sciences ‐ Institute of Medicine 2009 recommended total weight gain ranges during pregnancy. (3)
Percentage of women who participated in WIC who initiated breastfeeding.
1C.
1A.
2A.
2B.
3A.
3B.
1B.
4B.
5A.
69.1% 71.2%
Num Den Percent
Percentage of children 2 to 4 years of age who received services from the health department and who, according to their Body Mass Index (BMI) for age and gender were:
4A.
Percentage of infants who participated in WIC who were: 5B.
71.6%
58.0%
38.6%
79.7%
97.1%
94.9%
69.6%
33.7%
48.4%
27.0%9.3%
73.9%
57.6%
38.3%
81.6%
97.9%
94.0%
60.4%
30.2%
53.3%
33.3%15.0%
68.6%
79.0%
63.0%
38.4%
81.3%
100.0%
95.2%
61.7%
35.0%
57.9%
32.8%17.5%
‐0.8%
10.4%
8.5%
‐0.5%
2.0%
3.0%
0.3%
‐11.4%
3.7%
19.6%
21.7%88.8%
148 195 75.9%
248 304 81.6%
790 1,164 67.9%
244 641 38.1%
239 295 81.0%
48 48 100.0%
191 196 97.4%
321 525 61.1%
79 34.6%228
204 346 59.0%
117 368 31.8%58 368 15.8%
40.3%26.0%
44.9%20.1%
11.4%‐22.6%
46.5%23.3%
103 45.2%46 20.2%
228228
At a healthy weight (BMI less than the 85th percentile but at or greater than the 5th percentile) (1)
a.
Overweight (BMI at or above the 85th percentile but less than the 95th percentile)
b.
Underweight (BMI less than the 5th percentile).
c.
Recommended prenatal weight gaina.
Excessive prenatal weight gainb.
Inadequate prenatal weight gainc.
Breastfeeding at 6 weeks of age (1)a.
Breastfeeding at 6 months of ageb.
10.2% 18.2% 17.0% 66.9% 99 525 18.9%
9.4% 3.2% 2.3% ‐75.9% 11 525 2.1%
2000 2008 Data
2002to
2003
2005to
2006
2008to
% Change from 2000
to 2008
Obese (BMI at or greater than the 95th percentile).
d.
10.8% 18.2% 19.1% 76.6% 94 525 17.9%
(2) These data exclude women enrolled in Medicaid only for emergency delivery.
(3) Recommended total prenatal weight gain range by prepregnancy weight category is 28-40 lbs. for underweight women (BMI<18.5); 25-35 lbs. for normal weight women (BMI 18.5 to 24.9); 15-25 lbs. for overweight women (BMI 25 to 29.9); and 11-20 lbs. for obese women (BMI >=30.0): Adapted from the National Academy of Sciences. Weight Gain During Pregnancy: Reexamining the Guidelines. Washington, DC : National Academy Press, 2009.
(1) Item appears also on other WCH Section Agreement Addenda.

Moore CountyATTACHMENT A: WIC QUALITY ASSURANCE DELIVERABLES
SFY 20102011 AGREEMENT ADDENDA DATA
Process Outcome Objectives
Percentage of pregnant women enrolled in Medicaid who received prenatal WIC Program services. (1) (2)
Percentage of pregnant women who participated in WIC and received WIC Program services during the first trimester of pregnancy.
Percentage of children less than 12 months of age who were served in the Child Health Clinic and received WIC Program services. (1)
Percentage of children 1 to 5 years of age who were served in the Child Health Clinic and received WIC Program Services. (1)
Percentage of children 1 to 5 years of age enrolled in Medicaid who received WIC Program Services.
Percentage of children less than 12 months of age enrolled in Medicaid who received WIC Program services.
Percentage of postpartum women who participated in WIC during pregnancy and were recertified for WIC by 6 weeks postpartum.
Percentage of women with live term singleton births who received WIC Program services during pregnancy and who gained recommended/excessive/inadequate weight according to the National Academy of Sciences ‐ Institute of Medicine 2009 recommended total weight gain ranges during pregnancy. (3)
Percentage of women who participated in WIC who initiated breastfeeding.
1C.
1A.
2A.
2B.
3A.
3B.
1B.
4B.
5A.
72.5% 70.9%
Num Den Percent
Percentage of children 2 to 4 years of age who received services from the health department and who, according to their Body Mass Index (BMI) for age and gender were:
4A.
Percentage of infants who participated in WIC who were: 5B.
75.9%
68.3%
34.4%
71.5%
91.4%
87.8%
70.2%
27.6%
43.0%
21.5%8.5%
78.2%
64.1%
31.5%
70.2%
93.5%
89.4%
65.3%
28.3%
42.9%
24.9%11.2%
49.5%
80.4%
61.2%
28.9%
70.9%
95.5%
91.1%
66.4%
27.4%
52.9%
26.7%11.7%
‐31.7%
6.0%
‐10.3%
‐16.1%
‐0.9%
4.5%
3.8%
‐5.4%
‐0.7%
22.9%
23.8%37.9%
236 421 56.1%
503 615 81.8%
1,396 2,340 59.7%
286 1,050 27.2%
282 510 55.3%
31 34 91.2%
168 186 90.3%
532 821 64.8%
98 28.8%340
372 613 60.7%
174 691 25.2%82 691 11.9%
52.6%19.8%
53.9%18.7%
2.4%‐5.5%
51.2%20.5%
186 54.7%56 16.5%
340340
At a healthy weight (BMI less than the 85th percentile but at or greater than the 5th percentile) (1)
a.
Overweight (BMI at or above the 85th percentile but less than the 95th percentile)
b.
Underweight (BMI less than the 5th percentile).
c.
Recommended prenatal weight gaina.
Excessive prenatal weight gainb.
Inadequate prenatal weight gainc.
Breastfeeding at 6 weeks of age (1)a.
Breastfeeding at 6 months of ageb.
13.9% 16.9% 15.9% 14.7% 130 821 15.8%
2.9% 3.5% 3.1% 8.8% 30 821 3.7%
2000 2008 Data
2002to
2003
2005to
2006
2008to
% Change from 2000
to 2008
Obese (BMI at or greater than the 95th percentile).
d.
13.1% 14.2% 14.6% 11.2% 129 821 15.7%
(2) These data exclude women enrolled in Medicaid only for emergency delivery.
(3) Recommended total prenatal weight gain range by prepregnancy weight category is 28-40 lbs. for underweight women (BMI<18.5); 25-35 lbs. for normal weight women (BMI 18.5 to 24.9); 15-25 lbs. for overweight women (BMI 25 to 29.9); and 11-20 lbs. for obese women (BMI >=30.0): Adapted from the National Academy of Sciences. Weight Gain During Pregnancy: Reexamining the Guidelines. Washington, DC : National Academy Press, 2009.
(1) Item appears also on other WCH Section Agreement Addenda.

Nash CountyATTACHMENT A: WIC QUALITY ASSURANCE DELIVERABLES
SFY 20102011 AGREEMENT ADDENDA DATA
Process Outcome Objectives
Percentage of pregnant women enrolled in Medicaid who received prenatal WIC Program services. (1) (2)
Percentage of pregnant women who participated in WIC and received WIC Program services during the first trimester of pregnancy.
Percentage of children less than 12 months of age who were served in the Child Health Clinic and received WIC Program services. (1)
Percentage of children 1 to 5 years of age who were served in the Child Health Clinic and received WIC Program Services. (1)
Percentage of children 1 to 5 years of age enrolled in Medicaid who received WIC Program Services.
Percentage of children less than 12 months of age enrolled in Medicaid who received WIC Program services.
Percentage of postpartum women who participated in WIC during pregnancy and were recertified for WIC by 6 weeks postpartum.
Percentage of women with live term singleton births who received WIC Program services during pregnancy and who gained recommended/excessive/inadequate weight according to the National Academy of Sciences ‐ Institute of Medicine 2009 recommended total weight gain ranges during pregnancy. (3)
Percentage of women who participated in WIC who initiated breastfeeding.
1C.
1A.
2A.
2B.
3A.
3B.
1B.
4B.
5A.
78.3% 75.6%
Num Den Percent
Percentage of children 2 to 4 years of age who received services from the health department and who, according to their Body Mass Index (BMI) for age and gender were:
4A.
Percentage of infants who participated in WIC who were: 5B.
72.9%
55.5%
34.1%
75.7%
92.9%
92.4%
65.6%
28.8%
37.0%
16.5%8.2%
74.8%
52.3%
33.2%
78.9%
91.0%
88.4%
65.2%
30.6%
46.7%
18.6%8.6%
76.7%
73.6%
48.1%
31.0%
80.3%
87.9%
81.9%
66.0%
30.7%
43.8%
22.2%10.1%
‐2.0%
1.0%
‐13.3%
‐9.2%
6.0%
‐5.3%
‐11.4%
0.6%
6.7%
18.3%
34.5%23.4%
511 651 78.5%
642 875 73.4%
1,636 3,240 50.5%
556 1,650 33.7%
735 890 82.6%
239 269 88.8%
407 503 80.9%
673 1,012 66.5%
194 30.9%627
427 1,111 38.4%
216 1,004 21.5%111 1,004 11.1%
47.4%23.8%
40.3%29.0%
‐14.9%21.5%
45.9%23.5%
257 41.0%176 28.1%
627627
At a healthy weight (BMI less than the 85th percentile but at or greater than the 5th percentile) (1)
a.
Overweight (BMI at or above the 85th percentile but less than the 95th percentile)
b.
Underweight (BMI less than the 5th percentile).
c.
Recommended prenatal weight gaina.
Excessive prenatal weight gainb.
Inadequate prenatal weight gainc.
Breastfeeding at 6 weeks of age (1)a.
Breastfeeding at 6 months of ageb.
15.6% 15.0% 14.0% ‐10.5% 157 1,012 15.5%
4.7% 6.1% 5.8% 22.8% 48 1,012 4.7%
2000 2008 Data
2002to
2003
2005to
2006
2008to
% Change from 2000
to 2008
Obese (BMI at or greater than the 95th percentile).
d.
14.1% 13.8% 14.2% 1.2% 134 1,012 13.2%
(2) These data exclude women enrolled in Medicaid only for emergency delivery.
(3) Recommended total prenatal weight gain range by prepregnancy weight category is 28-40 lbs. for underweight women (BMI<18.5); 25-35 lbs. for normal weight women (BMI 18.5 to 24.9); 15-25 lbs. for overweight women (BMI 25 to 29.9); and 11-20 lbs. for obese women (BMI >=30.0): Adapted from the National Academy of Sciences. Weight Gain During Pregnancy: Reexamining the Guidelines. Washington, DC : National Academy Press, 2009.
(1) Item appears also on other WCH Section Agreement Addenda.

New Hanover CountyATTACHMENT A: WIC QUALITY ASSURANCE DELIVERABLES
SFY 20102011 AGREEMENT ADDENDA DATA
Process Outcome Objectives
Percentage of pregnant women enrolled in Medicaid who received prenatal WIC Program services. (1) (2)
Percentage of pregnant women who participated in WIC and received WIC Program services during the first trimester of pregnancy.
Percentage of children less than 12 months of age who were served in the Child Health Clinic and received WIC Program services. (1)
Percentage of children 1 to 5 years of age who were served in the Child Health Clinic and received WIC Program Services. (1)
Percentage of children 1 to 5 years of age enrolled in Medicaid who received WIC Program Services.
Percentage of children less than 12 months of age enrolled in Medicaid who received WIC Program services.
Percentage of postpartum women who participated in WIC during pregnancy and were recertified for WIC by 6 weeks postpartum.
Percentage of women with live term singleton births who received WIC Program services during pregnancy and who gained recommended/excessive/inadequate weight according to the National Academy of Sciences ‐ Institute of Medicine 2009 recommended total weight gain ranges during pregnancy. (3)
Percentage of women who participated in WIC who initiated breastfeeding.
1C.
1A.
2A.
2B.
3A.
3B.
1B.
4B.
5A.
77.2% 72.1%
Num Den Percent
Percentage of children 2 to 4 years of age who received services from the health department and who, according to their Body Mass Index (BMI) for age and gender were:
4A.
Percentage of infants who participated in WIC who were: 5B.
70.5%
51.2%
31.6%
59.6%
94.1%
24.6%
69.0%
33.6%
39.4%
21.1%10.5%
65.9%
46.6%
30.0%
70.8%
66.7%
49.2%
65.8%
30.0%
42.3%
27.3%13.9%
72.0%
67.2%
45.9%
34.0%
67.7%
71.4%
68.4%
66.1%
31.2%
50.9%
32.7%16.8%
‐6.7%
‐4.6%
‐10.4%
7.5%
13.6%
‐24.1%
177.8%
‐4.2%
‐7.1%
29.3%
54.8%60.4%
704 950 74.1%
984 1,387 70.9%
2,420 4,991 48.5%
784 2,186 35.9%
809 1,270 63.7%
1 1 100.0%
63 108 58.3%
788 1,236 63.8%
227 30.0%756
863 1,547 55.8%
469 1,446 32.4%253 1,446 17.5%
48.4%18.0%
49.0%19.7%
1.3%9.9%
49.5%20.6%
379 50.1%150 19.8%
756756
At a healthy weight (BMI less than the 85th percentile but at or greater than the 5th percentile) (1)
a.
Overweight (BMI at or above the 85th percentile but less than the 95th percentile)
b.
Underweight (BMI less than the 5th percentile).
c.
Recommended prenatal weight gaina.
Excessive prenatal weight gainb.
Inadequate prenatal weight gainc.
Breastfeeding at 6 weeks of age (1)a.
Breastfeeding at 6 months of ageb.
13.8% 16.4% 16.2% 17.2% 221 1,236 17.9%
6.2% 2.9% 2.5% ‐59.4% 29 1,236 2.3%
2000 2008 Data
2002to
2003
2005to
2006
2008to
% Change from 2000
to 2008
Obese (BMI at or greater than the 95th percentile).
d.
11.0% 14.9% 15.2% 38.3% 198 1,236 16.0%
(2) These data exclude women enrolled in Medicaid only for emergency delivery.
(3) Recommended total prenatal weight gain range by prepregnancy weight category is 28-40 lbs. for underweight women (BMI<18.5); 25-35 lbs. for normal weight women (BMI 18.5 to 24.9); 15-25 lbs. for overweight women (BMI 25 to 29.9); and 11-20 lbs. for obese women (BMI >=30.0): Adapted from the National Academy of Sciences. Weight Gain During Pregnancy: Reexamining the Guidelines. Washington, DC : National Academy Press, 2009.
(1) Item appears also on other WCH Section Agreement Addenda.
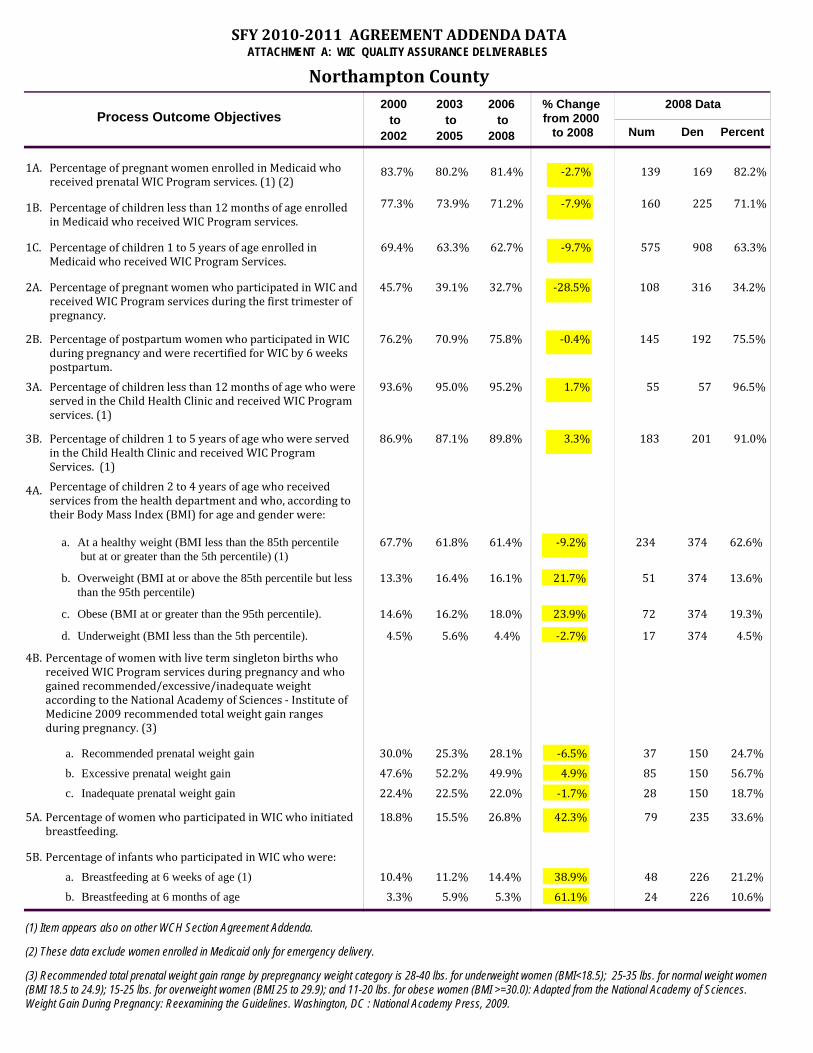
Northampton CountyATTACHMENT A: WIC QUALITY ASSURANCE DELIVERABLES
SFY 20102011 AGREEMENT ADDENDA DATA
Process Outcome Objectives
Percentage of pregnant women enrolled in Medicaid who received prenatal WIC Program services. (1) (2)
Percentage of pregnant women who participated in WIC and received WIC Program services during the first trimester of pregnancy.
Percentage of children less than 12 months of age who were served in the Child Health Clinic and received WIC Program services. (1)
Percentage of children 1 to 5 years of age who were served in the Child Health Clinic and received WIC Program Services. (1)
Percentage of children 1 to 5 years of age enrolled in Medicaid who received WIC Program Services.
Percentage of children less than 12 months of age enrolled in Medicaid who received WIC Program services.
Percentage of postpartum women who participated in WIC during pregnancy and were recertified for WIC by 6 weeks postpartum.
Percentage of women with live term singleton births who received WIC Program services during pregnancy and who gained recommended/excessive/inadequate weight according to the National Academy of Sciences ‐ Institute of Medicine 2009 recommended total weight gain ranges during pregnancy. (3)
Percentage of women who participated in WIC who initiated breastfeeding.
1C.
1A.
2A.
2B.
3A.
3B.
1B.
4B.
5A.
83.7% 80.2%
Num Den Percent
Percentage of children 2 to 4 years of age who received services from the health department and who, according to their Body Mass Index (BMI) for age and gender were:
4A.
Percentage of infants who participated in WIC who were: 5B.
77.3%
69.4%
45.7%
76.2%
93.6%
86.9%
67.7%
30.0%
18.8%
10.4%3.3%
73.9%
63.3%
39.1%
70.9%
95.0%
87.1%
61.8%
25.3%
15.5%
11.2%5.9%
81.4%
71.2%
62.7%
32.7%
75.8%
95.2%
89.8%
61.4%
28.1%
26.8%
14.4%5.3%
‐2.7%
‐7.9%
‐9.7%
‐28.5%
‐0.4%
1.7%
3.3%
‐9.2%
‐6.5%
42.3%
38.9%61.1%
139 169 82.2%
160 225 71.1%
575 908 63.3%
108 316 34.2%
145 192 75.5%
55 57 96.5%
183 201 91.0%
234 374 62.6%
37 24.7%150
79 235 33.6%
48 226 21.2%24 226 10.6%
47.6%22.4%
49.9%22.0%
4.9%‐1.7%
52.2%22.5%
85 56.7%28 18.7%
150150
At a healthy weight (BMI less than the 85th percentile but at or greater than the 5th percentile) (1)
a.
Overweight (BMI at or above the 85th percentile but less than the 95th percentile)
b.
Underweight (BMI less than the 5th percentile).
c.
Recommended prenatal weight gaina.
Excessive prenatal weight gainb.
Inadequate prenatal weight gainc.
Breastfeeding at 6 weeks of age (1)a.
Breastfeeding at 6 months of ageb.
13.3% 16.4% 16.1% 21.7% 51 374 13.6%
4.5% 5.6% 4.4% ‐2.7% 17 374 4.5%
2000 2008 Data
2002to
2003
2005to
2006
2008to
% Change from 2000
to 2008
Obese (BMI at or greater than the 95th percentile).
d.
14.6% 16.2% 18.0% 23.9% 72 374 19.3%
(2) These data exclude women enrolled in Medicaid only for emergency delivery.
(3) Recommended total prenatal weight gain range by prepregnancy weight category is 28-40 lbs. for underweight women (BMI<18.5); 25-35 lbs. for normal weight women (BMI 18.5 to 24.9); 15-25 lbs. for overweight women (BMI 25 to 29.9); and 11-20 lbs. for obese women (BMI >=30.0): Adapted from the National Academy of Sciences. Weight Gain During Pregnancy: Reexamining the Guidelines. Washington, DC : National Academy Press, 2009.
(1) Item appears also on other WCH Section Agreement Addenda.

Onslow CountyATTACHMENT A: WIC QUALITY ASSURANCE DELIVERABLES
SFY 20102011 AGREEMENT ADDENDA DATA
Process Outcome Objectives
Percentage of pregnant women enrolled in Medicaid who received prenatal WIC Program services. (1) (2)
Percentage of pregnant women who participated in WIC and received WIC Program services during the first trimester of pregnancy.
Percentage of children less than 12 months of age who were served in the Child Health Clinic and received WIC Program services. (1)
Percentage of children 1 to 5 years of age who were served in the Child Health Clinic and received WIC Program Services. (1)
Percentage of children 1 to 5 years of age enrolled in Medicaid who received WIC Program Services.
Percentage of children less than 12 months of age enrolled in Medicaid who received WIC Program services.
Percentage of postpartum women who participated in WIC during pregnancy and were recertified for WIC by 6 weeks postpartum.
Percentage of women with live term singleton births who received WIC Program services during pregnancy and who gained recommended/excessive/inadequate weight according to the National Academy of Sciences ‐ Institute of Medicine 2009 recommended total weight gain ranges during pregnancy. (3)
Percentage of women who participated in WIC who initiated breastfeeding.
1C.
1A.
2A.
2B.
3A.
3B.
1B.
4B.
5A.
78.9% 74.0%
Num Den Percent
Percentage of children 2 to 4 years of age who received services from the health department and who, according to their Body Mass Index (BMI) for age and gender were:
4A.
Percentage of infants who participated in WIC who were: 5B.
75.8%
62.2%
37.9%
35.4%
82.9%
76.3%
73.6%
34.8%
46.0%
27.8%12.0%
76.9%
60.6%
32.8%
38.5%
85.3%
80.1%
72.2%
34.2%
51.3%
31.1%12.6%
74.0%
75.6%
55.1%
27.1%
41.7%
82.8%
77.1%
70.1%
32.4%
53.6%
32.0%12.9%
‐6.2%
‐0.3%
‐11.4%
‐28.6%
18.0%
‐0.1%
1.0%
‐4.7%
‐7.1%
16.6%
15.0%8.1%
593 817 72.6%
834 1,101 75.7%
2,443 4,238 57.6%
1,180 4,499 26.2%
950 2,288 41.5%
7 7 100.0%
50 64 78.1%
1,842 2,662 69.2%
560 33.3%1,683
1,724 3,150 54.7%
1,087 3,326 32.7%435 3,326 13.1%
48.5%16.7%
51.2%16.5%
5.6%‐1.4%
48.2%17.6%
834 49.6%289 17.2%
1,6831,683
At a healthy weight (BMI less than the 85th percentile but at or greater than the 5th percentile) (1)
a.
Overweight (BMI at or above the 85th percentile but less than the 95th percentile)
b.
Underweight (BMI less than the 5th percentile).
c.
Recommended prenatal weight gaina.
Excessive prenatal weight gainb.
Inadequate prenatal weight gainc.
Breastfeeding at 6 weeks of age (1)a.
Breastfeeding at 6 months of ageb.
13.1% 14.3% 15.5% 17.8% 421 2,662 15.8%
4.4% 3.9% 3.3% ‐25.5% 68 2,662 2.6%
2000 2008 Data
2002to
2003
2005to
2006
2008to
% Change from 2000
to 2008
Obese (BMI at or greater than the 95th percentile).
d.
8.9% 9.6% 11.1% 25.5% 331 2,662 12.4%
(2) These data exclude women enrolled in Medicaid only for emergency delivery.
(3) Recommended total prenatal weight gain range by prepregnancy weight category is 28-40 lbs. for underweight women (BMI<18.5); 25-35 lbs. for normal weight women (BMI 18.5 to 24.9); 15-25 lbs. for overweight women (BMI 25 to 29.9); and 11-20 lbs. for obese women (BMI >=30.0): Adapted from the National Academy of Sciences. Weight Gain During Pregnancy: Reexamining the Guidelines. Washington, DC : National Academy Press, 2009.
(1) Item appears also on other WCH Section Agreement Addenda.

Orange CountyATTACHMENT A: WIC QUALITY ASSURANCE DELIVERABLES
SFY 20102011 AGREEMENT ADDENDA DATA
Process Outcome Objectives
Percentage of pregnant women enrolled in Medicaid who received prenatal WIC Program services. (1) (2)
Percentage of pregnant women who participated in WIC and received WIC Program services during the first trimester of pregnancy.
Percentage of children less than 12 months of age who were served in the Child Health Clinic and received WIC Program services. (1)
Percentage of children 1 to 5 years of age who were served in the Child Health Clinic and received WIC Program Services. (1)
Percentage of children 1 to 5 years of age enrolled in Medicaid who received WIC Program Services.
Percentage of children less than 12 months of age enrolled in Medicaid who received WIC Program services.
Percentage of postpartum women who participated in WIC during pregnancy and were recertified for WIC by 6 weeks postpartum.
Percentage of women with live term singleton births who received WIC Program services during pregnancy and who gained recommended/excessive/inadequate weight according to the National Academy of Sciences ‐ Institute of Medicine 2009 recommended total weight gain ranges during pregnancy. (3)
Percentage of women who participated in WIC who initiated breastfeeding.
1C.
1A.
2A.
2B.
3A.
3B.
1B.
4B.
5A.
65.7% 55.6%
Num Den Percent
Percentage of children 2 to 4 years of age who received services from the health department and who, according to their Body Mass Index (BMI) for age and gender were:
4A.
Percentage of infants who participated in WIC who were: 5B.
62.7%
51.1%
32.2%
61.1%
81.4%
62.3%
61.9%
31.8%
61.6%
45.5%26.5%
62.6%
53.3%
28.3%
60.5%
83.7%
32.3%
59.3%
31.8%
61.3%
49.8%29.7%
67.1%
59.3%
52.7%
28.2%
61.0%
83.9%
50.3%
64.0%
27.5%
68.4%
52.4%32.6%
2.1%
‐5.4%
3.2%
‐12.6%
‐0.2%
3.1%
‐19.3%
3.3%
‐13.6%
11.0%
15.2%22.8%
233 345 67.5%
395 639 61.8%
1,336 2,463 54.2%
678 2,222 30.5%
833 1,357 61.4%
77 90 85.6%
76 144 52.8%
664 996 66.7%
101 30.0%337
1,074 1,623 66.2%
900 1,665 54.1%552 1,665 33.2%
47.7%20.5%
51.3%21.2%
7.5%3.7%
51.9%16.4%
158 46.9%78 23.1%
337337
At a healthy weight (BMI less than the 85th percentile but at or greater than the 5th percentile) (1)
a.
Overweight (BMI at or above the 85th percentile but less than the 95th percentile)
b.
Underweight (BMI less than the 5th percentile).
c.
Recommended prenatal weight gaina.
Excessive prenatal weight gainb.
Inadequate prenatal weight gainc.
Breastfeeding at 6 weeks of age (1)a.
Breastfeeding at 6 months of ageb.
18.2% 18.0% 16.9% ‐7.3% 134 996 13.5%
3.6% 3.6% 3.1% ‐14.3% 52 996 5.2%
2000 2008 Data
2002to
2003
2005to
2006
2008to
% Change from 2000
to 2008
Obese (BMI at or greater than the 95th percentile).
d.
16.3% 19.1% 16.1% ‐1.4% 146 996 14.7%
(2) These data exclude women enrolled in Medicaid only for emergency delivery.
(3) Recommended total prenatal weight gain range by prepregnancy weight category is 28-40 lbs. for underweight women (BMI<18.5); 25-35 lbs. for normal weight women (BMI 18.5 to 24.9); 15-25 lbs. for overweight women (BMI 25 to 29.9); and 11-20 lbs. for obese women (BMI >=30.0): Adapted from the National Academy of Sciences. Weight Gain During Pregnancy: Reexamining the Guidelines. Washington, DC : National Academy Press, 2009.
(1) Item appears also on other WCH Section Agreement Addenda.

Pamlico CountyATTACHMENT A: WIC QUALITY ASSURANCE DELIVERABLES
SFY 20102011 AGREEMENT ADDENDA DATA
Process Outcome Objectives
Percentage of pregnant women enrolled in Medicaid who received prenatal WIC Program services. (1) (2)
Percentage of pregnant women who participated in WIC and received WIC Program services during the first trimester of pregnancy.
Percentage of children less than 12 months of age who were served in the Child Health Clinic and received WIC Program services. (1)
Percentage of children 1 to 5 years of age who were served in the Child Health Clinic and received WIC Program Services. (1)
Percentage of children 1 to 5 years of age enrolled in Medicaid who received WIC Program Services.
Percentage of children less than 12 months of age enrolled in Medicaid who received WIC Program services.
Percentage of postpartum women who participated in WIC during pregnancy and were recertified for WIC by 6 weeks postpartum.
Percentage of women with live term singleton births who received WIC Program services during pregnancy and who gained recommended/excessive/inadequate weight according to the National Academy of Sciences ‐ Institute of Medicine 2009 recommended total weight gain ranges during pregnancy. (3)
Percentage of women who participated in WIC who initiated breastfeeding.
1C.
1A.
2A.
2B.
3A.
3B.
1B.
4B.
5A.
75.5% 81.5%
Num Den Percent
Percentage of children 2 to 4 years of age who received services from the health department and who, according to their Body Mass Index (BMI) for age and gender were:
4A.
Percentage of infants who participated in WIC who were: 5B.
73.8%
64.9%
51.5%
77.7%
90.6%
77.8%
63.7%
32.3%
53.2%
30.8%10.3%
78.7%
59.5%
54.2%
71.3%
76.9%
87.0%
59.7%
29.6%
58.6%
32.8%16.7%
85.6%
76.5%
59.6%
50.1%
73.9%
50.0%
80.7%
65.3%
28.4%
56.0%
45.3%30.2%
13.4%
3.6%
‐8.2%
‐2.6%
‐4.9%
‐44.8%
3.8%
2.6%
‐11.8%
5.1%
47.4%194.8%
68 71 95.8%
83 102 81.4%
229 356 64.3%
90 164 54.9%
63 89 70.8%
8 10 80.0%
90 133 67.7%
20 27.8%72
49 107 45.8%
46 121 38.0%24 121 19.8%
47.3%20.4%
50.0%21.6%
5.7%5.5%
52.8%17.6%
36 50.0%16 22.2%
7272
At a healthy weight (BMI less than the 85th percentile but at or greater than the 5th percentile) (1)
a.
Overweight (BMI at or above the 85th percentile but less than the 95th percentile)
b.
Underweight (BMI less than the 5th percentile).
c.
Recommended prenatal weight gaina.
Excessive prenatal weight gainb.
Inadequate prenatal weight gainc.
Breastfeeding at 6 weeks of age (1)a.
Breastfeeding at 6 months of ageb.
16.2% 20.2% 17.0% 4.8% 25 133 18.8%
4.4% 2.3% 2.8% ‐37.5% 5 133 3.8%
2000 2008 Data
2002to
2003
2005to
2006
2008to
% Change from 2000
to 2008
Obese (BMI at or greater than the 95th percentile).
d.
15.7% 17.8% 14.9% ‐5.0% 13 133 9.8%
(2) These data exclude women enrolled in Medicaid only for emergency delivery.
(3) Recommended total prenatal weight gain range by prepregnancy weight category is 28-40 lbs. for underweight women (BMI<18.5); 25-35 lbs. for normal weight women (BMI 18.5 to 24.9); 15-25 lbs. for overweight women (BMI 25 to 29.9); and 11-20 lbs. for obese women (BMI >=30.0): Adapted from the National Academy of Sciences. Weight Gain During Pregnancy: Reexamining the Guidelines. Washington, DC : National Academy Press, 2009.
(1) Item appears also on other WCH Section Agreement Addenda.

Pender CountyATTACHMENT A: WIC QUALITY ASSURANCE DELIVERABLES
SFY 20102011 AGREEMENT ADDENDA DATA
Process Outcome Objectives
Percentage of pregnant women enrolled in Medicaid who received prenatal WIC Program services. (1) (2)
Percentage of pregnant women who participated in WIC and received WIC Program services during the first trimester of pregnancy.
Percentage of children less than 12 months of age who were served in the Child Health Clinic and received WIC Program services. (1)
Percentage of children 1 to 5 years of age who were served in the Child Health Clinic and received WIC Program Services. (1)
Percentage of children 1 to 5 years of age enrolled in Medicaid who received WIC Program Services.
Percentage of children less than 12 months of age enrolled in Medicaid who received WIC Program services.
Percentage of postpartum women who participated in WIC during pregnancy and were recertified for WIC by 6 weeks postpartum.
Percentage of women with live term singleton births who received WIC Program services during pregnancy and who gained recommended/excessive/inadequate weight according to the National Academy of Sciences ‐ Institute of Medicine 2009 recommended total weight gain ranges during pregnancy. (3)
Percentage of women who participated in WIC who initiated breastfeeding.
1C.
1A.
2A.
2B.
3A.
3B.
1B.
4B.
5A.
75.9% 69.9%
Num Den Percent
Percentage of children 2 to 4 years of age who received services from the health department and who, according to their Body Mass Index (BMI) for age and gender were:
4A.
Percentage of infants who participated in WIC who were: 5B.
73.9%
62.0%
37.5%
70.0%
76.3%
78.4%
67.3%
32.0%
24.3%
12.2%3.7%
71.5%
57.6%
34.7%
73.8%
80.5%
78.7%
66.1%
31.4%
34.9%
16.5%5.8%
70.8%
76.2%
57.8%
32.0%
78.3%
82.5%
78.4%
60.1%
31.1%
46.3%
27.2%10.6%
‐6.6%
3.1%
‐6.8%
‐14.7%
11.8%
8.1%
0.0%
‐10.7%
‐2.7%
90.5%
123.8%190.7%
174 255 68.2%
332 418 79.4%
967 1,592 60.7%
198 588 33.7%
250 312 80.1%
231 294 78.6%
429 546 78.6%
362 616 58.8%
75 29.4%255
204 451 45.2%
127 439 28.9%57 439 13.0%
47.6%20.5%
48.3%20.6%
1.5%0.7%
45.4%23.2%
130 51.0%50 19.6%
255255
At a healthy weight (BMI less than the 85th percentile but at or greater than the 5th percentile) (1)
a.
Overweight (BMI at or above the 85th percentile but less than the 95th percentile)
b.
Underweight (BMI less than the 5th percentile).
c.
Recommended prenatal weight gaina.
Excessive prenatal weight gainb.
Inadequate prenatal weight gainc.
Breastfeeding at 6 weeks of age (1)a.
Breastfeeding at 6 months of ageb.
11.1% 13.0% 17.5% 58.3% 120 616 19.5%
9.6% 7.1% 2.7% ‐72.0% 13 616 2.1%
2000 2008 Data
2002to
2003
2005to
2006
2008to
% Change from 2000
to 2008
Obese (BMI at or greater than the 95th percentile).
d.
12.1% 13.8% 19.7% 63.3% 121 616 19.6%
(2) These data exclude women enrolled in Medicaid only for emergency delivery.
(3) Recommended total prenatal weight gain range by prepregnancy weight category is 28-40 lbs. for underweight women (BMI<18.5); 25-35 lbs. for normal weight women (BMI 18.5 to 24.9); 15-25 lbs. for overweight women (BMI 25 to 29.9); and 11-20 lbs. for obese women (BMI >=30.0): Adapted from the National Academy of Sciences. Weight Gain During Pregnancy: Reexamining the Guidelines. Washington, DC : National Academy Press, 2009.
(1) Item appears also on other WCH Section Agreement Addenda.

Person CountyATTACHMENT A: WIC QUALITY ASSURANCE DELIVERABLES
SFY 20102011 AGREEMENT ADDENDA DATA
Process Outcome Objectives
Percentage of pregnant women enrolled in Medicaid who received prenatal WIC Program services. (1) (2)
Percentage of pregnant women who participated in WIC and received WIC Program services during the first trimester of pregnancy.
Percentage of children less than 12 months of age who were served in the Child Health Clinic and received WIC Program services. (1)
Percentage of children 1 to 5 years of age who were served in the Child Health Clinic and received WIC Program Services. (1)
Percentage of children 1 to 5 years of age enrolled in Medicaid who received WIC Program Services.
Percentage of children less than 12 months of age enrolled in Medicaid who received WIC Program services.
Percentage of postpartum women who participated in WIC during pregnancy and were recertified for WIC by 6 weeks postpartum.
Percentage of women with live term singleton births who received WIC Program services during pregnancy and who gained recommended/excessive/inadequate weight according to the National Academy of Sciences ‐ Institute of Medicine 2009 recommended total weight gain ranges during pregnancy. (3)
Percentage of women who participated in WIC who initiated breastfeeding.
1C.
1A.
2A.
2B.
3A.
3B.
1B.
4B.
5A.
85.4% 79.9%
Num Den Percent
Percentage of children 2 to 4 years of age who received services from the health department and who, according to their Body Mass Index (BMI) for age and gender were:
4A.
Percentage of infants who participated in WIC who were: 5B.
79.4%
65.8%
48.2%
76.2%
89.2%
87.5%
67.3%
28.2%
35.1%
22.4%8.9%
74.4%
64.8%
38.9%
77.1%
91.4%
91.2%
68.3%
32.9%
35.6%
20.4%9.5%
83.2%
82.1%
62.4%
37.3%
71.5%
89.2%
90.2%
63.8%
33.6%
37.8%
22.4%9.8%
‐2.6%
3.4%
‐5.1%
‐22.6%
‐6.2%
0.0%
3.2%
‐5.2%
19.1%
7.9%
0.2%10.1%
212 250 84.8%
279 339 82.3%
760 1,168 65.1%
211 556 37.9%
213 306 69.6%
11 12 91.7%
61 66 92.4%
248 383 64.8%
89 35.6%250
141 384 36.7%
75 329 22.8%29 329 8.8%
50.4%21.4%
47.7%18.8%
‐5.5%‐12.2%
44.7%22.4%
113 45.2%48 19.2%
250250
At a healthy weight (BMI less than the 85th percentile but at or greater than the 5th percentile) (1)
a.
Overweight (BMI at or above the 85th percentile but less than the 95th percentile)
b.
Underweight (BMI less than the 5th percentile).
c.
Recommended prenatal weight gaina.
Excessive prenatal weight gainb.
Inadequate prenatal weight gainc.
Breastfeeding at 6 weeks of age (1)a.
Breastfeeding at 6 months of ageb.
15.9% 14.6% 16.9% 6.3% 62 383 16.2%
2.6% 2.7% 3.6% 38.6% 12 383 3.1%
2000 2008 Data
2002to
2003
2005to
2006
2008to
% Change from 2000
to 2008
Obese (BMI at or greater than the 95th percentile).
d.
14.3% 14.5% 15.8% 10.3% 61 383 15.9%
(2) These data exclude women enrolled in Medicaid only for emergency delivery.
(3) Recommended total prenatal weight gain range by prepregnancy weight category is 28-40 lbs. for underweight women (BMI<18.5); 25-35 lbs. for normal weight women (BMI 18.5 to 24.9); 15-25 lbs. for overweight women (BMI 25 to 29.9); and 11-20 lbs. for obese women (BMI >=30.0): Adapted from the National Academy of Sciences. Weight Gain During Pregnancy: Reexamining the Guidelines. Washington, DC : National Academy Press, 2009.
(1) Item appears also on other WCH Section Agreement Addenda.

Pitt CountyATTACHMENT A: WIC QUALITY ASSURANCE DELIVERABLES
SFY 20102011 AGREEMENT ADDENDA DATA
Process Outcome Objectives
Percentage of pregnant women enrolled in Medicaid who received prenatal WIC Program services. (1) (2)
Percentage of pregnant women who participated in WIC and received WIC Program services during the first trimester of pregnancy.
Percentage of children less than 12 months of age who were served in the Child Health Clinic and received WIC Program services. (1)
Percentage of children 1 to 5 years of age who were served in the Child Health Clinic and received WIC Program Services. (1)
Percentage of children 1 to 5 years of age enrolled in Medicaid who received WIC Program Services.
Percentage of children less than 12 months of age enrolled in Medicaid who received WIC Program services.
Percentage of postpartum women who participated in WIC during pregnancy and were recertified for WIC by 6 weeks postpartum.
Percentage of women with live term singleton births who received WIC Program services during pregnancy and who gained recommended/excessive/inadequate weight according to the National Academy of Sciences ‐ Institute of Medicine 2009 recommended total weight gain ranges during pregnancy. (3)
Percentage of women who participated in WIC who initiated breastfeeding.
1C.
1A.
2A.
2B.
3A.
3B.
1B.
4B.
5A.
79.1% 74.9%
Num Den Percent
Percentage of children 2 to 4 years of age who received services from the health department and who, according to their Body Mass Index (BMI) for age and gender were:
4A.
Percentage of infants who participated in WIC who were: 5B.
73.7%
61.8%
38.7%
81.5%
82.9%
89.9%
66.2%
33.0%
38.6%
21.4%11.2%
75.1%
60.2%
32.0%
81.5%
89.5%
87.6%
59.7%
31.4%
44.9%
23.7%10.9%
76.5%
76.3%
57.2%
30.6%
82.2%
100.0%
83.5%
64.7%
32.3%
48.6%
27.7%13.1%
‐3.3%
3.6%
‐7.5%
‐20.8%
0.8%
20.7%
‐7.2%
‐2.2%
‐2.3%
25.9%
29.5%16.7%
781 1,017 76.8%
1,113 1,465 76.0%
3,129 5,288 59.2%
848 2,672 31.7%
1,042 1,295 80.5%
20 25 80.0%
1,012 1,582 64.0%
339 33.6%1,009
812 1,647 49.3%
455 1,705 26.7%220 1,705 12.9%
43.2%23.8%
46.5%21.3%
7.5%‐10.5%
45.5%23.2%
477 47.3%193 19.1%
1,0091,009
At a healthy weight (BMI less than the 85th percentile but at or greater than the 5th percentile) (1)
a.
Overweight (BMI at or above the 85th percentile but less than the 95th percentile)
b.
Underweight (BMI less than the 5th percentile).
c.
Recommended prenatal weight gaina.
Excessive prenatal weight gainb.
Inadequate prenatal weight gainc.
Breastfeeding at 6 weeks of age (1)a.
Breastfeeding at 6 months of ageb.
15.6% 18.6% 17.0% 9.4% 286 1,582 18.1%
3.4% 2.5% 2.7% ‐21.9% 40 1,582 2.5%
2000 2008 Data
2002to
2003
2005to
2006
2008to
% Change from 2000
to 2008
Obese (BMI at or greater than the 95th percentile).
d.
14.9% 19.3% 15.6% 5.2% 244 1,582 15.4%
(2) These data exclude women enrolled in Medicaid only for emergency delivery.
(3) Recommended total prenatal weight gain range by prepregnancy weight category is 28-40 lbs. for underweight women (BMI<18.5); 25-35 lbs. for normal weight women (BMI 18.5 to 24.9); 15-25 lbs. for overweight women (BMI 25 to 29.9); and 11-20 lbs. for obese women (BMI >=30.0): Adapted from the National Academy of Sciences. Weight Gain During Pregnancy: Reexamining the Guidelines. Washington, DC : National Academy Press, 2009.
(1) Item appears also on other WCH Section Agreement Addenda.

Randolph CountyATTACHMENT A: WIC QUALITY ASSURANCE DELIVERABLES
SFY 20102011 AGREEMENT ADDENDA DATA
Process Outcome Objectives
Percentage of pregnant women enrolled in Medicaid who received prenatal WIC Program services. (1) (2)
Percentage of pregnant women who participated in WIC and received WIC Program services during the first trimester of pregnancy.
Percentage of children less than 12 months of age who were served in the Child Health Clinic and received WIC Program services. (1)
Percentage of children 1 to 5 years of age who were served in the Child Health Clinic and received WIC Program Services. (1)
Percentage of children 1 to 5 years of age enrolled in Medicaid who received WIC Program Services.
Percentage of children less than 12 months of age enrolled in Medicaid who received WIC Program services.
Percentage of postpartum women who participated in WIC during pregnancy and were recertified for WIC by 6 weeks postpartum.
Percentage of women with live term singleton births who received WIC Program services during pregnancy and who gained recommended/excessive/inadequate weight according to the National Academy of Sciences ‐ Institute of Medicine 2009 recommended total weight gain ranges during pregnancy. (3)
Percentage of women who participated in WIC who initiated breastfeeding.
1C.
1A.
2A.
2B.
3A.
3B.
1B.
4B.
5A.
68.2% 67.5%
Num Den Percent
Percentage of children 2 to 4 years of age who received services from the health department and who, according to their Body Mass Index (BMI) for age and gender were:
4A.
Percentage of infants who participated in WIC who were: 5B.
70.6%
55.4%
37.6%
69.7%
91.4%
81.8%
65.4%
30.4%
65.9%
29.8%12.5%
73.9%
53.6%
30.8%
61.2%
89.2%
81.7%
56.7%
29.9%
61.5%
32.8%16.2%
66.9%
75.6%
52.6%
28.6%
54.1%
85.7%
74.5%
62.9%
32.5%
58.9%
37.2%19.0%
‐1.9%
7.2%
‐5.2%
‐23.9%
‐22.3%
‐6.2%
‐9.0%
‐3.8%
6.9%
‐10.7%
24.8%52.8%
583 864 67.5%
1,069 1,369 78.1%
2,907 5,170 56.2%
514 1,765 29.1%
512 1,013 50.5%
6 7 85.7%
64 83 77.1%
900 1,384 65.0%
265 33.8%783
663 1,204 55.1%
495 1,366 36.2%259 1,366 19.0%
51.6%18.0%
49.9%17.5%
‐3.2%‐2.6%
53.2%17.0%
379 48.4%139 17.8%
783783
At a healthy weight (BMI less than the 85th percentile but at or greater than the 5th percentile) (1)
a.
Overweight (BMI at or above the 85th percentile but less than the 95th percentile)
b.
Underweight (BMI less than the 5th percentile).
c.
Recommended prenatal weight gaina.
Excessive prenatal weight gainb.
Inadequate prenatal weight gainc.
Breastfeeding at 6 weeks of age (1)a.
Breastfeeding at 6 months of ageb.
15.5% 18.5% 17.1% 10.3% 215 1,384 15.5%
4.0% 2.4% 2.8% ‐30.6% 42 1,384 3.0%
2000 2008 Data
2002to
2003
2005to
2006
2008to
% Change from 2000
to 2008
Obese (BMI at or greater than the 95th percentile).
d.
15.1% 22.4% 17.3% 14.1% 227 1,384 16.4%
(2) These data exclude women enrolled in Medicaid only for emergency delivery.
(3) Recommended total prenatal weight gain range by prepregnancy weight category is 28-40 lbs. for underweight women (BMI<18.5); 25-35 lbs. for normal weight women (BMI 18.5 to 24.9); 15-25 lbs. for overweight women (BMI 25 to 29.9); and 11-20 lbs. for obese women (BMI >=30.0): Adapted from the National Academy of Sciences. Weight Gain During Pregnancy: Reexamining the Guidelines. Washington, DC : National Academy Press, 2009.
(1) Item appears also on other WCH Section Agreement Addenda.

Richmond CountyATTACHMENT A: WIC QUALITY ASSURANCE DELIVERABLES
SFY 20102011 AGREEMENT ADDENDA DATA
Process Outcome Objectives
Percentage of pregnant women enrolled in Medicaid who received prenatal WIC Program services. (1) (2)
Percentage of pregnant women who participated in WIC and received WIC Program services during the first trimester of pregnancy.
Percentage of children less than 12 months of age who were served in the Child Health Clinic and received WIC Program services. (1)
Percentage of children 1 to 5 years of age who were served in the Child Health Clinic and received WIC Program Services. (1)
Percentage of children 1 to 5 years of age enrolled in Medicaid who received WIC Program Services.
Percentage of children less than 12 months of age enrolled in Medicaid who received WIC Program services.
Percentage of postpartum women who participated in WIC during pregnancy and were recertified for WIC by 6 weeks postpartum.
Percentage of women with live term singleton births who received WIC Program services during pregnancy and who gained recommended/excessive/inadequate weight according to the National Academy of Sciences ‐ Institute of Medicine 2009 recommended total weight gain ranges during pregnancy. (3)
Percentage of women who participated in WIC who initiated breastfeeding.
1C.
1A.
2A.
2B.
3A.
3B.
1B.
4B.
5A.
78.9% 79.7%
Num Den Percent
Percentage of children 2 to 4 years of age who received services from the health department and who, according to their Body Mass Index (BMI) for age and gender were:
4A.
Percentage of infants who participated in WIC who were: 5B.
83.8%
75.0%
43.3%
80.8%
100.0%
88.5%
68.6%
24.8%
36.1%
17.0%8.7%
83.4%
72.1%
34.3%
75.9%
68.9%
30.5%
41.7%
21.4%10.1%
78.2%
82.1%
67.2%
31.6%
71.5%
67.6%
27.7%
29.2%
19.0%8.9%
‐0.9%
‐2.1%
‐10.4%
‐27.0%
‐11.4%
‐1.5%
11.7%
‐19.0%
12.1%2.6%
344 438 78.5%
485 596 81.4%
1,523 2,179 69.9%
351 1,057 33.2%
372 504 73.8%
525 768 68.4%
106 26.5%400
171 649 26.3%
124 647 19.2%61 647 9.4%
55.6%19.6%
49.1%23.2%
‐11.7%18.5%
49.0%20.5%
188 47.0%106 26.5%
400400
At a healthy weight (BMI less than the 85th percentile but at or greater than the 5th percentile) (1)
a.
Overweight (BMI at or above the 85th percentile but less than the 95th percentile)
b.
Underweight (BMI less than the 5th percentile).
c.
Recommended prenatal weight gaina.
Excessive prenatal weight gainb.
Inadequate prenatal weight gainc.
Breastfeeding at 6 weeks of age (1)a.
Breastfeeding at 6 months of ageb.
8.7% 8.4% 10.9% 24.1% 93 768 12.1%
14.1% 14.6% 10.7% ‐23.9% 81 768 10.5%
2000 2008 Data
2002to
2003
2005to
2006
2008to
% Change from 2000
to 2008
Obese (BMI at or greater than the 95th percentile).
d.
8.5% 8.1% 10.9% 27.3% 69 768 9.0%
(2) These data exclude women enrolled in Medicaid only for emergency delivery.
(3) Recommended total prenatal weight gain range by prepregnancy weight category is 28-40 lbs. for underweight women (BMI<18.5); 25-35 lbs. for normal weight women (BMI 18.5 to 24.9); 15-25 lbs. for overweight women (BMI 25 to 29.9); and 11-20 lbs. for obese women (BMI >=30.0): Adapted from the National Academy of Sciences. Weight Gain During Pregnancy: Reexamining the Guidelines. Washington, DC : National Academy Press, 2009.
(1) Item appears also on other WCH Section Agreement Addenda.

Robeson CountyATTACHMENT A: WIC QUALITY ASSURANCE DELIVERABLES
SFY 20102011 AGREEMENT ADDENDA DATA
Process Outcome Objectives
Percentage of pregnant women enrolled in Medicaid who received prenatal WIC Program services. (1) (2)
Percentage of pregnant women who participated in WIC and received WIC Program services during the first trimester of pregnancy.
Percentage of children less than 12 months of age who were served in the Child Health Clinic and received WIC Program services. (1)
Percentage of children 1 to 5 years of age who were served in the Child Health Clinic and received WIC Program Services. (1)
Percentage of children 1 to 5 years of age enrolled in Medicaid who received WIC Program Services.
Percentage of children less than 12 months of age enrolled in Medicaid who received WIC Program services.
Percentage of postpartum women who participated in WIC during pregnancy and were recertified for WIC by 6 weeks postpartum.
Percentage of women with live term singleton births who received WIC Program services during pregnancy and who gained recommended/excessive/inadequate weight according to the National Academy of Sciences ‐ Institute of Medicine 2009 recommended total weight gain ranges during pregnancy. (3)
Percentage of women who participated in WIC who initiated breastfeeding.
1C.
1A.
2A.
2B.
3A.
3B.
1B.
4B.
5A.
75.8% 72.8%
Num Den Percent
Percentage of children 2 to 4 years of age who received services from the health department and who, according to their Body Mass Index (BMI) for age and gender were:
4A.
Percentage of infants who participated in WIC who were: 5B.
76.4%
55.1%
33.4%
82.1%
90.1%
88.3%
70.5%
29.8%
33.7%
17.5%8.2%
76.3%
52.7%
31.3%
81.3%
89.8%
89.1%
66.4%
31.7%
35.6%
19.2%9.6%
74.6%
75.7%
47.9%
20.8%
83.0%
88.5%
84.4%
65.1%
30.1%
36.5%
20.1%10.5%
‐1.6%
‐0.9%
‐13.0%
‐37.7%
1.2%
‐1.9%
‐4.4%
‐7.8%
0.9%
8.3%
14.8%27.8%
1,096 1,438 76.2%
1,573 2,039 77.1%
3,482 7,125 48.9%
418 2,210 18.9%
1,185 1,422 83.3%
222 250 88.8%
581 694 83.7%
1,111 1,749 63.5%
364 29.5%1,234
722 1,884 38.3%
404 1,908 21.2%240 1,908 12.6%
43.3%26.8%
42.5%27.4%
‐1.9%2.0%
41.5%26.8%
538 43.6%332 26.9%
1,2341,234
At a healthy weight (BMI less than the 85th percentile but at or greater than the 5th percentile) (1)
a.
Overweight (BMI at or above the 85th percentile but less than the 95th percentile)
b.
Underweight (BMI less than the 5th percentile).
c.
Recommended prenatal weight gaina.
Excessive prenatal weight gainb.
Inadequate prenatal weight gainc.
Breastfeeding at 6 weeks of age (1)a.
Breastfeeding at 6 months of ageb.
12.1% 13.8% 15.1% 24.9% 294 1,749 16.8%
6.9% 6.8% 4.5% ‐34.3% 43 1,749 2.5%
2000 2008 Data
2002to
2003
2005to
2006
2008to
% Change from 2000
to 2008
Obese (BMI at or greater than the 95th percentile).
d.
10.5% 13.0% 15.4% 45.6% 301 1,749 17.2%
(2) These data exclude women enrolled in Medicaid only for emergency delivery.
(3) Recommended total prenatal weight gain range by prepregnancy weight category is 28-40 lbs. for underweight women (BMI<18.5); 25-35 lbs. for normal weight women (BMI 18.5 to 24.9); 15-25 lbs. for overweight women (BMI 25 to 29.9); and 11-20 lbs. for obese women (BMI >=30.0): Adapted from the National Academy of Sciences. Weight Gain During Pregnancy: Reexamining the Guidelines. Washington, DC : National Academy Press, 2009.
(1) Item appears also on other WCH Section Agreement Addenda.

Rockingham CountyATTACHMENT A: WIC QUALITY ASSURANCE DELIVERABLES
SFY 20102011 AGREEMENT ADDENDA DATA
Process Outcome Objectives
Percentage of pregnant women enrolled in Medicaid who received prenatal WIC Program services. (1) (2)
Percentage of pregnant women who participated in WIC and received WIC Program services during the first trimester of pregnancy.
Percentage of children less than 12 months of age who were served in the Child Health Clinic and received WIC Program services. (1)
Percentage of children 1 to 5 years of age who were served in the Child Health Clinic and received WIC Program Services. (1)
Percentage of children 1 to 5 years of age enrolled in Medicaid who received WIC Program Services.
Percentage of children less than 12 months of age enrolled in Medicaid who received WIC Program services.
Percentage of postpartum women who participated in WIC during pregnancy and were recertified for WIC by 6 weeks postpartum.
Percentage of women with live term singleton births who received WIC Program services during pregnancy and who gained recommended/excessive/inadequate weight according to the National Academy of Sciences ‐ Institute of Medicine 2009 recommended total weight gain ranges during pregnancy. (3)
Percentage of women who participated in WIC who initiated breastfeeding.
1C.
1A.
2A.
2B.
3A.
3B.
1B.
4B.
5A.
73.5% 77.6%
Num Den Percent
Percentage of children 2 to 4 years of age who received services from the health department and who, according to their Body Mass Index (BMI) for age and gender were:
4A.
Percentage of infants who participated in WIC who were: 5B.
75.9%
55.5%
34.6%
74.3%
80.3%
47.7%
70.5%
32.4%
36.9%
20.0%9.6%
76.6%
55.7%
33.3%
76.3%
79.8%
52.8%
70.6%
30.6%
40.0%
24.7%12.8%
77.7%
75.9%
54.1%
36.2%
73.9%
89.7%
59.3%
65.3%
31.9%
43.1%
26.8%13.2%
5.6%
0.0%
‐2.5%
4.7%
‐0.5%
11.7%
24.5%
‐7.3%
‐1.7%
16.7%
34.1%36.9%
429 545 78.7%
618 775 79.7%
1,794 3,030 59.2%
528 1,432 36.9%
520 673 77.3%
85 91 93.4%
210 311 67.5%
574 882 65.1%
82 31.8%258
355 830 42.8%
218 823 26.5%112 823 13.6%
46.8%20.8%
50.3%17.8%
7.4%‐14.0%
46.6%22.8%
139 53.9%37 14.3%
258258
At a healthy weight (BMI less than the 85th percentile but at or greater than the 5th percentile) (1)
a.
Overweight (BMI at or above the 85th percentile but less than the 95th percentile)
b.
Underweight (BMI less than the 5th percentile).
c.
Recommended prenatal weight gaina.
Excessive prenatal weight gainb.
Inadequate prenatal weight gainc.
Breastfeeding at 6 weeks of age (1)a.
Breastfeeding at 6 months of ageb.
11.1% 11.0% 16.4% 48.6% 135 882 15.3%
5.8% 7.0% 2.2% ‐61.3% 18 882 2.0%
2000 2008 Data
2002to
2003
2005to
2006
2008to
% Change from 2000
to 2008
Obese (BMI at or greater than the 95th percentile).
d.
12.7% 11.5% 16.0% 26.4% 155 882 17.6%
(2) These data exclude women enrolled in Medicaid only for emergency delivery.
(3) Recommended total prenatal weight gain range by prepregnancy weight category is 28-40 lbs. for underweight women (BMI<18.5); 25-35 lbs. for normal weight women (BMI 18.5 to 24.9); 15-25 lbs. for overweight women (BMI 25 to 29.9); and 11-20 lbs. for obese women (BMI >=30.0): Adapted from the National Academy of Sciences. Weight Gain During Pregnancy: Reexamining the Guidelines. Washington, DC : National Academy Press, 2009.
(1) Item appears also on other WCH Section Agreement Addenda.

Rowan CountyATTACHMENT A: WIC QUALITY ASSURANCE DELIVERABLES
SFY 20102011 AGREEMENT ADDENDA DATA
Process Outcome Objectives
Percentage of pregnant women enrolled in Medicaid who received prenatal WIC Program services. (1) (2)
Percentage of pregnant women who participated in WIC and received WIC Program services during the first trimester of pregnancy.
Percentage of children less than 12 months of age who were served in the Child Health Clinic and received WIC Program services. (1)
Percentage of children 1 to 5 years of age who were served in the Child Health Clinic and received WIC Program Services. (1)
Percentage of children 1 to 5 years of age enrolled in Medicaid who received WIC Program Services.
Percentage of children less than 12 months of age enrolled in Medicaid who received WIC Program services.
Percentage of postpartum women who participated in WIC during pregnancy and were recertified for WIC by 6 weeks postpartum.
Percentage of women with live term singleton births who received WIC Program services during pregnancy and who gained recommended/excessive/inadequate weight according to the National Academy of Sciences ‐ Institute of Medicine 2009 recommended total weight gain ranges during pregnancy. (3)
Percentage of women who participated in WIC who initiated breastfeeding.
1C.
1A.
2A.
2B.
3A.
3B.
1B.
4B.
5A.
73.7% 74.6%
Num Den Percent
Percentage of children 2 to 4 years of age who received services from the health department and who, according to their Body Mass Index (BMI) for age and gender were:
4A.
Percentage of infants who participated in WIC who were: 5B.
73.4%
55.6%
39.7%
76.1%
82.0%
80.1%
66.1%
31.9%
44.2%
27.9%11.9%
72.8%
56.8%
34.5%
75.8%
70.8%
75.0%
64.1%
31.4%
47.8%
29.9%13.1%
70.8%
72.1%
54.3%
20.6%
80.4%
63.2%
68.9%
65.4%
31.7%
50.7%
29.9%12.2%
‐3.9%
‐1.8%
‐2.4%
‐48.1%
5.6%
‐23.0%
‐14.0%
‐1.0%
‐0.6%
14.5%
7.3%2.2%
620 875 70.9%
992 1,350 73.5%
2,789 4,899 56.9%
208 1,364 15.2%
732 921 79.5%
4 7 57.1%
45 66 68.2%
881 1,281 68.8%
282 31.8%886
601 1,245 48.3%
378 1,256 30.1%168 1,256 13.4%
45.8%22.4%
45.6%22.7%
‐0.3%1.4%
46.2%22.4%
409 46.2%195 22.0%
886886
At a healthy weight (BMI less than the 85th percentile but at or greater than the 5th percentile) (1)
a.
Overweight (BMI at or above the 85th percentile but less than the 95th percentile)
b.
Underweight (BMI less than the 5th percentile).
c.
Recommended prenatal weight gaina.
Excessive prenatal weight gainb.
Inadequate prenatal weight gainc.
Breastfeeding at 6 weeks of age (1)a.
Breastfeeding at 6 months of ageb.
15.4% 17.6% 16.1% 4.8% 187 1,281 14.6%
4.3% 2.3% 3.8% ‐11.5% 59 1,281 4.6%
2000 2008 Data
2002to
2003
2005to
2006
2008to
% Change from 2000
to 2008
Obese (BMI at or greater than the 95th percentile).
d.
14.3% 16.0% 14.7% 2.8% 154 1,281 12.0%
(2) These data exclude women enrolled in Medicaid only for emergency delivery.
(3) Recommended total prenatal weight gain range by prepregnancy weight category is 28-40 lbs. for underweight women (BMI<18.5); 25-35 lbs. for normal weight women (BMI 18.5 to 24.9); 15-25 lbs. for overweight women (BMI 25 to 29.9); and 11-20 lbs. for obese women (BMI >=30.0): Adapted from the National Academy of Sciences. Weight Gain During Pregnancy: Reexamining the Guidelines. Washington, DC : National Academy Press, 2009.
(1) Item appears also on other WCH Section Agreement Addenda.

RutherfordPolkMcDowell DistrictATTACHMENT A: WIC QUALITY ASSURANCE DELIVERABLES
SFY 20102011 AGREEMENT ADDENDA DATA
Process Outcome Objectives
Percentage of pregnant women enrolled in Medicaid who received prenatal WIC Program services. (1) (2)
Percentage of pregnant women who participated in WIC and received WIC Program services during the first trimester of pregnancy.
Percentage of children less than 12 months of age who were served in the Child Health Clinic and received WIC Program services. (1)
Percentage of children 1 to 5 years of age who were served in the Child Health Clinic and received WIC Program Services. (1)
Percentage of children 1 to 5 years of age enrolled in Medicaid who received WIC Program Services.
Percentage of children less than 12 months of age enrolled in Medicaid who received WIC Program services.
Percentage of postpartum women who participated in WIC during pregnancy and were recertified for WIC by 6 weeks postpartum.
Percentage of women with live term singleton births who received WIC Program services during pregnancy and who gained recommended/excessive/inadequate weight according to the National Academy of Sciences ‐ Institute of Medicine 2009 recommended total weight gain ranges during pregnancy. (3)
Percentage of women who participated in WIC who initiated breastfeeding.
1C.
1A.
2A.
2B.
3A.
3B.
1B.
4B.
5A.
76.1% 66.8%
Num Den Percent
Percentage of children 2 to 4 years of age who received services from the health department and who, according to their Body Mass Index (BMI) for age and gender were:
4A.
Percentage of infants who participated in WIC who were: 5B.
75.8%
64.1%
32.8%
74.6%
97.5%
94.3%
69.3%
31.8%
40.4%
25.4%11.5%
74.9%
61.9%
32.5%
69.9%
91.4%
91.4%
67.9%
33.4%
46.4%
28.1%14.7%
66.7%
76.7%
60.3%
35.2%
72.4%
95.0%
90.7%
67.3%
29.5%
54.4%
31.1%14.5%
‐12.3%
1.2%
‐5.9%
7.5%
‐3.0%
‐2.6%
‐3.9%
‐2.9%
‐7.2%
34.8%
22.7%26.4%
611 817 74.8%
859 1,105 77.7%
2,700 4,289 63.0%
843 2,282 36.9%
796 1,087 73.2%
35 35 100.0%
320 352 90.9%
1,060 1,554 68.2%
210 28.2%744
697 1,258 55.4%
360 1,196 30.1%163 1,196 13.6%
40.6%27.6%
40.5%30.0%
‐0.2%8.6%
37.4%29.2%
345 46.4%189 25.4%
744744
At a healthy weight (BMI less than the 85th percentile but at or greater than the 5th percentile) (1)
a.
Overweight (BMI at or above the 85th percentile but less than the 95th percentile)
b.
Underweight (BMI less than the 5th percentile).
c.
Recommended prenatal weight gaina.
Excessive prenatal weight gainb.
Inadequate prenatal weight gainc.
Breastfeeding at 6 weeks of age (1)a.
Breastfeeding at 6 months of ageb.
14.4% 14.9% 15.6% 8.2% 252 1,554 16.2%
4.1% 4.2% 3.7% ‐8.8% 45 1,554 2.9%
2000 2008 Data
2002to
2003
2005to
2006
2008to
% Change from 2000
to 2008
Obese (BMI at or greater than the 95th percentile).
d.
12.2% 12.9% 13.4% 9.7% 197 1,554 12.7%
(2) These data exclude women enrolled in Medicaid only for emergency delivery.
(3) Recommended total prenatal weight gain range by prepregnancy weight category is 28-40 lbs. for underweight women (BMI<18.5); 25-35 lbs. for normal weight women (BMI 18.5 to 24.9); 15-25 lbs. for overweight women (BMI 25 to 29.9); and 11-20 lbs. for obese women (BMI >=30.0): Adapted from the National Academy of Sciences. Weight Gain During Pregnancy: Reexamining the Guidelines. Washington, DC : National Academy Press, 2009.
(1) Item appears also on other WCH Section Agreement Addenda.

Sampson CountyATTACHMENT A: WIC QUALITY ASSURANCE DELIVERABLES
SFY 20102011 AGREEMENT ADDENDA DATA
Process Outcome Objectives
Percentage of pregnant women enrolled in Medicaid who received prenatal WIC Program services. (1) (2)
Percentage of pregnant women who participated in WIC and received WIC Program services during the first trimester of pregnancy.
Percentage of children less than 12 months of age who were served in the Child Health Clinic and received WIC Program services. (1)
Percentage of children 1 to 5 years of age who were served in the Child Health Clinic and received WIC Program Services. (1)
Percentage of children 1 to 5 years of age enrolled in Medicaid who received WIC Program Services.
Percentage of children less than 12 months of age enrolled in Medicaid who received WIC Program services.
Percentage of postpartum women who participated in WIC during pregnancy and were recertified for WIC by 6 weeks postpartum.
Percentage of women with live term singleton births who received WIC Program services during pregnancy and who gained recommended/excessive/inadequate weight according to the National Academy of Sciences ‐ Institute of Medicine 2009 recommended total weight gain ranges during pregnancy. (3)
Percentage of women who participated in WIC who initiated breastfeeding.
1C.
1A.
2A.
2B.
3A.
3B.
1B.
4B.
5A.
77.0% 76.3%
Num Den Percent
Percentage of children 2 to 4 years of age who received services from the health department and who, according to their Body Mass Index (BMI) for age and gender were:
4A.
Percentage of infants who participated in WIC who were: 5B.
75.0%
58.5%
45.8%
69.6%
100.0%
77.7%
58.5%
30.5%
32.7%
20.2%10.3%
74.9%
56.0%
41.5%
71.9%
92.3%
80.0%
61.1%
31.9%
26.3%
16.1%6.8%
77.7%
77.7%
55.8%
34.8%
77.8%
72.2%
84.0%
54.3%
31.0%
30.4%
19.5%12.2%
0.9%
3.7%
‐4.5%
‐23.9%
11.7%
‐27.8%
8.1%
‐7.2%
1.7%
‐7.0%
‐3.7%19.3%
353 442 79.9%
624 816 76.5%
1,839 3,194 57.6%
301 1,011 29.8%
452 563 80.3%
6 7 85.7%
104 120 86.7%
556 1,092 50.9%
161 33.5%480
230 698 33.0%
136 669 20.3%82 669 12.3%
47.7%21.7%
49.5%19.4%
3.8%‐10.7%
48.3%19.8%
235 49.0%84 17.5%
480480
At a healthy weight (BMI less than the 85th percentile but at or greater than the 5th percentile) (1)
a.
Overweight (BMI at or above the 85th percentile but less than the 95th percentile)
b.
Underweight (BMI less than the 5th percentile).
c.
Recommended prenatal weight gaina.
Excessive prenatal weight gainb.
Inadequate prenatal weight gainc.
Breastfeeding at 6 weeks of age (1)a.
Breastfeeding at 6 months of ageb.
18.3% 15.2% 19.4% 6.0% 225 1,092 20.6%
4.4% 6.2% 2.5% ‐44.8% 29 1,092 2.7%
2000 2008 Data
2002to
2003
2005to
2006
2008to
% Change from 2000
to 2008
Obese (BMI at or greater than the 95th percentile).
d.
18.7% 17.6% 23.8% 27.5% 282 1,092 25.8%
(2) These data exclude women enrolled in Medicaid only for emergency delivery.
(3) Recommended total prenatal weight gain range by prepregnancy weight category is 28-40 lbs. for underweight women (BMI<18.5); 25-35 lbs. for normal weight women (BMI 18.5 to 24.9); 15-25 lbs. for overweight women (BMI 25 to 29.9); and 11-20 lbs. for obese women (BMI >=30.0): Adapted from the National Academy of Sciences. Weight Gain During Pregnancy: Reexamining the Guidelines. Washington, DC : National Academy Press, 2009.
(1) Item appears also on other WCH Section Agreement Addenda.

Scotland CountyATTACHMENT A: WIC QUALITY ASSURANCE DELIVERABLES
SFY 20102011 AGREEMENT ADDENDA DATA
Process Outcome Objectives
Percentage of pregnant women enrolled in Medicaid who received prenatal WIC Program services. (1) (2)
Percentage of pregnant women who participated in WIC and received WIC Program services during the first trimester of pregnancy.
Percentage of children less than 12 months of age who were served in the Child Health Clinic and received WIC Program services. (1)
Percentage of children 1 to 5 years of age who were served in the Child Health Clinic and received WIC Program Services. (1)
Percentage of children 1 to 5 years of age enrolled in Medicaid who received WIC Program Services.
Percentage of children less than 12 months of age enrolled in Medicaid who received WIC Program services.
Percentage of postpartum women who participated in WIC during pregnancy and were recertified for WIC by 6 weeks postpartum.
Percentage of women with live term singleton births who received WIC Program services during pregnancy and who gained recommended/excessive/inadequate weight according to the National Academy of Sciences ‐ Institute of Medicine 2009 recommended total weight gain ranges during pregnancy. (3)
Percentage of women who participated in WIC who initiated breastfeeding.
1C.
1A.
2A.
2B.
3A.
3B.
1B.
4B.
5A.
85.9% 86.0%
Num Den Percent
Percentage of children 2 to 4 years of age who received services from the health department and who, according to their Body Mass Index (BMI) for age and gender were:
4A.
Percentage of infants who participated in WIC who were: 5B.
82.5%
69.0%
58.7%
78.4%
100.0%
90.1%
66.6%
26.5%
28.9%
11.6%6.1%
80.9%
65.7%
55.0%
80.2%
66.7%
76.9%
67.0%
29.1%
35.0%
11.2%3.8%
84.5%
81.4%
61.1%
50.9%
79.6%
68.1%
27.4%
25.8%
9.4%2.4%
‐1.6%
‐1.4%
‐11.4%
‐13.4%
1.5%
2.3%
3.5%
‐10.7%
‐19.0%‐60.1%
331 399 83.0%
407 492 82.7%
1,145 1,794 63.8%
374 772 48.4%
369 462 79.9%
372 556 66.9%
77 27.0%285
127 552 23.0%
41 542 7.6%12 542 2.2%
49.8%23.7%
46.6%26.1%
‐6.5%9.8%
46.9%24.0%
129 45.3%79 27.7%
285285
At a healthy weight (BMI less than the 85th percentile but at or greater than the 5th percentile) (1)
a.
Overweight (BMI at or above the 85th percentile but less than the 95th percentile)
b.
Underweight (BMI less than the 5th percentile).
c.
Recommended prenatal weight gaina.
Excessive prenatal weight gainb.
Inadequate prenatal weight gainc.
Breastfeeding at 6 weeks of age (1)a.
Breastfeeding at 6 months of ageb.
16.5% 14.3% 14.8% ‐10.2% 94 556 16.9%
3.4% 5.2% 4.5% 32.8% 19 556 3.4%
2000 2008 Data
2002to
2003
2005to
2006
2008to
% Change from 2000
to 2008
Obese (BMI at or greater than the 95th percentile).
d.
13.6% 13.5% 12.6% ‐7.1% 71 556 12.8%
(2) These data exclude women enrolled in Medicaid only for emergency delivery.
(3) Recommended total prenatal weight gain range by prepregnancy weight category is 28-40 lbs. for underweight women (BMI<18.5); 25-35 lbs. for normal weight women (BMI 18.5 to 24.9); 15-25 lbs. for overweight women (BMI 25 to 29.9); and 11-20 lbs. for obese women (BMI >=30.0): Adapted from the National Academy of Sciences. Weight Gain During Pregnancy: Reexamining the Guidelines. Washington, DC : National Academy Press, 2009.
(1) Item appears also on other WCH Section Agreement Addenda.

Stanly CountyATTACHMENT A: WIC QUALITY ASSURANCE DELIVERABLES
SFY 20102011 AGREEMENT ADDENDA DATA
Process Outcome Objectives
Percentage of pregnant women enrolled in Medicaid who received prenatal WIC Program services. (1) (2)
Percentage of pregnant women who participated in WIC and received WIC Program services during the first trimester of pregnancy.
Percentage of children less than 12 months of age who were served in the Child Health Clinic and received WIC Program services. (1)
Percentage of children 1 to 5 years of age who were served in the Child Health Clinic and received WIC Program Services. (1)
Percentage of children 1 to 5 years of age enrolled in Medicaid who received WIC Program Services.
Percentage of children less than 12 months of age enrolled in Medicaid who received WIC Program services.
Percentage of postpartum women who participated in WIC during pregnancy and were recertified for WIC by 6 weeks postpartum.
Percentage of women with live term singleton births who received WIC Program services during pregnancy and who gained recommended/excessive/inadequate weight according to the National Academy of Sciences ‐ Institute of Medicine 2009 recommended total weight gain ranges during pregnancy. (3)
Percentage of women who participated in WIC who initiated breastfeeding.
1C.
1A.
2A.
2B.
3A.
3B.
1B.
4B.
5A.
78.2% 74.8%
Num Den Percent
Percentage of children 2 to 4 years of age who received services from the health department and who, according to their Body Mass Index (BMI) for age and gender were:
4A.
Percentage of infants who participated in WIC who were: 5B.
78.5%
59.8%
39.3%
86.4%
100.0%
73.8%
74.1%
30.7%
62.6%
11.4%3.7%
79.2%
59.7%
38.2%
69.4%
100.0%
82.9%
69.7%
33.0%
65.7%
15.6%5.8%
79.4%
73.8%
54.2%
40.2%
45.5%
88.9%
85.6%
70.2%
28.6%
64.2%
18.2%9.5%
1.6%
‐5.9%
‐9.3%
2.3%
‐47.3%
‐11.1%
15.9%
‐5.2%
‐6.9%
2.5%
59.9%157.6%
313 388 80.7%
370 505 73.3%
1,029 1,812 56.8%
315 771 40.9%
150 466 32.2%
3 4 75.0%
29 30 96.7%
327 487 67.1%
100 27.0%370
368 557 66.1%
108 538 20.1%59 538 11.0%
43.6%25.7%
44.1%27.3%
1.1%6.3%
40.1%26.9%
169 45.7%101 27.3%
370370
At a healthy weight (BMI less than the 85th percentile but at or greater than the 5th percentile) (1)
a.
Overweight (BMI at or above the 85th percentile but less than the 95th percentile)
b.
Underweight (BMI less than the 5th percentile).
c.
Recommended prenatal weight gaina.
Excessive prenatal weight gainb.
Inadequate prenatal weight gainc.
Breastfeeding at 6 weeks of age (1)a.
Breastfeeding at 6 months of ageb.
7.9% 12.7% 12.4% 56.2% 72 487 14.8%
11.1% 4.7% 6.2% ‐44.0% 12 487 2.5%
2000 2008 Data
2002to
2003
2005to
2006
2008to
% Change from 2000
to 2008
Obese (BMI at or greater than the 95th percentile).
d.
6.9% 12.8% 11.2% 61.7% 76 487 15.6%
(2) These data exclude women enrolled in Medicaid only for emergency delivery.
(3) Recommended total prenatal weight gain range by prepregnancy weight category is 28-40 lbs. for underweight women (BMI<18.5); 25-35 lbs. for normal weight women (BMI 18.5 to 24.9); 15-25 lbs. for overweight women (BMI 25 to 29.9); and 11-20 lbs. for obese women (BMI >=30.0): Adapted from the National Academy of Sciences. Weight Gain During Pregnancy: Reexamining the Guidelines. Washington, DC : National Academy Press, 2009.
(1) Item appears also on other WCH Section Agreement Addenda.

Stokes CountyATTACHMENT A: WIC QUALITY ASSURANCE DELIVERABLES
SFY 20102011 AGREEMENT ADDENDA DATA
Process Outcome Objectives
Percentage of pregnant women enrolled in Medicaid who received prenatal WIC Program services. (1) (2)
Percentage of pregnant women who participated in WIC and received WIC Program services during the first trimester of pregnancy.
Percentage of children less than 12 months of age who were served in the Child Health Clinic and received WIC Program services. (1)
Percentage of children 1 to 5 years of age who were served in the Child Health Clinic and received WIC Program Services. (1)
Percentage of children 1 to 5 years of age enrolled in Medicaid who received WIC Program Services.
Percentage of children less than 12 months of age enrolled in Medicaid who received WIC Program services.
Percentage of postpartum women who participated in WIC during pregnancy and were recertified for WIC by 6 weeks postpartum.
Percentage of women with live term singleton births who received WIC Program services during pregnancy and who gained recommended/excessive/inadequate weight according to the National Academy of Sciences ‐ Institute of Medicine 2009 recommended total weight gain ranges during pregnancy. (3)
Percentage of women who participated in WIC who initiated breastfeeding.
1C.
1A.
2A.
2B.
3A.
3B.
1B.
4B.
5A.
74.3% 75.2%
Num Den Percent
Percentage of children 2 to 4 years of age who received services from the health department and who, according to their Body Mass Index (BMI) for age and gender were:
4A.
Percentage of infants who participated in WIC who were: 5B.
79.6%
61.4%
40.9%
75.5%
90.7%
88.1%
69.5%
32.7%
41.4%
22.5%10.5%
75.9%
56.5%
34.1%
78.2%
93.9%
87.7%
66.6%
32.2%
50.8%
21.1%9.4%
75.9%
76.1%
55.9%
39.8%
79.3%
88.8%
88.5%
62.3%
28.6%
50.1%
24.2%10.8%
2.1%
‐4.5%
‐8.8%
‐2.7%
5.2%
‐2.1%
0.4%
‐10.4%
‐12.4%
21.0%
7.3%3.8%
168 222 75.7%
236 306 77.1%
700 1,192 58.7%
206 494 41.7%
221 274 80.7%
25 27 92.6%
79 89 88.8%
245 406 60.3%
51 28.0%182
175 342 51.2%
87 335 26.0%42 335 12.5%
47.3%20.0%
55.2%16.1%
16.7%‐19.4%
52.1%15.7%
106 58.2%25 13.7%
182182
At a healthy weight (BMI less than the 85th percentile but at or greater than the 5th percentile) (1)
a.
Overweight (BMI at or above the 85th percentile but less than the 95th percentile)
b.
Underweight (BMI less than the 5th percentile).
c.
Recommended prenatal weight gaina.
Excessive prenatal weight gainb.
Inadequate prenatal weight gainc.
Breastfeeding at 6 weeks of age (1)a.
Breastfeeding at 6 months of ageb.
11.9% 15.8% 18.3% 53.2% 75 406 18.5%
7.8% 4.2% 3.1% ‐59.9% 12 406 3.0%
2000 2008 Data
2002to
2003
2005to
2006
2008to
% Change from 2000
to 2008
Obese (BMI at or greater than the 95th percentile).
d.
10.7% 13.4% 16.3% 51.6% 74 406 18.2%
(2) These data exclude women enrolled in Medicaid only for emergency delivery.
(3) Recommended total prenatal weight gain range by prepregnancy weight category is 28-40 lbs. for underweight women (BMI<18.5); 25-35 lbs. for normal weight women (BMI 18.5 to 24.9); 15-25 lbs. for overweight women (BMI 25 to 29.9); and 11-20 lbs. for obese women (BMI >=30.0): Adapted from the National Academy of Sciences. Weight Gain During Pregnancy: Reexamining the Guidelines. Washington, DC : National Academy Press, 2009.
(1) Item appears also on other WCH Section Agreement Addenda.

Surry CountyATTACHMENT A: WIC QUALITY ASSURANCE DELIVERABLES
SFY 20102011 AGREEMENT ADDENDA DATA
Process Outcome Objectives
Percentage of pregnant women enrolled in Medicaid who received prenatal WIC Program services. (1) (2)
Percentage of pregnant women who participated in WIC and received WIC Program services during the first trimester of pregnancy.
Percentage of children less than 12 months of age who were served in the Child Health Clinic and received WIC Program services. (1)
Percentage of children 1 to 5 years of age who were served in the Child Health Clinic and received WIC Program Services. (1)
Percentage of children 1 to 5 years of age enrolled in Medicaid who received WIC Program Services.
Percentage of children less than 12 months of age enrolled in Medicaid who received WIC Program services.
Percentage of postpartum women who participated in WIC during pregnancy and were recertified for WIC by 6 weeks postpartum.
Percentage of women with live term singleton births who received WIC Program services during pregnancy and who gained recommended/excessive/inadequate weight according to the National Academy of Sciences ‐ Institute of Medicine 2009 recommended total weight gain ranges during pregnancy. (3)
Percentage of women who participated in WIC who initiated breastfeeding.
1C.
1A.
2A.
2B.
3A.
3B.
1B.
4B.
5A.
74.7% 72.5%
Num Den Percent
Percentage of children 2 to 4 years of age who received services from the health department and who, according to their Body Mass Index (BMI) for age and gender were:
4A.
Percentage of infants who participated in WIC who were: 5B.
73.4%
57.6%
52.1%
78.9%
89.2%
59.6%
72.9%
32.6%
52.7%
31.8%16.8%
76.7%
55.4%
46.6%
79.5%
83.5%
89.0%
68.2%
28.1%
53.0%
33.3%17.1%
68.7%
75.9%
51.5%
45.3%
80.5%
82.4%
79.7%
65.3%
29.5%
42.3%
28.9%13.0%
‐8.1%
3.4%
‐10.7%
‐12.9%
2.0%
‐7.6%
33.8%
‐10.4%
‐9.5%
‐19.8%
‐9.0%‐22.7%
314 443 70.9%
544 707 76.9%
1,400 2,565 54.6%
372 859 43.3%
430 542 79.3%
194 241 80.5%
414 530 78.1%
536 829 64.7%
100 29.3%341
328 749 43.8%
167 709 23.6%72 709 10.2%
47.4%20.0%
53.9%16.6%
13.7%‐16.8%
52.5%19.4%
186 54.5%55 16.1%
341341
At a healthy weight (BMI less than the 85th percentile but at or greater than the 5th percentile) (1)
a.
Overweight (BMI at or above the 85th percentile but less than the 95th percentile)
b.
Underweight (BMI less than the 5th percentile).
c.
Recommended prenatal weight gaina.
Excessive prenatal weight gainb.
Inadequate prenatal weight gainc.
Breastfeeding at 6 weeks of age (1)a.
Breastfeeding at 6 months of ageb.
8.2% 13.2% 16.4% 99.1% 139 829 16.8%
10.9% 6.4% 3.4% ‐69.1% 20 829 2.4%
2000 2008 Data
2002to
2003
2005to
2006
2008to
% Change from 2000
to 2008
Obese (BMI at or greater than the 95th percentile).
d.
8.0% 12.2% 15.0% 86.8% 134 829 16.2%
(2) These data exclude women enrolled in Medicaid only for emergency delivery.
(3) Recommended total prenatal weight gain range by prepregnancy weight category is 28-40 lbs. for underweight women (BMI<18.5); 25-35 lbs. for normal weight women (BMI 18.5 to 24.9); 15-25 lbs. for overweight women (BMI 25 to 29.9); and 11-20 lbs. for obese women (BMI >=30.0): Adapted from the National Academy of Sciences. Weight Gain During Pregnancy: Reexamining the Guidelines. Washington, DC : National Academy Press, 2009.
(1) Item appears also on other WCH Section Agreement Addenda.

Swain CountyATTACHMENT A: WIC QUALITY ASSURANCE DELIVERABLES
SFY 20102011 AGREEMENT ADDENDA DATA
Process Outcome Objectives
Percentage of pregnant women enrolled in Medicaid who received prenatal WIC Program services. (1) (2)
Percentage of pregnant women who participated in WIC and received WIC Program services during the first trimester of pregnancy.
Percentage of children less than 12 months of age who were served in the Child Health Clinic and received WIC Program services. (1)
Percentage of children 1 to 5 years of age who were served in the Child Health Clinic and received WIC Program Services. (1)
Percentage of children 1 to 5 years of age enrolled in Medicaid who received WIC Program Services.
Percentage of children less than 12 months of age enrolled in Medicaid who received WIC Program services.
Percentage of postpartum women who participated in WIC during pregnancy and were recertified for WIC by 6 weeks postpartum.
Percentage of women with live term singleton births who received WIC Program services during pregnancy and who gained recommended/excessive/inadequate weight according to the National Academy of Sciences ‐ Institute of Medicine 2009 recommended total weight gain ranges during pregnancy. (3)
Percentage of women who participated in WIC who initiated breastfeeding.
1C.
1A.
2A.
2B.
3A.
3B.
1B.
4B.
5A.
89.3% 84.8%
Num Den Percent
Percentage of children 2 to 4 years of age who received services from the health department and who, according to their Body Mass Index (BMI) for age and gender were:
4A.
Percentage of infants who participated in WIC who were: 5B.
78.3%
84.0%
59.6%
73.0%
84.8%
81.9%
67.6%
32.3%
73.1%
33.4%18.9%
76.2%
78.6%
50.3%
79.2%
100.0%
88.9%
72.7%
31.0%
82.6%
37.1%20.8%
85.8%
73.3%
74.2%
49.2%
75.1%
67.7%
27.3%
66.2%
29.6%17.0%
‐3.8%
‐6.3%
‐11.7%
‐17.4%
2.9%
0.2%
‐15.6%
‐9.5%
‐11.6%‐9.9%
107 133 80.5%
128 174 73.6%
504 645 78.1%
78 164 47.6%
69 93 74.2%
104 158 65.8%
18 18.2%99
88 110 80.0%
36 118 30.5%22 118 18.6%
51.0%16.6%
56.4%16.3%
10.6%‐2.2%
48.5%20.5%
64 64.6%17 17.2%
9999
At a healthy weight (BMI less than the 85th percentile but at or greater than the 5th percentile) (1)
a.
Overweight (BMI at or above the 85th percentile but less than the 95th percentile)
b.
Underweight (BMI less than the 5th percentile).
c.
Recommended prenatal weight gaina.
Excessive prenatal weight gainb.
Inadequate prenatal weight gainc.
Breastfeeding at 6 weeks of age (1)a.
Breastfeeding at 6 months of ageb.
14.5% 14.3% 16.9% 16.7% 30 158 19.0%
2.9% 3.5% 1.7% ‐39.4% 3 158 1.9%
2000 2008 Data
2002to
2003
2005to
2006
2008to
% Change from 2000
to 2008
Obese (BMI at or greater than the 95th percentile).
d.
15.1% 9.4% 13.7% ‐9.4% 21 158 13.3%
(2) These data exclude women enrolled in Medicaid only for emergency delivery.
(3) Recommended total prenatal weight gain range by prepregnancy weight category is 28-40 lbs. for underweight women (BMI<18.5); 25-35 lbs. for normal weight women (BMI 18.5 to 24.9); 15-25 lbs. for overweight women (BMI 25 to 29.9); and 11-20 lbs. for obese women (BMI >=30.0): Adapted from the National Academy of Sciences. Weight Gain During Pregnancy: Reexamining the Guidelines. Washington, DC : National Academy Press, 2009.
(1) Item appears also on other WCH Section Agreement Addenda.

Toe River DistrictATTACHMENT A: WIC QUALITY ASSURANCE DELIVERABLES
SFY 20102011 AGREEMENT ADDENDA DATA
Process Outcome Objectives
Percentage of pregnant women enrolled in Medicaid who received prenatal WIC Program services. (1) (2)
Percentage of pregnant women who participated in WIC and received WIC Program services during the first trimester of pregnancy.
Percentage of children less than 12 months of age who were served in the Child Health Clinic and received WIC Program services. (1)
Percentage of children 1 to 5 years of age who were served in the Child Health Clinic and received WIC Program Services. (1)
Percentage of children 1 to 5 years of age enrolled in Medicaid who received WIC Program Services.
Percentage of children less than 12 months of age enrolled in Medicaid who received WIC Program services.
Percentage of postpartum women who participated in WIC during pregnancy and were recertified for WIC by 6 weeks postpartum.
Percentage of women with live term singleton births who received WIC Program services during pregnancy and who gained recommended/excessive/inadequate weight according to the National Academy of Sciences ‐ Institute of Medicine 2009 recommended total weight gain ranges during pregnancy. (3)
Percentage of women who participated in WIC who initiated breastfeeding.
1C.
1A.
2A.
2B.
3A.
3B.
1B.
4B.
5A.
76.3% 72.8%
Num Den Percent
Percentage of children 2 to 4 years of age who received services from the health department and who, according to their Body Mass Index (BMI) for age and gender were:
4A.
Percentage of infants who participated in WIC who were: 5B.
69.3%
74.7%
47.6%
73.5%
86.6%
89.2%
69.0%
34.5%
57.3%
36.9%21.7%
63.4%
66.8%
41.5%
70.7%
89.2%
92.1%
65.6%
33.5%
63.9%
40.6%26.2%
72.6%
63.6%
59.9%
43.6%
68.2%
94.4%
87.9%
68.1%
32.7%
62.6%
36.3%22.8%
‐4.9%
‐8.3%
‐19.8%
‐8.5%
‐7.2%
9.0%
‐1.5%
‐1.2%
‐4.9%
9.2%
‐1.6%5.0%
180 263 68.4%
249 383 65.0%
906 1,445 62.7%
323 726 44.5%
271 382 70.9%
33 34 97.1%
66 73 90.4%
413 578 71.5%
68 29.6%230
311 481 64.7%
213 498 42.8%136 498 27.3%
44.5%21.0%
46.1%21.1%
3.7%0.4%
43.0%23.5%
115 50.0%47 20.4%
230230
At a healthy weight (BMI less than the 85th percentile but at or greater than the 5th percentile) (1)
a.
Overweight (BMI at or above the 85th percentile but less than the 95th percentile)
b.
Underweight (BMI less than the 5th percentile).
c.
Recommended prenatal weight gaina.
Excessive prenatal weight gainb.
Inadequate prenatal weight gainc.
Breastfeeding at 6 weeks of age (1)a.
Breastfeeding at 6 months of ageb.
15.1% 16.4% 15.5% 2.8% 76 578 13.1%
3.8% 2.4% 3.6% ‐4.9% 17 578 2.9%
2000 2008 Data
2002to
2003
2005to
2006
2008to
% Change from 2000
to 2008
Obese (BMI at or greater than the 95th percentile).
d.
12.1% 15.7% 12.7% 5.1% 72 578 12.5%
(2) These data exclude women enrolled in Medicaid only for emergency delivery.
(3) Recommended total prenatal weight gain range by prepregnancy weight category is 28-40 lbs. for underweight women (BMI<18.5); 25-35 lbs. for normal weight women (BMI 18.5 to 24.9); 15-25 lbs. for overweight women (BMI 25 to 29.9); and 11-20 lbs. for obese women (BMI >=30.0): Adapted from the National Academy of Sciences. Weight Gain During Pregnancy: Reexamining the Guidelines. Washington, DC : National Academy Press, 2009.
(1) Item appears also on other WCH Section Agreement Addenda.

Transylvania CountyATTACHMENT A: WIC QUALITY ASSURANCE DELIVERABLES
SFY 20102011 AGREEMENT ADDENDA DATA
Process Outcome Objectives
Percentage of pregnant women enrolled in Medicaid who received prenatal WIC Program services. (1) (2)
Percentage of pregnant women who participated in WIC and received WIC Program services during the first trimester of pregnancy.
Percentage of children less than 12 months of age who were served in the Child Health Clinic and received WIC Program services. (1)
Percentage of children 1 to 5 years of age who were served in the Child Health Clinic and received WIC Program Services. (1)
Percentage of children 1 to 5 years of age enrolled in Medicaid who received WIC Program Services.
Percentage of children less than 12 months of age enrolled in Medicaid who received WIC Program services.
Percentage of postpartum women who participated in WIC during pregnancy and were recertified for WIC by 6 weeks postpartum.
Percentage of women with live term singleton births who received WIC Program services during pregnancy and who gained recommended/excessive/inadequate weight according to the National Academy of Sciences ‐ Institute of Medicine 2009 recommended total weight gain ranges during pregnancy. (3)
Percentage of women who participated in WIC who initiated breastfeeding.
1C.
1A.
2A.
2B.
3A.
3B.
1B.
4B.
5A.
77.0% 77.1%
Num Den Percent
Percentage of children 2 to 4 years of age who received services from the health department and who, according to their Body Mass Index (BMI) for age and gender were:
4A.
Percentage of infants who participated in WIC who were: 5B.
64.7%
61.8%
54.3%
72.2%
30.0%
82.6%
67.2%
31.9%
67.2%
33.2%14.2%
71.4%
58.4%
50.0%
78.2%
33.3%
85.7%
67.0%
29.0%
80.9%
49.5%29.4%
71.8%
65.8%
53.0%
50.9%
75.4%
50.0%
83.9%
67.5%
33.0%
75.6%
53.1%30.8%
‐6.8%
1.7%
‐14.3%
‐6.2%
4.4%
66.7%
1.6%
0.4%
3.4%
12.6%
59.9%116.5%
122 166 73.5%
157 233 67.4%
501 900 55.7%
204 387 52.7%
155 203 76.4%
17 20 85.0%
180 257 70.0%
45 33.3%135
197 256 77.0%
115 233 49.4%66 233 28.3%
45.0%23.1%
47.8%19.2%
6.3%‐17.0%
49.6%21.3%
58 43.0%32 23.7%
135135
At a healthy weight (BMI less than the 85th percentile but at or greater than the 5th percentile) (1)
a.
Overweight (BMI at or above the 85th percentile but less than the 95th percentile)
b.
Underweight (BMI less than the 5th percentile).
c.
Recommended prenatal weight gaina.
Excessive prenatal weight gainb.
Inadequate prenatal weight gainc.
Breastfeeding at 6 weeks of age (1)a.
Breastfeeding at 6 months of ageb.
16.6% 15.9% 15.8% ‐4.7% 37 257 14.4%
3.5% 3.0% 2.7% ‐22.8% 8 257 3.1%
2000 2008 Data
2002to
2003
2005to
2006
2008to
% Change from 2000
to 2008
Obese (BMI at or greater than the 95th percentile).
d.
12.7% 14.0% 14.0% 10.5% 32 257 12.5%
(2) These data exclude women enrolled in Medicaid only for emergency delivery.
(3) Recommended total prenatal weight gain range by prepregnancy weight category is 28-40 lbs. for underweight women (BMI<18.5); 25-35 lbs. for normal weight women (BMI 18.5 to 24.9); 15-25 lbs. for overweight women (BMI 25 to 29.9); and 11-20 lbs. for obese women (BMI >=30.0): Adapted from the National Academy of Sciences. Weight Gain During Pregnancy: Reexamining the Guidelines. Washington, DC : National Academy Press, 2009.
(1) Item appears also on other WCH Section Agreement Addenda.

Union CountyATTACHMENT A: WIC QUALITY ASSURANCE DELIVERABLES
SFY 20102011 AGREEMENT ADDENDA DATA
Process Outcome Objectives
Percentage of pregnant women enrolled in Medicaid who received prenatal WIC Program services. (1) (2)
Percentage of pregnant women who participated in WIC and received WIC Program services during the first trimester of pregnancy.
Percentage of children less than 12 months of age who were served in the Child Health Clinic and received WIC Program services. (1)
Percentage of children 1 to 5 years of age who were served in the Child Health Clinic and received WIC Program Services. (1)
Percentage of children 1 to 5 years of age enrolled in Medicaid who received WIC Program Services.
Percentage of children less than 12 months of age enrolled in Medicaid who received WIC Program services.
Percentage of postpartum women who participated in WIC during pregnancy and were recertified for WIC by 6 weeks postpartum.
Percentage of women with live term singleton births who received WIC Program services during pregnancy and who gained recommended/excessive/inadequate weight according to the National Academy of Sciences ‐ Institute of Medicine 2009 recommended total weight gain ranges during pregnancy. (3)
Percentage of women who participated in WIC who initiated breastfeeding.
1C.
1A.
2A.
2B.
3A.
3B.
1B.
4B.
5A.
70.4% 62.1%
Num Den Percent
Percentage of children 2 to 4 years of age who received services from the health department and who, according to their Body Mass Index (BMI) for age and gender were:
4A.
Percentage of infants who participated in WIC who were: 5B.
61.4%
53.8%
31.2%
71.8%
90.0%
66.5%
66.7%
32.9%
64.5%
30.3%14.7%
61.8%
52.0%
27.4%
76.9%
89.7%
89.2%
66.1%
34.9%
68.9%
35.6%17.5%
57.1%
64.5%
49.8%
18.1%
78.0%
87.1%
85.8%
66.5%
38.1%
68.6%
36.2%20.0%
‐18.9%
5.0%
‐7.6%
‐42.1%
8.6%
‐3.3%
29.0%
‐0.3%
16.1%
6.4%
19.6%36.4%
405 759 53.4%
886 1,384 64.0%
2,738 5,254 52.1%
153 1,176 13.0%
627 827 75.8%
563 643 87.6%
585 687 85.2%
934 1,452 64.3%
329 40.9%805
926 1,315 70.4%
515 1,433 35.9%258 1,433 18.0%
40.9%26.3%
40.0%21.8%
‐2.1%‐16.9%
41.6%23.5%
299 37.1%177 22.0%
805805
At a healthy weight (BMI less than the 85th percentile but at or greater than the 5th percentile) (1)
a.
Overweight (BMI at or above the 85th percentile but less than the 95th percentile)
b.
Underweight (BMI less than the 5th percentile).
c.
Recommended prenatal weight gaina.
Excessive prenatal weight gainb.
Inadequate prenatal weight gainc.
Breastfeeding at 6 weeks of age (1)a.
Breastfeeding at 6 months of ageb.
15.9% 16.6% 15.7% ‐1.4% 236 1,452 16.3%
3.3% 3.1% 3.3% ‐0.5% 49 1,452 3.4%
2000 2008 Data
2002to
2003
2005to
2006
2008to
% Change from 2000
to 2008
Obese (BMI at or greater than the 95th percentile).
d.
14.1% 14.2% 14.5% 3.1% 233 1,452 16.0%
(2) These data exclude women enrolled in Medicaid only for emergency delivery.
(3) Recommended total prenatal weight gain range by prepregnancy weight category is 28-40 lbs. for underweight women (BMI<18.5); 25-35 lbs. for normal weight women (BMI 18.5 to 24.9); 15-25 lbs. for overweight women (BMI 25 to 29.9); and 11-20 lbs. for obese women (BMI >=30.0): Adapted from the National Academy of Sciences. Weight Gain During Pregnancy: Reexamining the Guidelines. Washington, DC : National Academy Press, 2009.
(1) Item appears also on other WCH Section Agreement Addenda.

Wake CountyATTACHMENT A: WIC QUALITY ASSURANCE DELIVERABLES
SFY 20102011 AGREEMENT ADDENDA DATA
Process Outcome Objectives
Percentage of pregnant women enrolled in Medicaid who received prenatal WIC Program services. (1) (2)
Percentage of pregnant women who participated in WIC and received WIC Program services during the first trimester of pregnancy.
Percentage of children less than 12 months of age who were served in the Child Health Clinic and received WIC Program services. (1)
Percentage of children 1 to 5 years of age who were served in the Child Health Clinic and received WIC Program Services. (1)
Percentage of children 1 to 5 years of age enrolled in Medicaid who received WIC Program Services.
Percentage of children less than 12 months of age enrolled in Medicaid who received WIC Program services.
Percentage of postpartum women who participated in WIC during pregnancy and were recertified for WIC by 6 weeks postpartum.
Percentage of women with live term singleton births who received WIC Program services during pregnancy and who gained recommended/excessive/inadequate weight according to the National Academy of Sciences ‐ Institute of Medicine 2009 recommended total weight gain ranges during pregnancy. (3)
Percentage of women who participated in WIC who initiated breastfeeding.
1C.
1A.
2A.
2B.
3A.
3B.
1B.
4B.
5A.
73.8% 70.2%
Num Den Percent
Percentage of children 2 to 4 years of age who received services from the health department and who, according to their Body Mass Index (BMI) for age and gender were:
4A.
Percentage of infants who participated in WIC who were: 5B.
66.7%
51.0%
26.8%
48.1%
84.5%
62.8%
69.2%
32.9%
44.7%
32.6%25.0%
67.4%
51.6%
19.1%
68.3%
86.5%
63.5%
64.5%
33.3%
57.2%
39.4%29.5%
68.0%
67.7%
50.8%
19.7%
71.8%
84.4%
63.4%
63.8%
32.8%
68.3%
56.3%32.5%
‐7.8%
1.6%
‐0.4%
‐26.4%
49.4%
‐0.2%
0.9%
‐7.8%
‐0.4%
52.7%
72.6%30.0%
2,016 2,904 69.4%
4,227 6,063 69.7%
11,353 21,035 54.0%
1,771 9,156 19.3%
3,448 4,660 74.0%
2,046 2,342 87.4%
1,881 2,842 66.2%
3,967 6,266 63.3%
1,098 33.8%3,244
4,105 6,058 67.8%
2,612 4,687 55.7%1,538 4,687 32.8%
41.6%25.5%
39.8%27.4%
‐4.3%7.4%
42.8%23.9%
1,260 38.8%886 27.3%
3,2443,244
At a healthy weight (BMI less than the 85th percentile but at or greater than the 5th percentile) (1)
a.
Overweight (BMI at or above the 85th percentile but less than the 95th percentile)
b.
Underweight (BMI less than the 5th percentile).
c.
Recommended prenatal weight gaina.
Excessive prenatal weight gainb.
Inadequate prenatal weight gainc.
Breastfeeding at 6 weeks of age (1)a.
Breastfeeding at 6 months of ageb.
11.0% 16.4% 17.3% 57.1% 1,151 6,266 18.4%
10.1% 2.9% 2.5% ‐75.0% 133 6,266 2.1%
2000 2008 Data
2002to
2003
2005to
2006
2008to
% Change from 2000
to 2008
Obese (BMI at or greater than the 95th percentile).
d.
9.7% 16.2% 16.4% 69.6% 1,015 6,266 16.2%
(2) These data exclude women enrolled in Medicaid only for emergency delivery.
(3) Recommended total prenatal weight gain range by prepregnancy weight category is 28-40 lbs. for underweight women (BMI<18.5); 25-35 lbs. for normal weight women (BMI 18.5 to 24.9); 15-25 lbs. for overweight women (BMI 25 to 29.9); and 11-20 lbs. for obese women (BMI >=30.0): Adapted from the National Academy of Sciences. Weight Gain During Pregnancy: Reexamining the Guidelines. Washington, DC : National Academy Press, 2009.
(1) Item appears also on other WCH Section Agreement Addenda.

Warren CountyATTACHMENT A: WIC QUALITY ASSURANCE DELIVERABLES
SFY 20102011 AGREEMENT ADDENDA DATA
Process Outcome Objectives
Percentage of pregnant women enrolled in Medicaid who received prenatal WIC Program services. (1) (2)
Percentage of pregnant women who participated in WIC and received WIC Program services during the first trimester of pregnancy.
Percentage of children less than 12 months of age who were served in the Child Health Clinic and received WIC Program services. (1)
Percentage of children 1 to 5 years of age who were served in the Child Health Clinic and received WIC Program Services. (1)
Percentage of children 1 to 5 years of age enrolled in Medicaid who received WIC Program Services.
Percentage of children less than 12 months of age enrolled in Medicaid who received WIC Program services.
Percentage of postpartum women who participated in WIC during pregnancy and were recertified for WIC by 6 weeks postpartum.
Percentage of women with live term singleton births who received WIC Program services during pregnancy and who gained recommended/excessive/inadequate weight according to the National Academy of Sciences ‐ Institute of Medicine 2009 recommended total weight gain ranges during pregnancy. (3)
Percentage of women who participated in WIC who initiated breastfeeding.
1C.
1A.
2A.
2B.
3A.
3B.
1B.
4B.
5A.
84.5% 86.1%
Num Den Percent
Percentage of children 2 to 4 years of age who received services from the health department and who, according to their Body Mass Index (BMI) for age and gender were:
4A.
Percentage of infants who participated in WIC who were: 5B.
73.2%
70.7%
53.6%
76.3%
97.6%
93.8%
70.4%
29.4%
29.0%
15.3%13.0%
76.1%
68.9%
49.7%
80.0%
97.7%
95.9%
70.4%
31.8%
34.1%
22.3%11.3%
85.5%
78.4%
66.7%
46.4%
78.2%
98.8%
92.5%
70.9%
26.8%
37.7%
27.9%14.2%
1.2%
7.1%
‐5.7%
‐13.5%
2.5%
1.2%
‐1.3%
0.7%
‐8.7%
29.9%
82.4%9.1%
104 119 87.4%
147 185 79.5%
557 797 69.9%
130 308 42.2%
129 172 75.0%
67 67 100.0%
151 158 95.6%
217 313 69.3%
36 28.6%126
91 211 43.1%
56 222 25.2%30 222 13.5%
44.4%26.2%
44.1%29.1%
‐0.7%10.9%
42.1%26.1%
53 42.1%37 29.4%
126126
At a healthy weight (BMI less than the 85th percentile but at or greater than the 5th percentile) (1)
a.
Overweight (BMI at or above the 85th percentile but less than the 95th percentile)
b.
Underweight (BMI less than the 5th percentile).
c.
Recommended prenatal weight gaina.
Excessive prenatal weight gainb.
Inadequate prenatal weight gainc.
Breastfeeding at 6 weeks of age (1)a.
Breastfeeding at 6 months of ageb.
11.0% 13.3% 10.0% ‐8.5% 30 313 9.6%
7.9% 6.1% 8.5% 8.4% 31 313 9.9%
2000 2008 Data
2002to
2003
2005to
2006
2008to
% Change from 2000
to 2008
Obese (BMI at or greater than the 95th percentile).
d.
10.8% 10.2% 10.6% ‐1.8% 35 313 11.2%
(2) These data exclude women enrolled in Medicaid only for emergency delivery.
(3) Recommended total prenatal weight gain range by prepregnancy weight category is 28-40 lbs. for underweight women (BMI<18.5); 25-35 lbs. for normal weight women (BMI 18.5 to 24.9); 15-25 lbs. for overweight women (BMI 25 to 29.9); and 11-20 lbs. for obese women (BMI >=30.0): Adapted from the National Academy of Sciences. Weight Gain During Pregnancy: Reexamining the Guidelines. Washington, DC : National Academy Press, 2009.
(1) Item appears also on other WCH Section Agreement Addenda.

Wayne CountyATTACHMENT A: WIC QUALITY ASSURANCE DELIVERABLES
SFY 20102011 AGREEMENT ADDENDA DATA
Process Outcome Objectives
Percentage of pregnant women enrolled in Medicaid who received prenatal WIC Program services. (1) (2)
Percentage of pregnant women who participated in WIC and received WIC Program services during the first trimester of pregnancy.
Percentage of children less than 12 months of age who were served in the Child Health Clinic and received WIC Program services. (1)
Percentage of children 1 to 5 years of age who were served in the Child Health Clinic and received WIC Program Services. (1)
Percentage of children 1 to 5 years of age enrolled in Medicaid who received WIC Program Services.
Percentage of children less than 12 months of age enrolled in Medicaid who received WIC Program services.
Percentage of postpartum women who participated in WIC during pregnancy and were recertified for WIC by 6 weeks postpartum.
Percentage of women with live term singleton births who received WIC Program services during pregnancy and who gained recommended/excessive/inadequate weight according to the National Academy of Sciences ‐ Institute of Medicine 2009 recommended total weight gain ranges during pregnancy. (3)
Percentage of women who participated in WIC who initiated breastfeeding.
1C.
1A.
2A.
2B.
3A.
3B.
1B.
4B.
5A.
76.9% 71.6%
Num Den Percent
Percentage of children 2 to 4 years of age who received services from the health department and who, according to their Body Mass Index (BMI) for age and gender were:
4A.
Percentage of infants who participated in WIC who were: 5B.
73.2%
55.9%
35.2%
74.7%
89.9%
82.1%
66.7%
32.4%
42.3%
24.2%11.0%
72.8%
55.1%
30.9%
67.8%
93.1%
85.6%
64.1%
31.3%
51.9%
26.8%11.5%
78.6%
77.1%
53.2%
37.4%
71.6%
85.0%
83.3%
63.8%
31.5%
49.1%
28.1%11.4%
2.2%
5.3%
‐4.8%
6.1%
‐4.2%
‐5.4%
1.5%
‐4.3%
‐2.8%
16.0%
16.6%3.8%
627 810 77.4%
924 1,205 76.7%
2,628 4,743 55.4%
701 1,959 35.8%
887 1,230 72.1%
2 2 100.0%
41 46 89.1%
988 1,478 66.8%
265 30.5%868
690 1,440 47.9%
424 1,401 30.3%164 1,401 11.7%
46.4%21.3%
45.0%23.5%
‐2.9%10.4%
47.2%21.5%
381 43.9%222 25.6%
868868
At a healthy weight (BMI less than the 85th percentile but at or greater than the 5th percentile) (1)
a.
Overweight (BMI at or above the 85th percentile but less than the 95th percentile)
b.
Underweight (BMI less than the 5th percentile).
c.
Recommended prenatal weight gaina.
Excessive prenatal weight gainb.
Inadequate prenatal weight gainc.
Breastfeeding at 6 weeks of age (1)a.
Breastfeeding at 6 months of ageb.
14.2% 16.9% 17.4% 21.9% 223 1,478 15.1%
4.8% 2.8% 2.5% ‐47.2% 40 1,478 2.7%
2000 2008 Data
2002to
2003
2005to
2006
2008to
% Change from 2000
to 2008
Obese (BMI at or greater than the 95th percentile).
d.
14.3% 16.2% 16.3% 14.1% 227 1,478 15.4%
(2) These data exclude women enrolled in Medicaid only for emergency delivery.
(3) Recommended total prenatal weight gain range by prepregnancy weight category is 28-40 lbs. for underweight women (BMI<18.5); 25-35 lbs. for normal weight women (BMI 18.5 to 24.9); 15-25 lbs. for overweight women (BMI 25 to 29.9); and 11-20 lbs. for obese women (BMI >=30.0): Adapted from the National Academy of Sciences. Weight Gain During Pregnancy: Reexamining the Guidelines. Washington, DC : National Academy Press, 2009.
(1) Item appears also on other WCH Section Agreement Addenda.

Wilkes CountyATTACHMENT A: WIC QUALITY ASSURANCE DELIVERABLES
SFY 20102011 AGREEMENT ADDENDA DATA
Process Outcome Objectives
Percentage of pregnant women enrolled in Medicaid who received prenatal WIC Program services. (1) (2)
Percentage of pregnant women who participated in WIC and received WIC Program services during the first trimester of pregnancy.
Percentage of children less than 12 months of age who were served in the Child Health Clinic and received WIC Program services. (1)
Percentage of children 1 to 5 years of age who were served in the Child Health Clinic and received WIC Program Services. (1)
Percentage of children 1 to 5 years of age enrolled in Medicaid who received WIC Program Services.
Percentage of children less than 12 months of age enrolled in Medicaid who received WIC Program services.
Percentage of postpartum women who participated in WIC during pregnancy and were recertified for WIC by 6 weeks postpartum.
Percentage of women with live term singleton births who received WIC Program services during pregnancy and who gained recommended/excessive/inadequate weight according to the National Academy of Sciences ‐ Institute of Medicine 2009 recommended total weight gain ranges during pregnancy. (3)
Percentage of women who participated in WIC who initiated breastfeeding.
1C.
1A.
2A.
2B.
3A.
3B.
1B.
4B.
5A.
77.4% 79.0%
Num Den Percent
Percentage of children 2 to 4 years of age who received services from the health department and who, according to their Body Mass Index (BMI) for age and gender were:
4A.
Percentage of infants who participated in WIC who were: 5B.
75.5%
62.2%
38.8%
80.5%
92.1%
86.7%
67.7%
29.4%
50.3%
26.2%11.4%
78.6%
62.3%
42.5%
81.5%
84.6%
84.6%
61.5%
30.0%
47.0%
26.4%12.8%
79.7%
80.9%
60.4%
39.9%
79.9%
91.3%
83.7%
63.7%
31.6%
54.2%
25.4%11.5%
3.0%
7.1%
‐2.9%
3.0%
‐0.7%
‐0.8%
‐3.5%
‐5.8%
7.4%
7.8%
‐3.1%0.7%
363 441 82.3%
513 616 83.3%
1,452 2,274 63.9%
267 738 36.2%
399 485 82.3%
104 114 91.2%
177 209 84.7%
423 645 65.6%
170 36.0%472
313 583 53.7%
184 686 26.8%82 686 12.0%
48.7%21.8%
38.0%30.3%
‐22.0%39.1%
50.1%19.9%
172 36.4%130 27.5%
472472
At a healthy weight (BMI less than the 85th percentile but at or greater than the 5th percentile) (1)
a.
Overweight (BMI at or above the 85th percentile but less than the 95th percentile)
b.
Underweight (BMI less than the 5th percentile).
c.
Recommended prenatal weight gaina.
Excessive prenatal weight gainb.
Inadequate prenatal weight gainc.
Breastfeeding at 6 weeks of age (1)a.
Breastfeeding at 6 months of ageb.
15.5% 17.8% 17.6% 13.9% 112 645 17.4%
2.3% 2.1% 2.0% ‐15.1% 9 645 1.4%
2000 2008 Data
2002to
2003
2005to
2006
2008to
% Change from 2000
to 2008
Obese (BMI at or greater than the 95th percentile).
d.
14.5% 18.7% 16.7% 14.9% 101 645 15.7%
(2) These data exclude women enrolled in Medicaid only for emergency delivery.
(3) Recommended total prenatal weight gain range by prepregnancy weight category is 28-40 lbs. for underweight women (BMI<18.5); 25-35 lbs. for normal weight women (BMI 18.5 to 24.9); 15-25 lbs. for overweight women (BMI 25 to 29.9); and 11-20 lbs. for obese women (BMI >=30.0): Adapted from the National Academy of Sciences. Weight Gain During Pregnancy: Reexamining the Guidelines. Washington, DC : National Academy Press, 2009.
(1) Item appears also on other WCH Section Agreement Addenda.

Wilson CountyATTACHMENT A: WIC QUALITY ASSURANCE DELIVERABLES
SFY 20102011 AGREEMENT ADDENDA DATA
Process Outcome Objectives
Percentage of pregnant women enrolled in Medicaid who received prenatal WIC Program services. (1) (2)
Percentage of pregnant women who participated in WIC and received WIC Program services during the first trimester of pregnancy.
Percentage of children less than 12 months of age who were served in the Child Health Clinic and received WIC Program services. (1)
Percentage of children 1 to 5 years of age who were served in the Child Health Clinic and received WIC Program Services. (1)
Percentage of children 1 to 5 years of age enrolled in Medicaid who received WIC Program Services.
Percentage of children less than 12 months of age enrolled in Medicaid who received WIC Program services.
Percentage of postpartum women who participated in WIC during pregnancy and were recertified for WIC by 6 weeks postpartum.
Percentage of women with live term singleton births who received WIC Program services during pregnancy and who gained recommended/excessive/inadequate weight according to the National Academy of Sciences ‐ Institute of Medicine 2009 recommended total weight gain ranges during pregnancy. (3)
Percentage of women who participated in WIC who initiated breastfeeding.
1C.
1A.
2A.
2B.
3A.
3B.
1B.
4B.
5A.
81.5% 83.4%
Num Den Percent
Percentage of children 2 to 4 years of age who received services from the health department and who, according to their Body Mass Index (BMI) for age and gender were:
4A.
Percentage of infants who participated in WIC who were: 5B.
76.8%
58.3%
34.6%
67.0%
99.0%
97.1%
66.6%
31.9%
31.7%
18.9%10.4%
78.2%
57.2%
30.2%
67.7%
99.3%
97.3%
62.4%
30.5%
38.5%
24.0%12.1%
84.1%
75.9%
57.6%
24.6%
68.5%
99.2%
97.2%
62.8%
32.4%
41.9%
25.7%13.4%
3.2%
‐1.1%
‐1.3%
‐28.9%
2.3%
0.3%
0.1%
‐5.8%
1.5%
32.1%
35.7%29.3%
517 602 85.9%
705 925 76.2%
1,982 3,351 59.1%
391 1,632 24.0%
592 830 71.3%
198 199 99.5%
376 387 97.2%
661 1,044 63.3%
220 31.4%700
387 972 39.8%
228 920 24.8%121 920 13.2%
39.0%29.1%
39.1%28.5%
0.4%‐2.1%
41.3%28.2%
255 36.4%225 32.1%
700700
At a healthy weight (BMI less than the 85th percentile but at or greater than the 5th percentile) (1)
a.
Overweight (BMI at or above the 85th percentile but less than the 95th percentile)
b.
Underweight (BMI less than the 5th percentile).
c.
Recommended prenatal weight gaina.
Excessive prenatal weight gainb.
Inadequate prenatal weight gainc.
Breastfeeding at 6 weeks of age (1)a.
Breastfeeding at 6 months of ageb.
15.4% 16.8% 18.3% 19.3% 188 1,044 18.0%
3.0% 2.7% 2.1% ‐29.0% 20 1,044 1.9%
2000 2008 Data
2002to
2003
2005to
2006
2008to
% Change from 2000
to 2008
Obese (BMI at or greater than the 95th percentile).
d.
15.0% 18.2% 16.7% 11.8% 175 1,044 16.8%
(2) These data exclude women enrolled in Medicaid only for emergency delivery.
(3) Recommended total prenatal weight gain range by prepregnancy weight category is 28-40 lbs. for underweight women (BMI<18.5); 25-35 lbs. for normal weight women (BMI 18.5 to 24.9); 15-25 lbs. for overweight women (BMI 25 to 29.9); and 11-20 lbs. for obese women (BMI >=30.0): Adapted from the National Academy of Sciences. Weight Gain During Pregnancy: Reexamining the Guidelines. Washington, DC : National Academy Press, 2009.
(1) Item appears also on other WCH Section Agreement Addenda.

Yadkin CountyATTACHMENT A: WIC QUALITY ASSURANCE DELIVERABLES
SFY 20102011 AGREEMENT ADDENDA DATA
Process Outcome Objectives
Percentage of pregnant women enrolled in Medicaid who received prenatal WIC Program services. (1) (2)
Percentage of pregnant women who participated in WIC and received WIC Program services during the first trimester of pregnancy.
Percentage of children less than 12 months of age who were served in the Child Health Clinic and received WIC Program services. (1)
Percentage of children 1 to 5 years of age who were served in the Child Health Clinic and received WIC Program Services. (1)
Percentage of children 1 to 5 years of age enrolled in Medicaid who received WIC Program Services.
Percentage of children less than 12 months of age enrolled in Medicaid who received WIC Program services.
Percentage of postpartum women who participated in WIC during pregnancy and were recertified for WIC by 6 weeks postpartum.
Percentage of women with live term singleton births who received WIC Program services during pregnancy and who gained recommended/excessive/inadequate weight according to the National Academy of Sciences ‐ Institute of Medicine 2009 recommended total weight gain ranges during pregnancy. (3)
Percentage of women who participated in WIC who initiated breastfeeding.
1C.
1A.
2A.
2B.
3A.
3B.
1B.
4B.
5A.
71.9% 72.8%
Num Den Percent
Percentage of children 2 to 4 years of age who received services from the health department and who, according to their Body Mass Index (BMI) for age and gender were:
4A.
Percentage of infants who participated in WIC who were: 5B.
72.5%
57.6%
45.3%
69.2%
98.7%
95.9%
65.3%
35.9%
50.6%
28.4%11.5%
67.8%
55.6%
48.0%
71.5%
98.5%
97.7%
62.0%
36.4%
65.5%
37.5%16.2%
73.4%
73.0%
58.7%
44.8%
77.9%
98.5%
95.8%
64.3%
33.3%
69.2%
43.3%21.8%
2.1%
0.7%
2.0%
‐1.2%
12.6%
‐0.2%
‐0.2%
‐1.5%
‐7.3%
36.8%
52.5%89.2%
167 221 75.6%
264 351 75.2%
850 1,311 64.8%
232 515 45.0%
245 318 77.0%
205 209 98.1%
290 300 96.7%
274 423 64.8%
89 37.6%237
282 405 69.6%
168 376 44.7%89 376 23.7%
45.1%19.0%
49.3%17.4%
9.4%‐8.5%
44.1%19.5%
106 44.7%42 17.7%
237237
At a healthy weight (BMI less than the 85th percentile but at or greater than the 5th percentile) (1)
a.
Overweight (BMI at or above the 85th percentile but less than the 95th percentile)
b.
Underweight (BMI less than the 5th percentile).
c.
Recommended prenatal weight gaina.
Excessive prenatal weight gainb.
Inadequate prenatal weight gainc.
Breastfeeding at 6 weeks of age (1)a.
Breastfeeding at 6 months of ageb.
15.2% 16.5% 16.0% 5.5% 68 423 16.1%
3.5% 2.8% 2.7% ‐21.6% 7 423 1.7%
2000 2008 Data
2002to
2003
2005to
2006
2008to
% Change from 2000
to 2008
Obese (BMI at or greater than the 95th percentile).
d.
16.0% 18.6% 16.9% 5.6% 74 423 17.5%
(2) These data exclude women enrolled in Medicaid only for emergency delivery.
(3) Recommended total prenatal weight gain range by prepregnancy weight category is 28-40 lbs. for underweight women (BMI<18.5); 25-35 lbs. for normal weight women (BMI 18.5 to 24.9); 15-25 lbs. for overweight women (BMI 25 to 29.9); and 11-20 lbs. for obese women (BMI >=30.0): Adapted from the National Academy of Sciences. Weight Gain During Pregnancy: Reexamining the Guidelines. Washington, DC : National Academy Press, 2009.
(1) Item appears also on other WCH Section Agreement Addenda.

Trend Data for the WIC Agreement Addenda SFY 2010-2011
DISTRICT AGENCY DATA

AlleghanyATTACHMENT A: WIC QUALITY ASSURANCE DELIVERABLES
SFY 20102011 AGREEMENT ADDENDA DATA
Process Outcome Objectives
Percentage of pregnant women enrolled in Medicaid who received prenatal WIC Program services. (1) (2)
Percentage of pregnant women who participated in WIC and received WIC Program services during the first trimester of pregnancy.
Percentage of children less than 12 months of age who were served in the Child Health Clinic and received WIC Program services. (1)
Percentage of children 1 to 5 years of age who were served in the Child Health Clinic and received WIC Program Services. (1)
Percentage of children 1 to 5 years of age enrolled in Medicaid who received WIC Program Services.
Percentage of children less than 12 months of age enrolled in Medicaid who received WIC Program services.
Percentage of postpartum women who participated in WIC during pregnancy and were recertified for WIC by 6 weeks postpartum.
Percentage of women with live term singleton births who received WIC Program services during pregnancy and who gained recommended/excessive/inadequate weight according to the National Academy of Sciences ‐ Institute of Medicine 2009 recommended total weight gain ranges during pregnancy. (3)
Percentage of women who participated in WIC who initiated breastfeeding.
1C.
1A.
2A.
2B.
3A.
3B.
1B.
4B.
5A.
84.2% 85.2%
Num Den Percent
Percentage of children 2 to 4 years of age who received services from the health department and who, according to their Body Mass Index (BMI) for age and gender were:
4A.
Percentage of infants who participated in WIC who were: 5B.
76.9%
76.0%
49.5%
66.4%
87.1%
90.0%
69.3%
27.5%
49.0%
25.4%13.4%
76.3%
72.4%
49.8%
74.7%
90.2%
91.5%
59.8%
34.6%
56.5%
15.4%4.3%
74.1%
77.4%
68.5%
46.4%
75.6%
93.7%
89.9%
55.3%
33.8%
65.2%
27.8%15.8%
‐11.9%
0.7%
‐9.9%
‐6.3%
14.0%
7.6%
‐0.1%
‐20.2%
23.2%
33.0%
9.6%18.3%
40 52 76.9%
64 86 74.4%
235 322 73.0%
51 116 44.0%
49 69 71.0%
38 39 97.4%
87 94 92.6%
60 117 51.3%
16 31.4%51
44 84 52.4%
29 113 25.7%16 113 14.2%
42.5%30.1%
49.3%16.9%
16.0%‐43.8%
47.1%18.4%
28 54.9%7 13.7%
5151
At a healthy weight (BMI less than the 85th percentile but at or greater than the 5th percentile) (1)
a.
Overweight (BMI at or above the 85th percentile but less than the 95th percentile)
b.
Underweight (BMI less than the 5th percentile).
c.
Recommended prenatal weight gaina.
Excessive prenatal weight gainb.
Inadequate prenatal weight gainc.
Breastfeeding at 6 weeks of age (1)a.
Breastfeeding at 6 months of ageb.
14.0% 18.4% 18.8% 34.0% 26 117 22.2%
3.9% 1.5% 1.4% ‐63.0% 2 117 1.7%
2000 2008 Data
2002to
2003
2005to
2006
2008to
% Change from 2000
to 2008
Obese (BMI at or greater than the 95th percentile).
d.
12.8% 20.3% 24.5% 90.9% 29 117 24.8%
(2) These data exclude women enrolled in Medicaid only for emergency delivery.
(3) Recommended total prenatal weight gain range by prepregnancy weight category is 28-40 lbs. for underweight women (BMI<18.5); 25-35 lbs. for normal weight women (BMI 18.5 to 24.9); 15-25 lbs. for overweight women (BMI 25 to 29.9); and 11-20 lbs. for obese women (BMI >=30.0): Adapted from the National Academy of Sciences. Weight Gain During Pregnancy: Reexamining the Guidelines. Washington, DC : National Academy Press, 2009.
(1) Item appears also on other WCH Section Agreement Addenda.

AsheATTACHMENT A: WIC QUALITY ASSURANCE DELIVERABLES
SFY 20102011 AGREEMENT ADDENDA DATA
Process Outcome Objectives
Percentage of pregnant women enrolled in Medicaid who received prenatal WIC Program services. (1) (2)
Percentage of pregnant women who participated in WIC and received WIC Program services during the first trimester of pregnancy.
Percentage of children less than 12 months of age who were served in the Child Health Clinic and received WIC Program services. (1)
Percentage of children 1 to 5 years of age who were served in the Child Health Clinic and received WIC Program Services. (1)
Percentage of children 1 to 5 years of age enrolled in Medicaid who received WIC Program Services.
Percentage of children less than 12 months of age enrolled in Medicaid who received WIC Program services.
Percentage of postpartum women who participated in WIC during pregnancy and were recertified for WIC by 6 weeks postpartum.
Percentage of women with live term singleton births who received WIC Program services during pregnancy and who gained recommended/excessive/inadequate weight according to the National Academy of Sciences ‐ Institute of Medicine 2009 recommended total weight gain ranges during pregnancy. (3)
Percentage of women who participated in WIC who initiated breastfeeding.
1C.
1A.
2A.
2B.
3A.
3B.
1B.
4B.
5A.
82.2% 77.6%
Num Den Percent
Percentage of children 2 to 4 years of age who received services from the health department and who, according to their Body Mass Index (BMI) for age and gender were:
4A.
Percentage of infants who participated in WIC who were: 5B.
76.7%
76.7%
62.5%
78.6%
90.5%
83.4%
70.5%
30.6%
45.0%
29.0%13.2%
73.2%
70.3%
52.6%
73.8%
89.9%
81.9%
70.9%
30.3%
48.4%
30.8%13.4%
75.3%
72.8%
62.1%
52.3%
81.0%
93.2%
84.4%
64.5%
31.4%
50.2%
28.8%13.1%
‐8.4%
‐5.1%
‐19.0%
‐16.4%
3.0%
3.0%
1.2%
‐8.5%
2.5%
11.5%
‐0.8%‐1.1%
112 146 76.7%
147 198 74.2%
467 730 64.0%
136 286 47.6%
144 180 80.0%
28 28 100.0%
89 95 93.7%
189 297 63.6%
41 31.1%132
117 218 53.7%
53 188 28.2%25 188 13.3%
44.8%24.6%
45.5%23.1%
1.6%‐6.1%
46.5%23.1%
65 49.2%26 19.7%
132132
At a healthy weight (BMI less than the 85th percentile but at or greater than the 5th percentile) (1)
a.
Overweight (BMI at or above the 85th percentile but less than the 95th percentile)
b.
Underweight (BMI less than the 5th percentile).
c.
Recommended prenatal weight gaina.
Excessive prenatal weight gainb.
Inadequate prenatal weight gainc.
Breastfeeding at 6 weeks of age (1)a.
Breastfeeding at 6 months of ageb.
11.9% 11.3% 14.9% 25.5% 48 297 16.2%
6.1% 6.1% 4.6% ‐24.5% 12 297 4.0%
2000 2008 Data
2002to
2003
2005to
2006
2008to
% Change from 2000
to 2008
Obese (BMI at or greater than the 95th percentile).
d.
11.6% 11.7% 16.0% 38.4% 48 297 16.2%
(2) These data exclude women enrolled in Medicaid only for emergency delivery.
(3) Recommended total prenatal weight gain range by prepregnancy weight category is 28-40 lbs. for underweight women (BMI<18.5); 25-35 lbs. for normal weight women (BMI 18.5 to 24.9); 15-25 lbs. for overweight women (BMI 25 to 29.9); and 11-20 lbs. for obese women (BMI >=30.0): Adapted from the National Academy of Sciences. Weight Gain During Pregnancy: Reexamining the Guidelines. Washington, DC : National Academy Press, 2009.
(1) Item appears also on other WCH Section Agreement Addenda.

AveryATTACHMENT A: WIC QUALITY ASSURANCE DELIVERABLES
SFY 20102011 AGREEMENT ADDENDA DATA
Process Outcome Objectives
Percentage of pregnant women enrolled in Medicaid who received prenatal WIC Program services. (1) (2)
Percentage of pregnant women who participated in WIC and received WIC Program services during the first trimester of pregnancy.
Percentage of children less than 12 months of age who were served in the Child Health Clinic and received WIC Program services. (1)
Percentage of children 1 to 5 years of age who were served in the Child Health Clinic and received WIC Program Services. (1)
Percentage of children 1 to 5 years of age enrolled in Medicaid who received WIC Program Services.
Percentage of children less than 12 months of age enrolled in Medicaid who received WIC Program services.
Percentage of postpartum women who participated in WIC during pregnancy and were recertified for WIC by 6 weeks postpartum.
Percentage of women with live term singleton births who received WIC Program services during pregnancy and who gained recommended/excessive/inadequate weight according to the National Academy of Sciences ‐ Institute of Medicine 2009 recommended total weight gain ranges during pregnancy. (3)
Percentage of women who participated in WIC who initiated breastfeeding.
1C.
1A.
2A.
2B.
3A.
3B.
1B.
4B.
5A.
77.6% 73.0%
Num Den Percent
Percentage of children 2 to 4 years of age who received services from the health department and who, according to their Body Mass Index (BMI) for age and gender were:
4A.
Percentage of infants who participated in WIC who were: 5B.
73.9%
74.9%
50.7%
79.0%
100.0%
90.7%
65.7%
35.9%
59.3%
37.6%21.1%
60.9%
65.8%
46.8%
72.2%
100.0%
83.3%
65.8%
31.4%
56.9%
38.3%28.2%
73.6%
65.5%
60.3%
46.7%
68.6%
93.2%
86.5%
62.4%
30.1%
55.2%
32.5%22.8%
‐5.2%
‐11.3%
‐19.5%
‐7.8%
‐13.1%
‐6.8%
‐4.6%
‐5.0%
‐16.1%
‐6.9%
‐13.6%8.2%
54 85 63.5%
81 117 69.2%
302 466 64.8%
102 213 47.9%
87 115 75.7%
25 26 96.2%
32 37 86.5%
136 191 71.2%
23 30.7%75
95 152 62.5%
80 196 40.8%56 196 28.6%
44.0%20.2%
46.5%23.4%
5.7%16.2%
45.0%23.6%
39 52.0%13 17.3%
7575
At a healthy weight (BMI less than the 85th percentile but at or greater than the 5th percentile) (1)
a.
Overweight (BMI at or above the 85th percentile but less than the 95th percentile)
b.
Underweight (BMI less than the 5th percentile).
c.
Recommended prenatal weight gaina.
Excessive prenatal weight gainb.
Inadequate prenatal weight gainc.
Breastfeeding at 6 weeks of age (1)a.
Breastfeeding at 6 months of ageb.
17.3% 15.6% 18.8% 8.5% 26 191 13.6%
2.3% 1.4% 3.0% 26.9% 7 191 3.7%
2000 2008 Data
2002to
2003
2005to
2006
2008to
% Change from 2000
to 2008
Obese (BMI at or greater than the 95th percentile).
d.
14.7% 17.2% 15.9% 8.1% 22 191 11.5%
(2) These data exclude women enrolled in Medicaid only for emergency delivery.
(3) Recommended total prenatal weight gain range by prepregnancy weight category is 28-40 lbs. for underweight women (BMI<18.5); 25-35 lbs. for normal weight women (BMI 18.5 to 24.9); 15-25 lbs. for overweight women (BMI 25 to 29.9); and 11-20 lbs. for obese women (BMI >=30.0): Adapted from the National Academy of Sciences. Weight Gain During Pregnancy: Reexamining the Guidelines. Washington, DC : National Academy Press, 2009.
(1) Item appears also on other WCH Section Agreement Addenda.

BertieATTACHMENT A: WIC QUALITY ASSURANCE DELIVERABLES
SFY 20102011 AGREEMENT ADDENDA DATA
Process Outcome Objectives
Percentage of pregnant women enrolled in Medicaid who received prenatal WIC Program services. (1) (2)
Percentage of pregnant women who participated in WIC and received WIC Program services during the first trimester of pregnancy.
Percentage of children less than 12 months of age who were served in the Child Health Clinic and received WIC Program services. (1)
Percentage of children 1 to 5 years of age who were served in the Child Health Clinic and received WIC Program Services. (1)
Percentage of children 1 to 5 years of age enrolled in Medicaid who received WIC Program Services.
Percentage of children less than 12 months of age enrolled in Medicaid who received WIC Program services.
Percentage of postpartum women who participated in WIC during pregnancy and were recertified for WIC by 6 weeks postpartum.
Percentage of women with live term singleton births who received WIC Program services during pregnancy and who gained recommended/excessive/inadequate weight according to the National Academy of Sciences ‐ Institute of Medicine 2009 recommended total weight gain ranges during pregnancy. (3)
Percentage of women who participated in WIC who initiated breastfeeding.
1C.
1A.
2A.
2B.
3A.
3B.
1B.
4B.
5A.
86.5% 82.0%
Num Den Percent
Percentage of children 2 to 4 years of age who received services from the health department and who, according to their Body Mass Index (BMI) for age and gender were:
4A.
Percentage of infants who participated in WIC who were: 5B.
74.8%
72.3%
42.2%
75.1%
90.0%
90.5%
66.2%
29.7%
19.3%
11.9%5.5%
73.0%
66.0%
39.2%
47.4%
63.5%
71.2%
64.3%
26.0%
26.5%
8.4%2.9%
82.6%
72.3%
61.3%
28.3%
27.0%
39.2%
45.6%
63.1%
29.0%
13.2%
6.6%2.4%
‐4.6%
‐3.4%
‐15.1%
‐33.0%
‐64.1%
‐56.4%
‐49.6%
‐4.7%
‐2.2%
‐31.8%
‐44.4%‐56.8%
158 197 80.2%
152 215 70.7%
433 706 61.3%
82 342 24.0%
48 192 25.0%
3 9 33.3%
34 93 36.6%
205 337 60.8%
50 28.6%175
26 221 11.8%
14 215 6.5%2 215 0.9%
43.0%27.3%
45.6%25.4%
6.1%‐7.3%
51.1%23.0%
77 44.0%48 27.4%
175175
At a healthy weight (BMI less than the 85th percentile but at or greater than the 5th percentile) (1)
a.
Overweight (BMI at or above the 85th percentile but less than the 95th percentile)
b.
Underweight (BMI less than the 5th percentile).
c.
Recommended prenatal weight gaina.
Excessive prenatal weight gainb.
Inadequate prenatal weight gainc.
Breastfeeding at 6 weeks of age (1)a.
Breastfeeding at 6 months of ageb.
12.7% 13.0% 14.0% 10.0% 52 337 15.4%
6.2% 7.5% 5.9% ‐5.1% 20 337 5.9%
2000 2008 Data
2002to
2003
2005to
2006
2008to
% Change from 2000
to 2008
Obese (BMI at or greater than the 95th percentile).
d.
14.9% 15.3% 17.1% 14.5% 60 337 17.8%
(2) These data exclude women enrolled in Medicaid only for emergency delivery.
(3) Recommended total prenatal weight gain range by prepregnancy weight category is 28-40 lbs. for underweight women (BMI<18.5); 25-35 lbs. for normal weight women (BMI 18.5 to 24.9); 15-25 lbs. for overweight women (BMI 25 to 29.9); and 11-20 lbs. for obese women (BMI >=30.0): Adapted from the National Academy of Sciences. Weight Gain During Pregnancy: Reexamining the Guidelines. Washington, DC : National Academy Press, 2009.
(1) Item appears also on other WCH Section Agreement Addenda.

CamdenATTACHMENT A: WIC QUALITY ASSURANCE DELIVERABLES
SFY 20102011 AGREEMENT ADDENDA DATA
Process Outcome Objectives
Percentage of pregnant women enrolled in Medicaid who received prenatal WIC Program services. (1) (2)
Percentage of pregnant women who participated in WIC and received WIC Program services during the first trimester of pregnancy.
Percentage of children less than 12 months of age who were served in the Child Health Clinic and received WIC Program services. (1)
Percentage of children 1 to 5 years of age who were served in the Child Health Clinic and received WIC Program Services. (1)
Percentage of children 1 to 5 years of age enrolled in Medicaid who received WIC Program Services.
Percentage of children less than 12 months of age enrolled in Medicaid who received WIC Program services.
Percentage of postpartum women who participated in WIC during pregnancy and were recertified for WIC by 6 weeks postpartum.
Percentage of women with live term singleton births who received WIC Program services during pregnancy and who gained recommended/excessive/inadequate weight according to the National Academy of Sciences ‐ Institute of Medicine 2009 recommended total weight gain ranges during pregnancy. (3)
Percentage of women who participated in WIC who initiated breastfeeding.
1C.
1A.
2A.
2B.
3A.
3B.
1B.
4B.
5A.
75.4% 80.0%
Num Den Percent
Percentage of children 2 to 4 years of age who received services from the health department and who, according to their Body Mass Index (BMI) for age and gender were:
4A.
Percentage of infants who participated in WIC who were: 5B.
73.6%
69.3%
38.7%
52.3%
80.0%
64.5%
77.4%
35.1%
29.0%
14.1%5.8%
69.0%
60.2%
39.2%
34.6%
63.6%
64.4%
68.6%
36.8%
24.7%
9.7%3.9%
78.3%
75.8%
56.9%
35.4%
38.2%
81.8%
53.8%
69.7%
30.4%
21.2%
9.9%3.5%
3.8%
3.0%
‐17.9%
‐8.6%
‐26.9%
2.3%
‐16.5%
‐9.9%
‐13.2%
‐27.0%
‐30.2%‐39.2%
25 29 86.2%
31 41 75.6%
89 137 65.0%
564 1,485 38.0%
311 730 42.6%
2 3 66.7%
10 28 35.7%
74 116 63.8%
7 23.3%30
248 943 26.3%
107 936 11.4%39 936 4.2%
42.9%22.1%
42.4%27.2%
‐1.1%23.1%
39.1%24.1%
16 53.3%7 23.3%
3030
At a healthy weight (BMI less than the 85th percentile but at or greater than the 5th percentile) (1)
a.
Overweight (BMI at or above the 85th percentile but less than the 95th percentile)
b.
Underweight (BMI less than the 5th percentile).
c.
Recommended prenatal weight gaina.
Excessive prenatal weight gainb.
Inadequate prenatal weight gainc.
Breastfeeding at 6 weeks of age (1)a.
Breastfeeding at 6 months of ageb.
3.7% 6.5% 6.3% 69.7% 13 116 11.2%
13.2% 17.0% 11.1% ‐15.4% 8 116 6.9%
2000 2008 Data
2002to
2003
2005to
2006
2008to
% Change from 2000
to 2008
Obese (BMI at or greater than the 95th percentile).
d.
5.8% 7.9% 12.9% 123.2% 21 116 18.1%
(2) These data exclude women enrolled in Medicaid only for emergency delivery.
(3) Recommended total prenatal weight gain range by prepregnancy weight category is 28-40 lbs. for underweight women (BMI<18.5); 25-35 lbs. for normal weight women (BMI 18.5 to 24.9); 15-25 lbs. for overweight women (BMI 25 to 29.9); and 11-20 lbs. for obese women (BMI >=30.0): Adapted from the National Academy of Sciences. Weight Gain During Pregnancy: Reexamining the Guidelines. Washington, DC : National Academy Press, 2009.
(1) Item appears also on other WCH Section Agreement Addenda.

ChowanATTACHMENT A: WIC QUALITY ASSURANCE DELIVERABLES
SFY 20102011 AGREEMENT ADDENDA DATA
Process Outcome Objectives
Percentage of pregnant women enrolled in Medicaid who received prenatal WIC Program services. (1) (2)
Percentage of pregnant women who participated in WIC and received WIC Program services during the first trimester of pregnancy.
Percentage of children less than 12 months of age who were served in the Child Health Clinic and received WIC Program services. (1)
Percentage of children 1 to 5 years of age who were served in the Child Health Clinic and received WIC Program Services. (1)
Percentage of children 1 to 5 years of age enrolled in Medicaid who received WIC Program Services.
Percentage of children less than 12 months of age enrolled in Medicaid who received WIC Program services.
Percentage of postpartum women who participated in WIC during pregnancy and were recertified for WIC by 6 weeks postpartum.
Percentage of women with live term singleton births who received WIC Program services during pregnancy and who gained recommended/excessive/inadequate weight according to the National Academy of Sciences ‐ Institute of Medicine 2009 recommended total weight gain ranges during pregnancy. (3)
Percentage of women who participated in WIC who initiated breastfeeding.
1C.
1A.
2A.
2B.
3A.
3B.
1B.
4B.
5A.
83.9% 82.0%
Num Den Percent
Percentage of children 2 to 4 years of age who received services from the health department and who, according to their Body Mass Index (BMI) for age and gender were:
4A.
Percentage of infants who participated in WIC who were: 5B.
85.4%
70.6%
38.7%
52.3%
90.0%
62.4%
65.8%
34.8%
29.0%
14.1%5.8%
83.2%
67.5%
39.2%
34.6%
88.9%
84.7%
63.7%
33.3%
24.7%
9.7%3.9%
81.0%
84.0%
65.2%
35.4%
38.2%
75.4%
85.4%
65.6%
34.7%
21.2%
9.9%3.5%
‐3.5%
‐1.6%
‐7.7%
‐8.6%
‐26.9%
‐16.3%
36.8%
‐0.3%
‐0.3%
‐27.0%
‐30.2%‐39.2%
78 97 80.4%
101 121 83.5%
332 478 69.5%
564 1,485 38.0%
311 730 42.6%
8 9 88.9%
65 72 90.3%
142 217 65.4%
28 32.2%87
248 943 26.3%
107 936 11.4%39 936 4.2%
40.9%24.3%
43.6%21.6%
6.8%‐11.0%
41.4%25.3%
37 42.5%22 25.3%
8787
At a healthy weight (BMI less than the 85th percentile but at or greater than the 5th percentile) (1)
a.
Overweight (BMI at or above the 85th percentile but less than the 95th percentile)
b.
Underweight (BMI less than the 5th percentile).
c.
Recommended prenatal weight gaina.
Excessive prenatal weight gainb.
Inadequate prenatal weight gainc.
Breastfeeding at 6 weeks of age (1)a.
Breastfeeding at 6 months of ageb.
13.9% 17.9% 15.2% 9.7% 33 217 15.2%
6.0% 1.6% 3.5% ‐41.2% 10 217 4.6%
2000 2008 Data
2002to
2003
2005to
2006
2008to
% Change from 2000
to 2008
Obese (BMI at or greater than the 95th percentile).
d.
14.3% 16.7% 15.6% 9.0% 32 217 14.7%
(2) These data exclude women enrolled in Medicaid only for emergency delivery.
(3) Recommended total prenatal weight gain range by prepregnancy weight category is 28-40 lbs. for underweight women (BMI<18.5); 25-35 lbs. for normal weight women (BMI 18.5 to 24.9); 15-25 lbs. for overweight women (BMI 25 to 29.9); and 11-20 lbs. for obese women (BMI >=30.0): Adapted from the National Academy of Sciences. Weight Gain During Pregnancy: Reexamining the Guidelines. Washington, DC : National Academy Press, 2009.
(1) Item appears also on other WCH Section Agreement Addenda.

CurrituckATTACHMENT A: WIC QUALITY ASSURANCE DELIVERABLES
SFY 20102011 AGREEMENT ADDENDA DATA
Process Outcome Objectives
Percentage of pregnant women enrolled in Medicaid who received prenatal WIC Program services. (1) (2)
Percentage of pregnant women who participated in WIC and received WIC Program services during the first trimester of pregnancy.
Percentage of children less than 12 months of age who were served in the Child Health Clinic and received WIC Program services. (1)
Percentage of children 1 to 5 years of age who were served in the Child Health Clinic and received WIC Program Services. (1)
Percentage of children 1 to 5 years of age enrolled in Medicaid who received WIC Program Services.
Percentage of children less than 12 months of age enrolled in Medicaid who received WIC Program services.
Percentage of postpartum women who participated in WIC during pregnancy and were recertified for WIC by 6 weeks postpartum.
Percentage of women with live term singleton births who received WIC Program services during pregnancy and who gained recommended/excessive/inadequate weight according to the National Academy of Sciences ‐ Institute of Medicine 2009 recommended total weight gain ranges during pregnancy. (3)
Percentage of women who participated in WIC who initiated breastfeeding.
1C.
1A.
2A.
2B.
3A.
3B.
1B.
4B.
5A.
77.5% 78.1%
Num Den Percent
Percentage of children 2 to 4 years of age who received services from the health department and who, according to their Body Mass Index (BMI) for age and gender were:
4A.
Percentage of infants who participated in WIC who were: 5B.
75.2%
67.6%
38.7%
52.3%
91.2%
65.9%
63.5%
32.9%
29.0%
14.1%5.8%
75.5%
56.5%
39.2%
34.6%
89.3%
83.6%
67.0%
36.8%
24.7%
9.7%3.9%
71.9%
67.0%
51.3%
35.4%
38.2%
82.7%
81.9%
65.5%
27.7%
21.2%
9.9%3.5%
‐7.2%
‐10.8%
‐24.1%
‐8.6%
‐26.9%
‐9.3%
24.2%
3.1%
‐15.9%
‐27.0%
‐30.2%‐39.2%
48 65 73.8%
74 108 68.5%
256 483 53.0%
564 1,485 38.0%
311 730 42.6%
11 11 100.0%
30 38 78.9%
111 177 62.7%
18 34.6%52
248 943 26.3%
107 936 11.4%39 936 4.2%
50.3%16.8%
50.3%22.0%
0.0%31.2%
45.8%17.4%
17 32.7%17 32.7%
5252
At a healthy weight (BMI less than the 85th percentile but at or greater than the 5th percentile) (1)
a.
Overweight (BMI at or above the 85th percentile but less than the 95th percentile)
b.
Underweight (BMI less than the 5th percentile).
c.
Recommended prenatal weight gaina.
Excessive prenatal weight gainb.
Inadequate prenatal weight gainc.
Breastfeeding at 6 weeks of age (1)a.
Breastfeeding at 6 months of ageb.
19.3% 16.9% 15.4% ‐20.2% 28 177 15.8%
3.7% 2.7% 3.1% ‐17.4% 5 177 2.8%
2000 2008 Data
2002to
2003
2005to
2006
2008to
% Change from 2000
to 2008
Obese (BMI at or greater than the 95th percentile).
d.
13.5% 13.4% 16.0% 19.3% 33 177 18.6%
(2) These data exclude women enrolled in Medicaid only for emergency delivery.
(3) Recommended total prenatal weight gain range by prepregnancy weight category is 28-40 lbs. for underweight women (BMI<18.5); 25-35 lbs. for normal weight women (BMI 18.5 to 24.9); 15-25 lbs. for overweight women (BMI 25 to 29.9); and 11-20 lbs. for obese women (BMI >=30.0): Adapted from the National Academy of Sciences. Weight Gain During Pregnancy: Reexamining the Guidelines. Washington, DC : National Academy Press, 2009.
(1) Item appears also on other WCH Section Agreement Addenda.

GatesATTACHMENT A: WIC QUALITY ASSURANCE DELIVERABLES
SFY 20102011 AGREEMENT ADDENDA DATA
Process Outcome Objectives
Percentage of pregnant women enrolled in Medicaid who received prenatal WIC Program services. (1) (2)
Percentage of pregnant women who participated in WIC and received WIC Program services during the first trimester of pregnancy.
Percentage of children less than 12 months of age who were served in the Child Health Clinic and received WIC Program services. (1)
Percentage of children 1 to 5 years of age who were served in the Child Health Clinic and received WIC Program Services. (1)
Percentage of children 1 to 5 years of age enrolled in Medicaid who received WIC Program Services.
Percentage of children less than 12 months of age enrolled in Medicaid who received WIC Program services.
Percentage of postpartum women who participated in WIC during pregnancy and were recertified for WIC by 6 weeks postpartum.
Percentage of women with live term singleton births who received WIC Program services during pregnancy and who gained recommended/excessive/inadequate weight according to the National Academy of Sciences ‐ Institute of Medicine 2009 recommended total weight gain ranges during pregnancy. (3)
Percentage of women who participated in WIC who initiated breastfeeding.
1C.
1A.
2A.
2B.
3A.
3B.
1B.
4B.
5A.
82.1% 81.1%
Num Den Percent
Percentage of children 2 to 4 years of age who received services from the health department and who, according to their Body Mass Index (BMI) for age and gender were:
4A.
Percentage of infants who participated in WIC who were: 5B.
75.7%
67.5%
28.3%
80.3%
94.9%
91.7%
64.9%
30.1%
25.9%
12.9%4.3%
73.4%
59.8%
28.4%
45.4%
86.7%
85.1%
63.7%
28.8%
29.8%
12.2%5.7%
80.0%
73.7%
60.6%
28.0%
57.9%
92.3%
90.6%
65.1%
37.7%
30.7%
10.6%3.2%
‐2.6%
‐2.7%
‐10.3%
‐1.1%
‐27.9%
‐2.7%
‐1.3%
0.3%
25.0%
18.5%
‐17.7%‐24.6%
14 20 70.0%
54 71 76.1%
206 326 63.2%
21 90 23.3%
49 67 73.1%
4 4 100.0%
43 46 93.5%
90 140 64.3%
9 42.9%21
22 82 26.8%
14 104 13.5%3 104 2.9%
41.1%28.8%
46.8%15.6%
13.8%‐45.8%
41.3%30.0%
10 47.6%2 9.5%
2121
At a healthy weight (BMI less than the 85th percentile but at or greater than the 5th percentile) (1)
a.
Overweight (BMI at or above the 85th percentile but less than the 95th percentile)
b.
Underweight (BMI less than the 5th percentile).
c.
Recommended prenatal weight gaina.
Excessive prenatal weight gainb.
Inadequate prenatal weight gainc.
Breastfeeding at 6 weeks of age (1)a.
Breastfeeding at 6 months of ageb.
17.1% 16.6% 14.1% ‐17.6% 20 140 14.3%
3.9% 3.9% 3.7% ‐3.1% 4 140 2.9%
2000 2008 Data
2002to
2003
2005to
2006
2008to
% Change from 2000
to 2008
Obese (BMI at or greater than the 95th percentile).
d.
14.1% 15.7% 17.0% 20.7% 26 140 18.6%
(2) These data exclude women enrolled in Medicaid only for emergency delivery.
(3) Recommended total prenatal weight gain range by prepregnancy weight category is 28-40 lbs. for underweight women (BMI<18.5); 25-35 lbs. for normal weight women (BMI 18.5 to 24.9); 15-25 lbs. for overweight women (BMI 25 to 29.9); and 11-20 lbs. for obese women (BMI >=30.0): Adapted from the National Academy of Sciences. Weight Gain During Pregnancy: Reexamining the Guidelines. Washington, DC : National Academy Press, 2009.
(1) Item appears also on other WCH Section Agreement Addenda.

GranvilleATTACHMENT A: WIC QUALITY ASSURANCE DELIVERABLES
SFY 20102011 AGREEMENT ADDENDA DATA
Process Outcome Objectives
Percentage of pregnant women enrolled in Medicaid who received prenatal WIC Program services. (1) (2)
Percentage of pregnant women who participated in WIC and received WIC Program services during the first trimester of pregnancy.
Percentage of children less than 12 months of age who were served in the Child Health Clinic and received WIC Program services. (1)
Percentage of children 1 to 5 years of age who were served in the Child Health Clinic and received WIC Program Services. (1)
Percentage of children 1 to 5 years of age enrolled in Medicaid who received WIC Program Services.
Percentage of children less than 12 months of age enrolled in Medicaid who received WIC Program services.
Percentage of postpartum women who participated in WIC during pregnancy and were recertified for WIC by 6 weeks postpartum.
Percentage of women with live term singleton births who received WIC Program services during pregnancy and who gained recommended/excessive/inadequate weight according to the National Academy of Sciences ‐ Institute of Medicine 2009 recommended total weight gain ranges during pregnancy. (3)
Percentage of women who participated in WIC who initiated breastfeeding.
1C.
1A.
2A.
2B.
3A.
3B.
1B.
4B.
5A.
78.3% 78.1%
Num Den Percent
Percentage of children 2 to 4 years of age who received services from the health department and who, according to their Body Mass Index (BMI) for age and gender were:
4A.
Percentage of infants who participated in WIC who were: 5B.
76.5%
63.9%
36.7%
78.5%
93.8%
94.2%
64.1%
31.5%
47.9%
26.9%18.3%
78.7%
61.0%
32.6%
81.7%
92.6%
93.1%
61.2%
27.3%
43.3%
28.7%20.9%
73.4%
74.8%
58.1%
32.7%
77.8%
93.0%
90.1%
63.0%
31.0%
52.9%
34.5%22.5%
‐6.2%
‐2.2%
‐9.1%
‐10.8%
‐0.9%
‐0.8%
‐4.3%
‐1.6%
‐1.6%
10.5%
27.9%22.9%
202 268 75.4%
278 372 74.7%
940 1,547 60.8%
495 1,426 34.7%
626 822 76.2%
30 31 96.8%
119 133 89.5%
370 611 60.6%
86 27.7%310
587 1,025 57.3%
480 1,069 44.9%317 1,069 29.7%
42.1%26.4%
44.4%24.6%
5.6%‐7.0%
37.4%35.3%
154 49.7%70 22.6%
310310
At a healthy weight (BMI less than the 85th percentile but at or greater than the 5th percentile) (1)
a.
Overweight (BMI at or above the 85th percentile but less than the 95th percentile)
b.
Underweight (BMI less than the 5th percentile).
c.
Recommended prenatal weight gaina.
Excessive prenatal weight gainb.
Inadequate prenatal weight gainc.
Breastfeeding at 6 weeks of age (1)a.
Breastfeeding at 6 months of ageb.
16.5% 18.2% 18.2% 9.9% 123 611 20.1%
3.6% 3.9% 2.6% ‐28.7% 11 611 1.8%
2000 2008 Data
2002to
2003
2005to
2006
2008to
% Change from 2000
to 2008
Obese (BMI at or greater than the 95th percentile).
d.
15.8% 16.8% 16.3% 2.9% 107 611 17.5%
(2) These data exclude women enrolled in Medicaid only for emergency delivery.
(3) Recommended total prenatal weight gain range by prepregnancy weight category is 28-40 lbs. for underweight women (BMI<18.5); 25-35 lbs. for normal weight women (BMI 18.5 to 24.9); 15-25 lbs. for overweight women (BMI 25 to 29.9); and 11-20 lbs. for obese women (BMI >=30.0): Adapted from the National Academy of Sciences. Weight Gain During Pregnancy: Reexamining the Guidelines. Washington, DC : National Academy Press, 2009.
(1) Item appears also on other WCH Section Agreement Addenda.

MartinATTACHMENT A: WIC QUALITY ASSURANCE DELIVERABLES
SFY 20102011 AGREEMENT ADDENDA DATA
Process Outcome Objectives
Percentage of pregnant women enrolled in Medicaid who received prenatal WIC Program services. (1) (2)
Percentage of pregnant women who participated in WIC and received WIC Program services during the first trimester of pregnancy.
Percentage of children less than 12 months of age who were served in the Child Health Clinic and received WIC Program services. (1)
Percentage of children 1 to 5 years of age who were served in the Child Health Clinic and received WIC Program Services. (1)
Percentage of children 1 to 5 years of age enrolled in Medicaid who received WIC Program Services.
Percentage of children less than 12 months of age enrolled in Medicaid who received WIC Program services.
Percentage of postpartum women who participated in WIC during pregnancy and were recertified for WIC by 6 weeks postpartum.
Percentage of women with live term singleton births who received WIC Program services during pregnancy and who gained recommended/excessive/inadequate weight according to the National Academy of Sciences ‐ Institute of Medicine 2009 recommended total weight gain ranges during pregnancy. (3)
Percentage of women who participated in WIC who initiated breastfeeding.
1C.
1A.
2A.
2B.
3A.
3B.
1B.
4B.
5A.
81.9% 75.9%
Num Den Percent
Percentage of children 2 to 4 years of age who received services from the health department and who, according to their Body Mass Index (BMI) for age and gender were:
4A.
Percentage of infants who participated in WIC who were: 5B.
80.0%
61.9%
41.1%
77.5%
92.1%
94.7%
68.0%
32.0%
31.5%
16.0%8.4%
74.7%
61.7%
37.4%
79.1%
91.1%
92.0%
64.4%
31.5%
41.3%
24.6%11.9%
81.8%
68.0%
56.6%
32.3%
82.0%
92.7%
90.1%
64.4%
31.5%
38.1%
23.3%11.4%
‐0.1%
‐15.0%
‐8.6%
‐21.3%
5.8%
0.6%
‐4.8%
‐5.3%
‐1.7%
20.8%
45.2%35.7%
177 211 83.9%
175 265 66.0%
549 919 59.7%
292 859 34.0%
321 384 83.6%
21 22 95.5%
126 134 94.0%
227 361 62.9%
63 34.1%185
170 456 37.3%
105 505 20.8%51 505 10.1%
41.2%26.8%
41.4%27.2%
0.4%1.4%
41.6%26.9%
73 39.5%49 26.5%
185185
At a healthy weight (BMI less than the 85th percentile but at or greater than the 5th percentile) (1)
a.
Overweight (BMI at or above the 85th percentile but less than the 95th percentile)
b.
Underweight (BMI less than the 5th percentile).
c.
Recommended prenatal weight gaina.
Excessive prenatal weight gainb.
Inadequate prenatal weight gainc.
Breastfeeding at 6 weeks of age (1)a.
Breastfeeding at 6 months of ageb.
13.5% 14.8% 16.2% 20.2% 56 361 15.5%
5.3% 6.5% 3.9% ‐26.8% 16 361 4.4%
2000 2008 Data
2002to
2003
2005to
2006
2008to
% Change from 2000
to 2008
Obese (BMI at or greater than the 95th percentile).
d.
13.2% 14.3% 15.5% 17.6% 62 361 17.2%
(2) These data exclude women enrolled in Medicaid only for emergency delivery.
(3) Recommended total prenatal weight gain range by prepregnancy weight category is 28-40 lbs. for underweight women (BMI<18.5); 25-35 lbs. for normal weight women (BMI 18.5 to 24.9); 15-25 lbs. for overweight women (BMI 25 to 29.9); and 11-20 lbs. for obese women (BMI >=30.0): Adapted from the National Academy of Sciences. Weight Gain During Pregnancy: Reexamining the Guidelines. Washington, DC : National Academy Press, 2009.
(1) Item appears also on other WCH Section Agreement Addenda.

McDowellATTACHMENT A: WIC QUALITY ASSURANCE DELIVERABLES
SFY 20102011 AGREEMENT ADDENDA DATA
Process Outcome Objectives
Percentage of pregnant women enrolled in Medicaid who received prenatal WIC Program services. (1) (2)
Percentage of pregnant women who participated in WIC and received WIC Program services during the first trimester of pregnancy.
Percentage of children less than 12 months of age who were served in the Child Health Clinic and received WIC Program services. (1)
Percentage of children 1 to 5 years of age who were served in the Child Health Clinic and received WIC Program Services. (1)
Percentage of children 1 to 5 years of age enrolled in Medicaid who received WIC Program Services.
Percentage of children less than 12 months of age enrolled in Medicaid who received WIC Program services.
Percentage of postpartum women who participated in WIC during pregnancy and were recertified for WIC by 6 weeks postpartum.
Percentage of women with live term singleton births who received WIC Program services during pregnancy and who gained recommended/excessive/inadequate weight according to the National Academy of Sciences ‐ Institute of Medicine 2009 recommended total weight gain ranges during pregnancy. (3)
Percentage of women who participated in WIC who initiated breastfeeding.
1C.
1A.
2A.
2B.
3A.
3B.
1B.
4B.
5A.
76.6% 66.3%
Num Den Percent
Percentage of children 2 to 4 years of age who received services from the health department and who, according to their Body Mass Index (BMI) for age and gender were:
4A.
Percentage of infants who participated in WIC who were: 5B.
74.4%
67.3%
32.8%
74.6%
96.3%
91.0%
69.5%
33.2%
40.4%
25.4%11.5%
70.9%
64.8%
32.5%
69.9%
85.7%
87.6%
68.6%
35.4%
46.4%
28.1%14.7%
73.5%
73.7%
62.7%
35.2%
72.4%
100.0%
86.2%
68.0%
29.5%
54.4%
31.1%14.5%
‐4.0%
‐1.1%
‐6.8%
7.5%
‐3.0%
3.8%
‐5.3%
‐2.1%
‐11.3%
34.8%
22.7%26.4%
227 305 74.4%
312 411 75.9%
992 1,523 65.1%
843 2,282 36.9%
796 1,087 73.2%
3 3 100.0%
54 67 80.6%
422 603 70.0%
85 28.2%301
697 1,258 55.4%
360 1,196 30.1%163 1,196 13.6%
39.6%27.1%
41.1%29.4%
3.8%8.3%
34.1%30.5%
143 47.5%73 24.3%
301301
At a healthy weight (BMI less than the 85th percentile but at or greater than the 5th percentile) (1)
a.
Overweight (BMI at or above the 85th percentile but less than the 95th percentile)
b.
Underweight (BMI less than the 5th percentile).
c.
Recommended prenatal weight gaina.
Excessive prenatal weight gainb.
Inadequate prenatal weight gainc.
Breastfeeding at 6 weeks of age (1)a.
Breastfeeding at 6 months of ageb.
14.1% 14.0% 15.6% 10.5% 89 603 14.8%
4.6% 5.0% 3.3% ‐29.0% 14 603 2.3%
2000 2008 Data
2002to
2003
2005to
2006
2008to
% Change from 2000
to 2008
Obese (BMI at or greater than the 95th percentile).
d.
11.8% 12.4% 13.1% 11.3% 78 603 12.9%
(2) These data exclude women enrolled in Medicaid only for emergency delivery.
(3) Recommended total prenatal weight gain range by prepregnancy weight category is 28-40 lbs. for underweight women (BMI<18.5); 25-35 lbs. for normal weight women (BMI 18.5 to 24.9); 15-25 lbs. for overweight women (BMI 25 to 29.9); and 11-20 lbs. for obese women (BMI >=30.0): Adapted from the National Academy of Sciences. Weight Gain During Pregnancy: Reexamining the Guidelines. Washington, DC : National Academy Press, 2009.
(1) Item appears also on other WCH Section Agreement Addenda.

MitchellATTACHMENT A: WIC QUALITY ASSURANCE DELIVERABLES
SFY 20102011 AGREEMENT ADDENDA DATA
Process Outcome Objectives
Percentage of pregnant women enrolled in Medicaid who received prenatal WIC Program services. (1) (2)
Percentage of pregnant women who participated in WIC and received WIC Program services during the first trimester of pregnancy.
Percentage of children less than 12 months of age who were served in the Child Health Clinic and received WIC Program services. (1)
Percentage of children 1 to 5 years of age who were served in the Child Health Clinic and received WIC Program Services. (1)
Percentage of children 1 to 5 years of age enrolled in Medicaid who received WIC Program Services.
Percentage of children less than 12 months of age enrolled in Medicaid who received WIC Program services.
Percentage of postpartum women who participated in WIC during pregnancy and were recertified for WIC by 6 weeks postpartum.
Percentage of women with live term singleton births who received WIC Program services during pregnancy and who gained recommended/excessive/inadequate weight according to the National Academy of Sciences ‐ Institute of Medicine 2009 recommended total weight gain ranges during pregnancy. (3)
Percentage of women who participated in WIC who initiated breastfeeding.
1C.
1A.
2A.
2B.
3A.
3B.
1B.
4B.
5A.
78.9% 77.5%
Num Den Percent
Percentage of children 2 to 4 years of age who received services from the health department and who, according to their Body Mass Index (BMI) for age and gender were:
4A.
Percentage of infants who participated in WIC who were: 5B.
74.1%
78.0%
45.7%
73.1%
91.4%
83.7%
71.9%
33.8%
57.7%
38.5%22.2%
67.0%
72.8%
38.1%
70.9%
96.8%
92.8%
69.1%
37.6%
53.0%
43.5%24.8%
75.6%
63.3%
60.8%
41.9%
72.4%
75.0%
97.1%
71.2%
35.6%
63.8%
42.5%25.8%
‐4.2%
‐14.6%
‐22.1%
‐8.2%
‐1.0%
‐18.0%
16.0%
‐1.0%
5.3%
10.6%
10.5%16.1%
67 96 69.8%
84 133 63.2%
287 474 60.5%
85 212 40.1%
95 127 74.8%
8 8 100.0%
113 156 72.4%
26 30.6%85
113 158 71.5%
64 132 48.5%35 132 26.5%
44.9%21.3%
45.6%18.8%
1.6%‐11.7%
41.3%21.1%
39 45.9%20 23.5%
8585
At a healthy weight (BMI less than the 85th percentile but at or greater than the 5th percentile) (1)
a.
Overweight (BMI at or above the 85th percentile but less than the 95th percentile)
b.
Underweight (BMI less than the 5th percentile).
c.
Recommended prenatal weight gaina.
Excessive prenatal weight gainb.
Inadequate prenatal weight gainc.
Breastfeeding at 6 weeks of age (1)a.
Breastfeeding at 6 months of ageb.
13.7% 12.6% 12.6% ‐8.2% 17 156 10.9%
5.2% 3.4% 4.5% ‐14.1% 5 156 3.2%
2000 2008 Data
2002to
2003
2005to
2006
2008to
% Change from 2000
to 2008
Obese (BMI at or greater than the 95th percentile).
d.
9.1% 14.9% 11.7% 28.3% 21 156 13.5%
(2) These data exclude women enrolled in Medicaid only for emergency delivery.
(3) Recommended total prenatal weight gain range by prepregnancy weight category is 28-40 lbs. for underweight women (BMI<18.5); 25-35 lbs. for normal weight women (BMI 18.5 to 24.9); 15-25 lbs. for overweight women (BMI 25 to 29.9); and 11-20 lbs. for obese women (BMI >=30.0): Adapted from the National Academy of Sciences. Weight Gain During Pregnancy: Reexamining the Guidelines. Washington, DC : National Academy Press, 2009.
(1) Item appears also on other WCH Section Agreement Addenda.

PasquotankATTACHMENT A: WIC QUALITY ASSURANCE DELIVERABLES
SFY 20102011 AGREEMENT ADDENDA DATA
Process Outcome Objectives
Percentage of pregnant women enrolled in Medicaid who received prenatal WIC Program services. (1) (2)
Percentage of pregnant women who participated in WIC and received WIC Program services during the first trimester of pregnancy.
Percentage of children less than 12 months of age who were served in the Child Health Clinic and received WIC Program services. (1)
Percentage of children 1 to 5 years of age who were served in the Child Health Clinic and received WIC Program Services. (1)
Percentage of children 1 to 5 years of age enrolled in Medicaid who received WIC Program Services.
Percentage of children less than 12 months of age enrolled in Medicaid who received WIC Program services.
Percentage of postpartum women who participated in WIC during pregnancy and were recertified for WIC by 6 weeks postpartum.
Percentage of women with live term singleton births who received WIC Program services during pregnancy and who gained recommended/excessive/inadequate weight according to the National Academy of Sciences ‐ Institute of Medicine 2009 recommended total weight gain ranges during pregnancy. (3)
Percentage of women who participated in WIC who initiated breastfeeding.
1C.
1A.
2A.
2B.
3A.
3B.
1B.
4B.
5A.
79.4% 81.0%
Num Den Percent
Percentage of children 2 to 4 years of age who received services from the health department and who, according to their Body Mass Index (BMI) for age and gender were:
4A.
Percentage of infants who participated in WIC who were: 5B.
76.4%
64.3%
38.7%
52.3%
68.2%
47.3%
70.0%
31.8%
29.0%
14.1%5.8%
74.4%
57.7%
39.2%
34.6%
63.8%
66.3%
66.2%
34.0%
24.7%
9.7%3.9%
60.6%
71.2%
53.2%
35.4%
38.2%
63.6%
65.3%
65.1%
32.7%
21.2%
9.9%3.5%
‐23.7%
‐6.8%
‐17.1%
‐8.6%
‐26.9%
‐6.7%
38.3%
‐7.0%
2.6%
‐27.0%
‐30.2%‐39.2%
153 272 56.3%
271 385 70.4%
795 1,399 56.8%
564 1,485 38.0%
311 730 42.6%
96 135 71.1%
201 283 71.0%
315 473 66.6%
59 29.4%201
248 943 26.3%
107 936 11.4%39 936 4.2%
45.6%22.5%
42.9%24.5%
‐6.1%8.6%
42.2%23.8%
93 46.3%49 24.4%
201201
At a healthy weight (BMI less than the 85th percentile but at or greater than the 5th percentile) (1)
a.
Overweight (BMI at or above the 85th percentile but less than the 95th percentile)
b.
Underweight (BMI less than the 5th percentile).
c.
Recommended prenatal weight gaina.
Excessive prenatal weight gainb.
Inadequate prenatal weight gainc.
Breastfeeding at 6 weeks of age (1)a.
Breastfeeding at 6 months of ageb.
7.4% 15.0% 15.3% 106.0% 72 473 15.2%
15.0% 5.0% 3.1% ‐79.3% 5 473 1.1%
2000 2008 Data
2002to
2003
2005to
2006
2008to
% Change from 2000
to 2008
Obese (BMI at or greater than the 95th percentile).
d.
7.6% 13.8% 16.5% 117.0% 81 473 17.1%
(2) These data exclude women enrolled in Medicaid only for emergency delivery.
(3) Recommended total prenatal weight gain range by prepregnancy weight category is 28-40 lbs. for underweight women (BMI<18.5); 25-35 lbs. for normal weight women (BMI 18.5 to 24.9); 15-25 lbs. for overweight women (BMI 25 to 29.9); and 11-20 lbs. for obese women (BMI >=30.0): Adapted from the National Academy of Sciences. Weight Gain During Pregnancy: Reexamining the Guidelines. Washington, DC : National Academy Press, 2009.
(1) Item appears also on other WCH Section Agreement Addenda.

PerquimansATTACHMENT A: WIC QUALITY ASSURANCE DELIVERABLES
SFY 20102011 AGREEMENT ADDENDA DATA
Process Outcome Objectives
Percentage of pregnant women enrolled in Medicaid who received prenatal WIC Program services. (1) (2)
Percentage of pregnant women who participated in WIC and received WIC Program services during the first trimester of pregnancy.
Percentage of children less than 12 months of age who were served in the Child Health Clinic and received WIC Program services. (1)
Percentage of children 1 to 5 years of age who were served in the Child Health Clinic and received WIC Program Services. (1)
Percentage of children 1 to 5 years of age enrolled in Medicaid who received WIC Program Services.
Percentage of children less than 12 months of age enrolled in Medicaid who received WIC Program services.
Percentage of postpartum women who participated in WIC during pregnancy and were recertified for WIC by 6 weeks postpartum.
Percentage of women with live term singleton births who received WIC Program services during pregnancy and who gained recommended/excessive/inadequate weight according to the National Academy of Sciences ‐ Institute of Medicine 2009 recommended total weight gain ranges during pregnancy. (3)
Percentage of women who participated in WIC who initiated breastfeeding.
1C.
1A.
2A.
2B.
3A.
3B.
1B.
4B.
5A.
79.9% 78.9%
Num Den Percent
Percentage of children 2 to 4 years of age who received services from the health department and who, according to their Body Mass Index (BMI) for age and gender were:
4A.
Percentage of infants who participated in WIC who were: 5B.
77.2%
68.9%
38.7%
52.3%
86.2%
49.7%
63.6%
32.6%
29.0%
14.1%5.8%
76.8%
65.0%
39.2%
34.6%
85.1%
72.8%
62.9%
35.3%
24.7%
9.7%3.9%
71.2%
71.3%
53.9%
35.4%
38.2%
82.9%
82.5%
62.3%
34.7%
21.2%
9.9%3.5%
‐10.9%
‐7.6%
‐21.8%
‐8.6%
‐26.9%
‐3.9%
66.0%
‐2.0%
6.5%
‐27.0%
‐30.2%‐39.2%
46 66 69.7%
64 89 71.9%
260 461 56.4%
564 1,485 38.0%
311 730 42.6%
9 10 90.0%
49 55 89.1%
98 156 62.8%
17 48.6%35
248 943 26.3%
107 936 11.4%39 936 4.2%
43.6%23.8%
44.6%20.7%
2.2%‐13.0%
34.0%30.7%
11 31.4%7 20.0%
3535
At a healthy weight (BMI less than the 85th percentile but at or greater than the 5th percentile) (1)
a.
Overweight (BMI at or above the 85th percentile but less than the 95th percentile)
b.
Underweight (BMI less than the 5th percentile).
c.
Recommended prenatal weight gaina.
Excessive prenatal weight gainb.
Inadequate prenatal weight gainc.
Breastfeeding at 6 weeks of age (1)a.
Breastfeeding at 6 months of ageb.
14.9% 16.2% 18.0% 20.4% 33 156 21.2%
4.9% 3.4% 1.3% ‐72.9% 2 156 1.3%
2000 2008 Data
2002to
2003
2005to
2006
2008to
% Change from 2000
to 2008
Obese (BMI at or greater than the 95th percentile).
d.
16.6% 17.4% 18.4% 10.8% 23 156 14.7%
(2) These data exclude women enrolled in Medicaid only for emergency delivery.
(3) Recommended total prenatal weight gain range by prepregnancy weight category is 28-40 lbs. for underweight women (BMI<18.5); 25-35 lbs. for normal weight women (BMI 18.5 to 24.9); 15-25 lbs. for overweight women (BMI 25 to 29.9); and 11-20 lbs. for obese women (BMI >=30.0): Adapted from the National Academy of Sciences. Weight Gain During Pregnancy: Reexamining the Guidelines. Washington, DC : National Academy Press, 2009.
(1) Item appears also on other WCH Section Agreement Addenda.

PolkATTACHMENT A: WIC QUALITY ASSURANCE DELIVERABLES
SFY 20102011 AGREEMENT ADDENDA DATA
Process Outcome Objectives
Percentage of pregnant women enrolled in Medicaid who received prenatal WIC Program services. (1) (2)
Percentage of pregnant women who participated in WIC and received WIC Program services during the first trimester of pregnancy.
Percentage of children less than 12 months of age who were served in the Child Health Clinic and received WIC Program services. (1)
Percentage of children 1 to 5 years of age who were served in the Child Health Clinic and received WIC Program Services. (1)
Percentage of children 1 to 5 years of age enrolled in Medicaid who received WIC Program Services.
Percentage of children less than 12 months of age enrolled in Medicaid who received WIC Program services.
Percentage of postpartum women who participated in WIC during pregnancy and were recertified for WIC by 6 weeks postpartum.
Percentage of women with live term singleton births who received WIC Program services during pregnancy and who gained recommended/excessive/inadequate weight according to the National Academy of Sciences ‐ Institute of Medicine 2009 recommended total weight gain ranges during pregnancy. (3)
Percentage of women who participated in WIC who initiated breastfeeding.
1C.
1A.
2A.
2B.
3A.
3B.
1B.
4B.
5A.
57.0% 67.7%
Num Den Percent
Percentage of children 2 to 4 years of age who received services from the health department and who, according to their Body Mass Index (BMI) for age and gender were:
4A.
Percentage of infants who participated in WIC who were: 5B.
62.8%
58.4%
32.8%
74.6%
86.4%
92.0%
66.2%
34.1%
40.4%
25.4%11.5%
66.3%
54.9%
32.5%
69.9%
86.4%
85.6%
64.2%
33.3%
46.4%
28.1%14.7%
55.8%
65.5%
54.1%
35.2%
72.4%
100.0%
82.6%
69.6%
23.9%
54.4%
31.1%14.5%
‐2.0%
4.3%
‐7.3%
7.5%
‐3.0%
15.8%
‐10.3%
5.0%
‐29.9%
34.8%
22.7%26.4%
47 84 56.0%
81 125 64.8%
241 444 54.3%
843 2,282 36.9%
796 1,087 73.2%
1 1 100.0%
33 36 91.7%
99 145 68.3%
16 24.6%65
697 1,258 55.4%
360 1,196 30.1%163 1,196 13.6%
42.2%23.7%
42.8%33.3%
1.3%40.7%
40.4%26.3%
29 44.6%20 30.8%
6565
At a healthy weight (BMI less than the 85th percentile but at or greater than the 5th percentile) (1)
a.
Overweight (BMI at or above the 85th percentile but less than the 95th percentile)
b.
Underweight (BMI less than the 5th percentile).
c.
Recommended prenatal weight gaina.
Excessive prenatal weight gainb.
Inadequate prenatal weight gainc.
Breastfeeding at 6 weeks of age (1)a.
Breastfeeding at 6 months of ageb.
14.9% 18.3% 15.9% 6.7% 26 145 17.9%
2.8% 1.8% 2.1% ‐23.7% 3 145 2.1%
2000 2008 Data
2002to
2003
2005to
2006
2008to
% Change from 2000
to 2008
Obese (BMI at or greater than the 95th percentile).
d.
16.1% 15.8% 12.5% ‐22.6% 17 145 11.7%
(2) These data exclude women enrolled in Medicaid only for emergency delivery.
(3) Recommended total prenatal weight gain range by prepregnancy weight category is 28-40 lbs. for underweight women (BMI<18.5); 25-35 lbs. for normal weight women (BMI 18.5 to 24.9); 15-25 lbs. for overweight women (BMI 25 to 29.9); and 11-20 lbs. for obese women (BMI >=30.0): Adapted from the National Academy of Sciences. Weight Gain During Pregnancy: Reexamining the Guidelines. Washington, DC : National Academy Press, 2009.
(1) Item appears also on other WCH Section Agreement Addenda.

RutherfordATTACHMENT A: WIC QUALITY ASSURANCE DELIVERABLES
SFY 20102011 AGREEMENT ADDENDA DATA
Process Outcome Objectives
Percentage of pregnant women enrolled in Medicaid who received prenatal WIC Program services. (1) (2)
Percentage of pregnant women who participated in WIC and received WIC Program services during the first trimester of pregnancy.
Percentage of children less than 12 months of age who were served in the Child Health Clinic and received WIC Program services. (1)
Percentage of children 1 to 5 years of age who were served in the Child Health Clinic and received WIC Program Services. (1)
Percentage of children 1 to 5 years of age enrolled in Medicaid who received WIC Program Services.
Percentage of children less than 12 months of age enrolled in Medicaid who received WIC Program services.
Percentage of postpartum women who participated in WIC during pregnancy and were recertified for WIC by 6 weeks postpartum.
Percentage of women with live term singleton births who received WIC Program services during pregnancy and who gained recommended/excessive/inadequate weight according to the National Academy of Sciences ‐ Institute of Medicine 2009 recommended total weight gain ranges during pregnancy. (3)
Percentage of women who participated in WIC who initiated breastfeeding.
1C.
1A.
2A.
2B.
3A.
3B.
1B.
4B.
5A.
79.2% 67.0%
Num Den Percent
Percentage of children 2 to 4 years of age who received services from the health department and who, according to their Body Mass Index (BMI) for age and gender were:
4A.
Percentage of infants who participated in WIC who were: 5B.
79.4%
63.3%
32.8%
74.6%
98.5%
95.8%
69.7%
30.4%
40.4%
25.4%11.5%
79.2%
61.5%
32.5%
69.9%
92.3%
93.4%
68.2%
31.7%
46.4%
28.1%14.7%
64.0%
80.9%
60.0%
35.2%
72.4%
93.9%
93.7%
66.3%
30.4%
54.4%
31.1%14.5%
‐19.2%
1.9%
‐5.3%
7.5%
‐3.0%
‐4.7%
‐2.2%
‐4.8%
0.0%
34.8%
22.7%26.4%
337 428 78.7%
466 569 81.9%
1,467 2,322 63.2%
843 2,282 36.9%
796 1,087 73.2%
31 31 100.0%
233 249 93.6%
539 806 66.9%
109 28.8%378
697 1,258 55.4%
360 1,196 30.1%163 1,196 13.6%
41.0%28.5%
39.5%30.1%
‐3.7%5.3%
39.5%28.8%
173 45.8%96 25.4%
378378
At a healthy weight (BMI less than the 85th percentile but at or greater than the 5th percentile) (1)
a.
Overweight (BMI at or above the 85th percentile but less than the 95th percentile)
b.
Underweight (BMI less than the 5th percentile).
c.
Recommended prenatal weight gaina.
Excessive prenatal weight gainb.
Inadequate prenatal weight gainc.
Breastfeeding at 6 weeks of age (1)a.
Breastfeeding at 6 months of ageb.
14.6% 14.9% 15.6% 6.9% 137 806 17.0%
3.9% 4.1% 4.4% 11.0% 28 806 3.5%
2000 2008 Data
2002to
2003
2005to
2006
2008to
% Change from 2000
to 2008
Obese (BMI at or greater than the 95th percentile).
d.
11.8% 12.8% 13.7% 16.5% 102 806 12.7%
(2) These data exclude women enrolled in Medicaid only for emergency delivery.
(3) Recommended total prenatal weight gain range by prepregnancy weight category is 28-40 lbs. for underweight women (BMI<18.5); 25-35 lbs. for normal weight women (BMI 18.5 to 24.9); 15-25 lbs. for overweight women (BMI 25 to 29.9); and 11-20 lbs. for obese women (BMI >=30.0): Adapted from the National Academy of Sciences. Weight Gain During Pregnancy: Reexamining the Guidelines. Washington, DC : National Academy Press, 2009.
(1) Item appears also on other WCH Section Agreement Addenda.

TyrrellATTACHMENT A: WIC QUALITY ASSURANCE DELIVERABLES
SFY 20102011 AGREEMENT ADDENDA DATA
Process Outcome Objectives
Percentage of pregnant women enrolled in Medicaid who received prenatal WIC Program services. (1) (2)
Percentage of pregnant women who participated in WIC and received WIC Program services during the first trimester of pregnancy.
Percentage of children less than 12 months of age who were served in the Child Health Clinic and received WIC Program services. (1)
Percentage of children 1 to 5 years of age who were served in the Child Health Clinic and received WIC Program Services. (1)
Percentage of children 1 to 5 years of age enrolled in Medicaid who received WIC Program Services.
Percentage of children less than 12 months of age enrolled in Medicaid who received WIC Program services.
Percentage of postpartum women who participated in WIC during pregnancy and were recertified for WIC by 6 weeks postpartum.
Percentage of women with live term singleton births who received WIC Program services during pregnancy and who gained recommended/excessive/inadequate weight according to the National Academy of Sciences ‐ Institute of Medicine 2009 recommended total weight gain ranges during pregnancy. (3)
Percentage of women who participated in WIC who initiated breastfeeding.
1C.
1A.
2A.
2B.
3A.
3B.
1B.
4B.
5A.
90.8% 80.3%
Num Den Percent
Percentage of children 2 to 4 years of age who received services from the health department and who, according to their Body Mass Index (BMI) for age and gender were:
4A.
Percentage of infants who participated in WIC who were: 5B.
73.8%
70.6%
41.1%
77.5%
96.0%
95.3%
62.8%
37.6%
31.5%
16.0%8.4%
72.4%
66.0%
37.4%
79.1%
97.5%
95.0%
63.3%
28.2%
41.3%
24.6%11.9%
83.7%
72.7%
69.1%
32.3%
82.0%
91.4%
93.4%
62.6%
33.3%
38.1%
23.3%11.4%
‐7.8%
‐1.5%
‐2.2%
‐21.3%
5.8%
‐4.9%
‐2.0%
‐0.3%
‐11.4%
20.8%
45.2%35.7%
24 29 82.8%
34 45 75.6%
124 172 72.1%
292 859 34.0%
321 384 83.6%
52 56 92.9%
117 127 92.1%
77 114 67.5%
13 31.7%41
170 456 37.3%
105 505 20.8%51 505 10.1%
36.6%25.8%
47.0%19.7%
28.6%‐23.8%
45.6%26.2%
23 56.1%5 12.2%
4141
At a healthy weight (BMI less than the 85th percentile but at or greater than the 5th percentile) (1)
a.
Overweight (BMI at or above the 85th percentile but less than the 95th percentile)
b.
Underweight (BMI less than the 5th percentile).
c.
Recommended prenatal weight gaina.
Excessive prenatal weight gainb.
Inadequate prenatal weight gainc.
Breastfeeding at 6 weeks of age (1)a.
Breastfeeding at 6 months of ageb.
16.6% 20.0% 14.1% ‐14.8% 21 114 18.4%
1.0% 1.8% 3.1% 197.4% 0 114 0.0%
2000 2008 Data
2002to
2003
2005to
2006
2008to
% Change from 2000
to 2008
Obese (BMI at or greater than the 95th percentile).
d.
19.7% 14.9% 20.3% 3.1% 16 114 14.0%
(2) These data exclude women enrolled in Medicaid only for emergency delivery.
(3) Recommended total prenatal weight gain range by prepregnancy weight category is 28-40 lbs. for underweight women (BMI<18.5); 25-35 lbs. for normal weight women (BMI 18.5 to 24.9); 15-25 lbs. for overweight women (BMI 25 to 29.9); and 11-20 lbs. for obese women (BMI >=30.0): Adapted from the National Academy of Sciences. Weight Gain During Pregnancy: Reexamining the Guidelines. Washington, DC : National Academy Press, 2009.
(1) Item appears also on other WCH Section Agreement Addenda.
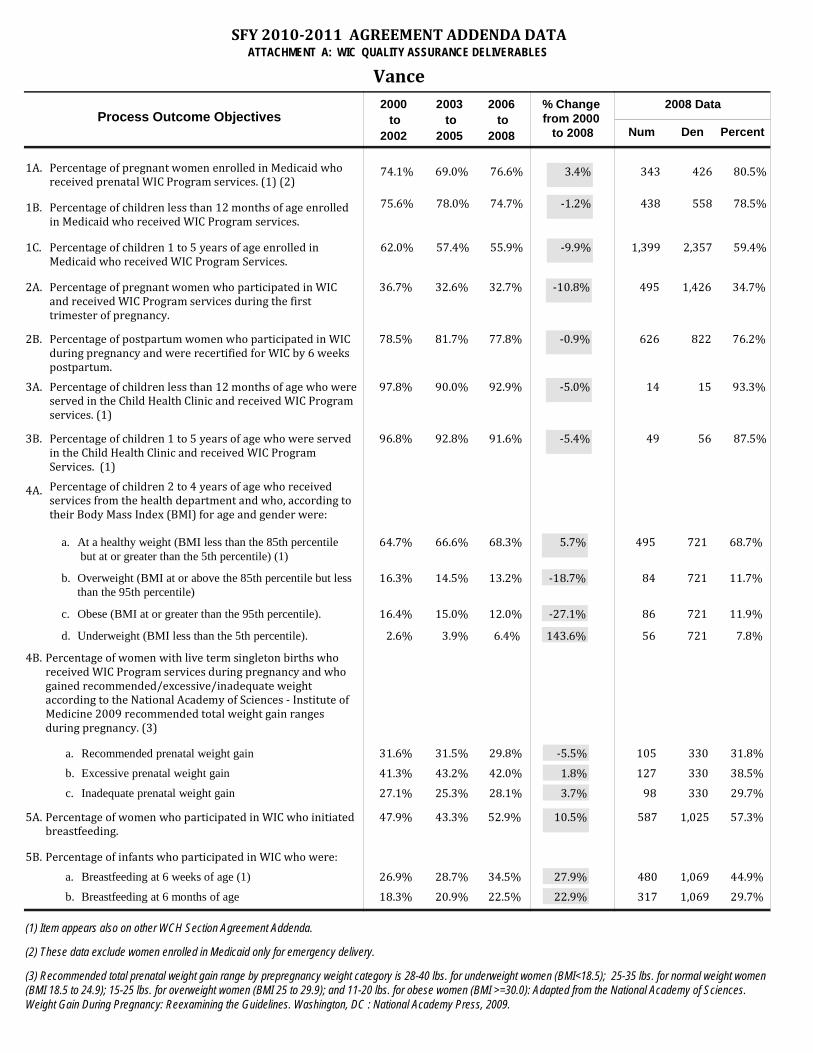
VanceATTACHMENT A: WIC QUALITY ASSURANCE DELIVERABLES
SFY 20102011 AGREEMENT ADDENDA DATA
Process Outcome Objectives
Percentage of pregnant women enrolled in Medicaid who received prenatal WIC Program services. (1) (2)
Percentage of pregnant women who participated in WIC and received WIC Program services during the first trimester of pregnancy.
Percentage of children less than 12 months of age who were served in the Child Health Clinic and received WIC Program services. (1)
Percentage of children 1 to 5 years of age who were served in the Child Health Clinic and received WIC Program Services. (1)
Percentage of children 1 to 5 years of age enrolled in Medicaid who received WIC Program Services.
Percentage of children less than 12 months of age enrolled in Medicaid who received WIC Program services.
Percentage of postpartum women who participated in WIC during pregnancy and were recertified for WIC by 6 weeks postpartum.
Percentage of women with live term singleton births who received WIC Program services during pregnancy and who gained recommended/excessive/inadequate weight according to the National Academy of Sciences ‐ Institute of Medicine 2009 recommended total weight gain ranges during pregnancy. (3)
Percentage of women who participated in WIC who initiated breastfeeding.
1C.
1A.
2A.
2B.
3A.
3B.
1B.
4B.
5A.
74.1% 69.0%
Num Den Percent
Percentage of children 2 to 4 years of age who received services from the health department and who, according to their Body Mass Index (BMI) for age and gender were:
4A.
Percentage of infants who participated in WIC who were: 5B.
75.6%
62.0%
36.7%
78.5%
97.8%
96.8%
64.7%
31.6%
47.9%
26.9%18.3%
78.0%
57.4%
32.6%
81.7%
90.0%
92.8%
66.6%
31.5%
43.3%
28.7%20.9%
76.6%
74.7%
55.9%
32.7%
77.8%
92.9%
91.6%
68.3%
29.8%
52.9%
34.5%22.5%
3.4%
‐1.2%
‐9.9%
‐10.8%
‐0.9%
‐5.0%
‐5.4%
5.7%
‐5.5%
10.5%
27.9%22.9%
343 426 80.5%
438 558 78.5%
1,399 2,357 59.4%
495 1,426 34.7%
626 822 76.2%
14 15 93.3%
49 56 87.5%
495 721 68.7%
105 31.8%330
587 1,025 57.3%
480 1,069 44.9%317 1,069 29.7%
41.3%27.1%
42.0%28.1%
1.8%3.7%
43.2%25.3%
127 38.5%98 29.7%
330330
At a healthy weight (BMI less than the 85th percentile but at or greater than the 5th percentile) (1)
a.
Overweight (BMI at or above the 85th percentile but less than the 95th percentile)
b.
Underweight (BMI less than the 5th percentile).
c.
Recommended prenatal weight gaina.
Excessive prenatal weight gainb.
Inadequate prenatal weight gainc.
Breastfeeding at 6 weeks of age (1)a.
Breastfeeding at 6 months of ageb.
16.3% 14.5% 13.2% ‐18.7% 84 721 11.7%
2.6% 3.9% 6.4% 143.6% 56 721 7.8%
2000 2008 Data
2002to
2003
2005to
2006
2008to
% Change from 2000
to 2008
Obese (BMI at or greater than the 95th percentile).
d.
16.4% 15.0% 12.0% ‐27.1% 86 721 11.9%
(2) These data exclude women enrolled in Medicaid only for emergency delivery.
(3) Recommended total prenatal weight gain range by prepregnancy weight category is 28-40 lbs. for underweight women (BMI<18.5); 25-35 lbs. for normal weight women (BMI 18.5 to 24.9); 15-25 lbs. for overweight women (BMI 25 to 29.9); and 11-20 lbs. for obese women (BMI >=30.0): Adapted from the National Academy of Sciences. Weight Gain During Pregnancy: Reexamining the Guidelines. Washington, DC : National Academy Press, 2009.
(1) Item appears also on other WCH Section Agreement Addenda.

WashingtonATTACHMENT A: WIC QUALITY ASSURANCE DELIVERABLES
SFY 20102011 AGREEMENT ADDENDA DATA
Process Outcome Objectives
Percentage of pregnant women enrolled in Medicaid who received prenatal WIC Program services. (1) (2)
Percentage of pregnant women who participated in WIC and received WIC Program services during the first trimester of pregnancy.
Percentage of children less than 12 months of age who were served in the Child Health Clinic and received WIC Program services. (1)
Percentage of children 1 to 5 years of age who were served in the Child Health Clinic and received WIC Program Services. (1)
Percentage of children 1 to 5 years of age enrolled in Medicaid who received WIC Program Services.
Percentage of children less than 12 months of age enrolled in Medicaid who received WIC Program services.
Percentage of postpartum women who participated in WIC during pregnancy and were recertified for WIC by 6 weeks postpartum.
Percentage of women with live term singleton births who received WIC Program services during pregnancy and who gained recommended/excessive/inadequate weight according to the National Academy of Sciences ‐ Institute of Medicine 2009 recommended total weight gain ranges during pregnancy. (3)
Percentage of women who participated in WIC who initiated breastfeeding.
1C.
1A.
2A.
2B.
3A.
3B.
1B.
4B.
5A.
78.6% 86.6%
Num Den Percent
Percentage of children 2 to 4 years of age who received services from the health department and who, according to their Body Mass Index (BMI) for age and gender were:
4A.
Percentage of infants who participated in WIC who were: 5B.
72.3%
68.6%
41.1%
77.5%
95.0%
93.1%
60.5%
25.2%
31.5%
16.0%8.4%
75.1%
69.6%
37.4%
79.1%
98.9%
95.8%
68.0%
26.8%
41.3%
24.6%11.9%
86.4%
73.6%
67.9%
32.3%
82.0%
98.0%
93.6%
68.1%
26.7%
38.1%
23.3%11.4%
10.0%
1.8%
‐1.0%
‐21.3%
5.8%
3.2%
0.5%
12.5%
6.0%
20.8%
45.2%35.7%
103 113 91.2%
99 140 70.7%
423 633 66.8%
292 859 34.0%
321 384 83.6%
80 81 98.8%
184 200 92.0%
169 250 67.6%
25 22.5%111
170 456 37.3%
105 505 20.8%51 505 10.1%
51.8%23.0%
45.1%28.2%
‐12.9%22.6%
43.8%29.3%
52 46.8%34 30.6%
111111
At a healthy weight (BMI less than the 85th percentile but at or greater than the 5th percentile) (1)
a.
Overweight (BMI at or above the 85th percentile but less than the 95th percentile)
b.
Underweight (BMI less than the 5th percentile).
c.
Recommended prenatal weight gaina.
Excessive prenatal weight gainb.
Inadequate prenatal weight gainc.
Breastfeeding at 6 weeks of age (1)a.
Breastfeeding at 6 months of ageb.
16.1% 10.4% 9.4% ‐41.6% 27 250 10.8%
7.3% 11.5% 12.7% 75.8% 25 250 10.0%
2000 2008 Data
2002to
2003
2005to
2006
2008to
% Change from 2000
to 2008
Obese (BMI at or greater than the 95th percentile).
d.
16.1% 10.1% 9.8% ‐39.5% 29 250 11.6%
(2) These data exclude women enrolled in Medicaid only for emergency delivery.
(3) Recommended total prenatal weight gain range by prepregnancy weight category is 28-40 lbs. for underweight women (BMI<18.5); 25-35 lbs. for normal weight women (BMI 18.5 to 24.9); 15-25 lbs. for overweight women (BMI 25 to 29.9); and 11-20 lbs. for obese women (BMI >=30.0): Adapted from the National Academy of Sciences. Weight Gain During Pregnancy: Reexamining the Guidelines. Washington, DC : National Academy Press, 2009.
(1) Item appears also on other WCH Section Agreement Addenda.

WataugaATTACHMENT A: WIC QUALITY ASSURANCE DELIVERABLES
SFY 20102011 AGREEMENT ADDENDA DATA
Process Outcome Objectives
Percentage of pregnant women enrolled in Medicaid who received prenatal WIC Program services. (1) (2)
Percentage of pregnant women who participated in WIC and received WIC Program services during the first trimester of pregnancy.
Percentage of children less than 12 months of age who were served in the Child Health Clinic and received WIC Program services. (1)
Percentage of children 1 to 5 years of age who were served in the Child Health Clinic and received WIC Program Services. (1)
Percentage of children 1 to 5 years of age enrolled in Medicaid who received WIC Program Services.
Percentage of children less than 12 months of age enrolled in Medicaid who received WIC Program services.
Percentage of postpartum women who participated in WIC during pregnancy and were recertified for WIC by 6 weeks postpartum.
Percentage of women with live term singleton births who received WIC Program services during pregnancy and who gained recommended/excessive/inadequate weight according to the National Academy of Sciences ‐ Institute of Medicine 2009 recommended total weight gain ranges during pregnancy. (3)
Percentage of women who participated in WIC who initiated breastfeeding.
1C.
1A.
2A.
2B.
3A.
3B.
1B.
4B.
5A.
83.8% 79.8%
Num Den Percent
Percentage of children 2 to 4 years of age who received services from the health department and who, according to their Body Mass Index (BMI) for age and gender were:
4A.
Percentage of infants who participated in WIC who were: 5B.
66.2%
70.1%
56.4%
56.2%
77.9%
77.2%
67.3%
29.1%
54.8%
41.1%28.6%
60.6%
65.3%
52.1%
58.2%
71.7%
80.6%
66.2%
31.6%
53.4%
42.7%27.7%
50.9%
66.6%
60.3%
45.2%
66.4%
82.4%
83.1%
73.3%
31.8%
63.1%
46.5%26.9%
‐39.4%
0.7%
‐14.0%
‐19.8%
18.2%
5.7%
7.6%
8.9%
9.3%
15.1%
13.2%‐5.9%
71 166 42.8%
156 239 65.3%
497 812 61.2%
189 430 44.0%
160 223 71.7%
3 4 75.0%
33 39 84.6%
216 292 74.0%
45 32.4%139
178 275 64.7%
116 229 50.7%66 229 28.8%
49.4%21.5%
51.6%16.5%
4.6%‐23.0%
49.1%19.3%
66 47.5%28 20.1%
139139
At a healthy weight (BMI less than the 85th percentile but at or greater than the 5th percentile) (1)
a.
Overweight (BMI at or above the 85th percentile but less than the 95th percentile)
b.
Underweight (BMI less than the 5th percentile).
c.
Recommended prenatal weight gaina.
Excessive prenatal weight gainb.
Inadequate prenatal weight gainc.
Breastfeeding at 6 weeks of age (1)a.
Breastfeeding at 6 months of ageb.
15.6% 17.6% 13.0% ‐16.8% 41 292 14.0%
5.3% 4.0% 3.0% ‐44.6% 7 292 2.4%
2000 2008 Data
2002to
2003
2005to
2006
2008to
% Change from 2000
to 2008
Obese (BMI at or greater than the 95th percentile).
d.
11.8% 12.2% 10.7% ‐8.6% 28 292 9.6%
(2) These data exclude women enrolled in Medicaid only for emergency delivery.
(3) Recommended total prenatal weight gain range by prepregnancy weight category is 28-40 lbs. for underweight women (BMI<18.5); 25-35 lbs. for normal weight women (BMI 18.5 to 24.9); 15-25 lbs. for overweight women (BMI 25 to 29.9); and 11-20 lbs. for obese women (BMI >=30.0): Adapted from the National Academy of Sciences. Weight Gain During Pregnancy: Reexamining the Guidelines. Washington, DC : National Academy Press, 2009.
(1) Item appears also on other WCH Section Agreement Addenda.

YanceyATTACHMENT A: WIC QUALITY ASSURANCE DELIVERABLES
SFY 20102011 AGREEMENT ADDENDA DATA
Process Outcome Objectives
Percentage of pregnant women enrolled in Medicaid who received prenatal WIC Program services. (1) (2)
Percentage of pregnant women who participated in WIC and received WIC Program services during the first trimester of pregnancy.
Percentage of children less than 12 months of age who were served in the Child Health Clinic and received WIC Program services. (1)
Percentage of children 1 to 5 years of age who were served in the Child Health Clinic and received WIC Program Services. (1)
Percentage of children 1 to 5 years of age enrolled in Medicaid who received WIC Program Services.
Percentage of children less than 12 months of age enrolled in Medicaid who received WIC Program services.
Percentage of postpartum women who participated in WIC during pregnancy and were recertified for WIC by 6 weeks postpartum.
Percentage of women with live term singleton births who received WIC Program services during pregnancy and who gained recommended/excessive/inadequate weight according to the National Academy of Sciences ‐ Institute of Medicine 2009 recommended total weight gain ranges during pregnancy. (3)
Percentage of women who participated in WIC who initiated breastfeeding.
1C.
1A.
2A.
2B.
3A.
3B.
1B.
4B.
5A.
73.2% 68.5%
Num Den Percent
Percentage of children 2 to 4 years of age who received services from the health department and who, according to their Body Mass Index (BMI) for age and gender were:
4A.
Percentage of infants who participated in WIC who were: 5B.
62.0%
71.8%
46.8%
69.4%
83.3%
92.1%
69.2%
33.8%
55.3%
34.9%21.7%
62.1%
62.3%
40.0%
69.1%
85.2%
92.1%
62.5%
32.1%
79.2%
39.9%25.7%
68.7%
62.0%
58.8%
42.5%
63.9%
100.0%
86.1%
70.3%
32.9%
68.1%
34.8%20.2%
‐6.2%
0.0%
‐18.1%
‐9.1%
‐7.9%
20.0%
‐6.5%
1.5%
‐2.6%
23.1%
‐0.3%‐6.9%
59 82 72.0%
84 133 63.2%
317 505 62.8%
136 301 45.2%
89 140 63.6%
8 8 100.0%
26 28 92.9%
164 231 71.0%
19 27.1%70
103 171 60.2%
69 170 40.6%45 170 26.5%
44.7%21.5%
46.3%20.8%
3.6%‐3.5%
42.5%25.4%
37 52.9%14 20.0%
7070
At a healthy weight (BMI less than the 85th percentile but at or greater than the 5th percentile) (1)
a.
Overweight (BMI at or above the 85th percentile but less than the 95th percentile)
b.
Underweight (BMI less than the 5th percentile).
c.
Recommended prenatal weight gaina.
Excessive prenatal weight gainb.
Inadequate prenatal weight gainc.
Breastfeeding at 6 weeks of age (1)a.
Breastfeeding at 6 months of ageb.
14.5% 20.0% 15.3% 5.2% 33 231 14.3%
3.8% 2.3% 3.5% ‐9.7% 5 231 2.2%
2000 2008 Data
2002to
2003
2005to
2006
2008to
% Change from 2000
to 2008
Obese (BMI at or greater than the 95th percentile).
d.
12.4% 15.2% 11.0% ‐11.6% 29 231 12.6%
(2) These data exclude women enrolled in Medicaid only for emergency delivery.
(3) Recommended total prenatal weight gain range by prepregnancy weight category is 28-40 lbs. for underweight women (BMI<18.5); 25-35 lbs. for normal weight women (BMI 18.5 to 24.9); 15-25 lbs. for overweight women (BMI 25 to 29.9); and 11-20 lbs. for obese women (BMI >=30.0): Adapted from the National Academy of Sciences. Weight Gain During Pregnancy: Reexamining the Guidelines. Washington, DC : National Academy Press, 2009.
(1) Item appears also on other WCH Section Agreement Addenda.