Embed Size (px)
Citation preview
ORIGINAL PAPER
Tree growth response to ENSO in Durango, Mexico
Marin Pompa-García & Liliana Miranda-Aragón &
Carlos Arturo Aguirre-Salado
Received: 27 May 2013 /Revised: 20 March 2014 /Accepted: 20 March 2014# ISB 2014
Abstract The dynamics of forest ecosystemsworldwide havebeen driven largely by climatic teleconnections. El Niño-Southern Oscillation (ENSO) is the strongest interannual var-iation of the Earth’s climate, affecting the regional climaticregime. These teleconnections may impact plant phenology,growth rate, forest extent, and other gradual changes in forestecosystems. The objective of this study was to investigate howPinus cooperi populations face the influence of ENSO andregional microclimates in five ecozones in northwesternMexico. Using standard dendrochronological techniques,tree-ring chronologies (TRI) were generated. TRI, ENSO,and climate relationships were correlated from 1950–2010.Additionally, multiple regressions were conducted in order todetect those ENSO months with direct relations in TRI(p<0.1). The five chronologies showed similar trends duringthe period they overlapped, indicating that the P. cooperipopulations shared an interannual growth variation. In gener-al, ENSO index showed correspondences with tree-ringgrowth in synchronous periods. We concluded that ENSOhad connectivity with regional climate in northern Mexicoand radial growth of P. cooperi populations has been drivenlargely by positive ENSO values (El Niño episodes).
Keywords Radial growth . Tree-rings . Pinus cooperi .
Dendrochronology .MEI . Niño3 . Elevation gradients
Introduction
Several studies of ecosystem vulnerability due to climaticchanges have been completed or are in progress around theworld (Seager et al. 2009; Williams et al. 2012). Tree-ringanalyses have provided a better understanding of the reper-cussions of these climatic variations on vegetation dynamics(Senkbeil et al. 2007), especially when these analyses considerelevational gradients, where climate is often a limiting factorfor tree growth (Lo et al. 2010).
Although dendroclimatologists have traditionally focusedon the impacts of local climatic components on the radialgrowth dynamics of trees, they have also begun to look atlarge-scale climatic patterns (Rozas and García-Gonzalez2012). These teleconnections provide a noteworthy under-standing of the climate–tree relationship in order to betterpredict changes in the local physical environment of forestecosystems (Beniston 2002). Interannual climatic variationsin the tropics and subtropics of the western Americas arelargely regulated by El Niño-Southern Oscillation (ENSO)(Villalba et al. 2011). For instance, in Mexico, Cleavelandet al. (2003) pointed out ENSO correlates well with instru-mental winter precipitation. The impact of ENSO in north-eastern Mexico indicated influence of climatic conditions inthis region (Villanueva–Díaz et al. 2007); in a similar context,Cerano-Paredes et al. (2011) reported that the intensity of thedry and wet spells recorded in the upper Nazas River water-shed in a century were influenced by ENSO.
All of these studies have been based on single-variableENSO indices (i.e., conventional indices) such as theSouthern Oscillation Index (SOI) or Niño3. Their values varywith the seasonal cycle (Wolter and Timlin 1993) because
M. Pompa-García (*)Facultad de Ciencias Forestales, Universidad Juárez del Estado deDurango, Av. Papaloapan y Blvd., Durango, Durango 34120,Mexicoe-mail: [email protected]
L. Miranda-AragónFacultad de Agronomía y Veterinaria, Universidad Autónoma de SanLuis Potosí, San Luis Potosí 78321, Mexicoe-mail: [email protected]
C. A. Aguirre-SaladoFacultad de Ingeniería, Universidad Autónoma de San Luis Potosí,San Luis Potosí 78290, Mexicoe-mail: [email protected]
Int J BiometeorolDOI 10.1007/s00484-014-0828-2
most anomaly fields show considerable variation with theannual cycle, thus reducing their reliability (Wolter andTimlin 1998). Recently, Wolter and Timlin (2011) have beenleading the definition of the multivariate ENSO index (MEI)which is reported as more robust and reliable than conven-tional ENSO indices that had been allowed to vary with theseasonal cycle (see http://www.noaa.esrl.noaa.gov/psd/people/klauss.wolter/MEI).
ENSO remains the most important large-scale atmosphericcirculation phenomenon to cause global climate variability(Bannayan et al. 2011). A major challenge is how to betterunderstand the consequences of large-scale circulation pat-terns on local climate and ecological processes. To addressthese issues, we investigate how Pinus cooperi populationsface the influence of ENSO (MEI, Niño3) in five ecozones innorthwestern Mexico. This species is ecologically importantand provides the highest volume and value to the timberindustry in the state of Durango because of its abundance;structural integrity; and long, clean boles (Cruz et al. 2008).We specifically address the following questions: are tree-ringseries sensitive to ENSO and local climate in northernMexico? How do large-scale climatic drivers, such as MEIand Niño3, impact regional climate to induce a particularresponse on tree growth across elevations gradients?
Materials and methods
Study area
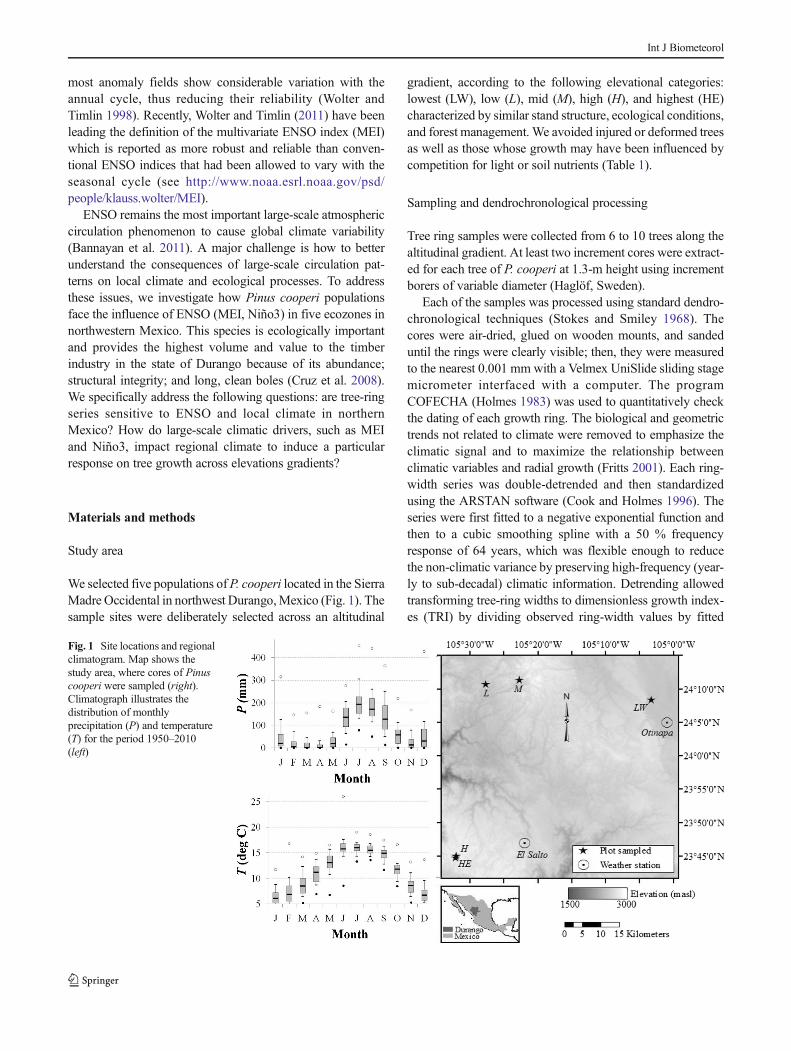
We selected five populations ofP. cooperi located in the SierraMadre Occidental in northwest Durango,Mexico (Fig. 1). Thesample sites were deliberately selected across an altitudinal
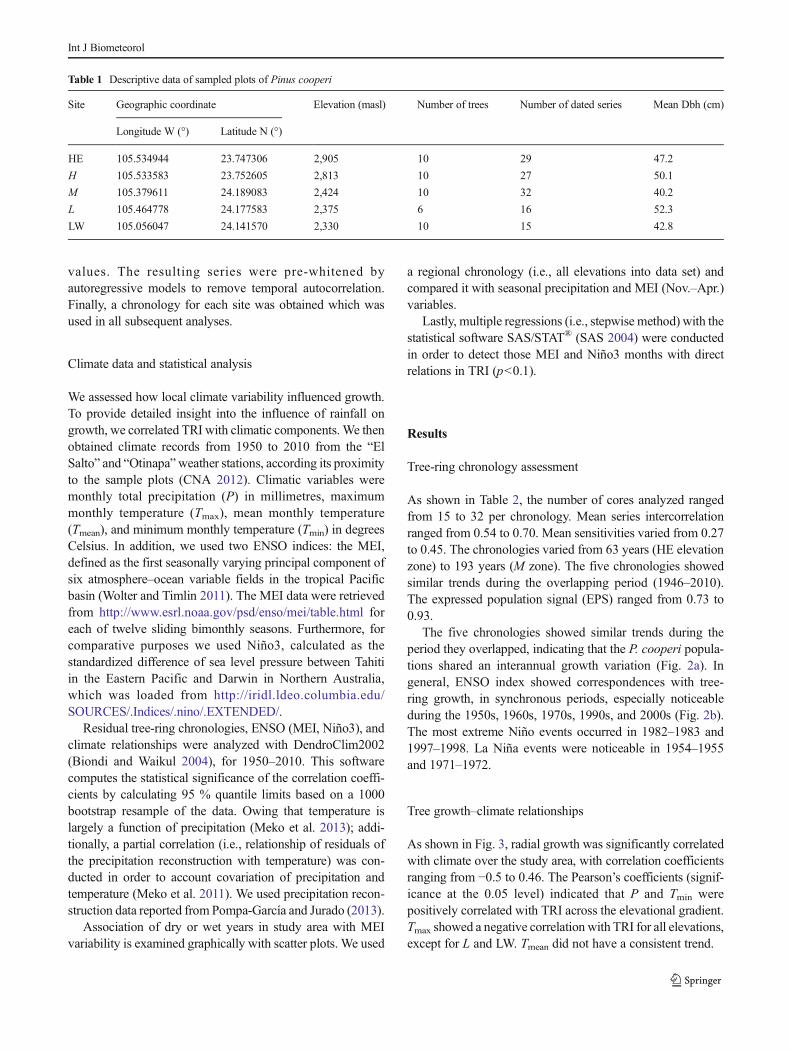
gradient, according to the following elevational categories:lowest (LW), low (L), mid (M), high (H), and highest (HE)characterized by similar stand structure, ecological conditions,and forest management. We avoided injured or deformed treesas well as those whose growth may have been influenced bycompetition for light or soil nutrients (Table 1).
Sampling and dendrochronological processing
Tree ring samples were collected from 6 to 10 trees along thealtitudinal gradient. At least two increment cores were extract-ed for each tree of P. cooperi at 1.3-m height using incrementborers of variable diameter (Haglöf, Sweden).
Each of the samples was processed using standard dendro-chronological techniques (Stokes and Smiley 1968). Thecores were air-dried, glued on wooden mounts, and sandeduntil the rings were clearly visible; then, they were measuredto the nearest 0.001 mm with a Velmex UniSlide sliding stagemicrometer interfaced with a computer. The programCOFECHA (Holmes 1983) was used to quantitatively checkthe dating of each growth ring. The biological and geometrictrends not related to climate were removed to emphasize theclimatic signal and to maximize the relationship betweenclimatic variables and radial growth (Fritts 2001). Each ring-width series was double-detrended and then standardizedusing the ARSTAN software (Cook and Holmes 1996). Theseries were first fitted to a negative exponential function andthen to a cubic smoothing spline with a 50 % frequencyresponse of 64 years, which was flexible enough to reducethe non-climatic variance by preserving high-frequency (year-ly to sub-decadal) climatic information. Detrending allowedtransforming tree-ring widths to dimensionless growth index-es (TRI) by dividing observed ring-width values by fitted
Fig. 1 Site locations and regionalclimatogram. Map shows thestudy area, where cores of Pinuscooperi were sampled (right).Climatograph illustrates thedistribution of monthlyprecipitation (P) and temperature(T) for the period 1950–2010(left)
Int J Biometeorol
values. The resulting series were pre-whitened byautoregressive models to remove temporal autocorrelation.Finally, a chronology for each site was obtained which wasused in all subsequent analyses.
Climate data and statistical analysis
We assessed how local climate variability influenced growth.To provide detailed insight into the influence of rainfall ongrowth, we correlated TRI with climatic components. We thenobtained climate records from 1950 to 2010 from the “ElSalto” and “Otinapa”weather stations, according its proximityto the sample plots (CNA 2012). Climatic variables weremonthly total precipitation (P) in millimetres, maximummonthly temperature (Tmax), mean monthly temperature(Tmean), and minimum monthly temperature (Tmin) in degreesCelsius. In addition, we used two ENSO indices: the MEI,defined as the first seasonally varying principal component ofsix atmosphere–ocean variable fields in the tropical Pacificbasin (Wolter and Timlin 2011). The MEI data were retrievedfrom http://www.esrl.noaa.gov/psd/enso/mei/table.html foreach of twelve sliding bimonthly seasons. Furthermore, forcomparative purposes we used Niño3, calculated as thestandardized difference of sea level pressure between Tahitiin the Eastern Pacific and Darwin in Northern Australia,which was loaded from http://iridl.ldeo.columbia.edu/SOURCES/.Indices/.nino/.EXTENDED/.
Residual tree-ring chronologies, ENSO (MEI, Niño3), andclimate relationships were analyzed with DendroClim2002(Biondi and Waikul 2004), for 1950–2010. This softwarecomputes the statistical significance of the correlation coeffi-cients by calculating 95 % quantile limits based on a 1000bootstrap resample of the data. Owing that temperature islargely a function of precipitation (Meko et al. 2013); addi-tionally, a partial correlation (i.e., relationship of residuals ofthe precipitation reconstruction with temperature) was con-ducted in order to account covariation of precipitation andtemperature (Meko et al. 2011). We used precipitation recon-struction data reported from Pompa-García and Jurado (2013).
Association of dry or wet years in study area with MEIvariability is examined graphically with scatter plots. We used
a regional chronology (i.e., all elevations into data set) andcompared it with seasonal precipitation and MEI (Nov.–Apr.)variables.
Lastly, multiple regressions (i.e., stepwise method) with thestatistical software SAS/STAT® (SAS 2004) were conductedin order to detect those MEI and Niño3 months with directrelations in TRI (p<0.1).
Results
Tree-ring chronology assessment
As shown in Table 2, the number of cores analyzed rangedfrom 15 to 32 per chronology. Mean series intercorrelationranged from 0.54 to 0.70. Mean sensitivities varied from 0.27to 0.45. The chronologies varied from 63 years (HE elevationzone) to 193 years (M zone). The five chronologies showedsimilar trends during the overlapping period (1946–2010).The expressed population signal (EPS) ranged from 0.73 to0.93.
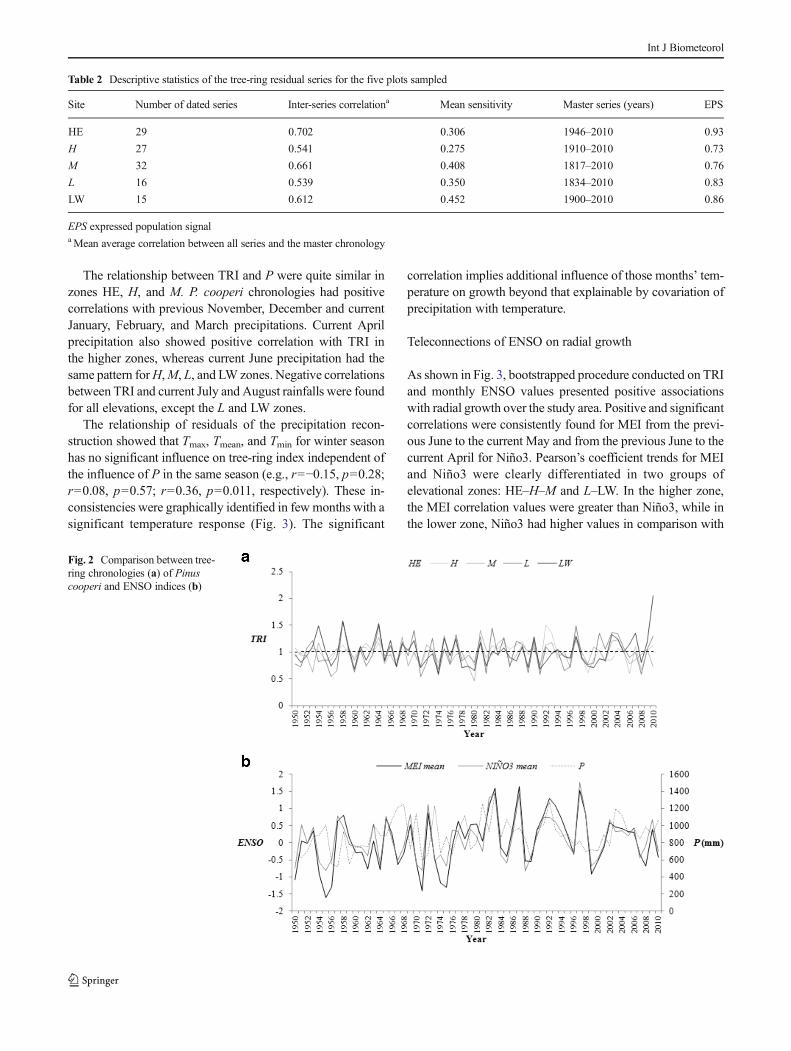
The five chronologies showed similar trends during theperiod they overlapped, indicating that the P. cooperi popula-tions shared an interannual growth variation (Fig. 2a). Ingeneral, ENSO index showed correspondences with tree-ring growth, in synchronous periods, especially noticeableduring the 1950s, 1960s, 1970s, 1990s, and 2000s (Fig. 2b).The most extreme Niño events occurred in 1982–1983 and1997–1998. La Niña events were noticeable in 1954–1955and 1971–1972.
Tree growth–climate relationships
As shown in Fig. 3, radial growth was significantly correlatedwith climate over the study area, with correlation coefficientsranging from −0.5 to 0.46. The Pearson’s coefficients (signif-icance at the 0.05 level) indicated that P and Tmin werepositively correlated with TRI across the elevational gradient.Tmax showed a negative correlation with TRI for all elevations,except for L and LW. Tmean did not have a consistent trend.
Table 1 Descriptive data of sampled plots of Pinus cooperi
Site Geographic coordinate Elevation (masl) Number of trees Number of dated series Mean Dbh (cm)
Longitude W (°) Latitude N (°)
HE 105.534944 23.747306 2,905 10 29 47.2
H 105.533583 23.752605 2,813 10 27 50.1
M 105.379611 24.189083 2,424 10 32 40.2
L 105.464778 24.177583 2,375 6 16 52.3
LW 105.056047 24.141570 2,330 10 15 42.8
Int J Biometeorol
The relationship between TRI and P were quite similar inzones HE, H, and M. P. cooperi chronologies had positivecorrelations with previous November, December and currentJanuary, February, and March precipitations. Current Aprilprecipitation also showed positive correlation with TRI inthe higher zones, whereas current June precipitation had thesame pattern forH,M, L, and LW zones. Negative correlationsbetween TRI and current July and August rainfalls were foundfor all elevations, except the L and LW zones.
The relationship of residuals of the precipitation recon-struction showed that Tmax, Tmean, and Tmin for winter seasonhas no significant influence on tree-ring index independent ofthe influence of P in the same season (e.g., r=−0.15, p=0.28;r=0.08, p=0.57; r=0.36, p=0.011, respectively). These in-consistencies were graphically identified in fewmonths with asignificant temperature response (Fig. 3). The significant
correlation implies additional influence of those months’ tem-perature on growth beyond that explainable by covariation ofprecipitation with temperature.
Teleconnections of ENSO on radial growth
As shown in Fig. 3, bootstrapped procedure conducted on TRIand monthly ENSO values presented positive associationswith radial growth over the study area. Positive and significantcorrelations were consistently found for MEI from the previ-ous June to the current May and from the previous June to thecurrent April for Niño3. Pearson’s coefficient trends for MEIand Niño3 were clearly differentiated in two groups ofelevational zones: HE–H–M and L–LW. In the higher zone,the MEI correlation values were greater than Niño3, while inthe lower zone, Niño3 had higher values in comparison with
Table 2 Descriptive statistics of the tree-ring residual series for the five plots sampled
Site Number of dated series Inter-series correlationa Mean sensitivity Master series (years) EPS
HE 29 0.702 0.306 1946–2010 0.93
H 27 0.541 0.275 1910–2010 0.73
M 32 0.661 0.408 1817–2010 0.76
L 16 0.539 0.350 1834–2010 0.83
LW 15 0.612 0.452 1900–2010 0.86
EPS expressed population signalaMean average correlation between all series and the master chronology
Fig. 2 Comparison between tree-ring chronologies (a) of Pinuscooperi and ENSO indices (b)
Int J Biometeorol
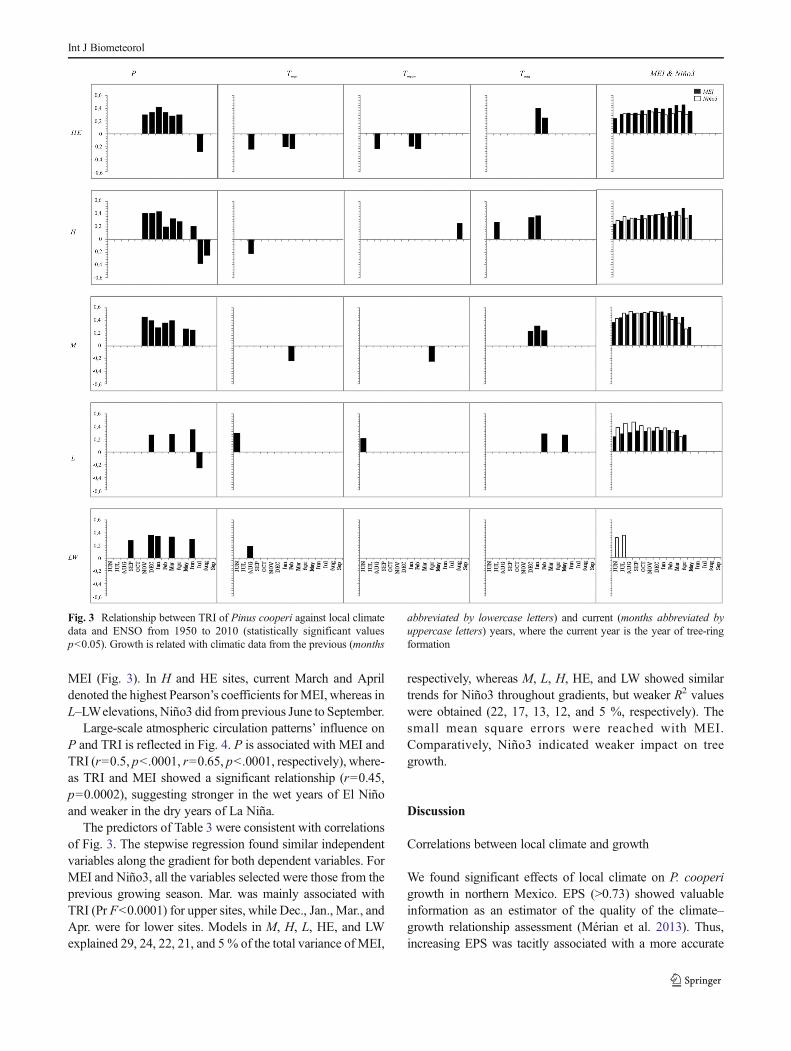
MEI (Fig. 3). In H and HE sites, current March and Aprildenoted the highest Pearson’s coefficients for MEI, whereas inL–LWelevations, Niño3 did from previous June to September.
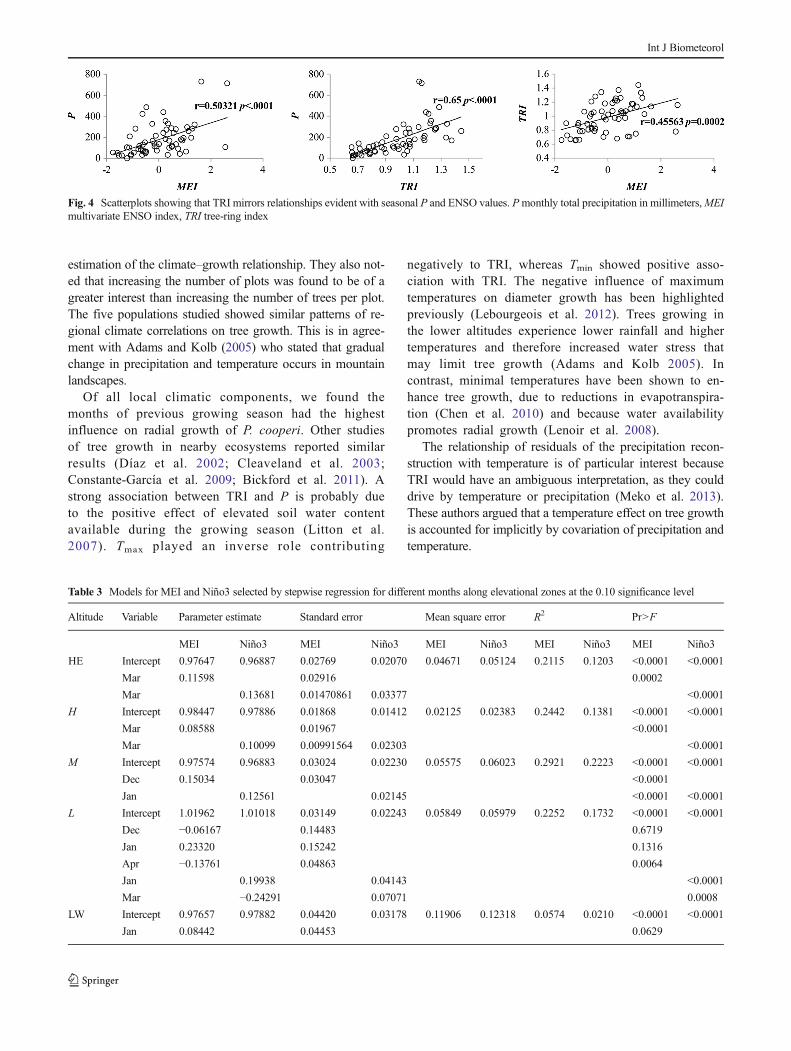
Large-scale atmospheric circulation patterns’ influence onP and TRI is reflected in Fig. 4. P is associated with MEI andTRI (r=0.5, p<.0001, r=0.65, p<.0001, respectively), where-as TRI and MEI showed a significant relationship (r=0.45,p=0.0002), suggesting stronger in the wet years of El Niñoand weaker in the dry years of La Niña.
The predictors of Table 3 were consistent with correlationsof Fig. 3. The stepwise regression found similar independentvariables along the gradient for both dependent variables. ForMEI and Niño3, all the variables selected were those from theprevious growing season. Mar. was mainly associated withTRI (Pr F<0.0001) for upper sites, while Dec., Jan., Mar., andApr. were for lower sites. Models in M, H, L, HE, and LWexplained 29, 24, 22, 21, and 5 % of the total variance ofMEI,
respectively, whereas M, L, H, HE, and LW showed similartrends for Niño3 throughout gradients, but weaker R2 valueswere obtained (22, 17, 13, 12, and 5 %, respectively). Thesmall mean square errors were reached with MEI.Comparatively, Niño3 indicated weaker impact on treegrowth.
Discussion
Correlations between local climate and growth
We found significant effects of local climate on P. cooperigrowth in northern Mexico. EPS (>0.73) showed valuableinformation as an estimator of the quality of the climate–growth relationship assessment (Mérian et al. 2013). Thus,increasing EPS was tacitly associated with a more accurate
Fig. 3 Relationship between TRI of Pinus cooperi against local climatedata and ENSO from 1950 to 2010 (statistically significant valuesp<0.05). Growth is related with climatic data from the previous (months
abbreviated by lowercase letters) and current (months abbreviated byuppercase letters) years, where the current year is the year of tree-ringformation
Int J Biometeorol
estimation of the climate–growth relationship. They also not-ed that increasing the number of plots was found to be of agreater interest than increasing the number of trees per plot.The five populations studied showed similar patterns of re-gional climate correlations on tree growth. This is in agree-ment with Adams and Kolb (2005) who stated that gradualchange in precipitation and temperature occurs in mountainlandscapes.
Of all local climatic components, we found themonths of previous growing season had the highestinfluence on radial growth of P. cooperi. Other studiesof tree growth in nearby ecosystems reported similarresults (Díaz et al. 2002; Cleaveland et al. 2003;Constante-García et al. 2009; Bickford et al. 2011). Astrong association between TRI and P is probably dueto the positive effect of elevated soil water contentavailable during the growing season (Litton et al.2007). Tmax played an inverse role contributing
negatively to TRI, whereas Tmin showed positive asso-ciation with TRI. The negative influence of maximumtemperatures on diameter growth has been highlightedpreviously (Lebourgeois et al. 2012). Trees growing inthe lower altitudes experience lower rainfall and highertemperatures and therefore increased water stress thatmay limit tree growth (Adams and Kolb 2005). Incontrast, minimal temperatures have been shown to en-hance tree growth, due to reductions in evapotranspira-tion (Chen et al. 2010) and because water availabilitypromotes radial growth (Lenoir et al. 2008).
The relationship of residuals of the precipitation recon-struction with temperature is of particular interest becauseTRI would have an ambiguous interpretation, as they coulddrive by temperature or precipitation (Meko et al. 2013).These authors argued that a temperature effect on tree growthis accounted for implicitly by covariation of precipitation andtemperature.
Fig. 4 Scatterplots showing that TRI mirrors relationships evident with seasonal P and ENSO values. Pmonthly total precipitation in millimeters,MEImultivariate ENSO index, TRI tree-ring index
Table 3 Models for MEI and Niño3 selected by stepwise regression for different months along elevational zones at the 0.10 significance level
Altitude Variable Parameter estimate Standard error Mean square error R2 Pr>F
MEI Niño3 MEI Niño3 MEI Niño3 MEI Niño3 MEI Niño3
HE Intercept 0.97647 0.96887 0.02769 0.02070 0.04671 0.05124 0.2115 0.1203 <0.0001 <0.0001
Mar 0.11598 0.02916 0.0002
Mar 0.13681 0.01470861 0.03377 <0.0001
H Intercept 0.98447 0.97886 0.01868 0.01412 0.02125 0.02383 0.2442 0.1381 <0.0001 <0.0001
Mar 0.08588 0.01967 <0.0001
Mar 0.10099 0.00991564 0.02303 <0.0001
M Intercept 0.97574 0.96883 0.03024 0.02230 0.05575 0.06023 0.2921 0.2223 <0.0001 <0.0001
Dec 0.15034 0.03047 <0.0001
Jan 0.12561 0.02145 <0.0001 <0.0001
L Intercept 1.01962 1.01018 0.03149 0.02243 0.05849 0.05979 0.2252 0.1732 <0.0001 <0.0001
Dec −0.06167 0.14483 0.6719
Jan 0.23320 0.15242 0.1316
Apr −0.13761 0.04863 0.0064
Jan 0.19938 0.04143 <0.0001
Mar −0.24291 0.07071 0.0008
LW Intercept 0.97657 0.97882 0.04420 0.03178 0.11906 0.12318 0.0574 0.0210 <0.0001 <0.0001
Jan 0.08442 0.04453 0.0629
Int J Biometeorol
Teleconnections between ENSO and tree growth
Our findings showed strong relationship between MEI andregional chronology (Fig. 4). Graphical trends show that TRImirrors relationships evident with seasonal P and ENSOvalues. Thus, tree response to ENSO is sensitive to the wetyears of El Niño and to the dry years of La Niña. These resultsreflected teleconnections of ENSO and local climate in north-ern Mexico. Pohl et al. (2003) reported that this region regis-ters one of the strongest extratropical ENSO signals world-wide. Also, Cleaveland et al. (2003) showed that cool seasonprecipitation over northernMexico and the southwestern USAis well-associated with ENSO. Stahle et al. (2012) highlightedthe association between El Niño 3.4 and seasonal precipitationover the past millennium. Lastly, Meko et al. (2013) suggeststhat precipitation variability in the winter is strongly linked toENSO in northern Mexico.
Although some connection between tree-ring growth andENSO has been observed previously in northern Mexico(Seager et al. 2009; Méndez and Magaña 2010; Stahle et al.2012), this work demonstrated that the positive relationshipbetween positive ENSO values (warm phases) and subsequenttree growth were consistent along five different elevationalzones. According to our results, the connection of P. cooperigrowth with ENSO is associated mostly with the precedingfall, winter, and early spring, whereas current growing seasondid not show a significant correlation. This trend may be dueto the change of ENSO phase (Stahle et al. 2012). Tree growthwas probably enhanced by positive effects of ENSO in annualwinter soil moisture and higher atmospheric vapor (Rozas andGarcía-Gonzalez 2012). Niños leads to warm waters in thenorthern Mexico impacting rainfall (Brienen et al. 2010). Thisagrees with expectations since precipitation in northernMexico is considered seasonal (Griffin et al. 2011). Thesefindings correspond with the hypothesis that damp winterscontribute to tree growth (Chen et al. 2010). Winter rains areusually of low intensity, favoring high infiltration and lowevapotranspiration, which result in a positive water balance(Constante-García et al. 2009). Thus, seasonal precipitationvariations recover great importance to study season-specificclimate (Therrell et al. 2002; Griffin et al. 2011).
Recently, dendrochronologists have targeted earlywoodand latewood width (Griffin et al. 2011; Griffin et al. 2013;Meko et al. 2013). They argued that intraannual ring widthcontains strong monsoon-specific precipitation signals. Theseproxies provide novel perspective on monsoon paleoclimatol-ogy and could reveal valuable seasonal precipitation variationthrough time for study area. Partial width measurements are inprogress for P. cooperi and will bemade available on the Tree-Ring Data Bank (ITRDB; http://www.ncdc.noaa.gov/data-access/paleoclimatology-data/datasets/tree-ring).
In addition, our findings showed different responses ofradial growth, according to the ENSO index used. MEI had
the highest influence on growth in upper zones. For the lowestzones, we observed stronger and more positive relations ofgrowth with Niño3. In spite of both indices revealing stronglinks on TRI, our results in Table 3 confirm the advantages ofMEI with respect to traditional SOI. Cerano-Paredes et al.(2011) correlated precipitation series with El Niño region 3.4indices. Although some coincident patterns were found, theperiod from 1951 to 1969 did not show a significant (p>0.05)association between two variables. While all other ENSOindices remain fixed in their spatial domain, the MEI allowsfor geographic variations in its seasonal features, being theonly ENSO index that allows for spatial variations of its keyfeatures with the seasonal cycle (Wolter and Timlin 2011).Thus, some inconsistency can occur due to the poor coverageaway from the major shipping lines (Worley et al. 2005).Furthermore, MEI reflects its multivariate occurrence basedon multiple variables, rather than just one variable field asNiño 3.4 does. Therefore, MEI is more accurate because it hasbeen achieving high-quality measurements (Wolter andTimlin 2011).
Conclusion
We found evidence that ENSO had connectivity with regionalclimate in northernMexico. Such teleconnections mostly havebeen detected as large-scale associations between positiveENSO (El Niño episodes) values and previous month precip-itation. Radial growth of P. cooperi populations has beendriven largely by El Niño events (warm phase). TRI betterexplained seasonal precipitation associated with ENSO. MEIwas a strong correlated variable that showed an outstandingcontribution as a response to precipitation. Our results mayalso have implications for other areas where rainfall variabilityhas been linked to ENSO or regions that are showing atendency toward increasing extreme droughts in the comingyears.
Acknowledgments This work was conducted within the framework ofacademic mobility supported by the UJED & CONACyT: “Postdoctoraland Sabbatical Stays Abroad for Consolidation of Researchers Teams.”We would like to thank the support given by the School of Forestry atNorthern Arizona University. The CENID-RASPA Lab from INIFAPsupported data gathering and processing. Jacob Baker reviewed earlyversions of this manuscript. The authors are grateful to the Editors andanonymous reviewers for their helpful reviews. Also, we thank D. Griffinfor his useful suggestions that improved this manuscript.
References
Adams HD, Kolb TE (2005) Tree growth response to drought andtemperature in a mountain landscape in northern Arizona, USA. JBiogeogr 32:1629–1640. doi:10.1111/j.1365-2699.2005.01292.x
Int J Biometeorol
Bannayan M, Lotfabadi S, Sanjani S, Mohammadian A, Agaalikhani M(2011) Effects of precipitation and temperature on cereal yieldvariability in northeast of Iran. Int J Biometeorol 55:387–40. doi:10.1007/s00484-010-0348-7
Beniston M (2002) Climate modeling at various spatial and temporalscales: where can dendrochronology help? Dendrochronologia 20:117–131
Bickford IN, Fulé ZP, Kolb TE (2011) Growth sensitivity to drought ofco-occurring Pinus spp. along an elevation gradient in northernMexico. West N Am Nat 71(3):338–348
Biondi F, Waikul J (2004) DENDROCLIM2002: a C++ program forstatistical calibration of climate signals in tree-ring chronologies.Comp Geosci 30:303–311. doi:10.1016/j.cageo.2003.11.004
Brienen RJW, Lebrija-Trejos E, Zuidema PA, Martínez-Ramos M (2010)Climate-growth analysis for a Mexican dry forest tree shows strongimpact of sea surface temperatures and predicts future growth de-clines. Glob Chang Biol 16:2001–2012
Cerano-Paredes J, Villanueva-Diáz J, Valdez-Cepeda RD, Arreola-AvilaJG, Constante-García V (2011) Effects of the El Niño SouthernOscillation on precipitation in the upper Nazas river watershed.Rev Chapingo XVII:207–215
Chen P, Welsh C, Hamann A (2010) Geographic variation in growthresponse of Douglas-fir to inter-annual climate variability andprojected climate change. Glob Chang Biol 16:3374–3385. doi:10.1111/j.1365-2486.2010.02166.x
Cleaveland MK, Stahle DW, Therrell MD, Villanueva-Díaz J,Buns BT (2003) Tree-ring reconstructed winter precipitationand tropical teleconnections in Durango, Mexico. ClimChang 59:369–388
Constante-García V, Villanueva-Díaz J, Cerano-Paredes J, Cornejo-Oviedo EH, Valencia-Manzo S (2009) Dendrochronology of Pinuscembroides Zucc. and rainfall seasonal reconstruction in CoahuilaSoutheastern. Rev Cien For en Méx 34:17–38
Cook, E.R., Holmes, R.L., 1996. Guide for computer program ARSTAN.The International Tree-RingData Bank ProgramLibraryVersion 2.0User’s Manual (ed. by H.D. Grissino-Mayer, R.L. Holmes and H.C.Fritts), pp. 75-87. Laboratory of Tree-Ring Research, University ofArizona, Tucson.
Cruz CF, de los Santos PHM, Valdez LJR (2008) Compatible taper-volume system for Pinus cooperi blanco in Durango, México.Agrociencia 42(4):473–485
CNA (Comisión Nacional del Agua) (2012). Datos climáticos deestaciones meteorológicas de Durango: El Salto y Otinapa.(Climatic weather of Durango State, el Salto). <http://smn.cna.gob.mx/emas/> (accessed February 8, 2013)
Díaz SC, Therrell MT, Stahle DW, Cleaveland MK (2002) Chihuahuawinter-spring precipitation reconstructed from tree-rings. Clim Res22:237–244
Fritts HC (2001) Tree rings and climate. Blackburn Press, Caldwell, p 567Griffin D, Meko DM, Touchan R, Leavitt SW, Woodhouse CA (2011)
Latewood chronology development for summer-moisture recon-struction in the U.S. Southwest. Tree-Ring Res 67:87–101. doi:10.3959/2011-4.1
Griffin D,Woodhouse CA,MekoDM, Stahle DW, Faulstich HL, CarrilloC, Touchan R, Castro CL, Leavitt SW (2013) North Americanmonsoon precipitation reconstructed from tree-ring latewood.Geophys Res Lett 40:954–958. doi:10.1002/grl.50184
Holmes RL (1983) Computer-assisted quality control in tree-ring datingand measurement. Tree-Ring Bull 43:69–78
Lebourgeois F, Mérian P, Courdier F, Ladier J, Dreyfus P (2012)Instability of climate signal in tree-ring width in Mediterraneanmountains: a multi-species analysis. Trees Struct Funct 26:715–729. doi:10.1007/s00468-011-0638-7
Lenoir J, Gegout JC, Marquet PA, de Ruffray P, Brisse H (2008) Asignificant upward shift in plant species optimum elevation duringthe 20th century. Science 320:1768–1771
Litton CM, Raich JW, Ryan MG (2007) Carbon allocation in forestecosystems. Glob Chang Biol 13:2089–2109
Lo YH, Blanco JA, Seely B, Welham C, Kimmins JP (2010)Relationships between climate and tree radial growth in interiorBritish Columbia, Canada. For Ecol Manag 259:932–942. doi:10.1016/j.foreco.2009.11.033
Meko DM, Touchan R, Anchukaitis KA (2011) Seascorr: a MATLABprogram for identifying the seasonal climate signal in an annual tree-ring time series. Comput Geosci 37:1234–1241. doi:10.1016/j.cageo.2011.01.013
Meko DM, Touchan R, Villanueva-Díaz J, Griffin D, Woodhouse CA,Castro CL, Carillo C, Leavitt SW (2013) Sierra San Pedro Mártir,Baja California, cool-season precipitation reconstructed from early-wood width of Abies concolor tree rings. J Geophys Res Biogeosci118:1660–1673. doi:10.1002/2013JG002408
Méndez M, Magaña V (2010) Regional aspects of prolonged meteoro-logical droughts over Mexico and Central America. J Clim 23(5):1175–1188
Mérian P, Pierrat J, Lebourgeois F (2013) Effect of sampling effort on theregional chronology statistics and climate–growth relationships es-timation. Dendrochronologia 31:58–67. doi:10.1016/j.dendro.2012.07.001
Pohl K, Therrell MD, Santiago BJ, Ayotte N, Bernal SJ, Cabrera HJ,Castro DS, Elvir JA, Gonzales EM, Opland D, Park J, Pederson G,Vazguez SL, Villanueva-Díaz J, Cornejo OE, Stahle DW (2003) Acool-season precipitation reconstruction for Saltillo, Mexico. Tree-Ring Res 59(1):11–19
Pompa-García M, Jurado E (2013) Seasonal precipitation reconstructionand teleconnections with ENSO based on tree ring analysis of Pinuscooperi. Theor Appl Climatol. doi:10.1007/s00704-013-1018-6
Rozas V, García-Gonzalez I (2012) Non-stationary influence of El Niño-Southern Oscillation and winter temperature on oak latewoodgrowth in NW Iberian Peninsula. Int J Biometeorol 56:787–800
SAS (Statistical Analysis System) (2004) SAS user’s guide statis-tics. Release 9.1. SAS Institute Inc, Cary, North Carolina,USA, p 2170
Seager R, TingM, Davis M, CaneM, Naik N, Nakamura J, Li C, Cook E,Stahle D (2009) Mexican drought: an observational modeling andtree ring study of variability and climate change. Atmosfera 22:1–31
Senkbeil JC, Rodgers JC, Sheridan SC (2007) The sensitivity of treegrowth to air mass variability and the Pacific Decadal Oscillation incoastal Alabama. Int J Biometeorol 51:483–491. doi:10.1007/s00484-007-0087-6
Stahle DW, Burnette DJ, Villanueva-Diaz J, Heim RR Jr, Fye FK,Cerano-Paredes J, Acuna-Soto R, Cleaveland MK (2012) Pacificand Atlantic influences on Mesoamerican climate over the pastmillennium. Clim Dyn 39(6):1431–1446. doi:10.1007/s00382-011-1205-z
Stokes MA, Smiley TL (1968) An introduction to tree-ring dating. Univ.of Chicago Press, Chicago, p 73
Therrell, M.D., Stahle, D.W., Cleaveland, M.K. and Villanueva- Diaz, J(2002) Warm season tree growth and precipitation over Mexico.Journal of Geophysical Research 107(D14), doi:10.1029/2001DJ000851
Villalba R, Luckman BH, Boninsegna JA, D’Arrigo RD, Lara A,Villanueva-Diaz J, Masiokas M, Argollo J, Soliz C, LeQuesne C,Stahle D, Roig F, Aravena JC, Wiles G, Hartsough P, Wilson RJS,Watson E, Cook ER, Cerano-Paredes J, Therrell M, Cleaveland M,MoralesMJ, Moya J, Pacajes J, Massacchesi G, Biondi F, Urrutia R,Martinez PG (2011) Dendroclimatology from regional to continen-tal scales: understanding regional processes to reconstruct large-scale climatic variations across the Western Americas. In Hughes,M.K., Swetnam, T.W. and Diaz, H.F. (eds.) Dendroclimatology:progress and prospects, Springer. Book Chapter 7. p. 175-227
Villanueva–Díaz J, Stahle DW, Luckman B, Cerano–Paredes J, TherrellMD, Cleaveland MK, Cornejo–Oviedo E (2007) Winter–spring
Int J Biometeorol

precipitation reconstructions from tree rings for northeast México.Clim Chang 83:117–131
Williams AP, Allen CD, Macalady AK, Griffin D, Woodhouse CA, MekoDM, Swetnam TW, Rauscher SA, Seager R, Grissino-Mayer HD,Dean JS, Cook ER, Gangodagamage C, Cai M, McDowell NG(2012) Temperature as a potent driver of regional forest drought stressand tree mortality. Nat Clim Chang. doi:10.1038/NCLIMATE1693
Wolter K, Timlin MS (1993) Monitoring ENSO in COADS with aseasonally adjusted principal component index. Proc. of the 17thClimate Diagnostics Workshop, Norman, OK, NOAA/NMC/CAC,
NSSL, Oklahoma Clim. Survey, CIMMS and the School ofMeteor.,Univ. of Oklahoma, 52-57
Wolter K, Timlin MS (1998) Measuring the strength of ENSO events—how does 1997/98 rank? Weather 53:315–324
Wolter K, Timlin MS (2011) El Niño/Southern Oscillation behavior since1871 as diagnosed in an extended multivariate ENSO index (MEI.ext). Int J Climatol 31:1074–1087
Worley SJ, Woodruff SD, Reynolds RW, Lubker SJ, Lott N (2005)ICOADS Release 2.1 data and products. Int J Climatol 25:823–842. doi:10.1002/joc.1166, CLIMAR-II Special Issue
Int J Biometeorol