Embed Size (px)
Citation preview

DIS
CU
SSIO
N P
APE
R May 2007 RFF DP 07-32
Tree Cover Loss in El Salvador’s Shade Coffee Areas
Al len B lackman , Bea t r i z Áva los -Sar to r io ,
and Je f f re y Chow
1616 P St. NW Washington, DC 20036 202-328-5000 www.rff.org
© 2007 Resources for the Future. All rights reserved. No portion of this paper may be reproduced without permission of the authors.
Discussion papers are research materials circulated by their authors for purposes of information and discussion. They have not necessarily undergone formal peer review.
Tree Cover Loss in El Salvador’s Shade Coffee Areas
Allen Blackman, Beatriz Ávalos-Sartorio, and Jeffrey Chow
Abstract Shade coffee farms in Central America provide important ecological services. But because
international coffee prices have fallen since 1990, many have been cleared to make way for more remunerative land uses. This problem is of particular concern in heavily deforested El Salvador, where a large share of the remaining tree cover is associated with shade coffee. We use satellite images, stakeholder interviews, and secondary data to analyze the magnitude, characteristics, and drivers of clearing in El Salvador’s shade coffee areas during the 1990s. We find that 13 percent of these areas was cleared, mostly in middle- and high-altitude regions. Falling coffee prices were not the only drivers of this phenomenon, however: a downward spiral of on-farm investment and yields, debt, poverty, urbanization, migration, and weak land use regulation also contributed. Our findings suggest that stricter enforcement of land use and land cover regulations is urgently needed to prevent further clearing.
Key Words: shade coffee, land use, land cover, deforestation, El Salvador
JEL Classification Numbers: Q15, Q17, Q18, Q23

Contents
1. Introduction......................................................................................................................... 1
2. El Salvador’s Coffee Sector................................................................................................ 3
3. Data from Satellite Images................................................................................................. 4
4. Factors Driving Tree Cover Loss in the 1990s ................................................................. 6
4.1. Downward Spiral of On-Farm Investment and Yields ................................................ 6
4.2. Debt.............................................................................................................................. 7
4.3. Poverty ......................................................................................................................... 7
4.4. Urbanization................................................................................................................. 8
4.5. Migration and Remittances .......................................................................................... 9
4.6. Weak Land Use and Land Cover Management ......................................................... 10
5. Land Uses Replacing Shade Coffee ................................................................................. 10
6. Conclusion ......................................................................................................................... 11
References.............................................................................................................................. 13
Figures.................................................................................................................................... 15
Resources for the Future Blackman et al.
Tree Cover Loss in El Salvador’s Shade Coffee Areas
Allen Blackman, Beatriz Ávalos-Sartorio, and Jeffrey Chow∗
1. Introduction
In 2001, after a decade of decline interrupted by short-term spikes, inflation-adjusted world coffee prices dropped to their lowest levels in a half-century. The causes of this phenomenon, commonly referred to as the coffee crisis, included the collapse of the international coffee cartel in the late 1980s, increased production in Vietnam and Brazil, weak demand for low-end coffee, and growing concentration in the roasting sector. Because these factors are structural rather than cyclical, prices are unlikely to rebound to pre-1990 levels, at least not in the near term (Varangis et al. 2003). The coffee crisis has caused economic dislocation in Central America, where coffee is a leading agricultural sector (World Bank 2005). Less well known is that the crisis has also had adverse environmental impacts (IADB et al. 2002). Most important, it has led to a significant loss of tree cover and related ecological services.
On most Central America coffee farms, tree cover is used to moderate temperature, humidity, and sunlight. Unlike most agricultural land uses, this mixed agroforestry system provides many of the same ecological services associated with natural forests—harboring biodiversity, preventing soil erosion, sequestering carbon, facilitating aquifer recharge—albeit at a lower level in most cases. Shade coffee’s biodiversity benefits are particularly notable. The crop grows in mountain ranges at altitudes where tropical and temperate climates overlap, areas that are extremely rich in biodiversity (Rice 2003; Perfecto et al. 1996). As coffee prices have declined, however, tree cover in Central American shade coffee areas has been cleared to make way for more remunerative land uses, including urban development, conventional farming,
∗ Allen Blackman (corresponding author, [email protected], 202 328-5073, fax 202 939-3460), Resources for the Future, 1616 P Street, N.W., Washington, DC 20036; Beatriz Ávalos-Sartorio, Senior Agricultural Research Officer, Consultative Group for International Agricultural Research , Science Council Secretariat, FAO NRDS, Room C-636, Viale delle Terme di Caracalla, Rome 00153, Italy; Jeffrey Chow, Research Associate, Resources for the Future. We are grateful to Sergio Gil, Oscar Gómez, and Carlos Pleitez at PROCAFE for their multifaceted assistance; the IADB and the Tinker Foundation for financial support; Sassan Saatchi at NASA’s Jet Propulsion Laboratory for land cover data; Diego Arias, Silvia Oritz, and Sybille Nuenninghoff at IADB, Deborah Barry at CIFOR, and Jeffrey Jones at CATIE for helpful comments and logistical support; and to our many interviewees in El Salvador.
1

Resources for the Future Blackman et al.
ranching, and logging. As a result, critical ecological services have been lost. Some of the consequent damages—for example, species loss and soil erosion—may be irreversible or nearly so.
Although this problem is beginning to attract the attention of policymakers (see, e.g., IADB et al. 2002; Varangis et al. 2003; ICO 2004), it remains poorly understood. Little is known about its magnitude, characteristics, and drivers. As a first step toward filling this gap, this paper analyzes tree cover loss in El Salvador’s shade coffee areas during the 1990s. We focus on El Salvador because its shade coffee provides particularly important ecological services. El Salvador is the most densely populated country in Latin America and also the most severely deforested. Less than 10 percent of its natural forests survive, and a significant share of remaining tree cover is associated with shade coffee (FAO 2002). We focus on the decade of the 1990s because, as discussed below, the digital land cover maps needed to analyze tree cover loss are available for this decade.1 In addition to land cover maps derived from satellite images, our analysis relies on primary and secondary documents and interviews with representatives of coffee cooperatives, government regulatory agencies, trade associations, coffee exporters, development banks, nongovernmental organizations, and research institutes.
The remainder of this paper is organized as follows. Section 2 provides background information on El Salvador’s coffee sector. Section 3 presents the results of an analysis of satellite images. Section 4 discusses the factors that contributed to tree cover loss in shade coffee areas during the 1990s. Section 5 identifies the land uses that substituted for shade coffee. Finally, Section 6 offers a summary of our principal findings and a discussion of their policy implications.
1 The extent to which our study period coincides with—or predates—the “coffee crisis” is open to question; a precise definition of this term does not exist. Recent studies frequently use it to refer to the precipitous decline of prices between 1997 and 2001 (e.g., Varangis et al. 2003; World Bank 2005a). However, the overall downward trend in coffee prices that culminated in this steep five-year slide began decades earlier and many researchers use the 1989 collapse of the International Coffee Agreements (ICA) quota system to mark the start of the coffee crisis (e.g., Ponte 2002; Gresser and Tickell 2002). Hence, using the first definition, our study period overlaps with the last three years of the coffee crisis. Using the second definition, it covers a ten-year period in the middle of the crisis. In both cases, however, our study period misses the trough in prices that occurred in 2001.
2

Resources for the Future Blackman et al.
2. El Salvador’s Coffee Sector
Coffee in El Salvador grows in three main areas: the western region, located in the Apaneca-Ilamatapec mountain range; the central region, located in the El Balsamo and Chichontepc volcano mountain ranges; and the eastern region, located in the Tecapa Chinameca and Cachuatiqe mountain ranges (Figure 1). In the 2003–2004 harvest season, coffee was planted on a total of 161,000 hectares. Fifty-two percent of this acreage was in the west, 29 percent in the center, and 19 percent in the east. More than 45 percent of El Salvador’s coffee acreage lies above 800 meters above sea level (m.s.l.) (PROCAFE 2004).
Ninety-five percent of El Salvador’s coffee is shade grown (GEF 1998). The type and density of shade cover that farmers use depend partly on the altitude and local microclimate. Coffee farms in lowland areas typically have 40 percent shade cover, while those in highland areas typically have 20 percent shade cover (Gomez 2005).
In the 2003–2004 harvest season, El Salvador produced almost 2 million quintals (46-kg. sacks) of green coffee (PROCAFE 2004). This production represented about 1 percent of the world’s total that season and 11 percent of Central America’s total (ICO 2006). Ninety percent of the crop was exported, generating over $120 million in revenue. In the 2003–2004 season, the coffee sector employed more than 57,000 people permanently and paid some $14 million in wages (PROCAFE 2004).
Most Salvadoran coffee is relatively high in quality. The Salvadoran Coffee Council assigns coffee one of three quality standards depending on the altitude at which it is grown: “central standard” for coffee grown at 600–800 m.s.l.; “high grown” for coffee grown at 800–1,200 m.s.l.; and “strictly high grown” for coffee grown above 1,200 m.s.l. Almost three quarters of Salvadoran coffee exports are either high grown or strictly high grown, and another 5 percent is “gourmet.” Although other types of specialty coffees, including “organic,” “Rainforest Alliance certified,” and “fair trade,” have appeared in the past several years, they still make up less than 1 percent of overall exports (PROCAFE 2004).
The Salvadoran coffee sector suffered from a series of shocks during the 1990s. After a decade of decline in the 1980s, coffee prices rebounded for three harvest years in the mid- to late-1990s (1994–1995 through 1997–1998) in part because of a severe freeze in Brazil that reduced world supply, but then continued an overall downward slide in 1998–1999 (PROCAFE 2004). Several climatic events also adversely affected Salvadoran coffee production during the 1990s, including severe drought in 1997 associated with an El Niño event and Hurricane Mitch in 1998 (Varangis et al. 2003; World Bank 2001).
3

Resources for the Future Blackman et al.
The effects of price and climate shocks on the coffee sector during the 1990s were dramatic. Production, yields, wages, and permanent employment fell by 23–24 percent between 1991–1992 and 2000–2001, while exports and export revenue fell by approximately 20 percent. The impact of lower prices between 1991–1992 and 2003–2004 was even more dramatic. Production fell by 38 percent and yields by 36 percent. Wages and permanent employment fell by 64 percent, and exports and export revenue fell by 37 percent.
3. Data from Satellite Images
To analyze tree cover loss in El Salvador’s shade coffee areas, we rely on digital land cover maps for 1990 and 2000. Both maps were created by the NASA Jet Propulsion Laboratory by using a single land cover methodology to classify 30-meter resolution LANDSAT satellite images.2 The maps do not distinguish between shade coffee and other types of tree cover. Therefore, to identify areas where coffee was growing, we used a Salvadoran Ministry of Agriculture (MAG) land use map for 1992–1994. The MAG map identifies only the perimeters of the three main coffee-growing areas, which collectively encompass 197,000 hectares. In 1993–94, 164,000 hectares, representing 83 percent of the MAG-defined coffee area, were planted in coffee (PROCAFE 2004).
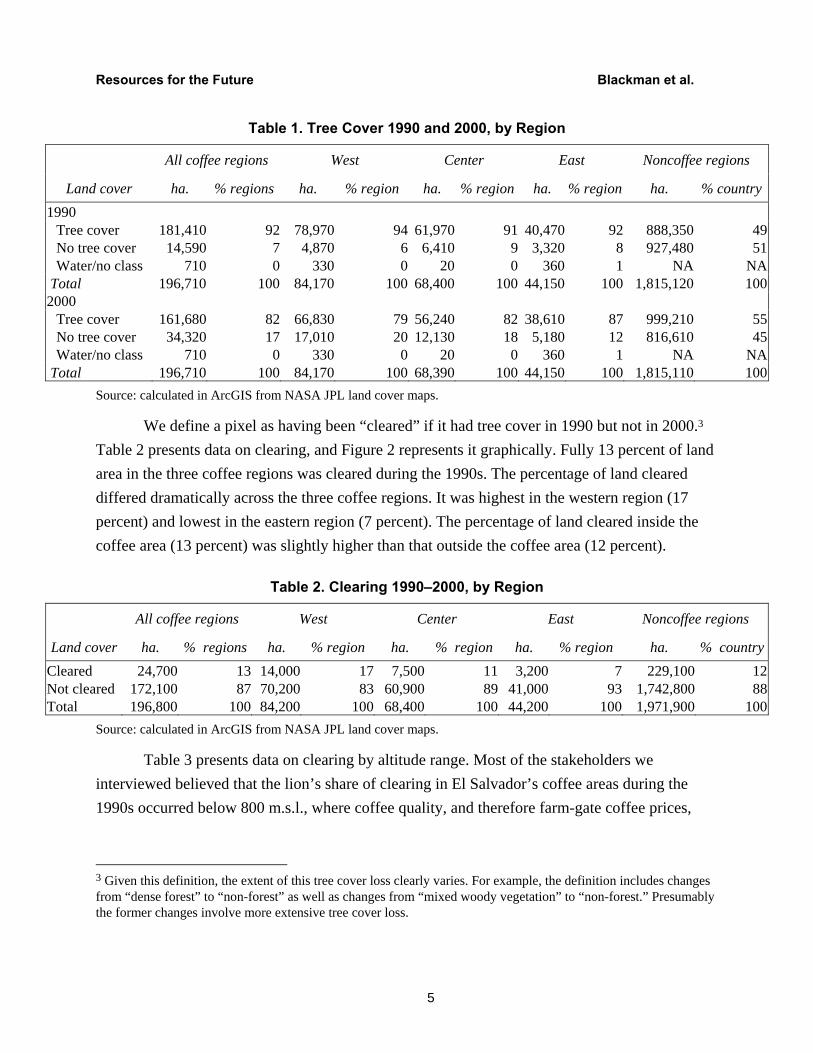
To create the 1990 and 2000 land cover maps, NASA’s Jet Propulsion Laboratory assigned each 30-meter pixel in the underlying satellite image to one of five categories, three of which—“dense forest,” “woody vegetation,” and “mixed woody vegetation”—entail tree cover, and two of which—“water or no class” and “nonforest”—do not. Table 1 presents data on tree cover in the three coffee areas. A comparison of 1990 tree cover inside the coffee regions (third column from the left) and outside the coffee regions (last column on the right) suggests that until 1990, shade coffee provided a bulwark against tree cover loss. Although 51 percent of the noncoffee area had no tree cover, only 7 percent of the coffee regions had none. The data clearly show that considerable tree cover in the coffee regions was lost between 1990 and 2000. For all three coffee regions, land without tree cover increased from 7 percent to 17 percent during this time.
2 Dr. Sassan Saatchi, a Senior Researcher at NASA’s Jet Propulsion Laboratory, supervised the creation of the maps and generously agreed to let us use them for this project.
4
Resources for the Future Blackman et al.
Table 1. Tree Cover 1990 and 2000, by Region
All coffee regions West Center East Noncoffee regions
Land cover ha. % regions ha. % region ha. % region ha. % region ha. % country1990
Tree cover 181,410 92 78,970 94 61,970 91 40,470 92 888,350 49No tree cover 14,590 7 4,870 6 6,410 9 3,320 8 927,480 51Water/no class 710 0 330 0 20 0 360 1 NA NA
Total 196,710 100 84,170 100 68,400 100 44,150 100 1,815,120 1002000
Tree cover 161,680 82 66,830 79 56,240 82 38,610 87 999,210 55No tree cover 34,320 17 17,010 20 12,130 18 5,180 12 816,610 45Water/no class 710 0 330 0 20 0 360 1 NA NA
Total 196,710 100 84,170 100 68,390 100 44,150 100 1,815,110 100Source: calculated in ArcGIS from NASA JPL land cover maps.
We define a pixel as having been “cleared” if it had tree cover in 1990 but not in 2000.3 Table 2 presents data on clearing, and Figure 2 represents it graphically. Fully 13 percent of land area in the three coffee regions was cleared during the 1990s. The percentage of land cleared differed dramatically across the three coffee regions. It was highest in the western region (17 percent) and lowest in the eastern region (7 percent). The percentage of land cleared inside the coffee area (13 percent) was slightly higher than that outside the coffee area (12 percent).
Table 2. Clearing 1990–2000, by Region
All coffee regions West Center East Noncoffee regions
Land cover ha. % regions ha. % region ha. % region ha. % region ha. % countryCleared 24,700 13 14,000 17 7,500 11 3,200 7 229,100 12Not cleared 172,100 87 70,200 83 60,900 89 41,000 93 1,742,800 88Total 196,800 100 84,200 100 68,400 100 44,200 100 1,971,900 100
Source: calculated in ArcGIS from NASA JPL land cover maps.
Table 3 presents data on clearing by altitude range. Most of the stakeholders we interviewed believed that the lion’s share of clearing in El Salvador’s coffee areas during the 1990s occurred below 800 m.s.l., where coffee quality, and therefore farm-gate coffee prices,
3 Given this definition, the extent of this tree cover loss clearly varies. For example, the definition includes changes from “dense forest” to “non-forest” as well as changes from “mixed woody vegetation” to “non-forest.” Presumably the former changes involve more extensive tree cover loss.
5

Resources for the Future Blackman et al.
were relatively low. Table 3 demonstrates that this conventional wisdom is incorrect. For all three coffee regions, 46 percent of clearing occurred between 800 and 1,200 m.s.l., where coffee is classified as high grown, and another 15 percent occurred above 1,200 meters, where coffee is classified as strictly high grown.
Table 3. Clearing 1990–2000 in All Three Coffee Regions, by Altitude Range
Range Area in range Cleared in 1990 Cleared in 2000 Cleared 1990–2000
m.s.l. ha. % region ha. % range ha. % range ha. % range % all
clearing 0-800 78,200 40 8,680 11 14,890 19 9,440 12 38801-1200 90,000 46 3,890 4 13,690 15 11,510 13 471201+ 29,200 15 540 2 3,940 13 3,670 13 15All 197,400 100 13,100 7 32,510 16 24,620 12 100
Source: calculated in ArcGIS from NASA JPL land cover maps.
Table 3 also shows that the conventional wisdom reflected the situation prior to 1990, when cleared land as a percentage of total land in each altitude range was almost twice as high below 800 m.s.l. as in the altitude ranges above 800 m.s.l. But since most clearing during the 1990s occurred above 800 m.s.l, by 2000, these percentages were more or less equal in each of the three altitude ranges.
4. Factors Driving Tree Cover Loss in the 1990s
As discussed in the introduction, low international coffee prices were an important driver of tree clearing in El Salvador’s coffee regions during the 1990s. However, interviews with coffee sector stakeholders as well as primary and secondary documents suggest that six complementary factors contributed to or influenced tree cover loss in El Salvador’s shade coffee areas during this period.
4.1. Downward Spiral of On-Farm Investment and Yields
The coffee crisis led to a downward spiral of on-farm investment and yields in the coffee sector. The spiral began when growers reacted to low prices by cutting back or completely eliminating farm management activities, such as pruning and the application of fertilizers and pesticides, which together account for approximately half of per hectare coffee production costs (World Bank 2001). Although such cost-cutting measures helped balance cash accounts in the short term, they also had short- and long-term negative impacts on yields. Reduced yields led to even lower profits, and lower profits led to further cutbacks in farm maintenance (Batz et al.
6
Resources for the Future Blackman et al.
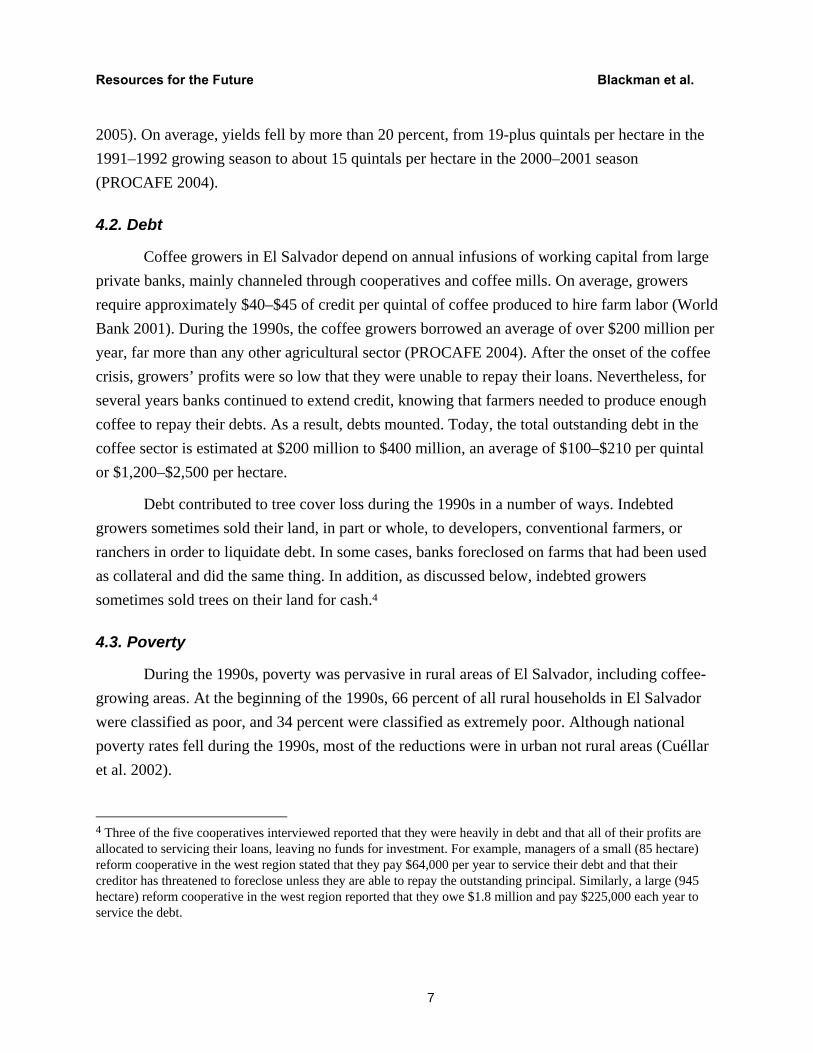
2005). On average, yields fell by more than 20 percent, from 19-plus quintals per hectare in the 1991–1992 growing season to about 15 quintals per hectare in the 2000–2001 season (PROCAFE 2004).
4.2. Debt
Coffee growers in El Salvador depend on annual infusions of working capital from large private banks, mainly channeled through cooperatives and coffee mills. On average, growers require approximately $40–$45 of credit per quintal of coffee produced to hire farm labor (World Bank 2001). During the 1990s, the coffee growers borrowed an average of over $200 million per year, far more than any other agricultural sector (PROCAFE 2004). After the onset of the coffee crisis, growers’ profits were so low that they were unable to repay their loans. Nevertheless, for several years banks continued to extend credit, knowing that farmers needed to produce enough coffee to repay their debts. As a result, debts mounted. Today, the total outstanding debt in the coffee sector is estimated at $200 million to $400 million, an average of $100–$210 per quintal or $1,200–$2,500 per hectare.
Debt contributed to tree cover loss during the 1990s in a number of ways. Indebted growers sometimes sold their land, in part or whole, to developers, conventional farmers, or ranchers in order to liquidate debt. In some cases, banks foreclosed on farms that had been used as collateral and did the same thing. In addition, as discussed below, indebted growers sometimes sold trees on their land for cash.4
4.3. Poverty
During the 1990s, poverty was pervasive in rural areas of El Salvador, including coffee-growing areas. At the beginning of the 1990s, 66 percent of all rural households in El Salvador were classified as poor, and 34 percent were classified as extremely poor. Although national poverty rates fell during the 1990s, most of the reductions were in urban not rural areas (Cuéllar et al. 2002).
4 Three of the five cooperatives interviewed reported that they were heavily in debt and that all of their profits are allocated to servicing their loans, leaving no funds for investment. For example, managers of a small (85 hectare) reform cooperative in the west region stated that they pay $64,000 per year to service their debt and that their creditor has threatened to foreclose unless they are able to repay the outstanding principal. Similarly, a large (945 hectare) reform cooperative in the west region reported that they owe $1.8 million and pay $225,000 each year to service the debt.
7

Resources for the Future Blackman et al.
Rural poverty contributed to tree cover loss in coffee-growing areas in several ways. First, after the onset of the coffee crisis, poor, small-scale growers unable to meet their basic subsistence needs from coffee alone cleared portions of their farms to grow maize, beans, and other basic food crops. This phenomenon has been a common response to poverty and income variability among all types of rural households in El Salvador, and it is a leading cause of tree cover loss in other Mesoamerican shade coffee–growing regions (Rodríguez-Meza et al. 2004; Blackman et al. 2007). In addition, poor rural households sold trees for lumber and firewood, both of which command a significant per unit price in El Salvador. Finally, in some cases, rural entrepreneurs harvested trees on abandoned or poorly supervised farms without obtaining permission.
4.4. Urbanization
With a 2000 population of 6.3 million inhabiting an area of just 21,000 square kilometers, El Salvador has more than 315 persons per square kilometer, making it the most densely populated country on the American continent. By comparison, Guatemala and Honduras have 104 and 58 persons per square kilometer (Cerrutti and Bertoncello 2003). Not surprisingly, given this density, El Salvador is an increasingly urban country. In 2000, 55 percent of El Salvador’s population lived in urban areas, up from 39 percent in 1970 (Cerrutti and Bertoncello 2003). Land under urban uses grew from 0.8 percent of the national territory in 1965 to 5 percent in 1995 (World Bank 1997).
Demand for land for housing has grown steadily over the past two decades, particularly since the signing of peace accords in El Salvador in 1992, and particularly in highland areas, including those used to grow coffee, which have a more hospitable climate than lowland areas. Over the past decade, all manner of farms, including coffee farms, have been divided into small lots and sold to construction companies or directly to homesteaders, a process known as “lotification.” Lotification does not cater just to the middle or upper class. Rather, small lots averaging 250 square meters, with no preexisting buildings, infrastructure, or services, are sold at modest prices to low-income households (World Bank 1997).
Strong demand for housing land has driven up land prices. In many areas, the price of agricultural land has risen well above the net present value of its lifetime productive value, making continued agricultural use unprofitable and creating powerful incentives for coffee growers to sell their farms (World Bank 1997).
8

Resources for the Future Blackman et al.
4.5. Migration and Remittances
Civil unrest and chronic poverty in rural areas have spurred massive internal and external migration in El Salvador over the past 20 years. Much of the internal migration has been from the eastern and northern parts of the country to the southwestern parts, including the greater metropolitan area of San Salvador. This phenomenon, along with population growth, has caused a dramatic shift in the geographic distribution of El Salvador’s population. Between 1971 and 2000, the share of El Salvador’s population living in the southwest rose from 53 percent to 67 percent. By comparison, the share of the country’s population living in the southeast fell from 28 percent to 20 percent, and the share of the population living in the north fell from 19 percent to 13 percent (Cuéllar et al. 2002). To the extent internal migration has exacerbated population pressures in the southwest, it has contributed to clearing of coffee farms in this area, for both urban and agricultural uses.
Although internal migration during the 1990s was significant, it paled in comparison with external migration. In 2000, for example, three-quarters of rural migration was external, and virtually all of it was to North America (Cuéllar et al. 2002). The Salvadoran ministry of foreign relations estimates that 2.5 million Salvadorans—roughly a fifth of the total population—now live abroad, and that 90 percent of these migrants live in the United States (Cuéllar et al. 2002).
Given this massive external migration, remittances have become a critical feature of El Salvador’s economy. In 1999, Salvadoran migrants sent home more than $1.5 billion, an amount that represented 13 percent of El Salvador’s GDP, 64 percent of its export earnings, and almost 700 percent of its foreign investment (Andrade-Edkhoff 2001). Nationally, between 1992–93 and 2000, the percentage of households receiving remittances rose six percentage points, from 14 to 20 percent. The increase was larger in rural areas (from 13 to 20 percent) than in urban areas (16 to 19 percent). The average amount of remittances per household also increased, from $76 to $121, the equivalent of the monthly minimum wage (Cuéllar et al. 2002).
External migration and associated remittances are likely to have had both beneficial and detrimental effects on tree cover in shade coffee regions during the 1990s. On the one hand, external migration may have dampened urbanization. Also, remittances may have enabled coffee-growing households to continue producing despite low prices and scarce credit and to avoid clearing trees to harvest the lumber or grow subsistence crops. On the other hand, however, according to stakeholders interviewed for this report, remittances have fueled the demand for urban land uses and have financed the conversion of coffee farms to alternative land uses. In addition, stakeholders report that migration—both external and internal—has created a
9
Resources for the Future Blackman et al.
scarcity of coffee labor in the eastern part of the country, making coffee production less profitable.
4.6. Weak Land Use and Land Cover Management
Both land use and land cover management in El Salvador were weak during the 1990s. Prior to 1998, the main laws governing land use and land cover were the Forestry Law of 1973 and land use permitting laws. The forestry laws required those wishing to clear forest to obtain permits from the Ministry of Agriculture (Ministerio de Agricultura y Ganaderia, or MAG). In addition, land use planning laws required those wishing to construct buildings to obtain permits from city mayors or the Ministry of Housing and Public Works.5 In practice, these requirements were frequently ignored. Even when they were heeded, the criteria for obtaining permits were rarely enforced and environmental impact assessments were not required. Prior to the passage of a new forestry law in 2002, MAG almost never rejected a request for a permit to clear forest (Celis, October 28, 2005; Gómez, October 24, 2005; Olano, November 3, 2005).
Environmental management in El Salvador took a major step forward in 1998 with the passage of the Environmental Law and the creation of the Ministry of the Environment and Natural Resources (Ministerio de Medio Ambiente y Recursos Naturales, or MARN). By law, MARN is required to issue permits for any changes in land use. According to government interviewees, however, MARN does not have the resources to conduct a detailed review of permit applications and approves the vast majority submitted (Celis, October 28, 2005; Olano, November 3, 2005).
5. Land Uses Replacing Shade Coffee
To our knowledge, no hard data are available on the specific land uses that replaced shade coffee between 1990 and 2000. Our land cover maps are of little use in this regard because they lump all land uses that entail clearing into a single “nonforest” class. As a first step toward filling this gap, we administered a questionnaire to the three regional managers of the Salvadoran
5 A key environmental regulatory gap in El Salvador is a system of comprehensive land use planning. Although a law has been drafted, it has yet to be passed. In any case, during the 1990s, no such law existed. As a result, there was a great deal of confusion about which regulatory authority—local mayors’ offices of national ministries—had jurisdiction over land use planning permitting (Celis, October 28, 2005).
10

Resources for the Future Blackman et al.
Coffee Research Institute (Fundación Salvadoreña para Investigatciones del Café, or PROCAFE), El Salvador’s parastatal research and technical extension organization.
The PROCAFE managers’ answers suggest that the majority of clearing between 1990 and 2000 in each of the three coffee regions was due to urbanization (Table 4). Urbanization played the largest role in the western region, where it accounted for fully 90 percent of clearing, and in the central region, where it accounted for 68 percent of clearing (Table 5). Felling trees to harvest lumber or firewood played a significant role in the eastern region, where it accounted for 20 percent of clearing. Finally, row crops played a significant, albeit minor, role in each region.
Table 4. Activities Responsible for Clearing 1990–2000, by Region
Percentage
Activity West Center East Urban land uses 90 68 50 Row crops 10 5 10 Pasture for livestock 5 Lumber, firewooda 5 20 Accidental forest fires 2 5 Others 20 Total 100 100 100 a No land use substituted for coffee.
Source: survey of PROCAFE regional managers.
6. Conclusion
To summarize briefly, using data from satellite images, we found that tree cover loss in El Salvador’s coffee areas during the 1990s was extensive: fully 13 percent of the land inside the three main coffee-growing areas was cleared. Contrary to conventional wisdom, most of this clearing occurred in middle- and high-altitude areas, not in lowland areas. Interviews with stakeholders and a review of secondary evidence suggest that falling coffee prices were not the only driver of tree cover loss during the 1990s. Rather, a complex web of interrelated factors contributed, including a downward spiral of on-farm investment and yields, debt, poverty, urbanization, migration, and weak land use and land cover regulation. Finally, data from interviews with coffee researchers suggest that urbanization was responsible for the majority of clearing in the coffee regions during the 1990s, particularly in the west and center.
These results have several policy implications. First, a rapid policy response is needed. Although historically, shade coffee appears to have provided a bulwark against deforestation,
11
Resources for the Future Blackman et al.
this no longer appears to be the case. During the 1990s, tree cover in shade coffee areas was lost at a rapid rate, and there is ample reason to suspect that this trend has continued apace, given that coffee prices reached a 50-year low in 2001 and have remained well below pre-1990 levels since then. In heavily deforested El Salvador, shade coffee provides important ecological services. To prevent soil erosion, flooding, biodiversity loss, and other types of environmental degradation that would result from further tree cover loss, action must be taken quickly.
Second, command-and-control land cover and land use restrictions are needed to stem tree cover loss. In the central and western regions, where more than three-quarters of El Salvador’s coffee is grown, urbanization and an inflow of financial capital from remittances have pushed land prices well above the net present value of future returns to coffee, thereby creating strong incentives for growers to sell their land to developers. In these areas, market-based conservation approaches, such as payments for environmental services and coffee certification, are not likely to be effective because the financial incentives they provide for continuing to grow coffee are significantly smaller than those offered by the land market. Unfortunately, however, command-and-control regulation is not likely to be effective in the near term. To date, by all accounts, land use and land cover regulation in El Salvador has proven toothless. It will undoubtedly take some time to build the political will and institutional capacity to enforce these policies. An interim solution may be to create incentives for land developers to clear and build in a manner that minimizes environmental degradation by, for example, retaining as much tree cover as possible, avoiding ecologically sensitive areas, and retaining corridors between forested areas.
Finally, our results suggest that efforts to improve coffee quality and marketing can help stem further tree cover loss. Because they have a comparative advantage in producing high-quality coffee, many highland growers in El Salvador have responded to the coffee crisis by boosting quality and marketing to obtain higher farm-gate prices. Our analysis shows that these efforts to improve coffee quality and marketing are targeting areas where most deforestation is occurring.
12

Resources for the Future Blackman et al.
References
Andrade-Eekhoff, K. 2001. Intercambios Transnacionales a Través de las Migración en Centroamérica: Dimámicas, Impactos y Potencial. PowerPoint presentation. Facultad LatinoAmericana de Ciencias Sociales (FLASCO), San Salvador.
Batz, M., H. Albers, B. Avalos-Sartorio, and A. Blackman. 2005. Shade-Grown Coffee: Simulation and Policy Analysis for Coastal Oaxaca, Mexico. Resources for the Future Discussion Paper 05-61. Available at www.rff.org.
Blackman, A. H. J. Albers, B. Ávalos, and L. Crooks. 2007. Land Cover in a Managed Forest Ecosystem: Mexican Shade Coffee. Resources for the Future Discussion Paper 07-30. Available at www.rff.org.
Celis, L.A. 2005. Director, Proyector Fortalecimiento de la Gestión Ambiental en El Salvador (FORGAES). Interview, October 28.
Cerrutti, M., and R. Bertoncello. 2003. Urbanization and Internal Migration Patterns in Latin America. Centro de Estudios de Población. Argentina.
Cuéllar, N. I. Gómez, S. Kandel, and H. Rosa. 2002. Rural Poverty and the Environment in El Salvador: Lessons for Sustainable Livelihoods. Programa Salvadoreño de Investigación Sobre Desarollo y Medio Ambiente (PRISMA), San Salvador.
Food and Agriculture Organization (FAO) Forestry Department. 2002. El Salvador: The Forests and the Forestry Sector. Available at www.fao.org/forestry/site/23747/en/slv.
Global Environmental Facility. 1998. El Salvador: Promotion of Biodiversity Conservation within Coffee Landscapes. Mimeo.
Gómez, O. 2005. Extension Agent, Fundación Salvadoreña para Investigaciones del Cafe (PROCAFE). Interview, October 24 and 25.
Gresser, C., and S. Tickell. 2002. Mugged: Poverty in Your Coffee Cup. Oxfam, London.
Inter-American Development Bank (IADB), US Agency for International Development, and World Bank. 2002. Managing the Competitive Transition of the Coffee Sector in Central America.” Paper prepared for Workshop on the Coffee Crisis and its Impact in Central America: Situation and Lines of Action. Antigua, Guatemala, April 3–5.
13
Resources for the Future Blackman et al.
International Coffee Organization (ICO). 2004. Impact of Low Prices on Sustainability Indicators in the Coffee Economy. Paper presented at 255th meeting of Executive Board, London, England, May 18–21.
International Coffee Organization (ICO). 2006. Coffee statistics. Available at www.ico.org.
Olano, J.A. 2005. Director, Dirección General de Ordenamiento Forestal, Ministerio de Agricultura y Ganaderia (MAG). Interview, November 3.
Perfecto, I., R. Rice, R. Greenberg, and M. E. Van der Voort. 1996. Shade Coffee: A Disappearing Refuge for Biodiversity. Bioscience 46(8): 98–608.
Ponte, S. 2002. The Coffee Crisis. Issue Paper. Center for Development Research, Copenhagen.
PROCAFE (Fundación Salvadoreña para Investigaciones del Cafe). 1998. Census of Coffee Growers. PROCAFE, San Salvador.
PROCAFE (Fundación Salvadoreña para Investigaciones del Cafe). 2004. Boletín Estadístico de la Caficultura Salvadoreña. PROCAFE, San Salvador.
Rice, R. 2003. Coffee Production in a Time of Crisis: Social and Environmental Connections. SAIS Review 23(1): 221–245.
Rodríguez-Meza, J. D. Southgate, and C. González-Vega. 2004. Rural Poverty, Households’ Responses to Shocks, and Agricultural Land Use: Panel Results for El Salvador. Environment and Development Economics 9: 225–239.
Varangis, P., P. Siegel, D. Giovannucci, and B. Lewin. 2003. Dealing with the Coffee Crisis in Central America: Impacts and Strategies. Policy Research Working Paper 2993. World Bank Development Research Group. March.
World Bank. 1997. El Salvador Rural Development Study, Main Report, Volume I. Report No. 16253-ES, August. Washington, D.C.
World Bank. 2001. El Salvador: Coffee Price Risk Management. Phase 2 Report. August. Washington, D.C.
World Bank. 2005. Shocks and Social Protection: Lessons from the Central American Coffee Crisis. Report No. 31857-CA. Washington, D.C.
14

EC
W
Figure 1. Major coffee-growing areas in El Salvador in 1993(West, Center, East)
0 25 50 75 10012.5Kilometers
±
Legendprimary road
primary river
coffee areas
Data source: Salvadoran Ministry of Environment (MARN)

E
C
W
Figure 2. Clearing between 1990 and 2000 in major coffee growing areas (West, Center, East)
0 5
Kilometers
Legendwater or no class
change from vegetated to nonforest
n/a
no change or regrowth
primary road
primary river
Data source: calculated from NASA data