Embed Size (px)
Citation preview
ELSEVIER Biochimica et Biophysica Acta 1360 (1997) 71-83
BIOCHIMICA ET BIOPHYSICA ACTA
Treatment-induced changes in 3 p-MRS (magnetic resonance spectroscopy) spectra of sera from patients with acute leukemia
M. Kuliszkiewicz-Janus a,,, S. Baczyfiski b
a Department ofHaematology, Wroctaw University of Medicine, Wyb. Pasteura 4, 50-367 Wroctaw, Poland b Institute of Chemistry, University of Wroctaw, Wroctaw, Poland
Received 1 November 1996; accepted 18 November 1996
Abstract
31 P-nuclear magnetic resonance (NMR) spectra were obtained in vitro from sera of 40 healthy volunteers and 30 patients with acute leukemia (AL) at the time of diagnosis and repeated up to 2-13 times during therapy. All spectra consisted of inorganic phosphate (Pi) peak (used as a reference peak) and two peaks from phospholipids (PL): one peak due to phosphatidylethanolamine and sphingomyelin (PE + SM) and second peak due to phosphatidylcholine (PC). Prior to initiation of therapy 31p spectra of sera of patients with acute leukemia differed from spectra of sera of normal individuals. Peak intensities of the PL were low in relation to Pi. During therapy leading to remission, resonance from PL progressively increased approximately to the spectral pattern in normal sera. Contrary to that, in non-responders the intensities of the phospholipids peaks remained unchanged. Long-term follow-up 31p-MRS studies showed not only a good correlation between this 31 P-MRS evolution of sera and the response to the therapy but also showed changes in phospholipids' levels in the following days during and after therapy. Moreover, correlations were found between high-density lipoprotein (HDL), cholesterol (CHOL) and low-density lipoprotein (LDL) concentrations measured by conventional techniques and peak intensities of PC and of PE + SM acquired by 31p_MRS.
Keywords: 3xP-Magnetic resonance spectroscopy in vitro; Acute leukemia; Chemotherapy
I. Introduction
Abbreviations: AL, acute leukemia; AMSA, amsacrine; ARA- C, cytarabine; BMT, bone marrow transplantation; CR, complete remission; CTX, cyclophosphamide; DHAD, mitoxantrone; EPI, epirubicin; GPC, glycerylphosphatidylcholine; GPE, glyc- erylphosphatidylethanolamine; L-ASPA, L-asparaginase; LPC, lysophosphatidylcholine; LPS, lysophosphatidylserine; 6-MP, 6- mercaptopurine; MRS, magnetic resonance spectroscopy; MTX, methotrexate; NMR, nuclear magnetic resonance; PC, phosphati- dylcholine; PDE, phosphodiesters; PE, phosphatidyl- ethanolamine; Pi, inorganic phosphate; PL, phospholipids; P1, plasmalogen; PME, phosphomonoesters; PR, partial remission; SM, sphingomyelin; TG, tioguanine; VCR, vincristine; VP-16, etoposide.
* Corresponding author. Fax: +48 71 215729.
3~p-MRS detects changes in metabolic concentra- tions which accompany biological events in the pro- gression of cancer. These may clinically serve as prognostic variables. The investigations performed mostly in vivo in lymphomas, sarcomas, breast can- cer, prostate cancer, hepatomas and metastatic liver cancers afforded possibilites for detection of metabolic differences associated with treatment sensi- tivity and resistance. These changes may be useful to predict treatment response in individual patients. 31p_ MRS spectra of tumors are typically characterized by
0925-4439/97/$17.00 Copyright © 1997 Elsevier Science B.V. All rights reserved. PII S0925-4439(96)00070- 1
72 M. Kuliszkiewicz-Janus, S. Baczyf~ski // Biochimica et Biophysica Acta 1360 (1997) 71-83
A
Pi
PC
P E + SM
B
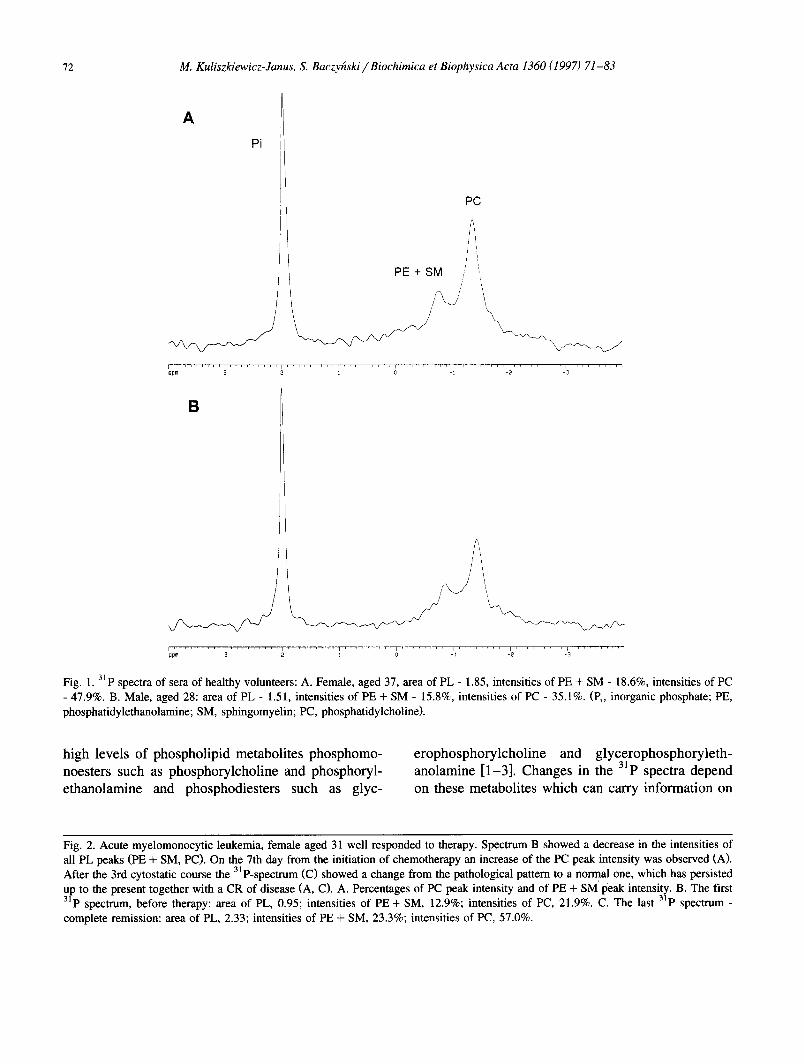
Fig. 1.3J p spectra of sera of healthy volunteers: A. Female, aged 37, area of PL - 1.85, intensities of PE + SM - 18.6%, intensities of PC - 47.9%. B. Male, aged 28: area of PL - 1.51, intensities of PE + SM - 15.8%, intensities of PC - 35.1%. (Pi, inorganic phosphate; PE, phosphatidylethanolamine; SM, sphingomyelin; PC, phosphatidylcholine).
high levels of phospholipid metabolites phosphomo- noesters such as phosphorylcholine and phosphoryl- ethanolamine and phosphodiesters such as glyc-
erophosphorylcholine and glycerophosphoryleth- anolamine [1-3]. Changes in the 31p spectra depend on these metabolites which can carry information on
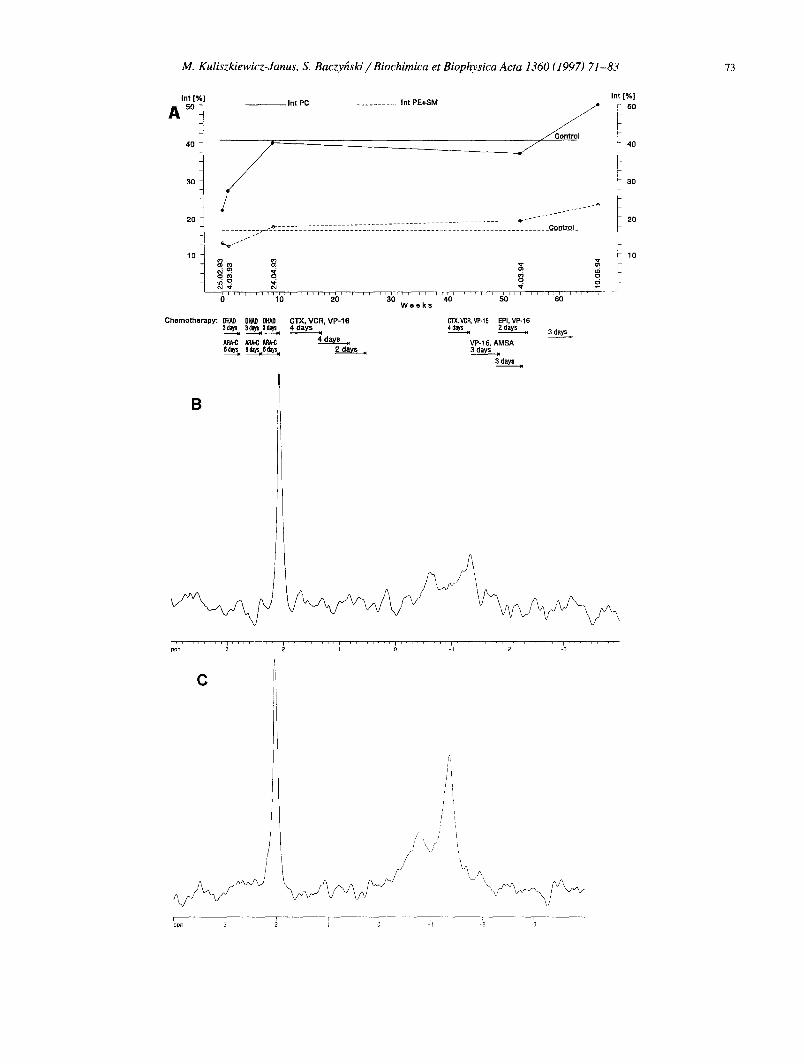
Fig. 2. Acute myelomonocytic leukemia, female aged 31 well responded to therapy. Spectrum B showed a decrease in the intensities of all PL peaks (PE + SM, PC). On the 7th day from the initiation of chemotherapy an increase of the PC peak intensity was observed (A). After the 3rd cytostatic course the 31 P-spectrum (C) showed a change from the pathological pattern to a normal one, which has persisted up to the present together with a CR of disease (A, C). A. Percentages of PC peak intensity and of PE + SM peak intensity. B. The first 31p spectrum, before therapy: area of PL, 0.95; intensities of PE + SM, 12.9%; intensities of PC, 21.9%. C. The last 31p spectrum - complete remission: area of PL, 2.33; intensities of PE + SM, 23.3%; intensities of PC, 57.0%.
M. Kuliszkiewicz-Janus, S. Baczyfiski / Biochimica et Biophysica Acta 1360 (1997) 71-83 73
Int [ % ]
A ~o-
40
30
20
10
- - Int PC . . . . . . . . . . Int PE+SM
.
Chemotherapy: DHAD [ILIAD DHAD C IX , VCR, VP-16 3 days ~ 3 ~ 4 days - - - M =1 ARA-C ~ /~RA-C 4days
~L~,~ , da~ ,,
~ o r l t r o l
Int [%]
F- 5o
31)
--° E e - - t ~ ......... __-__~-_ZZiZiIIIII-Z-_II-_-_II . . . . . . . . . . . . . . . . . . . . . . . . . . . . . . . . . . CoDtrDJ_
l l J l r ~ l l l l i ~ I r i ~ i q l l J J l l r l l i l I I i i i i i i J r l i i ' r~1--~ i I i ~ I f E i ' IT--7~-~ i r i r i ;
0 10 20 30 40 50 60 W e e k s
CT/~ VCR, VP-16 EPI, VP-16 4 days ,, 2 days ,~ 3 days ~
VP-16, AMSA 3 days ,(
3 days .
B
r ......... t ......... t ppm 3 2
C
. . . . . . . . . ~ . . . . . . . . . ~ . . . . . . . . . _ , . . . . . . . . . -'2 . . . . . . . . . -'3 . . . . . . . . .
f t
74 M. Kuliszkiewicz-Janus, S. Baczy~ski / Biochimica et Biophysica Acta 1360 (1997) 71-83
I n t [ % ]
A so
40
30
20
10
C h e m o t h e r a p y : D H A D H
ARA-C
_ _ l n t PC . . . . . . . . . . Int PE+SM
Contml
. . . . . . . . . . . . . . . . . . . . . . . . . . . . . . . . . . . . . . . . . . . . . . . . . . . . . . . . . . . . . . . . . . . . . . . . . . . . . GQ~Ir~I_
• ~'i o m,
04 oJ
6 . . . . . . . . . . . . . . . . . . . . . . . . . . . . "~ o 2 0 a ' o . . . . . . . . . 4 ' 0 ' D a y s
DHAD.
ARA-C =¢ Dz
TG p=
int [%]
5O
40
30
20
10
B
i . . . . . . . . . i ......... pom 3
C
Ilpm 3 . . . . . . . . . I . . . . . . . . . ~ . . . . . . . . . _', . . . . . . . . . . . . . . . . . . . . . . . . . . . -'2 -'3 '

M. Kuliszkiewicz-Janus, S. Baczyhski / Biochimica et Biophysica Acta 1360 (1997) 71-83 75
tumor regression or its progression during chemo- and radiotherapy [4-11 ].
Previously described investigations of normal serum by 3~P-MRS in vitro have showed that the spectrum consist of two sets of signals - one originat- ing from inorganic phosphate (Pi) and a second one due to serum phospholipids (PL): phosphatidyl- choline (PC), phosphatidylethanolamine (PE), sph- ingomyelin (SM), lysophosphatidylcholine (LPC), lysophosphatidylserine (LPS), and plasmalogen (P1) [12-14].
Observations (in vitro) of 3~p spectra of sera of patients suffering from multiple myeloma and malig- nant lymphomas showed lower level of PL before therapy and suggest that the changes of phospholipid metabolism induced by therapy may provide prognos- tic indices or predictors of sensitivity and resistance to individual treatment regiments [ 13,14].
The purposes of this investigation were: (1) to examine whether 31 P-MRS spectra of sera of patients with acute leukemia (AL) show changes before and during treatment similarly to patients with multiple myeloma and malignant lymphomas, and to find out
• • • 3 l possible application of P spectra of human serum to therapy monitoring; (2) to find out whether there also exists a dependence between PL metabolism, moni- tored by 3~p-MRS, and lipids and lipoproteins con- centrations in serum measured in a conventional way.
2. Materials and methods
volunteers and patients, were divided into two parts: below age of 22 (group A, younger), and above 22 years of age (group B, older). Group A of healthy volunteers consists of 15 persons (median age 17; 5 female and 10 male), group B, of 25 individuals (median age 35; 15 female and 10 male). Among the patients in group A were 8 individuals (median age 18; 3 female, 5 male), in group B, 24 (median age 43; 15 female and 9 male).
Studies were done prior to therapy and repeated up to 2-13 times during and after treatment, within 1 to 16 months from beginning of the disease. Measure- ments were also performed in five patients, who have achieved complete remission (CR) lasting already 3-9 years.
Blood samples (10 ml) were collected by venous puncture in fasting state. Serum was obtained by centrifugation (3000 r.p.m, for 20 min) and stored in 4°C. Measurements were performed within 24 h from blood collection. 31p-MRS data aquisition were car- ried out on a AMX 300 Bruker spectrometer (7.05 T) with probehead type BBI 300 MHz and NMR tube diameter of 5 mm. The details of method used in investigations are described elsewhere [13,14].
Concentrations of lipids - - cholesterol (CHOL), triglycerides (TGL), and lipoproteins - - HDL, low- density lipoprotein (LDL) of serum of all individuals (controls and patients) were measured at the same time as the spectra were obtained• The methods were described previously [13,14]. The statistical date were calculated by means of Student's t-test and verified by analysis of variance and Tukey test.
31p spectroscopy was performed on serum from 40 healthy volunteers (20 female and 20 male) with the median age 24 (17-60), and on serum from 33 patients with acute leukemia: myeloblastic, lympho- blastic, and blastic crisis of chronic granulocytic leukemia (18 female and 15 male) with the median age 46 (17-71). Persons from both groups, i.e. healthy
3. Results
Previous investigations [12] and our own studies [13,14] have showed that 31p-MRS spectra of normal serum consist of three peaks, including a downfield
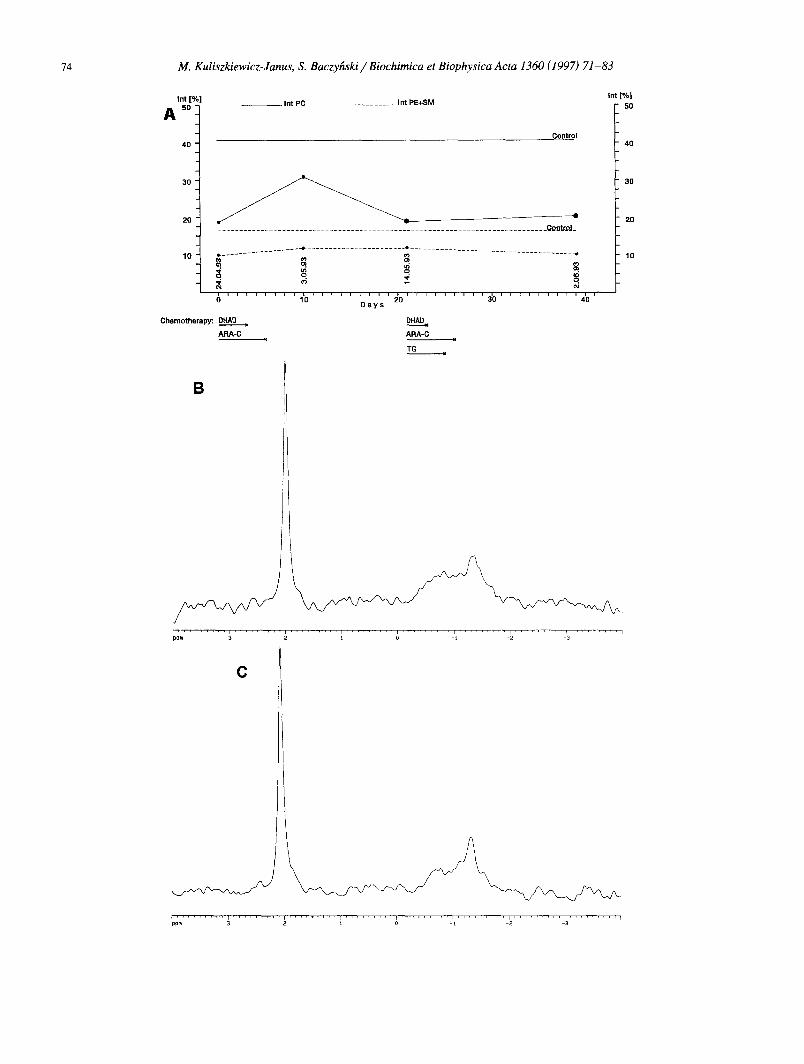
Fig. 3. Acute meyloblastic leukemia, female aged 59 non-responded to therapy. After initial moderate response to the treatment the disease progressed further and consequently a decrease in the intensities of PE + SM and PC peaks was noted (A, C); two days after the final NMR examination this patient died. A. Percentages of PC peak intensity and of PE + SM peak intensity. B. The first 31p spectrum - before therapy: area of PL, 1.29; intensities of PE + SM, 9.9%; intensities of PC, 18.6%. C. The last 3tp spectrum, progressio morbi: area of PL, 0.86; intensities of PE + SM, 7.4%; intensities of PC, 20.8%.

76 M. Kuliszkiewicz-Janus, S. Baczy[zski / Biochimica et Biophysica Acta 1360 (1997) 71-83
A Intl%]
4o ~
- - - - In t PC . . . . . . . . ]n t PE+SM
Contro l
/ 30 / ~/
/ ",
! 2 / /
' " , J - - - t . . . .
~ 7 7 - 7 I ~ ' ~ T T ~ = T r [ t ] r ~ T 7 ~ r F t ] I I ~ t T~ " T =r i F t 1 : T T 'T T FI'F TTI I ] ] ] r f I t T~r ~ - ' T - r ~ f ~ r T ~ F T ~ 7 ~ W 2 7 - ~ 7 ~ 7 7 7 ~ 7 7 - I I I I ] I I 0 10 20 30 40 50 60 70 80 90 1 O0
D B y s Chemotherapy: DHkO DH/~ VP-16
ARA~ AMSA
Int [%)
- 56
B
Ippm
C
I
I ~ -', :2 ~'3

M. Kuliszkiewicz-Janus, S. Baczyfiski / Biochimica et Biophysica Acta 1360 (1997) 71-83 77
peak due to inorganic phosphate (Pi) and two addi- tional upfield peaks due to phospholipids (PL): the upfield-most peak due to phosphatidylcholine (PC) and the second peak due to phosphatidylethanolamine and sphingomyelin (PE + SM) (Fig. 1). Because of the relation of the phospholipid level from the indi- viduals' age [15] and AL occurrence in young pa- tients, both groups, i.e. healthy volunteers and the patients, were divided into two parts dependent on age: < 22 years of age (group A) and > 22 years of age (group B).
Prior to initiation of therapy 31p spectra of sera of patients with acute leukemia differed from spectra of sera of normal individuals. Spectra of the patients revealed significantly decreased peak intensities of PC and PE + SM. The ratio of the peak areas of PL to P~ in sera of healthy volunteers in group A was 1.18 + 0.27, while in patients before treatment that ratio was only 0 .72_ 0.12, and in group B, 1.62 ___ 0.42, and 0.98 ___ 0.27, respectively. Quantified in a different manner, peak intensities from PC in sera of healthy volunteers of group A, accounted for 30.8% + 7.7 of the total 31p signal, while in patients it was only 16.9% ___ 3.1 and in group B, 40.2% + 12.8 and 21.9% ___ 6.5, respectively. Similarly, the PE + SM peaks in healthy volunteers (in group A) accounted for 12.9% + 2.9 of the total signal but only for 9.7% ___ 1.7 in patients, while in group B, 16.4% __+ 4.8 and 10.6% + 3.4, respectively. These values were significantly different from values in healthy volun- teers groups ( P < 0.001), except PE + SM (P < 0.01).
During therapy leading to remission, these ratios increased. The ratio of PL to P~ increased to 1.49 + 0.52 in group A and to 1.55_+0.40 in group B. Percentages of peak intensities rose as follows: PE + SM to 14.5% ___ 4.2 - group A, 16.5% + 4.2 - group B, whereas PC to 31.5% _+ 10.0 and 35.0% _+ 9.4,
respectively. At the conclusion of the treatment, re- suits from the responder group did not differ signifi- cantly from healthy volunteers. By contrast, in non- responding patients (only in the group B) the ratio of PL to P~ did not change and equaled 0.98 + 0.21, the percentage of peak intensity of PC did not change at 21.9% + 5.4, and PE + SM was down to 9.4% _ 1.4. These values were significantly different from noted in healthy volunteers group ( P < 0.001). A summary of these data from the entire population studied is presented in Table 1.
Our investigations of lipids and lipoproteins of sera led by means of conventional techniques showed a similar pattern. In patients suffering from acute leukemia HDL and CHOL concentrations before therapy were low in both groups in comparison with healthy volunteers. The results are presented in Table 1. The level of HDL in group A2 was 0.45 m m o l / l + 0.13 while in group A1, 1.19 mmol/1 + 0.20, in groups B2 i B1 were: 0.58 mmol/1 + 0.27 and 1.11 mmol/1 + 0.37, respectively. The concentrations of CHOL for groups A2 and A1 were 3.26 mmol/1 ___ 0.5 and 3.92 mmol/1 + 0.59, respectively. In older groups were 3.62 mmol/1 _+ 0.99 and 5.02 mmol / l + 0.81. These HDL and CHOL values increased in respond- ing patients and achieved the values equal or higher than those for healthy volunteers in the younger group (in groups A3 and A1 for HDL, 1.10 mmol/1 + 0.32. 1.19 mmol/ l_+ 0.20, respectively) or only higher for CHOL concentration: 4.68 mmol/1 + 0.53 and 3.92 mmol/1 + 0.59 respectively. However, in the older group mean concentration of lipid and lipoproteins increased but did not achieve a normal level (the values of HDL in groups B3 and B1 are: 0.88 mmol/1 _+ 0.3, 1.11 mmol/1 _+ 0.37, respec- tively; for CHOL 4.17 m m o l / l + 1.3 and 5.02 mmol/l___ 0.81. In patients not responding to the therapy HDL, LDL and CHOL values were lower
Fig. 4. Acute myelomonocytic leukemia, male, aged 28 for whom were performed 13 spectra from the time of diagnosis to the achievement of CR (A). Spectrum acquired on 5th day of cytostatic treatment pointed out on significant increase of intensities of all PL peaks (i.e., PE + SM and PC) resulted from direct action of ARA-C. Repeated increase of the intensities of peaks mentioned above was observed on 14th day from the beginning of cytostatic course, i.e., at the time of the most intense action of the second drug used (DAHD). The latter was associated with clinical and laboratory symptoms of myelosuppression. The intensities of PC and PE + SM decreased before the second cytostatic course, in spite of normal test of blood and bone marrow. Immediately after next chemotherapy those values consequently increased, but on the 95th day was observed a spontaneous increase of both intensities that connected with the achievement of CR. A. Percentages of PC peak intensity and of PE + SM peak intensity during the 13 measurements. B. The first 31p spectrum - before therapy: area of PL, 0.56; intensities of PE + SM, 5.8%; intensities of PC, 12.2%. C. The last 3~ p spectrum - complete remission: area of PL, 1.21; intensities of PE + SM, 12.5%; intensities of PC, 27.8%.

78 M. Kuliszkiewicz-Janus, S. Baczyfiski / Biochimica et Biophysica Acta 1360 (1997) 71-83
I n t [ % ]
k so
4Q
3 0
20
10
C h e m o - t h e r a p y :
1 - EPI+VCR 2 - VCR 3 - CTX 4 - M T X
In t PC . . . . . . . . . I n t PE+SM
C o n ~ o l
i
W e e k s ~,,~i!,,!,!,o,! . . . . . . . ,o . . . . . . . . I ~ ' ! . . . . ! ' ' ' ' ° . . . . . . . . . ,o . . . . T, IT, I ~ , t I . . . . . . ,,o . . . . .
L -ASPA ARA-C ARA-C ARA-C ARA-C ARA-C 6 - M P Bone 12 days l 3 d a y s . VP-16 VP-16 3 days VPo16 6 w e e k s M a r r o w
ARA-C 5 days . 5 days. " AP~-C 5 days ~l T ransp lan ta t i on
3 days 3 days, ~"~-CVP.16 ARA~C 5 days, 3 d a y s .
In t [ % ]
5O
40
30
20
10
B
J L _
I . . . . . . . . .
C
. . . . . . . . . i . . . . . . . . . . . . . . . . . . . . . . . . . . . . . . . . . . . . . . . . . . . . . 1 ~ -'~ -'~ -'3 '
r . . . . . . . . . r . . . . . . . . . i . . . . . . . . . i . . . . . . . . . i . . . . . . . . . i . . . . . . . . . i . . . . . . . . . _l 3 ppm 3 2 ~ 0 -~

M. Kuliszkiewicz-Janus, S. Baczy~ski // Biochimica et Biophysica Acta 1360 (1997) 71-83 79
B
A
/ /
~o~ ~ ~ I ~ ': '2 -'3
j r ppm . . . . . . . . . . . . . . . . . . . . ~ . . . . . . , / '_'2 _,~ , 2 1
Fig. 6. 31p spectra of sera of patients with acute lymphoblastic leukemia who have achieved complete remission before the year 1991 and 1986, respectively. Those spectra were similar to the spectra of healthy volunteers. A - female, aged 22: area of PL - 1.73, intensities of PE + SM - 15.4%, intensities of PC - 38.7%. B - male, aged 37: area of PL - 2.02, intensities of PE + SM - 22.8%, intensities of PC - 41.0%.
Fig. 5. Acute lymphoblastic leukemia, male, aged 18. The intensities of PC and PE + SM peaks were achieved during 9 measurements. After an appreciable increase in the intensities of all PL peaks (PE + SM, PC) immediately after the remission induction chemotherapy, values of peak intensities decreased although the leukemia could no longer be detected in the blood or bone marrow. Only the last investigation before bone marrow transplantation (BMT) (22 days after last chemotherapy), showed a spontaneous increase of peak intensities. Two measurements performed after BMT, during CR of disease, revealed strongly increased PC peak intensity; PE + SM peak intensity also increased, however, after initial lowering. A. Percentages of PC peak intensity and of PE + SM peak intensity during the 7 measurement before, and 2 after bone marrow transplantation. B. The first 3Jp spectrum - before therapy: area of PL, 0.57; intensities of PE + SM, 7.0%; intensities of PC, 14.2%. C. The last 31p spectrum - complete remission: area of PL, 1.11; intensities of PE + SM, 11.2%; intensities of PC, 27.4%.

80 M. Kuliszkiewicz-Janus, S. Baczyhski / Biochimica et Biophysica Acta 1360 (1997) 71-83
©
E ©
2
p ©
-i 8
u
zB
,o
<
t'q
<
AI ~
v~:
AI ~
cq (N cq
v <
AI ~
V <
V V
m
0 0 0 0
V V V ~ V
Z Z Z V v ~ V
Z Z Z Z v ~ v
• . . q
V V V V V ~ V
o c 5 o c5 o c5 V V V V ~ V V
d - o o c5 o
c 5 ~
• ~- ¢.q
c5.~/
c 5 ~
0 ¢q
~.0 ~ c 5 c 5 ~
t 'q
c5 ,--:
c 5 ~
t 'q
c 5 ~ :
t 'q .~-
d ~ r-:. r--- o o o o

M. Kuliszkiewicz-Janus, S. Baczyfiski / Biochimica et Biophysica Acta 1360 (1997) 71-83 81
(0.47 mmol/1 + 0.18, 2.10 mmol/1 + 0.46, 3.22 mmol/1 + 0.57, respectively) than those before ther- apy (1.11 mmol/1 + 0.37, 3.29 mmol/1 _+ 0.73, 5.02 mmol/1 _+ 0.81, respectively). Moreover, statistically significant correlations were found between HDL concentrations and the intensities of the peaks of PC, of PE + SM and the area of PL measured by 31p-MRS (correlation coefficient: 0.58, 0.44, 0.42, respectively; P < 0.001). Correlations were also seen between total intensity of PL peaks and concentrations of CHOL, LDH, and HDL (correlation coefficient 0.55, 0.49, and 0.42, respectively; P < 0.001) and between LDL concentration an mentioned parameters of 31p-MRS (correlation coefficient 0.36, 0.40 and 0.49 respec- tively; P < 0.001). No correlations were found be- tween the parameters measured by means of 3~p-MRS and concentrations of TGL in serum.
Figs. 2-5 show time-course of changes in intensi- ties of PE + SM and PC peaks from 31p-MRS spectra of sera in several patients during chemotherapy.The detailed description is given in the figure caption. It is worth noting the good dependencies between spec- tra parameters and clinical stages of patients respond- ing or non-responding to therapy.
4. Discussion
MRS permits to perform an examination of metabolic characteristics of human cancers cells in a clinical environment both in vivo and in vitro. Acces- sible 31p-nuclei contain information about energy status (phosphocreatine, inorganic phosphate, nucleo- side triphosphates), phospholipid metabolites (phos- phomonoesters, PME, and phosphodiesters, PDE), intracellular pH, and free cellular magnesium concen- tration. PME largely consist of phosphorylcholine and phosphorylethanolamine which are anabolic pre- cursors of membrane phospholipids, and PDE largely consist of glycerylphosphorylcholine and glyc- erylphosphorylethanolamine which are breakdown products of phospholipid metabolism [ 1-4,16-19].
Most cancer cells investigated by 31p-MRS [1-4] have high levels of phospholipid metabolites (PME, PDE). Contrary to that, immunodiffusion methods, separated preparation and 1H MRS revealed de- creased phospholipid contents in sera of cancer pa-
tients [20-24]. Our studies concerned with 31p-MRS monitoring of phospholipid levels in sera of patients with haematological cancer diseases are preliminary ones and their direct comparison with results of other investigations is difficult because the latter refer only to cancer cells.
Our previous observations of 31p spectra obtained from sera of patients suffering from multiple myeloma and malignant lymphomas suggest that the therapy induced changes in concentration of phospholipid may provide prognostic indices or may be predictors of sensitivity and resistance to individual treatment regiments [13,14].
Our present serial 31p-MRS studies of sera from acute leukemic patients showed the possibility of observation of the phospholipid levels changes during and immediately after chemotherapy with a good dependence between the evolution of the MRS pa- rameters and response of the disease to the treatment. Prior to initiation of therapy, the 3~p-MRS spectra of sera revealed significantly decreased peak areas of PL and intensities of PC and of PE + SM. During therapy significant changes in these spectra were observed: (1) In responding patients the spectral pro- file has been changed and resemble that of normal serum with increased peak intensities of PC and of PE + SM; (2) In non-responding individuals peak intensities of PC and of PE + SM did not change; (3) Spectra of patients who have achieved complete re- mission lasting for 3-9 years did not differ from spectra of healthy volunteers (Fig. 6).
Moreover some important observations from 31p_ MRS studies carried up to now are worth mentioning. The analysis of 3tp spectra obtained from sera of young patients with complete remission of AL showed that the spectral profiles were changed and resembled that of normal serum, but the intensities of PC and PE + SM did not achieve values typical of healthy volunteers (without division into age groups). A rea- son could be a low PL concentration in the sera of young people. It is known that PL level depends on age [15]. Therefore, volunteers and patients were divided according to their age: below 22 and above 22. A statistically significant difference between the observed spectral parameters has been found both in control and patient's groups. After this partition, it turned out that the lower values of PC and of PE + SM intensities observed in the group of younger
82 M. Kuliszkiewicz-Janus, S. Baczyhski / Biochimica et Biophysica Acta 1360 (1997) 71-83
patients during CR had statistically the same values as for age-matched controls.
Although CR has been stated by clinical and labo- ratory features, 31p spectral pattern may remain nor- mal with slightly lowered PL intensity values. The cause of this phenomenon could be the residual leukemia, when the leukemia cell mass is reduced approximately to 10 9 cells and leukemia can no longer be detected in the blood or bone marrow, and the patient appears to be in CR.
Another important conclusion is that 3~p spectrum has to be connected with the chemotherapy course. We have found that the investigation should be per- formed day by day during the cytostatic treatment and within a few days after the end of the course. It allows to observe changes of phospholipids metabolism, being a straight effect of chemotherapy. In the first days after cytostatic therapy the intensity peak of PC increases. It was not always correlated with a long-term response to the treatment. It seems that an increase in peak intensity related to PE + SM is a prognostic sign of positive, long-term response to the therapy. This dependence is difficult to explain without further detailed observations and investiga- tions. The spectra obtained on the spot after the cytostatic treatment may reflect the rate of changes of metabolism of cancer cells immediately after chemo- therapy, while the spectra obtained before the next course represent the metabolism of phospholipids in actual stage of the disease, a dozen or so days after discontinuance of the cytostatic treatment. The stage of illness (remission, progression or steady state) can be estimated by a comparison of consecutive spectra. Similarly to the findings of other researchers, it also reflects the advancement and the stage of the disease [1,2]. According to our present knowledge, this method can not be at present indiscriminately applied for diagnostic purposes of multiple myeloma, malig- nant lymphomas, and leukemia, but may be helpful in the monitoring of treatment of these diseases [13,14].
The 31p spectra evaluations during bone marrow suppression resulted from the cytostatic treatment may be of special importance for patients with acute leukemia, when it is not possible to make a prognosis on the basis of assessments done by means of con- ventional methods to determine whether the growth of bone marrow is normal or pathological.
Serial studies resulted in good dependencies be-
tween evolution of the MRS parameters and response of the disease to the therapy. In this way 3~p-MRS could be an important tool in future clinical monitor- ing, not only of patients with multiple myeloma and malignant lymphomas but also with acute leukemia.
Moreover, the analysis of serum phospholipids made by MRS offers a convenient and fast method for establishing a blood lipid profile in patients with acute leukemia during chemotherapy. Our observa- tions concerning changes in phospholipid metabolism in 3~p-MRS spectra were confirmed by measurements of lipoproteins and lipids in sera carried out by means of conventional techniques. We showed that the con- tent of lipoproteins and lipids in sera of patients with acute leukemia is decreased, except TGL concentra- tion. Mean HDL and CHOL concentrations, initially low before treatment, increased but did not return to normal values in older patients responding well to therapy; only in the group of young patients they were higher than in respective control group. In patients not responding to the therapy, values were lower than those before therapy. It reveals prominent disturbances of lipid metabolism in patients with acute leukemia. The perturbations of concentrations of HDL cholesterol noted during our investigations also in patients with multiple myeloma and malignant lymphoma [ 13,14] are conformable to the statements of Dessi et al. [23], who studied the concentrations of total and HDL cholesterol in sera of 66 cases of different human haematological neoplasmas (malig- nant lymphomas, acute leukemias, multiple myeloma, myelofibrosis). All considered investigations revealed significant reduction of HDL cholesterol concentra- tions in sera of all patients and apparent inverse correlation between the levels of HDL and the sever- ity of the clinical type of neoplasia.
The results of Dessi et al. concerning the levels of total cholesterol were largely scattered but Ginsberg et al. [24], in myeloproliferative disorders demon- strated in plasma reduced concentration of HDL as well cholesterol, similar to our observations concern- ing previously described patients with multiple lym- phoma and malignant lymphomas and now leukemias.
Moreover, Dessi et al. [25,26] on different experi- mental models of normal and neoplastic cell prolifer- ation pointed out an increase of cholesterol synthesis accompanied by an accumulation of cholesterol esters in the growing tissues and by a marked reduction of
M. Kuliszkiewicz-Janus, S. Baczyfiski / Biochimica et Biophysica Acta 1360 (1997) 71-83 83
HDL cholesterol in the plasma compartment. Cell proliferation is a biological condition that requires large amounts of cholesterol for cell growth, since this molecule is essential for membranes biogenesis. It is then conceivable that alteration of intracellular cholesterol metabolism observed during processes of sustained cell growth may also affect cholesterol distribution in the plasma.
The comparison of lipid perturbations in patients with haematological diseases investigated by means of conventional methods and NMR spectroscopy pointed at statistically significant correlations be- tween HDL, CHOL, and LDL concentrations and peak intensities of PC and of PE + SM assessed by 31p-MRS. These would prove that PC and SM are essential components of serum lipoproteins, espe- cially of HDL and LDL fractions [27]. PC strongly assimilates with A-I apolipoproteine, while SM, with A-II apolipoproteine. P C / S M ratio measured in all fractions of human lipoproteins had mean value of 3:1. These ratio is also reflected in 31P-MRS spectra obtained from sera of investigated patients.
The role of cell membrane in phospholipid metabolism has not been decided yet, despite numer- ous observations obtained both from cell models and human sera. Therefore, the analysis of serum phos- pholipids in patients with acute leukemias, lead be- fore and during chemotherapy can contribute in solv- ing the questions mentioned above.
Acknowledgements
I am most grateful to Benjamin S. Szwergold Ph.D., Department of NMR, Fox Chase Cancer Cen- ter, Philadelphia, for his constructive advice and to prof. dr hab. Henryk Ratajczak, Institute of Chem- istry, University of Wroctaw, for the use of MRS facilities.
References
[1] Negendank, W. (1992) NMR Biomed. 5, 303-324. [2] Steen, R.G. (1989) Cancer Res. 49, 4075-4085. [3] Szwergold, B.S. (1992) Annu. Rev. Physiol. 54, 775-798. [4] Meyerhoff, D.J., MacKay, S., Baker, A. Schaefer, S. and
Weiner, M.W. (1992) in Magnetic Resonance Imaging of
the Body (Higgins, Ch.B., Hricak, H. and Helms, C.A., eds.), pp. 287-312, Raven Press, New York.
[5] Redmond, O.M., Stack, J.P., O'Connor, N., Carney, D.N., Dervan, P.A., Hurson, B.J. and Ennis, J.T. (1992) Magn. Reson. Med. 25, 30-44.
[6] Ng, T.C., Majors, A.W., Vijayakumar, S., Baldwin, N.J., Thomas, F.J., Koumoundouros, I., Taylor, M.E., Grundfest, S.F., Meaney, T.F., Tubbs, R.R. and Shin, K.H. (1989) Radiology 170, 875-878.
[7] Bryant, D.J., Bydder, G.M., Case, H.A., Collins, A.G., Cox, I.J., Makepeace, A. and Pennock, J.M. (1988) J. Comput. Assist. Tomogr. 12, 770-774.
[8] Karczmar, G.S., Meyerhoff, D.J., Boska, M.D., Hubesch, B., Poole, J., Matson, G.B., Valone, F. and Weiner, M.W. (1991) Radiology 179, 149-153.
[9] Segebarth, C.M., Baleriaux, D.F., Arnold, D.L., Luyten, P.R. and den Hollander, J.H. (1987) Radiology 165, 215- 219.
[10] Smith, S.R., Martin, P.A., Davies, J.M., Edwards, R.H. and Steven, A.N. (1990) Br. J. Cancer 61,485-490.
[11] Koutcher, J.A., Ballon, D., Graham, M., Healey, J.H., Casper, E.S., Heelan, R. and Gerweck, L.E. (1990) Magn. Reson. Med. 16, 19-34.
[12] Bradamante, S., Barchiesi, E., Barenghi, L. and Zoppi, F. (1990) Anal. Biochem. 185, 299-303.
[13] Kuliszkiewicz-Janus, M. and Baczyfiski, S. (1995) NMR Biomed. 8, 127-132.
[14] Kuliszkiewicz-Janus, M. and Baczyfiski, S. (1996) MRM 35, 449-456.
[15] Lindgren, F.T. and Nichols, A.V. (1960) The Plasma Pro- teins, (Putnam F.W., eds.), Vol. 2, pp. 1, Academic Press, New York.
[16] Bottomley, P.A. (1989) Radiology 170, 1-15. [17] Griffiths, J.R., Cady, E., Edwards, R.H.T., McCready, V.R.,
Wilkie, D.R. and Wiltshaw, E. (1983) Lancet I, 1435-1436. [18] Bental, M. and Deutsch, C. (1993) Magn. Reson. Med. 29,
317-326. [19] Kuesel, A.C., Grashew, G., Hull, W.E., Lorenz, W. and
Thielmann, H.W. (1990) NMR Biomed. 3, 78-89. [20] Nydegger, U.E. and Butler, R.E. (1972) Cancer Res. 32,
1756-1760. [21] Barclay, M., Skipski, V.P., Terebus-Kekish, O., Greene,
E.M., Kaufman, R.J. and Stock, C.C. (1970) Cancer Res. 30, 2420-2430.
[22] Gadeholt, G., Kruse, S., Halsteinslid, L. and Sletten, E. (1990) Eur. J. Cancer 26, 611-615.
[23] Dessi, S., Batetta, B., Pulisi, D., Accogli, P., Pani, P. and Broccia, G. (1991) Int. J. Hematol. 554, 483-486.
[24] Ginsberg, H.N., Le, N.A. and Gilbert, H.S. (1986) Metabolism 35, 878-882.
[25] Dessi, S., Chiodino, C., Batetta, B., Fadda, A.M., Anchisi, C. and Pani, P. (1986) Exp. Mol. Pathol. 44, 169-176.
[26] Dessi, S., Fadda, A.M., Laconi, S., Batetta, B., Anchisi, C., Carrucciu, A. and Pani, P. (1989) Exp. Mol. Pathol. 51, 97-102.
[27] Rakowska, M. and Zborowski, J. (1992) Pot~py Biologii Kom6rki 19, 369-384 (in Polish).