Embed Size (px)
Citation preview

TREASURY
WINE ESTATESHALF YEAR RESULTS
27 February
Michael ClarkeChief Executive Officer
2
Result headlines1,2
• Net sales revenue (NSR) up 8.7% on a reported currency basis and by 6.2% constant currency basis3,
reflecting improved portfolio mix
• On track to deliver 50% uplift in consumer marketing investment and $35 million overhead reduction
program in F15
• EBITS4 $85.2 million, up 86.0% on a reported currency basis and 77.5% on a constant currency basis,
reflecting successful transition of Penfolds release date and strategy to invest in consumer marketing while
removing overheads
• Statutory net profit after tax $42.6 million
• EPS 7.8 cents per share up strongly on prior period (before material items, SGARA & $80.5 million tax
benefit in fiscal 2014); Tax benefit represented 12.4 cents per share in fiscal 2014. Reported EPS 6.6 cents
per share
• Interim dividend 6 cents per share, unfranked in line with the prior period
• Distributor inventory realignment program in US on track for completion in F15
• Steps taken to remove unprofitable and unsustainable volume while improving quality of base business
1 Financial information in this report is based on reviewed financial statements. Non-IFRS measures have not been subject to audit
or review. The non-IFRS measures are used internally by management to assess the performance of the business, make decisions
on the allocation of resources and assess operational performance2 All figures and calculations are subject to rounding3 Unless otherwise stated all percentage or dollar movements from prior periods are pre any material items and on a constant
currency basis4 Earnings before interest, tax, SGARA and material items
3
TWE’s journey towards being the world’s most celebrated wine company
• Challenge “cottage industry” mindset of winemaking: TWE can preserve the mystique and romance of
wine and deliver outstanding, quality brands of scale with sustainability
• Bring FMCG supply and marketing principles to wine; not take wine to FMCG
• Build scale and flexibility with global “umbrella brands”
• Satisfy global consumer “needs” for trust-marks (i.e. brands) as well as experimentation and discovery
• Leverage existing brands to innovate while staying ahead of the “next big thing”
• Capture and enlarge wine’s share of voice in the global marketing arena; “bigger, can be better in wine”
• Strengthen portfolio of brands (beyond Penfolds) with renewed and increased focus and consumer
marketing investment
• Broaden and deepen new and existing routes-to-market in growth markets; increase allocation of scarce
Luxury wine to build presence and drive value in these markets
• Dispel the myth that wine is complex; optimise supply chain and empower winemakers
• Embed a light-weight capital organisation; challenge mindset that TWE must own entire supply chain
By transitioning from an order-taking, agricultural company to a global, brand-led
marketing organisation
Globalising TWE’s marketing mindset and driving scale – sustainably – will deliver
consistent shareholder returns over time, regardless of “mother nature”
4
F15 re-set year; progress update
• Seamlessly transitioned Penfolds release date to October
• Significant step-up in consumer marketing
– 1Q15: Investment in depleting Penfolds sold to
retailers in F14, ahead of F15 release – Penfolds wine
cabinet initiative
– 2Q15: Launched best Penfolds marketing campaign
in brand’s history; “Numbers Can be Extraordinary”
• Steps taken to address quality of earnings base:
– Deliberately removed unsustainable and unprofitable
volume; notably in ANZ and UK
– De-stocked in all four regions in 1H15
– On track to deliver $35m overhead reduction in F15
• Invested in more focused route-to-market in North Asia,
notably in China
• Completed planning work for supply chain optimisation
initiatives
• Defended TWE against two PE firms for 3 months
• Focused on building confidence; from supply to sales
• Commenced separate focus on Luxury & Masstige versus
Commercial portfolios in Australia; slower than planned
1H15 achievements 2H15 plans
• Accelerate separate focus on Luxury & Masstige versus
Commercial portfolios globally
• Continue to address quality of earnings base
• Strengthen portfolio of brands (beyond Penfolds) with renewed
and increased focus and consumer marketing investment
• Partner with J Walter Thompson to embed global discipline into
brand marketing; eliminate “regional trading mindset”
• Execute more, “large” marketing campaigns across all regions
• Embed focused route-to-market in North Asia; support growth
with increased allocation of scarce products to North Asia and
Americas
• Continue to invest in sales and marketing capability in growth
markets
• Progress with plans to identify and implement further cost
savings, including supply chain optimisation
• Build scalable and flexible umbrella brands
• Flex innovation capability and execution
• Complete distributor inventory realignment in US
~
5
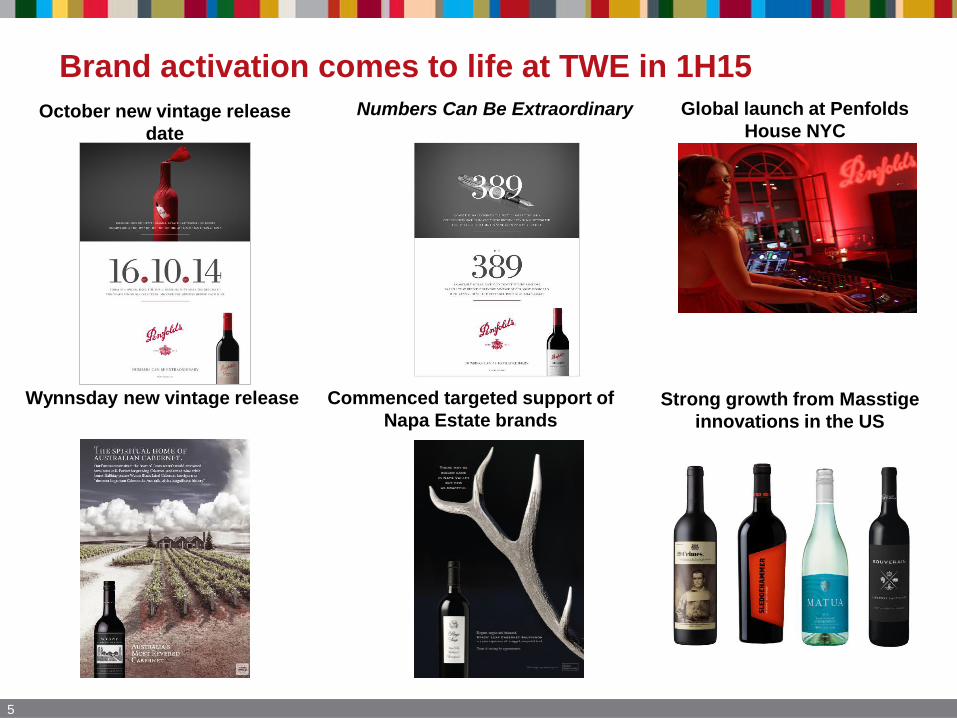
October new vintage release
date
Numbers Can Be Extraordinary
Brand activation comes to life at TWE in 1H15
Wynnsday new vintage release Commenced targeted support of
Napa Estate brandsStrong growth from Masstige
innovations in the US
Global launch at Penfolds
House NYC

Tony ReevesChief Financial Officer
7
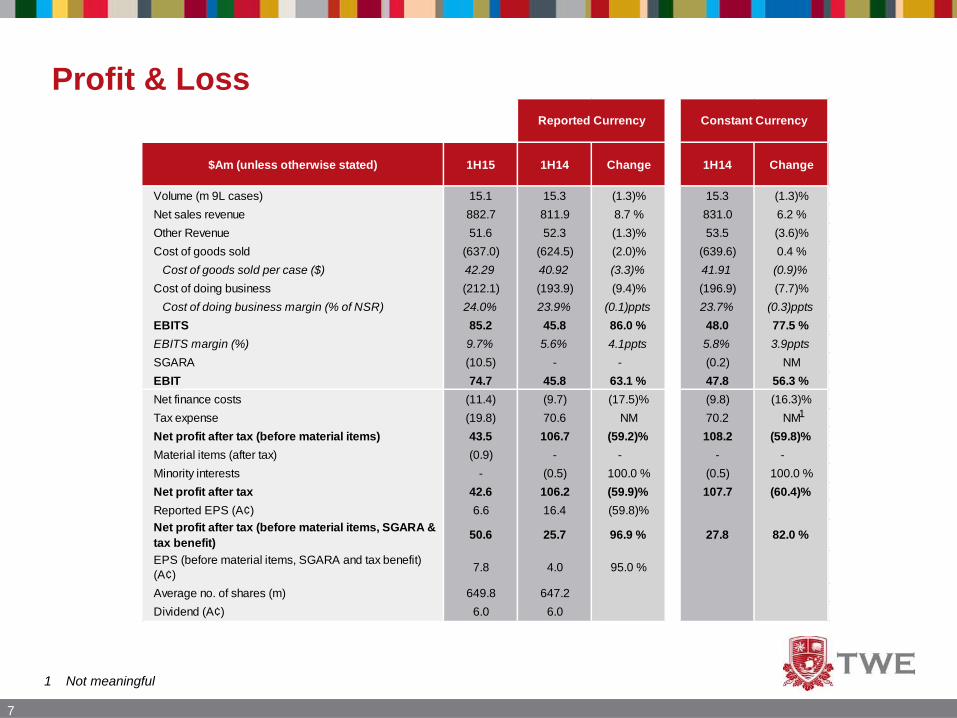
Profit & Loss
1 Not meaningful
$Am (unless otherwise stated) 1H15 1H14 Change 1H14 Change
Volume (m 9L cases) 15.1 15.3 (1.3)% 15.3 (1.3)%
Net sales revenue 882.7 811.9 8.7 % 831.0 6.2 %
Other Revenue 51.6 52.3 (1.3)% 53.5 (3.6)%
Cost of goods sold (637.0) (624.5) (2.0)% (639.6) 0.4 %
Cost of goods sold per case ($) 42.29 40.92 (3.3)% 41.91 (0.9)%
Cost of doing business (212.1) (193.9) (9.4)% (196.9) (7.7)%
Cost of doing business margin (% of NSR) 24.0% 23.9% (0.1)ppts 23.7% (0.3)ppts
EBITS 85.2 45.8 86.0 % 48.0 77.5 %
EBITS margin (%) 9.7% 5.6% 4.1ppts 5.8% 3.9ppts
SGARA (10.5) - - (0.2) NM
EBIT 74.7 45.8 63.1 % 47.8 56.3 %
Net finance costs (11.4) (9.7) (17.5)% (9.8) (16.3)%
Tax expense (19.8) 70.6 NM 70.2 NM
Net profit after tax (before material items) 43.5 106.7 (59.2)% 108.2 (59.8)%
Material items (after tax) (0.9) - - - -
Minority interests - (0.5) 100.0 % (0.5) 100.0 %
Net profit after tax 42.6 106.2 (59.9)% 107.7 (60.4)%
Reported EPS (A¢) 6.6 16.4 (59.8)%
Net profit after tax (before material items, SGARA &
tax benefit)50.6 25.7 96.9 % 27.8 82.0 %
EPS (before material items, SGARA and tax benefit)
(A¢)7.8 4.0 95.0 %
Average no. of shares (m) 649.8 647.2
Dividend (A¢) 6.0 6.0
Reported Currency Constant Currency
1
8
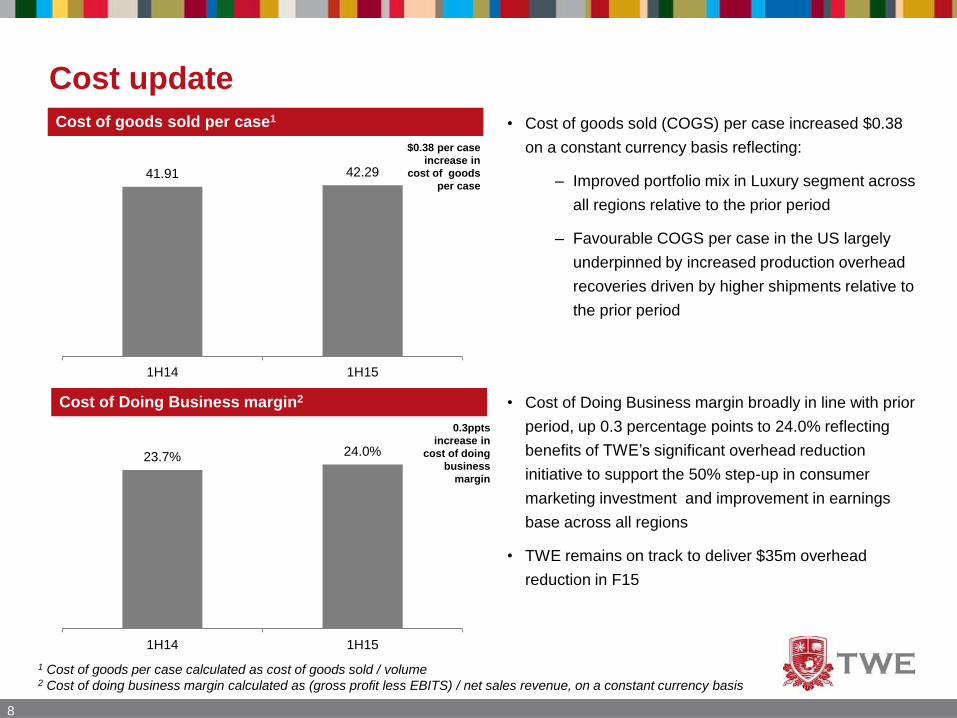
Cost update
• Cost of Doing Business margin broadly in line with prior
period, up 0.3 percentage points to 24.0% reflecting
benefits of TWE’s significant overhead reduction
initiative to support the 50% step-up in consumer
marketing investment and improvement in earnings
base across all regions
• TWE remains on track to deliver $35m overhead
reduction in F15
Cost of Doing Business margin2
1 Cost of goods per case calculated as cost of goods sold / volume2 Cost of doing business margin calculated as (gross profit less EBITS) / net sales revenue, on a constant currency basis
• Cost of goods sold (COGS) per case increased $0.38
on a constant currency basis reflecting:
– Improved portfolio mix in Luxury segment across
all regions relative to the prior period
– Favourable COGS per case in the US largely
underpinned by increased production overhead
recoveries driven by higher shipments relative to
the prior period
0.3ppts
increase in
cost of doing
business
margin
Cost of goods sold per case1
$0.38 per case
increase in
cost of goods
per case41.91 42.29
1H14 1H15
23.7% 24.0%
1H14 1H15
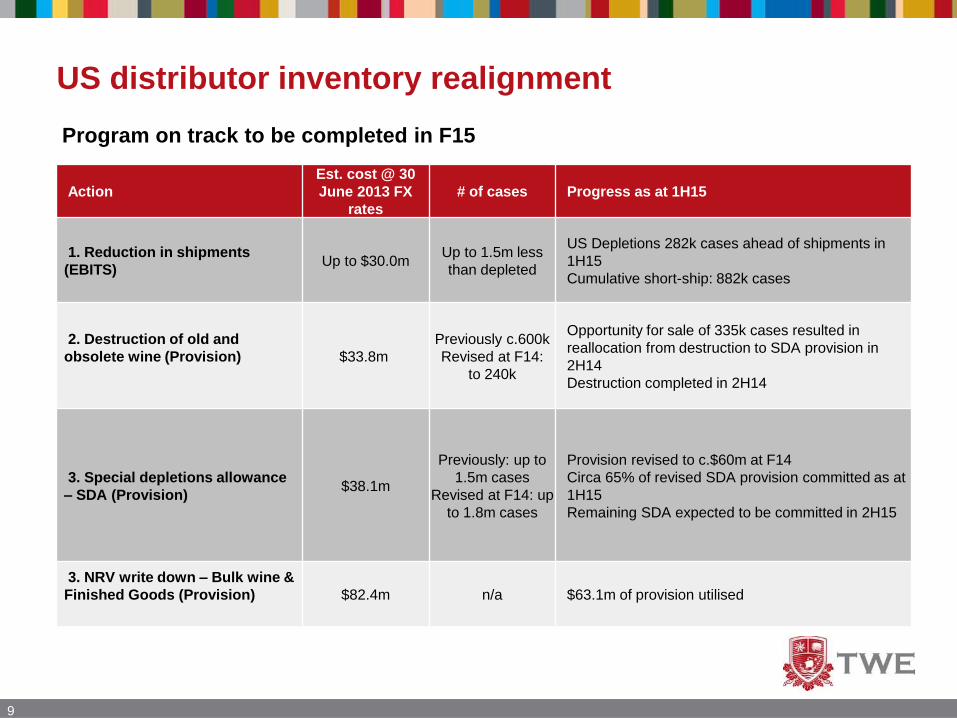
US distributor inventory realignment
9
Action
Est. cost @ 30
June 2013 FX
rates
# of cases Progress as at 1H15
1. Reduction in shipments
(EBITS)Up to $30.0m
Up to 1.5m less
than depleted
US Depletions 282k cases ahead of shipments in
1H15
Cumulative short-ship: 882k cases
2. Destruction of old and
obsolete wine (Provision) $33.8m
Previously c.600k
Revised at F14:
to 240k
Opportunity for sale of 335k cases resulted in
reallocation from destruction to SDA provision in
2H14
Destruction completed in 2H14
3. Special depletions allowance
– SDA (Provision)$38.1m
Previously: up to
1.5m cases
Revised at F14: up
to 1.8m cases
Provision revised to c.$60m at F14
Circa 65% of revised SDA provision committed as at
1H15
Remaining SDA expected to be committed in 2H15
3. NRV write down – Bulk wine &
Finished Goods (Provision) $82.4m n/a $63.1m of provision utilised
Program on track to be completed in F15
10
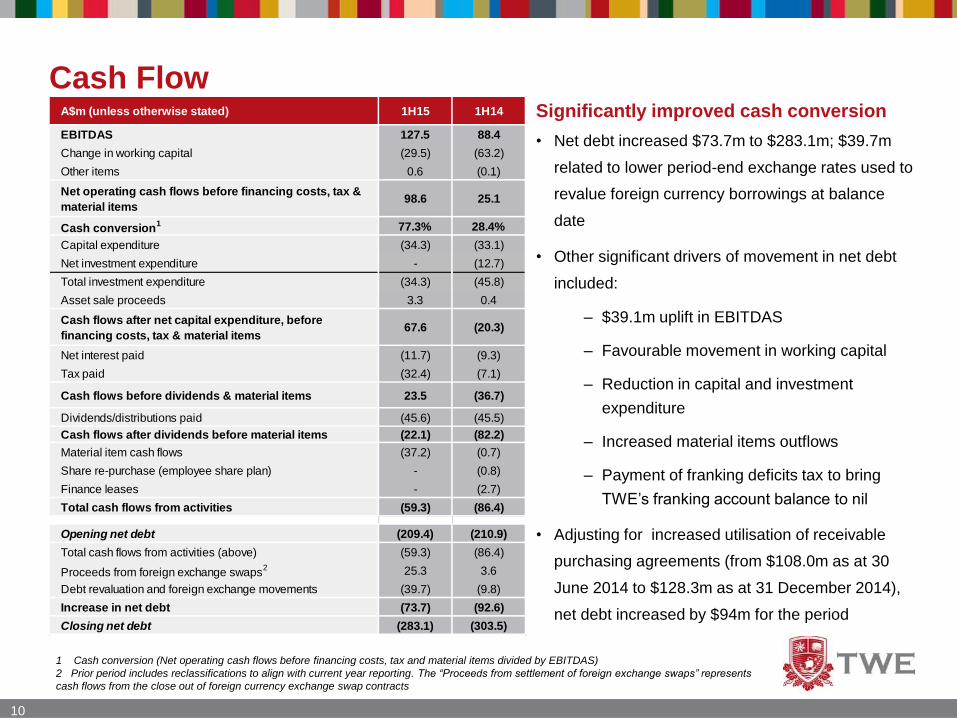
Cash Flow
1 Cash conversion (Net operating cash flows before financing costs, tax and material items divided by EBITDAS)
• Net debt increased $73.7m to $283.1m; $39.7m
related to lower period-end exchange rates used to
revalue foreign currency borrowings at balance
date
• Other significant drivers of movement in net debt
included:
– $39.1m uplift in EBITDAS
– Favourable movement in working capital
– Reduction in capital and investment
expenditure
– Increased material items outflows
– Payment of franking deficits tax to bring
TWE’s franking account balance to nil
• Adjusting for increased utilisation of receivable
purchasing agreements (from $108.0m as at 30
June 2014 to $128.3m as at 31 December 2014),
net debt increased by $94m for the period
Significantly improved cash conversionA$m (unless otherwise stated) 1H15 1H14
EBITDAS 127.5 88.4
Change in working capital (29.5) (63.2)
Other items 0.6 (0.1)
Net operating cash flows before financing costs, tax &
material items98.6 25.1
Cash conversion1 77.3% 28.4%
Capital expenditure (34.3) (33.1)
Net investment expenditure - (12.7)
Total investment expenditure (34.3) (45.8)
Asset sale proceeds 3.3 0.4
Cash flows after net capital expenditure, before
financing costs, tax & material items67.6 (20.3)
Net interest paid (11.7) (9.3)
Tax paid (32.4) (7.1)
Cash flows before dividends & material items 23.5 (36.7)
Dividends/distributions paid (45.6) (45.5)
Cash flows after dividends before material items (22.1) (82.2)
Material item cash flows (37.2) (0.7)
Share re-purchase (employee share plan) - (0.8)
Finance leases - (2.7)
Total cash flows from activities (59.3) (86.4)
Opening net debt (209.4) (210.9)
Total cash flows from activities (above) (59.3) (86.4)
Proceeds from foreign exchange swaps2 25.3 3.6
Debt revaluation and foreign exchange movements (39.7) (9.8)
Increase in net debt (73.7) (92.6)
Closing net debt (283.1) (303.5)
2 Prior period includes reclassifications to align with current year reporting. The “Proceeds from settlement of foreign exchange swaps” represents
cash flows from the close out of foreign currency exchange swap contracts
11
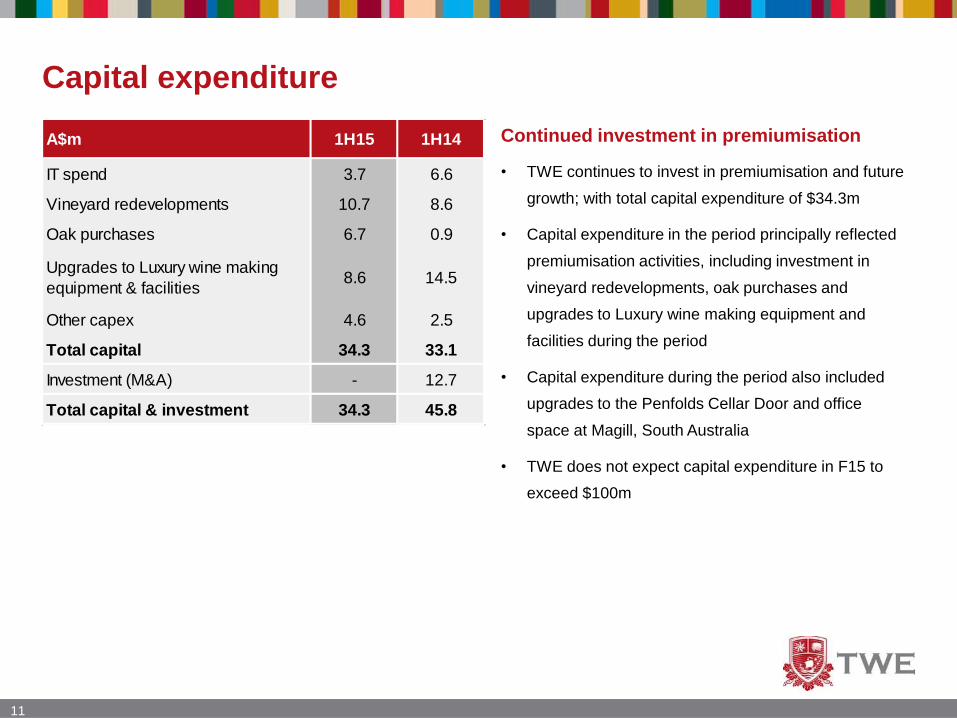
Capital expenditure
• TWE continues to invest in premiumisation and future
growth; with total capital expenditure of $34.3m
• Capital expenditure in the period principally reflected
premiumisation activities, including investment in
vineyard redevelopments, oak purchases and
upgrades to Luxury wine making equipment and
facilities during the period
• Capital expenditure during the period also included
upgrades to the Penfolds Cellar Door and office
space at Magill, South Australia
• TWE does not expect capital expenditure in F15 to
exceed $100m
Continued investment in premiumisation A$m 1H15 1H14
IT spend 3.7 6.6
Vineyard redevelopments 10.7 8.6
Oak purchases 6.7 0.9
Upgrades to Luxury wine making
equipment & facilities8.6 14.5
Other capex 4.6 2.5
Total capital 34.3 33.1
Investment (M&A) - 12.7
Total capital & investment 34.3 45.8
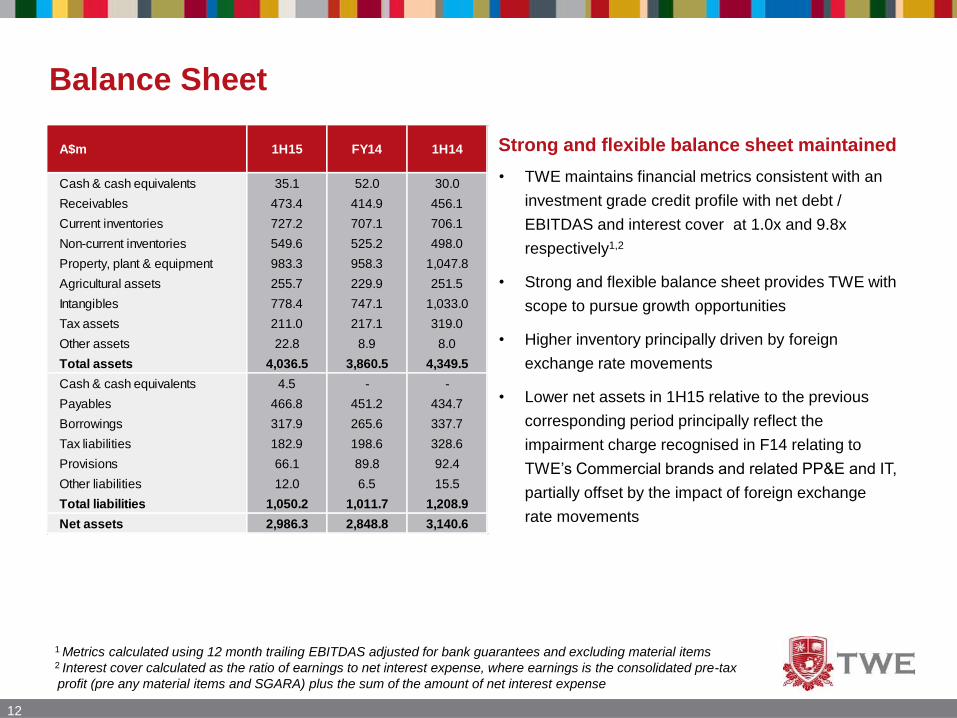
Balance Sheet
Strong and flexible balance sheet maintained
12
• TWE maintains financial metrics consistent with an
investment grade credit profile with net debt /
EBITDAS and interest cover at 1.0x and 9.8x
respectively1,2
• Strong and flexible balance sheet provides TWE with
scope to pursue growth opportunities
• Higher inventory principally driven by foreign
exchange rate movements
• Lower net assets in 1H15 relative to the previous
corresponding period principally reflect the
impairment charge recognised in F14 relating to
TWE’s Commercial brands and related PP&E and IT,
partially offset by the impact of foreign exchange
rate movements
1 Metrics calculated using 12 month trailing EBITDAS adjusted for bank guarantees and excluding material items 2 Interest cover calculated as the ratio of earnings to net interest expense, where earnings is the consolidated pre-tax
profit (pre any material items and SGARA) plus the sum of the amount of net interest expense
A$m 1H15 FY14 1H14
Cash & cash equivalents 35.1 52.0 30.0
Receivables 473.4 414.9 456.1
Current inventories 727.2 707.1 706.1
Non-current inventories 549.6 525.2 498.0
Property, plant & equipment 983.3 958.3 1,047.8
Agricultural assets 255.7 229.9 251.5
Intangibles 778.4 747.1 1,033.0
Tax assets 211.0 217.1 319.0
Other assets 22.8 8.9 8.0
Total assets 4,036.5 3,860.5 4,349.5
Cash & cash equivalents 4.5 - -
Payables 466.8 451.2 434.7
Borrowings 317.9 265.6 337.7
Tax liabilities 182.9 198.6 328.6
Provisions 66.1 89.8 92.4
Other liabilities 12.0 6.5 15.5
Total liabilities 1,050.2 1,011.7 1,208.9
Net assets 2,986.3 2,848.8 3,140.6
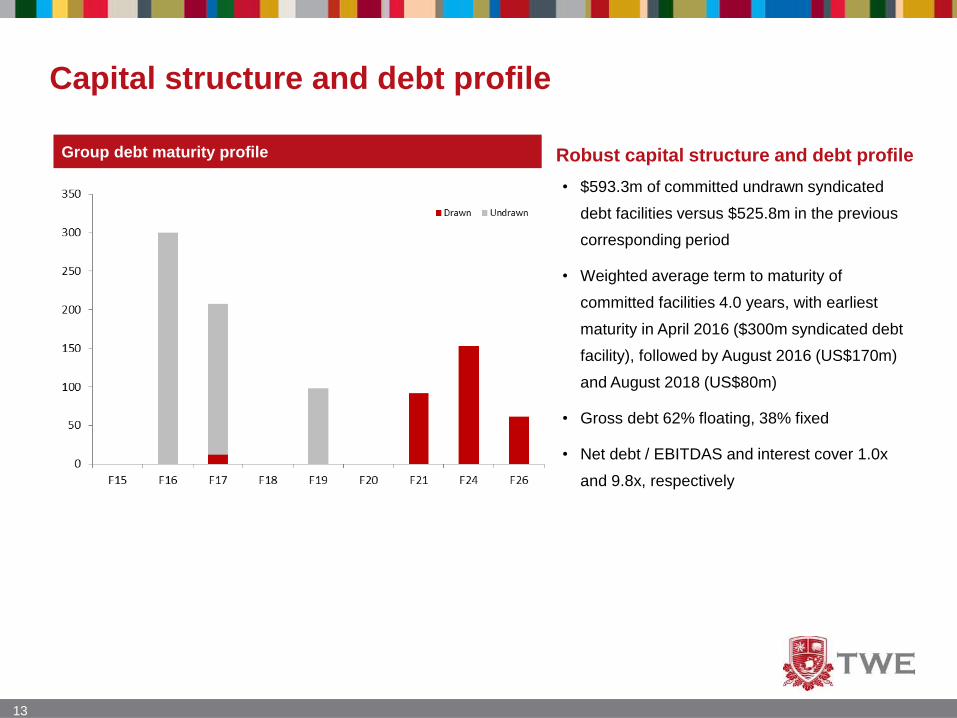
Capital structure and debt profile
• $593.3m of committed undrawn syndicated
debt facilities versus $525.8m in the previous
corresponding period
• Weighted average term to maturity of
committed facilities 4.0 years, with earliest
maturity in April 2016 ($300m syndicated debt
facility), followed by August 2016 (US$170m)
and August 2018 (US$80m)
• Gross debt 62% floating, 38% fixed
• Net debt / EBITDAS and interest cover 1.0x
and 9.8x, respectively
13
Group debt maturity profile Robust capital structure and debt profile
14
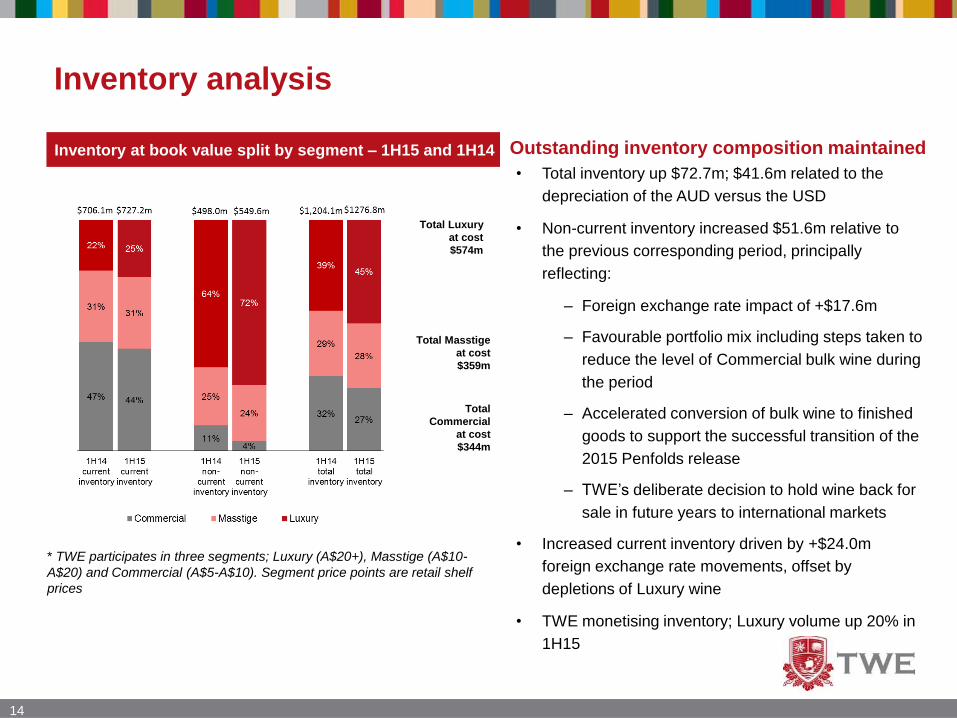
Inventory analysis
• Total inventory up $72.7m; $41.6m related to the
depreciation of the AUD versus the USD
• Non-current inventory increased $51.6m relative to
the previous corresponding period, principally
reflecting:
– Foreign exchange rate impact of +$17.6m
– Favourable portfolio mix including steps taken to
reduce the level of Commercial bulk wine during
the period
– Accelerated conversion of bulk wine to finished
goods to support the successful transition of the
2015 Penfolds release
– TWE’s deliberate decision to hold wine back for
sale in future years to international markets
• Increased current inventory driven by +$24.0m
foreign exchange rate movements, offset by
depletions of Luxury wine
• TWE monetising inventory; Luxury volume up 20% in
1H15
* TWE participates in three segments; Luxury (A$20+), Masstige (A$10-
A$20) and Commercial (A$5-A$10). Segment price points are retail shelf
prices
Outstanding inventory composition maintainedInventory at book value split by segment – 1H15 and 1H14
Total Luxury
at cost
$574m
Total Masstige
at cost
$359m
Total
Commercial
at cost
$344m
Foreign currency impact & risk management
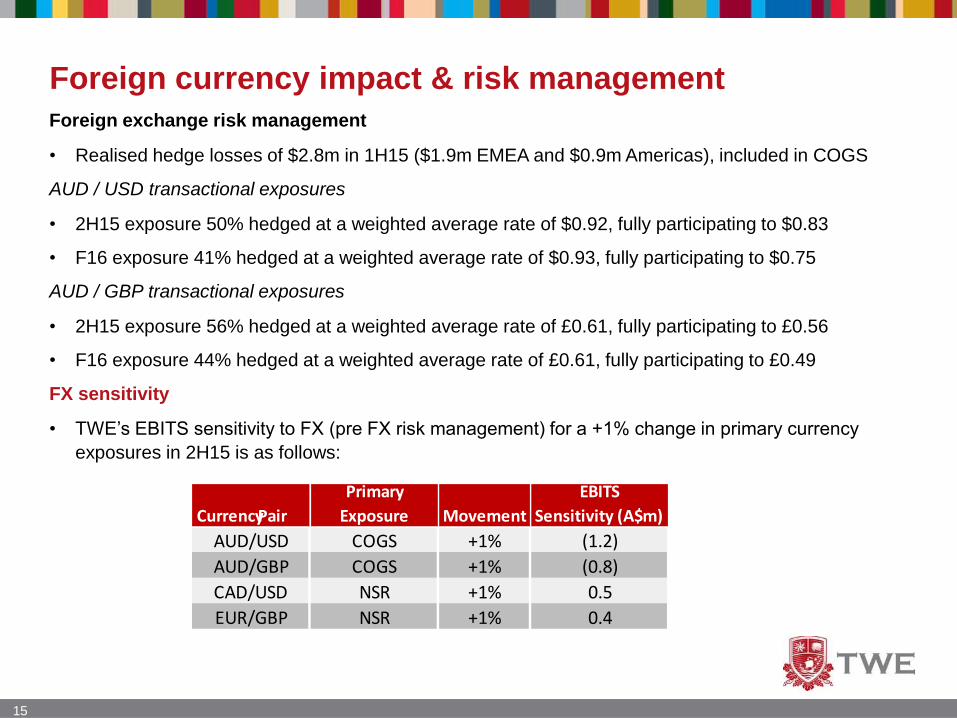
Foreign exchange risk management
• Realised hedge losses of $2.8m in 1H15 ($1.9m EMEA and $0.9m Americas), included in COGS
AUD / USD transactional exposures
• 2H15 exposure 50% hedged at a weighted average rate of $0.92, fully participating to $0.83
• F16 exposure 41% hedged at a weighted average rate of $0.93, fully participating to $0.75
AUD / GBP transactional exposures
• 2H15 exposure 56% hedged at a weighted average rate of £0.61, fully participating to £0.56
• F16 exposure 44% hedged at a weighted average rate of £0.61, fully participating to £0.49
FX sensitivity
• TWE’s EBITS sensitivity to FX (pre FX risk management) for a +1% change in primary currency
exposures in 2H15 is as follows:
15
Currency Pair
Primary
Exposure Movement
EBITS
Sensitivity (A$m)
AUD/USD COGS +1% (1.2)
AUD/GBP COGS +1% (0.8)
CAD/USD NSR +1% 0.5
EUR/GBP NSR +1% 0.4
Michael ClarkeChief Executive Officer
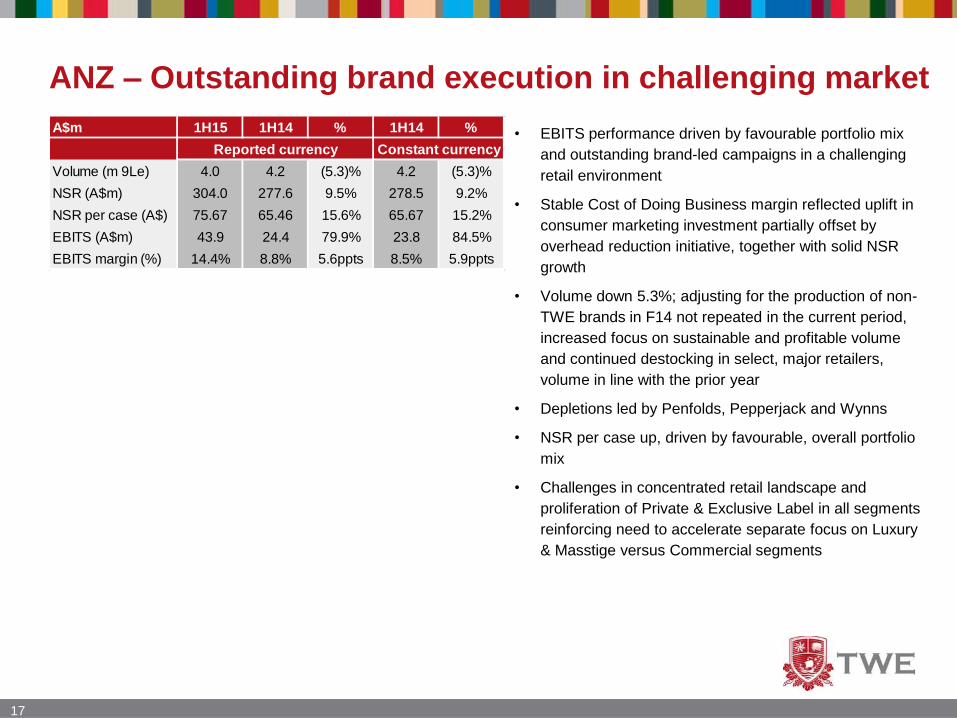
ANZ – Outstanding brand execution in challenging market
• EBITS performance driven by favourable portfolio mix
and outstanding brand-led campaigns in a challenging
retail environment
• Stable Cost of Doing Business margin reflected uplift in
consumer marketing investment partially offset by
overhead reduction initiative, together with solid NSR
growth
• Volume down 5.3%; adjusting for the production of non-
TWE brands in F14 not repeated in the current period,
increased focus on sustainable and profitable volume
and continued destocking in select, major retailers,
volume in line with the prior year
• Depletions led by Penfolds, Pepperjack and Wynns
• NSR per case up, driven by favourable, overall portfolio
mix
• Challenges in concentrated retail landscape and
proliferation of Private & Exclusive Label in all segments
reinforcing need to accelerate separate focus on Luxury
& Masstige versus Commercial segments
17
A$m 1H15 1H14 % 1H14 %
Reported currency Constant currency Reported currency
Volume (m 9Le) 4.0 4.2 (5.3)% 4.2 (5.3)%
NSR (A$m) 304.0 277.6 9.5% 278.5 9.2%
NSR per case (A$) 75.67 65.46 15.6% 65.67 15.2%
EBITS (A$m) 43.9 24.4 79.9% 23.8 84.5%
EBITS margin (%) 14.4% 8.8% 5.6ppts 8.5% 5.9ppts
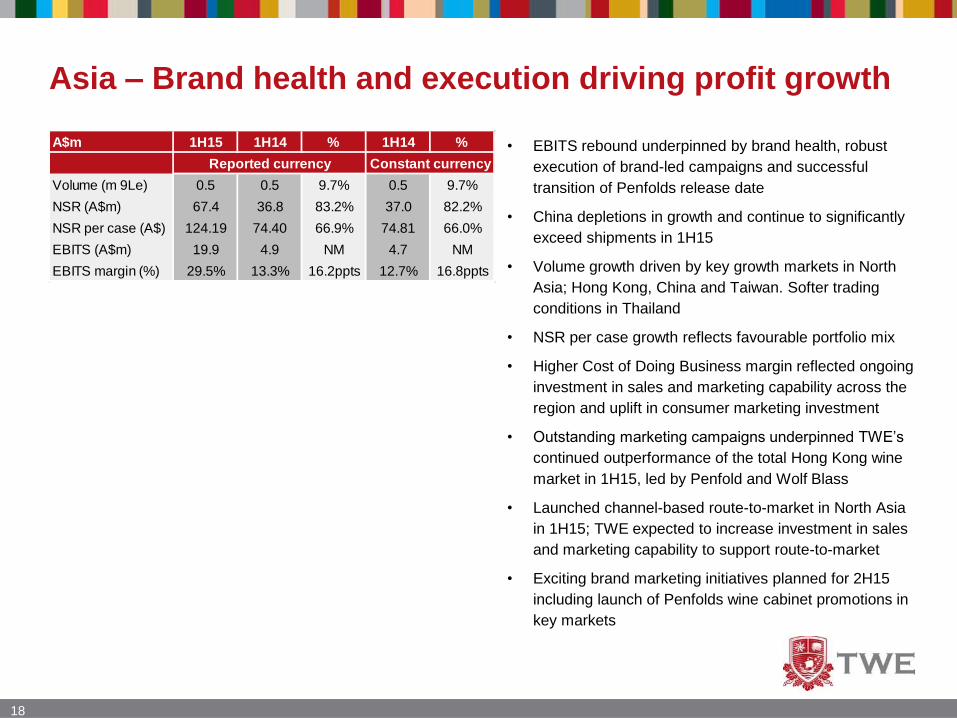
Asia – Brand health and execution driving profit growth
• EBITS rebound underpinned by brand health, robust
execution of brand-led campaigns and successful
transition of Penfolds release date
• China depletions in growth and continue to significantly
exceed shipments in 1H15
• Volume growth driven by key growth markets in North
Asia; Hong Kong, China and Taiwan. Softer trading
conditions in Thailand
• NSR per case growth reflects favourable portfolio mix
• Higher Cost of Doing Business margin reflected ongoing
investment in sales and marketing capability across the
region and uplift in consumer marketing investment
• Outstanding marketing campaigns underpinned TWE’s
continued outperformance of the total Hong Kong wine
market in 1H15, led by Penfold and Wolf Blass
• Launched channel-based route-to-market in North Asia
in 1H15; TWE expected to increase investment in sales
and marketing capability to support route-to-market
• Exciting brand marketing initiatives planned for 2H15
including launch of Penfolds wine cabinet promotions in
key markets
18
A$m 1H15 1H14 % 1H14 %
Reported currency Constant currency Reported currency
Volume (m 9Le) 0.5 0.5 9.7% 0.5 9.7%
NSR (A$m) 67.4 36.8 83.2% 37.0 82.2%
NSR per case (A$) 124.19 74.40 66.9% 74.81 66.0%
EBITS (A$m) 19.9 4.9 NM 4.7 NM
EBITS margin (%) 29.5% 13.3% 16.2ppts 12.7% 16.8ppts
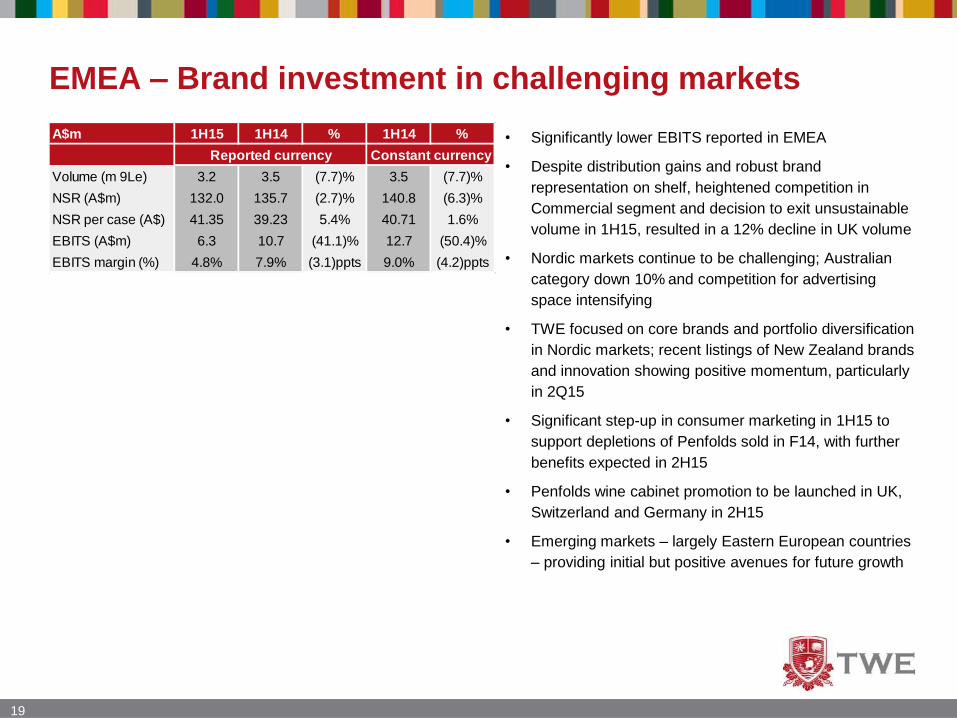
EMEA – Brand investment in challenging markets
• Significantly lower EBITS reported in EMEA
• Despite distribution gains and robust brand
representation on shelf, heightened competition in
Commercial segment and decision to exit unsustainable
volume in 1H15, resulted in a 12% decline in UK volume
• Nordic markets continue to be challenging; Australian
category down 10% and competition for advertising
space intensifying
• TWE focused on core brands and portfolio diversification
in Nordic markets; recent listings of New Zealand brands
and innovation showing positive momentum, particularly
in 2Q15
• Significant step-up in consumer marketing in 1H15 to
support depletions of Penfolds sold in F14, with further
benefits expected in 2H15
• Penfolds wine cabinet promotion to be launched in UK,
Switzerland and Germany in 2H15
• Emerging markets – largely Eastern European countries
– providing initial but positive avenues for future growth
19
A$m 1H15 1H14 % 1H14 %
Reported currency Constant currency Reported currency
Volume (m 9Le) 3.2 3.5 (7.7)% 3.5 (7.7)%
NSR (A$m) 132.0 135.7 (2.7)% 140.8 (6.3)%
NSR per case (A$) 41.35 39.23 5.4% 40.71 1.6%
EBITS (A$m) 6.3 10.7 (41.1)% 12.7 (50.4)%
EBITS margin (%) 4.8% 7.9% (3.1)ppts 9.0% (4.2)ppts
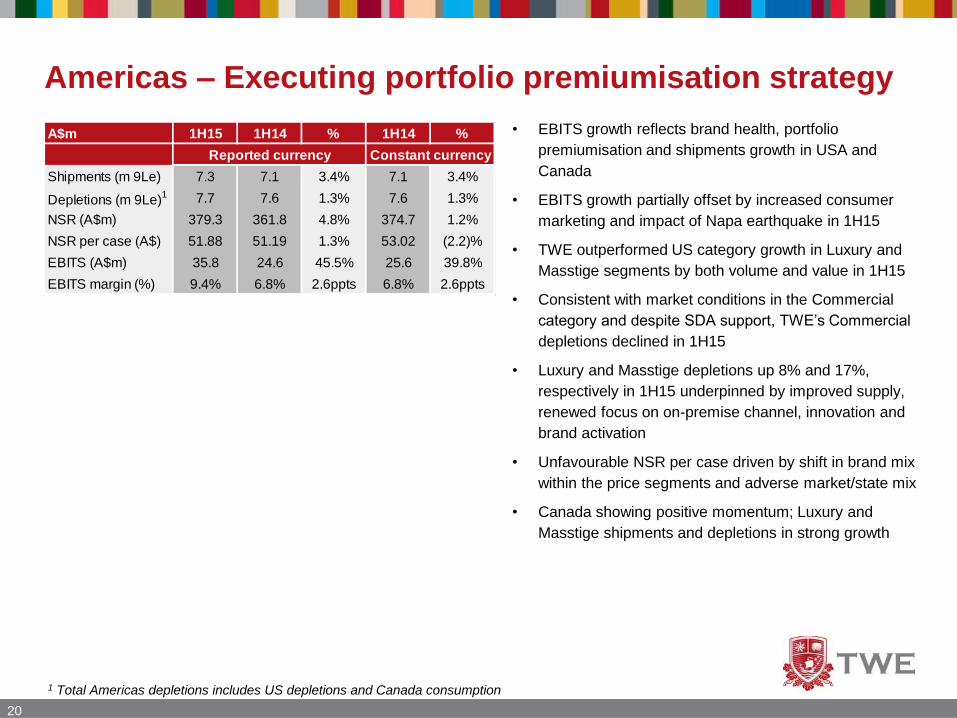
Americas – Executing portfolio premiumisation strategy
20
• EBITS growth reflects brand health, portfolio
premiumisation and shipments growth in USA and
Canada
• EBITS growth partially offset by increased consumer
marketing and impact of Napa earthquake in 1H15
• TWE outperformed US category growth in Luxury and
Masstige segments by both volume and value in 1H15
• Consistent with market conditions in the Commercial
category and despite SDA support, TWE’s Commercial
depletions declined in 1H15
• Luxury and Masstige depletions up 8% and 17%,
respectively in 1H15 underpinned by improved supply,
renewed focus on on-premise channel, innovation and
brand activation
• Unfavourable NSR per case driven by shift in brand mix
within the price segments and adverse market/state mix
• Canada showing positive momentum; Luxury and
Masstige shipments and depletions in strong growth
1 Total Americas depletions includes US depletions and Canada consumption
A$m 1H15 1H14 % 1H14 %
Reported currency Constant currency Reported currency
Shipments (m 9Le) 7.3 7.1 3.4% 7.1 3.4%
Depletions (m 9Le)1 7.7 7.6 1.3% 7.6 1.3%
NSR (A$m) 379.3 361.8 4.8% 374.7 1.2%
NSR per case (A$) 51.88 51.19 1.3% 53.02 (2.2)%
EBITS (A$m) 35.8 24.6 45.5% 25.6 39.8%
EBITS margin (%) 9.4% 6.8% 2.6ppts 6.8% 2.6ppts
21
Summary• 1H15 EBITS of $85.2m was in line with company expectations; TWE remains on track to deliver plan in F15
• Luxury & Masstige portfolio showing solid momentum in all regions
• Continued challenges in Commercial segment in all major markets; intensified by proliferation of Private &
Exclusive labels
• Separate focus of Luxury & Masstige and Commercial portfolio to rapidly accelerate in 2H15, globally
• Executing plan to expand routes-to-market in growth markets and channels; expected to have significant and
imminent impact on already strong demand for scarce Penfolds wine
• Outstanding brand campaigns planned in all regions for TWE’s brand portfolio – beyond Penfolds – in 2H15
• $35m overhead reduction program on track for completion in F15
• Exciting Penfolds innovation planned for mid-CY2015 combining a highly collectable proposition from TWE’s
cellars and the promise of delivering an accessible Luxury wine for new entrants into Penfolds family
• Movements in foreign exchange rates favour exports of Australian wine to growth market; TWE expects
recent declines in the Australian Dollar to have a meaningful translation impact in 2H15
• TWE’s balance sheet strength provides TWE with flexibility to explore inorganic growth opportunities intended
to strengthen the Company’s position to build scale and flexibility in its Luxury and Masstige portfolios around
the world
• 1H15 result demonstrates TWE is executing against its plan to fix the quality of its earnings base and re-set
the business
• Re-setting TWE’s base business is a journey; TWE is being managed for the long-term

Questions
23
Disclaimer
Treasury Wine Estates (TWE) advises that this presentation contains forward looking statements which may be subject to significant uncertainties outside of TWE’s control.
No representation is made as to the accuracy or reliability of forecasts or the assumptions on which they are based.
Actual future events may vary from these forecasts and you are cautioned not to place undue reliance on any forward looking statement.
Supplementary
Information
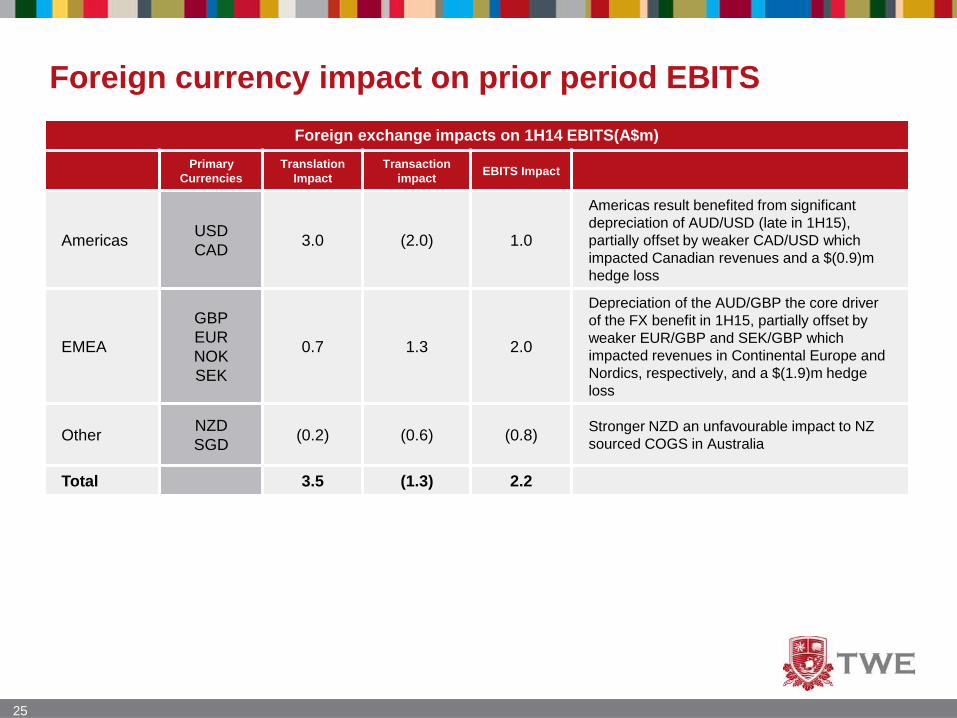
Foreign currency impact on prior period EBITS
25
Foreign exchange impacts on 1H14 EBITS(A$m)
Primary
Currencies
Translation
Impact
Transaction
impactEBITS Impact
AmericasUSD
CAD3.0 (2.0) 1.0
Americas result benefited from significant
depreciation of AUD/USD (late in 1H15),
partially offset by weaker CAD/USD which
impacted Canadian revenues and a $(0.9)m
hedge loss
EMEA
GBP
EUR
NOK
SEK
0.7 1.3 2.0
Depreciation of the AUD/GBP the core driver
of the FX benefit in 1H15, partially offset by
weaker EUR/GBP and SEK/GBP which
impacted revenues in Continental Europe and
Nordics, respectively, and a $(1.9)m hedge
loss
OtherNZD
SGD(0.2) (0.6) (0.8)
Stronger NZD an unfavourable impact to NZ
sourced COGS in Australia
Total 3.5 (1.3) 2.2
26
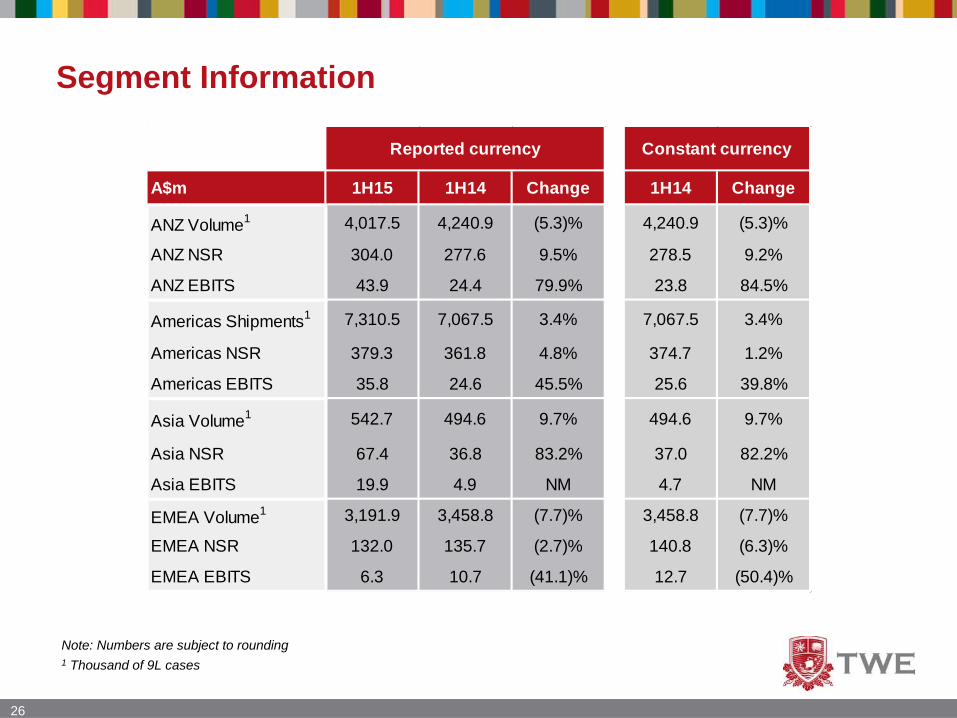
Segment Information
Note: Numbers are subject to rounding
1 Thousand of 9L cases
A$m 1H15 1H14 Change 1H14 Change
ANZ Volume1 4,017.5 4,240.9 (5.3)% 4,240.9 (5.3)%
ANZ NSR 304.0 277.6 9.5% 278.5 9.2%
ANZ EBITS 43.9 24.4 79.9% 23.8 84.5%
Americas Shipments1 7,310.5 7,067.5 3.4% 7,067.5 3.4%
Americas NSR 379.3 361.8 4.8% 374.7 1.2%
Americas EBITS 35.8 24.6 45.5% 25.6 39.8%
Asia Volume1 542.7 494.6 9.7% 494.6 9.7%
Asia NSR 67.4 36.8 83.2% 37.0 82.2%
Asia EBITS 19.9 4.9 NM 4.7 NM
EMEA Volume1 3,191.9 3,458.8 (7.7)% 3,458.8 (7.7)%
EMEA NSR 132.0 135.7 (2.7)% 140.8 (6.3)%
EMEA EBITS 6.3 10.7 (41.1)% 12.7 (50.4)%
Reported currency Constant currency
27
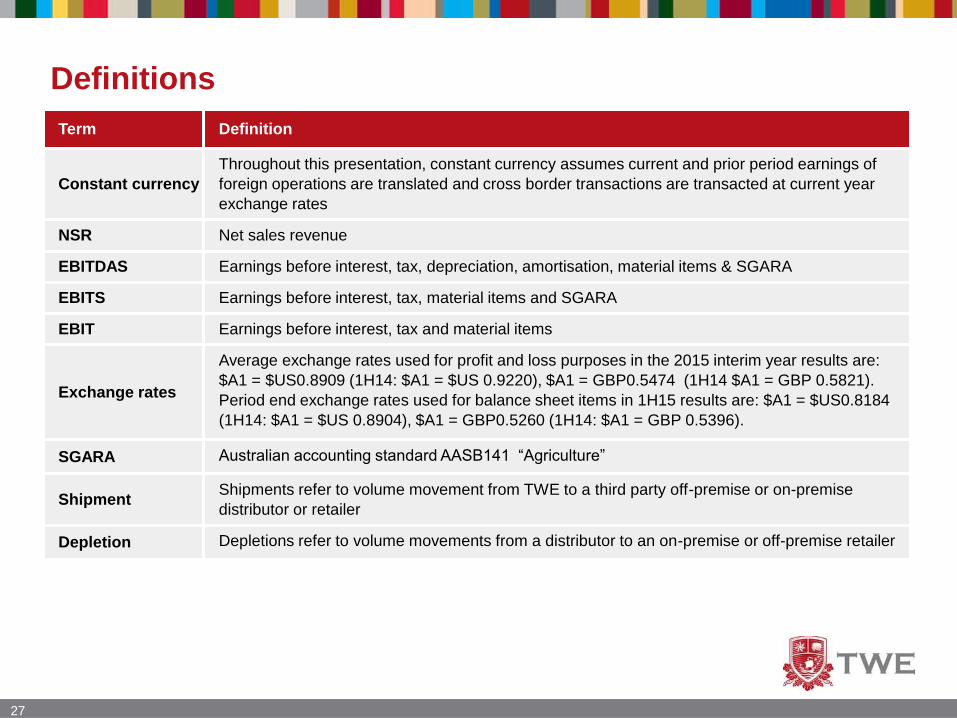
Definitions
Term Definition
Constant currency
Throughout this presentation, constant currency assumes current and prior period earnings of
foreign operations are translated and cross border transactions are transacted at current year
exchange rates
NSR Net sales revenue
EBITDAS Earnings before interest, tax, depreciation, amortisation, material items & SGARA
EBITS Earnings before interest, tax, material items and SGARA
EBIT Earnings before interest, tax and material items
Exchange rates
Average exchange rates used for profit and loss purposes in the 2015 interim year results are:
$A1 = $US0.8909 (1H14: $A1 = $US 0.9220), $A1 = GBP0.5474 (1H14 $A1 = GBP 0.5821).
Period end exchange rates used for balance sheet items in 1H15 results are: $A1 = $US0.8184
(1H14: $A1 = $US 0.8904), $A1 = GBP0.5260 (1H14: $A1 = GBP 0.5396).
SGARA Australian accounting standard AASB141 “Agriculture”
ShipmentShipments refer to volume movement from TWE to a third party off-premise or on-premise
distributor or retailer
Depletion Depletions refer to volume movements from a distributor to an on-premise or off-premise retailer