Embed Size (px)
Citation preview
Michael Ennamorato AndJohn Mohler
Travel Intentions StudyReportWave 4 (August 2004)
Presented to:
Ontario Ministry Of Tourism And Recreation
September 24, 2004
A1234/A1235
2©2004 TNS - Confidential
Background
This study is intended to measure intent to travel to Ontario and specific Ontario destinations within key US and domestic markets.
Information will be used to:forecast demand to assist with industry planning;gauge the impact of negative events on travel to Ontario;provide information to assist with messaging and targeting of promotional communications and other marketing initiatives.
This presentation focuses on findings in two key areas:understanding the factors placing pressure on Fall travel to Ontario in the main US source markets;measuring the travel dynamic in the domestic market.

3©2004 TNS - Confidential
Interviewing was conducted by telephone among individuals 18 years or older.
The survey for this fourth wave was essentially confined to the month of August, 2004. This follows waves conducted in May and February 2004, and in November of last year.
The focus was on travel intentions for the coming season (September/November) and, secondarily the following season (December 2004/February 2005).
A stringent methodology was used:modified random digit dialing using a seed sample drawn from up-to-date telephone listings;Multiple callbacks (up to 8 calls to achieve a completion once contact is made with the household);One additional callback to “soft” refusals.
Methodology
4©2004 TNS - Confidential
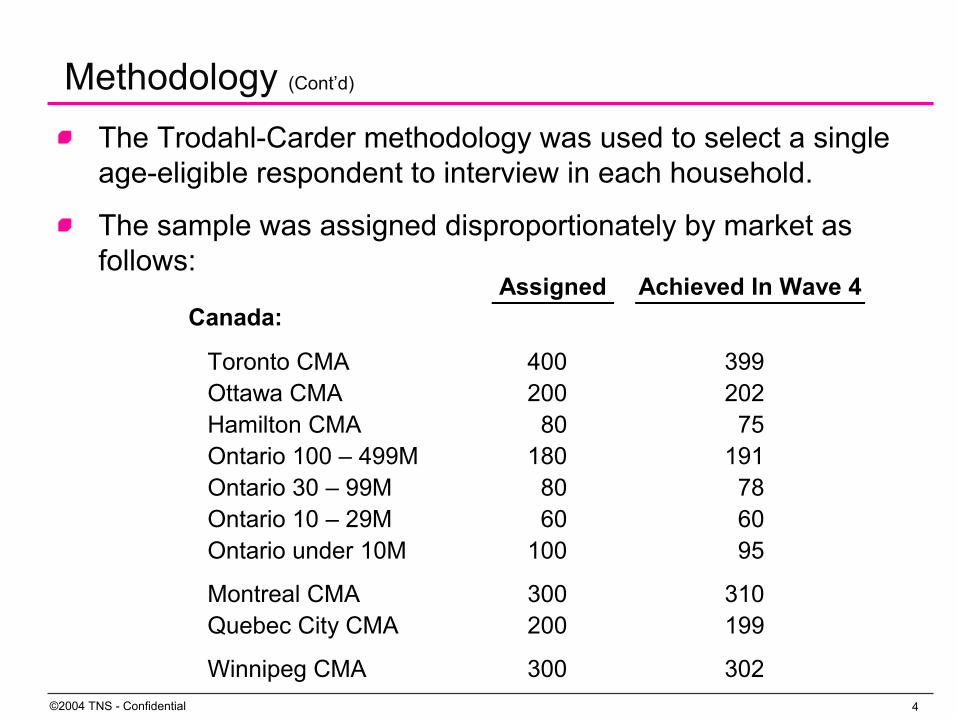
The Trodahl-Carder methodology was used to select a single age-eligible respondent to interview in each household.
The sample was assigned disproportionately by market as follows:
Assigned Achieved In Wave 4 Canada:
Toronto CMA 400 399 Ottawa CMA 200 202 Hamilton CMA 80 75 Ontario 100 – 499M 180 191 Ontario 30 – 99M 80 78 Ontario 10 – 29M 60 60 Ontario under 10M 100 95
Montreal CMA 300 310 Quebec City CMA 200 199
Winnipeg CMA 300 302
Methodology (Cont’d)
5©2004 TNS - Confidential
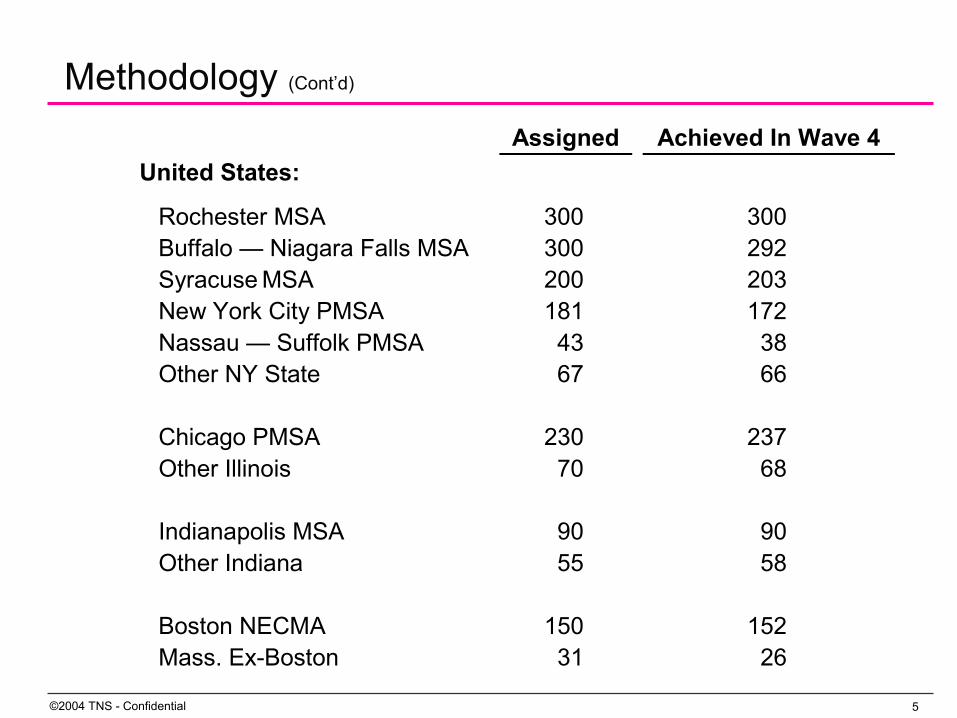
Assigned Achieved In Wave 4 United States:
Rochester MSA 300 300 Buffalo — Niagara Falls MSA 300 292 Syracuse MSA 200 203 New York City PMSA 181 172 Nassau — Suffolk PMSA 43 38 Other NY State 67 66 Chicago PMSA 230 237 Other Illinois 70 68 Indianapolis MSA 90 90 Other Indiana 55 58 Boston NECMA 150 152 Mass. Ex-Boston 31 26
Methodology (Cont’d)

6©2004 TNS - Confidential
Assigned Achieved In Wave 4 United States: (Cont’d)
Detroit PMSA 300 289 Northern Michigan PMSAs/MSAs 84 85 Other Michigan 64 68
Minneapolis—St. Paul UA 200 204 Other Minnesota 41 37
Cleveland—Lorain—Elyria PMSA 200 204 Cincinnati PMSA 100 103 Columbus MSA 104 103 Other Ohio 60 62
Pittsburgh MSA 300 306 Philadelphia PMSA 150 145 Other Pennsylvania 77 78
Milwaukee—Waukesha PMSA 200 190 Other Wisconsin 67 72
Washington DC PMSA 100 101
Maryland Ex. Washington DC 118 116
Methodology (Cont’d)

7©2004 TNS - Confidential
In total, 5,776 interviews were completed:1,911 in Canada;3,865 in the United States.
As part of data processing, the sample was weighted in three stages using the most recently available census information from each country:
household size within market;household conversion weight (to correct for differential selection probabilities within household due to variations in number of age-qualified individuals within each);age within gender within market.
Methodology (Cont’d)

8©2004 TNS - Confidential
The U.S.Travel InterestImpediments To TravelDestination Perceptions
CanadaTravel InterestImpediments To TravelDestination Perceptions
Ideal Destination
Presentation outline

Key Findings — U.S.
10©2004 TNS - Confidential
Key Findings — U.S.
Compared with the previous three waves of research, subtle shifts in key measures for Wave Four indicate a degree of stability with regard to American travel patterns.
A slight lift in travel intentions for the coming year is coupled with a comparable dip in the tendency to take fewer and shorter overnight trips.
Any hints of optimism with regard to increased travel activity, however, are tempered by signs that Americans remain cautious when planning trips.
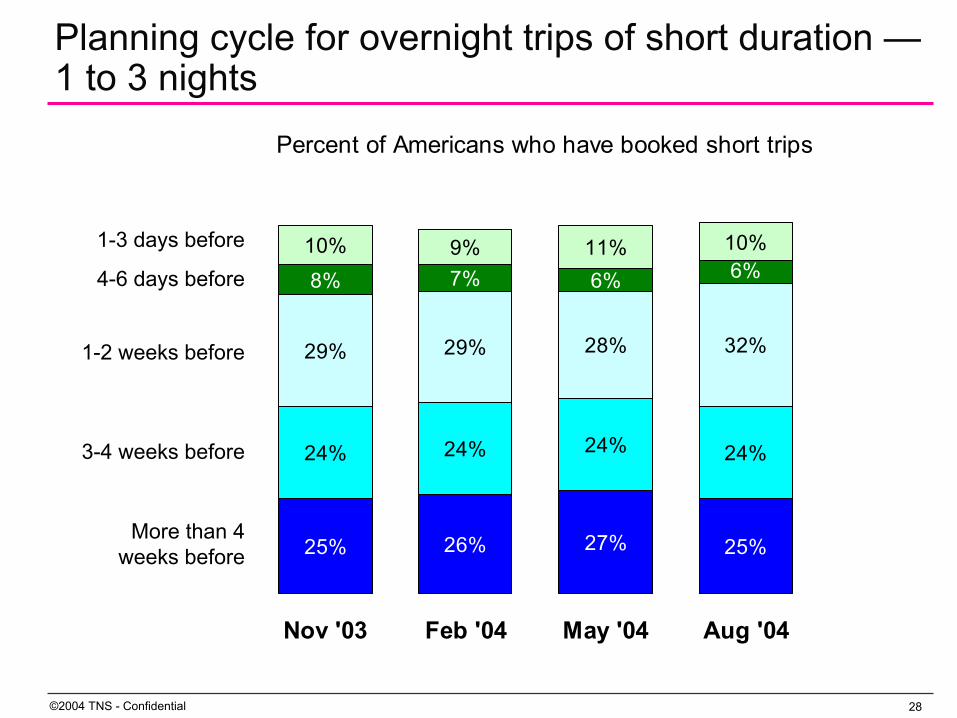
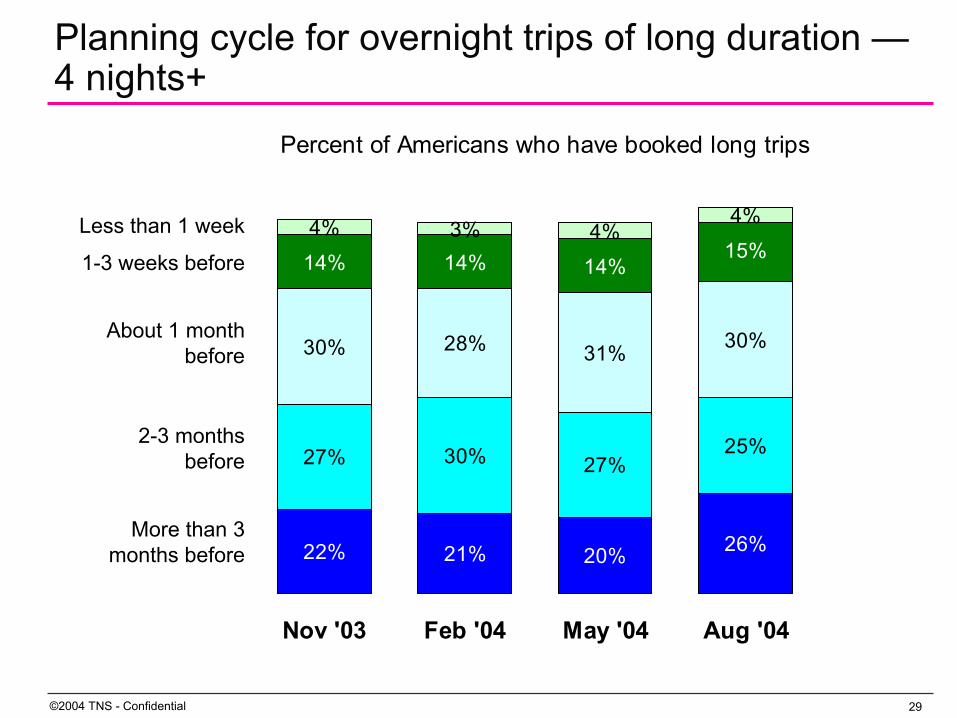
The pattern of making travel plans closer to the departure date is somewhat dynamic from wave to wave, and Wave Four suggests a rise in this trend.Roughly 50% of longer trips and 75% of shorter trips are booked within one month of the departure date.

11©2004 TNS - Confidential
Relative to other locations, and compared with previous waves, Americans’ travel intentions to Canada are favourable for the coming months. In fact, they are higher than were reported for any of the previous waves.
The pattern for Ontario, however, does not mirror the trend in intentions to other Canadian destinations.
Intentions for Toronto and Niagara Falls are in-line with intentions for the previous spring season (March/May).
Intentions for ‘Elsewhere In Ontario’ are at levels as low as reported for any of the previous three waves.
Key Findings — U.S. (Cont’d)

12©2004 TNS - Confidential
Certainly there is a seasonal effect at work here, and there is some sense that the fall travel intentions expressed last May with regard to Ontario are holding up fairly well in most major US markets.
This is particularly true in those in the Niagara Frontier, closest to Ontario’s main destinations.
When considering the American markets as a whole, one could say that there is pent up demand for out-of-country travel, but a “cocooning” effect is still in place.
This acts as a drag on foreign travel and possibly has a greater negative impact on the nearest Canadian destinations (Ontario) than on those that are more distant, or “exotic”.
Key Findings — U.S. (Cont’d)

13©2004 TNS - Confidential
Looking forward to the winter season, evidence suggests that intentions are constrained.
This suggests that US travellers are not going to commit themselves early in today’s environment, particularly when considering off-peak seasonal travel.
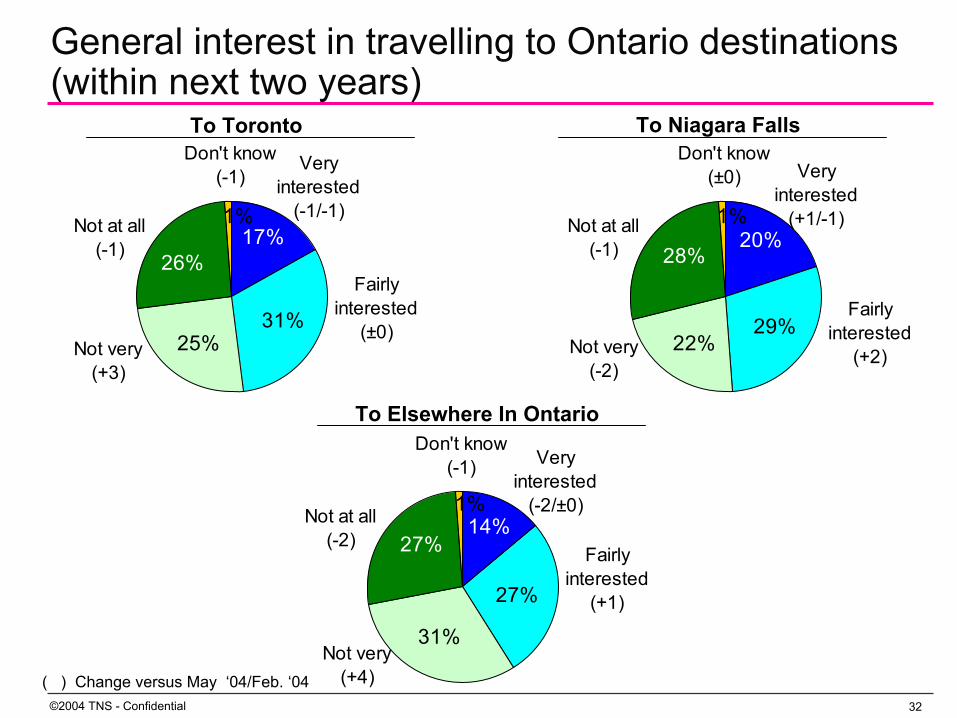
When considering specific Ontario destinations, a general lack of interest inhibits travel to Toronto, and to a lesser degree Niagara Falls and other Ontario destinations.
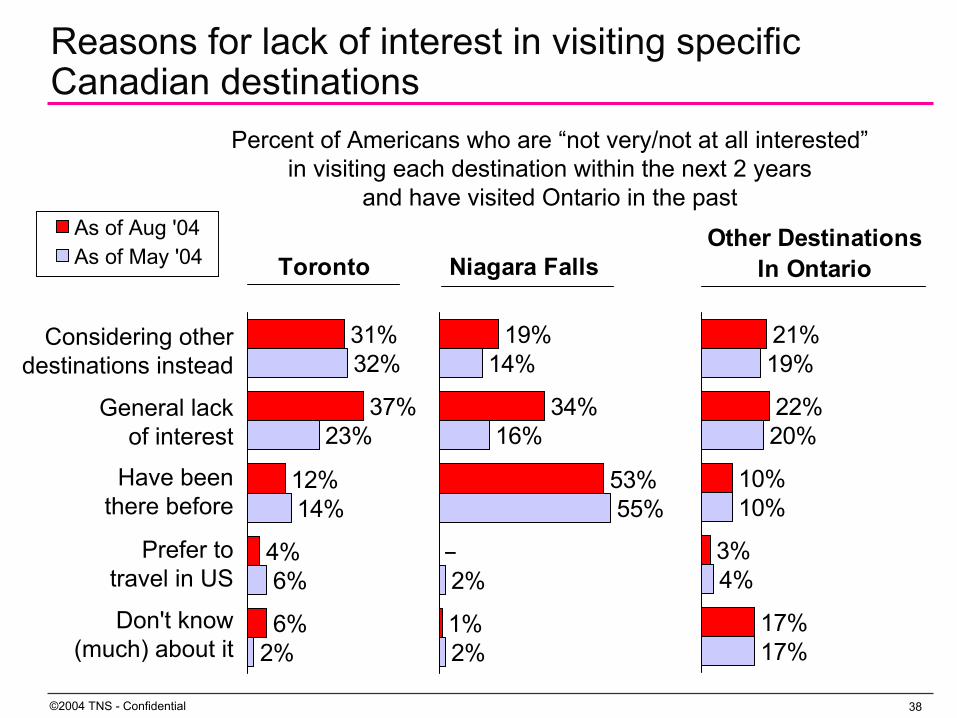
Travel to Niagara Falls is also limited by perceptions of ‘been there done that’.
A general lack of awareness limits travel to Ontario destinations other than Toronto and Niagara Falls.
Key Findings — U.S. (Cont’d)

14©2004 TNS - Confidential
The reported impact of specific, monitored issues and events, including SARS, is decreasing.
Issues broadly related to perceptions of terrorist activity and the associated political climate, however, do not show signs of diminishing and negatively impact travel intentions to Ontario.
Key Findings — U.S. (Cont’d)

15©2004 TNS - Confidential
Through four waves of research, Ontario destinations have maintained consistent overall ratings as travel destinations, atthe 7.5 out of 10 level.
Ratings for specific characteristics have also held moderate levels wave over wave.
It should be noted though, that no single characteristic stands out as exceptionally strong.
Beyond that, Ontario’s positive image does not directly translate into positive perceptions as a travel destination.
Perhaps a nice place to visit occasionally, and safe relative to other “foreign” alternatives…but not particularly exciting or alluring relative to other options (even within the US).
Key Findings — U.S. (Cont’d)

Propensity To Travel &Trip Planning
17©2004 TNS - Confidential
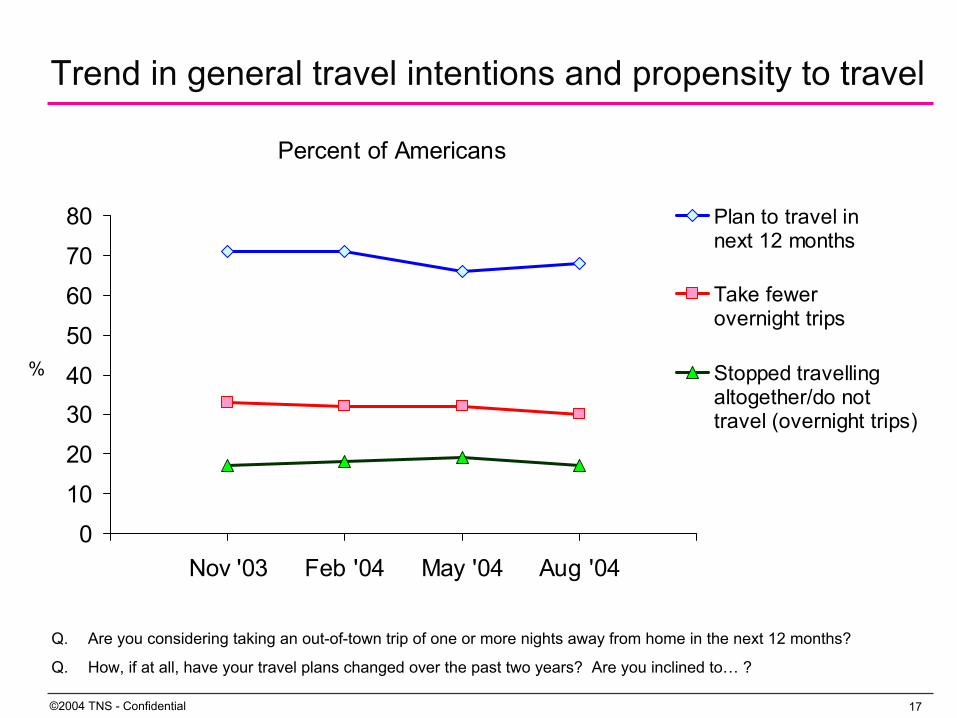
Trend in general travel intentions and propensity to travel
Percent of Americans
0
10
20
3040
50
60
70
80
Nov '03 Feb '04 May '04 Aug '04
%
Plan to travel innext 12 months
Take fewerovernight trips
Stopped travellingaltogether/do nottravel (overnight trips)
Q. Are you considering taking an out-of-town trip of one or more nights away from home in the next 12 months?
Q. How, if at all, have your travel plans changed over the past two years? Are you inclined to… ?
18©2004 TNS - Confidential
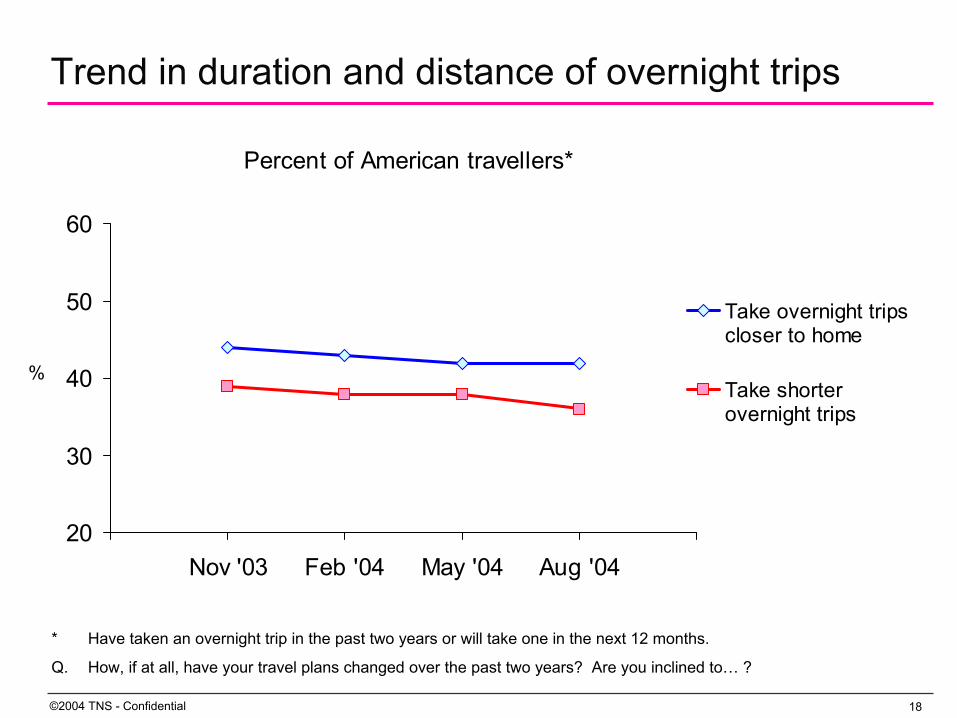
Percent of American travellers*
20
30
40
50
60
Nov '03 Feb '04 May '04 Aug '04
%
Take overnight tripscloser to home
Take shorterovernight trips
* Have taken an overnight trip in the past two years or will take one in the next 12 months.
Q. How, if at all, have your travel plans changed over the past two years? Are you inclined to… ?
Trend in duration and distance of overnight trips
19©2004 TNS - Confidential
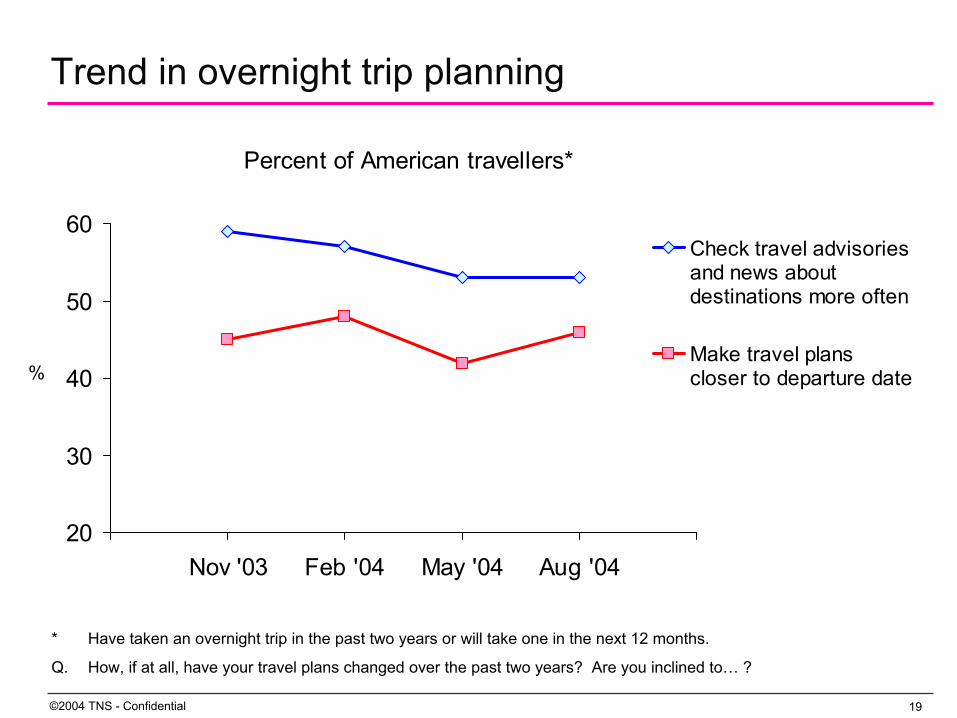
Percent of American travellers*
20
30
40
50
60
Nov '03 Feb '04 May '04 Aug '04
%
Check travel advisoriesand news about destinations more often
Make travel plans closer to departure date
* Have taken an overnight trip in the past two years or will take one in the next 12 months.
Q. How, if at all, have your travel plans changed over the past two years? Are you inclined to… ?
Trend in overnight trip planning

Travel Intention Details

21©2004 TNS - Confidential
Intended travel patterns of US residentsNumber of adults claiming will take overnight trip (thousands)— not seasonally adjusted
20,721
29,860
5,376
2,682
2,799
2,003
4,434
5,980
5,879
20,005
32,357
5,610
2,642
2,951
2,379
3,671
6,399
6,410
22,019
33,062
7,234
3,295
3,674
3,251
4,364
5,771
6,884
20,634
32,055
4,573
2,135
2,190
1,980
2,537
8,108
5,930
Next Season(Mar/May)
Within Own State
Elsewhere In US
Ontario
Toronto
Niagara Falls
Elsewhere in Ontario
Other Canada
Mexico/Caribbean
Other country
Next Season(Dec/Feb)
Next Season(June/Aug)
Next Season(Sept/Nov)
Nov. Wave Feb. Wave May Wave Aug. Wave

22©2004 TNS - Confidential
As of May '04
5,597
2,976
2,460
2,586
Ontario
Toronto
Niagara Falls
Other Ontario
As of August '04
5,376
2,682
2,799
2,003
Projected number of Americans intendingto travel to each destination (in thousands)
Travel intentions for Fall ‘04 (Sept/Nov)
Net Change
-221
-294
+339
-583

23©2004 TNS - Confidential
Ontario travel intention incidence
Percent of American adults stating intend to travel to Ontario as of….
6%
9%
NextSeason(Winter)
SeasonAfter Next(Spring)
Nov. '03
8%
12%
NextSeason(Spring)
SeasonAfter Next(Summer)
Feb. '04
10%8%
NextSeason
(Summer)
SeasonAfter Next
(Fall)
May '04
7%
3%
NextSeason
(Fall)
SeasonAfter Next(Winter)
Aug. '04

24©2004 TNS - Confidential
Percent Of Adults In Each Case Stating… Intend To Travel To/Within Ontario
As Of Feb. ‘04 As Of May ‘04 As Of Aug. ‘04
During Mar/May
During June/Aug
During June/Aug
During Sept/Nov
During Sept/Nov
During Dec/Feb
Buffalo % 29 36 35 23 27 14 Rochester % 23 37 36 22 30 11 Syracuse % 17 26 22 16 18 7 New York City % 9 14 12 10 8 1 Pittsburgh % 8 18 9 13 7 3 Detroit % 20 27 23 18 16 5 Cleveland % 18 26 18 3 12 4 Boston % 3 9 6 4 6 2 Washington DC % 9 10 6 6 8 2 Cincinnati % 6 14 7 3 5 1 Milwaukee % 3 6 3 4 1 1 Indianapolis % 6 14 4 2 4 2 Chicago % 2 10 6 11 7 4 Philadelphia % 9 11 11 5 4 2 Minneapolis % 5 9 5 2 2 2
TOTAL US % 8 12 10 8 7 3
Ontario travel intention incidenceby US market (selected cities)
25©2004 TNS - Confidential
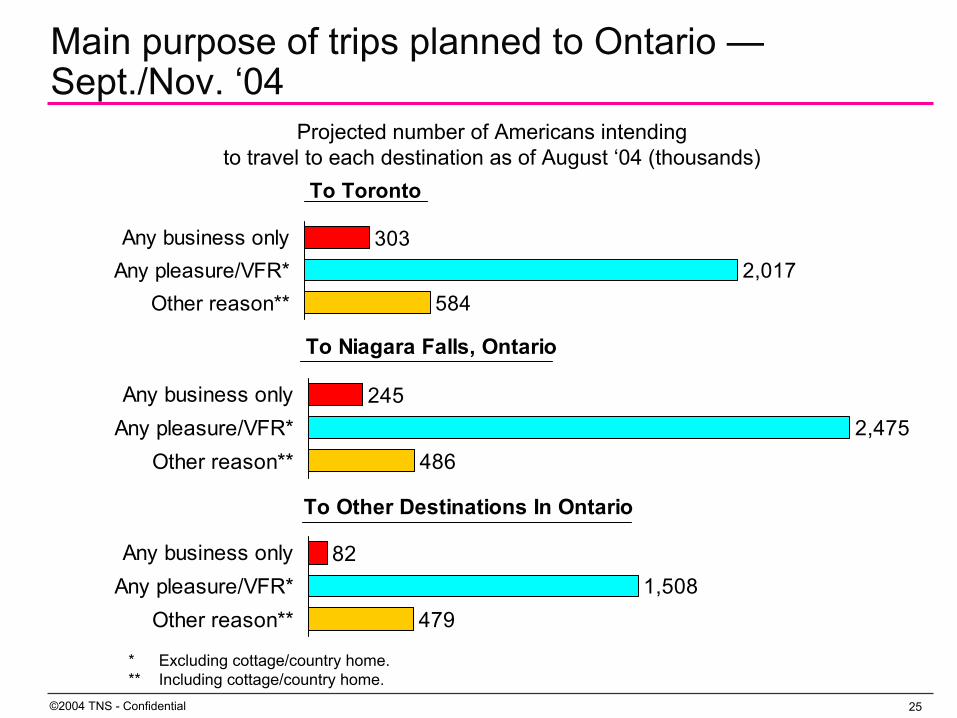
To Other Destinations In Ontario
821,508
479
Any business onlyAny pleasure/VFR*
Other reason**
To Toronto
3032,017
584
Any business onlyAny pleasure/VFR*
Other reason**
Main purpose of trips planned to Ontario —Sept./Nov. ‘04
Projected number of Americans intendingto travel to each destination as of August ‘04 (thousands)
To Niagara Falls, Ontario
2452,475
486
Any business onlyAny pleasure/VFR*
Other reason**
* Excluding cottage/country home. ** Including cottage/country home.
26©2004 TNS - Confidential
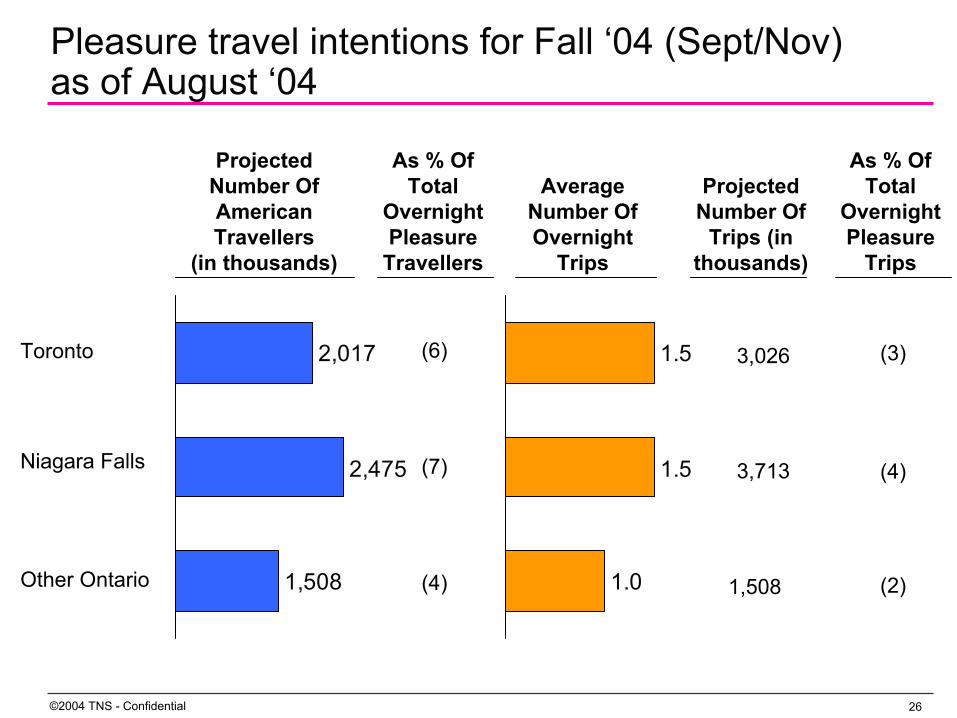
Pleasure travel intentions for Fall ‘04 (Sept/Nov)as of August ‘04
Toronto
Niagara Falls
Other Ontario
2,017
1,508
2,475
Projected Number OfAmerican Travellers
(in thousands)
1.5
1.0
1.5
Average Number OfOvernight
Trips
As % Of Total
Overnight Pleasure
Travellers
(6)
(7)
(4)
As % Of Total
Overnight Pleasure
Trips
(3)
(4)
(2)1,508
Projected Number Of
Trips (in thousands)
3,026
3,713
27©2004 TNS - Confidential
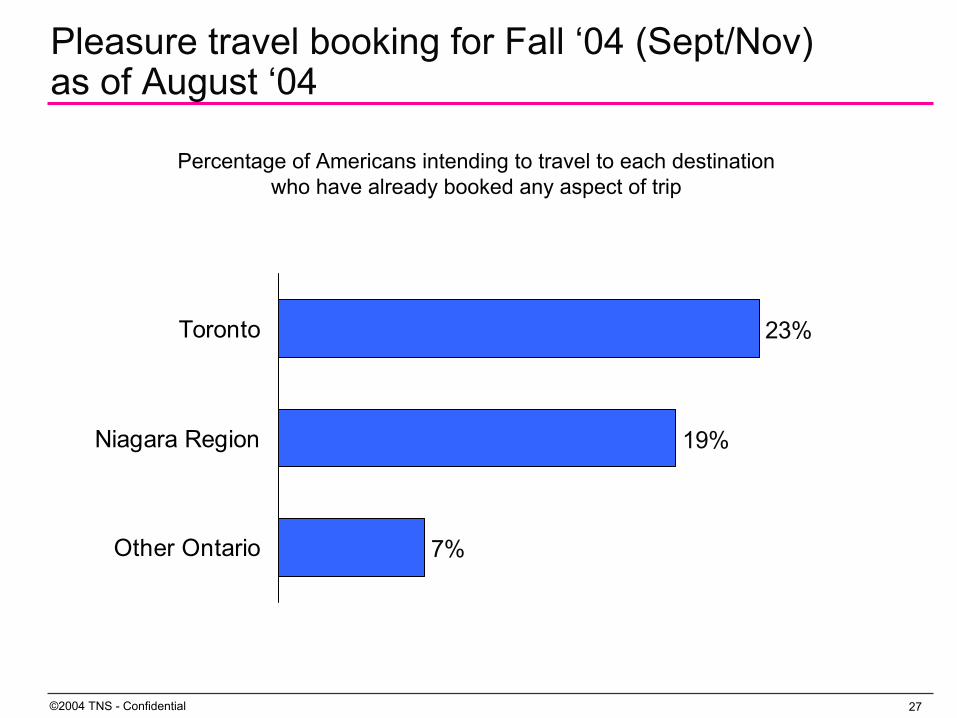
Pleasure travel booking for Fall ‘04 (Sept/Nov)as of August ‘04
23%
7%
19%
Toronto
Niagara Region
Other Ontario
Percentage of Americans intending to travel to each destination who have already booked any aspect of trip
28©2004 TNS - Confidential
Planning cycle for overnight trips of short duration —1 to 3 nights
Percent of Americans who have booked short trips
25% 26% 27% 25%
24% 24% 24% 24%
29% 29% 28% 32%
8% 7% 6%
10% 9% 11% 10%6%
Nov '03 Feb '04 May '04 Aug '04
1-3 days before
4-6 days before
1-2 weeks before
3-4 weeks before
More than 4 weeks before
29©2004 TNS - Confidential
Planning cycle for overnight trips of long duration —4 nights+
Less than 1 week
1-3 weeks before
About 1 monthbefore
2-3 monthsbefore
More than 3 months before
Percent of Americans who have booked long trips
22% 21% 20% 26%
27% 30% 27%25%
30% 28% 31% 30%
14% 14% 14%
4% 3% 4%4%
15%
Nov '03 Feb '04 May '04 Aug '04

Intended Ontario Pleasure Travel Among Americans

31©2004 TNS - Confidential
1,217
2,035
145
15
52
12
125
165
4
90
Toronto/GTA
Niagara Region
Ottawa
Central Ontario
Eastern Ontario
London
Northern Ontario
Windsor
Kingston
SW Ontario
Destination of next overnight pleasure tripto/within Ontario (as of Aug. ‘04)Number of Americans who intend to travel to each destination (thousands)
Change vs. Summer
‘04 (May)
Spring ’04
(Sept.)
Winter ’04
(Nov.) -488 +79 +81
-742 +439 +900
+42 -7 +145
-35 -2 +15
-15 -26 +4
-62 -8 +5
-47 +89 -36
+42 +48 +46
-98 -35 +5
+16 +35 +23
Sept./Nov. ‘04
32©2004 TNS - Confidential
General interest in travelling to Ontario destinations (within next two years)
26%
1%
31%
17%
25%
Very interested
(-1/-1)
Fairly interested
(±0)Not very
(+3)
Don't know(-1)
Not at all(-1)
To Toronto To Niagara Falls
28%
1%
29%
20%
22%
Very interested
(+1/-1)
Fairly interested
(+2)Not very(-2)
Don't know(±0)
Not at all(-1)
27%
1%
27%
14%
31%
Very interested
(-2/±0)
Fairly interested
(+1)
Not very(+4)
Don't know(-1)
Not at all(-2)
To Elsewhere In Ontario
( ) Change versus May ‘04/Feb. ‘04

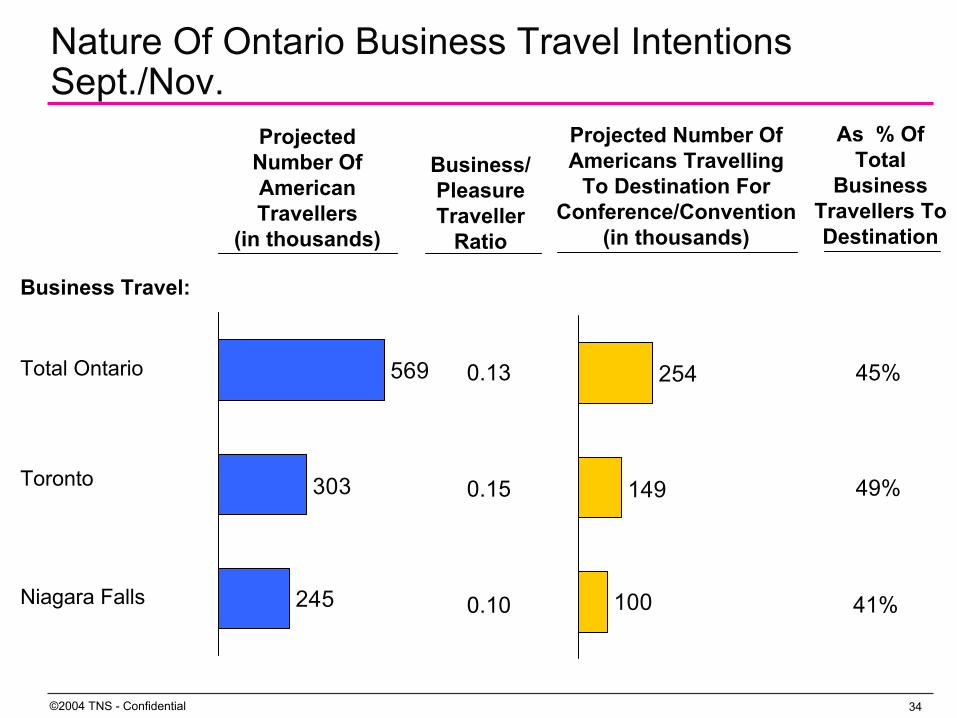
Intended Ontario Business Travel Among Americans
34©2004 TNS - Confidential
254
100
149
Nature Of Ontario Business Travel Intentions Sept./Nov.
569
245
303
Projected Number OfAmerican Travellers
(in thousands)
Business/Pleasure Traveller
Ratio
0.13
0.15
0.10
As % Of Total
Business Travellers To Destination
41%
45%
49%
Total Ontario
Toronto
Niagara Falls
Business Travel:
Projected Number OfAmericans Travelling
To Destination For Conference/Convention
(in thousands)

35©2004 TNS - Confidential
2,010
3,881
254
149
100
326
335
293
Within own State
To other US State
Any Ontario
Toronto
Niagara Falls
Other Canada
Mexico/Caribbean
Other overseas
The competitive for Business Conferences, Conventions & Trade Show
Number of Americans intending to travel to each destinationfor conference, convention or trade show in Sept./Nov. ‘04 (in thousands)

Volunteered Impediments To Travel(as of August ‘04)

37©2004 TNS - Confidential
Expressed reasons for not considering travel for any purpose in next 12 months
Percent of Americans who do not intend to travel
26%
13%
12%
11%
9%
5%
4%
29%
14%
7%
6%
3%
2%
21%
11%
10%
4%
4%†
10%
14%
-
8%
27%Financial reasons
No interest
Too busy
Ill health (self)
Do not travel
Family reason
Too old
Gas prices
As of Aug. '04As of May '04As of Feb. '04
† Less than 0.5%.
38©2004 TNS - Confidential
Reasons for lack of interest in visiting specific Canadian destinations
Percent of Americans who are “not very/not at all interested”in visiting each destination within the next 2 years
and have visited Ontario in the past
Niagara Falls
19%
34%
53%
1%
14%
16%
55%
2%
2%
–
Other DestinationsIn Ontario
21%
22%
10%
3%
17%
19%
20%
10%
4%
17%
Considering other destinations instead
General lack of interest
Have been there before
Prefer to travel in US
Don't know (much) about it
Toronto
31%
37%
12%
4%
6%
32%
23%
14%
6%
2%
As of Aug '04As of May '04
39©2004 TNS - Confidential
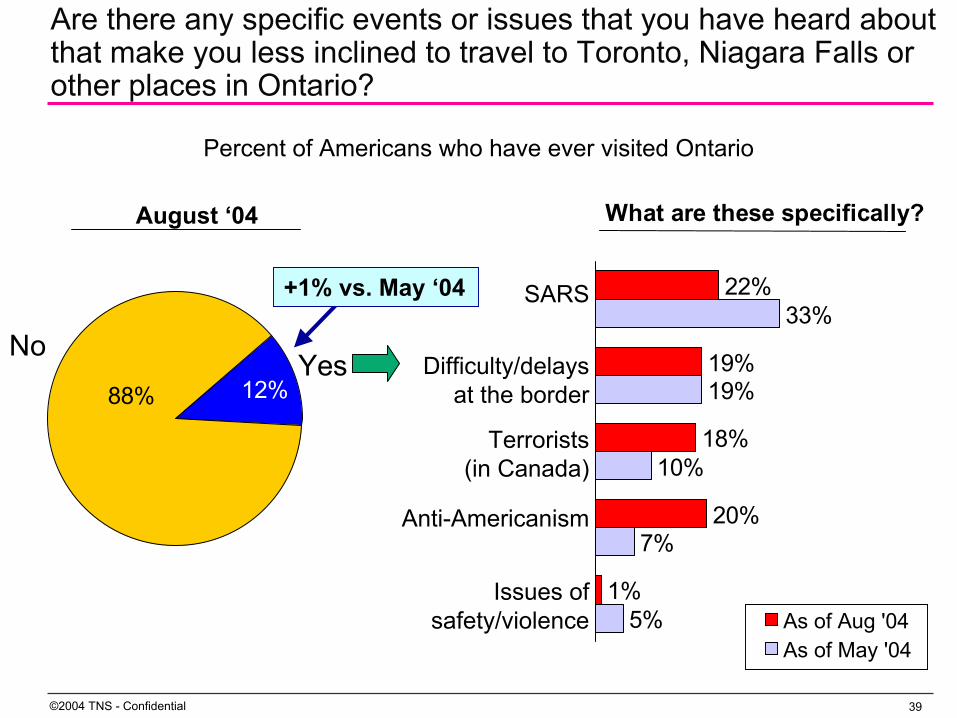
Are there any specific events or issues that you have heard about that make you less inclined to travel to Toronto, Niagara Falls or other places in Ontario?
Percent of Americans who have ever visited Ontario
88% 12%Yes
No
What are these specifically?
22%
19%
18%
20%
1%
33%
19%
10%
7%
5%
SARS
Difficulty/delays at the border
Terrorists(in Canada)
Anti-Americanism
Issues of safety/violence As of Aug '04
As of May '04
August ‘04
+1% vs. May ‘04

Prompted Awareness And Response To Specific Negative Events
41©2004 TNS - Confidential
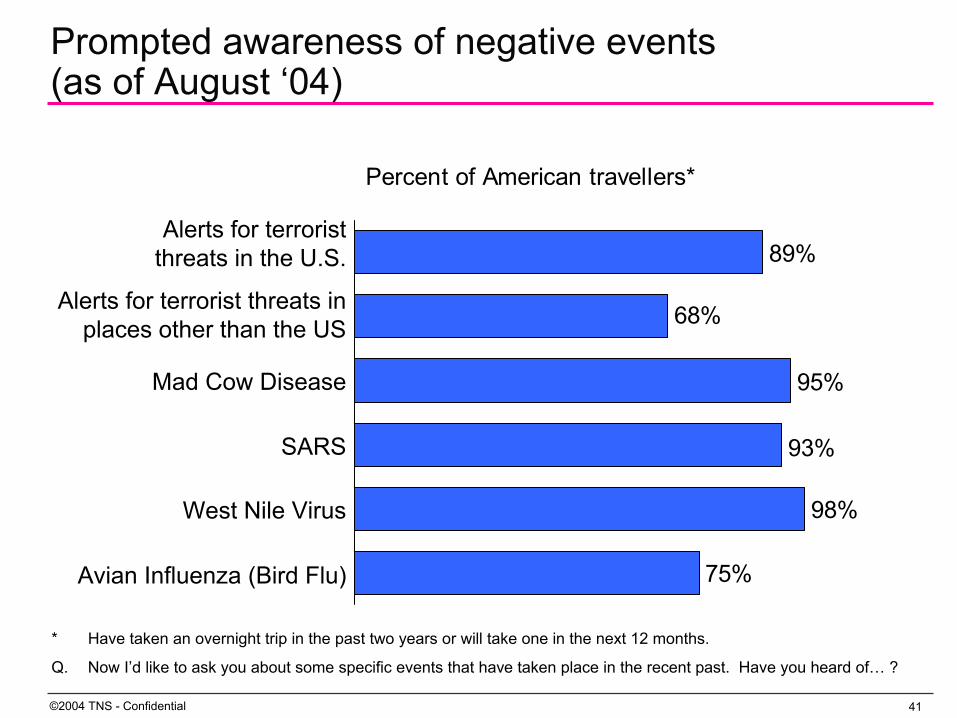
Prompted awareness of negative events(as of August ‘04)
Percent of American travellers*
89%
95%
98%
75%
93%
68%
Alerts for terrorist threats in the U.S.
Alerts for terrorist threats in places other than the US
Mad Cow Disease
SARS
West Nile Virus
Avian Influenza (Bird Flu)
* Have taken an overnight trip in the past two years or will take one in the next 12 months.
Q. Now I’d like to ask you about some specific events that have taken place in the recent past. Have you heard of… ?

42©2004 TNS - Confidential
Niagara Falls
3.7%
1.7%
2.0%
1.3%
2.8%
2.0%
2.1%
2.0%
1.9%
2.5%
3.5%
3.0%
Impact of negative events on intent to travel to specific destinations during coming season (as of Aug. ‘04)
Percentage of American travellers* who are less likely to visit each destination in Sept./Nov. because of …..
Elsewhere In Ontario
3.2%
1.5%
1.3%
1.1%
3.1%
2.1%
2.2%
1.7%
2.1%
2.5%
3.4%
3.6%
Toronto
3.8%
1.9%
1.9%
1.2%
3.2%
2.6%
2.1%
2.2%
2.9%
3.4%
5.8%
3.5%Alerts for terrorist
threats in the U.S.Alerts for terroristthreats in places
other than the US
Mad Cow Disease
SARS
West Nile Virus
Avian Influenza(Bird Flu)
As Of Aug '04As of May '04

Geographic Variation In Relationship Between Travel Intentions And Negative Events

44©2004 TNS - Confidential
238 18099 96
65184
193 224
405
644
188 163
241136
SyracuseBuffalox
Rochester
New Yorkx
Pittsburgh
Detroit
Cleveland
Boston
Columbus
Cincinnati
Wisconsin
Indianapolis
Chicago xPhiladelphia
x
xx
x
x
x
xx
x
xx
x
132252
135
389
214
508Minnesota
109
514
120
421
545
1,198
280505
Washington
Intend to travel to/within Ontario Sept./Nov.Less likely to travel to/within Ontario Sept./Nov. because of Negative Events.
Ontario travel intention volume— Sept./Nov. ‘04 (thousands)
42182
514 528

45©2004 TNS - Confidential
Market May ‘04
% Aug. ‘04
% Rochester 1.9 1.8 Buffalo 1.9 1.3 Columbus 1.4 1.2 Syracuse 1.6 1.0 Detroit 1.3 1.0 Cleveland 1.0 0.9 Chicago 0.4 0.6 Washington D.C. 0.5 0.6 New York City 0.6 0.5 Pittsburgh 0.8 0.5 Boston 0.4 0.4 Cincinnati 0.5 0.4 Minnesota 0.3 0.3 Philadelphia 0.6 0.3 Indianapolis 0.3 0.2 Wisconsin 0.3 0.2
Ratio Intend/Less Likely
-0.1-0.6
-0.2-0.6
-0.3-0.1
+0.2+0.1
-0.1-0.3
-0.1-0.1
±0.0
±0.0
-0.3
-0.1
Negative event impact on Ontario travel relative to intentions
Negative Event Impact (%)Worsening Improving

Destination Perceptions
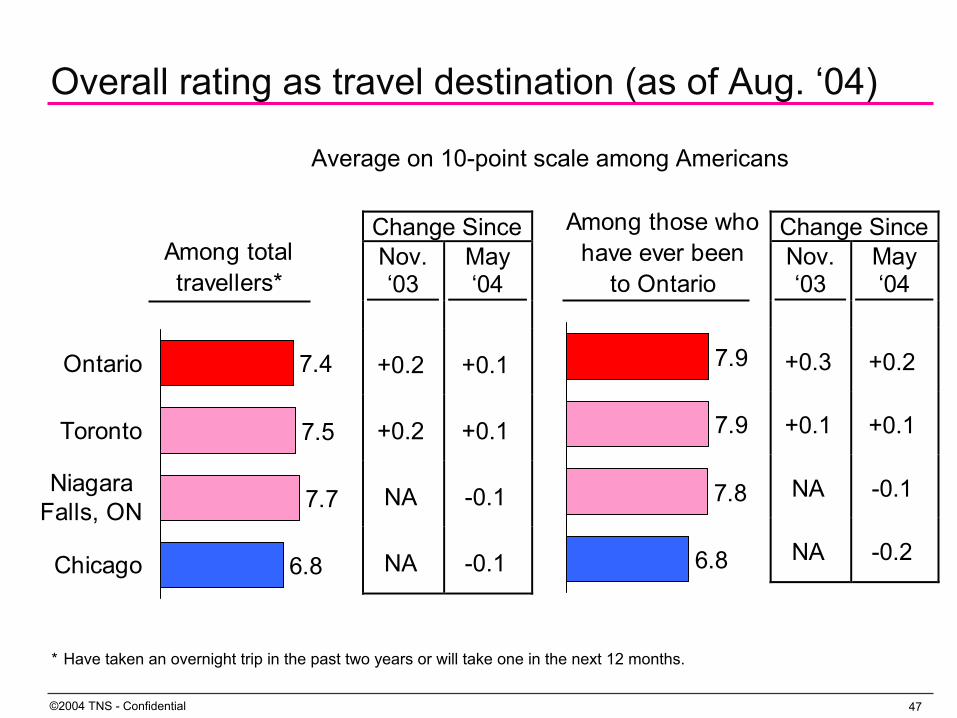
47©2004 TNS - Confidential
Among totaltravellers*
7.4
7.5
7.7
6.8
Ontario
Toronto
NiagaraFalls, ON
Chicago
Among those whohave ever been
to Ontario
7.9
7.9
7.8
6.8
Overall rating as travel destination (as of Aug. ‘04)
Average on 10-point scale among Americans
* Have taken an overnight trip in the past two years or will take one in the next 12 months.
Change SinceNov. ‘03
May ‘04
+0.2 +0.1
+0.2 +0.1
NA -0.1
NA -0.1
Change SinceNov. ‘03
May ‘04
+0.3 +0.2
+0.1 +0.1
NA -0.1
NA -0.2

48©2004 TNS - Confidential
Average on 10-point scale
6.0
6.5
7.0
7.5
8.0
Nov '03 Feb '04 May '04 Aug '04
#
Among Americans whohave ever visited Ontario
Among totalAmerican travellers*
* Have taken an overnight trip in the past two years or will take one in the next 12 months.
Trend in value for the money impressions of Ontario

Pleasure Destination Selection Criteria

50©2004 TNS - Confidential
8.7
8.6
8.5
8.3
8.1
7.1
6.6
Safe from terrorists and criminal activity
Offers good value for money
Friendly destination
Lots to see and do
Offers good health services for visitors
Offers destinations you can drive to
Don't have to worry about your health
Americans
Importance of various factors in selectinga pleasure travel destinationAverage score on 10-point scale among past 2 year/next 12-month American travellers
“Very Important
10/10”
64%
50%
45%
48%
49%
25%
27%

Ratings For Specific Characteristics
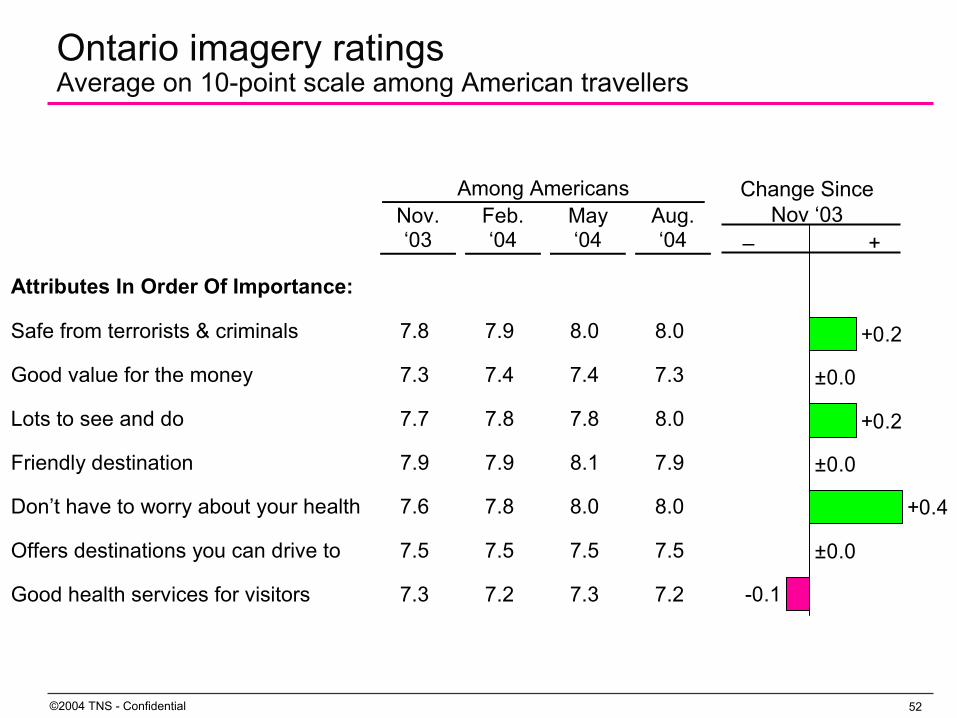
52©2004 TNS - Confidential
Ontario imagery ratingsAverage on 10-point scale among American travellers
+0.2
+0.4
±0.0
+0.2
-0.1
±0.0
±0.0
Change SinceNov ‘03
– +
Among Americans Nov.
‘03 Feb. ‘04
May ‘04
Aug. ‘04
Attributes In Order Of Importance:
Safe from terrorists & criminals 7.8 7.9 8.0 8.0
Good value for the money 7.3 7.4 7.4 7.3
Lots to see and do 7.7 7.8 7.8 8.0
Friendly destination 7.9 7.9 8.1 7.9
Don’t have to worry about your health 7.6 7.8 8.0 8.0
Offers destinations you can drive to 7.5 7.5 7.5 7.5
Good health services for visitors 7.3 7.2 7.3 7.2

53©2004 TNS - Confidential
Volunteered health issues associated with OntarioPercent of those who rate Ontario 7 or lower as a destinationwhere you don’t have to worry about your health
Any mention of SARS
The healthcare system(lack of doctors, long waits,
health insurance, etc.)
Mosquitoes/Black Flies/West Nile Virus
Pollution
8%
1%
9%
2%
Among AmericansChange Vs.
Nov. ‘03
-10%
+2%
-1%
±0%
Change Vs. May ‘04
-10%
+2%
-1%
±0%

54©2004 TNS - Confidential
Ontario ratings for trip typesAverage on 10-point scale among American travellers
Among Americans Nov.
‘03 Feb. ‘04
May ‘04
Aug. ‘04
Nature & outdoors 7.4 7.6 7.6 7.6
Touring trip 6.9 7.1 7.0 7.1
Big city trip 6.6 6.7 6.7 6.7
Arts, culture & history 6.6 6.8 6.8 6.8
Resort trip 6.4 6.7 6.4 6.5
+0.2
+0.2
+0.1
+0.2
+0.1
+
Change SinceNov ‘03
–

55©2004 TNS - Confidential
Toronto ratings for trip typesAverage on 10-point scale among American travellers
Among Americans Nov.
‘03 Feb. ‘04
May ‘04
Aug. ‘04
Shopping, restaurants, nightlife 7.5 7.6 7.5 7.5
Arts, culture & history 7.3 7.4 7.3 7.4
Strolling around to see buildings/sights 7.1 7.2 7.3 7.2
Family vacation 7.0 7.1 7.1 7.0
Overall rating 7.3 7.5 7.4 7.4
“Must See” destination 6.8 6.9 6.8 6.8
+0.1
±0.0
+0.1
±0.0
±0.0
+0.1
+
Change SinceNov ‘03
–

Key Findings — Canada
57©2004 TNS - Confidential
Key Findings — Canada
Key measures of Canadian travel behaviour indicate a pattern of overt caution with respect to travel planning, and a degree of uncertainty in terms of future travel intentions for the longer term.
A slight drop in next-12-month travel intentions is compounded by an increased tendency to take shorter trips that are closer to home.
In addition, a higher proportion of Canadians are planning trips closer to the departure date, and most book both shorter and longer trips within one month of travel.

58©2004 TNS - Confidential
Key Findings — Canada (Cont’d)
Looking toward the coming months, Canadian travel intentions are lower for most destinations than was reported during all previous waves.
This is not the case, however, with respect to travel intentionsto Ontario.
Intentions for the fall are quite robust and seem to have firmed up with the approach of the season itself.
59©2004 TNS - Confidential
Key Findings — Canada (Cont’d)
Of course, this trend is largely fueled by Ontario residents.
In a sense, we are observing the same geographic constraints to travel evident in the US, but from a different perspective.
Currency exchange rate moderation does not seem to have left Canadians more open to US travel (in relation to domestic).
Canadians are likely affected by the complex of security/safety/inconvenience concerns when considering longer-haul international trips, though possibly to a lesser degree than Americans.

60©2004 TNS - Confidential
Key Findings — Canada (Cont’d)
With respect to specific destinations in Ontario, Niagara Falls is challenged to show previous visitors something new: To provide a strong rationale for repeat visitation.
Still, Niagara travel intentions have declined more gradually as we move into the fall shoulder season than is the case for Toronto.
Other Ontario destinations, including Toronto, are hampered by a lack of initial interest, perhaps indicating that the destination simply isn’t enticing enough when compared to alternatives (such as Ottawa or destinations outside of the province).

61©2004 TNS - Confidential
Key Findings — Canada (Cont’d)
Concerns over specific, monitored events appear to be waning.
The reported impact of SARS, in particular, is decreasing in relation to previous waves.
Nonetheless, cautiousness is still exhibited.
Like their American counterparts, Canadians are unwilling to project their travel intentions into the winter season.

62©2004 TNS - Confidential
Key Findings — Canada (Cont’d)
Overall ratings for Ontario as a pleasure travel destination arefavourable and consistent wave over wave.
Ratings for specific characteristics are strong, and have improved slightly since November, ’03.
To some extent, Ontario’s generally positive image can be credited with supporting interest in Ontario travel.
Perceptions of specific types of travel in Ontario, however, do not keep pace with attribute ratings. As in the US, this may indicate that while impressions of Ontario are generally favourable, this is not directly translated into Ontario’s image as a travel destination, from the point of either distinctiveness or ‘excitement’.

Propensity To Travel &Trip Planning

64©2004 TNS - Confidential
Trend in general travel intentions and propensity to travel
Percent of Canadians
0
1020
30
40
5060
70
80
Nov '03 Feb '04 May '04 Aug '04
%
Plan to travel innext 12 months
Take fewerovernight trips
Stopped travellingaltogether/do nottravel (overnight trips)
Q. Are you considering taking an out-of-town trip of one or more nights away from home in the next 12 months?
Q. How, if at all, have your travel plans changed over the past two years? Are you inclined to… ?

65©2004 TNS - Confidential
Percent of Canadian travellers*
20
30
40
50
60
Nov '03 Feb '04 May '04 Aug '04
%
Take overnight tripscloser to home
Take shorterovernight trips
* Have taken an overnight trip in the past two years or will take one in the next 12 months.
Q. How, if at all, have your travel plans changed over the past two years? Are you inclined to… ?
Trend in duration and distance of overnight trips

66©2004 TNS - Confidential
Percent of Canadian travellers*
20
30
40
50
60
Nov '03 Feb '04 May '04 Aug '04
%
Check travel advisoriesand news about destinations more often
Make travel plans closer to departure date
* Have taken an overnight trip in the past two years or will take one in the next 12 months.
Q. How, if at all, have your travel plans changed over the past two years? Are you inclined to… ?
Trend in overnight trip planning

Travel Intention Details

68©2004 TNS - Confidential
Intended travel patterns of Canadian residentsNumber of adults claiming will take overnight trip (thousands)— not seasonally adjusted
3,249
1,402
883
2,148
1,837
2,512
1,623
1,246
3,684
1,601
965
2,420
1,963
2,473
1,295
1,155
4,702
1,640
1,579
3,456
2,926
2,904
980
1,354
Next Season(Mar/May)
Within Ontario
Toronto
Niagara Falls
Elsewhere in Ontario
Other Canada
United States
Mexico/Caribbean
Other country
Next Season(Dec/Feb)
Next Season(June/Aug)
Nov. Wave
3,630
1,343
1,094
2,505
1,712
2,041
900
1,103
Next Season(Sept/Nov)
Feb. Wave May Wave Aug. Wave
69©2004 TNS - Confidential
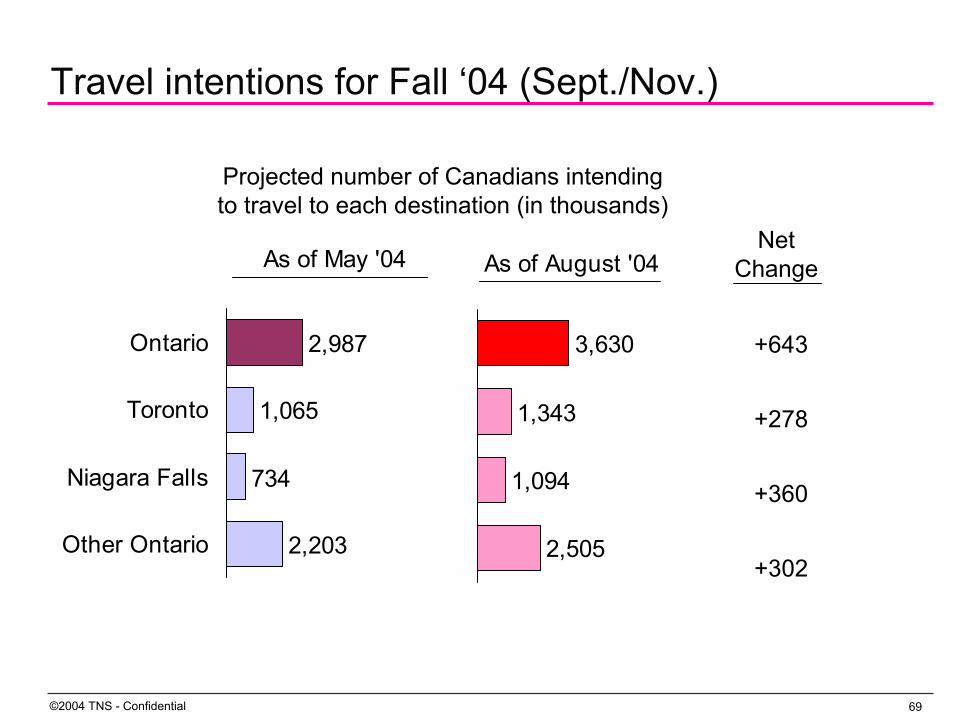
As of May '04
2,987
1,065
734
2,203
Ontario
Toronto
Niagara Falls
Other Ontario
As of August '04
3,630
1,343
1,094
2,505
Net Change
+643
+278
+360
+302
Projected number of Canadians intendingto travel to each destination (in thousands)
Travel intentions for Fall ‘04 (Sept./Nov.)
70©2004 TNS - Confidential
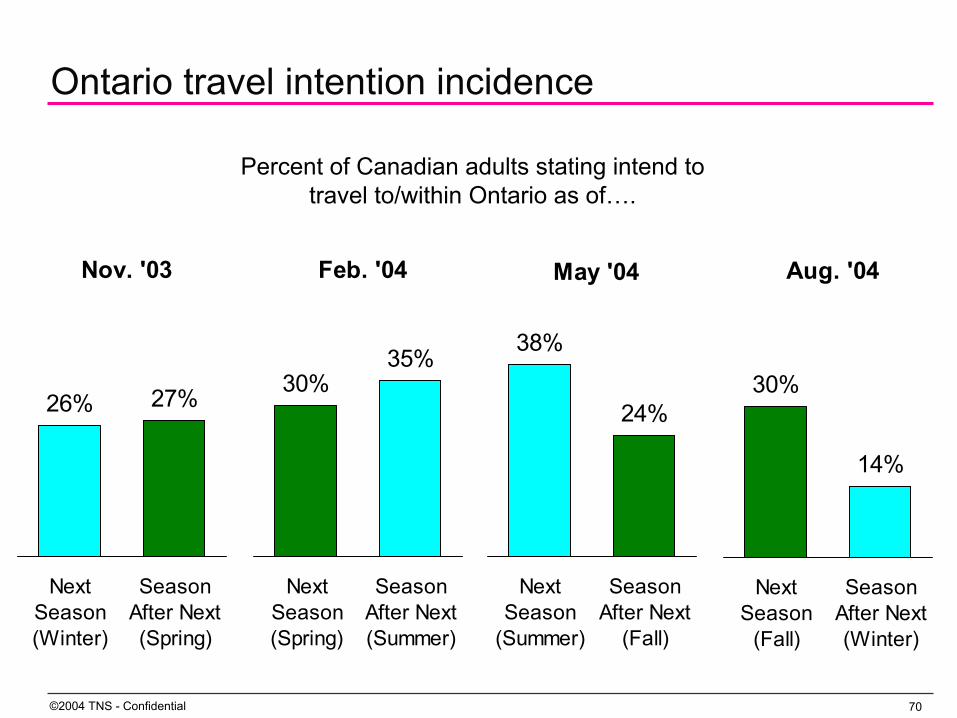
Ontario travel intention incidence
26% 27%
NextSeason(Winter)
SeasonAfter Next(Spring)
Nov. '03
Percent of Canadian adults stating intend to travel to/within Ontario as of….
30%35%
NextSeason(Spring)
SeasonAfter Next(Summer)
Feb. '04
38%
24%
NextSeason
(Summer)
SeasonAfter Next
(Fall)
May '04
30%
14%
NextSeason
(Fall)
SeasonAfter Next(Winter)
Aug. '04

71©2004 TNS - Confidential
Percent Of Adults In Each Case Stating… Intend To Travel To/Within Ontario
As Of Feb. ‘04 As Of May ‘04 As Of Aug. ‘04
During Mar/May
During June/Aug
During June/Aug
During Sept/Nov
During Sept/Nov
During Dec/Feb
Quebec City % 9 14 12 5 14 4
Montreal % 18 22 22 16 13 6
Ottawa % 44 48 46 35 43 20
Toronto % 28 37 43 26 29 15
Other Ontario % 40 43 46 29 40 20
Winnipeg % 17 29 29 19 20 8
TOTAL CANADA % 30 35 38 24 30 14
Ontario travel intention incidenceby Canadian market

72©2004 TNS - Confidential
To Other Destinations In Ontario
4322,058
776
Any business onlyAny pleasure/VFR*
Other reason**
To Toronto
3061,054
169
Any business onlyAny pleasure/VFR*
Other reason**
Main purpose of trips planned to Ontario —Sept./Nov. ‘04
Projected number of Canadians intendingto travel to each destination as of August ‘04 (thousands)
To Niagara Falls, Ontario
76914
137
Any business onlyAny pleasure/VFR*
Other reason**
* Excluding cottage/country home. ** Including cottage/country home.

Intended Ontario Pleasure Travel Among Canadians
74©2004 TNS - Confidential
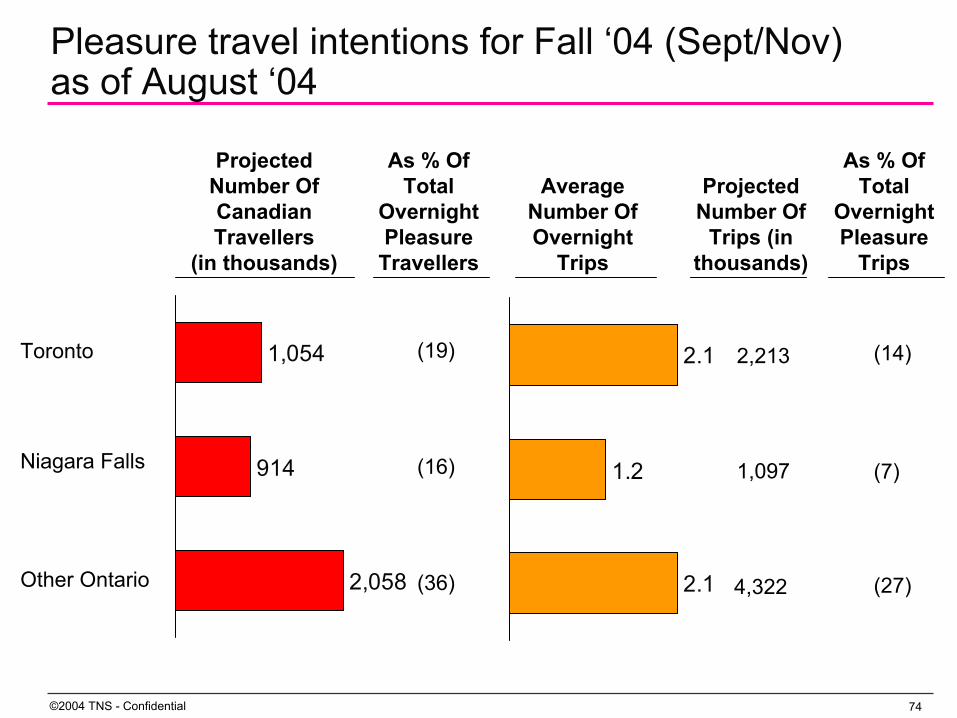
Pleasure travel intentions for Fall ‘04 (Sept/Nov)as of August ‘04
Toronto
Niagara Falls
Other Ontario
1,054
2,058
914
Projected Number OfCanadian Travellers
(in thousands)
2.1
2.1
1.2
Average Number OfOvernight
Trips
As % Of Total
Overnight Pleasure
Travellers
(19)
(16)
(36)
As % Of Total
Overnight Pleasure
Trips
(14)
(7)
(27)4,322
Projected Number Of
Trips (in thousands)
2,213
1,097

75©2004 TNS - Confidential
Pleasure travel booking for Fall ‘04 (Sept/Nov)as of August ‘04
6%
18%
6%
Toronto
Niagara Region
Other Ontario
Percentage of Canadians intending to travel to each destination who have already booked any aspect of trip
76©2004 TNS - Confidential
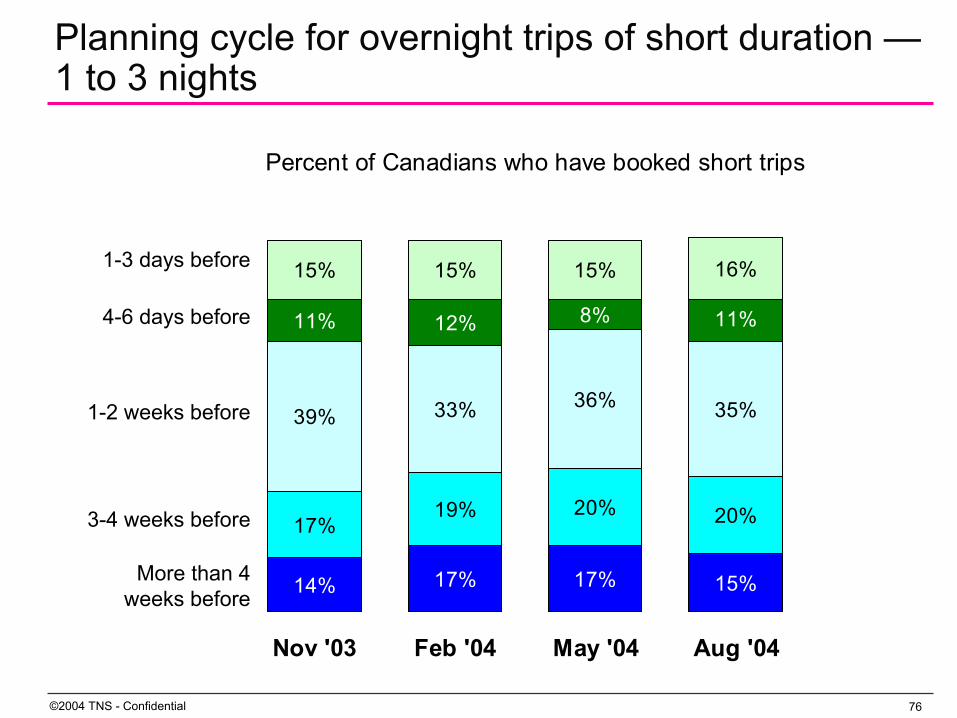
Planning cycle for overnight trips of short duration —1 to 3 nights
1-3 days before
4-6 days before
1-2 weeks before
3-4 weeks before
More than 4 weeks before
Percent of Canadians who have booked short trips
14% 17% 17% 15%
17%19% 20% 20%
39% 33% 36% 35%
11% 12% 8%
15% 15% 15% 16%
11%
Nov '03 Feb '04 May '04 Aug '04
77©2004 TNS - Confidential
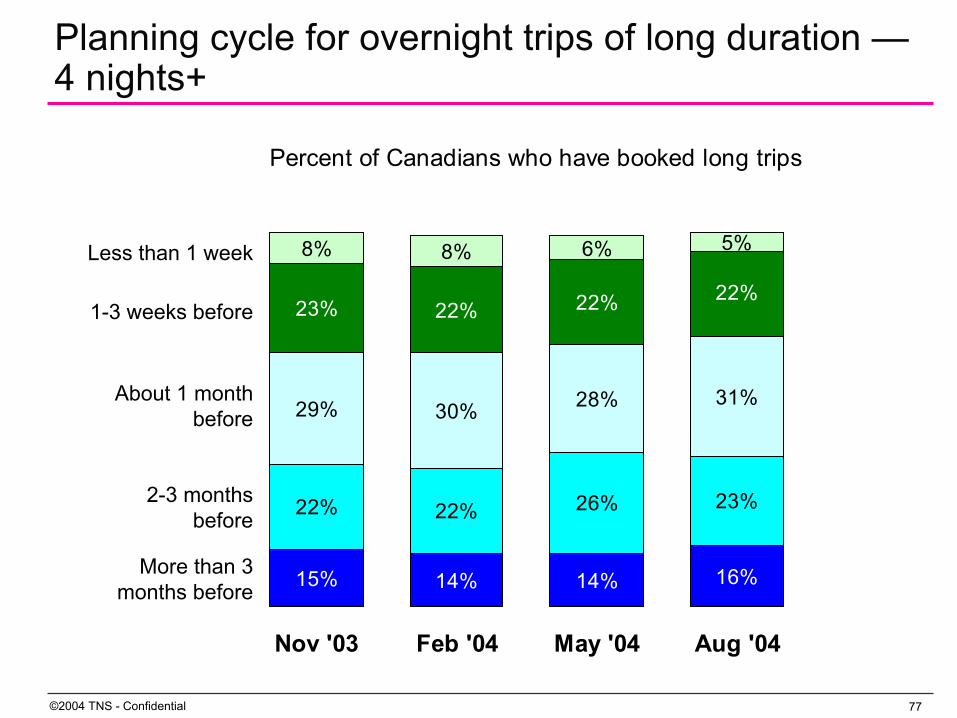
Planning cycle for overnight trips of long duration —4 nights+
Less than 1 week
1-3 weeks before
About 1 monthbefore
2-3 monthsbefore
More than 3 months before
Percent of Canadians who have booked long trips
15% 14% 14% 16%
22% 22% 26% 23%
29% 30% 28% 31%
23% 22% 22%
8% 8% 6% 5%
22%
Nov '03 Feb '04 May '04 Aug '04
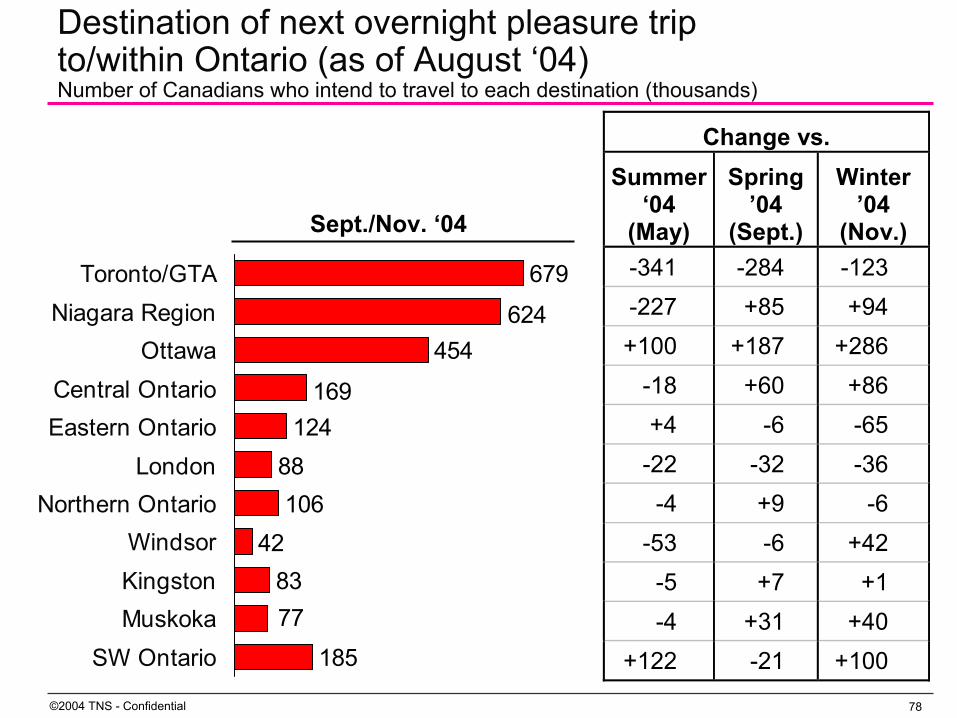
78©2004 TNS - Confidential
679
454
12488106
4283
185
77
169
624
Toronto/GTANiagara Region
OttawaCentral OntarioEastern Ontario
LondonNorthern Ontario
WindsorKingstonMuskoka
SW Ontario
Destination of next overnight pleasure tripto/within Ontario (as of August ‘04)Number of Canadians who intend to travel to each destination (thousands)
Change vs. Summer
‘04 (May)
Spring ’04
(Sept.)
Winter ’04
(Nov.) -341 -284 -123 -227 +85 +94 +100 +187 +286
-18 +60 +86 +4 -6 -65
-22 -32 -36 -4 +9 -6
-53 -6 +42 -5 +7 +1 -4 +31 +40
+122 -21 +100
Sept./Nov. ‘04
79©2004 TNS - Confidential
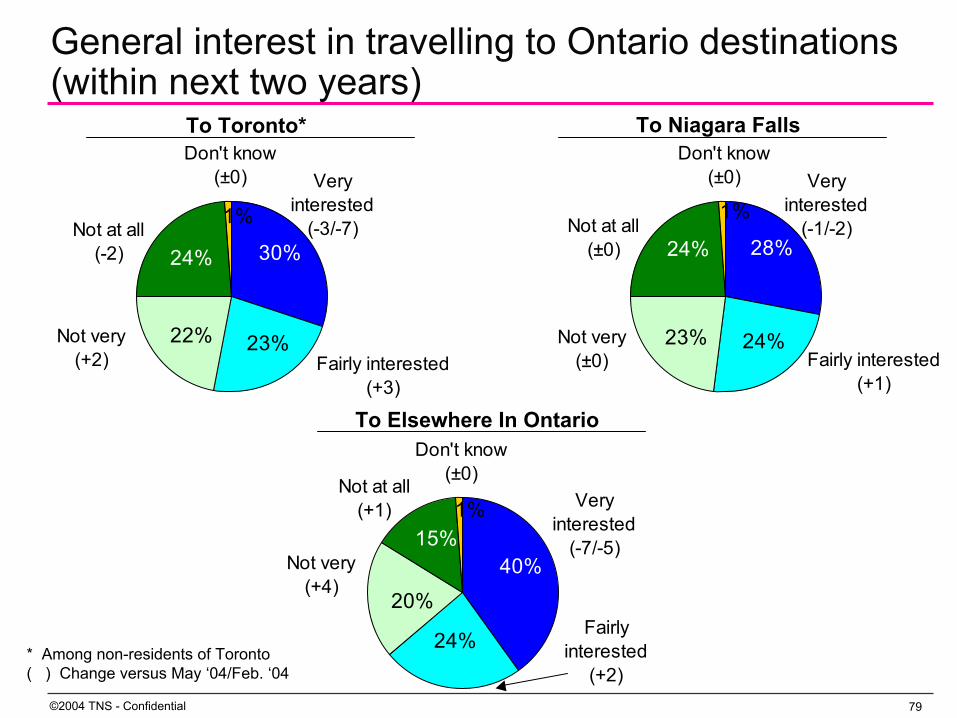
General interest in travelling to Ontario destinations (within next two years)
24%
1%
23%
30%
22%
Very interested
(-3/-7)
Fairly interested(+3)
Not very(+2)
Don't know(±0)
Not at all(-2)
To Toronto* To Niagara Falls
24%
1%
24%
28%
23%
Very interested
(-1/-2)
Fairly interested(+1)
Not very(±0)
Don't know(±0)
Not at all(±0)
15%1%
24%
40%
20%
Very interested
(-7/-5)
Fairly interested
(+2)
Not very(+4)
Don't know(±0)
Not at all(+1)
To Elsewhere In Ontario
* Among non-residents of Toronto( ) Change versus May ‘04/Feb. ‘04
Intended Ontario Business Travel Among Canadians
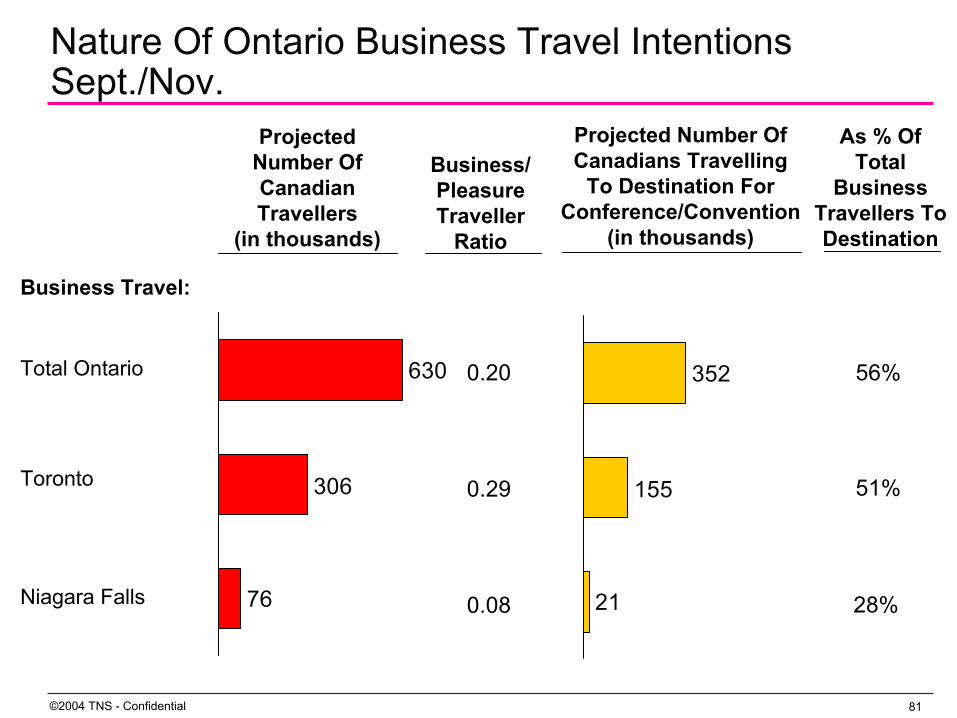
81©2004 TNS - Confidential
352
21
155
Nature Of Ontario Business Travel Intentions Sept./Nov.
630
76
306
Projected Number OfCanadian Travellers
(in thousands)
Business/Pleasure Traveller
Ratio
0.20
0.29
0.08
As % Of Total
Business Travellers To Destination
28%
56%
51%
Total Ontario
Toronto
Niagara Falls
Business Travel:
Projected Number OfCanadians Travelling
To Destination For Conference/Convention
(in thousands)

82©2004 TNS - Confidential
38
137
191
352
155
21
32
51
Within own province
Other Canadian provinces or territories
To the US
Any Ontario
Toronto
Niagara Falls
Mexico/Caribbean
Other overseas
The competitive for Business Conferences, Conventions & Trade Show
Number of Canadians intending to travel to each destinationfor conference, convention or trade show in Sept./Nov. ‘04 (in thousands)
Volunteered Impediments To Travel(as of August ‘04)
84©2004 TNS - Confidential
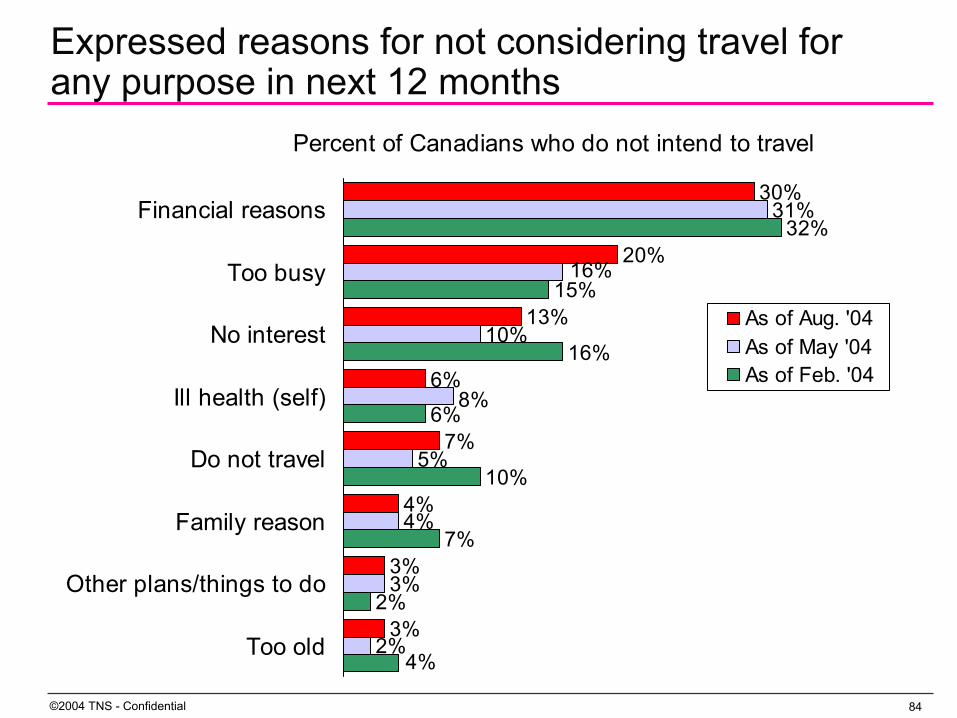
Expressed reasons for not considering travel for any purpose in next 12 months
Percent of Canadians who do not intend to travel
30%
20%
13%
6%
7%
4%
3%
31%
10%
5%
4%
3%
2%
15%
16%
10%
7%
2%3%
8%
16%
4%
6%
32%Financial reasons
Too busy
No interest
Ill health (self)
Do not travel
Family reason
Other plans/things to do
Too old
As of Aug. '04As of May '04As of Feb. '04
85©2004 TNS - Confidential
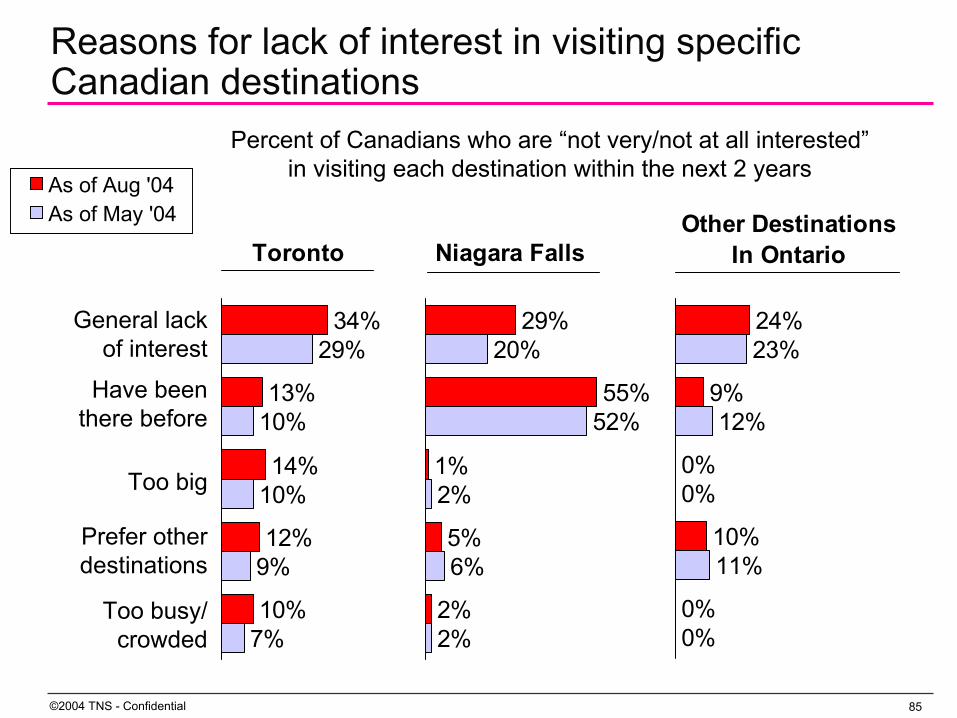
Reasons for lack of interest in visiting specific Canadian destinations
Percent of Canadians who are “not very/not at all interested”in visiting each destination within the next 2 years
Niagara Falls
29%
55%
1%
5%
2%
20%
52%
2%
6%
2%
Other DestinationsIn Ontario
24%
9%
0%
10%
0%
23%
12%
0%
11%
0%
Toronto
34%
13%
14%
12%
10%
29%
10%
10%
9%
7%
General lack of interest
Have been there before
Too big
Prefer other destinations
Too busy/ crowded
As of Aug '04As of May '04
86©2004 TNS - Confidential
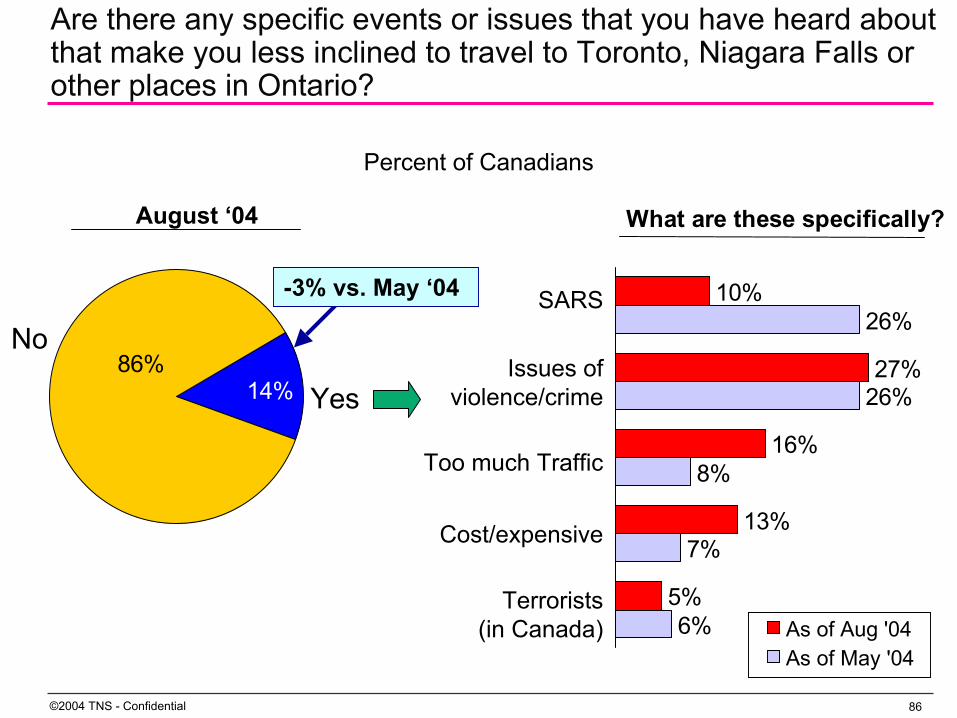
Are there any specific events or issues that you have heard about that make you less inclined to travel to Toronto, Niagara Falls or other places in Ontario?
Percent of Canadians
86%14% Yes
No
What are these specifically?
10%
27%
16%
13%
5%
26%
26%
8%
7%
6%
SARS
Terrorists(in Canada)
Cost/expensive
Issues of violence/crime
Too much Traffic
As of Aug '04As of May '04
August ‘04
-3% vs. May ‘04

Prompted Awareness And Response To Specific Negative Events

88©2004 TNS - Confidential
Prompted awareness of negative events(as of August ‘04)
Percent of Canadian travellers*
88%
96%
98%
88%
98%
62%
Alerts for terrorist threats in the U.S.
Alerts for terrorist threats in places other than the US
Mad Cow Disease
SARS
West Nile Virus
Avian Influenza (Bird Flu)
* Have taken an overnight trip in the past two years or will take one in the next 12 months.
Q. Now I’d like to ask you about some specific events that have taken place in the recent past. Have you heard of… ?

89©2004 TNS - Confidential
Impact of negative events on intent to travel to specific destinations during coming season (as of August ‘04)
* Have taken an overnight trip in the past two years or will take one in the next 12 months.** Excluding Toronto residents
Percent of Canadian travellers* who are less likely to visit each destination in Sept./Nov.
Niagara Falls
1.8%
1.4%
2.1%
1.3%
1.2%
1.3%
1.7%
1.1%
1.7%
0.6%
3.3%
2.0%
Elsewhere In Ontario
1.0%
1.0%
2.0%
1.0%
1.1%
1.9%
2.7%
2.0%
2.4%
0.4%
4.1%
2.6%Alerts for terrorist
threats in the U.S.Alerts for terroristthreats in places
other than the US
Mad Cow Disease
SARS
West Nile Virus
Avian Influenza(Bird Flu)
Toronto
0.9%
0.8%
0.9%
0.8%
1.6%
1.6%
2.4%
1.1%
2.8%
0.9%
7.2%
3.1%
As of Aug '04As of May '04

Geographic Variation In Relationship Between Travel Intentions And Negative Events

91©2004 TNS - Confidential
975
452
342257
21147
Quebec City
Montreal
Ottawax
Toronto
Winnipeg
x
xx
97 6076 45
Intend to travel to/within Ontario Sept./Nov.Less likely to travel to/within Ontario Sept./Nov. because of Negative Events.
Ontario travel intention volume— Sept./Nov. ‘04 (Thousands)
x

92©2004 TNS - Confidential
Negative event impact on Ontario travel relative to intentions
+0.7
+0.3
+0.7
-0.8
-1.1
Market May ‘04
% Aug. ‘04
%
Ottawa 3.8 4.5
Toronto 1.9 2.2
Quebec City 1.0 1.7
Winnipeg 2.4 1.6
Montreal 2.4 1.3
Ratio Intend/Less LikelyNegative Event Impact (%)Worsening Improving

Destination Perceptions

94©2004 TNS - Confidential
Among totalAmerican travellers*
7.4
7.5
7.7
6.8
Ontario
Toronto
NiagaraFalls, ON
Chicago
Among totalCanadian travellers*
7.8
7.5
7.8
6.0
Overall rating as travel destination (as of Aug. ‘04)
Average on 10-point scale
Change SinceNov. ‘03
May ‘04
+0.2 +0.1
+0.2 +0.1
NA -0.1
NA -0.1
Change SinceNov. ‘03
May ‘04
+0.2 ±0.0
±0.0 +0.3
NA +0.1
NA ±0.0
* Have taken an overnight trip in the past two years or will take one in the next 12 months.** Excluding Toronto residents
95©2004 TNS - Confidential
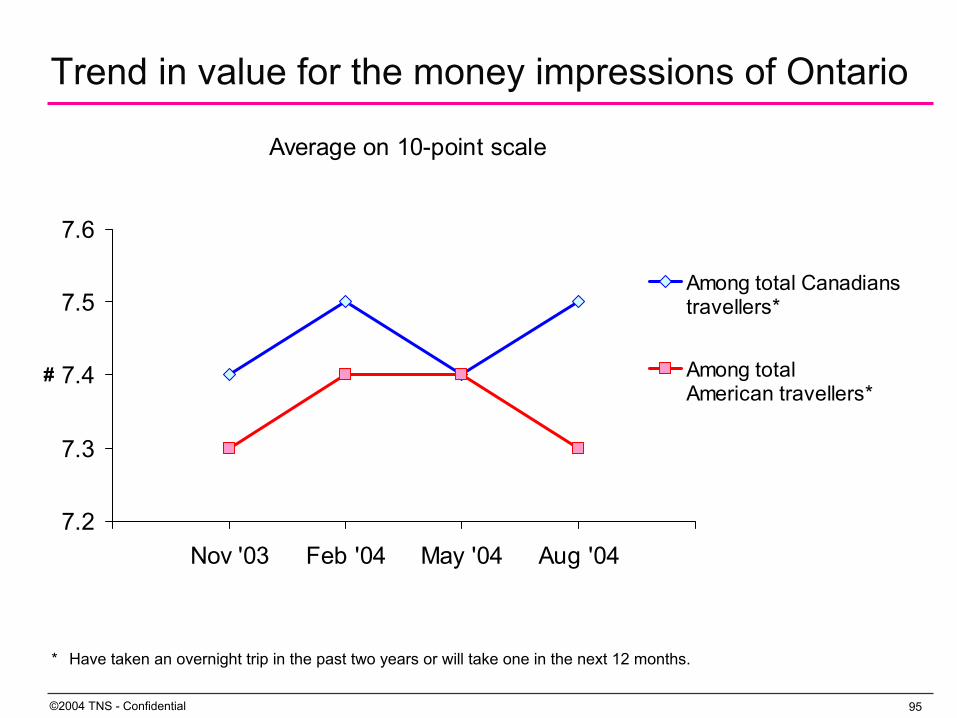
Average on 10-point scale
7.2
7.3
7.4
7.5
7.6
Nov '03 Feb '04 May '04 Aug '04
#
Among total Canadianstravellers*
Among totalAmerican travellers*
* Have taken an overnight trip in the past two years or will take one in the next 12 months.
Trend in value for the money impressions of Ontario

Pleasure Destination Selection Criteria

97©2004 TNS - Confidential
8.6
8.4
8.4
8.3
8.2
7.4
6.8
Offers good value for money
Safe from terrorists and criminal activity
Friendly destination
Lots to see and do
Offers good health services for visitorsOffers destinations
you can drive to
Don't have to worry about your health
Canadians
Importance of various factors in selectinga pleasure travel destinationAverage score on 10-point scale among past 2 year/next 12-month Canadian travellers
“Very Important
10/10”
45%
58%
42%
40%
47%
31%
23%

Ratings For Specific Characteristics

99©2004 TNS - Confidential
Ontario imagery ratingsAverage on 10-point scale among Canadian travellers
+0.1
+0.1
+0.2
+0.1
+0.3
+0.2
+0.1
Change SinceNov ‘03
– +
Among Canadians Nov.
‘03 Feb. ‘04
May ‘04
Aug. ‘04
Attributes In Order Of Importance:
Good value for the money 7.4 7.5 7.4 7.5
Safe from terrorists & criminals 8.4 8.5 8.4 8.5
Friendly destination 8.0 8.2 7.9 8.2
Lots to see and do 8.1 8.3 8.2 8.2
Don’t have to worry about your health 8.3 8.5 8.4 8.6
Offers destinations you can drive to 8.5 8.6 8.5 8.7
Good health services for visitors 8.1 8.0 8.1 8.2
100©2004 TNS - Confidential
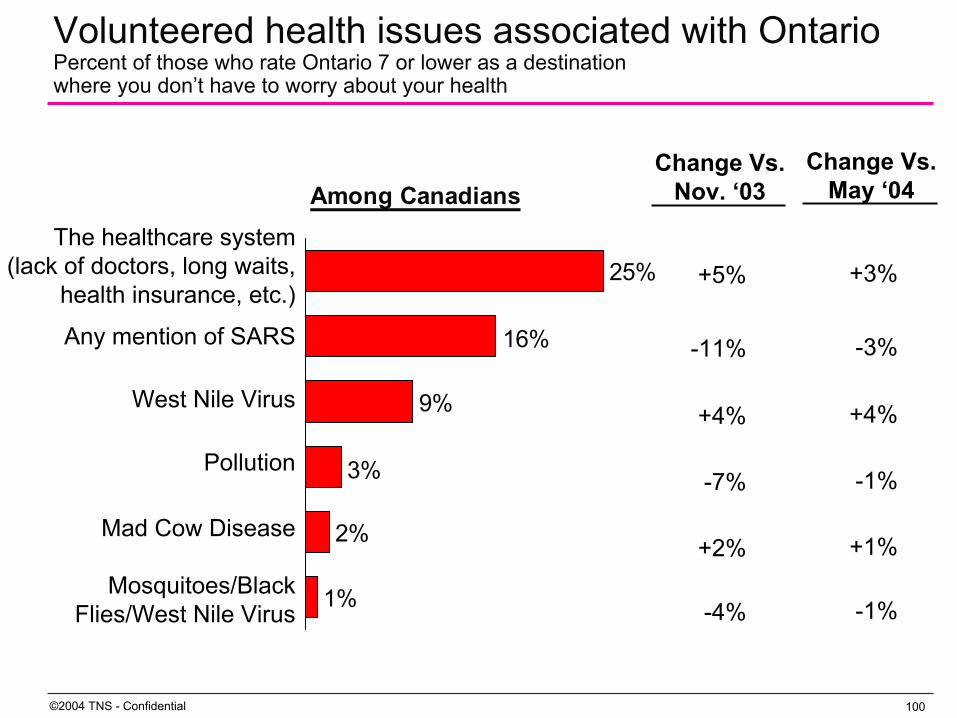
Volunteered health issues associated with OntarioPercent of those who rate Ontario 7 or lower as a destinationwhere you don’t have to worry about your health
Change Vs. Nov. ‘03
+5%
-11%
+4%
-7%
+2%
-4%
25%
9%
2%
1%
3%
16%
Among Canadians
Any mention of SARS
The healthcare system(lack of doctors, long waits,
health insurance, etc.)
Mosquitoes/Black Flies/West Nile Virus
Pollution
Mad Cow Disease
West Nile Virus
Change Vs. May ‘04
+3%
-3%
+4%
-1%
+1%
-1%

101©2004 TNS - Confidential
Ontario ratings for trip typesAverage on 10-point scale among Canadians travellers
Among Canadians Nov.
‘03 Feb. ‘04
May ‘04
Aug. ‘04
Nature & outdoors 8.0 8.1 8.0 8.2
Touring trip 7.3 7.4 7.3 7.4
Big city trip 7.2 7.4 7.2 7.4
Arts, culture & history 7.2 7.3 7.2 7.4
Resort trip 6.7 6.9 6.6 6.7
+0.2
+0.1
+0.2
+0.2
±0.0
+
Change SinceNov ‘03
–
102©2004 TNS - Confidential
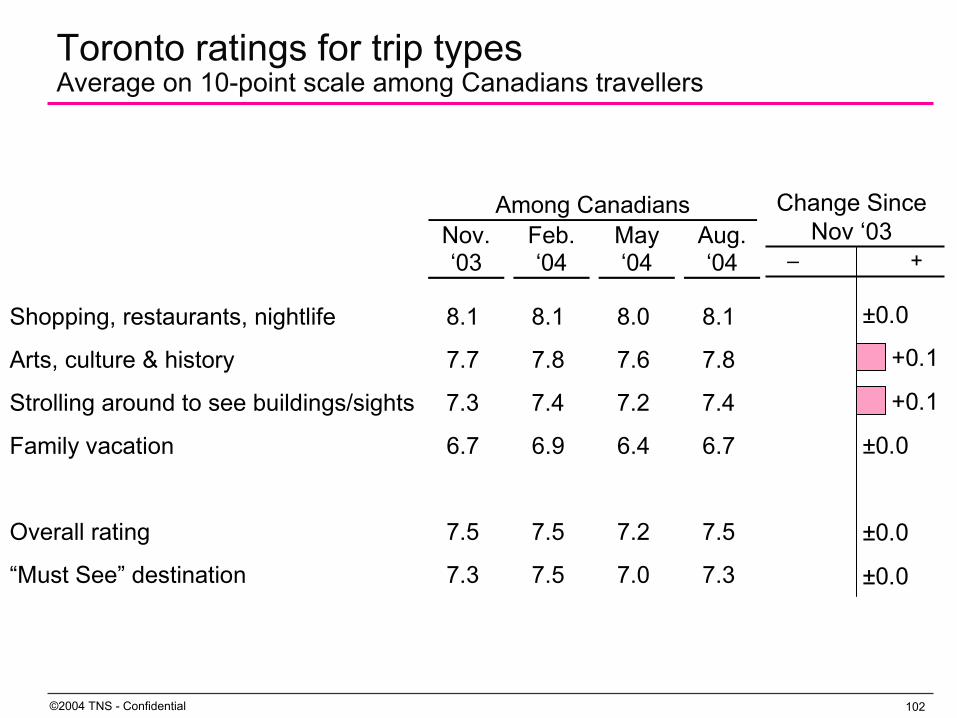
Toronto ratings for trip typesAverage on 10-point scale among Canadians travellers
Among Canadians Nov.
‘03 Feb. ‘04
May ‘04
Aug. ‘04
Shopping, restaurants, nightlife 8.1 8.1 8.0 8.1
Arts, culture & history 7.7 7.8 7.6 7.8
Strolling around to see buildings/sights 7.3 7.4 7.2 7.4
Family vacation 6.7 6.9 6.4 6.7
Overall rating 7.5 7.5 7.2 7.5
“Must See” destination 7.3 7.5 7.0 7.3
+0.1
+0.1
±0.0
±0.0
±0.0
±0.0
+
Change SinceNov ‘03
–

Comparison With The Ideal
104©2004 TNS - Confidential
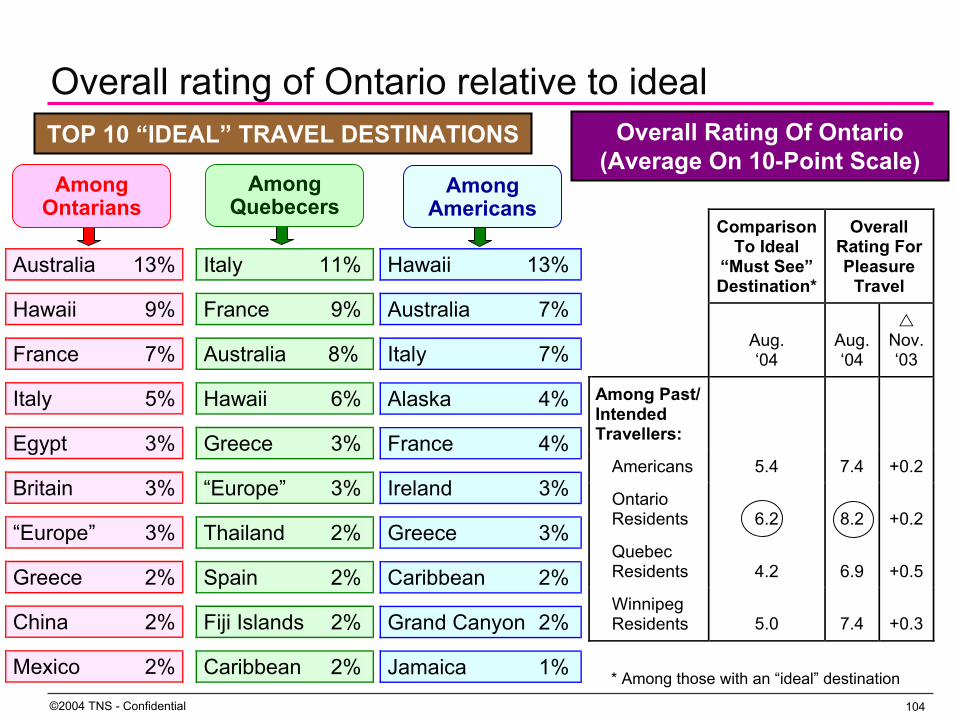
Overall rating of Ontario relative to ideal
Australia 13%
Hawaii 9%
France 7%
Italy 5%
Egypt 3%
Britain 3%
“Europe” 3%
Greece 2%
China 2%
Mexico 2%
Among Ontarians
TOP 10 “IDEAL” TRAVEL DESTINATIONS Overall Rating Of Ontario(Average On 10-Point Scale)
Among Quebecers
Italy 11%
France 9%
Australia 8%
Hawaii 6%
Greece 3%
“Europe” 3%
Thailand 2%
Spain 2%
Fiji Islands 2%
Caribbean 2%
Among Americans
Hawaii 13%
Australia 7%
Italy 7%
Alaska 4%
France 4%
Ireland 3%
Greece 3%
Caribbean 2%
Grand Canyon 2%
Jamaica 1%
Comparison To Ideal
“Must See” Destination*
Overall Rating For Pleasure
Travel
Aug. ‘04
Aug. ‘04
Nov. ‘03
Among Past/ Intended Travellers:
Americans 5.4 7.4 +0.2
Ontario Residents 6.2 8.2 +0.2
Quebec Residents 4.2 6.9 +0.5
Winnipeg Residents 5.0 7.4 +0.3
* Among those with an “ideal” destination

Implications

106©2004 TNS - Confidential
Implications
Negative tourism impacts that are unique to the Ontario have dissipated over the past several months.
However, Ontario is still facing a challenging tourism environment characterized by macro-level impacts:
traditional constraints imposed by economics and personal finances…
coupled with realities and perceptions as they exist within a turbulent post 9/11 world:• resistance to long-term travel planning;• anxiety about safety and security, particularly in the U.S.;• greater perceived inconvenience associated with travel,
particularly to foreign destinations.
107©2004 TNS - Confidential
Implications (cont’d)
Taken together, these factors have likely caused travellers to think twice about longer cross-border trips and have, perhaps, favoured domestic travel fairly close to home.
For Ontario and its destinations, this means operating within a much more competitive tourism market, particularly with respect to attracting “higher value” travellers with the capacity for extended stays within the region.
As with any brand or product, facing such challenges there is a need to define a meaningful and relevant point of difference capable of overcoming impediments to selecting Ontario’s “brands”.
Safety, friendliness and value for the money are “cost of entry” benefits.

108©2004 TNS - Confidential
Implications (cont’d)
As emphasized in previous reports, there is a need to go beyond these elements of the offer with the objective of establishing a profile as an exciting travel destination providing a unique combination of tourism experiences.
The message must have resonance among both first time visitors and potential repeat visitors.
It must be strong enough to break through the competitive “clutter”.
It must, in the end, move Ontario and its destinations closer to the top of potential travellers’ consideration set.
109©2004 TNS - Confidential
Implications (cont’d)
Toronto is possibly the most vulnerable of Ontario’s major destinations.
It has just emerged from the SARS crisis.
It is the least robust with respect to riding out seasonal tourism fluctuations.
Its “urban tourism image” remains fairly mediocre, especially in the eyes of Americans.
As a consequence, Toronto may continue to require special attention.
With respect to the business market, one can argue that Toronto is not performing to its optimal level in terms of attracting conferences, conventions and trade shows from across North America.

110©2004 TNS - Confidential
Implications (cont’d)
When it comes to managing the “brands”, a holistic approach would likely be beneficial.
Present “Ontario” as the umbrella brand embodying the generic positioning and imagery elements common to the region as a whole?
Align specific destinations and attractions under this positioning in a manner that is consistent with the overall strategic message while emphasizing the unique features of the individual tourism entity.