Embed Size (px)
Citation preview

1. Report No.
FHWA/TX-92/1108-4 I 2. G011emment Accession No.
4. Tille and Subtitle
Travel Impacts of the US-59 Southwest Freeway Reconstruction Project in Houston 1. Author(s)
Mark A. Shafer, Kevin D. Tyer, and Raymond A Krammes B. Pedormlng Organization Name and Address
Texas Transportation Institute The Texas A&M University System College Station, Texas 77843 12. Sponsoring Agency and Address
Texas Department of Transportation Transportation Planning Division P. 0. Box 5051 Austin, Texas 78763 15. Supplementary Notes
Technical Report Standard Title Page
3. Recipienl'$ Catalog No.
5. Report Oate
September 1992 6. Pefforming Organization Code
6. Pertormlng Organization Report No.
Research Report 1108-4
10. Work Unit No. (TRAIS)
11. Contract or Grant No.
Study 2-8-87/1-1108
13. Type of Report and Period Covered
Interim Report (July 1988-August 1992) 14. Sponsoring Agency Code
This study was conducted in cooperation with the U.S. Department of Transportation, Federal Highway Administration. Study Title: Traffic Pattern Assessment and Road User Delay Costs Resulting from Roadway Construction Options 16. Abstract
This report documents the results and findings of a five-year study to monitor the travel impacts of the US-59 Southwest Freeway reconstruction project in Houston, Texas. The monitoring effort included screen line traffic volume counts and travel time runs on the freeway, frontage roads, and alternative routes. The results indicate drops in traffic volumes on the freeway primarily during the first phase of reconstruction and on the westbound frontage road throughout all three phases of recontruction. Only minor volume variations were observed on other routes in the corridor. Travel times and average speeds in the corridor did not change significantly during reconstruction. The impacts of the Southwest Freeway project were generally consistent with the impacts observed previously at other major urban freeway reconstruction projects in Texas.
17. Key Words
Freeway Reconstruction Corridor Analysis
19. Security Classif. (of this report)
Unclassified
18. Distribution Statement
No restrictions. Tt"lis document is available to the public through the National Technical Information Service, Springfield, VA 22161.
I 20. Security Class~. (of this page)
Unclassified I 21. No. o~Ses I 22. Price
Form DOT F 1700.7 (8·72) Reproduction of form and completed page is authorized.

TRAVEL IMPACTS OF THE US-59 SOUTHWEST FREEWAY RECONSTRUCTION PROJECT IN HOUSTON
by
Mark A. Shafer
Kevin D. Tyer
and
Raymond A. Krammes
Research Report 1108-4 Research Study Number 2-8-87 /1-1108
Sponsored by
Texas Department of Transportation in cooperation with
U. S. Department of Transportation, Federal Highway Administration
TEXAS TRANSPORTATION INSTITUTE The Texas A&M University System
College Station, TX 77843
September 1992

METRIC (SI•) CONVERSION FACTORS
APPROXIMATE CONVERSIONS TO SI UNn'S ....... WllMIY•Know ........,., ToFlnd
In ft yd ml
In' ftt
yell ml1
llC
oz lb T
Inches , ... yerd• miles
..,.,.lnchee square feet square yMfa ..,.remlln acres
LENGTH
2.54 0.3CMI 0.914 1.81
AREA
845.2 0.0929 0.838 2.59 0.395
oenllmetres metres metres kllometrea
oenllmetreeaqu•ntd metres squared metf99 squared kllometnt1t aqmantd hectaNS
MASS (weight)
ouncn 28.35 pounds 0.454 short tone (2000 lb) 0.907
VOLUME
fl oz flutd ouncee 29.57 mlllllttf'M gal pllons 3.185 IHrea n• cubic feet 0.0328 inel1'91 cubed yd' cUblc yMfa 0.0785 metrn cubed
NOTE: Volurnn areater than 1000 L wn be shown In m•.
TEMPERATURE (exact)
Fahfenhelt !519 (after Celafus temperatunt subtracting 32) temperature
• SI Is the symbol for the International System of Measurements
cm m m km
m• m• km1
ha
g kg Mg
ml L m• m'
.. -
.. -
...
..
. -
.. -
... -
.. -
I
APPROXIMATE CONVERSIONS TO SI UNrrs
mm ml Ill metres m metres m metres km kllometrn
. .....,.., LENGTH
0.039 3.28 1.09 0.821
AREA
mm• mllllmetrn aquantd O.OCH8 m• metres aquantd 10.184 km' kilometres aquantd 0.39 ha hectOntlt (10 000 m't 2.53
To Find
lnchn feet yards miles
square lnchn square feet square mlln acres
MASS (weight)
g grams 0.0353 ounces kg ktlog,.ms 2.205 pounds Mg megagrama (1000 kg) 1.103 short tons
ml mltlllltres L lltres m• metres cubed m• metres cubed
VOLUME
0.034 0.264 35.315 1.308
ffuld ounces gallons cubic feet cubic yards
TEMPERATURE (exact)
oC Celslua 915 (then temperature add 32J ... 41F 32 II.I 212
-~!I I! 0 I~~. t • ~t ~1,~I' .1!"'. I!~' Jti r11-rr1--• -m o a • • ~ ~ v ~
These factora conform to the requirement of FHWA Order 5190. 1A.
In ft
yd ml
In' ft• ml1
ac
oz lb T
fl oz gal ft 1
yd'

ACKNOWLEDGMENTS
The authors gratefully acknowledge the cooperation and assistance of many Texas Department of Transportation personnel during the conduct of this study. Mark A. Marek (D-8) served as Technical Panel Chairperson. Lewis R. Rhodes, Jr. (D-18STO) and Steven Z. Levine (District 12) served as a Technical Panel Members. Numerous individuals in the Texas Department of Transportation District 12 office in Houston and the Texas Transportation Institute Houston office assisted in the study.
iv

SUMMARY OF FINDINGS
This report is the fourth interim report prepared under Study No. 2-8-87/1-1108 "Traffic Pattern Assessment and Road User Delay Costs Resulting from Roadway Construction Options." Previous reports were:
o Report 1108-1 'Travel Impacts of Freeway Reconstruction: Synthesis of Previous Experience"
o Report 1108-2 "Analysis of Accidents at Long-Term Construction Projects in Texas"
o Report 1108-3 "Travel Impacts of Urban Freeway Reconstruction Projects in Texas"
This report presents the results and findings of a five-year study to monitor the travel impacts of the US-59 Southwest Freeway reconstruction project in Houston, Texas. The monitoring effort followed the data collection and statistical analysis methodology previously documented in Research Report 1108-3. Data collection included screen line traffic volume counts and travel time runs on the freeway, frontage roads, and alternative routes.
The results indicate drops in traffic volumes on the freeway primarily during the first phase of reconstruction and on the westbound frontage road throughout all three phases of recontruction. Only minor volume variations were observed on other routes in the corridor. Travel times and average speeds in the corridor did not change significantly during reconstruction. The impacts of the Southwest Freeway project were generally consistent with the impacts observed previously at other major urban freeway reconstruction projects in Texas.

IMPLEMENTATION STATEMENT
This study support the findings of Research Report 1108-3 and should be useful to the Texas Department of Transportation in its future corridor traffic management planning efforts for urban freeway reconstruction projects. The results for all of the reconstruction projects monitored suggest that the traffic control plans typically employed by the Department (wr1ich generally maintain the same number of freeway lanes as before reconstruction and involve only minor capacity reductions associated with narrowing lane and shoulder widths and detouring traffic within the right-of-way) are generally effective at minimizing the adverse travel impacts resulting from the projects. When access to the freeway is restricted due to ramp closures and/or frontage road lane closures, however, some diversion of traffic away from the freeway is likely to occur. Therefore, when considering traffic control options that would significantly reduce either the capacity of the freeway or access to the freeway, the Department should determine the availability of excess capacity on other routes in the corridor.
DISCLAIMER
The contents of this report reflect the views of the authors who are responsible for the facts and the accuracy of the data presented within. The contents do not necessarily reflect the views or policies of the Texas Department of Transportation or the Federal Highway Administration. This report does not constitute a standard, specification or regulation. It is not intended for construction, bidding or permit purposes. Raymond A. Krammes, P.E., Texas P.E. Serial Number 66413, was the engineer in charge of the project.
vi

TABLE OF CONTENTS
LIST OF TABLES . . . . . . . . . . . . . . . . . . . . . . . . . . . . . . . . . . . . . . . . . . . . . viii
LIST OF FIGURES . . . . . . . . . . . . . . . . . . . . . . . . . . . . . . . . . . . . . . . . . . . . x
1. INTRODUCTION . . . . . . . . . . . . . . . . . . . . . . . . . . . . . . . . . . . . . . . . . 1
2. PROJECT COLLECTION . . . . . . . . . . . . . . . . . . . . . . . . . . . . . . . . . . . 2 Traffic Volume Data . . . . . . . . . . . . . . . . . . . . . . . . . . . . . . . . . . . . 4 Travel Time and Speed Data . . . . . . . . . . . . . . . . . . . . . . . . . . . . . . 8
3. OBSERVED TRAVEL IMPACTS . . . . . . . . . . . . . . . . . . . . . . . . . . . . . . . 10
TRAFFIC VOLUMES . . . . . . . . . . . . . . . . . . . . . . . . . . . . . . . . . . . . . . 10 Changes in Total Daily Screen Line Traffic Volumes . . . . . . . . . . . . . 10 Changes in Daily Traffic Volume by Route . . . . . . . . . . . . . . . . . . . . 1 O
TRAVEL TIMES AND SPEEDS . . . . . . . . . . . . . . . . . . . . . . . . . . . . . . . 14 A.M. Peak . . . . . . . . . . . . . . . . . . . . . . . . . . . . . . . . . . . . . . . . . . . 16 A.M. Off-Peak . . . . . . . . . . . . . . . . . . . . . . . . . . . . . . . . . . . . . . . . 16 P.M. Off-Peak and P.M. Peak . . . . . . . . . . . . . . . . . . . . . . . . . . . . . 16
4. SUMMARY AND CONCLUSIONS . . . . . . . . . . . . . . . . . . . . . . . . . . . . . 23
REFERENCES . . . . . . . . . . . . . . . . . . . . . . . . . . . . . . . . . . . . . . . . . . . . . . 24
APPENDIX A . . . . . . . . . . . . . . . . . . . . . . . . . . . . . . . . . . . . . . . . . . . . . . . . 25
vii

LIST OF TABLES
Figure Egge
1 Construction Status During Traffic Data Collection Period . . . . . . . . . . . . 2 2 Traffic Volume Count Locations . . . . . . . . . . . . . . . . . . . . . . . . . . . . . . 4 3 Percentage of Traffic in the US-59 Southwest Freeway Corridor on
Secondary Routes . . . . . . . . . . . . . . . . . . . . . . . . . . . . . . . . . . . . . . . . 5 4 Frontage Road Volume Data Before and After Adjustments . . . . . . . . . . . 7 5 Freeway Volume Data Before and After Adjustments . . . . . . . . . . . . . . . 7 6 Schedule of Travel Time Runs on the Freeway and Frontage Roads:
US-59 Corridor in Houston . . . . . . . . . . . . . . . . . . ·. . . . . . . . . . . . . . . . 9 7 Schedule of Travel Time Runs on the Alternative Rolltes:
US-59 Corridor in Houston . . . . . . . . . . . . . . . . . . . . . . . . . . . . . . . . . . 9 8 Total Daily Screen Line Traffic Volumes: US-59 Corridor in Houston .... 11 9 Eastbound Daily Traffic Volumes by Route: US-59 Corridor in Houston .. 12
10 Z-Test Statistics for changes in Daily Traffic Volumes: US-59 Corridor in Houston .................................. 13
11 Westbound Daily Traffic Volumes by Route: US-59 Corridor in Houston .. 15 12 A. M. Peak Period Eastbound Travel Times & Speeds:
US-59 Corridor in Houston . . . . . . . . . . . . . . . . . . . . . . . . . . . . . . . . . . 17 13 A. M. Off-Peak Period Eastbound Travel Times & Speeds:
US-59 Corridor in Houston . . . . . . . . . . . . . . . . . . . . . . . . . . . . . . . . . . 18 14 P. M. Off-Peak Period Eastbound Travel Times & Speeds:
US-59 Corridor in Houston . . . . . . . . . . . . . . . . . . . . . . . . . . . . . . . . . . 19 15 P. M. Peak Period Eastbound Travel Times & Speeds:
US-59 Corridor in Houston . . . . . . . . . . . . . . . . . . . . . . . . . . . . . . . . . . 20 16 Paired t-Test Results for Changes in Travel time During the Peak
Period: US-59 Corridor in Houston ............................ 21 17 Paired t-Test Results for Changes in Travel time During the
Off-Peak Period: US-59 Corridor in Houston ..................... 22 A-1 Eastbound A. M. Peak Period Traffic Volumes by Route:
US-59 Corridor in Houston . . . . . . . . . . . . . . . . . . . . . . . . . . . . . . . . .. A 1 A-2 Westbound A. M. Peak Period Traffic Volumes by Route:
US-59 Corridor in Houston . . . . . . . . . . . . . . . . . . . . . . . . . . . . . . . . .. A2 A-3 Z-Test Statistics for Changes in A. M. Peak Period Traffic Volumes:
US-59 Corridor in Houston . . . . . . . . . . . . . . . . . . . . . . . . . . . . . . . . . . A3 A-4 Eastbound Off-Peak Period Traffic Volumes by Route:
US-59 Corridor in Houston . . . . . . . . . . . . . . . . . . . . . . . . . . . . . . . . . . A4 A-5 Westbound Off-Peak Period Traffic Volumes by Route:
US-59 Corridor in Houston . . . . . . . . . . . . . . . . . . . . . . . . . . . . . . . . . . AS A-6 Z-Test Statistics for Changes in Off-Peak Period Traffic Volumes:
US-59 Corridor in Houston . . . . . . . . . . . . . . . . . . . . . . . . . . . . . . . . . . AS A-7 Eastbound P. M. Peak Period Traffic Volumes by Route:
US-59 Corridor in Houston .................................. A?
viii

A-8 Westbound P. M. Peak Period Traffic Volumes by Route: US-59 Corridor in Houston .................................. AB
A-9 Z-Test Statistics for Changes in P. M. Peak Period Traffic Volumes: US-59 Corridor in Houston .................................. A9
ix

LIST OF FIGURES
Figure Page
1 US-59 Southwest Freeway Study Corridor . . . . . . . . . . . . . . . . . . . . . . . 3 2 US-59 Ramp Configuration Before and During Construction at
Screen Line Count Location . . . . . . . . . . . . . . . . . . . . . . . . . . . . . . . . . 6
x

1. INTRODUCTION
This report documents the results and findings of a 5-year effort to monitor traffic conditions in the US-59 Southwest Freeway corridor in Houston. The purpose of the monitoring effort was to measure the traffic impacts of a major reconstruction project on the freeway.
The US-59 Southwest Freeway project is the sixth urban freeway reconstruction project in Texas that has been monitored as part of Study 1108 "Traffic Pattern Assessment and Road User Delay Costs Resulting from Roadway Construction Options." The monitoring efforts for the five previous projects were documented in Research Report 1108-3 "Travel Impacts of Urban Freeway Reconstruction Projects in Texas." The other projects included:
• 1-35 in Austin, • US-75 in Plano, • 1-45 North Freeway in Houston, • l-35W in Fort Worth, and • 1-10 in El Paso.
Chapter 2 describes the US-59 Southwest Freeway project and the data collection and analysis methodology for the monitoring efforts. Chapter 3 summarizes the observed travel impacts with respect to changes in traffic volumes and travel times and speeds. Chapter 4 presents a summary and conclusions.
1

2. PROJECT DESCRIPTION
US-59 PROJECT
The US-59 Southwest Freeway is a major highway that connects southwest Houston to areas including the Galleria, the Summit, and the Central Business District. An 11.0-mile section from Shepherd Drive to Beltway 8 was reconstructed during the period 1989-1992. Figure 1 indicates the section of freeway that was reconstructed.
The preconstruction conditions for a typical freeway section on US-59 included a six-lane freeway with a median consisting of paved shoulders and concrete traffic barriers. The frontage roads consisted of two, one-way traffic lanes in each direction. The improvements to the freeway and frontage roads occurred in three phases. Phase I included frontage road reconstruction and intersection improvement. Phase II consisted of the addition of mainlanes between the existing lanes and the newly constructed frontage road lanes. Phase Ill construction added the High Occupancy Vehicle {HOV) lanes in the median of the freeway.
When construction is completed in late 1992, the typical cross section will be an eight-lane freeway with a median consisting of paved shoulders and a barrier-separated reversible HOV lane. The frontage road will typically consist of three, one-way traffic lanes in each direction.
DATA COLLECTION
The data collection efforts in the US-59 Southwest Freeway corridor in Houston included five annual field studies. Table 1 summarizes the construction status during each of the data collection periods. Traffic conditions were monitored before construction in July 1988 and May 1989 and during construction phases I, II, and Ill in May 1990, May 1991, and May 1992, respectively. The effort involved the collection of screen line traffic volumes and travel times.
Table 1. Construction Status During Traffic Data Collection Periods
Traffic Data Collection Construction Period Status
July 1988 Before Construction May 1989 Before Construction May 1990 During Phase I May 1991 During Phase II May 1992 During Phase Ill
2

WESTHEIMER
BEECHNUT
81SSOHNET
1
... I.I. 0 a: u ..J ..J
x
Figure 1. US-59 Southwest Freeway Study Corridor.
0 a: w :I: 0. w ii
3 Traffic Count Location•

During the data collection in May 1990, phase I was in progress. Lanes were being added to both the northbound and southbound frontage roads. U-turn lanes were closed at most intersections, and left-turn lanes were reduced to minimum distances. At several locations, ramps were changed from a diamond to an "X" configuration.
During the May 1991 data collection, phase II was underway. Additional freeway mainlanes were being constructed between the existing mainlanes and the frontage road. Construction on the frontage roads caused intermittent lane closures in both directions and continued closure of most U-turn lanes. Night time closures of cross streets allowed work on the bridge structures for the outside freeway mainlanes. Off-peak lane closures occurred on Westpark at US-59, and lane closures occurred on Bellaire due to work by the city of Houston.
Construction on the inside mainlanes and transitway was in progress during the May 1992 data collection. Frontage road work continued on the northeastern part of the site causing lane closures. T-ramps connecting the transitway to the parking facilities were under construction. Night time closure of the freeway occurred to allow work on the bridge structures of the inside mainlanes and the transitway.
Traffic Volume Data
Traffic volume data were collected on the mainlanes, frontage roads, and major alternative routes at a single screen line which runs diagonally though the corridor. The screen line count locations are illustrated in Figure 1 and listed in Table 2. During each field study, data were collected on the same weekdays (Tuesday, Wednesday, Thursday).
Table 2. Traffic Volume Count Locations
I Route
I Count Location
I Number
US-59 Freeway 4 Frontage Road 5
Primary Alternative Routes:
Westheimer 1 Richmond 2 Westpark 3 Bellaire 6 Bisson net 7
Secondary Alternative Routes:
Beechnut 8 North Braeswood 9 South Braeswood 10 West Bellfort 11
4
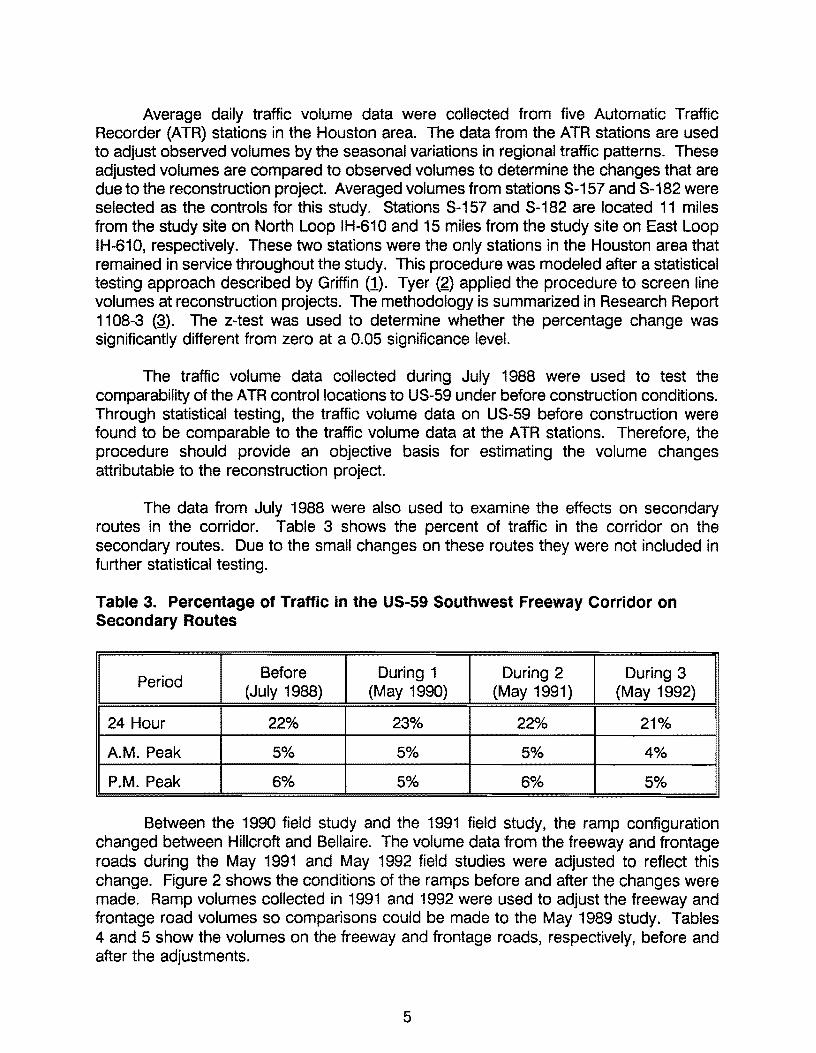
Average daily traffic volume data were collected from five Automatic Traffic Recorder {ATR) stations in the Houston area. The data from the ATR stations are used to adjust observed volumes by the seasonal variations in regional traffic patterns. These adjusted volumes are compared to observed volumes to determine the changes that are due to the reconstruction project. Averaged volumes from stations S-157 and S-182 were selected as the controls for this study. Stations S-157 and S-182 are located 11 miles from the study site on North Loop IH-610 and 15 miles from the study site on East Loop IH-610, respectively. These two stations were the only stations in the Houston area that remained in service throughout the study. This procedure was modeled after a statistical testing approach described by Griffin (1). Tyer (2) applied the procedure to screen line volumes at reconstruction projects. The methodology is summarized in Research Report 1108-3 (~). The z-test was used to determine whether the percentage change was significantly different from zero at a 0.05 significance level.
The traffic volume data collected during July 1988 were used to test the comparability of the ATR control locations to US-59 under before construction conditions. Through statistical testing, the traffic volume data on US-59 before construction were found to be comparable to the traffic volume data at the ATR stations. Therefore, the procedure should provide an objective basis for estimating the volume changes attributable to the reconstruction project.
The data from July 1988 were also used to examine the effects on secondary routes in the corridor. Table 3 shows the percent of traffic in the corridor on the secondary routes. Due to the small changes on these routes they were not included in further statistical testing.
Table 3. Percentage of Traffic in the US-59 Southwest Freeway Corridor on Secondary Routes
Period Before During 1 During 2 During 3 (July 1988) (May 1990) {May 1991) (May 1992)
24 Hour 22% 23% 22% 21%
AM. Peak 5% 5% 5% 4%
P.M. Peak 6% 5% 6% 5%
Between the 1990 field study and the 1991 field study, the ramp configuration changed between Hillcroft and Bellaire. The volume data from the freeway and frontage roads during the May 1991 and May 1992 field studies were adjusted to re·flect this change. Figure 2 shows the conditions of the ramps before and after the changes were made. Ramp volumes collected in 1991 and 1992 were used to adjust the freeway and frontage road volumes so comparisons could be made to the May 1989 study. Tables 4 and 5 show the volumes on the freeway and frontage roads, respectively, before and after the adjustments.
5

Hill croft
Sceen Line
Bellaire
Hill croft
Screen Line
Bellaire
1 I I
+lt
I I I I I I I
t!t!t
a) Before May 1989 and During May 1990
I
1 1 I
! I+ I+ : I I : I I 'I I
I I I I I I I
tltlt I I I I I I
b) During May 1991 and During May 1992
I I I I I I I
t!t
I I I I I I I
tlt I I I
N
\
N
\
Figure 2. US-59 Ramp Configuration Before and During Construction at
Screen Line Count Location.
6

Table 4. Freeway Volume Data Before and After Adjustments
Volumea Adjusted Volumeb Study Period
NB SB NB SB
24 Hour 48712 53488 72805 84489
A.M. Peak 9702 6869 13386 10107 May 1991
Off Peak 19833 19832 31005 32896
P.M. Peak 8223 12458 12257 19629
24 Hour 47432 54356 83055 87197
A.M. Peak 8938 7216 16131 10520 May 1992
Off Peak 18858 19597 34865 32510
P.M. Peak 8328 12606 13475 20447 a "X" configuration
b Volume adjusted to reflect diamond configuration that existed in May 1989 and May 1990.
Table 5. Frontage Road Volume Data Before and After Adjustments
Volume a Adjusted Volumeb Study Period
NB SB NB SB
24 Hour 22253 22421 15269 7463
A.M. Peak 5332 1771 3615 481 May 1991
Off Peak 9537 9666 6587 3382
P.M. Peak 3612 5910 2521 1669
24 Hour 30280 24630 16832 10853
A.M. Peak 7018 1768 2228 516 May 1992
Off Peak 13976 9902 9098 4934
P.M. Peak 4749 6969 3183 2635 a "X" configuration
b Volume adjusted to reflect diamond configuration that existed in May 1989 and May 1990.
7
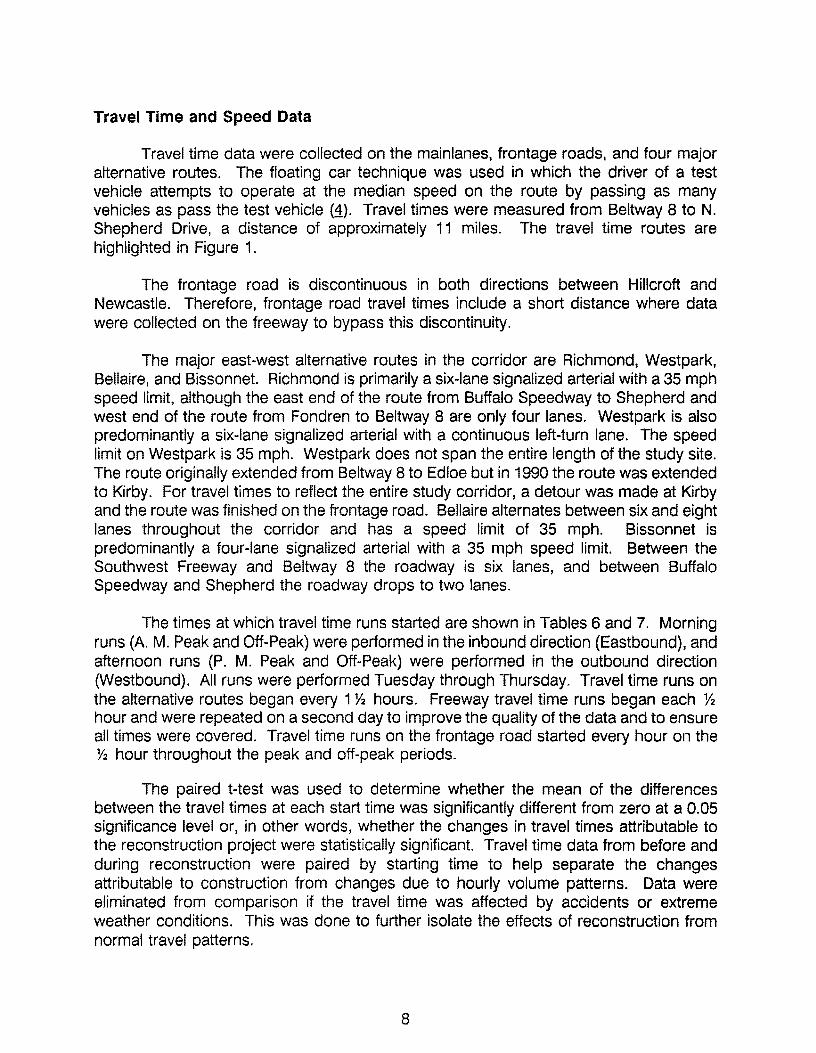
Travel Time and Speed Data
Travel time data were collected on the mainlanes, frontage roads, and four major alternative routes. The floating car technique was used in which the driver of a test vehicle attempts to operate at the median speed on the route by passing as many vehicles as pass the test vehicle (:1). Travel times were measured from Beltway 8 to N. Shepherd Drive, a distance of approximately 11 miles. The travel time routes are highlighted in Figure 1.
The frontage road is discontinuous in both directions between Hillcroft and Newcastle. Therefore, frontage road travel times include a short distance where data were collected on the freeway to bypass this discontinuity.
The major east-west alternative routes in the corridor are Richmond, Westpark, Bellaire, and Bissonnet. Richmond is primarily a six-lane signalized arterial with a 35 mph speed limit, although the east end of the route from Buffalo Speedway to Shepherd and west end of the route from Fondren to Beltway 8 are only four lanes. Westpark is also predominantly a six-lane signalized arterial with a continuous left-turn lane. The speed limit on Westpark is 35 mph. Westpark does not span the entire length of the study site. The route originally extended from Beltway 8 to Edloe but in 1990 the route was extended to Kirby. For travel times to reflect the entire study corridor, a detour was made at Kirby and the route was finished on the frontage road. Bellaire alternates between six and eight lanes throughout the corridor and has a speed limit of 35 mph. Bissonnet is predominantly a four-lane signalized arterial with a 35 mph speed limit. Between the Southwest Freeway and Beltway 8 the roadway is six lanes, and between Buffalo Speedway and Shepherd the roadway drops to two lanes.
The times at which travel time runs started are shown in Tables 6 and 7. Morning runs (A. M. Peak and Off-Peak) were performed in the inbound direction (Eastbound), and afternoon runs (P. M. Peak and Off-Peak} were performed in the outbound direction (Westbound). All runs were performed Tuesday through Thursday. Travel time runs on the alternative routes began every 1 % hours. Freeway travel time runs began each Y2 hour and were repeated on a second day to improve the quality of the data and to ensure all times were covered. Travel time runs on the frontage road started every hour on the % hour throughout the peak and off-peak periods.
The paired t-test was used to determine whether the mean of the differences between the travel times at each start time was significantly different from zero at a 0.05 significance level or, in other words, whether the changes in travel times attributable to the reconstruction project were statistically significant. Travel time data 'from before and during reconstruction were paired by starting time to help separate the changes attributable to construction from changes due to hourly volume patterns. Data were eliminated from comparison if the travel time was affected by accidents or extreme weather conditions. This was done to further isolate the effects of reconstruction from normal travel patterns.
8
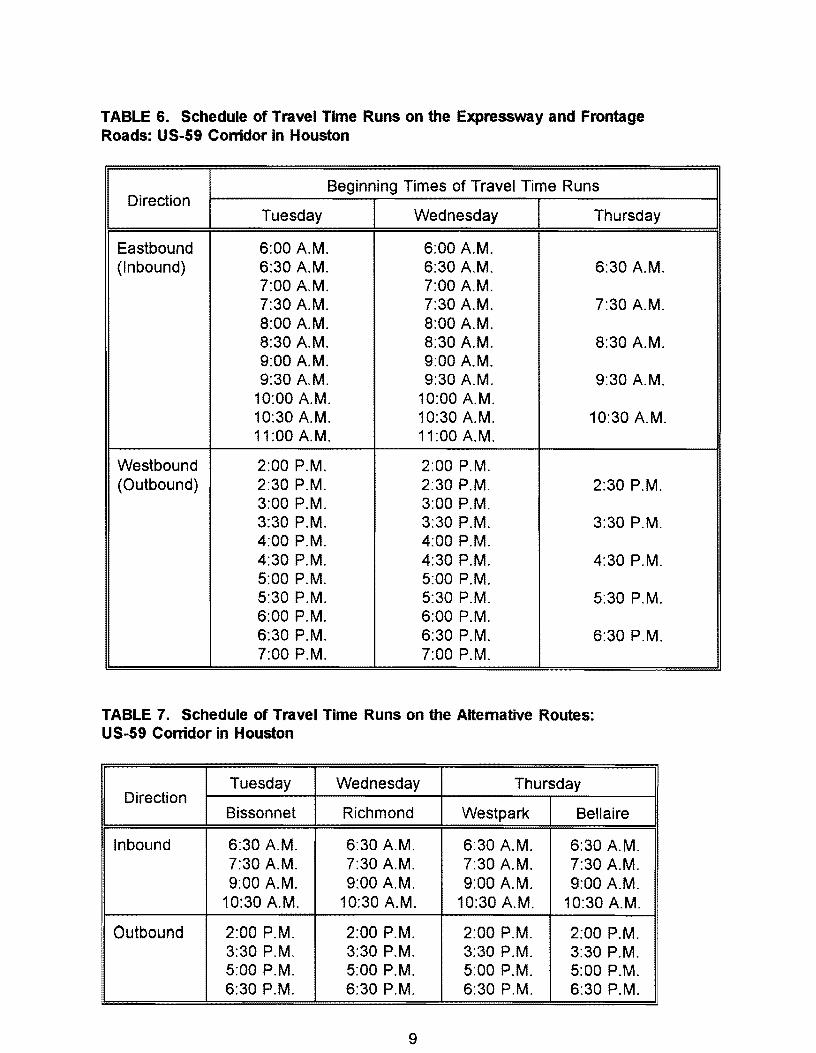
TABLE 6. Schedule of Travel Time Runs on the Expressway and Frontage Roads: US-59 Conidor in Houston
Direction Beginning Times of Travel Time Runs
Tuesday Wednesday Thursday
Eastbound 6:00 A.M. 6:00 A.M. (Inbound) 6:30 A.M. 6:30 A.M. 6:30 A.M.
7:00 A.M. 7:00 A.M. 7:30 A.M. 7:30 A.M. 7:30 A.M. 8:00 A.M. 8:00 A.M. 8:30 A.M. 8:30 A.M. 8:30 A.M. 9:00 A.M. 9:00 A.M. 9:30 A.M. 9:30 A.M. 9:30 A.M.
10:00 A.M. 10:00 A.M. 10:30 A.M. 10:30 A.M. 10:30 A.M. 11 :00 A.M. 11 :00 A.M.
Westbound 2:00 P.M. 2:00 P.M. (Outbound) 2:30 P.M. 2:30 P.M. 2:30 P.M.
3:00 P.M. 3:00 P.M. 3:30 P.M. 3:30 P.M. 3:30 P.M. 4:00 P.M. 4:00 P.M. 4:30 P.M. 4:30 P.M. 4:30 P.M. 5:00 P.M. 5:00 P.M. 5:30 P.M. 5:30 P.M. 5:30 P.M. 6:00 P.M. 6:00 P.M. 6:30 P.M. 6:30 P.M. 6:30 P.M. 7:00 P.M. 7:00 P.M.
TABLE 7. Schedule of Travel Time Runs on the Alternative Routes: US-59 Conidor in Houston
Direction Tuesday ~ednesday Thursday
Bisson net Richmond Westpark Bellaire
Inbound 6:30 A.M. 6:30 A.M. 6:30 A.M. 6:30 A.M. 7:30 A.M. 7:30 A.M. 7:30 A.M. 7:30 A.M. 9:00 A.M. 9:00 A.M. 9:00 A.M. 9:00 A.M.
10:30 A.M. 10:30 A.M. 10:30 A.M. 10:30 A.M.
Outbound 2:00 P.M. 2:00 P.M. 2:00 P.M. 2:00 P.M. 3:30 P.M. 3:30 P.M. 3:30 P.M. 3:30 P.M. 5:00 P.M. 5:00 P.M. 5:00 P.M. 5:00 P.M. 6:30 P.M. 6:30 P.M. 6:30 P.M. 6:30 P.M.
9

3. OBSERVED TRAVEL IMPACTS
The analysis indicates that the reconstruction project on US-59 in Houston significantly affected traffic volumes through the corridor. Freeway traffic volumes were generally lower during the first two phases of reconstruction than the seasonally adjusted volumes that would have been expected if construction had not occurred. Volumes on the frontage roads experienced significant decreases throughout reconstruction. Alternative route volumes were also affected by the construction project. With only a few exceptions, there were no significant changes in travel times on the freeway, frontage roads, and alternative routes.
TRAFFIC VOLUMES
Volume data were divided into four time periods; twenty-four hour, A.M. peak, off peak, and P.M. peak. The A.M. peak is from 6:00 A.M. to 9:00 A.M., the off peak from 9:00 A.M. to 4:00 P.M., and the P.M. peak runs from 4:00 P.M. to 7:00 P.M. Comparisons were made by time period between before and during reconstruction data. The largest percentage changes occurred on the frontage roads.
Changes in Total Daily Screen Line Traffic Volumes
Table B summarizes the changes in the daily screen line traffic volumes during reconstruction. The volume of the corridor dropped below expected values in both directions. Expected values are determined by using the volumes from control locations to adjust screen line volumes to represent conditions without construction. A 16 percent drop occurred in the corridor during May 1990, a 14 percent drop in May 1991, and a 9 percent drop in May 1992. The eastbound direction showed the greatest drop in volume during the first two years of construction. In the final year of construction the reduction was about equal in both directions. The decrease in volume suggests that either trips in the corridor were canceled or that other forms of transportation were utilized.
Changes in Daily Traffic Volumes by Route
Eastbound (Inbound) Traffic
Table 9 presents the daily eastbound traffic volumes on each route before and during reconstruction. Table 10 summarizes the z-test statistics for each route. Similar tables for the A.M., Off, and P.M. peak periods are presented in Appendix A.
Freeway conditions appear to have improved as construction progressed. The freeway volume decreased 15 percent at the screen line in May 1990 and decreased 1 o percent in May 1991. However, the volume of the freeway at the screen line increased only 2 percent in May 1992. These trends suggest that motorists changed their destinations, diverted to other routes, or canceled trips as construction began and returned to the freeway as construction continued.
10

_.. _..
Table 8. Total Daily Screen Line Traffic Volumes: US-59 Corridor in Houston
Before During Reconstruction Volumes During Reconstruction Volumes During Reconstruction Volumes
Direction (May 1989) (May 1990) (May 1991) (May 1992)
Observed Estimateda Observed f %A Estimateda Observed Ab %A Estimated8
Observed
EB 207618 229744 191443 -38301 -17 233057 195808 -37249 -16 233616 212723
WB 204930 226770 192652 -34118 -15 230040 203298 -26742 -12 230592 208604
Total 412548 456514 384095 -72419 -16 463097 399106 -63991 -14 464208 421327
a Volumes were estimated by seasonally adjusting May 1989 before volumes according to the patterns observed at the control locations.
b A =Observed - Estimated.
ab %A
-20893 -9
-21988 -10
-42881 -9

Table 9. Eastbound Daily Traffic Volumes by Route: US-59 Corridor in Houston
Before During Reconstruction Volumes During Reconstruction Volumes During Reconstruction Volumes
Route May 1989 {May 1990) (May 1991) (May 1992)
Observed Estimatec:r Observed lib Estimateda Observed lib Estimateda Observed
Freeway 72049 79727 67830 -11897 80877 72805 -8072 81071 83055
Frontage Road 11451 12671 8258 -4413 12854 15269 2415 12885 16832
Westheimer 52072 57621 34868 -22753 58452 34475 -23977 58593 38174
Richmond 15271 16898 19038 2140 17142 17824 682 17183 16392
West park 26408 29222 24091 -5131 29644 24180 -5464 29715 25860
Bellaire 18751 20749 18382 -2367 21049 18247 -2802 21099 20395
Bissonnet 11616 12854 18976 6122 13039 13008 -31 13071 12015
a Volumes were estimated by adjusting May 1989 before volumes according to the patterns observed at the control locations.
b A = Observed - Estimated
Ab
1984
3947
-20419
-791
-3855
-704
-1056
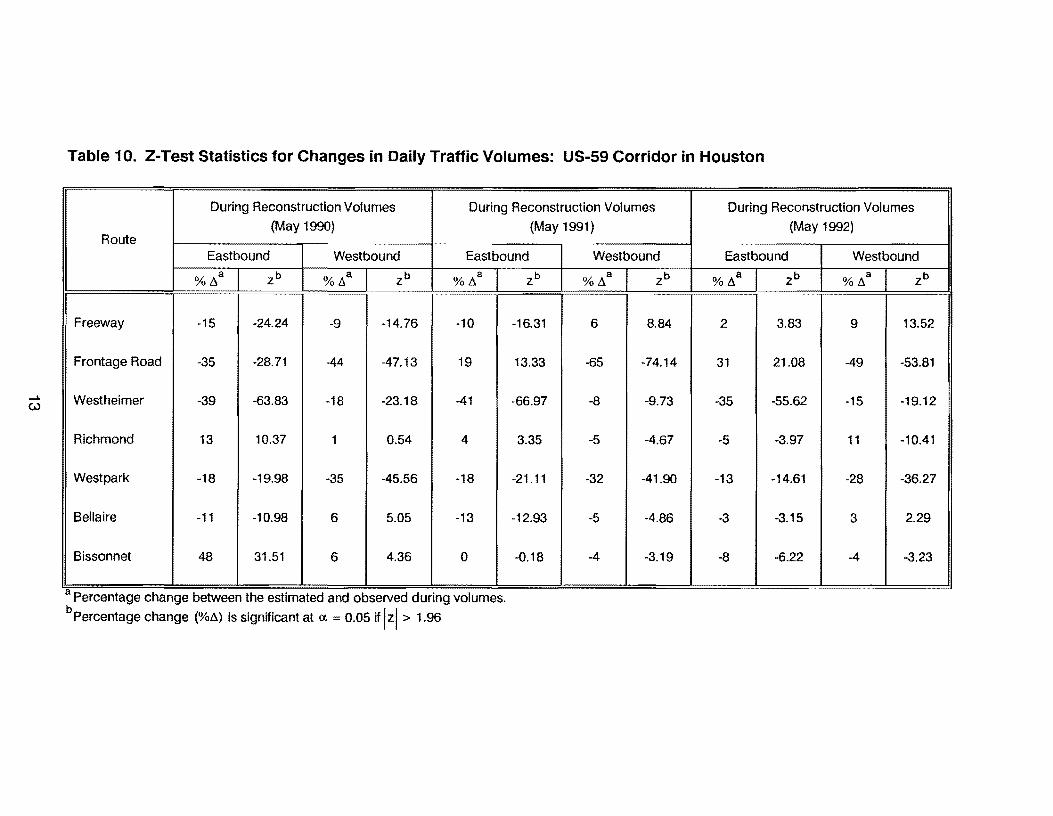
Table 1 O. Z-Test Statistics for Changes in Daily Traffic Volumes: US-59 Corridor in Houston
During Reconstruction Volumes During Reconstruction Volumes During Reconstruction Volumes
(May 1990) (May 1991) (May 1992) Route
Eastbound Westbound Eastbound Westbound Eastbound Westbound
%Aa zb %ti.a zb %Aa zb %Aa zb %Aa zb %Aa zb
Freeway -15 -24.24 -9 -14.76 -10 -16.31 6 8.84 2 3.83 9 13.52
Frontage Road -35 -28.71 -44 -47.13 19 13.33 -65 -74.14 31 21.08 -49 -53.81
...... (.,.) Westheimer -39 -63.83 -18 -23.18 -41 -66.97 -8 -9.73 -35 -55.62 -15 -19.12
Richmond 13 10.37 1 0.54 4 3.35 -5 -4.67 -5 -3.97 11 -10.41
West park -18 -19.98 -35 -45.56 -18 -21.11 -32 -41.90 -13 -14.61 -28 -36.27
Bellaire -11 -10.98 6 5.05 -13 -12.93 -5 -4.86 -3 -3.15 3 2.29
Bissonnet 48 31.51 6 4.36 0 -0.18 -4 -3.19 -8 -6.22 -4 -3.23
a Percentage change between the estimated and observed dunng volumes.
bPercentage change (%A) is significant at a. = 0.05 if lzl > 1.96

The largest percentage changes in traffic volume occurred on the frontage roads. The reductions in the eastbound direction were restricted to the May 1990 data, which coincides with the heavy phase I construction on the frontage roads during that year. Traffic volumes in the westbound direction of the frontage road were much lower than expected during all three phases of construction (May 1990, May 1991, and May 1992).
A large change in volume occurred on Westheimer between May 1989 and May 1990. The volume on the route stabilized for the remaining years of the study. The large volume in May 1989 may be attributed to a reconstruction project on Westheimer that concluded just before the May 1989 study occurred.
Richmond and Bissonnet received a majority of the diverted traffic during the first year of reconstruction. During the second year of the reconstruction project, both Richmond and Bellaire are very close to their expected volumes. This indicates that construction did not affect traffic on these two routes during May 1991. During the final year of reconstruction, the traffic appears to return to the freeway and frontage road. Westpark and Bellaire experienced a reduction in volume throughout the study.
Westbound (Outbound) Traffic
Table 11 summarizes the daily westbound traffic volumes on each route before and during reconstruction. Table 1 O summarizes the z-test statistics for each route. Similar tables for the A.M., Off, and P.M. peak periods are presented in Appendix A. Freeway volumes decreased by 9 percent during the first year of construction. This change was followed by an increase of 6 percent in May 1991 and an increase of 9 percent in May 1992. This indicates that westbound {outbound) traffic was not adversely affected while the freeway was under construction. The frontage road experienced a heavy reduction during all three years of reconstruction at the screen line.
Summary
Combining eastbound and westbound directions, total volumes on the freeway during May 1990 (phase I) were 12 percent lower than would have been expected if normal regional volume patterns had prevailed. During May 1991 (phase II), total freeway volumes returned almost to normal (2 percent lower than expected). During May 1992 (phase Ill), total freeway volumes exceeded normally expected volumes by 6 percent.
TRAVEL TIMES AND SPEEDS
Travel times were measured on the freeway, frontage road, and on the alternative routes of Richmond, Westpark, Bellaire, and Bissonnet. Travel times were divided into four time periods: A.M. peak, A.M. off-peak, P.M. off-peak, and P.M. peak. The off-peak period was divided in half because data were collected in different directions during the A.M. and P.M. periods.
14

..... CJl
Table 11. Westbound Daily Traffic Volumes by Route: US~59 Corridor in Houston
Before During Reconstruction Volumes During Reconstruction Volumes During Reconstruction Volumes
Route May 1989 (May 1990) (May 1991) (May 1992)
Observed Estimated8
Observed ~ Estimateda Observed Ab Estimateda Observed
Freeway 71183 78769 71580 -7189 79905 84489 4584 80097 87197
Frontage Road 18998 21023 11766 -9257 21326 7463 -13863 21377 10853
Westheimer 35488 39270 32203 -7067 39836 36735 -3101 39932 33970
Richmond 17623 19501 19618 117 19782 18781 -1001 19830 17632
Westpark 32907 36414 23843 -12571 36939 25154 -11785 37028 26672
Bellaire 17354 19203 20301 1098 19480 18446 -1034 19527 20026
Bisson net 11377 12589 13341 752 12771 12230 -541 12802 12254
a Volumes were estimated by adjusting May 1989 before volumes according to the patterns observed at the control locations.
b !l = Observed - Estimated
Ab
7100
-10524
-5962
-2198
-10356
499
-548
Tables 12 through 15 summarize the travel times and speeds before and during construction for the four time periods. Tables 16 and 17 summarize the paired t-test results.
A.M. Peak
The greatest change in travel time took place on the frontage road during the May 1990 study. This change may be attributed to the large amount of construction taking place on the frontage road at that time. The freeway maintained the highest average speed of all the routes throughout the study. The paired t-test indicates that the only significant change between before and during travel times occurred on Bissonnet between May 1989 and May 1990. This travel time increased by two minutes.
A.M. Off-Peak
Off-peak lane closures on the freeway increased the average travel time by three minutes during May 1992. The three-minute difference reduced the average travel speed by eleven miles per hour. The frontage road experienced little change in travel times during reconstruction. The only significant change on the alternative routes occurred on Westpark during May 1990. A 4.6-minute increase in travel time might have been caused by the expansion of Westpark from Edloe to Kirby between May 1989 and May 1990.
P .M. Off-Peak and P .M. Peak
No significant changes in travel times occurred during eitherthe P.M. peak and the P.M. off-peak. The freeway retained the lowest average travel time and highest speed of any route in the corridor. Travel times on the frontage roads changed corresponding with the level of construction on the frontage roads. The longest travel times occurred during the heaviest period of reconstruction.
16

Table 12. A.M. Peak Period Eastbound Travel Times & Speeds: US-59 Corridor in Houston
Average Travel Time Average Travel Speed
Sample (min) (mph)
Route Distance Size a Before During During During Before During During During
(May 1989) (May 1990) (May 1991) (May 1992) (May 1989) (May 1990) (May 1991) (May 1992)
US-59 11.0 6 17.7 21.8 18.1 17.2 37 30 36 38
Mainlanes
Frontage 10.8 3 25.9 37.4 32.0 22.8 25 17 20 28
Road
Richmond 8.9 2 25.4 25.3 25.0 25.6 21 21 21 21
West park 9.0 2 24.8 21.5 20.4 26.0 22 25 26 21
Bellaire 8.7 2 24.7 24.1 22.7 25.4 21 22 23 21
Bisson net 9.9 2 26.0 28.0 27.0 27.1 23 22 21 22
a Number of travel time runs during each study period.
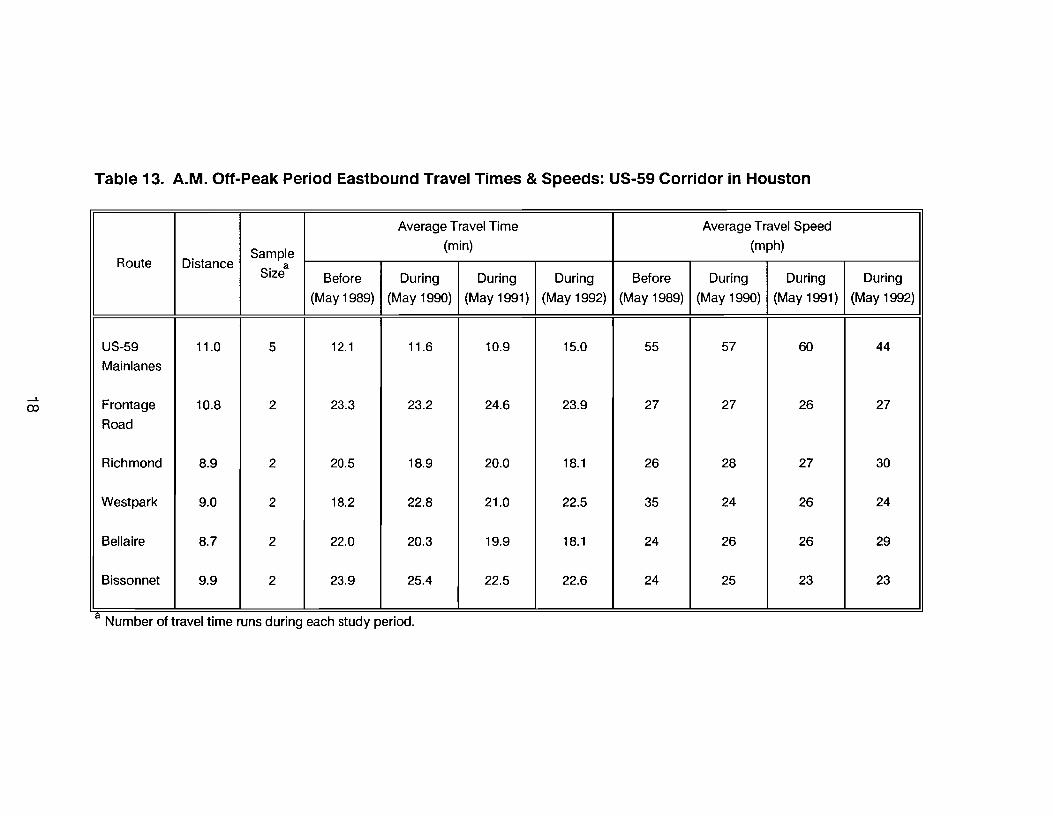
Table 13. A.M. Off-Peak Period Eastbound Travel Times & Speeds: US-59 Corridor in Houston
Average Travel Time Average Travel Speed
Sample (min) (mph)
Route Distance Size a Before During During During Before During During During
(May 1989) (May 1990) (May 1991) (May 1992) (May 1989) (May 1990) (May 1991) (May 1992)
US-59 11.0 5 12.1 11.6 10.9 15.0 55 57 60 44
Mainlanes
...... co Frontage 10.8 2 23.3 23.2 24.6 23.9 27 27 26 27
Road
Richmond 8.9 2 20.5 18.9 20.0 18.1 26 28 27 30
West park 9.0 2 18.2 22.8 21.0 22.5 35 24 26 24
Bellaire 8.7 2 22.0 20.3 19.9 18.1 24 26 26 29
Bisson net 9.9 2 23.9 25.4 22.5 22.6 24 25 23 23
a Number of travel time runs during each study period.

Table 14. P .M. Off-Peak Period Westbound Travel Times & Speeds: US-59 Corridor in Houston
Average Travel Time
Sample (min}
Route Distance Size a Before During During
(May 1989) (May 1990) (May 1991)
US-59 10.8 4 11.6 11.5 11.3
Mainlanes
b Frontage 10.8 2 27.2 31.8 24.3
Road
Richmond 8.9 2 21.9 20.5 22.1
West park 9.1 2 20.0 23.6 23.0
b Bellaire 8.7 2 21.9 24.1 21.9
Bissonnet 9.9 2 26.7 25.0 25.9
a Number of travel time runs during each study period. b
Taken from July 1988 data.
Average Travel Speed
(mph)
During Before During During
(May 1992) (May 1989) (May 1990) (May 1991)
12.4 56 57 58
b 22.7 24 21 27
21.9 25 26 24
19.7 26 23 24
b 22.4 24 22 24
26.6 22 24 23
During
(May 1992)
53
29
25
28
23
22

I\) a
Table 15. P .M. Peak Period Westbound Travel Times & Speeds: US~59 Corridor in Houston
Average Travel Time
Sample (min)
Route Distance Size a Before During During
(May 1989) (May 1990) (May 1991)
US-59 10.8 5 21.0 20.3 25.0
Mainlanes
b Frontage 10.8 2 30.5 39.1 41.5
Road
Richmond 8.9 2 30.6 23.3 27.5
Westpark 9.1 2 25.4 24.0 24.3
b Bellaire 8.7 2 23.3 29.9 29.5
Bisson net 9.9 2 31.8 31.6 26.0
a Number of travel time runs during each study period. b
Taken from July 1988 data.
Average Travel Speed
(mph)
During Before During During
(May 1992) (May 1989) (May 1990) (May 1991)
18.6 31 31 26
b 32.5 21 21 16
28.4 18 18 19
25.4 21 21 23
b 24.2 23 18 18
27.4 19 19 23
During
(May 1992)
35
20
19
22
24
22

Table 16. Paired t-Test Results for Changes in Travel Time During the Peak Period: US-59 Corridor in Houston
A.M. Peak Period (Eastbound) P.M. Peak Period (Westbound)
During a
During a
During a
During a
During a
During a
Route (May 1990) {May 1991) (May 1992) (May 1990) (May 1991) (May 1992)
df Calculated Critical
df Calculated Critical
df Calculated Critical
df Calculated Critical
df Calculated Critical
df Calculated Critical
t-value t-value t-value t-value t-value t-value t-value t-value t-value t-value t-value t-value
US-59 5 2.513 2.571 5 0.307 2.571 5 0.299 2.571 4 0.627 2.776 4 1.222 2.776 4 1.452 2.776
Main lanes
Frontage 2 2.775 4.303 2 0.848 4.303 2 3.184 4.303 1 1.441 12.706 1 1.599 12.706 1 1.727 12.706
Road
Richmond 1 0.037 12.706 1 0.636 12.706 1 0.125 12.706 1 3.476 12.706 1 2.727 12.706 1 2.263 12.706
Westpark 1 3.526 12.706 1 3.214 12.706 1 0.343 12.706 1 2.051 12.706 1 2.200 12.706 1 2.200 12.706
Bellaire 1 1.444 12.706 1 0.911 12.706 1 1.500 12.706 1 1.928 12.706 1 5.952 12.706 1 0.500 12.706
Bissonnet 1 21.000 12.706 1 2.857 12.706 1 7.667 12.706 1 0.263 12.706 1 6.882 12.706 1 1.459 12.706
aCompared to before construction (May 1989) peak period travel times.
Note: Change in travel times is significant at a = 0.05 if I calculated value I > critical value

I\) I\)
Table 17. Paired t-Test Results for Changes in Travel Time During the Off-Peak Period: US-59 Corridor in Houston
A.M. Off-Peak Period (Eastbound) P.M. Off-Peak Period (Westbound)
During a a a a a a
During During During During During
Route (May 1990) (May 1991) (May 1992) (May 1990) (May 1991) (May 1992)
df Calculated Critical
df Calculated Critical
df Calculated Critical
df Calculated Critical
df Calculated Critical
df Calculated Critical
t-value t-value t-value t-value t-value t-value t-value t-value t-value t-value t-value t-value
US-59 4 0.645 2.776 4 1.789 2.776 4 1.411 2.776 2 0.000 4.303 2 0.846 4.303 2 1.789 4.303
Main lanes
Frontage 1 0.048 12.706 1 0.692 12.706 1 0.277 12.706 1 1.484 12.706 1 1.439 12.706 1 1.187 12.706
Road
Richmond 1 1.737 12.706 1 0.360 12.706 1 1.786 12.706 1 0.871 12.706 1 0.091 12.706 1 0.000 12.706
Westpark 1 15.333 12.706 1 3.235 12.706 1 10.750 12.706 1 1.327 12.706 1 3.750 12.706 1 0.152 12.706
Bellaire 1 0.680 12.706 1 2.100 12.706 1 5.267 12.706 1 1.216 12.706 1 0.040 12.706 1 1.000 12.706
Bisson net 1 1.381 12.706 1 1.074 12.706 1 0.659 12.706 1 4.250 12.706 1 0.714 12.706 1 0.000 12.706
acompared to before construction (May 1989) peak period travel times.
Note: Change in travel times is significant at a =0.05 if !calculated value I >critical value

4. SUMMARY AND CONCLUSIONS
Volumes in the Southwest Freeway corridor were lower than expected during the first phase of reconstruction. Motorists returned to the freeway and volumes returned to expected levels during phases II and Ill. Daily traffic volumes on US-59 were 12 percent lower during the first year of reconstruction than the volumes that would have been expected on the freeway if construction had not occurred. This decrease was probably due to restricted access from construction on the frontage roads and the reconfiguration of the entrance and exit ramps. During phase II volumes were only 2 percent lower than expected, and during phase Ill volumes were 6 percent higher.
Travel times and average speeds experienced only minor variations on the freeway, frontage roads, and alternative routes in the corridor during the US-59 reconstruction project. These changes in travel times and speeds were generally not statistically significant.
The traffic impacts of the US-59 Southwest Freeway reconstruction project are generally consistent with the impacts observed at five other urban freeway reconstruction projects in Texas. There were few significant changes in travel times or speeds at any of the projects, including the Southwest Freeway project. With respect to traffic volumes, the Southwest Freeway experienced a larger percentage decrease in volume during phase I (relative to regional volume patterns) than the other projects. Consistent with experience elsewhere in the state, however, the largest decreases were associated with construction phases that restricted access to the freeway due to reduced capacity on the frontage roads and/or ramp construction.
23

REFERENCES
1. Griffin, L.I. Three Procedures for Evaluation Highway Safety Improvement Programs. Report No. TARE 51. College Station, TX: Texas Transportation Institute, 1982.
2. Tyer, K.D. Operational and Safety Effects of Reconstruction on the North Central Expressway (US-75), Plano, Texas. M.S. Thesis. College Station, TX: Texas A&M University, 1990.
3. Krammes, R.A, K.D. Tyer, G.L. Ullman, J.J. Dale, T.R. Hammons. Travel Impacts of Urban Freeway Reconstruction Projects in Texas. Report No. FHWA/TX-91/1108-3. Austin, TX: State Department of Highways and Public Transportation, September 1990.
4. Box, P.C., and J.C. Oppenlander. Manual of Traffic Engineering Studies. Arlington, VA: Institute of Transportation Engineers, 1976.
24

APPENDIX A.
ANALYSIS OF A.M., OFF, AND P.M. PEAK PERIOD TRAFFIC VOLUMES
25

)> ......
Table A-1. Eastbound A.M. Peak Period Traffic Volumes by Route: US-59 Corridor in Houston
Before During Reconstruction Volumes During Reconstruction Volumes During Reconstruction Volumes
Route May 1989 (May 1990) (May 1991) (May 1992)
Observed Estimatel Observed 6.b Estimatel Observed !:lb Estimatel Observed
Freeway 14955 15292 12303 -2989 16133 13386 -2747 15920 16131
Frontage Road 2479 2535 2659 124 2674 3615 941 2639 2228
Westheimer 14857 15192 9907 -5285 16028 9616 -6412 15816 11002
Richmond 5026 5139 6437 1298 5422 6648 1226 5350 4912
Westpark 7246 7409 5983 -1426 7817 6097 -1720 7714 6193
Bellaire 4721 4827 4838 11 5093 4320 -773 5026 5036
Bissonnet 3827 3913 6914 3001 4129 3785 -344 4074 3318
a Volumes were estimated by adjusting May 1989 before volumes according to the patterns observed at the control locations.
b t. = Observed - Estimated
!:lb
211
-411
-4814
-438
-1521
10
-756

)> I\)
Table A-2. Westbound A.M. Peak Period Traffic Volumes by Route: US-59 Corridor in Houston
Before During Reconstruction Volumes During Reconstruction Volumes During Reconstruction Volumes
Route May 1989 (May 1990) (May 1991) (May 1992)
Observed Estimatel Observed !lb Estimateda Observed !lb Estimateda Observed
Freeway 8930 9131 8857 -274 9634 10107 473 9506 10520
Frontage Road 1388 1419 700 -719 1497 481 -1016 1478 516
Westheimer 2542 2599 2208 -391 2742 2650 -92 2706 2570
Richmond 1089 1114 1341 227 1175 1263 88 1159 1147
Westpark 4899 5009 3535 -1474 5285 3793 -1492 5215 4108
Bellaire 1829 1870 2153 283 1973 1855 -118 1947 1983
Bisson net 886 906 1353 447 956 1139 183 943 1098
a Volumes were estimated by adjusting May 1989 before volumes according to the patterns observed at the control locations.
b !l = Observed - Estimated
!lb
1014
-962
-136
-12
-1107
36
155

Table A-3. Z-Test Statistics for Changes in A.M. Peak Period Traffic Volumes: US-59 Corridor in Houston
During Reconstruction Volumes During Reconstruction Volumes
(May 1990) (May 1991) Route
Eastbound d Westbound Eastbound Westbound
%/ia zb %/la zb % !ia zb % zb
Freeway -20 -14.90 -3 -1.79 -17 -13.05 5 2.90
Frontage Road 5 1.65 -51 -15.02 35 11.06 -68 -21.22
Westheimer -35 -28.00 -15 -5.41 -40 -33.37 -3 -1.19
Richmond 25 11.00 20 4.47 23 10.04 8 1.72
Westpark -19 -11.12 -29 -14.84 -22 -13.00 -28 -14.40
Bellaire 0 0.10 15 4.29 -15 -7.31 -6 -1.82
Bisson net 77 26.23 49 9.12 -8 -3.58 19 3.85
a Percentage change between the estimated and observed during volumes.
bPercentage change (%ti) is significant at a 0.05 if lzl > 1.96
During Reconstruction Volumes
(May 1992)
Eastbound Westbound
% /:;.a zb % 8.a zb
1 0.95 11 6.16
-16 -5.59 -65 -20.16
-30 -24.37 -5 -1.77
-8 -3.96 -1 -0.25
-20 -11.52 -21 -10.56
0 0.09 1 0.55
-19 -8.20 16 3.31

Table A-4. Eastbound Off-Peak Period Traffic Volumes by Route: US-59 Corridor in Houston
Before During Reconstruction Volumes During Reconstruction Volumes During Reconstruction Volumes
Route May 1989 (May 1990) (May 1991) (May 1992)
Observed Estimateda Observed b.b Estimatel Observed b.b Estimateda Observed
Freeway 30625 32543 23839 -8704 32723 31005 -1718 33204 34865
Frontage Road 4629 4917 2359 -2558 4944 6587 1643 5017 9098
Westheimer 20353 21620 12711 -8909 21740 13019 -8721 22060 14380
Richmond 5801 6162 6683 521 6196 6731 535 6288 6095
Westpark 10237 10874 9376 -1498 10935 9570 -1365 11096 10124
Bellaire 8133 8639 8036 -603 8687 7792 -895 8815 8578
Bisson net 4705 4998 3722 -1276 5026 5760 734 5100 5123
a Volumes were estimated by adjusting May 1989 before volumes according to the patterns observed at the control locations.
b !!. = Observed - Estimated
b.b
1661
4081
-7680
-193
-972
-237
23

)> (J1
Table A-5. Westbound Off-Peak Period Traffic Volumes by Route: US-59 Corridor in Houston
Before During Reconstruction Volumes During Reconstruction Volumes During Reconstruction Volumes
Route May 1989 (May 1990) (May 1991) (May 1992)
Observ Estima Observed Ab Estimate! Observed Ab Estimateda Observed
Freeway 28296 30058 23157 -6901 30224 32896 2672 30669 32510
Frontage Road 8272 8787 4436 -4351 8836 3382 -5454 8966 4934
Westheimer 11704 12433 11834 -599 12502 14116 1614 12686 12257
Richmond 6132 6514 6606 92 6550 6664 114 6646 6175
West park 12403 13175 8977 -4198 13248 9620 -3628 13443 9845
Bellaire 7511 7979 8508 529 8023 8180 157 8141 8390
Bisson net 4731 5026 5531 505 5053 5339 286 5128 5326
a Volumes were estimated by adjusting May 1989 before volumes according to the patterns observed at the control locations.
b /:,. = Observed - Estimated
Ab
1841
-4032
-429
-471
-3598
249
198

Table A-6. Z-Test Statistics for Changes in Off-Peak Period Traffic Volumes: US-59 Corridor in Houston
During Reconstruction Volumes During Reconstruction Volumes During Reconstruction Volumes
(May 1990) (May 1991) (May 1992) Route
Eastbound Westbound Eastbound Westbound Eastbound Westbound
zb %Aa zb %Aa z %Aa zb zb %Aa zb
Freeway -27 -29.61 -23 -24.38 -5 -5.37 9 8.41 5 4.96 6 5.78
Frontage Road -52 -28.25 -49 -34.96 33 14.28 -62 -45.15 81 31.30 -45 -31.52
)> 0)
Westheimer -41 -41.51 -5 -3.44 -40 -40.32 13 8.76 -35 -34.46 -3 -2.42
Richmond 8 4.29 1 0.75 9 4.38 2 0.92 -3 -1.61 -7 -3.87
Westpark -14 -9.57 -32 -25.41 -12 -8.64 -27 -21.56 -9 -6.02 -27 -21.11
Bellaire -7 -4.30 7 3.79 -10 -6.42 2 1.14 -3 -1.64 3 1.78
Bisson net 47 19.46 10 4.63 15 6.64 6 2.64 0 0.22 4 1.82
a Percentage change between the estimated and observed during volumes.
bPercentage change (%A) is significant at a= 0.05 if lzl > 1.96
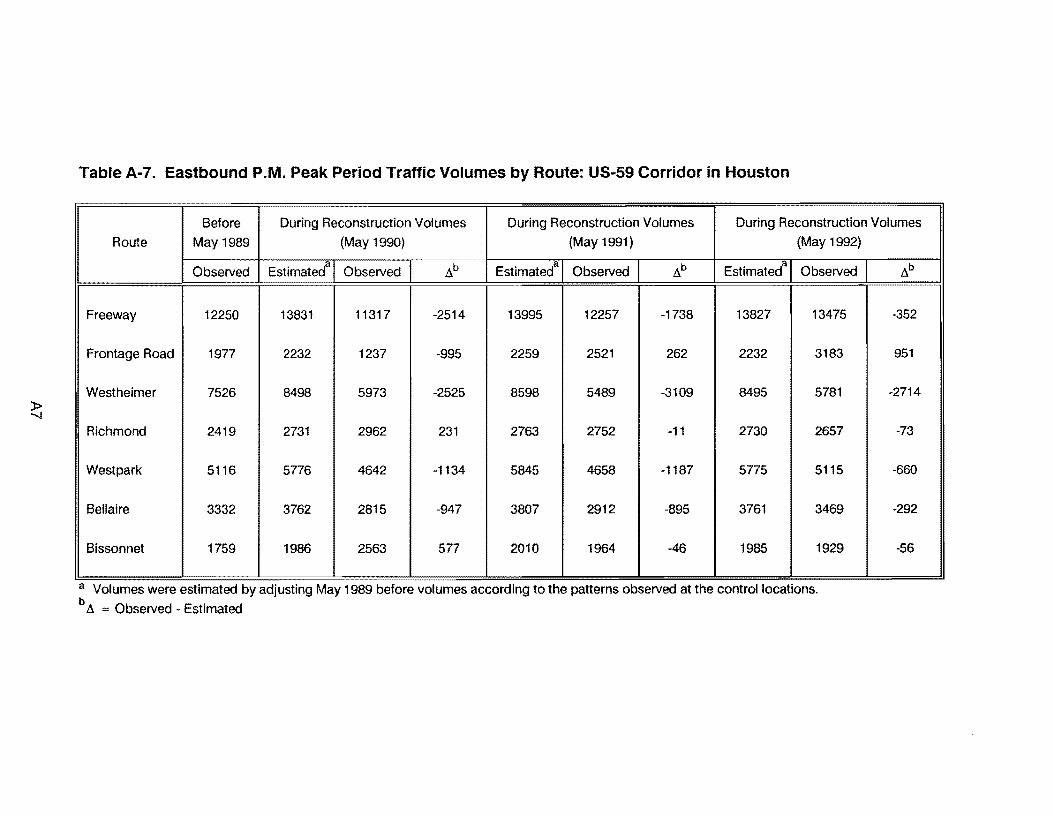
Table A-7. Eastbound P.M. Peak Period Traffic Volumes by Route: US-59 Corridor in Houston
Before During Reconstruction Volumes During Reconstruction Volumes During Reconstruction Volumes
Route May 1989 (May 1990) (May 1991) (May 1992)
Observed Estimatel Observed !::.b Estimateda Observed !::.b Estimatel Observed
Freeway 12250 13831 11317 -2514 13995 12257 -1738 13827 13475
Frontage Road 1977 2232 1237 -995 2259 2521 262 2232 3183
Westhelmer 7526 8498 5973 -2525 8598 5489 -3109 8495 5781
Richmond 2419 2731 2962 231 2763 2752 -11 2730 2657
Westpark 5116 5776 4642 -1134 5845 4658 -1187 5775 5115
Bellaire 3332 3762 2815 -947 3807 2912 -895 3761 3469
Bissonnet 1759 1986 2563 577 2010 1964 -46 1985 1929
a Volumes were estimated by adjusting May 1989 before volumes according to the patterns observed at the control locations.
b ll = Observed - Estimated
!::.b
-352
951
-2714
-73
-660
-292
-56

Table A-8. Westbound P.M. Peak Period Traffic Volumes by Route: US-59 Corridor in Houston
Before During Reconstruction Volumes During Reconstruction Volumes During Reconstruction Volumes
Route May 1989 (May 1990) (May 1991) (May 1992)
-Observed Estimateda Observed 6.b Estimateda Observed ti.b Estimateda I Observed
Freeway 15950 18009 14831 -3178 18221 19629 1408 18003 20447
Frontage Road 4749 5362 3013 -2349 5425 1669 -3756 5360 2635
Westheimer 11467 12947 9583 -3364 13100 11077 -2023 12943 10323
Richmond 6814 7694 6759 -935 7784 6568 -1216 7691 5993
Westpark 8458 9550 5733 -3817 9663 5708 -3955 9547 6389
Bellaire 5272 5953 5937 -16 6023 5072 -951 5951 5898
Bisson net 4043 4565 4444 -121 4619 1934 -2685 4564 3807
a Volumes were estimated by adjusting May 1989 before volumes according to the patterns observed at the control locations.
b A = Observed - Estimated
ti.b
2444
-2725
-2620
-1698
-3158
-53
-757

Table A-9. Z-Test Statistics for Changes in P.M. Peak Period Traffic Volumes: US-59 Corridor in Houston
During Reconstruction Volumes During Reconstruction Volumes
(May 1990) (May 1991) Route
Eastbound Westbound Eastbound Westbound
%Aa zb %t. a zb %Aa zb %Aa zb
Freeway -18 -13.08 -18 -13.89 -12 -8.78 8 5.57
Frontage Road -45 -15.89 -44 -23.38 12 3.53 -69 -39.86
Westheimer -30 -18.44 -26 -18.76 -36 -23.02 -15 -10.77
Richmond 8 2.84 -12 -6.83 0 -0.14 -16 -8.98
West park -20 -10.02 -40 -26.97 -20 -10.41 -41 -27.81
Bellaire -25 -10.80 0 -0.13 -24 -10.06 -16 -8.08
Bisson net 29 7.97 -3 -1.16 -2 -0.68 -58 -30.23
a Percentage change between the estimated and observed during volumes.
bPercentage change (%A) is significant at a = 0.05 if lzl > 1.96
During Reconstruction Volumes
(May 1992)
Eastbound Westbound
%Aa zb %Aa zb
-3 -1.73 14 9.57
43 11.94 -51 -27.74
-32 -19.98 -20 -14.33
-3 0.93 -22 -12.82
-11 -5.68 -33 -21.78
-8 -3.16 -1 -0.43
-3 -0.85 -17 -7.56