Embed Size (px)
Citation preview
Transportation Study PROPOSED MIXED-USE RESIDENTIAL AND COMMERCIAL DEVELOPMENT Brock Street East Township of Uxbridge, Durham Region, ONTARIO November 2017 Project No: NT-17-207
nextrans.ca

November 29, 2017
Re: Transportation Impact Study Brock Street East Township of Uxbridge, Durham Region Our Project No. NT-17-207
Nextrans Consulting Engineers (A Division of NextEng Consulting Group Inc.) is pleased to present the enclosed Transportation Study for the above noted site in support of an Official Plan Amendment and Zoning By-law Amendment application(s).
The subject site is located north of Brock Street East and east of Donland Lane, inclusive, in the Township of Uxbridge. The subject site is currently vacant. Based on the proposed site plan prepared by ICR Associates Incorporated, dated August 2017, the development proposal is to redevelop the existing 49, 714.57 m2 site area to include 94 townhouses and 8 semi-bungalows with loft residential units, a future development block, and a commercial building with GFA of 469.45 m2 and 5 apartment units above. Vehicular access to the site is proposed through a full movement driveway via an extension of Low Boulevard, a full movement driveway via an extension of Herrema Boulevard to Brock Street East, and through a right-in/right-out driveway via Brock Street East.
The study concludes that the development proposal can adequately be accommodated by the existing transportation network with manageable traffic impact to the adjacent public roadways. We trust the enclosed sufficiently addresses your needs. Should you have any questions, please do not hesitate to contact the undersigned.
Yours truly,
Nextrans Consulting Engineers A Division of NextEng Consulting Group Inc.
Prepared by: Reviewed by:
Madeleine Catz, B.Eng., EIT Richard Pernicky, CET, MITE Transportation Analyst Principal
TRAFFIC & TRANSPORTATION | ROADS AND HIGHWAYS | URBAN DEVELOPMENT | ENVIRONMENTAL
520 Industrial Parkway South, Suite 201 Aurora ON L4G 6W8
Phone: 905-503-2563
www.nextrans.ca

NT-17-207 Brock Street East, Township of Uxbridge November 2017 / Page i
EXECUTIVE SUMMARY
NexTrans Consulting Engineers was retained by David Sud (the ‘Client’) to undertake a Transportation Impact Study for an Official Plan Amendment and Zoning By-law Amendment applications in support of a proposed mixed-use residential and commercial development, in the Township of Uxbridge, Ontario. The subject property is located north of Brock Street East and east of Donland Lane, inclusive.
Development Proposal
The development proposal is to redevelop the existing 49, 714.57 m2 site area to include 94 townhouses and 8 semi-bungalows with loft residential units, a future development block with an approximate maximum scenario of 34 apartment units, and a commercial building with GFA of 469.45 m2 and 5 apartment units above. Vehicular access to the site is proposed through a full movement driveway via an extension of Low Boulevard, a full movement driveway via an extension of Herrema Boulevard to Brock Street East, and through a right-in/right-out driveway via Brock Street East.
Traffic Analysis
The proposed development is anticipated to generate 122 two-way trips (33 inbound and 89 outbound) during the AM peak hours and 189 two-way trips (110 inbound and 79 outbound) during the PM peak hours.
The intersection capacity analysis results (based on the methodology and procedures outlined in the Highway Capacity Manual, HCM 2000, published by the Transportation Research Board) indicate that the study area intersections and proposed access are expected to operate with acceptable levels of service.
Access/Parking Review
It is recommended that appropriate signage consisting of STOP signs (Ra-1) and STOP bars be provided throughout the internal road network, and an appropriate barrier to ensure correct vehicle circulation at the right-in/right-out access on Brock Street East, as shown in Figure 7-1.
Based on Township of Uxbridge Zoning By-law 81-19, a total of 238 parking spaces will be required for the proposed mixed-use development. The preliminary site plan provides for a total of 277 parking spaces, which results in a surplus of 39 parking spaces. This surplus is due to the visitor parking provided in the townhouse block, which the zoning by-law does not currently require for townhouse dwelling units. On this basis, the future parking demand with the proposed redevelopment is completely satisfied with the proposed parking provision.
Site Area Review
AutoTURN software was used to generate a vehicular turning template to confirm and demonstrate the accessibility of the proposed loading space and parking spaces. As illustrated in Figure 7-2 and Figure 7-3, the AutoTURN analysis demonstrates that a passenger vehicle (P TAC-1999) and 12-metre Garbage/Emergency vehicle, can effectively maneuver through the parking spaces and loading area.

NT-17-207 Brock Street East, Township of Uxbridge November 2017 / Page ii
TABLE OF CONTENTS
1.0 INTRODUCTION .................................................................................................. 1
2.0 EXISTING TRAFFIC CONDITIONS ..................................................................... 2
2.1. Existing Road Network ........................................................................................ 2
2.2. Existing Active Transportation Network ............................................................ 3
2.3. Active Transportation Mode and Assessment ................................................... 3
2.4. Existing Traffic Volumes ..................................................................................... 4
2.5. Existing Traffic Assessment ............................................................................... 4
3.0 FUTURE BACKGROUND CONDITIONS ............................................................ 5
4.0 SITE TRAFFIC ..................................................................................................... 8
5.0 FUTURE TOTAL TRAFFIC CONDITIONS .......................................................... 9
6.0 PARKING ASSESSMENT ................................................................................. 12
7.0 SITE PLAN REVIEW .......................................................................................... 13
7.1. Site Access .........................................................................................................13
7.2. Loading Requirement and Assessment ............................................................13
7.3. Right Lane Warrant Analysis .............................................................................14
7.4. Left Lane Warrant Analysis ................................................................................14
8.0 TRANSPORTATION DEMAND MANAGEMENT .............................................. 14
8.1. Transit and Active Transportation Mode Assessment .....................................14
9.0 CONCLUSION ................................................................................................... 15

NT-17-207 Brock Street East, Township of Uxbridge November 2017 / Page iii
LIST OF FIGURES
Figure 1-1 Site Location Figure 1-2 Proposed Site Plan Figure 2-1 Existing Amenities and Commercial Establishments Figure 2-2 Existing Traffic Volumes Figure 3-1 Future Background 2021 Full Build Out Traffic Volumes Figure 3-2 Future Background 2026 Full Build Out Traffic Volumes Figure 4-1 Site Generated Traffic Volumes Figure 5-1 Future Total 2021 Traffic Volumes Figure 5-2 Future Total 2026 Traffic Volumes Figure 7-1 Signage, Pavement Markings, and Functional Plan Figure 7-2 AutoTURN – Maneuverability Demonstration (P TAC-1999) Figure 7-3 AutoTURN – Maneuverability Demonstration (12m Garbage/Emergency)
LIST OF TABLES
Table 2.1 – Level of Service – Existing Traffic Assessments Table 3.1 – Future Background 2021 Full Build Out Traffic Assessments Table 3.2 – Future Background 2026 Full Build Out Traffic Assessments Table 4.1 – Site Traffic Trip Generation (Based on ITE) Table 4.2 – Site Traffic Trip Distribution Table 5.1 – Level of Service – Future Total 2021 Traffic Assessments Table 5.2 – Level of Service – Future Total 2026 Traffic Assessments Table 5.3 – Probable Signal Timing Table 5.4 – Level of Service – Future Total 2026 Traffic Assessments with Traffic Signal Table 6.1 – Vehicle Parking Requirements (ZBL 81-19)
APPENDICES
Appendix A – Terms of Reference Appendix B – Proposed Site Plan Appendix C – Existing Traffic Data Appendix D – Existing Traffic Level of Service Calculations Appendix E – Future Background Level of Service Calculations Appendix F – Email Response from the Township of Uxbridge Appendix G – TTS Data Appendix H – Future Total Traffic Level of Service Calculations Appendix I – Future Total 2026 with Traffic Signal Level of Service Calculations Appendix J – York Region Typical Right Turn In/Right Turn Out Design Standard Appendix K – Left Turn Lane Warrant Nomograph Appendix L – Transit Route Services
Transportation Impact Study
NT-17-207 Brock Street East, Township of Uxbridge November 2017 / Page 1
1.0 INTRODUCTION
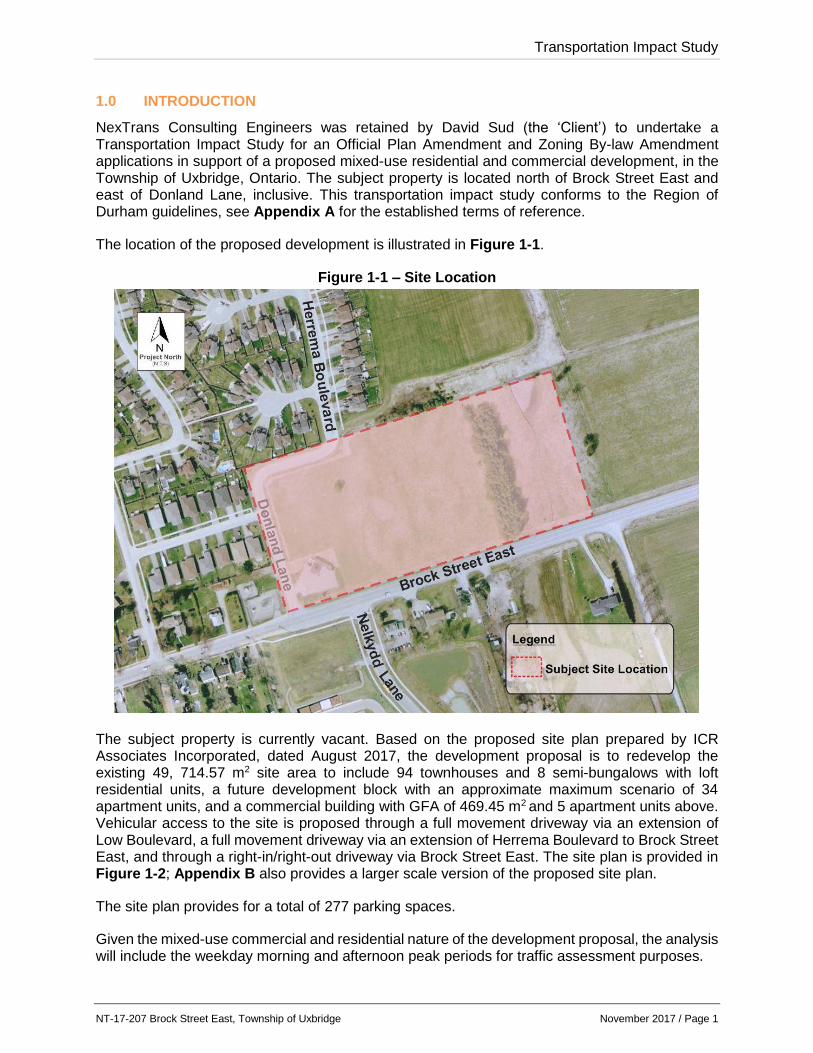
NexTrans Consulting Engineers was retained by David Sud (the ‘Client’) to undertake a Transportation Impact Study for an Official Plan Amendment and Zoning By-law Amendment applications in support of a proposed mixed-use residential and commercial development, in the Township of Uxbridge, Ontario. The subject property is located north of Brock Street East and east of Donland Lane, inclusive. This transportation impact study conforms to the Region of Durham guidelines, see Appendix A for the established terms of reference.
The location of the proposed development is illustrated in Figure 1-1.
Figure 1-1 – Site Location
The subject property is currently vacant. Based on the proposed site plan prepared by ICR Associates Incorporated, dated August 2017, the development proposal is to redevelop the existing 49, 714.57 m2 site area to include 94 townhouses and 8 semi-bungalows with loft residential units, a future development block with an approximate maximum scenario of 34 apartment units, and a commercial building with GFA of 469.45 m2 and 5 apartment units above. Vehicular access to the site is proposed through a full movement driveway via an extension of Low Boulevard, a full movement driveway via an extension of Herrema Boulevard to Brock Street East, and through a right-in/right-out driveway via Brock Street East. The site plan is provided in Figure 1-2; Appendix B also provides a larger scale version of the proposed site plan.
The site plan provides for a total of 277 parking spaces.
Given the mixed-use commercial and residential nature of the development proposal, the analysis will include the weekday morning and afternoon peak periods for traffic assessment purposes.

Transportation Impact Study
NT-17-207 Brock Street East, Township of Uxbridge November 2017 / Page 2
Figure 1-2 – Proposed Site Plan
2.0 EXISTING TRAFFIC CONDITIONS
2.1. Existing Road Network
The existing subject lands are located north of Brock Street East and east of Donland Lane, inclusive, in the Town of Uxbridge. The existing road network is described as follows:
Brock Street East: is classified as an east-west arterial road under the jurisdiction of the Region of Durham. In the study area, it has an existing two-lane cross section and posted speed limit of 50 km/h. Brock Street East is unsignalized at Donland Lane and Nelkydd Lane with a warranted right-turn lane on approach to Nelkydd Lane. Herrema Boulevard: is classified as a north-south local road under the jurisdiction of the Township of Uxbridge. In the study area, it has an existing two-lane cross section and posted speed limit of 50 km/h. Herrema Boulevard is a continuation of Donland Lane into the existing residential neighbourhood. Donland Lane: is classified as a north-south local road under the jurisdiction of the Township of Uxbridge. In the study area, it has an existing two-lane cross section and posted speed limit of 50 km/h. Donland Lane is STOP controlled on approach to Brock Street East. Donland Lane also becomes Herrema Boulevard just north of Low Boulevard.

Transportation Impact Study
NT-17-207 Brock Street East, Township of Uxbridge November 2017 / Page 3
2.2. Existing Active Transportation Network
Sidewalks
The area surrounding the proposed development is serviced with dedicated sidewalks on the
south side of Brock Street East and on the east side of Herrema Boulevard.
Bicycle Lanes
There are no dedicated bicycle lanes within the vicinity of the subject site.
2.3. Active Transportation Mode and Assessment
Existing Amenities
The review of the area surrounding the proposed development indicates numerous recreational
facilities, houses of worship, and schools, many of which can be easily reached by pedestrian
traffic and non-auto options. Figure 2-1 illustrates the location of the existing amenities which
include Uxbridge Secondary School, Uxbridge & Area Swimming Pool, Trinity United Church etc.
Existing Commercial Establishments
The review of the area surrounding the proposed development indicates numerous retail, food,
and service establishments, many of which can be easily reached by pedestrian traffic and non-
auto options. The Uxbridge Shopping Centre is located approximately 2.8 km (about an 11-minute
bike ride) from the site. Figure 2-1 illustrates the location of existing retail, food and service
establishments from the proposed development. Amenities include TD Canada Trust, Pizza
Pizza, Mac’s, etc.
Figure 2-1 – Existing Amenities and Commercial Establishments

Transportation Impact Study
NT-17-207 Brock Street East, Township of Uxbridge November 2017 / Page 4
2.4. Existing Traffic Volumes
Existing traffic volumes at the study area intersections of Brock Street East with Donland Lane, Brock Street East with Nelkydd Lane, and Low Boulevard and Donland Lane were undertaken by Spectrum Traffic on behalf of NexTrans Consulting Engineers on Tuesday October 24th, 2017, during the morning (7:00 a.m. to 10:00 a.m.) and afternoon (4:00 p.m. to 7:00 p.m.) peak periods. Detailed traffic data sheets are provided in Appendix C.
2.5. Existing Traffic Assessment
The existing volumes are illustrated in Figure 2-2, and were analyzed using Synchro 10 software. The methodology of the software follows the procedures described and outlined in the Highway Capacity Manual, HCM 2000, published by the Transportation Research Board. The detailed results are provided in Appendix D and summarized in Table 2.1.
Figure 2-2 – Existing Traffic Volumes

Transportation Impact Study
NT-17-207 Brock Street East, Township of Uxbridge November 2017 / Page 5
Table 2.1 – Level of Service – Existing Traffic Assessments
Intersection Movement
Weekday AM Peak Hour Weekday PM Peak Hour
LOS (v/c)
Delay
(s)
Queue (95th m)
LOS (v/c)
Delay
(s)
Queue (95th m)
Brock Street East &
Nelkydd Lane
WBLT NBLR
A (0.08) C (0.26)
2.5 15.7
2.0 8.1
A (0.01) B (0.17)
0.6 13.2
0.3 4.8
Brock Street East &
Donland Lane
EBLT SBLR
A (0.04) C (0.21)
1.3 13.9
0.9 5.1
A (0.04) B (0.09)
1.3 13.0
1.1 2.3
Donland Lane & Low Boulevard
EBLR NBLT
A (0.01) A (<0.01)
8.8 0.8
0.2 0.1
A (0.01) -
8.5 -
0.2 -
As summarized in Table 2.1, under existing conditions the study area intersections are operating at excellent levels of service with no critical movements identified. The intersections are operating at overall ‘LOS C’ or better during the peak hour time periods.
3.0 FUTURE BACKGROUND CONDITIONS
The future background 2021 full build out traffic volumes and the future background 2026 horizon
year traffic volumes are provided in Figure 3-1 and Figure 3-2, respectively. Table 3.1 and Table
3.2 summarize the level of service at the given intersections under future background full build
out, and horizon year traffic conditions. Using the Region of Durham historic AADT statistics
available between the years of 2007-2015 for ATR station 7402, a conservative background
growth rate of 1% was applied to the traffic assessment. This is due to the AADT statistics
fluctuating between increasing and decreasing growth, thus a 1% growth rate is representative
since the traffic is relatively steady and within similar range throughout the years. Detailed output
analysis can be found in Appendix E.
When establishing the terms of reference, the Region of Durham stated to include any future
developments within the vicinity of the area. After speaking with the Township of Uxbridge, they
have not received any applications for future developments at this time thus, no additional
information on proposed developments was available so, if any are proposed, they were not
included in our trip generation model, see Appendix F.

Transportation Impact Study
NT-17-207 Brock Street East, Township of Uxbridge November 2017 / Page 6
Figure 3-1 – Future Background 2021 Full Build Out Traffic Volumes
Table 3.1: Future Background 2021 Full Build Out Traffic Assessments
Intersection Movement
Weekday AM Peak Hour Weekday PM Peak Hour
LOS (v/c)
Delay
(s)
Queue (95th m)
LOS (v/c) Delay
(s)
Queue (95th m)
Brock Street East &
Nelkydd Lane
WBLT NBLR
A (0.08) C (0.26)
2.4 16.1
2.0 8.4
A (0.01) B (0.18)
0.6 13.8
0.3 5.1
Brock Street East &
Donland Lane
EBLT SBLR
A (0.04) C (0.22)
1.2 16.2
0.9 6.5
A (0.04) B (0.09)
1.3 13.6
1.1 2.4
Donland Lane & Low Boulevard
EBLR NBLT
A (0.01) A (<0.01)
8.8 0.7
0.2 0.1
A (<0.01) -
0 -
0 -

Transportation Impact Study
NT-17-207 Brock Street East, Township of Uxbridge November 2017 / Page 7
Figure 3-2 – Future Background 2026 Full Build Out Traffic Volumes
Table 3.2: Future Background 2026 Horizon Year Traffic Assessments
Intersection Movement
Weekday AM Peak Hour Weekday PM Peak Hour
LOS (v/c)
Delay
(s)
Queue (95th m)
LOS (v/c) Delay
(s)
Queue (95th m)
Brock Street East &
Nelkydd Lane
WBLT NBLR
A (0.08) C (0.27)
2.4 16.5
2.0 8.7
A (0.01) B (0.18)
0.5 14.2
0.3 5.3
Brock Street East &
Donland Lane
EBLT SBLR
A (0.04) C (0.23)
1.2 16.9
1.0 6.2
A (0.04) B (0.09)
1.3 13.6
1.1 2.5
Donland Lane & Low Boulevard
EBLR NBLT
A (0.01) A (<0.01)
8.8 0.7
0.2 0.1
A (<0.01) -
0 -
0 -
Transportation Impact Study
NT-17-207 Brock Street East, Township of Uxbridge November 2017 / Page 8
As summarized in Table 3.1 and Table 3.2, it is shown that during future background traffic conditions the subject study area intersections continue to operate at acceptable levels of service with no changes to expected operations. During future background traffic conditions, the intersections are operating at overall LOS 'C' during the peak hour periods.
4.0 SITE TRAFFIC
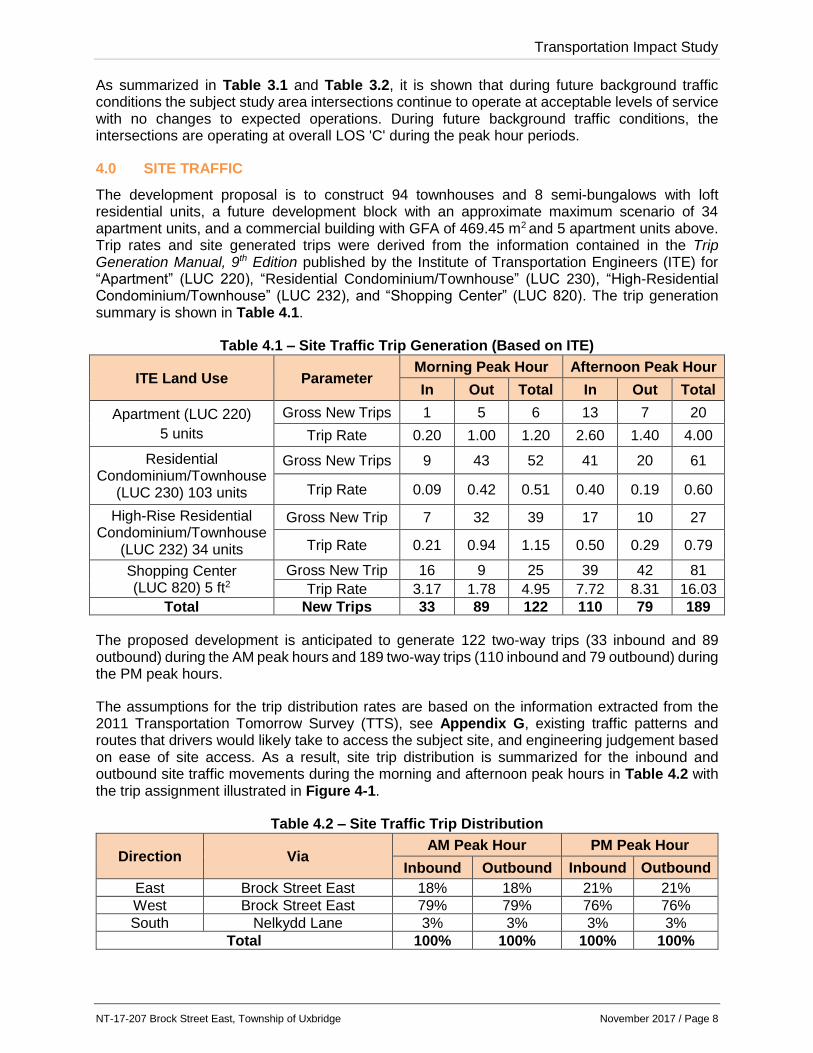
The development proposal is to construct 94 townhouses and 8 semi-bungalows with loft residential units, a future development block with an approximate maximum scenario of 34 apartment units, and a commercial building with GFA of 469.45 m2 and 5 apartment units above. Trip rates and site generated trips were derived from the information contained in the Trip Generation Manual, 9th Edition published by the Institute of Transportation Engineers (ITE) for “Apartment” (LUC 220), “Residential Condominium/Townhouse” (LUC 230), “High-Residential Condominium/Townhouse” (LUC 232), and “Shopping Center” (LUC 820). The trip generation summary is shown in Table 4.1.
Table 4.1 – Site Traffic Trip Generation (Based on ITE)
ITE Land Use Parameter Morning Peak Hour Afternoon Peak Hour
In Out Total In Out Total
Apartment (LUC 220)
5 units
Gross New Trips 1 5 6 13 7 20
Trip Rate 0.20 1.00 1.20 2.60 1.40 4.00
Residential Condominium/Townhouse
(LUC 230) 103 units
Gross New Trips 9 43 52 41 20 61
Trip Rate 0.09 0.42 0.51 0.40 0.19 0.60
High-Rise Residential Condominium/Townhouse
(LUC 232) 34 units
Gross New Trip 7 32 39 17 10 27
Trip Rate 0.21 0.94 1.15 0.50 0.29 0.79
Shopping Center (LUC 820) 5 ft2
Gross New Trip 16 9 25 39 42 81
Trip Rate 3.17 1.78 4.95 7.72 8.31 16.03
Total New Trips 33 89 122 110 79 189
The proposed development is anticipated to generate 122 two-way trips (33 inbound and 89 outbound) during the AM peak hours and 189 two-way trips (110 inbound and 79 outbound) during the PM peak hours.
The assumptions for the trip distribution rates are based on the information extracted from the 2011 Transportation Tomorrow Survey (TTS), see Appendix G, existing traffic patterns and routes that drivers would likely take to access the subject site, and engineering judgement based on ease of site access. As a result, site trip distribution is summarized for the inbound and outbound site traffic movements during the morning and afternoon peak hours in Table 4.2 with the trip assignment illustrated in Figure 4-1.
Table 4.2 – Site Traffic Trip Distribution
Direction Via AM Peak Hour PM Peak Hour
Inbound Outbound Inbound Outbound
East Brock Street East 18% 18% 21% 21%
West Brock Street East 79% 79% 76% 76%
South Nelkydd Lane 3% 3% 3% 3%
Total 100% 100% 100% 100%

Transportation Impact Study
NT-17-207 Brock Street East, Township of Uxbridge November 2017 / Page 9
Figure 4-1 – Site Generated Traffic Volumes
5.0 FUTURE TOTAL TRAFFIC CONDITIONS
The forecasted 2021 and 2026 future total traffic volumes (future background traffic volumes plus site generated traffic volumes) are illustrated in Figure 5-1 and Figure 5-2, and were analyzed using Synchro 10 software. The detailed calculations are provided in Appendix H and summarized in Table 5.1 and Table 5.2.

Transportation Impact Study
NT-17-207 Brock Street East, Township of Uxbridge November 2017 / Page 10
Figure 5-1 – Future Total 2021 Traffic Volumes
Table 5.1 – Level of Service – Future Total 2021 Traffic Assessments
Intersection Movement
Weekday AM Peak Hour Weekday PM Peak Hour
LOS (v/c)
Delay
(s)
Queue (95th m)
LOS (v/c)
Delay
(s)
Queue (95th m)
Brock Street East & Nelkydd
Lane/Herrema Boulevard
EBL WBL NBL
NBTR SBL
SBTR
A (0.04) A (0.08) D (0.41) A (0.04) C (0.22) B (0.15)
8.1 8.3
34.6 9.9
23.2 12.4
1.0 2.0 14.9 1.1 6.9 4.2
A (0.11) A (0.01) D (0.31) B (0.05) C (0.15) B (0.13)
8.1 8.4
34.1 12.2 24.8 11.4
2.8 0.2
10.1 1.4 4.3 3.5
Brock Street East & Site Access
SBR B (0.03) 10.4 0.8 A (0.01) 9.5 0.3
Herrema Boulevard & Low
Boulevard
EBLTR WBLTR NBLTR
A (0.02) A (0.03)
A (<0.01)
8.7 9.5 0.9
0.6 0.7 0.1
A (0.01) A (0.01) A (0.01)
8.5 9.6 1.0
0.2 0.3 0.2
Herrema Boulevard &
Internal Driveway
EBLTR WBLTR NBLTR
A (0.02) A (0.02)
A (<0.01)
8.9 9.8 0.5
0.4 0.5 0.1
A (<0.01) B (0.07) A (0.01)
8.6 10.3 0.5
0.1 1.9 0.2
Low Boulevard & Internal Driveway
WBLT NBLR
A (<0.01) A (0.02)
4.3 8.4
0.0 0.4
A (0.01) A (<0.01)
7.2 8.3
0.1 0.1

Transportation Impact Study
NT-17-207 Brock Street East, Township of Uxbridge November 2017 / Page 11
Figure 5-2 – Future Total 2026 Traffic Volumes
Table 5.2 – Level of Service – Future Total 2026 Traffic Assessments
Intersection Movement
Weekday AM Peak Hour Weekday PM Peak Hour
LOS (v/c) Delay
(s)
Queue (95th m)
LOS (v/c)
Delay
(s)
Queue (95th m)
Brock Street East & Nelkydd
Lane/Herrema Boulevard
EBL WBL NBL
NBTR SBL
SBTR
A (0.04) A (0.08) E (0.43) A (0.04) C (0.23) B (0.16)
8.1 8.4
36.8 10.0 24.2 12.6
1.0 2.0
15.9 1.1 7.1 4.5
A (0.11) A (0.01) E (0.33) B (0.06) D (0.16) B (0.13)
8.1 8.4
36.4 12.4 26.0 11.6
2.8 0.2
10.8 1.4 4.5 3.6
Brock Street East & Site Access
SBR B (0.03) 10.5 0.8 A (0.01) 9.6 0.3
Herrema Boulevard & Low
Boulevard
EBLTR WBLTR NBLTR
A (0.02) A (0.03)
A (<0.01)
8.7 9.6 0.9
0.6 0.7 0.1
A (0.01) A (0.01) A (0.01)
8.5 9.6 1.0
0.2 0.3 0.2
Herrema Boulevard &
Internal Driveway
EBLTR WBLTR NBLTR
A (0.02) A (0.02)
A (<0.01)
8.9 9.9 0.5
0.4 0.5 0.1
A (<0.01) B (0.07) A (0.01)
8.6 10.3 0.5
0.1 1.9 0.2
Low Boulevard & Internal Driveway
WBLT NBLR
A (<0.01) A (0.02)
4.3 8.4
0.0 0.4
A (0.01) A (<0.01)
7.2 8.3
0.1 0.1

Transportation Impact Study
NT-17-207 Brock Street East, Township of Uxbridge November 2017 / Page 12
Under future total traffic conditions, the study intersections, proposed right-in/right-out access via Brock Street East, and internal road network are expected to operate at acceptable levels of service during both peak periods.
The intersection of Brock Street East and Nelkydd Lane/Herrema Boulevard was analysed as a two way stop control, during future total 2026 conditions. The lane configuration allows for future signal operations to be implemented at the intersection thus, further analysis of a possible traffic light with advanced left turn signals at the intersection was analyzed, see Appendix I.
Table 5.3 – Probable Signal Timing
Intersection Movement Split (s) Yellow
Time (s) All-Red Time (s)
Cycle Length (s)
Brock Street East & Nelkydd Lane/Herrema
Boulevard
EB/WB NB/SB
34.5 45.5
3.5 3.5
1.0 1.0
80
Table 5.4 – Level of Service – Future Total 2026 Traffic Assessments with Traffic Signal
Intersection Movement
Weekday AM Peak Hour Weekday PM Peak Hour
LOS (v/c) Delay
(s)
Queue (95th m)
LOS (v/c)
Delay
(s)
Queue (95th m)
Brock Street East & Nelkydd
Lane/Herrema Boulevard
(Signalized)
OVERALL EBL EBT EBR WBL WBT WBR NBL
NBTR SBL
SBTR
C (0.36) C (0.27) C (0.51) C (0.13) C (0.29) D (0.81) C (0.01) A (0.12) B (0.03) C (0.13) C (0.07)
27.3 23.7 28.2 24.9 21.1 38.6 22.7 8.8
11.8 20.1 22.1
- 11.8 45.2 0.0
12.4 84.2 0.0
12.3 5.3
10.0 12.3
C (0.38) C (0.44) D (0.82) C (0.06) C (0.07) C (0.57) C (0.03) A (0.08) B (0.02) C (0.08) C (0.06)
28.3 20.3 37.8 21.3 24.1 29.7 24.3 9.4
12.1 21.4 23.0
- 27.1 113.1 0.0 2.7
53.9 0.0 9.0 5.2 6.6
11.8
Brock Street East & Site Access
SBR B (0.03) 10.5 0.8 A (0.01) 9.6 0.3
Herrema Boulevard & Low
Boulevard
EBLTR WBLTR NBLTR
A (0.02) A (0.03)
A (<0.01)
8.7 9.6 0.9
0.6 0.7 0.1
A (0.01) A (0.01) A (0.01)
8.5 9.6 1.0
0.2 0.3 0.2
Herrema Boulevard &
Internal Driveway
EBLTR WBLTR NBLTR
A (0.02) A (0.02)
A (<0.01)
8.9 9.8 0.5
0.4 0.5 0.1
A (<0.01) B (0.07) A (0.01)
8.6 10.0 0.5
0.1 1.8 0.2
Low Boulevard & Internal Driveway
WBLT NBLR
A (<0.01) A (0.02)
4.3 8.4
0.0 0.4
A (0.01) A (<0.01)
7.2 8.3
0.1 0.1
Under the future total 2026 conditions a signalized intersection at Brock Street East and Nelkydd Lane/Herrema Boulevard is expected to operate at acceptable levels of service.
6.0 PARKING ASSESSMENT
The Township of Uxbridge Zoning By-law No. 81-19 has been adopted by the Council of the
Corporation of the Township of Uxbridge and has been updated in December 2016. It is a
comprehensive By-law covering the entire amalgamated Township of Uxbridge. Based on the
information contained in the Zoning By-law, the subject site is located in zone ‘C6 – Brock Street

Transportation Impact Study
NT-17-207 Brock Street East, Township of Uxbridge November 2017 / Page 13
East Mixed Use’. The technical parking requirement for the proposed development is detailed in
Table 6.1.
Table 6.1 – Vehicle Parking Requirements (ZBL 81-19)
Use GFA / Units Rate Parking
Requirement Parking
Provided Difference
Commercial 469.45 m2 5.5 spaces per
100 m2 26 26 0
Apartment (above
commercial) 5 1.5 spaces/unit 8 8 0
Townhouse and Semi-Bungalow
102 2 space/unit 204 243 +39
Total 238 277 +39
Based on Township of Uxbridge Zoning By-law 81-19, a total of 238 parking spaces will be required for the proposed mixed-use development. The preliminary site plan provides for a total of 277 parking spaces, which results in a surplus of 39 parking spaces. This surplus is due to the visitor parking provided in the townhouse block, which the zoning by-law does not currently require for townhouse dwelling units.
7.0 SITE PLAN REVIEW
7.1. Site Access
According to the proposed site plan, access to the site is provided through an extension of Herrema Boulevard, eliminating Donland Lane, and reaching Brock Street East. Low Boulevard will also be extended to intersect with Herrema Boulevard, this provides two full movement driveways to access the proposed future development building. The semi-bungalow units will be accessed via Low Boulevard, and both the commercial and townhouse blocks will be accessed via the extension of Herrema Boulevard. In addition, there will be a right-in/right-out site entrance at the east end of the site via Brock Street East which also provides a secondary ease of access for emergency vehicles. In accordance with Ontario Traffic Manual (OTM) Book 5, we recommend appropriate signage consisting of STOP signs (Ra-1) and STOP bars throughout the internal road network as exhibited in Figure 7-1. It is recommended that the most eastern access via Brock Street East be a channelized right-in/right-out entrance/exit for vehicles through the addition of a concrete barrier. Appropriate signage will be used to control vehicles to obey the right-in/right-out movements only and prevent vehicles traveling in the westbound direction on Brock Street East from turning left into the site. A similar design to York Region’s “Typical Right Turn In/Right Turn Out” design standard was utilized, see Appendix J.
7.2. Loading Requirement and Assessment
AutoTURN software was used to generate a vehicular turning template to confirm and demonstrate the accessibility of the proposed loading space and parking spaces. As illustrated in Figure 7-2 and Figure 7-3, the AutoTURN analysis demonstrates that a passenger vehicle (P TAC-1999) and 12-metre Garbage/Emergency vehicle, can effectively maneuver through the parking spaces and loading area.

Transportation Impact Study
NT-17-207 Brock Street East, Township of Uxbridge November 2017 / Page 14
7.3. Right Lane Warrant Analysis
Abiding by the Region of Durham guidelines, the consideration for right turn lanes on Brock Street East were analysed. The proposed site plan considers the addition of a westbound right turn lane at Herrema Boulevard/Nelkydd Lane which will allow free flow of through volumes at all times on Brock Street East. Moreover, due to the low traffic volumes using the right-in/right-out access a right turn lane is not required.
7.4. Left Lane Warrant Analysis
Due to the volume of left turning vehicles on Brock Street East at the Herrema Boulevard/Nelkydd Lane new intersection into the site, a left-turn lane warrant analysis was made based on the review and application of the Ministry of Transportation Ontario's (MTO) Geometric Design Standards for Ontario Highways and the applicable nomographs.
The traffic volumes projected in Figure 5-2 at the proposed vehicular entrance at Brock Street East and Herrema Boulevard/Nelkydd Lane, indicate the site access may experience high left turning traffic volumes during the weekday peak hour periods. As a result, the 2026 future total traffic volumes during the morning peak hour in the westbound left-turn lane and the afternoon peak hour in the eastbound left-turn lane will be assessed as the worst-case scenarios.
The projected traffic volumes intersect above the warrant line area of the nomograph (see Appendix K) and on this basis, an eastbound and westbound left turn lane are warranted thus, the proposed intersection lane configuration is acceptable.
8.0 TRANSPORTATION DEMAND MANAGEMENT
Transportation demand management (TDM) refers to variety of strategies to reduce congestion, minimize the number of single-occupant vehicles, encourage non-auto modes of travel, and reduce vehicle dependency to create a sustainable transportation system. Typically, TDM strategies are for residential and office developments where large quantities of people congregate in one origin or destination. Pedestrian sidewalks will be provided on both sides of the roadways, and sidewalk connectivity is provided throughout the proposed municipal road to ensure a complete sidewalk network.
8.1. Transit and Active Transportation Mode Assessment
The proposed development is situated in a transit supportive neighbourhood with bus stops located approximately 6-minutes to the subject site within comfortable walking distance. The route services are illustrated in Appendix L. The route services in the immediate area are described below:
• 950 Reach – Simcoe North: The 950 Reach – Simcoe North bus route operates approximately every hour apart from only one stop between 11:00am and 3:00pm between the Welwood Plaza and UOIT/DC North Campus, generally in a north-south direction. The 950 Reach – Simcoe North bus route provides service 6 days a week. Weekend service is offered only on Saturdays and operates approximately every two (2) hours. Accessible service and bike racks are provided on the route.
• 601 Brock – Uxbridge: The 601 Brock – Uxbridge bus route operates three to four times per day from 4:00pm to 7:00pm, between 9 Mile Road at Lakeview Mannor and the Welwood Plaza, generally in an north-south direction. The 601 Brock – Uxbridge bus route

Transportation Impact Study
NT-17-207 Brock Street East, Township of Uxbridge November 2017 / Page 15
provides service from Monday to Friday. Accessible service and bike racks are provided on this route.
9.0 CONCLUSION
The findings and conclusions of our analysis are as follows:
• The development proposal is to redevelop the existing 49, 714.57 m2 site area to include 95 townhouses and 8 semi-bungalows with loft residential units, a future development block with an approximate maximum scenario of 34 apartment units, and a commercial building with GFA of 469.45 m2 and 5 apartment units above. Vehicular access to the site is proposed through a full movement driveway via and extension of Low Boulevard, a full movement driveway via an extension of Herrema Boulevard to Brock Street East, and through a right-in/right-out driveway via Brock Street East.
• The proposed development is anticipated to generate 122 two-way trips (33 inbound and 89 outbound) during the AM peak hours and 189 two-way trips (110 inbound and 79 outbound) during the PM peak hours.
• The intersection capacity analysis results (based on the methodology and procedures outlined in the Highway Capacity Manual, HCM 2000, published by the Transportation Research Board) indicate that the study intersection and access are expected to continue to operate with acceptable levels of service.
• Based on Township of Uxbridge Zoning By-law 81-19, a total of 238 parking spaces will be required for the proposed mixed-use development. The preliminary site plan provides for a total of 277 parking spaces, which results in a surplus of 39 parking spaces. This surplus is due to the visitor parking provided in the townhouse block, which the zoning by-law does not currently require for townhouse dwelling units. On this basis, the future parking demand with the proposed redevelopment is completely satisfied with the proposed parking provision.
• To ensure safe traffic operation in the area, it is recommended that appropriate internal signage consisting of STOP signs (Ra-1) and STOP bars be provided throughout the internal network, and an appropriate barrier to ensure correct vehicle circulation at the right-in/right-out access on Brock Street East, see Figure 7-1.
• Left and right turn lanes are warranted on Brock Street East.
• The proposed study area/loading space is accessible from a circulation perspective.

LEGEND
STOP SIGN
(Ra-1)
NO LEFT
TURN (Rb-12)
DO NOT
ENTER (Rb-19)
KEEP RIGHT
(Rb-25)
9
.
5
6
4
N
1
°
3
1
'4
0
"W
R
=
1
2
3
.2
5
0
5.479
6.000
20.000
N6°11'00"W
R=
123.250
N16°25'10"W
25.773
50.292
12.079
0.117
N73°50'20"E
20.000
N73°40'50"E
38.616
2.760
SUBJECT TO EASEMENT AS IN UX15154
N75°11'50"E
29.665
N75°11'50"E
22.342
1
2
.
5
4
6
10.063
SU
BJE
CT
TO
EA
SE
ME
NT
SU
BJE
CT
T
O E
AS
EM
EN
T A
S IN
4
49
55
98
BY
LA
W
HIG
HW
AY
PU
BLIC
AS
DE
DIC
AT
ED
97-006,
IN
ST
.
LT
795744
SUBJECT
TO
EASEMENT
AS
IN
TU7669
STOP Sign
(Ra-1)
STOP Bar
STOP Sign
(Ra-1)
STOP Bar
No Left Turn
(Rb-12)
Do Not Enter
(Rb-19)
STOP Sign
(Ra-1)
Keep Right
(Rb-25)
STOP Bar
No Left Turn
(Rb-12)
Barrier Concrete Curb
R
=
2
0
R
=
2
0
M.C
CHECKED BY:
DESIGN BY:
KEY PLAN
NTS
SCALE:
PROJECT NO.
DRAWING NO.
DRAWN BY:
M.C
R.P.
NT-17-207
DATE: November 17, 2017
Figure 7-1

A.S.
CHECKED BY:
DESIGN BY:
KEY PLAN
NTS
SCALE:
PROJECT NO.
DRAWING NO.
DRAWN BY:
A.S.
R.P.
NT-17-207
DATE: November 28, 2017
Figure 7-2

A.S.
CHECKED BY:
DESIGN BY:
KEY PLAN
NTS
SCALE:
PROJECT NO.
DRAWING NO.
DRAWN BY:
A.S.
R.P.
NT-17-207
DATE: November 28, 2017
Figure 7-3

Appendix A - Terms of Reference

TRAFFIC & TRANSPORTATION | ROADS AND HIGHWAYS | URBAN DEVELOPMENT | ENVIRONMENTAL
520 Industrial Parkway South, Suite 201 Aurora ON L4G 6W8
Phone: 905-503-2563
www.nextrans.ca
Terms of Reference To: Jeff Almeida, Development Approvals Division, Region of Durham
From: Madeleine Catz, B.Eng., E.I.T., Transportation Analyst, Nextrans Consulting Engineers
cc: David Sud
Date: October 17, 2017
Re: Brock Street, Proposed Mixed-use Residential and Commercial Development – TOR for Transportation Impact Study and Transportation Demand Management Options
This memo has been prepared to outline (for the Region’s review and approval) the intended scope of work for a transportation impact study and transportation demand management (TDM) options report for the proposed mixed-use development located northeast of Brock Street East and Donland Lane in the Township of Uxbridge, Durham Region.
The following text outlines the intended scope for a transportation impact study and TDM options for the Brock Street East mixed-use development. Our transportation impact study will conform to the Regional Municipality of Durham “Traffic Impact Study Guidelines” which will include the following study parameters:
• Definition of the Study Area
• Necessary Data Requirements
• Background Traffic Forecast
• Site Trip Generation and Modal Split Assumptions
• Site Trip Distribution
• Site Trip Assignment and Total Traffic Forecasts
• Traffic Analysis
• Community Impact Analysis
• Findings and Recommendations
Introduction The report introduction will include:
1. Description of the study area 2. Description of nature of application 3. Description of proposed development and land use

2
Access to the site is envisioned through three locations. First, via an extension of Low Boulevard, second is through an extension of Herrema Boulevard via Brock Street East, and third is through a proposed Right-In/Right-Out driveway via Brock Street East which may act as a secondary emergency entrance.
Existing Traffic Assessment
The existing conditions within the study area will be summarized and documented. This will include, but not limited to:
• Description of existing conditions
• A description of key roads and intersections (lanes, speed limits)
• Identifying forms of traffic control, lane configurations, turning restrictions
• Identifying pedestrian and cycling facilities
• Noting the location of adjacent driveways and access points
• Identifying other traffic generators in the vicinity of the site Turning movement counts will be collected during weekday AM (7am-10am), weekday PM (4pm-7pm) peak periods at the following study area intersections:
• Brock Street East / Nelkydd Lane;
• Brock Street East / Donland Lane; and
• Low Boulevard / Donland Lane Once existing traffic volumes have been collected, we will prepare a baseline model of existing traffic operations at the study area intersections using Synchro v.10 for the identified critical time periods (weekday AM and PM peak hours). The existing analysis will include levels of service, volume to capacity ratios, and queuing at the key study intersections.
Future Background Traffic Assessment
Future Background consists of background growth and other background development traffic. We will obtain historic AADT records and estimate a background growth rate for the assumed 5-year time horizon period.
We do understand that there is and may be further redevelopment applications, as such traffic generation associated with those developments will be included in our analysis to reflect our horizon year assessment of 2022. Operational deficiencies as a result of future forecasted traffic volumes will be identified and mitigative measures will be proposed and documented in the final report.
Site Traffic Assessment
The weekday AM and PM peak hour traffic to be generated by the proposed development will be estimated based on information published in the Trip Generation, 9th Edition, by the Institute of Transportation Engineers (ITE).
The directional trip distribution and assignment for traffic approaching and departing the site will be determined based upon existing traffic patterns and Transportation Tomorrow Survey (TTS) data.

3
Future Total Traffic Assessment
Future total traffic consists of future background plus site traffic. Operational deficiencies as a result of site traffic will be identified and mitigative measures will be proposed and documented in the final report. We will develop and recommend appropriate intersection controls and geometric improvements for all key intersections as well as determine the appropriateness of the proposed site access location(s) and the lane requirements at these new locations.
Transit and Transportation Demand Management (TDM) Plan
A review of the existing and future transit availability in the area and recommendations shall be made in relation to the Region’s TDM requirements to ensure acceptable walking distances are proposed to the subject lands. Additionally, a review of whether additional STOP locations would be of benefit. Also required is a transit pedestrian study to ensure sufficient capacity is available along the existing routes and that appropriate pedestrian connectivity is provided. We will obtain all necessary data from the Region’s Planning Department and apply it accordingly in our analysis and final recommendation in this regard.
Parking Justification / On Site Circulation and Site Access Review
• Review the available parking to determine whether the proposed parking supply is sufficient to accommodate the parking demand of the proposed site and meets current Township of Uxbridge by-law requirements.
• Provide a recommended minimum parking rate for all end uses, based on shared parking rationale (if appropriate).
• We will review and provide comment on the most recent site plan with respect to the functionality of the internal vehicular circulation to facilitate vehicle maneuvering, loading, servicing, parking and pick-up / drop-off activities.
• Using Auto TURN, we will confirm the turning radius requirements and site circulation for passenger and heavy vehicles.
• Determine the appropriateness of access location and ensure adequate connections to main corridors are provided.
• Determine if the site access locations confirm to City standards vis-a-vis spacing, clear throat, sight lines and setback minimum criteria.
• Prepare an internal signage plan depicting location of all regulatory signage as well as location of all convex mirror and pavement markings.
1
Madeleine Catz
From: Jeff Almeida <[email protected]>
Sent: October-25-17 2:42 PM
To: Madeleine Catz
Cc: [email protected]; Richard Pernicky
Subject: RE: Terms of Reference - Brock Street Proposed Mixed-use Development
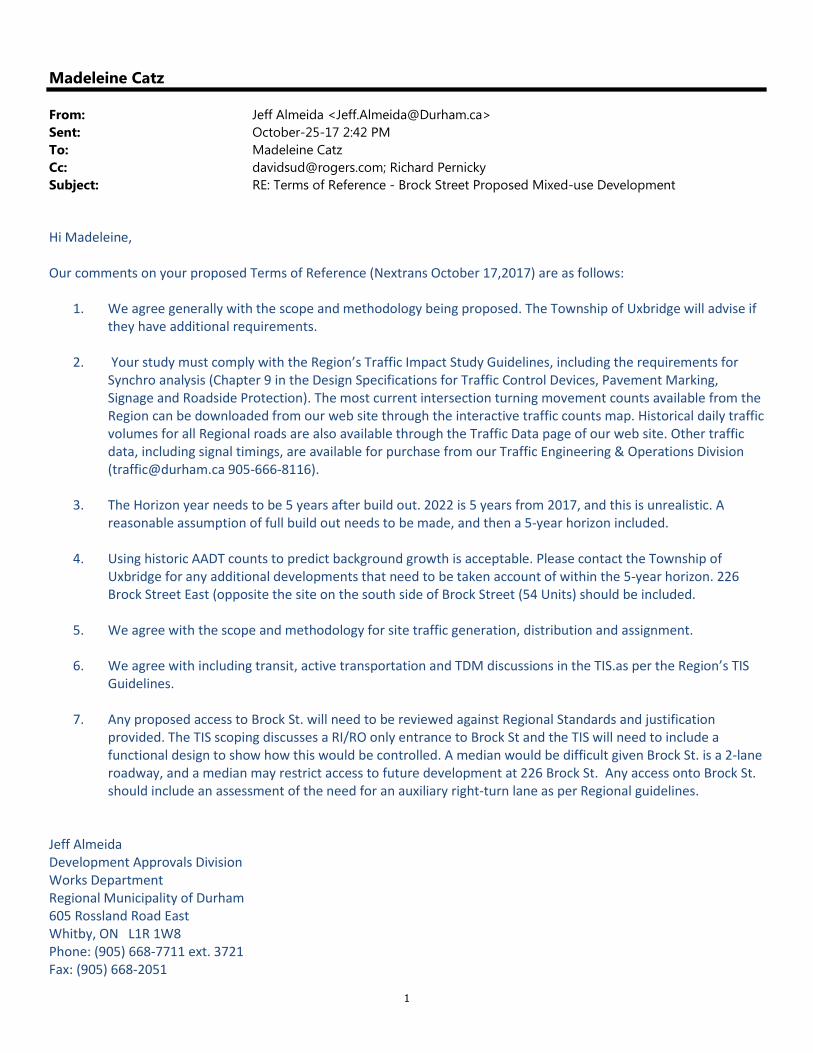
Hi Madeleine, Our comments on your proposed Terms of Reference (Nextrans October 17,2017) are as follows:
1. We agree generally with the scope and methodology being proposed. The Township of Uxbridge will advise if they have additional requirements.
2. Your study must comply with the Region’s Traffic Impact Study Guidelines, including the requirements for Synchro analysis (Chapter 9 in the Design Specifications for Traffic Control Devices, Pavement Marking, Signage and Roadside Protection). The most current intersection turning movement counts available from the Region can be downloaded from our web site through the interactive traffic counts map. Historical daily traffic volumes for all Regional roads are also available through the Traffic Data page of our web site. Other traffic data, including signal timings, are available for purchase from our Traffic Engineering & Operations Division ([email protected] 905-666-8116).
3. The Horizon year needs to be 5 years after build out. 2022 is 5 years from 2017, and this is unrealistic. A
reasonable assumption of full build out needs to be made, and then a 5-year horizon included.
4. Using historic AADT counts to predict background growth is acceptable. Please contact the Township of Uxbridge for any additional developments that need to be taken account of within the 5-year horizon. 226 Brock Street East (opposite the site on the south side of Brock Street (54 Units) should be included.
5. We agree with the scope and methodology for site traffic generation, distribution and assignment.
6. We agree with including transit, active transportation and TDM discussions in the TIS.as per the Region’s TIS
Guidelines.
7. Any proposed access to Brock St. will need to be reviewed against Regional Standards and justification provided. The TIS scoping discusses a RI/RO only entrance to Brock St and the TIS will need to include a functional design to show how this would be controlled. A median would be difficult given Brock St. is a 2-lane roadway, and a median may restrict access to future development at 226 Brock St. Any access onto Brock St. should include an assessment of the need for an auxiliary right-turn lane as per Regional guidelines.
Jeff Almeida Development Approvals Division Works Department Regional Municipality of Durham 605 Rossland Road East Whitby, ON L1R 1W8 Phone: (905) 668-7711 ext. 3721 Fax: (905) 668-2051

2
From: Madeleine Catz [mailto:[email protected]] Sent: October-17-17 4:38 PM To: Jeff Almeida Cc: [email protected]; Richard Pernicky Subject: Terms of Reference - Brock Street Proposed Mixed-use Development
Good afternoon Mr. Almeida, I would like to establish a terms of reference regarding a proposed mixed-use development northeast of Brock Street East and Donland Lane in Uxbridge. Please see attached terms of reference, along with the preliminary site plan. Sincerely, Madeleine Catz, B.Eng., EIT Transportation Analyst o: 905-503-2563 ext. 207 c: 647-893-1640 e: [email protected] w: www.nextrans.ca NOTE: NEW ADDRESS BELOW – EMAIL AND PHONES REMAIN SAME NexTrans Consulting Engineers A Division of NextEng Consulting Group Inc. 520 Industrial Parkway South, Suite 201 Aurora ON L4G 6W8 THIS MESSAGE IS FOR THE USE OF THE INTENDED RECIPIENT(S) ONLY AND MAY CONTAIN INFORMATION THAT IS PRIVILEGED, PROPRIETARY, CONFIDENTIAL, AND/OR EXEMPT FROM DISCLOSURE UNDER ANY RELEVANT PRIVACY LEGISLATION. No rights to any privilege have been waived. If you are not the intended recipient, you are hereby notified that any review, retransmission, dissemination, distribution, copying, conversion to hard copy, taking of action in reliance on or other use of this communication is strictly prohibited. If you are not the intended recipient and have received this message in error, please notify me by return e-mail and delete or destroy all copies of this message. THIS MESSAGE IS FOR THE USE OF THE INTENDED RECIPIENT(S) ONLY AND MAY CONTAIN INFORMATION THAT IS PRIVILEGED, PROPRIETARY, CONFIDENTIAL, AND/OR EXEMPT FROM DISCLOSURE UNDER ANY RELEVANT PRIVACY LEGISLATION. No rights to any privilege have been waived. If you are not the intended recipient, you are hereby notified that any review, re-transmission, dissemination, distribution, copying, conversion to hard copy, taking of action in reliance on or other use of this communication is strictly prohibited. If you are not the intended recipient and have received this message in error, please notify me by return e-mail and delete or destroy all copies of this message.

Appendix B - Proposed Site Plan


Appendix C – Existing Traffic Data

Turning Movement Count (1 . BROCK ST E & DONLAND LN)
Start Time
N Approach DONLAND LN
E Approach BROCK ST E
W Approach BROCK ST E
Int. Total(15 min)
Int. Total(1 hr)
RightN:W
LeftN:E
U-TurnN:N
PedsN:
Approach TotalRightE:N
ThruE:W
U-TurnE:E
PedsE:
Approach TotalThruW:E
LeftW:N
U-TurnW:W
PedsW:
Approach Total
07:00:00 4 7 0 0 11 1 68 0 0 69 23 0 0 0 23 103
07:15:00 4 4 0 0 8 0 64 0 0 64 31 3 0 0 34 106
07:30:00 6 6 0 0 12 0 64 0 0 64 33 1 0 0 34 110
07:45:00 9 2 0 0 11 0 83 0 0 83 34 1 0 0 35 129 448
08:00:00 4 5 0 0 9 3 74 0 0 77 54 4 0 0 58 144 489
08:15:00 8 14 0 0 22 2 82 0 0 84 79 3 0 1 82 188 571
08:30:00 6 9 0 0 15 0 75 0 0 75 59 10 0 2 69 159 620
08:45:00 4 8 0 0 12 1 91 0 0 92 45 2 0 7 47 151 642
09:00:00 5 7 0 0 12 8 74 0 2 82 45 2 0 0 47 141 639
09:15:00 2 4 0 0 6 1 60 0 0 61 27 2 0 3 29 96 547
09:30:00 4 2 0 0 6 2 48 0 0 50 29 2 0 0 31 87 475
09:45:00 4 3 0 0 7 3 61 0 0 64 31 1 0 0 32 103 427
***BREAK***
16:00:00 4 2 0 2 6 5 57 0 0 62 75 5 0 0 80 148
16:15:00 3 2 0 0 5 5 59 0 0 64 94 7 0 0 101 170
16:30:00 3 5 0 0 8 6 48 0 0 54 97 10 0 1 107 169
16:45:00 6 1 0 2 7 7 47 0 2 54 81 6 0 0 87 148 635
17:00:00 5 4 0 0 9 2 55 0 0 57 104 11 0 0 115 181 668
17:15:00 2 3 0 0 5 6 60 0 2 66 91 14 0 0 105 176 674
17:30:00 3 3 0 0 6 3 42 0 0 45 89 7 0 0 96 147 652
17:45:00 5 2 0 0 7 4 50 0 0 54 75 4 0 2 79 140 644
18:00:00 8 4 0 0 12 5 35 0 0 40 68 9 0 0 77 129 592
18:15:00 2 2 0 0 4 3 43 0 0 46 66 5 0 0 71 121 537
18:30:00 6 4 0 0 10 3 46 0 0 49 54 6 0 0 60 119 509
NexTrans4261-A14 Highway 7 East
Suite 489Markham ON, CANADA, L3R 9W6
Turning Movement CountLocation Name: BROCK ST E & DONLAND LN
Date: Tue, Oct 24, 2017 Deployment Lead: Theo Daglis
Turning Movement Count NXT17G7APage 1 of 6

18:45:00 5 1 0 0 6 5 48 0 0 53 52 7 0 0 59 118 487
Grand Total 112 104 0 4 216 75 1434 0 6 1509 1436 122 0 16 1558 3283 -
Approach% 51.9% 48.1% 0% - 5% 95% 0% - 92.2% 7.8% 0% - - -
Totals % 3.4% 3.2% 0% 6.6% 2.3% 43.7% 0% 46% 43.7% 3.7% 0% 47.5% - -
Heavy 4 0 0 - 1 93 0 - 90 4 0 - - -
Heavy % 3.6% 0% 0% - 1.3% 6.5% 0% - 6.3% 3.3% 0% - - -
Bicycles 1 0 0 - 0 0 0 - 0 0 0 - - -
Bicycle % 0.9% 0% 0% - 0% 0% 0% - 0% 0% 0% - - -
NexTrans4261-A14 Highway 7 East
Suite 489Markham ON, CANADA, L3R 9W6
Turning Movement CountLocation Name: BROCK ST E & DONLAND LN
Date: Tue, Oct 24, 2017 Deployment Lead: Theo Daglis
Turning Movement Count NXT17G7APage 2 of 6
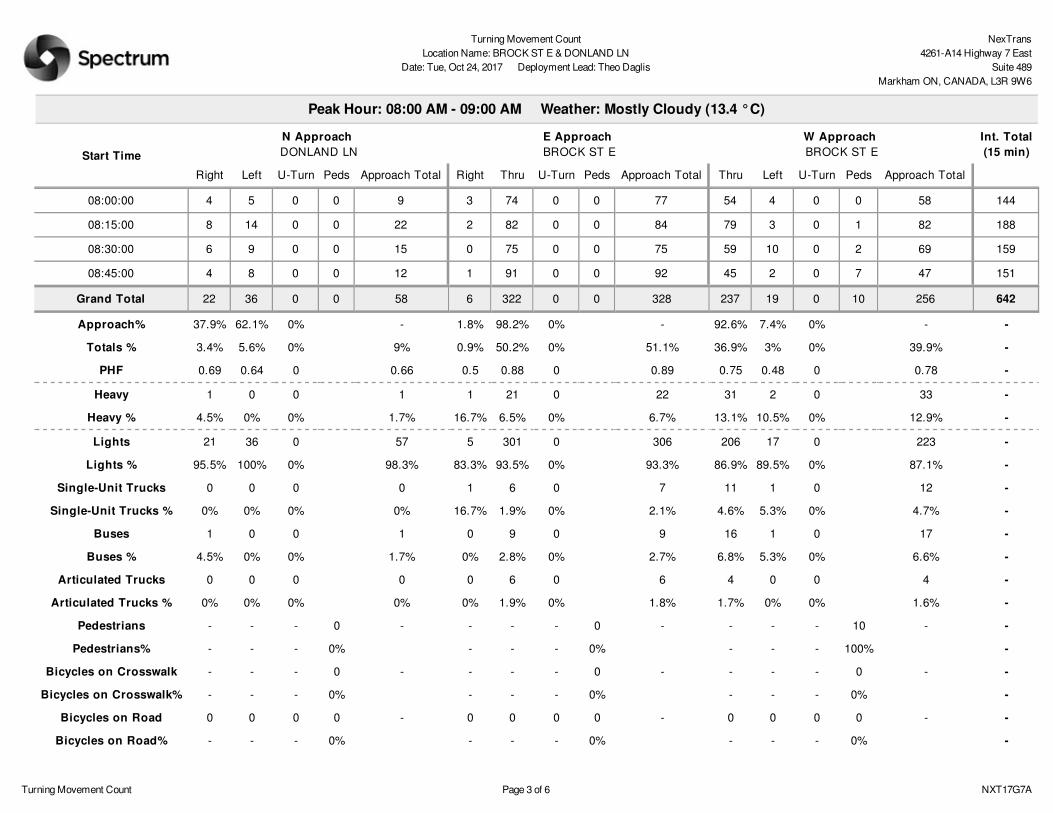
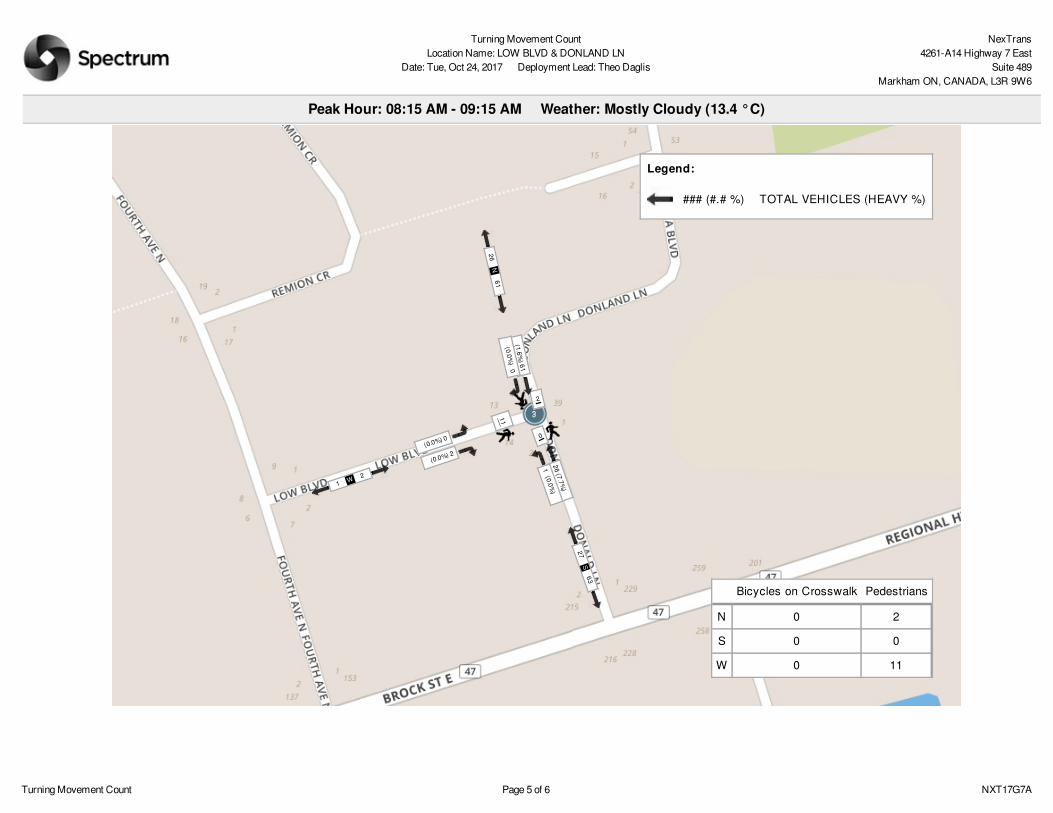
Peak Hour: 08:00 AM - 09:00 AM Weather: Mostly Cloudy (13.4 °C)
Start Time
N Approach DONLAND LN
E Approach BROCK ST E
W Approach BROCK ST E
Int. Total(15 min)
Right Left U-Turn Peds Approach Total Right Thru U-Turn Peds Approach Total Thru Left U-Turn Peds Approach Total
08:00:00 4 5 0 0 9 3 74 0 0 77 54 4 0 0 58 144
08:15:00 8 14 0 0 22 2 82 0 0 84 79 3 0 1 82 188
08:30:00 6 9 0 0 15 0 75 0 0 75 59 10 0 2 69 159
08:45:00 4 8 0 0 12 1 91 0 0 92 45 2 0 7 47 151
Grand Total 22 36 0 0 58 6 322 0 0 328 237 19 0 10 256 642
Approach% 37.9% 62.1% 0% - 1.8% 98.2% 0% - 92.6% 7.4% 0% - -
Totals % 3.4% 5.6% 0% 9% 0.9% 50.2% 0% 51.1% 36.9% 3% 0% 39.9% -
PHF 0.69 0.64 0 0.66 0.5 0.88 0 0.89 0.75 0.48 0 0.78 -
Heavy 1 0 0 1 1 21 0 22 31 2 0 33 -
Heavy % 4.5% 0% 0% 1.7% 16.7% 6.5% 0% 6.7% 13.1% 10.5% 0% 12.9% -
Lights 21 36 0 57 5 301 0 306 206 17 0 223 -
Lights % 95.5% 100% 0% 98.3% 83.3% 93.5% 0% 93.3% 86.9% 89.5% 0% 87.1% -
Single-Unit Trucks 0 0 0 0 1 6 0 7 11 1 0 12 -
Single-Unit Trucks % 0% 0% 0% 0% 16.7% 1.9% 0% 2.1% 4.6% 5.3% 0% 4.7% -
Buses 1 0 0 1 0 9 0 9 16 1 0 17 -
Buses % 4.5% 0% 0% 1.7% 0% 2.8% 0% 2.7% 6.8% 5.3% 0% 6.6% -
Articulated Trucks 0 0 0 0 0 6 0 6 4 0 0 4 -
Articulated Trucks % 0% 0% 0% 0% 0% 1.9% 0% 1.8% 1.7% 0% 0% 1.6% -
Pedestrians - - - 0 - - - - 0 - - - - 10 - -
Pedestrians% - - - 0% - - - 0% - - - 100% -
Bicycles on Crosswalk - - - 0 - - - - 0 - - - - 0 - -
Bicycles on Crosswalk% - - - 0% - - - 0% - - - 0% -
Bicycles on Road 0 0 0 0 - 0 0 0 0 - 0 0 0 0 - -
Bicycles on Road% - - - 0% - - - 0% - - - 0% -
NexTrans4261-A14 Highway 7 East
Suite 489Markham ON, CANADA, L3R 9W6
Turning Movement CountLocation Name: BROCK ST E & DONLAND LN
Date: Tue, Oct 24, 2017 Deployment Lead: Theo Daglis
Turning Movement Count NXT17G7APage 3 of 6

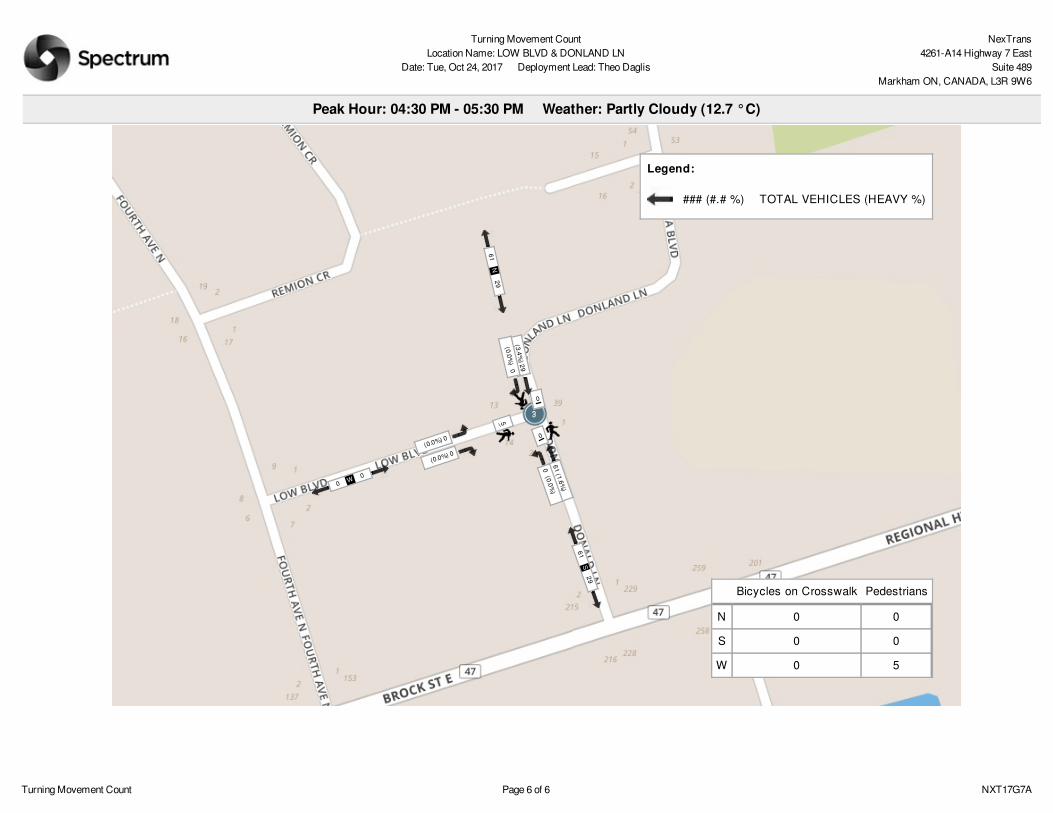
Peak Hour: 04:30 PM - 05:30 PM Weather: Partly Cloudy (12.7 °C)
Start Time
N Approach DONLAND LN
E Approach BROCK ST E
W Approach BROCK ST E
Int. Total(15 min)
Right Left U-Turn Peds Approach Total Right Thru U-Turn Peds Approach Total Thru Left U-Turn Peds Approach Total
16:30:00 3 5 0 0 8 6 48 0 0 54 97 10 0 1 107 169
16:45:00 6 1 0 2 7 7 47 0 2 54 81 6 0 0 87 148
17:00:00 5 4 0 0 9 2 55 0 0 57 104 11 0 0 115 181
17:15:00 2 3 0 0 5 6 60 0 2 66 91 14 0 0 105 176
Grand Total 16 13 0 2 29 21 210 0 4 231 373 41 0 1 414 674
Approach% 55.2% 44.8% 0% - 9.1% 90.9% 0% - 90.1% 9.9% 0% - -
Totals % 2.4% 1.9% 0% 4.3% 3.1% 31.2% 0% 34.3% 55.3% 6.1% 0% 61.4% -
PHF 0.67 0.65 0 0.81 0.75 0.88 0 0.88 0.9 0.73 0 0.9 -
Heavy 1 0 0 1 0 14 0 14 12 1 0 13 -
Heavy % 6.3% 0% 0% 3.4% 0% 6.7% 0% 6.1% 3.2% 2.4% 0% 3.1% -
Lights 15 13 0 28 21 196 0 217 361 40 0 401 -
Lights % 93.8% 100% 0% 96.6% 100% 93.3% 0% 93.9% 96.8% 97.6% 0% 96.9% -
Single-Unit Trucks 1 0 0 1 0 10 0 10 8 1 0 9 -
Single-Unit Trucks % 6.3% 0% 0% 3.4% 0% 4.8% 0% 4.3% 2.1% 2.4% 0% 2.2% -
Buses 0 0 0 0 0 0 0 0 1 0 0 1 -
Buses % 0% 0% 0% 0% 0% 0% 0% 0% 0.3% 0% 0% 0.2% -
Articulated Trucks 0 0 0 0 0 4 0 4 3 0 0 3 -
Articulated Trucks % 0% 0% 0% 0% 0% 1.9% 0% 1.7% 0.8% 0% 0% 0.7% -
Pedestrians - - - 2 - - - - 4 - - - - 1 - -
Pedestrians% - - - 28.6% - - - 57.1% - - - 14.3% -
Bicycles on Crosswalk - - - 0 - - - - 0 - - - - 0 - -
Bicycles on Crosswalk% - - - 0% - - - 0% - - - 0% -
Bicycles on Road 1 0 0 0 - 0 0 0 0 - 0 0 0 0 - -
Bicycles on Road% - - - 0% - - - 0% - - - 0% -
25 N
58
NexTrans4261-A14 Highway 7 East
Suite 489Markham ON, CANADA, L3R 9W6
Turning Movement CountLocation Name: BROCK ST E & DONLAND LN
Date: Tue, Oct 24, 2017 Deployment Lead: Theo Daglis
Turning Movement Count NXT17G7APage 4 of 6

Peak Hour: 08:00 AM - 09:00 AM Weather: Mostly Cloudy (13.4 °C)
0
6 (16.7%)
322 (6.5% )0
(0.0%) 36
(4.5%) 22
10
(13.1%) 237 (10.5%) 19
25 N
58
328 E 273
344 W 256
Legend:
### (#.# %) TOTAL VEHICLES (HEAVY %)
Bicycles on Crosswalk Pedestrians
N 0 0
E 0 0
W 0 10
62 N
29
NexTrans4261-A14 Highway 7 East
Suite 489Markham ON, CANADA, L3R 9W6
Turning Movement CountLocation Name: BROCK ST E & DONLAND LN
Date: Tue, Oct 24, 2017 Deployment Lead: Theo Daglis
Turning Movement Count NXT17G7APage 5 of 6

Peak Hour: 04:30 PM - 05:30 PM Weather: Partly Cloudy (12.7 °C)
4
21 (0.0%)
210 (6.7%)2
(0.0%) 13
(6.3%) 16
1
(3.2%) 373 (2.4%) 41
62 N
29
231 E 386
226 W 414
Legend:
### (#.# %) TOTAL VEHICLES (HEAVY %)
Bicycles on Crosswalk Pedestrians
N 0 2
E 0 4
W 0 1
NexTrans4261-A14 Highway 7 East
Suite 489Markham ON, CANADA, L3R 9W6
Turning Movement CountLocation Name: BROCK ST E & DONLAND LN
Date: Tue, Oct 24, 2017 Deployment Lead: Theo Daglis
Turning Movement Count NXT17G7APage 6 of 6
Turning Movement Count (2 . BROCK ST E & NELKYDD LN)
Start Time
E Approach BROCK ST E
S Approach NELKYDD LN
W Approach BROCK ST E
Int. Total(15 min)
Int. Total(1 hr)
ThruE:W
LeftE:S
U-TurnE:E
PedsE:
Approach TotalRightS:E
LeftS:W
U-TurnS:S
PedsS:
Approach TotalRightW:S
ThruW:E
U-TurnW:W
PedsW:
Approach Total
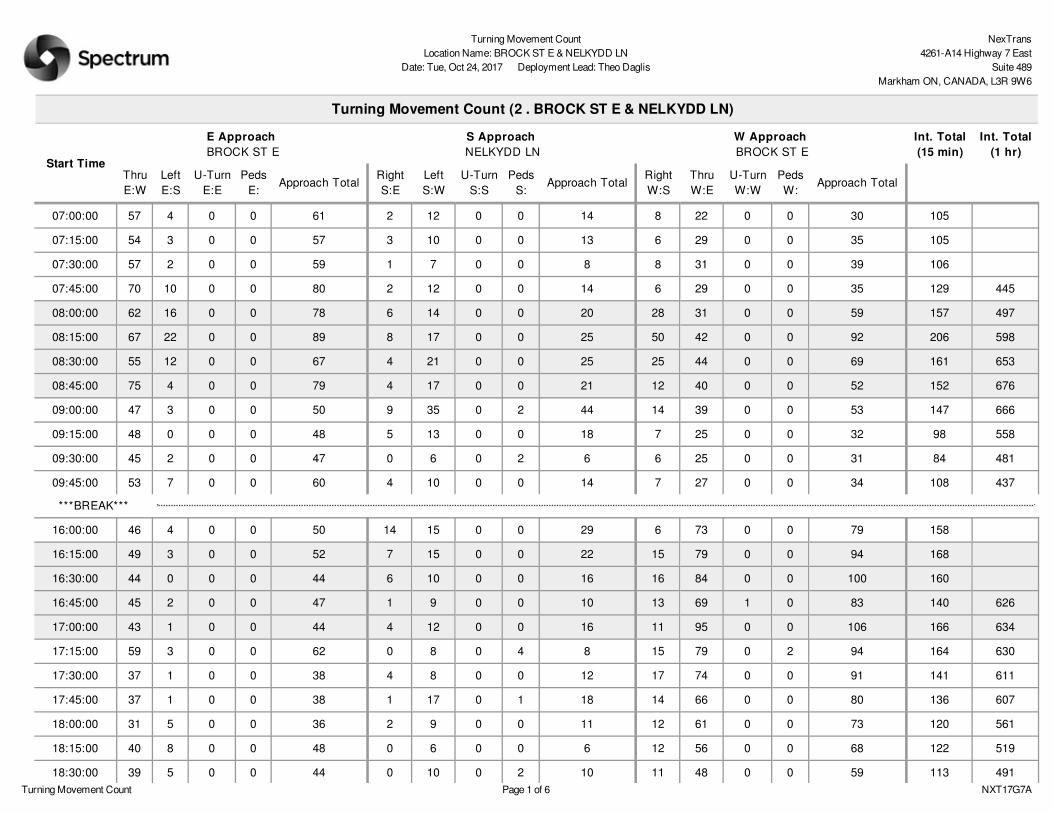
07:00:00 57 4 0 0 61 2 12 0 0 14 8 22 0 0 30 105
07:15:00 54 3 0 0 57 3 10 0 0 13 6 29 0 0 35 105
07:30:00 57 2 0 0 59 1 7 0 0 8 8 31 0 0 39 106
07:45:00 70 10 0 0 80 2 12 0 0 14 6 29 0 0 35 129 445
08:00:00 62 16 0 0 78 6 14 0 0 20 28 31 0 0 59 157 497
08:15:00 67 22 0 0 89 8 17 0 0 25 50 42 0 0 92 206 598
08:30:00 55 12 0 0 67 4 21 0 0 25 25 44 0 0 69 161 653
08:45:00 75 4 0 0 79 4 17 0 0 21 12 40 0 0 52 152 676
09:00:00 47 3 0 0 50 9 35 0 2 44 14 39 0 0 53 147 666
09:15:00 48 0 0 0 48 5 13 0 0 18 7 25 0 0 32 98 558
09:30:00 45 2 0 0 47 0 6 0 2 6 6 25 0 0 31 84 481
09:45:00 53 7 0 0 60 4 10 0 0 14 7 27 0 0 34 108 437
***BREAK***
16:00:00 46 4 0 0 50 14 15 0 0 29 6 73 0 0 79 158
16:15:00 49 3 0 0 52 7 15 0 0 22 15 79 0 0 94 168
16:30:00 44 0 0 0 44 6 10 0 0 16 16 84 0 0 100 160
16:45:00 45 2 0 0 47 1 9 0 0 10 13 69 1 0 83 140 626
17:00:00 43 1 0 0 44 4 12 0 0 16 11 95 0 0 106 166 634
17:15:00 59 3 0 0 62 0 8 0 4 8 15 79 0 2 94 164 630
17:30:00 37 1 0 0 38 4 8 0 0 12 17 74 0 0 91 141 611
17:45:00 37 1 0 0 38 1 17 0 1 18 14 66 0 0 80 136 607
18:00:00 31 5 0 0 36 2 9 0 0 11 12 61 0 0 73 120 561
18:15:00 40 8 0 0 48 0 6 0 0 6 12 56 0 0 68 122 519
18:30:00 39 5 0 0 44 0 10 0 2 10 11 48 0 0 59 113 491
NexTrans4261-A14 Highway 7 East
Suite 489Markham ON, CANADA, L3R 9W6
Turning Movement CountLocation Name: BROCK ST E & NELKYDD LN
Date: Tue, Oct 24, 2017 Deployment Lead: Theo Daglis
Turning Movement Count NXT17G7APage 1 of 6

18:45:00 43 1 0 0 44 0 10 0 0 10 12 41 0 0 53 107 462
Grand Total 1203 119 0 0 1322 87 303 0 11 390 331 1209 1 2 1541 3253 -
Approach% 91% 9% 0% - 22.3% 77.7% 0% - 21.5% 78.5% 0.1% - - -
Totals % 37% 3.7% 0% 40.6% 2.7% 9.3% 0% 12% 10.2% 37.2% 0% 47.4% - -
Heavy 80 4 0 - 8 13 0 - 14 79 0 - - -
Heavy % 6.7% 3.4% 0% - 9.2% 4.3% 0% - 4.2% 6.5% 0% - - -
Bicycles - - - - - - - - - - - - - -
Bicycle % - - - - - - - - - - - - - -
NexTrans4261-A14 Highway 7 East
Suite 489Markham ON, CANADA, L3R 9W6
Turning Movement CountLocation Name: BROCK ST E & NELKYDD LN
Date: Tue, Oct 24, 2017 Deployment Lead: Theo Daglis
Turning Movement Count NXT17G7APage 2 of 6

Peak Hour: 08:00 AM - 09:00 AM Weather: Mostly Cloudy (13.4 °C)
Start Time
E Approach BROCK ST E
S Approach NELKYDD LN
W Approach BROCK ST E
Int. Total(15 min)
Thru Left U-Turn Peds Approach Total Right Left U-Turn Peds Approach Total Right Thru U-Turn Peds Approach Total
08:00:00 62 16 0 0 78 6 14 0 0 20 28 31 0 0 59 157
08:15:00 67 22 0 0 89 8 17 0 0 25 50 42 0 0 92 206
08:30:00 55 12 0 0 67 4 21 0 0 25 25 44 0 0 69 161
08:45:00 75 4 0 0 79 4 17 0 0 21 12 40 0 0 52 152
Grand Total 259 54 0 0 313 22 69 0 0 91 115 157 0 0 272 676
Approach% 82.7% 17.3% 0% - 24.2% 75.8% 0% - 42.3% 57.7% 0% - -
Totals % 38.3% 8% 0% 46.3% 3.3% 10.2% 0% 13.5% 17% 23.2% 0% 40.2% -
PHF 0.86 0.61 0 0.88 0.69 0.82 0 0.91 0.58 0.89 0 0.74 -
Heavy 14 3 0 17 5 7 0 12 13 19 0 32 -
Heavy % 5.4% 5.6% 0% 5.4% 22.7% 10.1% 0% 13.2% 11.3% 12.1% 0% 11.8% -
Lights 245 51 0 296 17 62 0 79 102 138 0 240 -
Lights % 94.6% 94.4% 0% 94.6% 77.3% 89.9% 0% 86.8% 88.7% 87.9% 0% 88.2% -
Single-Unit Trucks 6 0 0 6 0 1 0 1 0 9 0 9 -
Single-Unit Trucks % 2.3% 0% 0% 1.9% 0% 1.4% 0% 1.1% 0% 5.7% 0% 3.3% -
Buses 2 3 0 5 5 6 0 11 13 3 0 16 -
Buses % 0.8% 5.6% 0% 1.6% 22.7% 8.7% 0% 12.1% 11.3% 1.9% 0% 5.9% -
Articulated Trucks 6 0 0 6 0 0 0 0 0 7 0 7 -
Articulated Trucks % 2.3% 0% 0% 1.9% 0% 0% 0% 0% 0% 4.5% 0% 2.6% -
Pedestrians - - - 0 - - - - 0 - - - - 0 - -
Pedestrians% - - - 0% - - - 0% - - - 0% -
NexTrans4261-A14 Highway 7 East
Suite 489Markham ON, CANADA, L3R 9W6
Turning Movement CountLocation Name: BROCK ST E & NELKYDD LN
Date: Tue, Oct 24, 2017 Deployment Lead: Theo Daglis
Turning Movement Count NXT17G7APage 3 of 6

Peak Hour: 04:15 PM - 05:15 PM Weather: Partly Cloudy (12.7 °C)
Start Time
E Approach BROCK ST E
S Approach NELKYDD LN
W Approach BROCK ST E
Int. Total(15 min)
Thru Left U-Turn Peds Approach Total Right Left U-Turn Peds Approach Total Right Thru U-Turn Peds Approach Total
16:15:00 49 3 0 0 52 7 15 0 0 22 15 79 0 0 94 168
16:30:00 44 0 0 0 44 6 10 0 0 16 16 84 0 0 100 160
16:45:00 45 2 0 0 47 1 9 0 0 10 13 69 1 0 83 140
17:00:00 43 1 0 0 44 4 12 0 0 16 11 95 0 0 106 166
Grand Total 181 6 0 0 187 18 46 0 0 64 55 327 1 0 383 634
Approach% 96.8% 3.2% 0% - 28.1% 71.9% 0% - 14.4% 85.4% 0.3% - -
Totals % 28.5% 0.9% 0% 29.5% 2.8% 7.3% 0% 10.1% 8.7% 51.6% 0.2% 60.4% -
PHF 0.92 0.5 0 0.9 0.64 0.77 0 0.73 0.86 0.86 0.25 0.9 -
Heavy 13 0 0 13 0 0 0 0 0 15 0 15 -
Heavy % 7.2% 0% 0% 7% 0% 0% 0% 0% 0% 4.6% 0% 3.9% -
Lights 168 6 0 174 18 46 0 64 55 312 1 368 -
Lights % 92.8% 100% 0% 93% 100% 100% 0% 100% 100% 95.4% 100% 96.1% -
Single-Unit Trucks 10 0 0 10 0 0 0 0 0 9 0 9 -
Single-Unit Trucks % 5.5% 0% 0% 5.3% 0% 0% 0% 0% 0% 2.8% 0% 2.3% -
Buses 0 0 0 0 0 0 0 0 0 1 0 1 -
Buses % 0% 0% 0% 0% 0% 0% 0% 0% 0% 0.3% 0% 0.3% -
Articulated Trucks 3 0 0 3 0 0 0 0 0 5 0 5 -
Articulated Trucks % 1.7% 0% 0% 1.6% 0% 0% 0% 0% 0% 1.5% 0% 1.3% -
Pedestrians - - - 0 - - - - 0 - - - - 0 - -
Pedestrians% - - - 0% - - - 0% - - - 0% -
NexTrans4261-A14 Highway 7 East
Suite 489Markham ON, CANADA, L3R 9W6
Turning Movement CountLocation Name: BROCK ST E & NELKYDD LN
Date: Tue, Oct 24, 2017 Deployment Lead: Theo Daglis
Turning Movement Count NXT17G7APage 4 of 6

Peak Hour: 08:00 AM - 09:00 AM Weather: Mostly Cloudy (13.4 °C)
0
54 (5.6%) 259 (5.4%)
0
22 (22.7%)
69 (10.1%)
0
(12.1%) 157
(11.3%) 115
91 S
169
313 E 179
328 W 272
Legend:
### (#.# %) TOTAL VEHICLES (HEAVY %)
Pedestrians
S 0
E 0
W 0
NexTrans4261-A14 Highway 7 East
Suite 489Markham ON, CANADA, L3R 9W6
Turning Movement CountLocation Name: BROCK ST E & NELKYDD LN
Date: Tue, Oct 24, 2017 Deployment Lead: Theo Daglis
Turning Movement Count NXT17G7APage 5 of 6

Peak Hour: 04:15 PM - 05:15 PM Weather: Partly Cloudy (12.7 °C)
169
0
6 (0.0%) 181 (7.2%)
0
18 (0.0%)
46 (0.0%)
0
(4.6%) 327
(0.0%) 55
64 S
61
187 E 345
227 W 382
Legend:
### (#.# %) TOTAL VEHICLES (HEAVY %)
Pedestrians
S 0
E 0
W 0
NexTrans4261-A14 Highway 7 East
Suite 489Markham ON, CANADA, L3R 9W6
Turning Movement CountLocation Name: BROCK ST E & NELKYDD LN
Date: Tue, Oct 24, 2017 Deployment Lead: Theo Daglis
Turning Movement Count NXT17G7APage 6 of 6

Turning Movement Count (3 . LOW BLVD & DONLAND LN)
Start Time
N Approach DONLAND LN
S Approach DONLAND LN
W Approach LOW BLVD
Int. Total(15 min)
Int. Total(1 hr)
RightN:W
ThruN:S
U-TurnN:N
PedsN:
Approach TotalThruS:N
LeftS:W
U-TurnS:S
PedsS:
Approach TotalRightW:S
LeftW:N
U-TurnW:W
PedsW:
Approach Total
07:00:00 0 11 0 0 11 1 0 0 0 1 0 0 0 0 0 12
07:15:00 0 8 0 0 8 3 0 0 0 3 0 0 0 0 0 11
07:30:00 0 12 0 0 12 1 0 0 0 1 0 0 0 0 0 13
07:45:00 0 10 0 0 10 1 0 0 0 1 1 0 0 0 1 12 48
08:00:00 0 9 0 0 9 6 1 0 0 7 0 0 0 0 0 16 52
08:15:00 0 21 0 1 21 5 0 0 0 5 2 0 0 1 2 28 69
08:30:00 0 15 0 1 15 9 1 0 0 10 0 0 0 2 0 25 81
08:45:00 0 12 0 0 12 3 0 0 0 3 0 0 0 8 0 15 84
09:00:00 0 13 0 0 13 9 0 0 0 9 0 0 0 0 0 22 90
09:15:00 0 4 0 0 4 3 1 0 0 4 1 0 0 3 1 9 71
09:30:00 0 6 0 0 6 4 0 0 0 4 0 0 0 1 0 10 56
09:45:00 0 6 0 0 6 4 0 0 0 4 1 0 0 0 1 11 52
***BREAK***
16:00:00 0 6 0 0 6 9 0 0 0 9 0 0 0 2 0 15
16:15:00 0 5 0 0 5 11 2 0 0 13 0 0 0 1 0 18
16:30:00 0 8 0 0 8 16 0 0 0 16 0 0 0 2 0 24
16:45:00 0 7 0 0 7 12 0 0 0 12 0 0 0 2 0 19 76
17:00:00 0 9 0 0 9 13 0 0 0 13 0 0 0 0 0 22 83
17:15:00 0 5 0 0 5 20 0 0 0 20 0 0 0 1 0 25 90
17:30:00 0 6 0 0 6 9 0 0 0 9 0 0 0 0 0 15 81
17:45:00 0 6 0 0 6 9 0 0 0 9 1 0 0 2 1 16 78
18:00:00 0 12 0 0 12 13 0 0 0 13 0 0 0 0 0 25 81
18:15:00 0 4 0 0 4 8 0 0 0 8 0 0 0 0 0 12 68
18:30:00 0 9 0 0 9 8 1 0 0 9 1 0 0 2 1 19 72
NexTrans4261-A14 Highway 7 East
Suite 489Markham ON, CANADA, L3R 9W6
Turning Movement CountLocation Name: LOW BLVD & DONLAND LN
Date: Tue, Oct 24, 2017 Deployment Lead: Theo Daglis
Turning Movement Count NXT17G7APage 1 of 6

18:45:00 0 6 0 0 6 10 0 0 0 10 0 0 0 0 0 16 72
Grand Total 0 210 0 2 210 187 6 0 0 193 7 0 0 27 7 410 -
Approach% 0% 100% 0% - 96.9% 3.1% 0% - 100% 0% 0% - - -
Totals % 0% 51.2% 0% 51.2% 45.6% 1.5% 0% 47.1% 1.7% 0% 0% 1.7% - -
Heavy 0 3 0 - 4 0 0 - 1 0 0 - - -
Heavy % 0% 1.4% 0% - 2.1% 0% 0% - 14.3% 0% 0% - - -
Bicycles 2 2 0 - 0 0 0 - 1 2 0 - - -
Bicycle % 0% 1% 0% - 0% 0% 0% - 14.3% 0% 0% - - -
NexTrans4261-A14 Highway 7 East
Suite 489Markham ON, CANADA, L3R 9W6
Turning Movement CountLocation Name: LOW BLVD & DONLAND LN
Date: Tue, Oct 24, 2017 Deployment Lead: Theo Daglis
Turning Movement Count NXT17G7APage 2 of 6

Peak Hour: 08:15 AM - 09:15 AM Weather: Mostly Cloudy (13.4 °C)
Start Time
N Approach DONLAND LN
S Approach DONLAND LN
W Approach LOW BLVD
Int. Total(15 min)
Right Thru U-Turn Peds Approach Total Thru Left U-Turn Peds Approach Total Right Left U-Turn Peds Approach Total
08:15:00 0 21 0 1 21 5 0 0 0 5 2 0 0 1 2 28
08:30:00 0 15 0 1 15 9 1 0 0 10 0 0 0 2 0 25
08:45:00 0 12 0 0 12 3 0 0 0 3 0 0 0 8 0 15
09:00:00 0 13 0 0 13 9 0 0 0 9 0 0 0 0 0 22
Grand Total 0 61 0 2 61 26 1 0 0 27 2 0 0 11 2 90
Approach% 0% 100% 0% - 96.3% 3.7% 0% - 100% 0% 0% - -
Totals % 0% 67.8% 0% 67.8% 28.9% 1.1% 0% 30% 2.2% 0% 0% 2.2% -
PHF 0 0.73 0 0.73 0.72 0.25 0 0.68 0.25 0 0 0.25 -
Heavy 0 1 0 1 2 0 0 2 0 0 0 0 -
Heavy % 0% 1.6% 0% 1.6% 7.7% 0% 0% 7.4% 0% 0% 0% 0% -
Lights 0 60 0 60 24 1 0 25 2 0 0 2 -
Lights % 0% 98.4% 0% 98.4% 92.3% 100% 0% 92.6% 100% 0% 0% 100% -
Single-Unit Trucks 0 0 0 0 1 0 0 1 0 0 0 0 -
Single-Unit Trucks % 0% 0% 0% 0% 3.8% 0% 0% 3.7% 0% 0% 0% 0% -
Buses 0 1 0 1 1 0 0 1 0 0 0 0 -
Buses % 0% 1.6% 0% 1.6% 3.8% 0% 0% 3.7% 0% 0% 0% 0% -
Articulated Trucks 0 0 0 0 0 0 0 0 0 0 0 0 -
Articulated Trucks % 0% 0% 0% 0% 0% 0% 0% 0% 0% 0% 0% 0% -
Pedestrians - - - 2 - - - - 0 - - - - 11 - -
Pedestrians% - - - 15.4% - - - 0% - - - 84.6% -
Bicycles on Crosswalk - - - 0 - - - - 0 - - - - 0 - -
Bicycles on Crosswalk% - - - 0% - - - 0% - - - 0% -
Bicycles on Road 0 1 0 0 - 0 0 0 0 - 0 0 0 0 - -
Bicycles on Road% - - - 0% - - - 0% - - - 0% -
NexTrans4261-A14 Highway 7 East
Suite 489Markham ON, CANADA, L3R 9W6
Turning Movement CountLocation Name: LOW BLVD & DONLAND LN
Date: Tue, Oct 24, 2017 Deployment Lead: Theo Daglis
Turning Movement Count NXT17G7APage 3 of 6

Peak Hour: 04:30 PM - 05:30 PM Weather: Partly Cloudy (12.7 °C)
Start Time
N Approach DONLAND LN
S Approach DONLAND LN
W Approach LOW BLVD
Int. Total(15 min)
Right Thru U-Turn Peds Approach Total Thru Left U-Turn Peds Approach Total Right Left U-Turn Peds Approach Total
16:30:00 0 8 0 0 8 16 0 0 0 16 0 0 0 2 0 24
16:45:00 0 7 0 0 7 12 0 0 0 12 0 0 0 2 0 19
17:00:00 0 9 0 0 9 13 0 0 0 13 0 0 0 0 0 22
17:15:00 0 5 0 0 5 20 0 0 0 20 0 0 0 1 0 25
Grand Total 0 29 0 0 29 61 0 0 0 61 0 0 0 5 0 90
Approach% 0% 100% 0% - 100% 0% 0% - 0% 0% 0% - -
Totals % 0% 32.2% 0% 32.2% 67.8% 0% 0% 67.8% 0% 0% 0% 0% -
PHF 0 0.81 0 0.81 0.76 0 0 0.76 0 0 0 0 -
Heavy 0 1 0 1 1 0 0 1 0 0 0 0 -
Heavy % 0% 3.4% 0% 3.4% 1.6% 0% 0% 1.6% 0% 0% 0% 0% -
Lights 0 28 0 28 60 0 0 60 0 0 0 0 -
Lights % 0% 96.6% 0% 96.6% 98.4% 0% 0% 98.4% 0% 0% 0% 0% -
Single-Unit Trucks 0 1 0 1 1 0 0 1 0 0 0 0 -
Single-Unit Trucks % 0% 3.4% 0% 3.4% 1.6% 0% 0% 1.6% 0% 0% 0% 0% -
Buses 0 0 0 0 0 0 0 0 0 0 0 0 -
Buses % 0% 0% 0% 0% 0% 0% 0% 0% 0% 0% 0% 0% -
Articulated Trucks 0 0 0 0 0 0 0 0 0 0 0 0 -
Articulated Trucks % 0% 0% 0% 0% 0% 0% 0% 0% 0% 0% 0% 0% -
Pedestrians - - - 0 - - - - 0 - - - - 5 - -
Pedestrians% - - - 0% - - - 0% - - - 100% -
Bicycles on Crosswalk - - - 0 - - - - 0 - - - - 0 - -
Bicycles on Crosswalk% - - - 0% - - - 0% - - - 0% -
Bicycles on Road 0 0 0 0 - 0 0 0 0 - 1 0 0 0 - -
Bicycles on Road% - - - 0% - - - 0% - - - 0% -
NexTrans4261-A14 Highway 7 East
Suite 489Markham ON, CANADA, L3R 9W6
Turning Movement CountLocation Name: LOW BLVD & DONLAND LN
Date: Tue, Oct 24, 2017 Deployment Lead: Theo Daglis
Turning Movement Count NXT17G7APage 4 of 6
Peak Hour: 08:15 AM - 09:15 AM Weather: Mostly Cloudy (13.4 °C)
2
(1.6%) 61
(0.0%) 0
0
26 (7.7%)
1 (0.0%)
11
(0.0%) 0
(0.0%) 2
26 N
61
27 S
63
1 W 2
Legend:
### (#.# %) TOTAL VEHICLES (HEAVY %)
Bicycles on Crosswalk Pedestrians
N 0 2
S 0 0
W 0 11
NexTrans4261-A14 Highway 7 East
Suite 489Markham ON, CANADA, L3R 9W6
Turning Movement CountLocation Name: LOW BLVD & DONLAND LN
Date: Tue, Oct 24, 2017 Deployment Lead: Theo Daglis
Turning Movement Count NXT17G7APage 5 of 6
Peak Hour: 04:30 PM - 05:30 PM Weather: Partly Cloudy (12.7 °C)
63
0
(3.4%) 29
(0.0%) 0
0
61 (1.6%)
0 (0.0%)
5
(0.0%) 0
(0.0%) 0
61 N
29
61 S
29
0 W 0
Legend:
### (#.# %) TOTAL VEHICLES (HEAVY %)
Bicycles on Crosswalk Pedestrians
N 0 0
S 0 0
W 0 5
NexTrans4261-A14 Highway 7 East
Suite 489Markham ON, CANADA, L3R 9W6
Turning Movement CountLocation Name: LOW BLVD & DONLAND LN
Date: Tue, Oct 24, 2017 Deployment Lead: Theo Daglis
Turning Movement Count NXT17G7APage 6 of 6

Appendix D – Existing Traffic Level ofService Calculations

HCM Unsignalized Intersection Capacity Analysis3: Nelkydd Lane & Brock Street East 11/16/2017
Existing AM 11/06/2017 Baseline Synchro 10 Light ReportPage 1
Movement EBT EBR WBL WBT NBL NBR
Lane ConfigurationsTraffic Volume (veh/h) 157 115 54 259 69 22Future Volume (Veh/h) 157 115 54 259 69 22Sign Control Free Free StopGrade 0% 0% 0%Peak Hour Factor 0.89 0.58 0.61 0.86 0.82 0.69Hourly flow rate (vph) 176 198 89 301 84 32PedestriansLane Width (m)Walking Speed (m/s)Percent BlockageRight turn flare (veh)Median type None NoneMedian storage veh)Upstream signal (m)pX, platoon unblockedvC, conflicting volume 374 655 176vC1, stage 1 conf volvC2, stage 2 conf volvCu, unblocked vol 374 655 176tC, single (s) 4.2 6.5 6.4tC, 2 stage (s)tF (s) 2.3 3.6 3.5p0 queue free % 92 78 96cM capacity (veh/h) 1163 387 816
Direction, Lane # EB 1 EB 2 WB 1 NB 1
Volume Total 176 198 390 116Volume Left 0 0 89 84Volume Right 0 198 0 32cSH 1700 1700 1163 452Volume to Capacity 0.10 0.12 0.08 0.26Queue Length 95th (m) 0.0 0.0 2.0 8.1Control Delay (s) 0.0 0.0 2.5 15.7Lane LOS A CApproach Delay (s) 0.0 2.5 15.7Approach LOS C
Intersection Summary
Average Delay 3.2Intersection Capacity Utilization 40.0% ICU Level of Service AAnalysis Period (min) 15

HCM Unsignalized Intersection Capacity Analysis6: Brock Street East & Donland Lane 11/16/2017
Existing AM 11/06/2017 Baseline Synchro 10 Light ReportPage 2
Movement EBL EBT WBT WBR SBL SBR
Lane ConfigurationsTraffic Volume (veh/h) 19 237 322 6 36 22Future Volume (Veh/h) 19 237 322 6 36 22Sign Control Free Free StopGrade 0% 0% 0%Peak Hour Factor 0.48 0.75 0.88 0.50 0.64 0.69Hourly flow rate (vph) 40 316 366 12 56 32Pedestrians 10Lane Width (m) 3.6Walking Speed (m/s) 1.2Percent Blockage 1Right turn flare (veh)Median type None NoneMedian storage veh)Upstream signal (m)pX, platoon unblockedvC, conflicting volume 388 778 382vC1, stage 1 conf volvC2, stage 2 conf volvCu, unblocked vol 388 778 382tC, single (s) 4.2 6.4 6.2tC, 2 stage (s)tF (s) 2.3 3.5 3.3p0 queue free % 96 84 95cM capacity (veh/h) 1119 352 655
Direction, Lane # EB 1 WB 1 SB 1
Volume Total 356 378 88Volume Left 40 0 56Volume Right 0 12 32cSH 1119 1700 423Volume to Capacity 0.04 0.22 0.21Queue Length 95th (m) 0.9 0.0 6.2Control Delay (s) 1.3 0.0 15.7Lane LOS A CApproach Delay (s) 1.3 0.0 15.7Approach LOS C
Intersection Summary
Average Delay 2.2Intersection Capacity Utilization 38.2% ICU Level of Service AAnalysis Period (min) 15

HCM Unsignalized Intersection Capacity Analysis8: Donland Lane & Low Boulevard 11/16/2017
Existing AM 11/06/2017 Baseline Synchro 10 Light ReportPage 3
Movement EBL EBR NBL NBT SBT SBR
Lane ConfigurationsTraffic Volume (veh/h) 0 2 1 26 61 0Future Volume (Veh/h) 0 2 1 26 61 0Sign Control Stop Free FreeGrade 0% 0% 0%Peak Hour Factor 0.25 0.25 0.25 0.72 0.73 0.25Hourly flow rate (vph) 0 8 4 36 84 0Pedestrians 11 2Lane Width (m) 3.6 3.6Walking Speed (m/s) 1.2 1.2Percent Blockage 1 0Right turn flare (veh)Median type None NoneMedian storage veh)Upstream signal (m)pX, platoon unblockedvC, conflicting volume 141 95 95vC1, stage 1 conf volvC2, stage 2 conf volvCu, unblocked vol 141 95 95tC, single (s) 6.4 6.2 4.1tC, 2 stage (s)tF (s) 3.5 3.3 2.2p0 queue free % 100 99 100cM capacity (veh/h) 845 958 1498
Direction, Lane # EB 1 NB 1 SB 1
Volume Total 8 40 84Volume Left 0 4 0Volume Right 8 0 0cSH 958 1498 1700Volume to Capacity 0.01 0.00 0.05Queue Length 95th (m) 0.2 0.1 0.0Control Delay (s) 8.8 0.8 0.0Lane LOS A AApproach Delay (s) 8.8 0.8 0.0Approach LOS A
Intersection Summary
Average Delay 0.8Intersection Capacity Utilization 16.4% ICU Level of Service AAnalysis Period (min) 15

HCM Unsignalized Intersection Capacity Analysis3: Nelkydd Lane & Brock Street East 11/06/2017
Existing PM 11/06/2017 Baseline Synchro 10 Light ReportPage 1
Movement EBT EBR WBL WBT NBL NBR
Lane ConfigurationsTraffic Volume (veh/h) 327 55 6 161 46 18Future Volume (Veh/h) 327 55 6 161 46 18Sign Control Free Free StopGrade 0% 0% 0%Peak Hour Factor 0.86 0.86 0.50 0.92 0.77 0.64Hourly flow rate (vph) 380 64 12 175 60 28PedestriansLane Width (m)Walking Speed (m/s)Percent BlockageRight turn flare (veh)Median type None NoneMedian storage veh)Upstream signal (m) 65pX, platoon unblockedvC, conflicting volume 444 579 380vC1, stage 1 conf volvC2, stage 2 conf volvCu, unblocked vol 444 579 380tC, single (s) 4.1 6.4 6.2tC, 2 stage (s)tF (s) 2.2 3.5 3.3p0 queue free % 99 87 96cM capacity (veh/h) 1127 475 671
Direction, Lane # EB 1 EB 2 WB 1 NB 1
Volume Total 380 64 187 88Volume Left 0 0 12 60Volume Right 0 64 0 28cSH 1700 1700 1127 524Volume to Capacity 0.22 0.04 0.01 0.17Queue Length 95th (m) 0.0 0.0 0.3 4.8Control Delay (s) 0.0 0.0 0.6 13.2Lane LOS A BApproach Delay (s) 0.0 0.6 13.2Approach LOS B
Intersection Summary
Average Delay 1.8Intersection Capacity Utilization 27.5% ICU Level of Service AAnalysis Period (min) 15

HCM Unsignalized Intersection Capacity Analysis6: Brock Street East & Donland Lane 11/06/2017
Existing PM 11/06/2017 Baseline Synchro 10 Light ReportPage 2
Movement EBL EBT WBT WBR SBL SBR
Lane ConfigurationsTraffic Volume (veh/h) 41 373 210 21 13 16Future Volume (Veh/h) 41 373 210 21 13 16Sign Control Free Free StopGrade 0% 0% 0%Peak Hour Factor 0.73 0.90 0.88 0.75 0.65 0.67Hourly flow rate (vph) 56 414 239 28 20 24Pedestrians 1 4 2Lane Width (m) 3.6 3.6 3.6Walking Speed (m/s) 1.2 1.2 1.2Percent Blockage 0 0 0Right turn flare (veh)Median type None NoneMedian storage veh)Upstream signal (m)pX, platoon unblockedvC, conflicting volume 269 785 256vC1, stage 1 conf volvC2, stage 2 conf volvCu, unblocked vol 269 785 256tC, single (s) 4.1 6.4 6.3tC, 2 stage (s)tF (s) 2.2 3.5 3.4p0 queue free % 96 94 97cM capacity (veh/h) 1292 347 771
Direction, Lane # EB 1 WB 1 SB 1
Volume Total 470 267 44Volume Left 56 0 20Volume Right 0 28 24cSH 1292 1700 495Volume to Capacity 0.04 0.16 0.09Queue Length 95th (m) 1.1 0.0 2.3Control Delay (s) 1.3 0.0 13.0Lane LOS A BApproach Delay (s) 1.3 0.0 13.0Approach LOS B
Intersection Summary
Average Delay 1.5Intersection Capacity Utilization 48.0% ICU Level of Service AAnalysis Period (min) 15

HCM Unsignalized Intersection Capacity Analysis8: Donland Lane & Low Boulevard 11/06/2017
Existing PM 11/06/2017 Baseline Synchro 10 Light ReportPage 3
Movement EBL EBR NBL NBT SBT SBR
Lane ConfigurationsTraffic Volume (veh/h) 0 2 0 61 29 0Future Volume (Veh/h) 0 2 0 61 29 0Sign Control Stop Free FreeGrade 0% 0% 0%Peak Hour Factor 0.25 0.25 0.25 0.76 0.81 0.25Hourly flow rate (vph) 0 8 0 80 36 0Pedestrians 5Lane Width (m) 3.6Walking Speed (m/s) 1.2Percent Blockage 0Right turn flare (veh)Median type None NoneMedian storage veh)Upstream signal (m)pX, platoon unblockedvC, conflicting volume 121 41 41vC1, stage 1 conf volvC2, stage 2 conf volvCu, unblocked vol 121 41 41tC, single (s) 6.4 6.2 4.1tC, 2 stage (s)tF (s) 3.5 3.3 2.2p0 queue free % 100 99 100cM capacity (veh/h) 876 1031 1575
Direction, Lane # EB 1 NB 1 SB 1
Volume Total 8 80 36Volume Left 0 0 0Volume Right 8 0 0cSH 1031 1575 1700Volume to Capacity 0.01 0.00 0.02Queue Length 95th (m) 0.2 0.0 0.0Control Delay (s) 8.5 0.0 0.0Lane LOS AApproach Delay (s) 8.5 0.0 0.0Approach LOS A
Intersection Summary
Average Delay 0.5Intersection Capacity Utilization 14.9% ICU Level of Service AAnalysis Period (min) 15

Appendix E – Future Background Levelof Service Calculations

HCM Unsignalized Intersection Capacity Analysis3: Nelkydd Lane & Brock Street East 11/16/2017
Future Background 2021 AM (Build) 11/06/2017 Baseline Synchro 10 Light ReportPage 1
Movement EBT EBR WBL WBT NBL NBR
Lane ConfigurationsTraffic Volume (veh/h) 163 115 54 270 69 22Future Volume (Veh/h) 163 115 54 270 69 22Sign Control Free Free StopGrade 0% 0% 0%Peak Hour Factor 0.89 0.58 0.61 0.86 0.82 0.69Hourly flow rate (vph) 183 198 89 314 84 32PedestriansLane Width (m)Walking Speed (m/s)Percent BlockageRight turn flare (veh)Median type None NoneMedian storage veh)Upstream signal (m)pX, platoon unblockedvC, conflicting volume 381 675 183vC1, stage 1 conf volvC2, stage 2 conf volvCu, unblocked vol 381 675 183tC, single (s) 4.2 6.5 6.4tC, 2 stage (s)tF (s) 2.3 3.6 3.5p0 queue free % 92 78 96cM capacity (veh/h) 1156 376 808
Direction, Lane # EB 1 EB 2 WB 1 NB 1
Volume Total 183 198 403 116Volume Left 0 0 89 84Volume Right 0 198 0 32cSH 1700 1700 1156 441Volume to Capacity 0.11 0.12 0.08 0.26Queue Length 95th (m) 0.0 0.0 2.0 8.4Control Delay (s) 0.0 0.0 2.5 16.1Lane LOS A CApproach Delay (s) 0.0 2.5 16.1Approach LOS C
Intersection Summary
Average Delay 3.2Intersection Capacity Utilization 40.9% ICU Level of Service AAnalysis Period (min) 15

HCM Unsignalized Intersection Capacity Analysis6: Brock Street East & Donland Lane 11/16/2017
Future Background 2021 AM (Build) 11/06/2017 Baseline Synchro 10 Light ReportPage 2
Movement EBL EBT WBT WBR SBL SBR
Lane ConfigurationsTraffic Volume (veh/h) 19 247 335 6 36 22Future Volume (Veh/h) 19 247 335 6 36 22Sign Control Free Free StopGrade 0% 0% 0%Peak Hour Factor 0.48 0.75 0.88 0.50 0.64 0.69Hourly flow rate (vph) 40 329 381 12 56 32Pedestrians 10Lane Width (m) 3.6Walking Speed (m/s) 1.2Percent Blockage 1Right turn flare (veh)Median type None NoneMedian storage veh)Upstream signal (m)pX, platoon unblockedvC, conflicting volume 403 806 397vC1, stage 1 conf volvC2, stage 2 conf volvCu, unblocked vol 403 806 397tC, single (s) 4.2 6.4 6.2tC, 2 stage (s)tF (s) 2.3 3.5 3.3p0 queue free % 96 83 95cM capacity (veh/h) 1104 338 643
Direction, Lane # EB 1 WB 1 SB 1
Volume Total 369 393 88Volume Left 40 0 56Volume Right 0 12 32cSH 1104 1700 409Volume to Capacity 0.04 0.23 0.22Queue Length 95th (m) 0.9 0.0 6.5Control Delay (s) 1.2 0.0 16.2Lane LOS A CApproach Delay (s) 1.2 0.0 16.2Approach LOS C
Intersection Summary
Average Delay 2.2Intersection Capacity Utilization 38.7% ICU Level of Service AAnalysis Period (min) 15

HCM Unsignalized Intersection Capacity Analysis8: Donland Lane & Low Boulevard 11/16/2017
Future Background 2021 AM (Build) 11/06/2017 Baseline Synchro 10 Light ReportPage 3
Movement EBL EBR NBL NBT SBT SBR
Lane ConfigurationsTraffic Volume (veh/h) 0 2 1 27 63 0Future Volume (Veh/h) 0 2 1 27 63 0Sign Control Stop Free FreeGrade 0% 0% 0%Peak Hour Factor 0.25 0.25 0.25 0.72 0.73 0.25Hourly flow rate (vph) 0 8 4 38 86 0Pedestrians 11 2Lane Width (m) 3.6 3.6Walking Speed (m/s) 1.2 1.2Percent Blockage 1 0Right turn flare (veh)Median type None NoneMedian storage veh)Upstream signal (m)pX, platoon unblockedvC, conflicting volume 145 97 97vC1, stage 1 conf volvC2, stage 2 conf volvCu, unblocked vol 145 97 97tC, single (s) 6.4 6.2 4.1tC, 2 stage (s)tF (s) 3.5 3.3 2.2p0 queue free % 100 99 100cM capacity (veh/h) 841 956 1495
Direction, Lane # EB 1 NB 1 SB 1
Volume Total 8 42 86Volume Left 0 4 0Volume Right 8 0 0cSH 956 1495 1700Volume to Capacity 0.01 0.00 0.05Queue Length 95th (m) 0.2 0.1 0.0Control Delay (s) 8.8 0.7 0.0Lane LOS A AApproach Delay (s) 8.8 0.7 0.0Approach LOS A
Intersection Summary
Average Delay 0.7Intersection Capacity Utilization 16.4% ICU Level of Service AAnalysis Period (min) 15

HCM Unsignalized Intersection Capacity Analysis3: Nelkydd Lane & Brock Street East 11/16/2017
Future Background 2021 PM (Build) 11/06/2017 Baseline Synchro 10 Light ReportPage 1
Movement EBT EBR WBL WBT NBL NBR
Lane ConfigurationsTraffic Volume (veh/h) 340 55 6 188 46 18Future Volume (Veh/h) 340 55 6 188 46 18Sign Control Free Free StopGrade 0% 0% 0%Peak Hour Factor 0.86 0.86 0.50 0.92 0.77 0.64Hourly flow rate (vph) 395 64 12 204 60 28PedestriansLane Width (m)Walking Speed (m/s)Percent BlockageRight turn flare (veh)Median type None NoneMedian storage veh)Upstream signal (m)pX, platoon unblockedvC, conflicting volume 459 623 395vC1, stage 1 conf volvC2, stage 2 conf volvCu, unblocked vol 459 623 395tC, single (s) 4.1 6.4 6.2tC, 2 stage (s)tF (s) 2.2 3.5 3.3p0 queue free % 99 87 96cM capacity (veh/h) 1113 448 659
Direction, Lane # EB 1 EB 2 WB 1 NB 1
Volume Total 395 64 216 88Volume Left 0 0 12 60Volume Right 0 64 0 28cSH 1700 1700 1113 499Volume to Capacity 0.23 0.04 0.01 0.18Queue Length 95th (m) 0.0 0.0 0.3 5.1Control Delay (s) 0.0 0.0 0.6 13.8Lane LOS A BApproach Delay (s) 0.0 0.6 13.8Approach LOS B
Intersection Summary
Average Delay 1.7Intersection Capacity Utilization 28.2% ICU Level of Service AAnalysis Period (min) 15

HCM Unsignalized Intersection Capacity Analysis6: Brock Street East & Donland Lane 11/16/2017
Future Background 2021 PM (Build) 11/06/2017 Baseline Synchro 10 Light ReportPage 2
Movement EBL EBT WBT WBR SBL SBR
Lane ConfigurationsTraffic Volume (veh/h) 41 388 219 21 13 16Future Volume (Veh/h) 41 388 219 21 13 16Sign Control Free Free StopGrade 0% 0% 0%Peak Hour Factor 0.73 0.90 0.88 0.75 0.65 0.67Hourly flow rate (vph) 56 431 249 28 20 24Pedestrians 1 4 2Lane Width (m) 3.6 3.6 3.6Walking Speed (m/s) 1.2 1.2 1.2Percent Blockage 0 0 0Right turn flare (veh)Median type None NoneMedian storage veh)Upstream signal (m)pX, platoon unblockedvC, conflicting volume 279 812 266vC1, stage 1 conf volvC2, stage 2 conf volvCu, unblocked vol 279 812 266tC, single (s) 4.1 6.4 6.3tC, 2 stage (s)tF (s) 2.2 3.5 3.4p0 queue free % 96 94 97cM capacity (veh/h) 1282 334 761
Direction, Lane # EB 1 WB 1 SB 1
Volume Total 487 277 44Volume Left 56 0 20Volume Right 0 28 24cSH 1282 1700 481Volume to Capacity 0.04 0.16 0.09Queue Length 95th (m) 1.1 0.0 2.4Control Delay (s) 1.3 0.0 13.2Lane LOS A BApproach Delay (s) 1.3 0.0 13.2Approach LOS B
Intersection Summary
Average Delay 1.5Intersection Capacity Utilization 49.2% ICU Level of Service AAnalysis Period (min) 15

HCM Unsignalized Intersection Capacity Analysis8: Donland Lane & Low Boulevard 11/16/2017
Future Background 2021 PM (Build) 11/06/2017 Baseline Synchro 10 Light ReportPage 3
Movement EBL EBR NBL NBT SBT SBR
Lane ConfigurationsTraffic Volume (veh/h) 0 0 0 63 30 0Future Volume (Veh/h) 0 0 0 63 30 0Sign Control Stop Free FreeGrade 0% 0% 0%Peak Hour Factor 0.25 0.25 0.25 0.76 0.81 0.25Hourly flow rate (vph) 0 0 0 83 37 0Pedestrians 5Lane Width (m) 3.6Walking Speed (m/s) 1.2Percent Blockage 0Right turn flare (veh)Median type None NoneMedian storage veh)Upstream signal (m)pX, platoon unblockedvC, conflicting volume 125 42 42vC1, stage 1 conf volvC2, stage 2 conf volvCu, unblocked vol 125 42 42tC, single (s) 6.4 6.2 4.1tC, 2 stage (s)tF (s) 3.5 3.3 2.2p0 queue free % 100 100 100cM capacity (veh/h) 871 1030 1573
Direction, Lane # EB 1 NB 1 SB 1
Volume Total 0 83 37Volume Left 0 0 0Volume Right 0 0 0cSH 1700 1573 1700Volume to Capacity 0.00 0.00 0.02Queue Length 95th (m) 0.0 0.0 0.0Control Delay (s) 0.0 0.0 0.0Lane LOS AApproach Delay (s) 0.0 0.0 0.0Approach LOS A
Intersection Summary
Average Delay 0.0Intersection Capacity Utilization 8.2% ICU Level of Service AAnalysis Period (min) 15

HCM Unsignalized Intersection Capacity Analysis3: Nelkydd Lane & Brock Street East 11/16/2017
Future Background 2026 AM (Horizon) 11/06/2017 Baseline Synchro 10 Light ReportPage 1
Movement EBT EBR WBL WBT NBL NBR
Lane ConfigurationsTraffic Volume (veh/h) 171 115 54 284 69 22Future Volume (Veh/h) 171 115 54 284 69 22Sign Control Free Free StopGrade 0% 0% 0%Peak Hour Factor 0.89 0.58 0.61 0.86 0.82 0.69Hourly flow rate (vph) 192 198 89 330 84 32PedestriansLane Width (m)Walking Speed (m/s)Percent BlockageRight turn flare (veh)Median type None NoneMedian storage veh)Upstream signal (m)pX, platoon unblockedvC, conflicting volume 390 700 192vC1, stage 1 conf volvC2, stage 2 conf volvCu, unblocked vol 390 700 192tC, single (s) 4.2 6.5 6.4tC, 2 stage (s)tF (s) 2.3 3.6 3.5p0 queue free % 92 77 96cM capacity (veh/h) 1147 363 799
Direction, Lane # EB 1 EB 2 WB 1 NB 1
Volume Total 192 198 419 116Volume Left 0 0 89 84Volume Right 0 198 0 32cSH 1700 1700 1147 427Volume to Capacity 0.11 0.12 0.08 0.27Queue Length 95th (m) 0.0 0.0 2.0 8.7Control Delay (s) 0.0 0.0 2.4 16.5Lane LOS A CApproach Delay (s) 0.0 2.4 16.5Approach LOS C
Intersection Summary
Average Delay 3.2Intersection Capacity Utilization 42.1% ICU Level of Service AAnalysis Period (min) 15

HCM Unsignalized Intersection Capacity Analysis6: Brock Street East & Donland Lane 11/16/2017
Future Background 2026 AM (Horizon) 11/06/2017 Baseline Synchro 10 Light ReportPage 2
Movement EBL EBT WBT WBR SBL SBR
Lane ConfigurationsTraffic Volume (veh/h) 19 260 352 6 36 22Future Volume (Veh/h) 19 260 352 6 36 22Sign Control Free Free StopGrade 0% 0% 0%Peak Hour Factor 0.48 0.75 0.88 0.50 0.64 0.69Hourly flow rate (vph) 40 347 400 12 56 32Pedestrians 10Lane Width (m) 3.6Walking Speed (m/s) 1.2Percent Blockage 1Right turn flare (veh)Median type None NoneMedian storage veh)Upstream signal (m)pX, platoon unblockedvC, conflicting volume 422 843 416vC1, stage 1 conf volvC2, stage 2 conf volvCu, unblocked vol 422 843 416tC, single (s) 4.2 6.4 6.2tC, 2 stage (s)tF (s) 2.3 3.5 3.3p0 queue free % 96 83 95cM capacity (veh/h) 1086 322 627
Direction, Lane # EB 1 WB 1 SB 1
Volume Total 387 412 88Volume Left 40 0 56Volume Right 0 12 32cSH 1086 1700 391Volume to Capacity 0.04 0.24 0.23Queue Length 95th (m) 0.9 0.0 6.8Control Delay (s) 1.2 0.0 16.9Lane LOS A CApproach Delay (s) 1.2 0.0 16.9Approach LOS C
Intersection Summary
Average Delay 2.2Intersection Capacity Utilization 39.3% ICU Level of Service AAnalysis Period (min) 15

HCM Unsignalized Intersection Capacity Analysis8: Donland Lane & Low Boulevard 11/16/2017
Future Background 2026 AM (Horizon) 11/06/2017 Baseline Synchro 10 Light ReportPage 3
Movement EBL EBR NBL NBT SBT SBR
Lane ConfigurationsTraffic Volume (veh/h) 0 2 1 28 64 0Future Volume (Veh/h) 0 2 1 28 64 0Sign Control Stop Free FreeGrade 0% 0% 0%Peak Hour Factor 0.25 0.25 0.25 0.72 0.73 0.25Hourly flow rate (vph) 0 8 4 39 88 0Pedestrians 11 2Lane Width (m) 3.6 3.6Walking Speed (m/s) 1.2 1.2Percent Blockage 1 0Right turn flare (veh)Median type None NoneMedian storage veh)Upstream signal (m)pX, platoon unblockedvC, conflicting volume 148 99 99vC1, stage 1 conf volvC2, stage 2 conf volvCu, unblocked vol 148 99 99tC, single (s) 6.4 6.2 4.1tC, 2 stage (s)tF (s) 3.5 3.3 2.2p0 queue free % 100 99 100cM capacity (veh/h) 837 953 1493
Direction, Lane # EB 1 NB 1 SB 1
Volume Total 8 43 88Volume Left 0 4 0Volume Right 8 0 0cSH 953 1493 1700Volume to Capacity 0.01 0.00 0.05Queue Length 95th (m) 0.2 0.1 0.0Control Delay (s) 8.8 0.7 0.0Lane LOS A AApproach Delay (s) 8.8 0.7 0.0Approach LOS A
Intersection Summary
Average Delay 0.7Intersection Capacity Utilization 16.4% ICU Level of Service AAnalysis Period (min) 15

HCM Unsignalized Intersection Capacity Analysis3: Nelkydd Lane & Brock Street East 11/16/2017
Future Background 2026 PM (Horizon) 11/06/2017 Baseline Synchro 10 Light ReportPage 1
Movement EBT EBR WBL WBT NBL NBR
Lane ConfigurationsTraffic Volume (veh/h) 357 55 6 198 46 18Future Volume (Veh/h) 357 55 6 198 46 18Sign Control Free Free StopGrade 0% 0% 0%Peak Hour Factor 0.86 0.86 0.50 0.92 0.77 0.64Hourly flow rate (vph) 415 64 12 215 60 28PedestriansLane Width (m)Walking Speed (m/s)Percent BlockageRight turn flare (veh)Median type None NoneMedian storage veh)Upstream signal (m)pX, platoon unblockedvC, conflicting volume 479 654 415vC1, stage 1 conf volvC2, stage 2 conf volvCu, unblocked vol 479 654 415tC, single (s) 4.1 6.4 6.2tC, 2 stage (s)tF (s) 2.2 3.5 3.3p0 queue free % 99 86 96cM capacity (veh/h) 1094 430 642
Direction, Lane # EB 1 EB 2 WB 1 NB 1
Volume Total 415 64 227 88Volume Left 0 0 12 60Volume Right 0 64 0 28cSH 1700 1700 1094 480Volume to Capacity 0.24 0.04 0.01 0.18Queue Length 95th (m) 0.0 0.0 0.3 5.3Control Delay (s) 0.0 0.0 0.5 14.2Lane LOS A BApproach Delay (s) 0.0 0.5 14.2Approach LOS B
Intersection Summary
Average Delay 1.7Intersection Capacity Utilization 29.1% ICU Level of Service AAnalysis Period (min) 15

HCM Unsignalized Intersection Capacity Analysis6: Brock Street East & Donland Lane 11/16/2017
Future Background 2026 PM (Horizon) 11/06/2017 Baseline Synchro 10 Light ReportPage 2
Movement EBL EBT WBT WBR SBL SBR
Lane ConfigurationsTraffic Volume (veh/h) 41 408 230 21 13 16Future Volume (Veh/h) 41 408 230 21 13 16Sign Control Free Free StopGrade 0% 0% 0%Peak Hour Factor 0.73 0.90 0.88 0.75 0.65 0.67Hourly flow rate (vph) 56 453 261 28 20 24Pedestrians 1 4 2Lane Width (m) 3.6 3.6 3.6Walking Speed (m/s) 1.2 1.2 1.2Percent Blockage 0 0 0Right turn flare (veh)Median type None NoneMedian storage veh)Upstream signal (m)pX, platoon unblockedvC, conflicting volume 291 846 278vC1, stage 1 conf volvC2, stage 2 conf volvCu, unblocked vol 291 846 278tC, single (s) 4.1 6.4 6.3tC, 2 stage (s)tF (s) 2.2 3.5 3.4p0 queue free % 96 94 97cM capacity (veh/h) 1269 319 749
Direction, Lane # EB 1 WB 1 SB 1
Volume Total 509 289 44Volume Left 56 0 20Volume Right 0 28 24cSH 1269 1700 464Volume to Capacity 0.04 0.17 0.09Queue Length 95th (m) 1.1 0.0 2.5Control Delay (s) 1.3 0.0 13.6Lane LOS A BApproach Delay (s) 1.3 0.0 13.6Approach LOS B
Intersection Summary
Average Delay 1.5Intersection Capacity Utilization 50.8% ICU Level of Service AAnalysis Period (min) 15

HCM Unsignalized Intersection Capacity Analysis8: Donland Lane & Low Boulevard 11/16/2017
Future Background 2026 PM (Horizon) 11/06/2017 Baseline Synchro 10 Light ReportPage 3
Movement EBL EBR NBL NBT SBT SBR
Lane ConfigurationsTraffic Volume (veh/h) 0 0 0 66 32 0Future Volume (Veh/h) 0 0 0 66 32 0Sign Control Stop Free FreeGrade 0% 0% 0%Peak Hour Factor 0.25 0.25 0.25 0.76 0.81 0.25Hourly flow rate (vph) 0 0 0 87 40 0Pedestrians 5Lane Width (m) 3.6Walking Speed (m/s) 1.2Percent Blockage 0Right turn flare (veh)Median type None NoneMedian storage veh)Upstream signal (m)pX, platoon unblockedvC, conflicting volume 132 45 45vC1, stage 1 conf volvC2, stage 2 conf volvCu, unblocked vol 132 45 45tC, single (s) 6.4 6.2 4.1tC, 2 stage (s)tF (s) 3.5 3.3 2.2p0 queue free % 100 100 100cM capacity (veh/h) 863 1026 1570
Direction, Lane # EB 1 NB 1 SB 1
Volume Total 0 87 40Volume Left 0 0 0Volume Right 0 0 0cSH 1700 1570 1700Volume to Capacity 0.00 0.00 0.02Queue Length 95th (m) 0.0 0.0 0.0Control Delay (s) 0.0 0.0 0.0Lane LOS AApproach Delay (s) 0.0 0.0 0.0Approach LOS A
Intersection Summary
Average Delay 0.0Intersection Capacity Utilization 8.2% ICU Level of Service AAnalysis Period (min) 15

Appendix F – Email Response from the
Township of Uxbridge

1
Madeleine Catz
From: Jo Ann. Merrick <[email protected]>
Sent: November-03-17 1:04 PM
To: Madeleine Catz
Subject: RE: Brock Street East Proposed Development
There is nothing at this time. We have had people inquiring about different properties in that area, but until we get an application, we don’t really know.
Jo Ann Merrick Administrative Assistant Public Works & Operations/ Development Services Township of Uxbridge 51 Toronto St. S. Uxbridge, ON L9P 1T1 (t)905-852-9181 ext 202 (f) 905-852-9674
From: Madeleine Catz [mailto:[email protected]] Sent: Friday, November 03, 2017 12:57 PM To: Jo Ann. Merrick <[email protected]> Subject: RE: Brock Street East Proposed Development Hi Jo Ann, Thank you for getting back to me. Would you know of any future developments in the area that I would be able consider in my transportation study? Sincerely, Madeleine Catz, B.Eng., EIT Transportation Analyst o: 905-503-2563 ext. 207 c: 647-893-1640 e: [email protected] w: www.nextrans.ca NexTrans Consulting Engineers A Division of NextEng Consulting Group Inc. 520 Industrial Parkway South, Suite 201 Aurora ON L4G 6W8
From: Jo Ann. Merrick [mailto:[email protected]] Sent: November-03-17 11:39 AM To: Madeleine Catz <[email protected]> Subject: RE: Brock Street East Proposed Development

2
Madeleine We do not have any applications for 226 Brock St. at this time.
Jo Ann Merrick Administrative Assistant Public Works & Operations/ Development Services Township of Uxbridge 51 Toronto St. S. Uxbridge, ON L9P 1T1 (t)905-852-9181 ext 202 (f) 905-852-9674
From: Madeleine Catz [mailto:[email protected]] Sent: Thursday, November 02, 2017 4:30 PM To: Jo Ann. Merrick <[email protected]> Subject: Brock Street East Proposed Development Good afternoon Jo Ann, I am working on the Transportation Study for a proposed mixed-use development at the northeast corner of Brock Street East and Donland Lane. Would you be able to provide me with any future developments that would need to be taken into account during our horizon period, 2021-2026? The Region of Durham mentioned how 54 units are being built just south of the proposed site at 226 Brock Street East, would you have more information on this? Sincerely, Madeleine Catz, B.Eng., EIT Transportation Analyst o: 905-503-2563 ext. 207 c: 647-893-1640 e: [email protected] w: www.nextrans.ca NexTrans Consulting Engineers A Division of NextEng Consulting Group Inc. 520 Industrial Parkway South, Suite 201 Aurora ON L4G 6W8

Appendix G – TTS Data

TTS AM DataColumn1 Column2 Column3 Column4 Column5 Column6 Column7 Column8 Column9 Column10 Column11 Column12 Column13 Column14 Column15 Column16 Column17 Column18 Column19 Column20 Column21
Fri Nov 03 2017 16:07:58 GMT-0400 (Eastern Daylight Time) - Run Time: 2920ms
Cross Tabulation Query Form - Trip - 2011
Row: 2006 GTA zone of origin - gta06_orig
Column: Planning district of destination - pd_dest
Table: Primary travel mode of trip - mode_prime
Filters:
(2006 GTA zone of origin - gta06_orig In 1317
and
Start time of trip - start_time In 600-900)
Trip 2011
Table: Transit excluding GO rail
Oshawa
1317 31
Trip 2011
Table: Auto driver
PD 1 of Toronto PD 5 of Toronto PD 11 of Toronto PD 13 of Toronto PD 16 of Toronto Uxbridge Scugog Ajax Clarington Georgina Newmarket Aurora Richmond Hill Whitchurch-Stouffville Markham King Vaughan Mississauga Kawartha Lakes Peterborough
1317 57 40 24 40 40 696 135 17 17 31 105 48 17 111 231 31 50 22 24 24
Trip 2011
Table: Auto passenger
Uxbridge Aurora Markham
1317 259 62 24
Trip 2011
Table: School bus
Uxbridge
1317 53
Trip 2011
Table: Walk
Uxbridge
1317 374

TTS PM DataColumn1 Column2 Column3 Column4 Column5 Column6 Column7 Column8 Column9 Column10 Column11 Column12 Column13 Column14 Column15 Column16 Column17Fri Nov 03 2017 16:08:41 GMT-0400 (Eastern Daylight Time) - Run Time: 2959ms
Cross Tabulation Query Form - Trip - 2011
Row: 2006 GTA zone of origin - gta06_origColumn: Planning district of destination - pd_destTable: Primary travel mode of trip - mode_prime
Filters:(2006 GTA zone of origin - gta06_orig In 1317andStart time of trip - start_time In 1600-1900)
Trip 2011 Table: Auto driver
PD 4 of Toronto PD 11 of Toronto PD 13 of Toronto Brock Uxbridge Scugog Pickering Ajax Whitby Oshawa Georgina Newmarket Richmond Hill Whitchurch-Stouffville Markham Kawartha Lakes1317 15 24 15 19 639 119 18 22 64 39 38 33 45 61 50 32
Trip 2011 Table: Auto passenger
PD 13 of Toronto Uxbridge Scugog Whitby East Gwillimbury Richmond Hill Markham
1317 15 189 15 44 13 53 37
Trip 2011 Table: Walk
Uxbridge1317 62
Appendix H – Future Total Traffic Levelof Service Calculations

HCM Unsignalized Intersection Capacity Analysis3: Nelkydd Lane/Herrema Boulevard & Brock Street East 11/23/2017
Future Total 2021 AM (Build) 11/06/2017 Baseline Synchro 10 Light ReportPage 1
Movement EBL EBT EBR WBL WBT WBR NBL NBT NBR SBL SBT SBR
Lane ConfigurationsTraffic Volume (veh/h) 45 163 110 54 289 11 69 1 22 52 8 74Future Volume (Veh/h) 45 163 110 54 289 11 69 1 22 52 8 74Sign Control Free Free Stop StopGrade 0% 0% 0% 0%Peak Hour Factor 0.92 0.89 0.58 0.61 0.86 0.92 0.82 0.92 0.69 0.92 0.92 0.92Hourly flow rate (vph) 49 183 190 89 336 12 84 1 32 57 9 80PedestriansLane Width (m)Walking Speed (m/s)Percent BlockageRight turn flare (veh)Median type None NoneMedian storage veh)Upstream signal (m)pX, platoon unblockedvC, conflicting volume 348 373 880 807 183 828 985 336vC1, stage 1 conf volvC2, stage 2 conf volvCu, unblocked vol 348 373 880 807 183 828 985 336tC, single (s) 4.1 4.2 7.2 6.5 6.4 7.1 6.5 6.2tC, 2 stage (s)tF (s) 2.2 2.3 3.6 4.0 3.5 3.5 4.0 3.3p0 queue free % 96 92 59 100 96 78 96 89cM capacity (veh/h) 1211 1164 203 279 808 254 220 706
Direction, Lane # EB 1 EB 2 EB 3 WB 1 WB 2 WB 3 NB 1 NB 2 SB 1 SB 2
Volume Total 49 183 190 89 336 12 84 33 57 89Volume Left 49 0 0 89 0 0 84 0 57 0Volume Right 0 0 190 0 0 12 0 32 0 80cSH 1211 1700 1700 1164 1700 1700 203 764 254 577Volume to Capacity 0.04 0.11 0.11 0.08 0.20 0.01 0.41 0.04 0.22 0.15Queue Length 95th (m) 1.0 0.0 0.0 2.0 0.0 0.0 15.0 1.1 6.7 4.3Control Delay (s) 8.1 0.0 0.0 8.3 0.0 0.0 34.6 9.9 23.2 12.4Lane LOS A A D A C BApproach Delay (s) 0.9 1.7 27.6 16.6Approach LOS D C
Intersection Summary
Average Delay 6.1Intersection Capacity Utilization 39.0% ICU Level of Service AAnalysis Period (min) 15

HCM Unsignalized Intersection Capacity Analysis6: Brock Street East & Site Access 11/23/2017
Future Total 2021 AM (Build) 11/06/2017 Baseline Synchro 10 Light ReportPage 2
Movement EBL EBT WBT WBR SBL SBR
Lane ConfigurationsTraffic Volume (veh/h) 0 237 329 1 0 19Future Volume (Veh/h) 0 237 329 1 0 19Sign Control Free Free StopGrade 0% 0% 0%Peak Hour Factor 0.92 0.92 0.92 0.92 0.92 0.92Hourly flow rate (vph) 0 258 358 1 0 21PedestriansLane Width (m)Walking Speed (m/s)Percent BlockageRight turn flare (veh)Median type None NoneMedian storage veh)Upstream signal (m)pX, platoon unblockedvC, conflicting volume 359 616 358vC1, stage 1 conf volvC2, stage 2 conf volvCu, unblocked vol 359 616 358tC, single (s) 4.1 6.4 6.2tC, 2 stage (s)tF (s) 2.2 3.5 3.3p0 queue free % 100 100 97cM capacity (veh/h) 1200 454 686
Direction, Lane # EB 1 WB 1 SB 1
Volume Total 258 359 21Volume Left 0 0 0Volume Right 0 1 21cSH 1700 1700 686Volume to Capacity 0.15 0.21 0.03Queue Length 95th (m) 0.0 0.0 0.8Control Delay (s) 0.0 0.0 10.4Lane LOS BApproach Delay (s) 0.0 0.0 10.4Approach LOS B
Intersection Summary
Average Delay 0.3Intersection Capacity Utilization 27.4% ICU Level of Service AAnalysis Period (min) 15

HCM Unsignalized Intersection Capacity Analysis8: Herrema Boulevard /Herrema Boulevard & Low Boulevard 11/23/2017
Future Total 2021 AM (Build) 11/06/2017 Baseline Synchro 10 Light ReportPage 3
Movement EBL EBT EBR WBL WBT WBR NBL NBT NBR SBL SBT SBR
Lane ConfigurationsTraffic Volume (veh/h) 0 0 22 20 0 0 5 27 7 0 63 0Future Volume (Veh/h) 0 0 22 20 0 0 5 27 7 0 63 0Sign Control Stop Stop Free FreeGrade 0% 0% 0% 0%Peak Hour Factor 0.92 0.92 0.92 0.92 0.92 0.92 0.92 0.92 0.92 0.92 0.92 0.92Hourly flow rate (vph) 0 0 24 22 0 0 5 29 8 0 68 0PedestriansLane Width (m)Walking Speed (m/s)Percent BlockageRight turn flare (veh)Median type None NoneMedian storage veh)Upstream signal (m)pX, platoon unblockedvC, conflicting volume 111 115 68 135 111 33 68 37vC1, stage 1 conf volvC2, stage 2 conf volvCu, unblocked vol 111 115 68 135 111 33 68 37tC, single (s) 7.1 6.5 6.2 7.1 6.5 6.2 4.1 4.1tC, 2 stage (s)tF (s) 3.5 4.0 3.3 3.5 4.0 3.3 2.2 2.2p0 queue free % 100 100 98 97 100 100 100 100cM capacity (veh/h) 865 773 995 814 777 1041 1533 1574
Direction, Lane # EB 1 WB 1 NB 1 SB 1
Volume Total 24 22 42 68Volume Left 0 22 5 0Volume Right 24 0 8 0cSH 995 814 1533 1574Volume to Capacity 0.02 0.03 0.00 0.00Queue Length 95th (m) 0.6 0.7 0.1 0.0Control Delay (s) 8.7 9.5 0.9 0.0Lane LOS A A AApproach Delay (s) 8.7 9.5 0.9 0.0Approach LOS A A
Intersection Summary
Average Delay 2.9Intersection Capacity Utilization 20.6% ICU Level of Service AAnalysis Period (min) 15

HCM Unsignalized Intersection Capacity Analysis11: Herrema Boulevard/Herrema Boulevard & Internal Driveway 1 11/23/2017
Future Total 2021 AM (Build) 11/06/2017 Baseline Synchro 10 Light ReportPage 4
Movement EBL EBT EBR WBL WBT WBR NBL NBT NBR SBL SBT SBR
Lane ConfigurationsTraffic Volume (veh/h) 0 0 16 14 0 0 4 36 17 0 105 0Future Volume (Veh/h) 0 0 16 14 0 0 4 36 17 0 105 0Sign Control Stop Stop Free FreeGrade 0% 0% 0% 0%Peak Hour Factor 0.92 0.92 0.92 0.92 0.92 0.92 0.92 0.92 0.92 0.92 0.92 0.92Hourly flow rate (vph) 0 0 17 15 0 0 4 39 18 0 114 0PedestriansLane Width (m)Walking Speed (m/s)Percent BlockageRight turn flare (veh)Median type None NoneMedian storage veh)Upstream signal (m)pX, platoon unblockedvC, conflicting volume 170 179 114 187 170 48 114 57vC1, stage 1 conf volvC2, stage 2 conf volvCu, unblocked vol 170 179 114 187 170 48 114 57tC, single (s) 7.1 6.5 6.2 7.1 6.5 6.2 4.1 4.1tC, 2 stage (s)tF (s) 3.5 4.0 3.3 3.5 4.0 3.3 2.2 2.2p0 queue free % 100 100 98 98 100 100 100 100cM capacity (veh/h) 792 713 939 758 721 1021 1475 1547
Direction, Lane # EB 1 WB 1 NB 1 SB 1
Volume Total 17 15 61 114Volume Left 0 15 4 0Volume Right 17 0 18 0cSH 939 758 1475 1547Volume to Capacity 0.02 0.02 0.00 0.00Queue Length 95th (m) 0.4 0.5 0.1 0.0Control Delay (s) 8.9 9.8 0.5 0.0Lane LOS A A AApproach Delay (s) 8.9 9.8 0.5 0.0Approach LOS A A
Intersection Summary
Average Delay 1.6Intersection Capacity Utilization 20.5% ICU Level of Service AAnalysis Period (min) 15

HCM Unsignalized Intersection Capacity Analysis14: Internal Driveway 2 & Low Boulevard 11/23/2017
Future Total 2021 AM (Build) 11/06/2017 Baseline Synchro 10 Light ReportPage 5
Movement EBT EBR WBL WBT NBL NBR
Lane ConfigurationsTraffic Volume (veh/h) 0 0 3 2 0 16Future Volume (Veh/h) 0 0 3 2 0 16Sign Control Free Free StopGrade 0% 0% 0%Peak Hour Factor 0.92 0.92 0.92 0.92 0.92 0.92Hourly flow rate (vph) 0 0 3 2 0 17PedestriansLane Width (m)Walking Speed (m/s)Percent BlockageRight turn flare (veh)Median type None NoneMedian storage veh)Upstream signal (m)pX, platoon unblockedvC, conflicting volume 0 8 0vC1, stage 1 conf volvC2, stage 2 conf volvCu, unblocked vol 0 8 0tC, single (s) 4.1 6.4 6.2tC, 2 stage (s)tF (s) 2.2 3.5 3.3p0 queue free % 100 100 98cM capacity (veh/h) 1623 1011 1085
Direction, Lane # EB 1 WB 1 NB 1
Volume Total 0 5 17Volume Left 0 3 0Volume Right 0 0 17cSH 1700 1623 1085Volume to Capacity 0.00 0.00 0.02Queue Length 95th (m) 0.0 0.0 0.4Control Delay (s) 0.0 4.3 8.4Lane LOS A AApproach Delay (s) 0.0 4.3 8.4Approach LOS A
Intersection Summary
Average Delay 7.5Intersection Capacity Utilization 13.3% ICU Level of Service AAnalysis Period (min) 15

HCM Unsignalized Intersection Capacity Analysis3: Nelkydd Lane/Herrema Boulevard & Brock Street East 11/23/2017
Future Total 2021 PM (Build) 11/06/2017 Baseline Synchro 10 Light ReportPage 1
Movement EBL EBT EBR WBL WBT WBR NBL NBT NBR SBL SBT SBR
Lane ConfigurationsTraffic Volume (veh/h) 125 340 50 6 196 39 46 3 18 30 7 68Future Volume (Veh/h) 125 340 50 6 196 39 46 3 18 30 7 68Sign Control Free Free Stop StopGrade 0% 0% 0% 0%Peak Hour Factor 0.92 0.89 0.58 0.61 0.86 0.92 0.82 0.92 0.69 0.92 0.92 0.92Hourly flow rate (vph) 136 382 86 10 228 42 56 3 26 33 8 74PedestriansLane Width (m)Walking Speed (m/s)Percent BlockageRight turn flare (veh)Median type None NoneMedian storage veh)Upstream signal (m)pX, platoon unblockedvC, conflicting volume 270 468 980 944 382 930 988 228vC1, stage 1 conf volvC2, stage 2 conf volvCu, unblocked vol 270 468 980 944 382 930 988 228tC, single (s) 4.1 4.2 7.2 6.5 6.4 7.1 6.5 6.2tC, 2 stage (s)tF (s) 2.2 2.3 3.6 4.0 3.5 3.5 4.0 3.3p0 queue free % 89 99 69 99 96 85 96 91cM capacity (veh/h) 1293 1073 179 232 621 215 219 811
Direction, Lane # EB 1 EB 2 EB 3 WB 1 WB 2 WB 3 NB 1 NB 2 SB 1 SB 2
Volume Total 136 382 86 10 228 42 56 29 33 82Volume Left 136 0 0 10 0 0 56 0 33 0Volume Right 0 0 86 0 0 42 0 26 0 74cSH 1293 1700 1700 1073 1700 1700 179 530 215 642Volume to Capacity 0.11 0.22 0.05 0.01 0.13 0.02 0.31 0.05 0.15 0.13Queue Length 95th (m) 2.8 0.0 0.0 0.2 0.0 0.0 10.1 1.4 4.3 3.5Control Delay (s) 8.1 0.0 0.0 8.4 0.0 0.0 34.1 12.2 24.8 11.4Lane LOS A A D B C BApproach Delay (s) 1.8 0.3 26.6 15.3Approach LOS D C
Intersection Summary
Average Delay 4.8Intersection Capacity Utilization 40.4% ICU Level of Service AAnalysis Period (min) 15

HCM Unsignalized Intersection Capacity Analysis6: Brock Street East & Site Access 11/23/2017
Future Total 2021 PM (Build) 11/06/2017 Baseline Synchro 10 Light ReportPage 2
Movement EBL EBT WBT WBR SBL SBR
Lane ConfigurationsTraffic Volume (veh/h) 0 388 212 5 0 8Future Volume (Veh/h) 0 388 212 5 0 8Sign Control Free Free StopGrade 0% 0% 0%Peak Hour Factor 0.92 0.92 0.92 0.92 0.92 0.92Hourly flow rate (vph) 0 422 230 5 0 9PedestriansLane Width (m)Walking Speed (m/s)Percent BlockageRight turn flare (veh)Median type None NoneMedian storage veh)Upstream signal (m)pX, platoon unblockedvC, conflicting volume 235 654 232vC1, stage 1 conf volvC2, stage 2 conf volvCu, unblocked vol 235 654 232tC, single (s) 4.1 6.4 6.2tC, 2 stage (s)tF (s) 2.2 3.5 3.3p0 queue free % 100 100 99cM capacity (veh/h) 1332 431 807
Direction, Lane # EB 1 WB 1 SB 1
Volume Total 422 235 9Volume Left 0 0 0Volume Right 0 5 9cSH 1700 1700 807Volume to Capacity 0.25 0.14 0.01Queue Length 95th (m) 0.0 0.0 0.3Control Delay (s) 0.0 0.0 9.5Lane LOS AApproach Delay (s) 0.0 0.0 9.5Approach LOS A
Intersection Summary
Average Delay 0.1Intersection Capacity Utilization 23.8% ICU Level of Service AAnalysis Period (min) 15

HCM Unsignalized Intersection Capacity Analysis8: Herrema Boulevard & Low Boulevard 11/23/2017
Future Total 2021 PM (Build) 11/06/2017 Baseline Synchro 10 Light ReportPage 3
Movement EBL EBT EBR WBL WBT WBR NBL NBT NBR SBL SBT SBR
Lane ConfigurationsTraffic Volume (veh/h) 0 0 7 10 0 0 14 63 30 0 30 0Future Volume (Veh/h) 0 0 7 10 0 0 14 63 30 0 30 0Sign Control Stop Stop Free FreeGrade 0% 0% 0% 0%Peak Hour Factor 0.92 0.92 0.92 0.92 0.92 0.92 0.92 0.92 0.92 0.92 0.92 0.92Hourly flow rate (vph) 0 0 8 11 0 0 15 68 33 0 33 0PedestriansLane Width (m)Walking Speed (m/s)Percent BlockageRight turn flare (veh)Median type None NoneMedian storage veh)Upstream signal (m)pX, platoon unblockedvC, conflicting volume 148 164 33 156 148 84 33 101vC1, stage 1 conf volvC2, stage 2 conf volvCu, unblocked vol 148 164 33 156 148 84 33 101tC, single (s) 7.1 6.5 6.2 7.1 6.5 6.2 4.1 4.1tC, 2 stage (s)tF (s) 3.5 4.0 3.3 3.5 4.0 3.3 2.2 2.2p0 queue free % 100 100 99 99 100 100 99 100cM capacity (veh/h) 815 722 1041 799 737 975 1579 1491
Direction, Lane # EB 1 WB 1 NB 1 SB 1
Volume Total 8 11 116 33Volume Left 0 11 15 0Volume Right 8 0 33 0cSH 1041 799 1579 1491Volume to Capacity 0.01 0.01 0.01 0.00Queue Length 95th (m) 0.2 0.3 0.2 0.0Control Delay (s) 8.5 9.6 1.0 0.0Lane LOS A A AApproach Delay (s) 8.5 9.6 1.0 0.0Approach LOS A A
Intersection Summary
Average Delay 1.7Intersection Capacity Utilization 26.5% ICU Level of Service AAnalysis Period (min) 15

HCM Unsignalized Intersection Capacity Analysis11: Herrema Boulevard /Herrema Boulevard & Internal Driveway 1 11/23/2017
Future Total 2021 PM (Build) 11/06/2017 Baseline Synchro 10 Light ReportPage 4
Movement EBL EBT EBR WBL WBT WBR NBL NBT NBR SBL SBT SBR
Lane ConfigurationsTraffic Volume (veh/h) 0 0 5 49 0 0 9 106 52 0 47 0Future Volume (Veh/h) 0 0 5 49 0 0 9 106 52 0 47 0Sign Control Stop Stop Free FreeGrade 0% 0% 0% 0%Peak Hour Factor 0.92 0.92 0.92 0.92 0.92 0.92 0.92 0.92 0.92 0.92 0.92 0.92Hourly flow rate (vph) 0 0 5 53 0 0 10 115 57 0 51 0PedestriansLane Width (m)Walking Speed (m/s)Percent BlockageRight turn flare (veh)Median type None NoneMedian storage veh)Upstream signal (m)pX, platoon unblockedvC, conflicting volume 214 243 51 220 214 144 51 172vC1, stage 1 conf volvC2, stage 2 conf volvCu, unblocked vol 214 243 51 220 214 144 51 172tC, single (s) 7.1 6.5 6.2 7.1 6.5 6.2 4.1 4.1tC, 2 stage (s)tF (s) 3.5 4.0 3.3 3.5 4.0 3.3 2.2 2.2p0 queue free % 100 100 100 93 100 100 99 100cM capacity (veh/h) 739 655 1017 729 679 904 1555 1405
Direction, Lane # EB 1 WB 1 NB 1 SB 1
Volume Total 5 53 182 51Volume Left 0 53 10 0Volume Right 5 0 57 0cSH 1017 729 1555 1405Volume to Capacity 0.00 0.07 0.01 0.00Queue Length 95th (m) 0.1 1.9 0.2 0.0Control Delay (s) 8.6 10.3 0.5 0.0Lane LOS A B AApproach Delay (s) 8.6 10.3 0.5 0.0Approach LOS A B
Intersection Summary
Average Delay 2.3Intersection Capacity Utilization 32.0% ICU Level of Service AAnalysis Period (min) 15

HCM Unsignalized Intersection Capacity Analysis14: Internal Driveway 2 & Low Boulevard 11/23/2017
Future Total 2021 PM (Build) 11/06/2017 Baseline Synchro 10 Light ReportPage 5
Movement EBT EBR WBL WBT NBL NBR
Lane ConfigurationsTraffic Volume (veh/h) 0 0 8 0 0 5Future Volume (Veh/h) 0 0 8 0 0 5Sign Control Free Free StopGrade 0% 0% 0%Peak Hour Factor 0.92 0.92 0.92 0.92 0.92 0.92Hourly flow rate (vph) 0 0 9 0 0 5PedestriansLane Width (m)Walking Speed (m/s)Percent BlockageRight turn flare (veh)Median type None NoneMedian storage veh)Upstream signal (m)pX, platoon unblockedvC, conflicting volume 0 18 0vC1, stage 1 conf volvC2, stage 2 conf volvCu, unblocked vol 0 18 0tC, single (s) 4.1 6.4 6.2tC, 2 stage (s)tF (s) 2.2 3.5 3.3p0 queue free % 99 100 100cM capacity (veh/h) 1623 994 1085
Direction, Lane # EB 1 WB 1 NB 1
Volume Total 0 9 5Volume Left 0 9 0Volume Right 0 0 5cSH 1700 1623 1085Volume to Capacity 0.00 0.01 0.00Queue Length 95th (m) 0.0 0.1 0.1Control Delay (s) 0.0 7.2 8.3Lane LOS A AApproach Delay (s) 0.0 7.2 8.3Approach LOS A
Intersection Summary
Average Delay 7.6Intersection Capacity Utilization 13.3% ICU Level of Service AAnalysis Period (min) 15

HCM Unsignalized Intersection Capacity Analysis3: Nelkydd Lane/Herrema Boulevard & Brock Street East 11/23/2017
Future Total 2026 AM (Horizon) 11/06/2017 Baseline Synchro 10 Light ReportPage 1
Movement EBL EBT EBR WBL WBT WBR NBL NBT NBR SBL SBT SBR
Lane ConfigurationsTraffic Volume (veh/h) 45 171 110 54 303 11 69 1 22 52 8 74Future Volume (Veh/h) 45 171 110 54 303 11 69 1 22 52 8 74Sign Control Free Free Stop StopGrade 0% 0% 0% 0%Peak Hour Factor 0.92 0.89 0.58 0.61 0.86 0.92 0.82 0.92 0.69 0.92 0.92 0.92Hourly flow rate (vph) 49 192 190 89 352 12 84 1 32 57 9 80PedestriansLane Width (m)Walking Speed (m/s)Percent BlockageRight turn flare (veh)Median type None NoneMedian storage veh)Upstream signal (m)pX, platoon unblockedvC, conflicting volume 364 382 904 832 192 852 1010 352vC1, stage 1 conf volvC2, stage 2 conf volvCu, unblocked vol 364 382 904 832 192 852 1010 352tC, single (s) 4.1 4.2 7.2 6.5 6.4 7.1 6.5 6.2tC, 2 stage (s)tF (s) 2.2 2.3 3.6 4.0 3.5 3.5 4.0 3.3p0 queue free % 96 92 57 100 96 77 96 88cM capacity (veh/h) 1195 1155 195 270 799 244 212 692
Direction, Lane # EB 1 EB 2 EB 3 WB 1 WB 2 WB 3 NB 1 NB 2 SB 1 SB 2
Volume Total 49 192 190 89 352 12 84 33 57 89Volume Left 49 0 0 89 0 0 84 0 57 0Volume Right 0 0 190 0 0 12 0 32 0 80cSH 1195 1700 1700 1155 1700 1700 195 754 244 563Volume to Capacity 0.04 0.11 0.11 0.08 0.21 0.01 0.43 0.04 0.23 0.16Queue Length 95th (m) 1.0 0.0 0.0 2.0 0.0 0.0 15.9 1.1 7.1 4.5Control Delay (s) 8.1 0.0 0.0 8.4 0.0 0.0 36.8 10.0 24.2 12.6Lane LOS A A E A C BApproach Delay (s) 0.9 1.6 29.3 17.1Approach LOS D C
Intersection Summary
Average Delay 6.2Intersection Capacity Utilization 39.8% ICU Level of Service AAnalysis Period (min) 15

HCM Unsignalized Intersection Capacity Analysis6: Brock Street East & Site Access 11/23/2017
Future Total 2026 AM (Horizon) 11/06/2017 Baseline Synchro 10 Light ReportPage 2
Movement EBL EBT WBT WBR SBL SBR
Lane ConfigurationsTraffic Volume (veh/h) 0 245 343 1 0 19Future Volume (Veh/h) 0 245 343 1 0 19Sign Control Free Free StopGrade 0% 0% 0%Peak Hour Factor 0.92 0.92 0.92 0.92 0.92 0.92Hourly flow rate (vph) 0 266 373 1 0 21PedestriansLane Width (m)Walking Speed (m/s)Percent BlockageRight turn flare (veh)Median type None NoneMedian storage veh)Upstream signal (m)pX, platoon unblockedvC, conflicting volume 374 640 374vC1, stage 1 conf volvC2, stage 2 conf volvCu, unblocked vol 374 640 374tC, single (s) 4.1 6.4 6.2tC, 2 stage (s)tF (s) 2.2 3.5 3.3p0 queue free % 100 100 97cM capacity (veh/h) 1184 440 673
Direction, Lane # EB 1 WB 1 SB 1
Volume Total 266 374 21Volume Left 0 0 0Volume Right 0 1 21cSH 1700 1700 673Volume to Capacity 0.16 0.22 0.03Queue Length 95th (m) 0.0 0.0 0.8Control Delay (s) 0.0 0.0 10.5Lane LOS BApproach Delay (s) 0.0 0.0 10.5Approach LOS B
Intersection Summary
Average Delay 0.3Intersection Capacity Utilization 28.1% ICU Level of Service AAnalysis Period (min) 15

HCM Unsignalized Intersection Capacity Analysis8: Herrema Boulevard /Herrema Boulevard & Low Boulevard 11/23/2017
Future Total 2026 AM (Horizon) 11/06/2017 Baseline Synchro 10 Light ReportPage 3
Movement EBL EBT EBR WBL WBT WBR NBL NBT NBR SBL SBT SBR
Lane ConfigurationsTraffic Volume (veh/h) 0 0 22 20 0 0 5 28 7 0 64 0Future Volume (Veh/h) 0 0 22 20 0 0 5 28 7 0 64 0Sign Control Stop Stop Free FreeGrade 0% 0% 0% 0%Peak Hour Factor 0.92 0.92 0.92 0.92 0.92 0.92 0.92 0.92 0.92 0.92 0.92 0.92Hourly flow rate (vph) 0 0 24 22 0 0 5 30 8 0 70 0PedestriansLane Width (m)Walking Speed (m/s)Percent BlockageRight turn flare (veh)Median type None NoneMedian storage veh)Upstream signal (m)pX, platoon unblockedvC, conflicting volume 114 118 70 138 114 34 70 38vC1, stage 1 conf volvC2, stage 2 conf volvCu, unblocked vol 114 118 70 138 114 34 70 38tC, single (s) 7.1 6.5 6.2 7.1 6.5 6.2 4.1 4.1tC, 2 stage (s)tF (s) 3.5 4.0 3.3 3.5 4.0 3.3 2.2 2.2p0 queue free % 100 100 98 97 100 100 100 100cM capacity (veh/h) 861 770 993 810 774 1039 1531 1572
Direction, Lane # EB 1 WB 1 NB 1 SB 1
Volume Total 24 22 43 70Volume Left 0 22 5 0Volume Right 24 0 8 0cSH 993 810 1531 1572Volume to Capacity 0.02 0.03 0.00 0.00Queue Length 95th (m) 0.6 0.7 0.1 0.0Control Delay (s) 8.7 9.6 0.9 0.0Lane LOS A A AApproach Delay (s) 8.7 9.6 0.9 0.0Approach LOS A A
Intersection Summary
Average Delay 2.9Intersection Capacity Utilization 20.7% ICU Level of Service AAnalysis Period (min) 15

HCM Unsignalized Intersection Capacity Analysis11: Herrema Boulevard/Herrema Boulevard & Internal Driveway 1 11/23/2017
Future Total 2026 AM (Horizon) 11/06/2017 Baseline Synchro 10 Light ReportPage 4
Movement EBL EBT EBR WBL WBT WBR NBL NBT NBR SBL SBT SBR
Lane ConfigurationsTraffic Volume (veh/h) 0 0 16 14 0 0 4 36 17 0 106 0Future Volume (Veh/h) 0 0 16 14 0 0 4 36 17 0 106 0Sign Control Stop Stop Free FreeGrade 0% 0% 0% 0%Peak Hour Factor 0.92 0.92 0.92 0.92 0.92 0.92 0.92 0.92 0.92 0.92 0.92 0.92Hourly flow rate (vph) 0 0 17 15 0 0 4 39 18 0 115 0PedestriansLane Width (m)Walking Speed (m/s)Percent BlockageRight turn flare (veh)Median type None NoneMedian storage veh)Upstream signal (m)pX, platoon unblockedvC, conflicting volume 171 180 115 188 171 48 115 57vC1, stage 1 conf volvC2, stage 2 conf volvCu, unblocked vol 171 180 115 188 171 48 115 57tC, single (s) 7.1 6.5 6.2 7.1 6.5 6.2 4.1 4.1tC, 2 stage (s)tF (s) 3.5 4.0 3.3 3.5 4.0 3.3 2.2 2.2p0 queue free % 100 100 98 98 100 100 100 100cM capacity (veh/h) 791 712 937 757 720 1021 1474 1547
Direction, Lane # EB 1 WB 1 NB 1 SB 1
Volume Total 17 15 61 115Volume Left 0 15 4 0Volume Right 17 0 18 0cSH 937 757 1474 1547Volume to Capacity 0.02 0.02 0.00 0.00Queue Length 95th (m) 0.4 0.5 0.1 0.0Control Delay (s) 8.9 9.9 0.5 0.0Lane LOS A A AApproach Delay (s) 8.9 9.9 0.5 0.0Approach LOS A A
Intersection Summary
Average Delay 1.6Intersection Capacity Utilization 20.5% ICU Level of Service AAnalysis Period (min) 15

HCM Unsignalized Intersection Capacity Analysis14: Internal Driveway 2 & Low Boulevard 11/23/2017
Future Total 2026 AM (Horizon) 11/06/2017 Baseline Synchro 10 Light ReportPage 5
Movement EBT EBR WBL WBT NBL NBR
Lane ConfigurationsTraffic Volume (veh/h) 0 0 3 2 0 16Future Volume (Veh/h) 0 0 3 2 0 16Sign Control Free Free StopGrade 0% 0% 0%Peak Hour Factor 0.92 0.92 0.92 0.92 0.92 0.92Hourly flow rate (vph) 0 0 3 2 0 17PedestriansLane Width (m)Walking Speed (m/s)Percent BlockageRight turn flare (veh)Median type None NoneMedian storage veh)Upstream signal (m)pX, platoon unblockedvC, conflicting volume 0 8 0vC1, stage 1 conf volvC2, stage 2 conf volvCu, unblocked vol 0 8 0tC, single (s) 4.1 6.4 6.2tC, 2 stage (s)tF (s) 2.2 3.5 3.3p0 queue free % 100 100 98cM capacity (veh/h) 1623 1011 1085
Direction, Lane # EB 1 WB 1 NB 1
Volume Total 0 5 17Volume Left 0 3 0Volume Right 0 0 17cSH 1700 1623 1085Volume to Capacity 0.00 0.00 0.02Queue Length 95th (m) 0.0 0.0 0.4Control Delay (s) 0.0 4.3 8.4Lane LOS A AApproach Delay (s) 0.0 4.3 8.4Approach LOS A
Intersection Summary
Average Delay 7.5Intersection Capacity Utilization 13.3% ICU Level of Service AAnalysis Period (min) 15

HCM Unsignalized Intersection Capacity Analysis3: Nelkydd Lane/Herrema Boulevard & Brock Street East 11/23/2017
Future Total 2026 PM (Horizon) 11/06/2017 Baseline Synchro 10 Light ReportPage 1
Movement EBL EBT EBR WBL WBT WBR NBL NBT NBR SBL SBT SBR
Lane ConfigurationsTraffic Volume (veh/h) 125 357 50 6 206 39 46 3 18 30 7 68Future Volume (Veh/h) 125 357 50 6 206 39 46 3 18 30 7 68Sign Control Free Free Stop StopGrade 0% 0% 0% 0%Peak Hour Factor 0.92 0.89 0.58 0.61 0.86 0.92 0.82 0.92 0.69 0.92 0.92 0.92Hourly flow rate (vph) 136 401 86 10 240 42 56 3 26 33 8 74PedestriansLane Width (m)Walking Speed (m/s)Percent BlockageRight turn flare (veh)Median type None NoneMedian storage veh)Upstream signal (m)pX, platoon unblockedvC, conflicting volume 282 487 1011 975 401 960 1019 240vC1, stage 1 conf volvC2, stage 2 conf volvCu, unblocked vol 282 487 1011 975 401 960 1019 240tC, single (s) 4.1 4.2 7.2 6.5 6.4 7.1 6.5 6.2tC, 2 stage (s)tF (s) 2.2 2.3 3.6 4.0 3.5 3.5 4.0 3.3p0 queue free % 89 99 67 99 96 84 96 91cM capacity (veh/h) 1280 1056 169 223 606 204 210 799
Direction, Lane # EB 1 EB 2 EB 3 WB 1 WB 2 WB 3 NB 1 NB 2 SB 1 SB 2
Volume Total 136 401 86 10 240 42 56 29 33 82Volume Left 136 0 0 10 0 0 56 0 33 0Volume Right 0 0 86 0 0 42 0 26 0 74cSH 1280 1700 1700 1056 1700 1700 169 514 204 627Volume to Capacity 0.11 0.24 0.05 0.01 0.14 0.02 0.33 0.06 0.16 0.13Queue Length 95th (m) 2.8 0.0 0.0 0.2 0.0 0.0 10.8 1.4 4.5 3.6Control Delay (s) 8.1 0.0 0.0 8.4 0.0 0.0 36.4 12.4 26.0 11.6Lane LOS A A E B D BApproach Delay (s) 1.8 0.3 28.2 15.7Approach LOS D C
Intersection Summary
Average Delay 4.8Intersection Capacity Utilization 41.3% ICU Level of Service AAnalysis Period (min) 15

HCM Unsignalized Intersection Capacity Analysis6: Brock Street East & Site Access 11/23/2017
Future Total 2026 PM (Horizon) 11/06/2017 Baseline Synchro 10 Light ReportPage 2
Movement EBL EBT WBT WBR SBL SBR
Lane ConfigurationsTraffic Volume (veh/h) 0 405 222 5 0 8Future Volume (Veh/h) 0 405 222 5 0 8Sign Control Free Free StopGrade 0% 0% 0%Peak Hour Factor 0.92 0.92 0.92 0.92 0.92 0.92Hourly flow rate (vph) 0 440 241 5 0 9PedestriansLane Width (m)Walking Speed (m/s)Percent BlockageRight turn flare (veh)Median type None NoneMedian storage veh)Upstream signal (m)pX, platoon unblockedvC, conflicting volume 246 684 244vC1, stage 1 conf volvC2, stage 2 conf volvCu, unblocked vol 246 684 244tC, single (s) 4.1 6.4 6.2tC, 2 stage (s)tF (s) 2.2 3.5 3.3p0 queue free % 100 100 99cM capacity (veh/h) 1320 415 795
Direction, Lane # EB 1 WB 1 SB 1
Volume Total 440 246 9Volume Left 0 0 0Volume Right 0 5 9cSH 1700 1700 795Volume to Capacity 0.26 0.14 0.01Queue Length 95th (m) 0.0 0.0 0.3Control Delay (s) 0.0 0.0 9.6Lane LOS AApproach Delay (s) 0.0 0.0 9.6Approach LOS A
Intersection Summary
Average Delay 0.1Intersection Capacity Utilization 24.6% ICU Level of Service AAnalysis Period (min) 15

HCM Unsignalized Intersection Capacity Analysis8: Herrema Boulevard & Low Boulevard 11/23/2017
Future Total 2026 PM (Horizon) 11/06/2017 Baseline Synchro 10 Light ReportPage 3
Movement EBL EBT EBR WBL WBT WBR NBL NBT NBR SBL SBT SBR
Lane ConfigurationsTraffic Volume (veh/h) 0 0 7 10 0 0 14 66 30 0 32 0Future Volume (Veh/h) 0 0 7 10 0 0 14 66 30 0 32 0Sign Control Stop Stop Free FreeGrade 0% 0% 0% 0%Peak Hour Factor 0.92 0.92 0.92 0.92 0.92 0.92 0.92 0.92 0.92 0.92 0.92 0.92Hourly flow rate (vph) 0 0 8 11 0 0 15 72 33 0 35 0PedestriansLane Width (m)Walking Speed (m/s)Percent BlockageRight turn flare (veh)Median type None NoneMedian storage veh)Upstream signal (m)pX, platoon unblockedvC, conflicting volume 154 170 35 162 154 88 35 105vC1, stage 1 conf volvC2, stage 2 conf volvCu, unblocked vol 154 170 35 162 154 88 35 105tC, single (s) 7.1 6.5 6.2 7.1 6.5 6.2 4.1 4.1tC, 2 stage (s)tF (s) 3.5 4.0 3.3 3.5 4.0 3.3 2.2 2.2p0 queue free % 100 100 99 99 100 100 99 100cM capacity (veh/h) 808 716 1038 792 731 970 1576 1486
Direction, Lane # EB 1 WB 1 NB 1 SB 1
Volume Total 8 11 120 35Volume Left 0 11 15 0Volume Right 8 0 33 0cSH 1038 792 1576 1486Volume to Capacity 0.01 0.01 0.01 0.00Queue Length 95th (m) 0.2 0.3 0.2 0.0Control Delay (s) 8.5 9.6 1.0 0.0Lane LOS A A AApproach Delay (s) 8.5 9.6 1.0 0.0Approach LOS A A
Intersection Summary
Average Delay 1.7Intersection Capacity Utilization 26.6% ICU Level of Service AAnalysis Period (min) 15
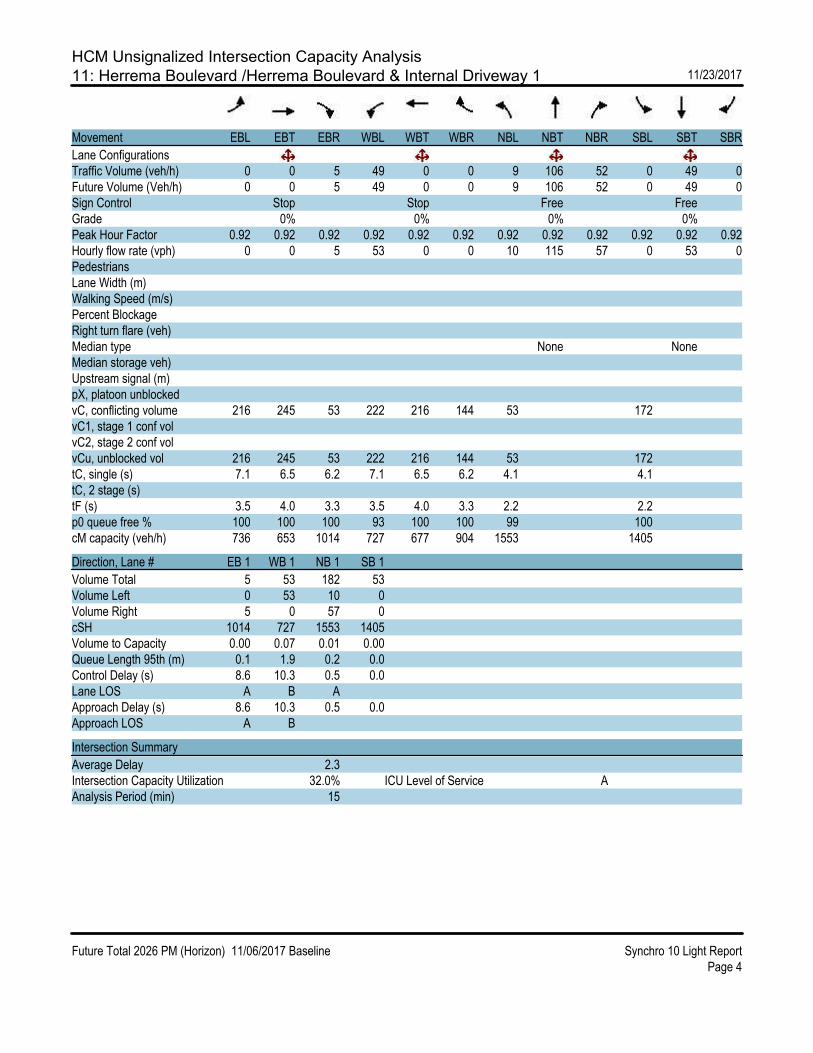
HCM Unsignalized Intersection Capacity Analysis11: Herrema Boulevard /Herrema Boulevard & Internal Driveway 1 11/23/2017
Future Total 2026 PM (Horizon) 11/06/2017 Baseline Synchro 10 Light ReportPage 4
Movement EBL EBT EBR WBL WBT WBR NBL NBT NBR SBL SBT SBR
Lane ConfigurationsTraffic Volume (veh/h) 0 0 5 49 0 0 9 106 52 0 49 0Future Volume (Veh/h) 0 0 5 49 0 0 9 106 52 0 49 0Sign Control Stop Stop Free FreeGrade 0% 0% 0% 0%Peak Hour Factor 0.92 0.92 0.92 0.92 0.92 0.92 0.92 0.92 0.92 0.92 0.92 0.92Hourly flow rate (vph) 0 0 5 53 0 0 10 115 57 0 53 0PedestriansLane Width (m)Walking Speed (m/s)Percent BlockageRight turn flare (veh)Median type None NoneMedian storage veh)Upstream signal (m)pX, platoon unblockedvC, conflicting volume 216 245 53 222 216 144 53 172vC1, stage 1 conf volvC2, stage 2 conf volvCu, unblocked vol 216 245 53 222 216 144 53 172tC, single (s) 7.1 6.5 6.2 7.1 6.5 6.2 4.1 4.1tC, 2 stage (s)tF (s) 3.5 4.0 3.3 3.5 4.0 3.3 2.2 2.2p0 queue free % 100 100 100 93 100 100 99 100cM capacity (veh/h) 736 653 1014 727 677 904 1553 1405
Direction, Lane # EB 1 WB 1 NB 1 SB 1
Volume Total 5 53 182 53Volume Left 0 53 10 0Volume Right 5 0 57 0cSH 1014 727 1553 1405Volume to Capacity 0.00 0.07 0.01 0.00Queue Length 95th (m) 0.1 1.9 0.2 0.0Control Delay (s) 8.6 10.3 0.5 0.0Lane LOS A B AApproach Delay (s) 8.6 10.3 0.5 0.0Approach LOS A B
Intersection Summary
Average Delay 2.3Intersection Capacity Utilization 32.0% ICU Level of Service AAnalysis Period (min) 15

HCM Unsignalized Intersection Capacity Analysis14: Internal Driveway 2 & Low Boulevard 11/23/2017
Future Total 2026 PM (Horizon) 11/06/2017 Baseline Synchro 10 Light ReportPage 5
Movement EBT EBR WBL WBT NBL NBR
Lane ConfigurationsTraffic Volume (veh/h) 0 0 8 0 0 5Future Volume (Veh/h) 0 0 8 0 0 5Sign Control Free Free StopGrade 0% 0% 0%Peak Hour Factor 0.92 0.92 0.92 0.92 0.92 0.92Hourly flow rate (vph) 0 0 9 0 0 5PedestriansLane Width (m)Walking Speed (m/s)Percent BlockageRight turn flare (veh)Median type None NoneMedian storage veh)Upstream signal (m)pX, platoon unblockedvC, conflicting volume 0 18 0vC1, stage 1 conf volvC2, stage 2 conf volvCu, unblocked vol 0 18 0tC, single (s) 4.1 6.4 6.2tC, 2 stage (s)tF (s) 2.2 3.5 3.3p0 queue free % 99 100 100cM capacity (veh/h) 1623 994 1085
Direction, Lane # EB 1 WB 1 NB 1
Volume Total 0 9 5Volume Left 0 9 0Volume Right 0 0 5cSH 1700 1623 1085Volume to Capacity 0.00 0.01 0.00Queue Length 95th (m) 0.0 0.1 0.1Control Delay (s) 0.0 7.2 8.3Lane LOS A AApproach Delay (s) 0.0 7.2 8.3Approach LOS A
Intersection Summary
Average Delay 7.6Intersection Capacity Utilization 13.3% ICU Level of Service AAnalysis Period (min) 15

Appendix I – Future Total 2026 with
Traffic Signal Level of ServiceCalculations

HCM Signalized Intersection Capacity Analysis3: Nelkydd Lane/Herrema Boulevard & Brock Street East 11/23/2017
Future Total 2026 AM (Horizon) 11/06/2017 Baseline Synchro 10 Light ReportPage 1
Movement EBL EBT EBR WBL WBT WBR NBL NBT NBR SBL SBT SBR
Lane ConfigurationsTraffic Volume (vph) 45 171 110 54 303 11 69 1 22 52 8 74Future Volume (vph) 45 171 110 54 303 11 69 1 22 52 8 74Ideal Flow (vphpl) 1900 1900 1900 1900 1900 1900 1900 1900 1900 1900 1900 1900Total Lost time (s) 4.5 4.5 4.5 4.5 4.5 4.5 4.5 4.5 4.5 4.5Lane Util. Factor 1.00 1.00 1.00 1.00 1.00 1.00 1.00 1.00 1.00 1.00Frt 1.00 1.00 0.85 1.00 1.00 0.85 1.00 0.85 1.00 0.87Flt Protected 0.95 1.00 1.00 0.95 1.00 1.00 0.95 1.00 0.95 1.00Satd. Flow (prot) 1770 1712 1442 1703 1810 1583 1641 1327 1770 1612Flt Permitted 0.29 1.00 1.00 0.48 1.00 1.00 0.57 1.00 0.74 1.00Satd. Flow (perm) 532 1712 1442 869 1810 1583 992 1327 1370 1612
Peak-hour factor, PHF 0.92 0.89 0.58 0.61 0.86 0.92 0.82 0.92 0.69 0.92 0.92 0.92Adj. Flow (vph) 49 192 190 89 352 12 84 1 32 57 9 80RTOR Reduction (vph) 0 0 148 0 0 9 0 17 0 0 59 0Lane Group Flow (vph) 49 192 42 89 352 3 84 16 0 57 30 0Heavy Vehicles (%) 2% 11% 12% 6% 5% 2% 10% 2% 23% 2% 2% 2%
Turn Type pm+pt NA Perm pm+pt NA Perm pm+pt NA pm+pt NAProtected Phases 7 4 3 8 5 2 1 6Permitted Phases 4 4 8 8 2 6Actuated Green, G (s) 20.1 17.3 17.3 23.5 19.0 19.0 43.4 36.0 23.6 20.7Effective Green, g (s) 20.1 17.3 17.3 23.5 19.0 19.0 43.4 36.0 23.6 20.7Actuated g/C Ratio 0.26 0.22 0.22 0.30 0.24 0.24 0.55 0.46 0.30 0.26Clearance Time (s) 4.5 4.5 4.5 4.5 4.5 4.5 4.5 4.5 4.5 4.5Vehicle Extension (s) 3.0 3.0 3.0 3.0 3.0 3.0 3.0 3.0 3.0 3.0
Lane Grp Cap (vph) 179 376 316 307 436 382 697 607 425 423v/s Ratio Prot 0.01 0.11 c0.02 c0.19 c0.03 0.01 0.00 0.02v/s Ratio Perm 0.06 0.03 0.07 0.00 c0.04 0.04v/c Ratio 0.27 0.51 0.13 0.29 0.81 0.01 0.12 0.03 0.13 0.07Uniform Delay, d1 22.9 27.0 24.7 20.6 28.1 22.7 8.5 11.7 19.9 21.8Progression Factor 1.00 1.00 1.00 1.00 1.00 1.00 1.00 1.00 1.00 1.00Incremental Delay, d2 0.8 1.2 0.2 0.5 10.5 0.0 0.4 0.1 0.1 0.3Delay (s) 23.7 28.2 24.9 21.1 38.6 22.7 8.8 11.8 20.1 22.1Level of Service C C C C D C A B C CApproach Delay (s) 26.2 34.8 9.7 21.3Approach LOS C C A C
Intersection Summary
HCM 2000 Control Delay 27.3 HCM 2000 Level of Service CHCM 2000 Volume to Capacity ratio 0.36Actuated Cycle Length (s) 78.7 Sum of lost time (s) 18.0Intersection Capacity Utilization 41.9% ICU Level of Service AAnalysis Period (min) 15c Critical Lane Group

Queues3: Nelkydd Lane/Herrema Boulevard & Brock Street East 11/23/2017
Future Total 2026 AM (Horizon) 11/06/2017 Baseline Synchro 10 Light ReportPage 1
Lane Group EBL EBT EBR WBL WBT WBR NBL NBT SBL SBT
Lane Group Flow (vph) 49 192 190 89 352 12 84 33 57 89v/c Ratio 0.22 0.52 0.40 0.27 0.77 0.02 0.12 0.05 0.12 0.19Control Delay 18.9 31.6 6.1 19.3 39.4 0.1 10.2 6.3 12.3 9.0Queue Delay 0.0 0.0 0.0 0.0 0.0 0.0 0.0 0.0 0.0 0.0Total Delay 18.9 31.6 6.1 19.3 39.4 0.1 10.2 6.3 12.3 9.0Queue Length 50th (m) 4.9 26.2 0.0 9.2 52.0 0.0 6.5 0.1 4.3 1.1Queue Length 95th (m) 11.8 45.2 0.0 12.4 #84.2 0.0 12.3 5.3 10.0 12.3Internal Link Dist (m) 153.2 201.7 64.4 34.7Turn Bay Length (m)Base Capacity (vph) 227 453 532 325 506 590 706 656 464 462Starvation Cap Reductn 0 0 0 0 0 0 0 0 0 0Spillback Cap Reductn 0 0 0 0 0 0 0 0 0 0Storage Cap Reductn 0 0 0 0 0 0 0 0 0 0Reduced v/c Ratio 0.22 0.42 0.36 0.27 0.70 0.02 0.12 0.05 0.12 0.19
Intersection Summary
# 95th percentile volume exceeds capacity, queue may be longer. Queue shown is maximum after two cycles.

HCM Unsignalized Intersection Capacity Analysis6: Brock Street East & Site Access 11/23/2017
Future Total 2026 AM (Horizon) 11/06/2017 Baseline Synchro 10 Light ReportPage 1
Movement EBL EBT WBT WBR SBL SBR
Lane ConfigurationsTraffic Volume (veh/h) 0 245 343 1 0 19Future Volume (Veh/h) 0 245 343 1 0 19Sign Control Free Free StopGrade 0% 0% 0%Peak Hour Factor 0.92 0.92 0.92 0.92 0.92 0.92Hourly flow rate (vph) 0 266 373 1 0 21PedestriansLane Width (m)Walking Speed (m/s)Percent BlockageRight turn flare (veh)Median type None NoneMedian storage veh)Upstream signal (m) 226pX, platoon unblocked 0.95vC, conflicting volume 374 640 374vC1, stage 1 conf volvC2, stage 2 conf volvCu, unblocked vol 374 590 374tC, single (s) 4.1 6.4 6.2tC, 2 stage (s)tF (s) 2.2 3.5 3.3p0 queue free % 100 100 97cM capacity (veh/h) 1184 445 673
Direction, Lane # EB 1 WB 1 SB 1
Volume Total 266 374 21Volume Left 0 0 0Volume Right 0 1 21cSH 1700 1700 673Volume to Capacity 0.16 0.22 0.03Queue Length 95th (m) 0.0 0.0 0.8Control Delay (s) 0.0 0.0 10.5Lane LOS BApproach Delay (s) 0.0 0.0 10.5Approach LOS B
Intersection Summary
Average Delay 0.3Intersection Capacity Utilization 28.1% ICU Level of Service AAnalysis Period (min) 15

HCM Unsignalized Intersection Capacity Analysis8: Herrema Boulevard /Herrema Boulevard & Low Boulevard 11/23/2017
Future Total 2026 AM (Horizon) 11/06/2017 Baseline Synchro 10 Light ReportPage 2
Movement EBL EBT EBR WBL WBT WBR NBL NBT NBR SBL SBT SBR
Lane ConfigurationsTraffic Volume (veh/h) 0 0 22 20 0 0 5 28 7 0 64 0Future Volume (Veh/h) 0 0 22 20 0 0 5 28 7 0 64 0Sign Control Stop Stop Free FreeGrade 0% 0% 0% 0%Peak Hour Factor 0.92 0.92 0.92 0.92 0.92 0.92 0.92 0.92 0.92 0.92 0.92 0.92Hourly flow rate (vph) 0 0 24 22 0 0 5 30 8 0 70 0PedestriansLane Width (m)Walking Speed (m/s)Percent BlockageRight turn flare (veh)Median type None NoneMedian storage veh)Upstream signal (m) 117pX, platoon unblockedvC, conflicting volume 114 118 70 138 114 34 70 38vC1, stage 1 conf volvC2, stage 2 conf volvCu, unblocked vol 114 118 70 138 114 34 70 38tC, single (s) 7.1 6.5 6.2 7.1 6.5 6.2 4.1 4.1tC, 2 stage (s)tF (s) 3.5 4.0 3.3 3.5 4.0 3.3 2.2 2.2p0 queue free % 100 100 98 97 100 100 100 100cM capacity (veh/h) 861 770 993 810 774 1039 1531 1572
Direction, Lane # EB 1 WB 1 NB 1 SB 1
Volume Total 24 22 43 70Volume Left 0 22 5 0Volume Right 24 0 8 0cSH 993 810 1531 1572Volume to Capacity 0.02 0.03 0.00 0.00Queue Length 95th (m) 0.6 0.7 0.1 0.0Control Delay (s) 8.7 9.6 0.9 0.0Lane LOS A A AApproach Delay (s) 8.7 9.6 0.9 0.0Approach LOS A A
Intersection Summary
Average Delay 2.9Intersection Capacity Utilization 20.7% ICU Level of Service AAnalysis Period (min) 15

HCM Unsignalized Intersection Capacity Analysis11: Herrema Boulevard/Herrema Boulevard & Internal Driveway 1 11/23/2017
Future Total 2026 AM (Horizon) 11/06/2017 Baseline Synchro 10 Light ReportPage 3
Movement EBL EBT EBR WBL WBT WBR NBL NBT NBR SBL SBT SBR
Lane ConfigurationsTraffic Volume (veh/h) 0 0 16 14 0 0 4 36 17 0 106 0Future Volume (Veh/h) 0 0 16 14 0 0 4 36 17 0 106 0Sign Control Stop Stop Free FreeGrade 0% 0% 0% 0%Peak Hour Factor 0.92 0.92 0.92 0.92 0.92 0.92 0.92 0.92 0.92 0.92 0.92 0.92Hourly flow rate (vph) 0 0 17 15 0 0 4 39 18 0 115 0PedestriansLane Width (m)Walking Speed (m/s)Percent BlockageRight turn flare (veh)Median type None NoneMedian storage veh)Upstream signal (m) 59pX, platoon unblocked 0.99 0.99 0.99 0.99 0.99 0.99vC, conflicting volume 171 180 115 188 171 48 115 57vC1, stage 1 conf volvC2, stage 2 conf volvCu, unblocked vol 161 170 115 179 161 38 115 47tC, single (s) 7.1 6.5 6.2 7.1 6.5 6.2 4.1 4.1tC, 2 stage (s)tF (s) 3.5 4.0 3.3 3.5 4.0 3.3 2.2 2.2p0 queue free % 100 100 98 98 100 100 100 100cM capacity (veh/h) 796 715 937 762 724 1027 1474 1550
Direction, Lane # EB 1 WB 1 NB 1 SB 1
Volume Total 17 15 61 115Volume Left 0 15 4 0Volume Right 17 0 18 0cSH 937 762 1474 1550Volume to Capacity 0.02 0.02 0.00 0.00Queue Length 95th (m) 0.4 0.5 0.1 0.0Control Delay (s) 8.9 9.8 0.5 0.0Lane LOS A A AApproach Delay (s) 8.9 9.8 0.5 0.0Approach LOS A A
Intersection Summary
Average Delay 1.6Intersection Capacity Utilization 20.5% ICU Level of Service AAnalysis Period (min) 15

HCM Unsignalized Intersection Capacity Analysis14: Internal Driveway 2 & Low Boulevard 11/23/2017
Future Total 2026 AM (Horizon) 11/06/2017 Baseline Synchro 10 Light ReportPage 4
Movement EBT EBR WBL WBT NBL NBR
Lane ConfigurationsTraffic Volume (veh/h) 0 0 3 2 0 16Future Volume (Veh/h) 0 0 3 2 0 16Sign Control Free Free StopGrade 0% 0% 0%Peak Hour Factor 0.92 0.92 0.92 0.92 0.92 0.92Hourly flow rate (vph) 0 0 3 2 0 17PedestriansLane Width (m)Walking Speed (m/s)Percent BlockageRight turn flare (veh)Median type None NoneMedian storage veh)Upstream signal (m)pX, platoon unblockedvC, conflicting volume 0 8 0vC1, stage 1 conf volvC2, stage 2 conf volvCu, unblocked vol 0 8 0tC, single (s) 4.1 6.4 6.2tC, 2 stage (s)tF (s) 2.2 3.5 3.3p0 queue free % 100 100 98cM capacity (veh/h) 1623 1011 1085
Direction, Lane # EB 1 WB 1 NB 1
Volume Total 0 5 17Volume Left 0 3 0Volume Right 0 0 17cSH 1700 1623 1085Volume to Capacity 0.00 0.00 0.02Queue Length 95th (m) 0.0 0.0 0.4Control Delay (s) 0.0 4.3 8.4Lane LOS A AApproach Delay (s) 0.0 4.3 8.4Approach LOS A
Intersection Summary
Average Delay 7.5Intersection Capacity Utilization 13.3% ICU Level of Service AAnalysis Period (min) 15

HCM Signalized Intersection Capacity Analysis3: Nelkydd Lane/Herrema Boulevard & Brock Street East 11/23/2017
Future Total 2026 PM (Horizon) 11/06/2017 Baseline Synchro 10 Light ReportPage 1
Movement EBL EBT EBR WBL WBT WBR NBL NBT NBR SBL SBT SBR
Lane ConfigurationsTraffic Volume (vph) 125 357 50 6 206 39 46 3 18 30 7 68Future Volume (vph) 125 357 50 6 206 39 46 3 18 30 7 68Ideal Flow (vphpl) 1900 1900 1900 1900 1900 1900 1900 1900 1900 1900 1900 1900Total Lost time (s) 4.5 4.5 4.5 4.5 4.5 4.5 4.5 4.5 4.5 4.5Lane Util. Factor 1.00 1.00 1.00 1.00 1.00 1.00 1.00 1.00 1.00 1.00Frt 1.00 1.00 0.85 1.00 1.00 0.85 1.00 0.87 1.00 0.86Flt Protected 0.95 1.00 1.00 0.95 1.00 1.00 0.95 1.00 0.95 1.00Satd. Flow (prot) 1770 1712 1442 1703 1810 1583 1641 1361 1770 1611Flt Permitted 0.36 1.00 1.00 0.31 1.00 1.00 0.58 1.00 0.74 1.00Satd. Flow (perm) 671 1712 1442 554 1810 1583 1004 1361 1375 1611
Peak-hour factor, PHF 0.92 0.89 0.58 0.61 0.86 0.92 0.82 0.92 0.69 0.92 0.92 0.92Adj. Flow (vph) 136 401 86 10 240 42 56 3 26 33 8 74RTOR Reduction (vph) 0 0 61 0 0 32 0 14 0 0 55 0Lane Group Flow (vph) 136 401 25 10 240 10 56 15 0 33 27 0Heavy Vehicles (%) 2% 11% 12% 6% 5% 2% 10% 2% 23% 2% 2% 2%
Turn Type pm+pt NA Perm pm+pt NA Perm pm+pt NA pm+pt NAProtected Phases 7 4 3 8 5 2 1 6Permitted Phases 4 4 8 8 2 6Actuated Green, G (s) 28.7 23.4 23.4 19.9 19.0 19.0 44.0 37.6 23.3 21.4Effective Green, g (s) 28.7 23.4 23.4 19.9 19.0 19.0 44.0 37.6 23.3 21.4Actuated g/C Ratio 0.35 0.29 0.29 0.24 0.23 0.23 0.54 0.46 0.28 0.26Clearance Time (s) 4.5 4.5 4.5 4.5 4.5 4.5 4.5 4.5 4.5 4.5Vehicle Extension (s) 3.0 3.0 3.0 3.0 3.0 3.0 3.0 3.0 3.0 3.0
Lane Grp Cap (vph) 306 489 412 147 420 367 680 625 400 421v/s Ratio Prot c0.03 c0.23 0.00 0.13 c0.02 0.01 0.00 0.02v/s Ratio Perm 0.13 0.02 0.02 0.01 c0.03 0.02v/c Ratio 0.44 0.82 0.06 0.07 0.57 0.03 0.08 0.02 0.08 0.06Uniform Delay, d1 19.3 27.2 21.2 23.9 27.8 24.3 9.2 12.1 21.3 22.7Progression Factor 1.00 1.00 1.00 1.00 1.00 1.00 1.00 1.00 1.00 1.00Incremental Delay, d2 1.0 10.6 0.1 0.2 1.9 0.0 0.2 0.1 0.1 0.3Delay (s) 20.3 37.8 21.3 24.1 29.7 24.3 9.4 12.1 21.4 23.0Level of Service C D C C C C A B C CApproach Delay (s) 31.7 28.7 10.3 22.5Approach LOS C C B C
Intersection Summary
HCM 2000 Control Delay 28.3 HCM 2000 Level of Service CHCM 2000 Volume to Capacity ratio 0.38Actuated Cycle Length (s) 81.8 Sum of lost time (s) 18.0Intersection Capacity Utilization 43.4% ICU Level of Service AAnalysis Period (min) 15c Critical Lane Group
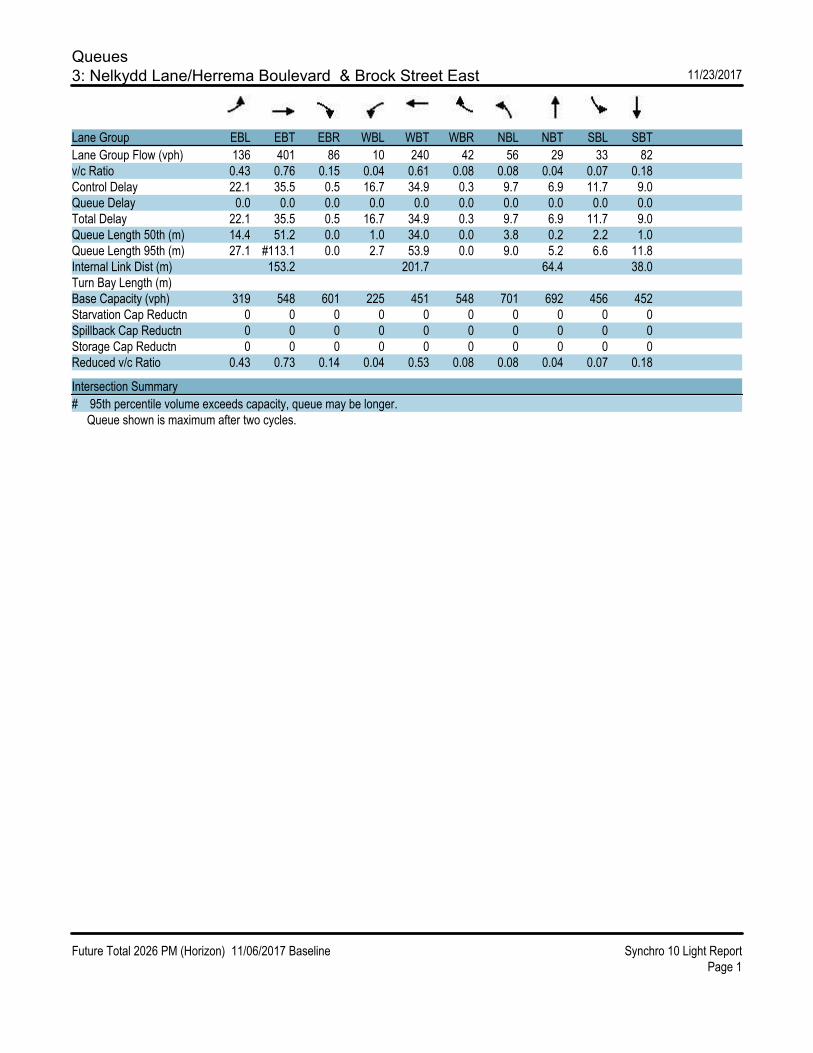
Queues3: Nelkydd Lane/Herrema Boulevard & Brock Street East 11/23/2017
Future Total 2026 PM (Horizon) 11/06/2017 Baseline Synchro 10 Light ReportPage 1
Lane Group EBL EBT EBR WBL WBT WBR NBL NBT SBL SBT
Lane Group Flow (vph) 136 401 86 10 240 42 56 29 33 82v/c Ratio 0.43 0.76 0.15 0.04 0.61 0.08 0.08 0.04 0.07 0.18Control Delay 22.1 35.5 0.5 16.7 34.9 0.3 9.7 6.9 11.7 9.0Queue Delay 0.0 0.0 0.0 0.0 0.0 0.0 0.0 0.0 0.0 0.0Total Delay 22.1 35.5 0.5 16.7 34.9 0.3 9.7 6.9 11.7 9.0Queue Length 50th (m) 14.4 51.2 0.0 1.0 34.0 0.0 3.8 0.2 2.2 1.0Queue Length 95th (m) 27.1 #113.1 0.0 2.7 53.9 0.0 9.0 5.2 6.6 11.8Internal Link Dist (m) 153.2 201.7 64.4 38.0Turn Bay Length (m)Base Capacity (vph) 319 548 601 225 451 548 701 692 456 452Starvation Cap Reductn 0 0 0 0 0 0 0 0 0 0Spillback Cap Reductn 0 0 0 0 0 0 0 0 0 0Storage Cap Reductn 0 0 0 0 0 0 0 0 0 0Reduced v/c Ratio 0.43 0.73 0.14 0.04 0.53 0.08 0.08 0.04 0.07 0.18
Intersection Summary
# 95th percentile volume exceeds capacity, queue may be longer. Queue shown is maximum after two cycles.
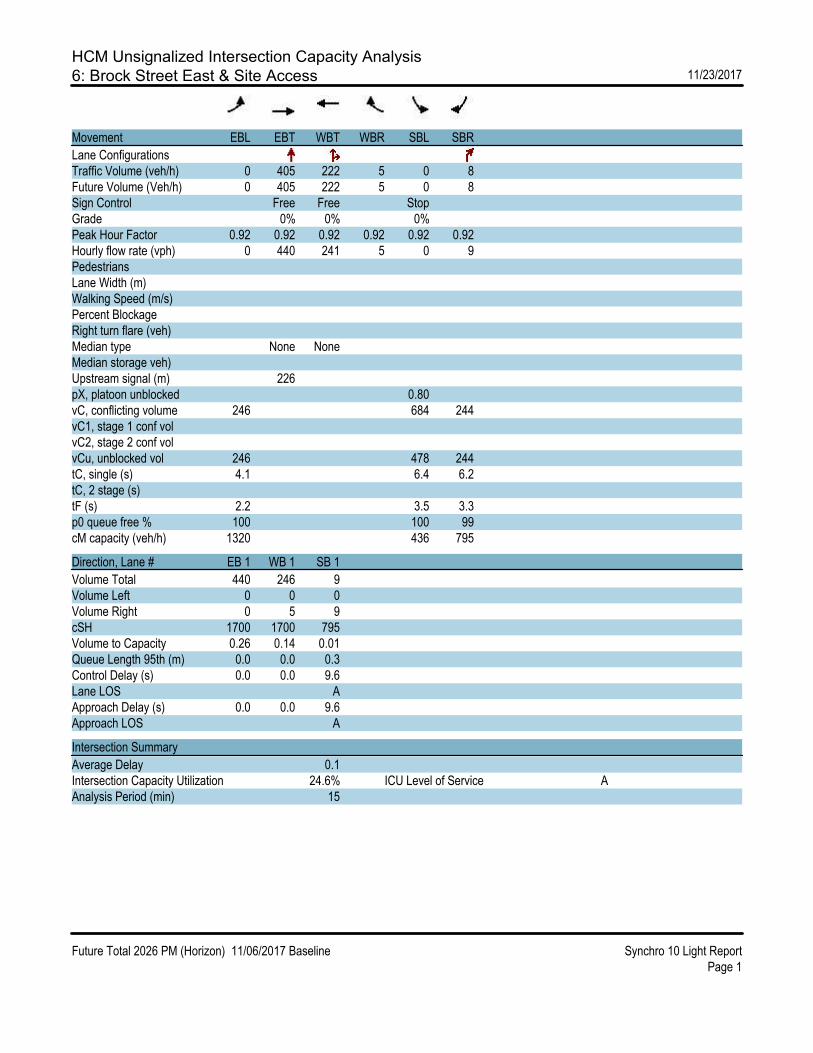
HCM Unsignalized Intersection Capacity Analysis6: Brock Street East & Site Access 11/23/2017
Future Total 2026 PM (Horizon) 11/06/2017 Baseline Synchro 10 Light ReportPage 1
Movement EBL EBT WBT WBR SBL SBR
Lane ConfigurationsTraffic Volume (veh/h) 0 405 222 5 0 8Future Volume (Veh/h) 0 405 222 5 0 8Sign Control Free Free StopGrade 0% 0% 0%Peak Hour Factor 0.92 0.92 0.92 0.92 0.92 0.92Hourly flow rate (vph) 0 440 241 5 0 9PedestriansLane Width (m)Walking Speed (m/s)Percent BlockageRight turn flare (veh)Median type None NoneMedian storage veh)Upstream signal (m) 226pX, platoon unblocked 0.80vC, conflicting volume 246 684 244vC1, stage 1 conf volvC2, stage 2 conf volvCu, unblocked vol 246 478 244tC, single (s) 4.1 6.4 6.2tC, 2 stage (s)tF (s) 2.2 3.5 3.3p0 queue free % 100 100 99cM capacity (veh/h) 1320 436 795
Direction, Lane # EB 1 WB 1 SB 1
Volume Total 440 246 9Volume Left 0 0 0Volume Right 0 5 9cSH 1700 1700 795Volume to Capacity 0.26 0.14 0.01Queue Length 95th (m) 0.0 0.0 0.3Control Delay (s) 0.0 0.0 9.6Lane LOS AApproach Delay (s) 0.0 0.0 9.6Approach LOS A
Intersection Summary
Average Delay 0.1Intersection Capacity Utilization 24.6% ICU Level of Service AAnalysis Period (min) 15

HCM Unsignalized Intersection Capacity Analysis8: Herrema Boulevard & Low Boulevard 11/23/2017
Future Total 2026 PM (Horizon) 11/06/2017 Baseline Synchro 10 Light ReportPage 2
Movement EBL EBT EBR WBL WBT WBR NBL NBT NBR SBL SBT SBR
Lane ConfigurationsTraffic Volume (veh/h) 0 0 7 10 0 0 14 66 30 0 32 0Future Volume (Veh/h) 0 0 7 10 0 0 14 66 30 0 32 0Sign Control Stop Stop Free FreeGrade 0% 0% 0% 0%Peak Hour Factor 0.92 0.92 0.92 0.92 0.92 0.92 0.92 0.92 0.92 0.92 0.92 0.92Hourly flow rate (vph) 0 0 8 11 0 0 15 72 33 0 35 0PedestriansLane Width (m)Walking Speed (m/s)Percent BlockageRight turn flare (veh)Median type None NoneMedian storage veh)Upstream signal (m) 119pX, platoon unblockedvC, conflicting volume 154 170 35 162 154 88 35 105vC1, stage 1 conf volvC2, stage 2 conf volvCu, unblocked vol 154 170 35 162 154 88 35 105tC, single (s) 7.1 6.5 6.2 7.1 6.5 6.2 4.1 4.1tC, 2 stage (s)tF (s) 3.5 4.0 3.3 3.5 4.0 3.3 2.2 2.2p0 queue free % 100 100 99 99 100 100 99 100cM capacity (veh/h) 808 716 1038 792 731 970 1576 1486
Direction, Lane # EB 1 WB 1 NB 1 SB 1
Volume Total 8 11 120 35Volume Left 0 11 15 0Volume Right 8 0 33 0cSH 1038 792 1576 1486Volume to Capacity 0.01 0.01 0.01 0.00Queue Length 95th (m) 0.2 0.3 0.2 0.0Control Delay (s) 8.5 9.6 1.0 0.0Lane LOS A A AApproach Delay (s) 8.5 9.6 1.0 0.0Approach LOS A A
Intersection Summary
Average Delay 1.7Intersection Capacity Utilization 26.6% ICU Level of Service AAnalysis Period (min) 15
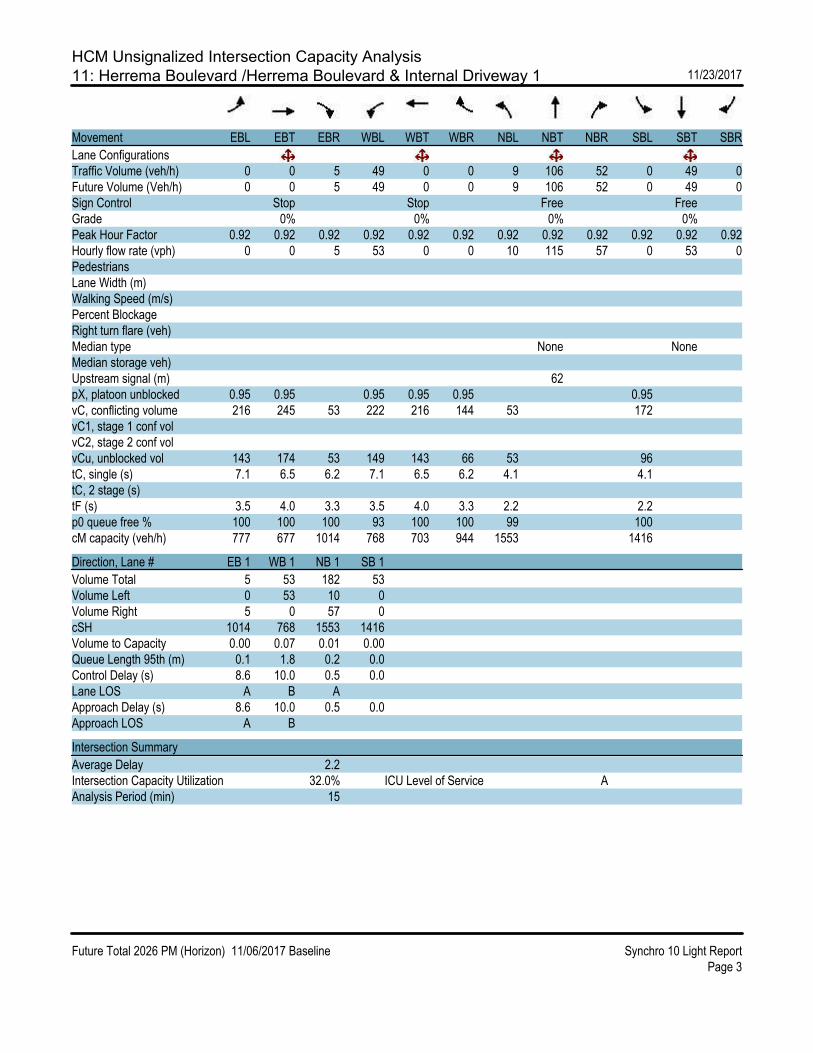
HCM Unsignalized Intersection Capacity Analysis11: Herrema Boulevard /Herrema Boulevard & Internal Driveway 1 11/23/2017
Future Total 2026 PM (Horizon) 11/06/2017 Baseline Synchro 10 Light ReportPage 3
Movement EBL EBT EBR WBL WBT WBR NBL NBT NBR SBL SBT SBR
Lane ConfigurationsTraffic Volume (veh/h) 0 0 5 49 0 0 9 106 52 0 49 0Future Volume (Veh/h) 0 0 5 49 0 0 9 106 52 0 49 0Sign Control Stop Stop Free FreeGrade 0% 0% 0% 0%Peak Hour Factor 0.92 0.92 0.92 0.92 0.92 0.92 0.92 0.92 0.92 0.92 0.92 0.92Hourly flow rate (vph) 0 0 5 53 0 0 10 115 57 0 53 0PedestriansLane Width (m)Walking Speed (m/s)Percent BlockageRight turn flare (veh)Median type None NoneMedian storage veh)Upstream signal (m) 62pX, platoon unblocked 0.95 0.95 0.95 0.95 0.95 0.95vC, conflicting volume 216 245 53 222 216 144 53 172vC1, stage 1 conf volvC2, stage 2 conf volvCu, unblocked vol 143 174 53 149 143 66 53 96tC, single (s) 7.1 6.5 6.2 7.1 6.5 6.2 4.1 4.1tC, 2 stage (s)tF (s) 3.5 4.0 3.3 3.5 4.0 3.3 2.2 2.2p0 queue free % 100 100 100 93 100 100 99 100cM capacity (veh/h) 777 677 1014 768 703 944 1553 1416
Direction, Lane # EB 1 WB 1 NB 1 SB 1
Volume Total 5 53 182 53Volume Left 0 53 10 0Volume Right 5 0 57 0cSH 1014 768 1553 1416Volume to Capacity 0.00 0.07 0.01 0.00Queue Length 95th (m) 0.1 1.8 0.2 0.0Control Delay (s) 8.6 10.0 0.5 0.0Lane LOS A B AApproach Delay (s) 8.6 10.0 0.5 0.0Approach LOS A B
Intersection Summary
Average Delay 2.2Intersection Capacity Utilization 32.0% ICU Level of Service AAnalysis Period (min) 15

HCM Unsignalized Intersection Capacity Analysis14: Internal Driveway 2 & Low Boulevard 11/23/2017
Future Total 2026 PM (Horizon) 11/06/2017 Baseline Synchro 10 Light ReportPage 4
Movement EBT EBR WBL WBT NBL NBR
Lane ConfigurationsTraffic Volume (veh/h) 0 0 8 0 0 5Future Volume (Veh/h) 0 0 8 0 0 5Sign Control Free Free StopGrade 0% 0% 0%Peak Hour Factor 0.92 0.92 0.92 0.92 0.92 0.92Hourly flow rate (vph) 0 0 9 0 0 5PedestriansLane Width (m)Walking Speed (m/s)Percent BlockageRight turn flare (veh)Median type None NoneMedian storage veh)Upstream signal (m)pX, platoon unblockedvC, conflicting volume 0 18 0vC1, stage 1 conf volvC2, stage 2 conf volvCu, unblocked vol 0 18 0tC, single (s) 4.1 6.4 6.2tC, 2 stage (s)tF (s) 2.2 3.5 3.3p0 queue free % 99 100 100cM capacity (veh/h) 1623 994 1085
Direction, Lane # EB 1 WB 1 NB 1
Volume Total 0 9 5Volume Left 0 9 0Volume Right 0 0 5cSH 1700 1623 1085Volume to Capacity 0.00 0.01 0.00Queue Length 95th (m) 0.0 0.1 0.1Control Delay (s) 0.0 7.2 8.3Lane LOS A AApproach Delay (s) 0.0 7.2 8.3Approach LOS A
Intersection Summary
Average Delay 7.6Intersection Capacity Utilization 13.3% ICU Level of Service AAnalysis Period (min) 15

Appendix J –
York Region Typical Right Turn In/Right Turn Out Design Standard


Appendix K – Left Turn Lane Warrant
Nomograph


Appendix L – Transit Route Services

Effective September 4, 2017
ROUTE601-603-950-960
BROCK - UXBRIDGEPICKERING - UXBRIDGE
REACH - SIMCOE NORTH NEWMARKET - UXBRIDGE
SUNDERLAND
CANNINGTON
BEAVERTON
UXBRIDGE
HW
Y 12
RR 10
RAVENSHOE RD
RR 1
HWY 7
SIM
COE
ST
RR 12
RR 2
3
OSBO
RNE
ST
RR 2
3
RR 2
3
WILFRID
UDORA
LEAKSDALE
MANILLAMANILLA
HWY 48
ALBERT ST
RIVER ST
MAIN ST
9 M
ILE
ST
SIMCOE ST
CLAREMONT
BROUGHAM N
81
SIM
COE
ST
REACH ST
UOIT / DCNORTHCAMPUS
PORT PERRYPORT PERRY
WELWOODPLAZA
DAVIS DR / 404
YORK
DU
RHA
M L
N
DAVIS DR
REGIONAL RD 8
601
950960
960
950
601
601
see inset
see inset
PICKERINGPARKWAYTERMINAL
BROCK RD
HWY 7
603
T T T T
Bra
nch
Wel
woo
d &
Tor
onto
| D
epar
t
Stop
# 2
416
Toro
nto
& A
lber
t
Stop
# 2
422
Bro
ck &
Qua
ker V
illag
e
St
op #
935
47
Firs
t & B
rock
Stop
# 3
333
Rea
ch &
Eas
t
Stop
# 2
428
Rea
ch &
Sim
coe
Stop
# 2
453
Paxt
on &
Ros
a | P
ort P
erry
Hos
pita
l |St
op #
249
8
Cur
ts &
Wat
er |
Port
Per
ry
Te
rmin
al | S
top
# 24
91
Smar
t Cen
tre
Port
Per
ry
St
op #
330
0
Sim
coe
& G
reen
Way
St
op #
274
5
Sim
coe
& R
agla
n
Stop
# 2
465
Sim
coe
& C
olum
bus
St
op #
245
8
UO
IT /
DC
Nor
th C
ampu
s |
Arr
ive
Bra
nch
UO
IT /
DC
Nor
th C
ampu
s |
D
epar
t Sto
p #
698
Sim
coe
& C
olum
bus
St
op #
245
7
Sim
coe
& R
agla
n
Stop
# 2
462
Sim
coe
& G
reen
way
Stop
# 2
733
Smar
t Cen
tre
Port
Per
ry
St
op #
330
0
Cur
ts &
Wat
er |
Port
Per
ry
Te
rmin
al | S
top
# 24
91
Paxt
on &
Ros
a | P
ort P
erry
Hos
pita
l | S
top
# 24
98
Rea
ch &
Sim
coe
Stop
# 2
454
Fran
klin
& R
each
Stop
# 3
224
Firs
t & B
rock
Stop
# 2
435
Bro
ck &
Sou
th B
alsa
m
St
op #
321
0
Toro
nto
& B
rock
| N
orth
Sid
e |
Stop
# 2
424
Wel
woo
d &
Tor
onto
| A
rriv
e
Toro
nto
& B
rock
| N
orth
Sid
e |
Dep
art |
Sto
p #
2424
Bro
ck &
Qua
ker V
illag
e
St
op #
935
47
Reg
iona
l Roa
d 8
& M
ill R
un |
Si
loam
| Sto
p #
3237
Dav
is -
404
Park
& R
ide
|
Arr
ive
Dav
is -
404
Park
& R
ide
|
Dep
art S
top
# 32
41
Reg
iona
l Roa
d 8
& M
ill R
un |
Si
loam
| St
op #
323
8
Bro
ck &
Sou
th B
alsa
m
St
op #
321
0
Toro
nto
& A
lber
t | A
rriv
e
950C - 06:20 06:23 06:30 06:33 06:45 06:49 06:54 → 07:05 07:12 07:15 07:23 950B - - - - - 06:44 06:49 06:53 07:05 07:08 07:16 07:20 - 07:20 07:23 07:28 07:44 07:50 08:06 08:11 08:15950C - 07:20 07:23 07:30 07:33 07:45 07:49 07:54 → 08:05 08:12 08:15 08:23 950B 07:25 07:32 07:35 07:42 07:50 07:57 08:02 08:06 08:18 08:21 08:29 08:33 - 08:40 08:43 08:48 09:04 09:20 09:36 09:41 09:45950 - 08:20 08:23 08:30 08:33 08:45 08:49 08:54 09:00 09:08 09:15 09:18 09:26 950 08:25 08:32 08:35 08:42 08:50 08:57 09:02 09:06 09:18 09:21 09:29 09:33 09:38 13:40 13:43 13:48 14:04 14:10 14:26 14:31 14:35950 - 09:50 09:53 10:00 10:03 10:15 10:19 10:24 10:30 10:38 10:45 10:48 10:56 950 09:55 10:02 10:05 10:12 10:20 10:27 10:32 10:36 10:48 10:51 10:59 11:03 11:08 17:00 17:03 17:08 17:24 17:35 17:51 17:56 18:00950 11:15 11:20 11:23 11:30 11:33 11:45 11:49 11:54 12:00 12:08 12:15 12:18 12:26 950B 12:30 12:37 12:40 12:47 12:55 13:02 13:07 13:11 13:23 13:26 13:34 13:38 - 18:05 18:08 18:13 18:29 18:35 18:51 18:56 19:00950 13:15 13:20 13:23 13:30 13:33 13:45 13:49 13:54 14:00 14:08 14:15 14:18 14:26 950 14:30 14:37 14:40 14:47 14:55 15:01 15:07 15:11 15:23 15:26 15:34 15:38 15:43950 - 14:40 14:43 14:50 14:53 15:05 15:09 15:14 15:20 15:28 15:35 15:38 15:46 950B 15:50 15:57 16:00 16:07 16:15 16:22 16:27 16:31 16:43 16:46 16:54 16:58 -950 16:25 16:30 16:33 16:40 16:43 16:55 16:59 17:04 17:10 17:18 17:25 17:28 17:36 950B 16:50 16:57 17:00 17:07 17:15 17:22 17:27 17:31 17:43 17:46 17:54 17:58 -950 - 18:05 18:08 18:15 18:18 18:30 18:34 18:39 18:45 18:53 19:00 19:03 19:11 950 17:45 17:52 17:55 18:02 18:10 18:17 18:22 18:26 18:38 18:41 18:49 18:53 18:58950 - 19:05 19:08 19:15 19:18 19:30 19:34 19:39 19:45 19:53 20:00 20:03 20:11 950 19:15 19:22 19:25 19:32 19:40 19:47 19:52 19:56 20:08 20:11 20:19 20:23 20:28950 21:00 21:05 21:08 21:15 21:18 21:30 21:34 21:39 21:45 21:53 22:00 22:03 22:11 950 20:15 20:22 20:25 20:32 20:40 20:47 20:52 20:56 21:08 21:11 21:19 21:23 21:28
950 22:15 22:22 22:25 22:32 22:40 22:47 22:52 22:56 23:08 23:11 23:19 23:23 23:28
950 08:20 08:25 08:28 08:34 08:37 08:47 08:51 08:56 9:02 09:09 09:15 09:18 09:25 950 - - - - - 07:38 07:43 07:47 07:57 08:00 08:06 08:10 08:15950 10:40 10:45 10:48 10:54 10:57 11:07 11:11 11:16 11:22 11:29 11:35 11:38 11:45 950 09:30 09:37 09:40 09:46 09:52 09:58 10:03 10:07 10:17 10:20 10:26 10:30 10:35950 13:00 13:05 13:08 13:14 13:17 13:27 13:31 13:36 13:42 13:49 13:55 13:58 14:05 950 11:50 11:57 12:00 12:06 12:12 12:18 12:23 12:27 12:37 12:40 12:46 12:50 12:55950 15:20 15:25 15:28 15:34 15:37 15:47 15:51 15:56 16:02 16:09 16:15 16:18 16:25 950 14:10 14:17 14:20 14:26 14:32 14:38 14:43 14:47 14:57 15:00 15:06 15:10 15:15950 17:40 17:45 17:48 17:54 17:57 18:07 18:11 18:16 18:22 18:29 18:35 18:38 18:45 950 16:30 16:37 16:40 16:46 16:52 16:58 17:03 17:07 17:17 17:20 17:26 17:30 17:35
950 18:50 18:57 19:00 19:06 19:12 19:18 19:23 19:27 19:37 19:40 19:46 19:50 19:55
T
Bra
nch
Wel
woo
d &
Tor
onto
| U
xbrid
ge |
D
epar
t St
op #
241
6
Vict
oria
at U
xbrid
ge H
ospi
tal
En
tran
ce S
top
# 33
03
Toro
nto
& B
rock
| S
outh
Sid
e
| U
xbrid
ge |
Stop
# 9
3018
Firs
t & B
rock
| U
xbrid
ge |
St
op #
333
3
R.R
. 1 &
Har
rison
| Le
askd
ale
|
St
op #
319
8
R.R
. 1 &
Rav
ensh
oe |
Udo
ra |
St
op #
319
4
Alb
ert &
Riv
er |
Sund
erla
nd |
St
op #
253
0
Sim
coe
& H
wy.
7 |
Man
illa
|
St
op #
319
2
Cam
eron
& A
nn |
Can
ning
ton
|
St
op #
935
49
Hw
y. 1
2 &
Bro
ck R
oad
| Wilf
rid |
St
op #
323
4
R.R
23
& H
wy.
48
Stop
# 3
180
R.R
. 23
& C
once
ssio
n 2
Stop
# 3
182
Hw
y. 1
2 &
Bea
ver |
Bea
vert
on |
Stop
# 9
3528
Mai
n &
Fra
nklin
| B
eave
rton
|
Stop
# 9
3529
9 M
ile a
t Lak
evie
w M
anno
r
| B
eave
rton
| A
rriv
e
Bra
nch
9 M
ile a
t Lak
evie
w M
anno
r
| B
eave
rton
| D
epar
t S
top
# 31
90
Hw
y. 1
2 &
Bea
ver |
Bea
vert
on |
Stop
# 9
3528
Mai
n &
Fra
nklin
| B
eave
rton
|
Stop
# 9
3529
R.R
. 23
& C
once
ssio
n 2
Stop
# 3
183
R.R
23
& H
wy.
48
Stop
# 3
181
Hw
y. 1
2 &
Bro
ck R
oad
| Wilf
rid |
St
op #
323
5
Cam
eron
& A
nn |
Can
ning
ton
|
St
op #
253
3
Sim
coe
& H
wy.
7 |
Man
illa
|
St
op #
319
1
Alb
ert &
Jon
es |
Sund
erla
nd |
St
op #
319
3
R.R
. 1 &
Rav
ensh
oe |
Udo
ra |
St
op #
319
5
R.R
. 1 &
Har
rison
| Le
askd
ale
|
St
op #
319
9
Firs
t & B
rock
| U
xbrid
ge |
St
op #
243
5
Toro
nto
& B
rock
| So
uth
Side
|
U
xbrid
ge |
Stop
# 2
438
Toro
nto
& A
lber
t | U
xbrid
ge |
St
op #
242
2
Vict
oria
at U
xbrid
ge H
ospi
tal
En
tran
ce
Stop
# 3
301
Wel
woo
d &
Tor
onto
| U
xbrid
ge |
A
rriv
e
601 10:15 10:18 10:20 10:22 10:31 10:36 10:47 10:59 11:08 11:20 11:22 11:26 11:36 11:40 11:45 601B - - - - - - - - - 06:03 06:08 06:17 → 06:19 - -601 15:55 15:58 16:00 16:02 16:11 16:16 16:27 16:39 16:48 17:00 17:02 17:06 17:16 17:20 17:25 601B 05:50 05:55 05:59 06:09 06:13 06:15 06:27 06:36 06:48 06:59 07:04 07:13 → 07:15 - -601B 19:05 19:08 19:10 19:12 19:21 19:26 - - - - - - - - - 601 11:50 → → 11:59 12:03 12:05 12:17 12:26 12:38 12:49 12:54 13:03 13:05 → 13:06 13:10
601 17:30 → → 17:39 17:43 17:45 17:57 18:06 18:18 18:29 18:34 18:43 18:45 → 18:46 18:50
→ Stop not serviced by this trip T Connect between Routes 601 / 950 / 960
Monday - Saturday
South to UOIT / DC North Campus Terminal North to Uxbridge
Monday - Friday950 950
Saturday950 950
Legend
Monday - Friday
North to Beaverton South to UxbridgeT
601 601
Monday - Friday
East to Uxbridge
960
West to Newmarket
960Monday - Friday
UXBRIDGE
PORT PERRY
BROCK ST W
MA
IN ST
CON
C. 7
TORO
NTO
ST
OLD
SIM
COE
RDO
LD S
IMCO
E RD
REACH ST
REACH ST WATER ST
NORTH ST
QU
AKER
VIL
LAG
E DR
DALLAS ST
2ND
ST
KING ST
UNIO
N AV
QUEEN STQUEEN ST
BALSAM ST
PAXTON STPAXTON ST
BALSAM STROSA ST
PERRY ST
TOUXBRIDGE
TO UOIT/DC NORTH CAMPUS
DOMINION STTODAVIS DR / 404
TO UOIT/DCNORTH CAMPUS
TOBEAVERTON
1ST AV
BROCK ST E
2ND
AVDOMINION ST
DOMINION STDOMINION ST
UXBRIDGETORONTO & BROCK
601960
950
PORT PERRYCURTS & WATER
950
FRAN
KLIN ST
SIM
COE
ST
71
81
960
601
950
PEEL ST
VICTORIA ST
WELWOODDRIVE
HW
Y 12
950
NEW
950 SATURDAY
SERV
ICE
CONTACT US
Customer Service Centre 1-866-247-0055
durhamregiontransit.com
@durham_transit
/durhamregiontransit
Toro
nto
& B
rock
| Uxb
ridge
| D
epar
t | S
top
# 24
24
Wel
woo
d &
Tor
onto
| Uxb
ridge
| St
op #
241
6
Old
Bro
ck &
Cen
tral
| A
corn
|
| U
xbrid
ge |
Stop
# 3
386
407
/ Bro
ck P
ark
& R
ide
| Pic
kerin
g | S
top
# 33
77
Pick
erin
g Pa
rkw
ay T
erm
inal
| Arri
ve
Pick
erin
g Pa
rkw
ay T
erm
inal
| Dep
art |
Sto
p #
9311
2
407
/ Bro
ck P
ark
& R
ide
| Pic
kerin
g | S
top
# 33
76
Old
Bro
ck &
Cen
tral
| A
corn
|
| U
xbrid
ge |
Stop
# 3
385
Wel
woo
d &
Tor
onto
| Uxb
ridge
| Ar
rive
06:30 06:35 06:50 06:58 07:15 10:32 10:47 10:55 11:1007:55 08:00 08:15 08:23 08:40 12:32 12:47 12:55 13:10
- 11:15 11:30 11:38 11:53 15:40 15:55 16:03 16:18- 13:15 13:30 13:38 13:53 17:45 18:00 18:08 18:23
→ Stop not serviced by this tripLegend
Monday - Friday
North to UxbridgeSouth to Pickering
603603
UXBRIDGE
PORT PERRY
BROCK ST W
MA
IN ST
CON
C. 7
TORO
NTO
ST
OLD
SIM
COE
RDO
LD S
IMCO
E RD
REACH ST
REACH ST WATER ST
NORTH ST
QU
AKER
VIL
LAG
E DR
DALLAS ST
2ND
ST
KING ST
UNIO
N AV
QUEEN STQUEEN ST
BALSAM ST
PAXTON STPAXTON ST
BALSAM STROSA ST
PERRY ST
TOUXBRIDGE
TO UOIT/DC NORTH CAMPUS
DOMINION STTODAVIS DR / 404
TO UOIT/DCNORTH CAMPUS
TOBEAVERTON
1ST AV
BROCK ST E
2ND
AV
DOMINION ST
DOMINION STDOMINION ST
UXBRIDGETORONTO & BROCK
601960
950
PORT PERRYCURTS & WATER
950
FRAN
KLIN ST
SIM
COE
ST
71
81
960
601
950
PEEL ST
VICTORIA ST
WELWOODDRIVE
HW
Y 12
950

ROUTE 601 - 603 - 950 - 960BROCK - UXBRIDGE PICKERING - UXBRIDGEREACH - SIMCOE NORTH NEWMARKET - UXBRIDGE
T T T T
Bra
nch
Wel
woo
d &
Tor
onto
| D
epar
t
Stop
# 2
416
Toro
nto
& A
lber
t
Stop
# 2
422
Bro
ck &
Qua
ker V
illag
e
St
op #
935
47
Firs
t & B
rock
Stop
# 3
333
Rea
ch &
Eas
t
Stop
# 2
428
Rea
ch &
Sim
coe
Stop
# 2
453
Paxt
on &
Ros
a | P
ort P
erry
Hos
pita
l |St
op #
249
8
Cur
ts &
Wat
er |
Port
Per
ry
Te
rmin
al | S
top
# 24
91
Smar
t Cen
tre
Port
Per
ry
St
op #
330
0
Sim
coe
& G
reen
Way
St
op #
274
5
Sim
coe
& R
agla
n
Stop
# 2
465
Sim
coe
& C
olum
bus
St
op #
245
8
UO
IT /
DC
Nor
th C
ampu
s |
Arr
ive
Bra
nch
UO
IT /
DC
Nor
th C
ampu
s |
D
epar
t Sto
p #
698
Sim
coe
& C
olum
bus
St
op #
245
7
Sim
coe
& R
agla
n
Stop
# 2
462
Sim
coe
& G
reen
way
Stop
# 2
733
Smar
t Cen
tre
Port
Per
ry
St
op #
330
0
Cur
ts &
Wat
er |
Port
Per
ry
Te
rmin
al | S
top
# 24
91
Paxt
on &
Ros
a | P
ort P
erry
Hos
pita
l | S
top
# 24
98
Rea
ch &
Sim
coe
Stop
# 2
454
Fran
klin
& R
each
Stop
# 3
224
Firs
t & B
rock
Stop
# 2
435
Bro
ck &
Sou
th B
alsa
m
St
op #
321
0
Toro
nto
& B
rock
| N
orth
Sid
e |
Stop
# 2
424
Wel
woo
d &
Tor
onto
| A
rriv
e
Toro
nto
& B
rock
| N
orth
Sid
e |
Dep
art |
Sto
p #
2424
Bro
ck &
Qua
ker V
illag
e
St
op #
935
47
Reg
iona
l Roa
d 8
& M
ill R
un |
Si
loam
| Sto
p #
3237
Dav
is -
404
Park
& R
ide
|
Arr
ive
Dav
is -
404
Park
& R
ide
|
Dep
art S
top
# 32
41
Reg
iona
l Roa
d 8
& M
ill R
un |
Si
loam
| St
op #
323
8
Bro
ck &
Sou
th B
alsa
m
St
op #
321
0
Toro
nto
& A
lber
t | A
rriv
e
950C - 06:20 06:23 06:30 06:33 06:45 06:49 06:54 → 07:05 07:12 07:15 07:23 950B - - - - - 06:44 06:49 06:53 07:05 07:08 07:16 07:20 - 07:20 07:23 07:28 07:44 07:50 08:06 08:11 08:15950C - 07:20 07:23 07:30 07:33 07:45 07:49 07:54 → 08:05 08:12 08:15 08:23 950B 07:25 07:32 07:35 07:42 07:50 07:57 08:02 08:06 08:18 08:21 08:29 08:33 - 08:40 08:43 08:48 09:04 09:20 09:36 09:41 09:45950 - 08:20 08:23 08:30 08:33 08:45 08:49 08:54 09:00 09:08 09:15 09:18 09:26 950 08:25 08:32 08:35 08:42 08:50 08:57 09:02 09:06 09:18 09:21 09:29 09:33 09:38 13:40 13:43 13:48 14:04 14:10 14:26 14:31 14:35950 - 09:50 09:53 10:00 10:03 10:15 10:19 10:24 10:30 10:38 10:45 10:48 10:56 950 09:55 10:02 10:05 10:12 10:20 10:27 10:32 10:36 10:48 10:51 10:59 11:03 11:08 17:00 17:03 17:08 17:24 17:35 17:51 17:56 18:00950 11:15 11:20 11:23 11:30 11:33 11:45 11:49 11:54 12:00 12:08 12:15 12:18 12:26 950B 12:30 12:37 12:40 12:47 12:55 13:02 13:07 13:11 13:23 13:26 13:34 13:38 - 18:05 18:08 18:13 18:29 18:35 18:51 18:56 19:00950 13:15 13:20 13:23 13:30 13:33 13:45 13:49 13:54 14:00 14:08 14:15 14:18 14:26 950 14:30 14:37 14:40 14:47 14:55 15:02 15:07 15:11 15:23 15:26 15:34 15:38 15:43950 - 14:40 14:43 14:50 14:53 15:05 15:09 15:14 15:20 15:28 15:35 15:38 15:46 950B 15:50 15:57 16:00 16:07 16:15 16:22 16:27 16:31 16:43 16:46 16:54 16:58 -950 16:25 16:30 16:33 16:40 16:43 16:55 16:59 17:04 17:10 17:18 17:25 17:28 17:36 950B 16:50 16:57 17:00 17:07 17:15 17:22 17:27 17:31 17:43 17:46 17:54 17:58 -950 - 18:05 18:08 18:15 18:18 18:30 18:34 18:39 18:45 18:53 19:00 19:03 19:11 950 17:45 17:52 17:55 18:02 18:10 18:17 18:22 18:26 18:38 18:41 18:49 18:53 18:58950 - 19:05 19:08 19:15 19:18 19:30 19:34 19:39 19:45 19:53 20:00 20:03 20:11 950 19:15 19:22 19:25 19:32 19:40 19:47 19:52 19:56 20:08 20:11 20:19 20:23 20:28950 21:00 21:05 21:08 21:15 21:18 21:30 21:34 21:39 21:45 21:53 22:00 22:03 22:11 950 20:15 20:22 20:25 20:32 20:40 20:47 20:52 20:56 21:08 21:11 21:19 21:23 21:28
950 22:15 22:22 22:25 22:32 22:40 22:47 22:52 22:56 23:08 23:11 23:19 23:23 23:28
950 08:20 08:25 08:28 08:34 08:37 08:47 08:51 08:56 09:02 09:09 09:15 09:18 09:25 950 - - - - - 07:38 07:43 07:47 07:57 08:00 08:06 08:10 08:15950 10:40 10:45 10:48 10:54 10:57 11:07 11:11 11:16 11:22 11:29 11:35 11:38 11:45 950 09:30 09:37 09:40 09:46 09:52 09:58 10:03 10:07 10:17 10:20 10:26 10:30 10:35950 13:00 13:05 13:08 13:14 13:17 13:27 13:31 13:36 13:42 13:49 13:55 13:58 14:05 950 11:50 11:57 12:00 12:06 12:12 12:18 12:23 12:27 12:37 12:40 12:46 12:50 12:55950 15:20 15:25 15:28 15:34 15:37 15:47 15:51 15:56 16:02 16:09 16:15 16:18 16:25 950 14:10 14:17 14:20 14:26 14:32 14:38 14:43 14:47 14:57 15:00 15:06 15:10 15:15950 17:40 17:45 17:48 17:54 17:57 18:07 18:11 18:16 18:22 18:29 18:35 18:38 18:45 950 16:30 16:37 16:40 16:46 16:52 16:58 17:03 17:07 17:17 17:20 17:26 17:30 17:35
950 18:50 18:57 19:00 19:06 19:12 19:18 19:23 19:27 19:37 19:40 19:46 19:50 19:55
T
Bra
nch
Wel
woo
d &
Tor
onto
| U
xbrid
ge |
D
epar
t St
op #
241
6
Toro
nto
& B
rock
| S
outh
Sid
e
| U
xbrid
ge |
Stop
# 9
3018
Firs
t & B
rock
| U
xbrid
ge |
St
op #
333
3
R.R
. 1 &
Har
rison
| Le
askd
ale
|
St
op #
319
8
R.R
. 1 &
Rav
ensh
oe |
Udo
ra |
St
op #
319
4
Alb
ert &
Riv
er |
Sund
erla
nd |
St
op #
253
0
Sim
coe
& H
wy.
7 |
Man
illa
|
St
op #
319
2
Cam
eron
& A
nn |
Can
ning
ton
|
St
op #
935
49
Hw
y. 1
2 &
Bro
ck R
oad
| Wilf
rid |
St
op #
323
4
R.R
23
& H
wy.
48
Stop
# 3
180
R.R
. 23
& C
once
ssio
n 2
Stop
# 3
182
Hw
y. 1
2 &
Bea
ver |
Bea
vert
on |
Stop
# 9
3528
Mai
n &
Fra
nklin
| B
eave
rton
|
Stop
# 9
3529
9 M
ile a
t Lak
evie
w M
anno
r
| B
eave
rton
| A
rriv
e
Bra
nch
9 M
ile a
t Lak
evie
w M
anno
r
| B
eave
rton
| D
epar
t S
top
# 31
90
R.R
. 23
& C
once
ssio
n 2
Stop
# 3
183
R.R
23
& H
wy.
48
Stop
# 3
181
Hw
y. 1
2 &
Bro
ck R
oad
| Wilf
rid |
St
op #
323
5
Cam
eron
& A
nn |
Can
ning
ton
|
St
op #
253
3
Sim
coe
& H
wy.
7 |
Man
illa
|
St
op #
319
1
Alb
ert &
Jon
es |
Sund
erla
nd |
St
op #
319
3
R.R
. 1 &
Rav
ensh
oe |
Udo
ra |
St
op #
319
5
R.R
. 1 &
Har
rison
| Le
askd
ale
|
St
op #
319
9
Firs
t & B
rock
| U
xbrid
ge |
St
op #
243
5
Toro
nto
& B
rock
| So
uth
Side
|
U
xbrid
ge |
Stop
# 2
438
Toro
nto
& A
lber
t | U
xbrid
ge |
St
op #
242
2
Vict
oria
at U
xbrid
ge H
ospi
tal
En
tran
ce
Stop
# 3
301
Wel
woo
d &
Tor
onto
| U
xbrid
ge |
A
rriv
e
601 - - - - - - - - - - - 05:51 05:55 06:00 601B - - - - - - 05:53 06:03 06:08 06:17 → 06:19 - -601 10:15 10:20 10:22 10:31 10:36 10:47 10:59 11:08 11:20 11:22 11:26 11:36 11:40 11:45 601B 06:00 06:09 06:13 06:15 06:27 06:36 06:48 06:59 07:04 07:13 07:15 - - -601 15:55 16:00 16:02 16:11 16:16 16:27 16:39 16:48 17:00 17:02 17:06 17:16 17:20 17:25 601 11:50 11:59 12:03 12:05 12:17 12:26 12:38 12:49 12:54 13:03 13:05 → 13:06 13:10601B 18:30 18:35 18:37 18:46 18:51 19:02 - - - - - - - - 601 17:30 17:39 17:43 17:45 17:57 18:06 18:18 18:29 18:34 18:43 18:45 → 18:46 18:50
Legend→ Stop not serviced by this trip T Connect between Routes 601 / 950 / 960
South to Uxbridge
601
Monday - Saturday
South to UOIT / DC North Campus Terminal North to Uxbridge
Monday - Friday950 950
Saturday950 950
TNorth to Beaverton
601
Monday - Friday
Monday - Friday
East to Uxbridge
960
West to Newmarket
960Monday - Friday
If this information is required in an
accessible format, please call
1-866-247-0055