Embed Size (px)
Citation preview

CH
AP
TE
R 2
CH
AP
TE
R 2
28 | ENERGY FUTURE: Think Efficiency American Physical Society • September 2008
T r a n s p o r tat i o nEnhancing energy security and reducing global warming through improvements in energy efficiency constitute the two primary objectives of this study. Chapter 2 examines the opportunities and challenges posed by the transportation sector, which consumes 70 percent of the petroleum the United States uses for fuel. Today, our nation imports two out of every three barrels of oil we consume, as we noted in Chapter 1, and U.S. domestic production cannot be increased any time soon. Unless we are able to reduce transportation’s use of petroleum, we will continue to be dependent on potentially unreliable sources of foreign oil, and we will continue to send hundreds of billion of dollars to nations that often do not share our values or global outlook.
Reducing or eliminating transportation’s reliance on petroleum requires developing and deploying technologies and policies that do not place an unaffordable financial burden on consumers or entail rapid changes in where and how people live and work. Unlike many Europeans, who often live in concentrated population centers and have well-developed public transit, most Americans live in suburban and exurban areas and rely heavily on cars to get them to and from work and to perform daily tasks.
In this chapter we focus on technologies and strategies that we believe can get more mileage from existing and emerging technologies, and properly funded and targeted research and development that will likely lead to more options in the future.
Introduction
Last year, Americans driving cars, minivans, sport utility vehicles and pickup trucks burned an average of 270,000 gallons of gasoline a minute. Burning that gasoline dumped the greenhouse gas carbon dioxide into the atmosphere
at the prodigious rate of 2,400 metric tons per minute.
And it wasn’t cheap. Americans paid about $700,000 per minute to the foreign countries that were supplying the oil from which the gasoline was made.
Transportation accounts for 70 percent of the petroleum used for fuel in the U.S., and today we are using more fuel than ever before.1, 2 We import approximately
1. The U.S. transportation sector consumed approximately 18 billion BTUs in 1975 and 40.5 billion BTUs in 2007. (E.I.A.: http://www.eia.doe.gov/emeu/aer/consump.html)
2. “Energyintensitiesarefallingmoreslowlythaneverbeforewhileactualenergyuseincreasedfasterthanatanytimesince1970.”[MurtishawandSchipper2001]
American Physical Society • September 2008 ENERGY FUTURE: Think Efficiency | 29
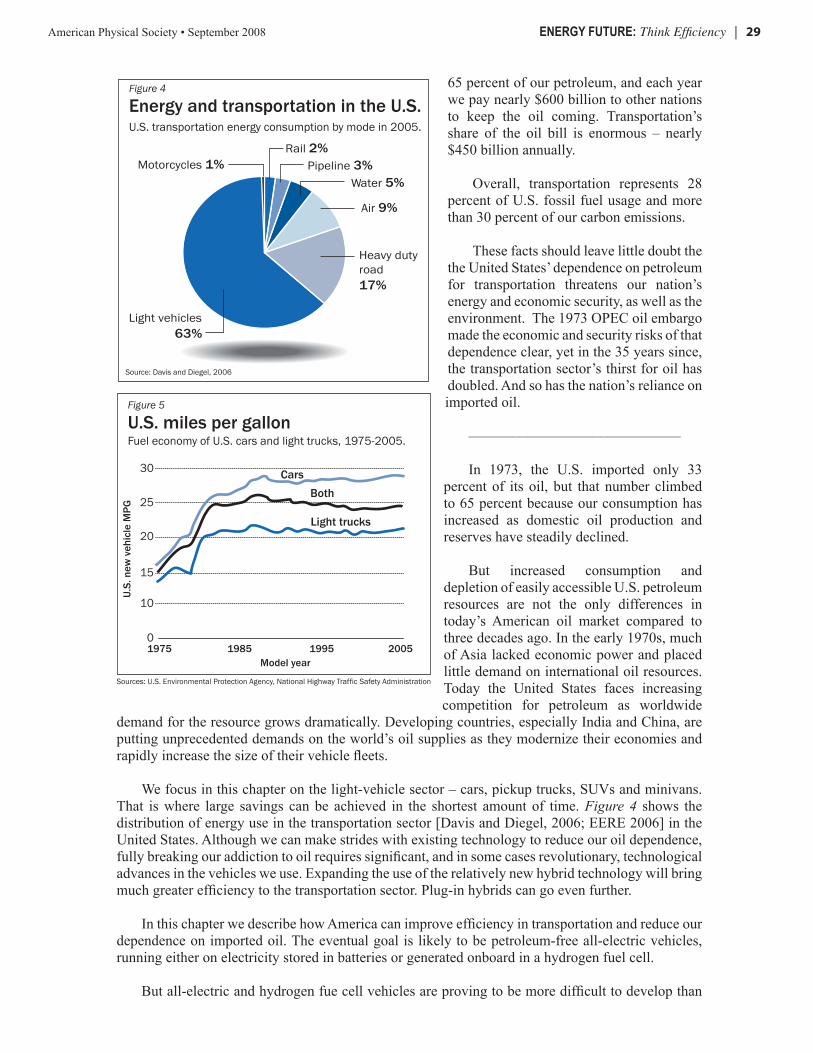
Source: Davis and Diegel, 2006
Figure 4
Energy and transportation in the U.S.
Motorcycles 1%
Light vehicles 63%
Heavy duty road 17%
Air 9%
Water 5%Pipeline 3%
Rail 2%
U.S. transportation energy consumption by mode in 2005.
65 percent of our petroleum, and each year we pay nearly $600 billion to other nations to keep the oil coming. Transportation’s share of the oil bill is enormous – nearly $450 billion annually.
Overall, transportation represents 28 percent of U.S. fossil fuel usage and more than 30 percent of our carbon emissions.
These facts should leave little doubt the the United States’ dependence on petroleum for transportation threatens our nation’s energy and economic security, as well as the environment. The 1973 OPEC oil embargo made the economic and security risks of that dependence clear, yet in the 35 years since, the transportation sector’s thirst for oil has doubled. And so has the nation’s reliance on imported oil.
–––––––––––––––––––––––––––––
In 1973, the U.S. imported only 33 percent of its oil, but that number climbed to 65 percent because our consumption has increased as domestic oil production and reserves have steadily declined.
But increased consumption and depletion of easily accessible U.S. petroleum resources are not the only differences in today’s American oil market compared to three decades ago. In the early 1970s, much of Asia lacked economic power and placed little demand on international oil resources. Today the United States faces increasing competition for petroleum as worldwide
demand for the resource grows dramatically. Developing countries, especially India and China, are putting unprecedented demands on the world’s oil supplies as they modernize their economies and rapidly increase the size of their vehicle fleets.
We focus in this chapter on the light-vehicle sector – cars, pickup trucks, SUVs and minivans. That is where large savings can be achieved in the shortest amount of time. Figure 4 shows the distribution of energy use in the transportation sector [Davis and Diegel, 2006; EERE 2006] in the United States. Although we can make strides with existing technology to reduce our oil dependence, fully breaking our addiction to oil requires significant, and in some cases revolutionary, technological advances in the vehicles we use. Expanding the use of the relatively new hybrid technology will bring much greater efficiency to the transportation sector. Plug-in hybrids can go even further.
In this chapter we describe how America can improve efficiency in transportation and reduce our dependence on imported oil. The eventual goal is likely to be petroleum-free all-electric vehicles, running either on electricity stored in batteries or generated onboard in a hydrogen fuel cell.
But all-electric and hydrogen fue cell vehicles are proving to be more difficult to develop than
Sources: U.S. Environmental Protection Agency, National Highway Traffic Safety Administration
Figure 5
U.S. miles per gallon Fuel economy of U.S. cars and light trucks, 1975-2005.
30
25
20
15
10
1975 1985 1995 20050
U.S.
new
veh
icle
MPG
Model year
CarsBoth
Light trucks

30 | ENERGY FUTURE: Think Efficiency American Physical Society • September 2008
first thought. Indeed, it may be years before all-electric vehicles can replace the standard family car, and even longer before practical hydrogen fuel-cell vehicles may be on the market (See Endnote 1).
This report does not look at energy efficiency issues for tractor-trailers and other large trucks. Instead, we defer to a comprehensive study of trucks recently completed by the National Academy of Sciences [NAS, 2008a], Review of the 21st Century Truck Partnership. The NAS report concludes that the Department of Energy funding for the program does not match its goals or needs and that the program needs restructuring.
To appreciate the opportunities for improving fuel economy in gasoline engines, it is instructive to look at the fuel-economy trends [NPC 2007] over the past 30 years for new cars by year of sale, shown in Figure 2. In 1975, the first year of the federal government’s Corporate Average Fuel Economy (CAFE) standards mandating increased fuel economy in the U.S. light-vehicle fleet, the average fuel economy was 14 miles per gallon. Twelve years later, in 1987, the fuel economy of new light vehicles had climbed to 28 miles per gallon for cars and 22 miles per gallon for pickup trucks, minivans, and SUVs. Since then there has been no improvement. In fact, today’s fuel-economy figure for new cars is no better than what the auto industry achieved in 1983, a quarter of a century ago.3
We define fuel economy as vehicle miles per gallon of fuel, or how far you can go on a gallon of fuel. Where different fuels with different energy contents are compared (e.g., gasoline, diesel, ethanol) the energy differences are noted. In general, economy is not equivalent to efficiency. Efficiency relates to the fraction of the energy content of fuel used to move the vehicle.
Both fuel efficiency and fuel economy began to improve with the implementation of the CAFE standards program in 1975, but what is
surprising is that when the standards stopped increasing in 1985, fuel efficiency continued to improve while fuel economy leveled off. Instead of using the technology-driven increases in the fuel efficiency of gasoline internal combustion engines to continue the increases in fuel economy, the auto industry used the increases to build bigger, more powerful cars, minivans, SUVs and pickup trucks. Light-duty vehicles now account for nearly half of all U.S. oil consumption and contribute about 20 percent of all CO2 emissions. (See Endnote 2.) The entire transportation sector produced nearly 2 billion metric tons of CO2 [EIA, 2007a] in 2005, more climate-changing CO2 than was produced by every other nation on Earth except China [EIA, 2007b].
Source: Lutsey and Sperling, 2005
Figure 6
U.S. fuel economy vs. fuel efficiency
Passenger cars Pickups, minivans and SUVs
15
20
25
30
35
40
1975 1980 1985 1990 1995 2000
Model year
Fuel
eco
nom
y (m
pg)
27
30
33
36
39
42
45
Vehi
cle
effic
ienc
y
Vehi
cle
effic
ienc
y
Efficiency
Fuel economy
10
15
20
25
30
1975 1980 1985 1990 1995 2000
Model year
Fuel
eco
nom
y (m
pg)
20
25
30
35
40
45
Efficiency
Fuel economy
Fuel economy and fuel efficiency for cars and light trucks in the United States for the period 1975 to 2004. (The unit of efficiency in this figure only is ton-miles per gallon. This is the fuel efficiency mentioned in the text multiplied by the weight of the vehicle.)
3.ThisreportusesEnvironmentalProtectionAgency(EPA)“unadjusted”fuel-economyvaluesforvehiclemileagefigures.ThesearethefiguresthattheNationalHighwayTrafficSafetyAdministrationusestoratecompliancewithCAFEstandardsasrequiredbylaw.TheunadjustedfiguresarebasedonEPAlaboratoryestimates.In2007,theEPAannounceditwouldbeginreporting“adjusted”fuel-economynumbersaswell,tobetterreflectreaL-worldexperience.Theadjustednumbersareabout25percentlowerthantheunadjustedfigures.

American Physical Society • September 2008 ENERGY FUTURE: Think Efficiency | 31
As serious as we consider the impact of light-duty transportation on greenhouse gas emissions to be, we cannot overemphasize how strongly we also believe that our dependence on petroleum, especially imported petroleum, undermines our energy security and puts our nation at economic risk. It is not just extreme events, like an oil embargo, that threaten the United States – the current skyrocketing price of oil is a threat to the stability of our economy. The United States imports between 13 and 14 million barrels of oil per day at a cost of about $120 per barrel (as of August 5); this is a cost of approximately $1.6 billion dollars per day, or approximately $600 billion per year. The doubling of the use of petroleum since the 1973 oil embargo makes it clear that for the transportation sector the lessons of that crisis were not learned. And the added threat of global warming makes our addiction to petroleum a more serious problem than it was in 1973.
Finding 1: The fuel economy of conventional gasoline-powered light-duty vehicles, which include cars,
SUVs, minivans and pickup trucks, can be increased to at least 35 miles per gallon by 2020 through improvements in internal combustion engines, transmissions, aerodynamics, and other technologies. This can be done with existing technology––meaning technology that is available today or in the pipeline—with minimal changes in the performance of current vehicles and without hybrid or diesel technology.
Discussion:Light-duty vehicles consume 63 percent of transportation energy in the United States and nearly
all are powered by internal-combustion engines that use gasoline, with a small percent using diesel, ethanol or other fuel. (See Endnote 3.)
Fuel economy remained constant from 1987 to 2007 while fuel efficiency increased by more than 20 percent, as shown [Lutsey and Sperling, 2005] in Figure 6. Automakers instead increased the weight and power of vehicles [EPA, 2007] as shown in Figure 4. Had the increase in fuel efficiency instead been used to increase fuel economy, light vehicles could have increased the miles-per-gallon rating by the same 20 percent.
The 1973 oil embargo showed how vulnerable the economy was to changes in the international oil market. The embargo stimulated the passage of the Federal Energy Policy and Conservation Act in 1975, which set the CAFE standards for new light-duty-vehicle sales. The CAFE standards led to substantial efficiency gains in the automobile and light truck fleet over the next decade. The increases in fuel economy in the first years of the standards came through both increases in fuel efficiency and significant decreases in the weight of new vehicles. By 1985 fuel economy had been boosted to 27.5 miles per gallon for cars and 20.7 for light trucks. (See Figure 6.)
Many of the initial gains were related to automakers decreasing the size, weight and power of cars as well as improvements in efficiency (Figure 7). The efficiency
Source: Environmental Protection Agency, 2007
4,500 15
14
13
12
11
10
9
4,000
3,500
3,000
Figure 7
Vehicle weight and acceleration, 1975-2007
Weight (pounds) 0 to 60 mph (seconds)
0 to 60 mph
Weight
1975 1980 20051985 1990 1995 2000
Model year
Vehicle weight initially decreased to help meet the new standards, but has increased ever since.

32 | ENERGY FUTURE: Think Efficiency American Physical Society • September 2008
improvements continue to this day due to many small improvements, including such things as switching from rear-wheel to front-wheel drive (which reduced drive train losses) improving engines and transmissions and making increasing use of computer-controlled engine combustion.
But, as Figure 5 shows, two years after the CAFE fuel-economy targets were met in 1985, the average combined fuel economy for new cars and light trucks
began to decrease, largely because of the increasing fraction in the mix of light trucks and SUVs. These larger vehicles only had to meet lower CAFE standards as they rolled out of auto plants. The result is that although the fuel economy of both cars and light trucks has increased over the long term, the increased ratio of trucks to cars has caused the combined average fuel economy of the fleet to actually decrease since the mid-1980s.
The effectiveness of the 1975 fuel-economy standards was evaluated by the National Academy of Sciences [NAS, 2002] in 2002 at the request of Congress. The NAS found not only that the standards were effective, but that with existing technologies fuel economy could be improved over a 10 to 15-year period at reasonable cost by 12 to 27 percent in cars and by 25 to 42 percent in light trucks and SUVs.
In 2007, with oil prices climbing dramatically, new CAFE standards were passed by Congress and signed into law by the president. The Energy Independence and Security Act of 2007, Public Law 110-140, sec. 102, sets the new fuel-economy standard at 35 miles per gallon by 2020 and calls for “maximum feasible” increases beyond that date but does not define them.
The new standards will contribute to reducing our petroleum consumption and set a modest lower bound that can be met through incremental i m p r o v e m e n t of existing t e c h n o l o g i e s . Executives of two major automobile manufacturers have 1999 2000 2001 2002 2003 2004 2005 2006 2007 2008*
400,000
380,000
360,000
340,000320,000
300,000
380,000
360,000
240,000
220,000
200,000
180,000160,000
140,000
120,000
100,000
80,000
60,000
40,000
20,000
0
Total
Prius
Camry
HighlanderEscapeCivic
Figure 9
Hybrid auto salesin the U.S.
*2008 forecastSource: www.hybridcars.com
Source: Kromer and Heywood, 2007; Kasseris and Heywood, 2007;
Figure 8
Possible technology advances may help
Fuel
eco
nom
y (m
pg)
Potential for advanced conventional technologies to increase fuel economy by 2030.
2005 Base 2030 Advance 2030 Diesel 2030 Turbo SI 2030 Hybrid
100
90
80
70
60
50
40
30
20
10
0
Toyota Camry 2.5 LToyota Camry 3.0Ford F-150 Pickup
American Physical Society • September 2008 ENERGY FUTURE: Think Efficiency | 33
4. More specifically, an efficiency improvement is cost-effective when its marginal benefit (the benefit of the last increment of efficiency improvement) equals or exceeds its marginal cost (the cost of that increment).
5. Cars with diesel engines in Europe have somewhat better fuel economy (adjusting for the different energy content of gasoline and diesel fuel) and about the same greenhouse gas emissions as gasoline-powered cars. [Schipper 2008]
assured us that a 2.5 percent improvement in fuel efficiency per year is possible on a continuing basis. Cylinder deactivation, turbocharging, and improvements in controlling engine valves – all possible with existing technology – can increase efficiency and thereby improve fuel economy. Additionally, aerodynamics can be improved, as can tire technology to reduce rolling resistance. Still greater gains can be achieved through the introduction of emerging technology.
Finding 2:The average fuel economy of new light-duty vehicles can be increased to at least 50 miles per
gallon by 2030 through a combination of more advanced technologies, including further improvements in internal combustion engines; decreasing vehicle weight while maintaining vehicle dimensions; and a fleet with a reasonable mix of vehicles powered by efficient internal combustion engines, diesel engines and improved hybrid technology.
Discussion: We describe energy-efficiency improvements as cost-effective when the value they return
exceeds their cost.4 The value produced by energy-efficiency improvements comes from cost savings over the life of a vehicle. Typically, energy-efficient equipment comes with a higher initial cost, and determining cost, effectiveness even in its simplest form, involves discounting future benefits. Because future energy prices are uncertain, cost effectiveness inherently involves uncertainty, especially when looking at future technologies whose cost and performance are not known.
Because energy use involves external costs, such as national energy security or its impact on global climate change, determining cost effectiveness often must include difficult-to-measure societal and environmental benefits. A rigorous consideration of these issues is beyond the scope of this report.
For proven technologies, where the value of future energy savings is likely to more than compensate for initial costs, we describe the technology as cost effective. For future technologies, we intend only that the technology appears to have the potential to be cost effective, given an appropriate level of research and development.
Improving fuel economy from the CAFE standard of 35 miles per gallon by 2020 to 50 miles per gallon by 2030 is achievable if technological improvements are focused on reducing fuel consumption. The potential for advanced technologies to increase automotive fuel economy by 2030 is shown in Figure 8, based on MIT analyses.
Diesel engines currently have a fuel economy as much as 30 percent greater than gasoline engines (diesel fuel contains 11 percent more energy than gasoline per volume). In Europe, 50 percent of new cars sold have diesel engines5, primarily because of historically lower diesel-fuel prices, government tax incentives and weaker emission controls on diesel engines than on gasoline engines. Greater market penetration of diesel-powered vehicles in the United States would help reach the 2030 goal (Figure 8). However, the current cost premium of diesel fuel compared to gasoline may be a barrier, as may be concerns with U.S. particulate emission standards.
Most automobile manufacturers are doing research on a form of combustion – homogeneous charge compression ignition (HCCI) – that could combine the best of diesel and gasoline engines. An HCCI engine would have the high efficiency of a diesel engine and the relatively low emissions of a gasoline engine. Other technologies that could come into play in reaching the 2030 goal include engines with variable compression ratios, engines that switch between two and four-stroke operation and engines without camshafts.

34 | ENERGY FUTURE: Think Efficiency American Physical Society • September 2008
Weight reduction, discussed in greater detail below, is another critical part of increasing fuel economy to 50 miles per gallon. Each 10 percent reduction in vehicle weight translates to a 6 or 7 percent increase in fuel economy. The development of strong, lightweight materials, when they become available at an affordable price, could have a dramatic effect on fuel economy while improving overall vehicle safety.
Conventional hybrid vehicles, such as the Toyota Prius, are currently the most efficient widely available vehicles in the United States, with average fuel-economy ratings between 45 and 48 miles per gallon, depending on the hybrid system and the size of the vehicle. Hybrids make up more than 3 percent of the U.S. market, and sales are rapidly increasing (Figure 9) because of rising gasoline prices. According to JDPower, [www.jdpower.com] hybrid sales in the U.S. increased from 250,000 in 2006 to 350,000 in 2007.
The energy efficiency of conventional hybrids can be considerably increased through a number of near-term and long-term improvements, some of which are already in use. Engines could be run at lower revolutions per minute (rpm), and they could be turbocharged. Mechanical pumps and other systems could be replaced with electrical pumps. There are a host of other improvements based on existing technology that could make the relatively efficient hybrid vehicles even more efficient.
But if the steady growth in vehicle miles traveled (VMT) in the United States were to continue even with this doubling of today’s fuel economy, there could be very little reduction in overall petroleum use or in greenhouse gas emissions. Recently, however, VMT has decreased (Figure 10). A recent Federal Highway Administration report notes that cumulative travel for the first six months of 2008 dropped by 4.7 percent compared to June 2007, and the cumulative travel for 2008 as of June dropped by 2.8 percent.
Americans are reducing the number of miles they drive because of today’s high fuel prices. It is unclear what long-term impact higher prices will have on driving habits; an ongoing decrease in VMT would be consistent with the significant impact on driving behavior in the face of increasing gasoline
prices.6 Even larger reductions in VMT might be achieved by limiting urban sprawl through changes in the way land use is regulated and financed. Because urban sprawl encourages more driving, developing better models and criteria for transportation infrastructure and factoring vehicle use into urban planning could reduce VMT. (See finding 7 below.)
Finding 3:
The weight of vehicles can be significantly reduced through design and new materials without compromising safety. Vehicle weight reductions of 20 percent, for example, achieved by greater use of high-strength steel, aluminum and composite materials, would improve fuel economy by approximately 14 percent while reducing traffic injuries and fatalities. Greater reductions in weight, such as the 50 percent goal of the FreedomCAR program, if achieved by means of advanced lightweight materials, would lead to even greater improvements in fuel economy.7
6. There are many more aspects to consumer habits and VMT, for example, telecommuting and the impact of the Internet. These issues are not in the scope of this report.
7. The use of strong, light-weight materials in light-duty vehicles is important for improving fuel economy and will likely occur as the cost of materials comes down.
Source: Federal Highway Administration
3.0
2.9
2.8
2.7
2.6
2.5
Figure 10
Fewer miles
In trillions of miles
1998 2000 2002 2004 2006 2008
The New York Times (used with permission)
Vehicle miles traveled as reported by the Federal Highway Administration. Note the decrease in 2008.
Miles driven12-month total, monthly

American Physical Society • September 2008 ENERGY FUTURE: Think Efficiency | 35
Discussion: Reducing the weight of vehicles by using lighter, stronger materials even while maintaining
vehicle size, will significantly improve fuel economy. The new CAFE standards are likely to encourage automobile manufacturers to turn to lighter materials to squeeze more miles per gallon out of the same engines. A 10 percent reduction in weight, for example, yields a 6 or 7 percent increase in fuel economy.
A 2002 National Academy of Science study [NAS, 2002] linked the reduction in the weight of a vehicle to a possible increase in fatalities. That view was not unanimous among the NAS panelists, and many experts believe that with advanced materials, vehicles can be made both lighter and safer. This is one of the goals of the FreedomCAR program [EERE, 2005].
While it is obvious that in a head-on collision between a very large truck and a car, the passengers in the car will be the losers, that is not necessarily true when the weight differences are not so dramatic. A 2007 International Council on Clean Transportation study (ICCT, an independent organization of transportation experts) [Wenzel et al 2006] looked at the relationship of fuel economy and safety in light vehicles and noted that “the linkages among fuel economy, vehicle size, weight, and safety are manageable and are more a function of smart vehicle design than any other single factor.” The report concluded that no trade-off is required between a vehicle’s weight and safety. Indeed, other researchers have found that reducing vehicle weight while maintaining the key dimensions of wheelbase and track width could decrease the total number of fatalities [Van Auken and Zellner, 2004].
However, there is a crucial difference between making the cars lighter and making them smaller. Smaller cars may indeed be less safe for their occupants than their larger counterparts because of reduced space for “crush zones” in the front and rear; this can be mitigated by proper design. Advanced air-bag technology and smart design mean small cars are safer than they once were, but adequate crush zones are critical for passenger safety. The Insurance Institute for Highway Safety [Institute for Highway Safety 2008], after running crash tests, recently gave its highest safety rating to the diminutive Smart Car, a micro car that weighs only 1800 pounds and is a full three feet shorter and 700 pounds lighter than a Mini Cooper. So it is crush zones and other safety technologies, such as side curtain air bags, electronic stability control, lower bumpers and stronger roofs, that ultimately make vehicles safer.
Additional information can be found in Evans 2004, which emphasizes the role of drivers in
accidents, and Ahmad and Greene 2005.
Recommendation 1: Technology is available to move beyond the 35 mpg CAFE standard mandated in law to be
reached by the year 2020. The federal government should establish policies to ensure that new light-duty vehicles average 50 miles per gallon if not more by 2030. The specific policies are beyond the scope of this study but could include more aggressive and longer-horizon CAFE standards, financial incentives such as “feebates” (fees for not meeting the standard and rebates for surpassing it) and carbon taxes.
Finding 4:Plug-in hybrid electric vehicles (PHEV), which charge their batteries from the electric grid,
could reduce gasoline consumption by 60 percent or more, assuming a range on batteries alone of at least 40 miles. However, plug-in hybrids require more efficient and more durable batteries, able to withstand deep discharges that are not yet in commercial large-scale production. Given the technical difficulties faced in developing the batteries, it cannot be assumed that plug-in hybrids to replace the standard American family car will be available at affordable prices in the near term.

36 | ENERGY FUTURE: Think Efficiency American Physical Society • September 2008
Discussion: Plug-in hybrid electric
vehicles are different from the conventional hybrids in that they can travel extended distances on their batteries alone, as well as in the conventional hybrid combined mode. They charge their batteries from the electric power grid when the vehicles are not in use. Current hybrids like the Prius, because of the small battery size, are not designed to run on their battery alone except in very low-power conditions. Current hybrids’ battery packs cannot be charged from the electric grid because the integrated design of existing systems only allows the battery to be charged within a narrow range.
Ordinary hybrid electric vehicles like Toyota’s Prius get all their energy from gasoline, achieving high fuel economy
through a combination of methods. They recover some of the energy that non-hybrid vehicles waste as heat when braking; they use smaller internal-combustion engines that typically operate in their most efficient range; and they shut off the engine when the car is idling.
Plug-in hybrids get some of their energy from gasoline and some from the electric grid. PHEVs have the efficiency advantage of a conventional hybrid and the additional advantage of drawing some of their energy from the grid, not from gasoline. All-electric battery-powered vehicles, which are discussed later, get all of their energy from the grid.
Figure 11 shows the distribution of daily vehicle miles traveled, using data from the 2001 National Household Travel Survey by the U.S. Department of Transportation [Santini and Vyas 2008; Vyas and Santini, 2008]. The chart shows, for example, that 30 percent of all miles traveled are in vehicles that go less than 40 miles per day. If vehicles could run for 40 miles per charge on batteries alone, charged from the electric power grid, as much as 30 percent of vehicle miles in any one day would not require use of gasoline.
Figure 12 shows the percentage of all vehicle miles traveled on electricity as a function of PHEV electric only range. If all vehicles had a 40-mile PHEV electric range, the amount of fuel used in the entire fleet would decrease by 63 percent relative to what was required without the PHEV40 technology. If all trips of less than 40 miles were on batteries alone, and the first 40 miles of longer daily travel were on batteries, the effective fuel economy for a full fleet of PHEV40 vehicles, taking into account only gasoline put into the tank (not primary energy) would be 135 miles per gallon, assuming a 50 mpg fuel economy when operating with the gasoline engine [Vyas and Santini, 2008; Santini and Vyas, 2008; Dr. E.D. Tate, General Motors, private communication].8
8. “Effective miles per gallon” means the ratio of miles driven to gasoline put in the tank, averaged over a fleet of cars. It does not take into account the primary energy used to produce the electricity. A car with electric drive is more efficient “well-to-wheels” in terms of primary energy use than a car with an internal combustion engine. (See Endnote 3.)
Sources: Santini and Vyas 2008; Vyas and Santini 2008
100%
90%
80%
70%
60%
50%
40%
30%
20%
10%
0%
Daily travel (miles per vehicle)
% of sampled vehicle VMT
0 20 40 60 80 100 120 140 160 180 200 220 240 260 280 300
Figure 11
On the roadPercent of sampled vehicle miles traveled (VMT) as a function of daily travel.
Distribution of VMT by vehicles in the 2001 NHTS travel day file

American Physical Society • September 2008 ENERGY FUTURE: Think Efficiency | 37
Sources: Santini and Vyas 2008
100%
90%
80%
70%
60%
50%
40%
30%
20%
10%
0%
PHEV electric range (miles)
% of VMT on electricity
0 20 40 60 80 100 120 140 160 180 200 220 240 260 280 300
Figure 12
Electric-powered drivingFraction of vehicle miles traveled (VMT) driven on electricity as a function of the plug-in hybrid electric vehicle (PHEV) electric range.
VMT satisfied by PHEVall electric range
9. There are issues regarding PHEVs that tend to make the curve in Figure 12 the maximum that can be expected. These include limited market penetration, variability of choice of PHEV range by consumers, battery performance, and the driving profile of vehicles
This would amount to a 63 percent saving of gasoline per day.9 This estimate is an upper bound, as it assumes that batteries are fully charged each morning and have not deteriorated since purchase. Nonetheless, the impact on both fuel imports and on greenhouse gas emission would be dramatic, with the reduction of greenhouse gas emission depending on how green is the electric power system used to charge the PHEV batteries (the balance among coal, natural gas, nuclear, renewables and so on).
The key requirement for a PHEV is a battery with large electrical storage capacity and high energy density – the measure of how much energy a battery of a given weight and size can hold. Gasoline stores a remarkable amount of energy for its weight and volume: the energy density of gasoline is 50 times that of a lithium-ion battery when measuring volume, and 100 times that of a lithium-ion battery when measuring weight.
A conventional hybrid utilizes a relatively small battery, now typically a nickel-metal-hydride battery (NiMH), to keep costs low. Additionally, the battery is used primarily to store energy recovered from braking. A Prius, for example, has a battery with a capacity of approximately 1.3 kWh; about 15 percent of that capacity is allowed to be used, a necessary tradeoff to give the battery a long life.
A PHEV must have a considerably larger battery in order to store significant electrical energy from the grid. A PHEV running on electricity for 40 miles will consume approximately 14 kWh (industry standard of 350 Wh/mile). The battery pack should be approximately 28 kWh (twice as large) to allow for the less-than-complete discharging required for a long battery life. A PHEV battery must also have a reasonable weight, size, cost and recharging time, and, to be commercially viable, must last many years. (See Endnote 4.) The cost of a battery with 28-kWh capacity is roughly $20,000 at the present time, meaning that costs will have to come down considerably before a PHEV40 is feasible for the consumer market.
General Motors says it will produce the Chevrolet Volt, a commercial PHEV, by 2010. The Volt, according to GM, will use a new type of lithium-ion battery, have an electric range of about 40 miles in urban driving, and utilize about 50 percent of the capacity of its battery. Toyota has also announced a new PHEV to appear in 2010; it is expected to have a pair of lithium-ion batteries and an electric range of about 7 miles.
If PHEVs come into widespread use, there are implications for the electrical grid. Charging times for PHEVs are typically several hours, and if a large number of the vehicles are recharged during the day, when electricity demand is already high, the strain on the grid could be significant. If

38 | ENERGY FUTURE: Think Efficiency American Physical Society • September 2008
the vehicles are charged at night then the impact on the grid should be minimal. This topic has been discussed recently in California with the conclusion that, as long as daytime, on-peak charging is avoided, a million vehicles could be charged before a new generation of transmission investments are required [Lemoine, Kammen and Farrel 2008]. Differential pricing of electricity – cutting the cost for electricity used “off peak” – could reduce the daytime demand.
Given the current price of electricity, driving a vehicle powered by electricity would be much cheaper per mile than driving on the power from gasoline. Off-peak electricity costs in California are 9 cents per kWh corresponding to a cost of about 3 cents per mile for the electric mode in the PHEV. With gas at $4.50 per gallon, even a 50-mpg vehicle will cost 8 to 9 cents per mile for fuel. The cost per mile is one-third as much for an electric car as for today’s hybrid car.10
However, major technical and infrastructure issues must be faced before PHEVs can become a large part of the light vehicle fleet, including:
The batteries being developed for the PHEVs to be introduced in 2010 are not yet in •production, so the actual capability and cost are not known. Present battery costs are too high for a commercial market.
Access to electrical charging stations is obviously required, and many dwellings, such as •apartment buildings and condominiums, do not have them.
Daytime charging will have to be avoided if PHEVs are adopted on a large scale. Note that a •car with a 40-mile electric range will only run on electricity for a 20-mile commute one-way. Otherwise daytime charging at the workplace will be required or the return trip will be done on gasoline power.
Finding 5: An all-electric battery-powered vehicle would reduce to zero the use of petroleum as a fuel for
light-duty vehicles. However, achieving the same range as a gasoline-powered car–– 300 miles–– requires batteries with much larger capacity than is needed for PHEVs. For the standard mid-priced American family vehicle, batteries with the needed energy storage per unit weight and per unit volume do not exist. A long term R&D program will be required to develop them.
Discussion: The target range in the Department of Energy’s program for an all-electric vehicle is 300 miles,
a much more difficult challenge than that for the PHEV. If the battery technology used to make a vehicle with an electric range of 300 miles is the same technology used to make a vehicle with a 40-mile electric range, the 300-mile vehicle would require a battery of 7.5 times the weight, volume and cost of the 40-mile vehicle. (See Endnote 4.)
The all-electric vehicle is appealing because it would reduce use of gasoline to zero and reduce consumption of primary energy by roughly 50 percent since electric drive is much more efficient than internal combustion. This reduction includes the electric drive efficiency advantage combined with the average efficiency of 31 percent for electricity delivered from primary energy to the wall plug. The greenhouse gas emission reduction depends on the greening of the electric power generation system. Meeting the all-electric range goal is going to be more difficult than the range goals of PHEVs.
There have been all-electric vehicles before, and there are new ones now. The GM EV-1 and the Toyota RAV-4 were examples using NiMH battery technology. They had relatively short range, but
10. A comparison of the cost of running a car on gasoline or electricity should include a correction for taxes. The present federal tax on gasoline is $0.184/gallon; state taxes vary, but are of this magnitude. However, there are also local taxes on electricity; in many areas of the country the tax on electricity is of a similar magnitude to the combined state and federal gasoline tax.

American Physical Society • September 2008 ENERGY FUTURE: Think Efficiency | 39
11. A new National Academy of Sciences report on fuel-cell vehicles was published as this report was being completed. It primarily ad-dresses long-term infrastructure needs for a hydrogen economy assuming the basic problems have been solved. The conclusions of the report are similar to those of previous NAS studies [Transitions to Alternative Transportation Technologies: a Focus on Hydrogen. National Academies Press 2008. ISBN: 978-0-309-12100-2].
were very popular with their few users. The hardware and software developed for those cars are the starting point for the new generation. Tesla Motors’ new two-seater has a range of over 200 miles, very fast acceleration typical of electric propulsion and a price tag of about $100,000. Nissan Motors plans to introduce a small electric car with a 100-mile range, a top speed of 75 miles per hour and an 8-hour recharge time. These are a start on an evolutionary road that together with the Toyota and GM PHEV will move the fuel for light-duty vehicles from petroleum to electricity generated at central power plants.
Even though PHEVs or all-electric battery-powered vehicles will use little or no gasoline, they are not zero energy vehicles. The electricity they use is made from a primary energy source, e.g. fossil, nuclear or renewable fuels. However, the high wheel-to-tank efficiency of an electric vehicle, the existence of the grid, and the potential for freedom from fossil fuels, all favor using electricity to power cars, assuming development of suitable batteries at an acceptable price. In the future, as policies are implemented to reduce greenhouse gas emissions, grid electricity will become a cleaner and cleaner energy source [EIA 2008].
Finding 6:Hydrogen fuel cell vehicles (FCVs) are unlikely to be more than a niche product without scientific
and engineering breakthroughs in several areas. The main challenges are durability and costs of fuel cells, including their catalysts, cost-effective onboard storage of hydrogen, hydrogen production and deployment of a hydrogen-refueling infrastructure.
Discussion: Hydrogen fuels and fuel cell vehicle technology were heavily promoted by government and
industry beginning in the late 1990s. The early promises were not met. The challenge of developing a new technology (fuel cells) and deploying a new fuel supply system proved daunting. A collection of reports by the American Physical Society [Davis et al. 2003], the Basic Energy Sciences division of the DOE Office of Science [http://www.sc.doe.gov/bes/hydrogen.pdf] and the National Academy of Sciences [NAS 2005] highlighted the challenges. By 2006 it had been recognized that the original plans presented by the automotive companies and a wide range of leaders in the European Union and the United States were not achievable in the near term. A more reasoned view has now emerged, highlighting the breakthroughs that are needed and the longer time to deployment.
Hydrogen vehicles are no longer seen as a short-term or even intermediate-term solution to our oil needs, but as a long-term option requiring fundamental breakthroughs in several areas. The recent NAS report on the FreedomCar and Fuel Partnership program [NAS 2008] says that even now, “There remain many barriers to achieving the objectives of the Partnership. These barriers include cost and performance at the vehicle, system, and component levels. To be overcome, some of these barriers will require invention, and others will require new understanding of the underlying science.” A new NAS report looks at deployment scenarios after the fundamental issues are solved.11
There are four principal barriers to large-scale use of fuel-cell vehicles – the fuel cells themselves, onboard hydrogen storage, hydrogen production, and a distribution infrastructure. The fuel cells must be efficient in turning hydrogen into electricity, long lived, and affordable. (See Endnote 5.) While considerable progress has been made in the past few years, the necessary cost-effective performance has not yet been achieved. The membranes that are at the heart of fuel cells do not have the durability, permeability, or conductivity to work efficiently in a mass-market vehicle. In addition, a relatively large amount (roughly 60 grams) of the platinum catalyst is presently required to make the chemical reaction run at the necessary rate. This much platinum is too expensive and the material too rare for a mass-market vehicle. Progress in both the membrane and catalyst area is being made. For example, it

40 | ENERGY FUTURE: Think Efficiency American Physical Society • September 2008
has recently been shown that control of the atomic structure of the catalyst can, in principle, improve its performance by a factor of 10 or more.
Onboard hydrogen storage remains a significant barrier to development and commercialization of a hydrogen vehicle. Hydrogen has high energy content per molecule, but is a gas at room temperature. Compressed hydrogen systems, the kind typically used on hydrogen demonstration cars, use ultrahigh-pressure containers that are heavy, large and typically contain only one-seventh the energy per unit volume of gasoline. Liquid hydrogen has to be stored at lower than -400 ºF in special highly insulated containers and 30-40 percent of its energy is lost in the liquefaction-evaporation cycle. An alternative to compressed gas or liquid is highly desirable.
A practical, commercial hydrogen vehicle will most likely have some form of solid-state storage, near atmospheric pressure. In solid-state storage, hydrogen molecules are absorbed onto or chemically bound up in the storage medium. Storage has seen promising new approaches – computer prediction of structure and performance of storage media, and the release of hydrogen from high density storage media by reaction to structurally different compounds, a process called “destabilization.” The latest NAS FreedomCar review notes that finding a solid-state storage material is critical to fulfillment of the vision for the hydrogen economy, and urges that basic and applied research be conducted to establish the necessary technical base. The scientific community has responded to the hydrogen challenge with vigor – the publication rate and activity at meetings on catalysts and membranes for fuel cell reactions and on hydrogen storage media have increased significantly.
Hydrogen production is as important as storage and fuel cells. The United States now produces 90 percent of its hydrogen by reforming natural gas, a process that combines gas and water at high temperature to produce hydrogen and carbon dioxide. If this were to be the source of hydrogen, widespread use of hydrogen cars would simply shift our dependence on oil to a dependence on imported natural gas with only modest greenhouse gas reduction.
Producing the required hydrogen from coal would be acceptable if carbon capture and storage technology that would eliminate the CO2 produced in the process were to be commercially successful. More attractive are innovative methods to produce hydrogen with carbon-free sources of energy. These include high-temperature electrolysis in which heat and electricity are both available from solar or nuclear energy, and photo-biological processes that produce hydrogen directly from sunlight. None of these more advanced processes are yet ready for commercialization, but progress is being made.
The last of the four barriers is the hydrogen distribution system. If done by pipeline like natural gas, a new system will be required. It would be far too expensive to transport hydrogen by truck or rail either as a gas or a liquid because of its low energy density. Perhaps one of the solid-state storage solutions will allow the transportation of large amounts of the material.
While large-scale commercialization will not occur any time soon, automakers are planning to produce demonstration fleets. The Honda FCV Clarity will be available in limited numbers (200) over the next 3 years for lease to customers near hydrogen stations in the Los Angeles area. This vehicle uses a fuel cell in a hybrid-electric vehicle, with hydrogen stored as a pressurized gas at 5,000 pounds per square inch, giving it a range of 270 miles. Each vehicle costs several hundred thousand dollars to produce and will receive special servicing from Honda. This demonstration vehicle is a fully functional substitute for gasoline cars, but the cost remains far too high and the life of the fuel cell too short for widespread use in the vehicle fleet now. Honda intends to have 1000 FCVs on the road by 2013; the target for the start of high-volume production is 2015.
GM announced it will release a hydrogen fuel-cell vehicle by the end of 2008 and plans to have a

American Physical Society • September 2008 ENERGY FUTURE: Think Efficiency | 41
fleet of 100 Chevrolet Equinox fuel cell SUVs on the road by the end of the year. Toyota and Daimler have similar plans to release hydrogen fuel-cell vehicles in demonstration programs.12
Recommendation 2: The federal government’s current R&D program should have a broader focus. A more balanced
portfolio is needed across the full range of potential medium- and long-range advances in automotive technologies. Increased research is needed in batteries for conventional hybrids, plug-in hybrids and battery electric vehicles, and in various types of fuel cells. This more balanced portfolio is likely to bring significant benefits sooner than the current program through the development of a more diverse range of efficient modes of transportation, and will aid federal agencies in setting successive standards for reduced emissions per mile for vehicles.
Recommendation 3: “Time of use” electric power metering is needed to make charging of batteries at night the preferred
mode. Improvements in the electric grid must be made if daytime charging of electric vehicles is to occur on a large scale or when the market penetration of electric vehicles becomes significant.
Finding 7:There are clearly societal issues that effect fuel use in the transportation sector. Reforms in public
policy for land use and urban and transportation infrastructure planning can potentially contribute to energy efficiency by reducing vehicle miles traveled, as can expansions of public transit and various pricing policies. Some could be introduced in the near term, while others, such as changes in land use, would phase in over decades, but might still have significant effects in 10-15 years.
Discussion: It is clear from more than 20 years of research that changes in current policies for urban land use,
transportation infrastructure investment, parking and auto insurance can reduce vehicle miles traveled (VMT) and save energy. These are mainly social science issues. Current policies have resulted in growth rates for urban land that exceed the growth rates of population. There has been a similar disproportionate increase in vehicle miles traveled (VMT) since 1973 that cannot be explained by increasing incomes, the cost of driving or the building of more roads – highway congestion has increased since 1973 [Eaken and Goldstein, 2007; Boarnet and Crane, 2001; Ewing et al., 2007; Handy et al., 2006; Johnston, 2008; Handy, et al., 2005].
Residential density, the availability of public transportation, proximity to jobs, pedestrian friendliness and the mixed-use nature of a community all influence the number of miles people drive. The general conclusions of research on the role of urban planning on vehicle use indicate that to high densities, proximity to reliable public transit, and inclusion of sidewalks and bike lanes correlate with lower household VMT.
An effort to maximize energy efficiency in the transportation sector would require a combination of short-term pricing policies and medium- and longer-term land use and infrastructure investment policies.
A significant obstacle to informing policymakers and the public about these policy options is the lack of an agreed-upon method for quantifying these issues. Different studies frame the questions in different ways, and different sources provide different predictions that are qualitatively in agreement but yield slightly different—or mutually incomparable—predictions.
12. BMW has recently introduced a car, the Hydrogen 7, which stores hydrogen as a liquid and uses hydrogen as a fuel in an internal com-bustion engine. Gasoline is also carried onboard. As noted, the energy cost of producing liquid hydrogen is high. U. Bossel, B. Eliasson and G. Taylor, The Future of the Hydrogen Economy: Bright or Bleak? Final Report. April 2003. [www.hyweb.de/News/Bossel-Eliasson_2003_Hydrogen-Economy.pdf]

42 | ENERGY FUTURE: Think Efficiency American Physical Society • September 2008
Recommendation 4: Federally funded social-science research is needed to determine how land-use and transportation
infrastructure can reduce vehicle miles traveled. Studies of consumer behavior as it relates to transportation should be conducted, as should policy and market-force studies on how to reduce VMT. Estimation of the long-term effects of transportation infrastructure on transportation demand should become a required component of the transportation planning process. This program needs a home.

American Physical Society • September 2008 ENERGY FUTURE: Think Efficiency | 43
1. Energy and energy densityThe density at which energy can be stored is
critical for transportation applications. The weight and volume of fuel to provide a given amount of energy to power a vehicle are shown in Table 1.
2. Reducing greenhouse gas emissionsGreenhouse gas emissions from different
transportation sectors [Greene and Schafer, 2003] are shown in Figure 13. Passenger cars and light trucks are responsible for 55 percent of greenhouse-gas emission in transportation, and heavy trucks are responsible for another 16 percent.
Improvement in fuel economy for constant vehicle miles traveled will directly translate into a reduction of greenhouse gas emissions without introduction of new technology. A transition to plug-in hybrid vehicles and battery-powered all-electric vehicles in the passenger-car and light-truck fleet has significant implications for production of greenhouse gases. As these vehicles will rely on electricity from the grid, the extent to which the grid is green—generating electricity from nuclear or other “clean” energy sources—will determine the carbon footprint of the vehicles. It may be possible that carbon emission could become negligible. The same consideration applies to widespread use of hydrogen fuel cells: there will be a benefit if the hydrogen can be produced without adding equivalent amounts of carbon to the atmosphere. One recent report estimates that in the absence of carbon-constraining policies, the transition to a hydrogen economy would achieve about the same reduction in emission of carbon dioxide as a transition to advanced gasoline-electric hybrid vehicles. Drastic reduction of well-to-wheel CO2 emission is possible with a significant carbon policy [Greene et al., 2007].
Figure 14, from a recent MIT study [Kromer and Heywood, 2007], shows well-to-wheel greenhouse-gas emissions for a variety of advanced vehicles; advanced hybrid-electric vehicles, plug-in hybrid vehicles, fuel-cell vehicles and battery-electric vehicles all have the potential to reduce CO2 emissions from motor vehicles by two-thirds. However, Greene [2008] notes that these calculations assume that electricity and hydrogen will be produced in the
Table 1
Energy density per volumeGasoline 34.6 MJ/l = 9.7 kWh/l
Diesel fuel 38.6 MJ/l = 10.7 kWh/l
Ethanol 24 MJ/l = 6.4 kWh/l
Hydrogen at 1 atmosphere pressure 0.009 MJ/l = 0.0025 kWh/l
Hydrogen at 10,000 psi 4.7 MJ/l = 1.3 kWh/l
Liquid hydrogen 10.1 MJ/l = 2.6 kWh/l
NiMH battery 0.3-1.0 MJ/l = 0.1-0.3 kWh/l
Lithium-ion battery (present time) 0.7 MJ/l = 0.2-kWh/l
Energy density per weight13
(1 MJ = 0.278 kWh)
Gasoline 47.5 MJ/kg = 13.2 kWh/kg
Diesel fuel 45.8 MJ/kg = 12.7 kWh/kg
Ethanol 30 MJ/kg = 7.9 kWh/kg
Hydrogen at 10,000 psi 143 MJ/kG = 39 kWh/kg
Liquid hydrogen 143 MJ/kG = 39 kWh/kg
NiMH battery 0.34 MJ/kg = 0.1 kWh/kg
Lithium-ion battery (present time) 0.5 MJ/kg = 0.14 kWh/kg
Lithium-ion battery (future) 1 MJ/kg = 0.28 kWh/kg
13. Energy density by weight shown is the co-called higher heating value. The so-called lower heating value takes into account the energy required for a phase change. The difference depends on the chemical composition of the fuel, and is about 10 percent for gasoline and 7% for diesel fuel.
C h a p t e r 2 E n d n o t e s
Source: U.S. Environmental Protection Agency
Figure 13
Emissions of greenhouse gases in transportation by sector
Passengercars 36%
Heavy trucks 16%
Aircraft10%
Marine5%
Rail2%
Buses1%
Other11%
Light trucks19%
Figures are from year 2000.

44 | ENERGY FUTURE: Think Efficiency American Physical Society • September 2008
future by the same methods that are presently employed. Use of nuclear or renewable sources and/or carbon sequestration could reduce future emission of CO2 to very low levels.
3. Transportation efficiencyAn internal-combustion engine (ICE) is used to power most cars on the road today. Chemical
energy stored in gasoline is converted to mechanical motion by combustion in the engine, which turns a drive shaft that then turns the wheels. This process is not very efficient: Figure 15 [U.S. EPA] illustrates the flow of energy from gasoline (100%) to mechanical energy out (18.2%) to 12.6 percent finally powering the wheels.
The 12.6 percent efficiency of converting gasoline energy into mechanical energy is called the “tank-to-wheel” efficiency. The “well-to-tank” efficiency of gasoline is approximately 90 percent, with the additional 10 percent being the energy cost of producing and distributing gasoline. The “well-to-wheel” efficiency in the case of an ICE is therefore approximately 16 percent to the drive train, and only 11 percent to the wheels.
0
50
100
150
200
250
300
2006Base
2030NA SI
2030Turbo SI
2030Diesel
2030HEV
2030PHEV10
2030PHEV30
gCO
2 /
km
2030PHEV60
2030H2 FCV
2030BEV
Source: Kromer and Heywood, 2007: Assumes H2 from natural gas and electricity in EIA 2030 mix
NormallyAspirated
Figure 14
Projected well-to-wheels greenhouse gas emissions of advanced vehicle technologies
Tank-to-wheels
Well-to-tank
Spark Ignition Plug-InHybrid Electric
Vehicle
Plug-InHybrid Electric
Vehicle
Plug-InHybrid Electric
Vehicle
Fuel CellVehicle
BatteryElectric Vehicle
Hybrid ElectricVehicle
Figure 15
Where does the energy go?
How energy flows for a vehicle powered by an internal-combustion engine. The diagram shows the energy uses and losses from a typical vehicle.
Source: www.fueleconomy.gov
Aerodynamic drag
Engine losses
Rolling resistance
Inertia
Braking5.8%
Standby / idling
Drive line losses
Accessories 4.2%
2.6%
100% 18.2% 12.6%
62.4%
5.6%
2.2%
17.2%
American Physical Society • September 2008 ENERGY FUTURE: Think Efficiency | 45
An electric motor-inverter is about 90 percent efficient in converting electric energy into mechanical motion, and charging a battery is about 90 percent efficient. The tank-to-wheel efficiency is therefore about 81 percent. For a well-to-tank efficiency of production and distribution of 30 percent for electricity, the well-to-wheel efficiency is about 24 percent.14
Additional energy savings of up to 30 percent is possible by capturing energy from braking and by shutting off the engine when the car is idling. The result is a saving in primary energy for an electric car of more than a factor of two compared with a car powered by gasoline and an internal combustion engine.
4. Batteries for plug-in hybrid and all-electric vehiclesBatteries for plug-in hybrid and battery-electric vehicles must have high charge storage capacity;
be of a reasonable size, weight and cost; be able to be deeply discharged; have a long service life; and operate with a high degree of safety. Existing batteries do not meet those requirements.
According to a leading expert in the auto battery community [Anderman, private communication, 2007], the estimated cost of a battery that could meet the requirements is $625/kWh, assuming a modest production level, which puts the cost of the battery for a 55-kWh all-electric vehicle at about $35,000. A 28-kWh battery, needed to give a plug-in hybrid vehicle a range of 40 miles and allowing for discharge cycles and lifetime, would cost nearly $18,000. For a production level of a million units per year, the cost is expected to decrease by a factor of two, which will still make it expensive for the consumer market.
Although some companies are getting into the market, no widespread industrial capability currently exists for volume production of lithium-ion batteries for automotive applications; that is expected to soon change. At present a battery for consumer electronics applications has a lifetime of only 2–3 years, while batteries for automotive applications will have to have considerably longer lifetimes.
The energy density of present batteries is about one-hundredth that of gasoline, which means it is a major challenge to store enough energy in a battery that is small, light and powerful enough to give an electric vehicle acceptable range. To make a plug-in hybrid or an all-electric battery-powered vehicle practical, it will be necessary to significantly increase the battery’s energy density, reduce the vehicle’s energy consumption per mile and design a vehicle that can accommodate a large battery and presumably a little cargo.
Lithium-ion batteries are being developed for use in hybrid vehicles and in plug-in hybrid vehicles. Figure 16 [Srinivasan, private communication, 2007] shows the specific energy versus specific power, along with DOE goals, and Figure 17 shows a comparison with DOE goals for all the relevant battery parameters. (Note that calendar life and cycle life are not shown, as they are as yet undetermined.) Present batteries show promise, but energy-storage issues must still be overcome for them to be practical for an American family vehicle. However, Toyota and Chevrolet, among other vehicle manufacturers, will soon place plug-in hybrid vehicles on the market, likely as demonstration vehicles if they have a large electric range––say 40 miles––and possibly for sale if they have a short electric range––say up to 10 miles.
5. Catalysts for fuel cellsPlatinum or other platinum-group metals (PGM) are required as a catalyst for present-day fuel
cells for automotive use, and these metals are both rare and expensive. The current price for platinum as of May 2008 is $2,200 per once, or about $73 per gram. Prices for these metals have been rising rapidly in the past few years, and this rise is likely to continue.
14. A more complete comparison of ICE and electric cars should take into account that electric cars will have accessories which will use a few percent of the energy, just like ICE cars. Small changes in calculated efficiencies are of the order of the improvement in fuel economy by proper tire inflation.

46 | ENERGY FUTURE: Think Efficiency American Physical Society • September 2008
The major use of platinum and PGM in the transportation sector today is in catalytic converters, required for emission control in automobiles. An automobile catalytic converter contains approximately 1.5 grams of PGM, and the total consumption of platinum for catalytic converters in the United States is approximately 25,000 kilograms out of a total of 40,000 kilograms of platinum used for all U.S. purposes. Worldwide platinum production was less than 200,000 kilograms in 2002. Most of the world’s platinum comes from South Africa (80%) and Russia (20%); there is very limited production in the United States.
With current technology, hydrogen fuel cells for automotive use would also require platinum and PGM. Present designs require approximately 0.8 grams of platinum per kW, and a typical, present-day automotive fuel cell is roughly 75 kW, meaning that it requires approximately 60 grams of platinum, costing $4,400 at today’s price.
The need for platinum introduces at least three obstacles to widespread use of fuel cells for transportation: cost, the total quantity of platinum available in the world, and vulnerability to supply disruption. Research in these areas is needed.
The solution is to find methods of making fuel cells that require very little or no platinum. This is a topic of considerable research today, because reducing or eliminating the need for platinum would simultaneously surmount all three obstacles.
If the amount of platinum now required for a fuel cell could be reduced by a factor of 50, a fuel cell would contain about the same amount of the metal as a catalytic converter. One promising new approach is to alter the electronic structure of the subsurface layers of platinum by substituting a a different material, leaving a pure platinum surface [Stamenkovic et al., 2007] Stamenkovic’s work achieved a factor-of-10 improvement in catalytic activity for the oxygen-reduction reaction in fuel cells by adjusting the near-surface composition of platinum single crystals. Single crystals could not be used in fuel cells, so this is a proof of concept rather than a technological advance.
The path to improving catalysts to make PEM (Polymer Electrolyte Membrane) fuel cells practical involves a combination of basic and applied research. Achieving large decreases in platinum use requires qualitative changes in the way platinum catalysts are prepared and implemented in fuel cells. Obtaining a factor-of-10 reduction requires a thorough understanding of what the catalytically active site is, and control of the internal structure and external morphology of the platinum catalyst using nanoscale fabrication.
1
10
4
100
2
1,000
Spec
ific
ener
gy (W
h/kg
)Ra
nge
Average/peak specific power (W/kg)
-
Fuel Cells
Internal combustion engine
Acceleration
Lead-acid battery
Lithium-ion battery
Nickel metal hydride battery
CapacitorsHybrid-electric goal
3.6 seconds36 seconds6 minutes 1 hour
PHEV-40
PHEV-20
Source: Venkat Srinivasan
Figure 16
Battery performanceThis graphic compares the energy in watt hours per kilogram of vehicle power sources. The chart indicates their range, power and acceleration.
Electric vehicle goal

American Physical Society • September 2008 ENERGY FUTURE: Think Efficiency | 47
These breakthroughs are well beyond the reach of incremental advances in the present state of the art. To make them happen, there needs to be significant investment in basic research using creative approaches and tools of nanoscience, followed by a concerted engineering effort to apply this knowledge to practical fuel-cell technology. This has to be done by government, as it is too risky for industry.
0
10
20
30
40
50
60
70
80
90
100
Specificpower
Power density
Specific available energy
Availableenergydensity
Cycle life
Calendar life
Production price
Operatingtemperature
range
Perc
ent o
f goa
l ach
ieve
d
Battery characteristic
Source: Environmental Protection Agency (Adapted from a figure provided by Srinivasan, 2007)
Figure 17
Battery capabilitiesBattery capabilities with PHEV comparisons of 40-mile electric range goals.

48 | ENERGY FUTURE: Think Efficiency American Physical Society • September 2008
S. Ahmad and D. L. Greene, “Effect of Fuel Economy on Automobile Safety,” Transportation •Research Record: Journal of the Transportation Research Board 1941, 1-7 (2005).
M. Anderman, private communication (2007).•
L. Bailey and P. Mokhtarian, A. Little, “The Broader Connection Between Public Transportation, •Energy Conservation and Greenhouse Gas Reduction”, ICF International, Fairfax, VA (2008).
M. G. Boarnet and R. Crane, “Travel by Design: The Influence of Urban Form on Travel,” •Oxford University Press, New York (2001).
J. Bordoff, and P. Noel,“Pay As You Drive Insurance: A Simple Way to Reduce Driving-Related •Harms and Increase Equity,” Brookings Institution, Washington, DC (2008).
R. Cervero and C. Radisch, “Travel Choices in Pedestrian Versus Automobile Oriented •Neighborhoods,” University of California Transportation Center, Berkeley (1995).
L. Cheah, C. Evans, A. Bandivadekar and J. Heywood, “Factor of Two: Halving the Fuel •Consumption of New U.S. Automobiles by 2035,” pub. no. LFEE 2007-04 RP, MIT, Cambridge, MA (2007).
C. Davis, B. Edelstein, B. Evenson, A. Brecher and D. Cox, • Hydrogen Fuel-Cell-Vehicle Study, report prepared for the Panel on Public Affairs, American Physical Society, New York (2003).
S. C. Davis and S.W. Diegel, • Transportation Energy Data Book, edition 26, ORNL-6978, Oak Ridge National Laboratory, Oak Ridge, Tennessee, http://cta.ornl.gov/data/index.shtml.
A. M. Eaken and D. B. Goldstein; “Quantifying the Third Leg: The Potential for Smart Growth •to Reduce Greenhouse Gas Emissions,” in Proceedings of the 2008 ACEEE Summer Study on Energy Efficiency in Building, in press.
EERE 2005: U.S. Department of Energy, • Energy Efficiency and Renewable Energy, FreedomCAR and Fuel Technical Partnership Technical Goals, (2005), http://www1.eere.energy.gov/vehiclesandfuels/about/partnerships/freedomcar/fc_goals.html.
EIA 2007a: Energy Information Administration, “Executive Summary—Carbon,” in • Emissions of Greenhouse Gases in the United States, 2005,. http://www.eia.doe.gov/oiaf/1605/ggrpt/summary/carbon.html.
EIA 2007b http://www.eia.doe.gov/environment.html.•
Energy Information Administration, Energy Market and Economic Impacts of S. 2192, the • Lieberman-Warner Climate Security Act of 2007, SR/OIAF/2008-01, U.S. Department of Energy, Washington, D.C., April 2008.
Environmental Protection Agency, • Light-Duty Automotive Technology and Fuel-Economy Trends: 1975 through 2007, http://www.epa.gov/otaq/fetrends.htm#2, (2007).
Environmental Protection Agency (EPA), U.S. Department of Energy, Washington, DC, • http://www.fueleconomy.gov/FEG/atv.shtml
C h a p t e r 2 R e f e r e n c e s

American Physical Society • September 2008 ENERGY FUTURE: Think Efficiency | 49
R. Ewing and R. Cervero, “Travel and the Built Environment: A Synthesis,” • Transportation Research Record 1780: 87-114 (2001); T. Litman, Land Use Impacts on Transport, Victoria Transport Policy Institute, Victoria, BC (2005); Center for Clean Air Policy, CCAP Transportation Emissions Guidebook, Part 1: Land Use, Transit, and Travel Demand Management, Washington, DC (2005).
R. Ewing, K. Bartholomew, S. Winkelman, J. Walters and D. Chen, • Growing Cooler: The Evidence on Urban Development and Climate Change, Urban Land Institute, Chicago (2007).
Federal Highway Administration, Traffic Volume Trend, FHWA, Washington, DC (2008), • http://www.fhwa.dot.gov/ohim/tvtw/tvtpage.htm
D. B. Goldstein, J. Holtzclaw and T. Litman, “Overcoming Barriers to Smart Growth: Surprisingly •Large Role of Better Transportation Modeling,” in Proceedings of the 2006 Summer Study on Energy Efficiency in Buildings, American Council for an Energy Efficient Economy, Washington, DC, August 2006.
D. Gordon, D. L. Greene, M. H. Ross and T. P. Wenzel, • Increasing Vehicle Fuel Economy without Sacrificing Safety, International Council on Clean Transportation, Washington, DC (2006).
D. L. Greene and A. Schafer, • Reducing Greenhouse Gas Emission from U. S. Transportation, Pew Center, on Global Climate Change, 2003.
D. L. Greene, P. N. Leiby and D. Bowman, “Integrated Analysis of Market Transformation scenarios •with HyTrans”, ORNL/TM-2007/094, 2007.
D. L. Greene, private communications (2008).•
S. L. Handy, L. Weston and P. L. Mokhtarian “Driving by Choice or Necessity?” • Transportation Research Part A 39 (3), 183 – 203 (2005).
S. Handy, X. Cao and P. L. Mokhtarian, “Self-Selection in the Relationship between the Built •Environment and Walking,” Journal of the American Planning Association 72 (1), 55-74 (2006).
J. Holtzclaw, • Explaining Urban Density and Transit Impacts on Auto Use, Natural Resources Defense Council and Sierra Club, submission to State of California Energy Resources Conservation and Development Commission, 2001; see also J. Holtzclaw, R. Clear, H. Dittmar, D. Goldstein, and P. Haas. “Location Efficiency: Neighborhood and Socio-Economic Characteristics Determine Auto Ownership and Use – Studies in Chicago, Los Angeles and San Francisco,” Transportation Planning and Technology Journal 25 (1) (March 2002).
Insurance Institute for Highway Safety, press release May 14, 2008, http://www.iihs.org/news/rss/•pr051408.html.
R. A. Johnston, • Review of U.S. and European Regional Modeling Studies of Policies Intended to Reduce Transportation Greenhouse Gas Emissions, Institute of Transportation Studies, University of California, Davis, research report UCD-ITS-RR-08-12.
E. P. Kasseris and J. B. Heywood, • Comparative Analysis of Powertrain Choices for the Near to Mid-term Future, master’s thesis, MIT, Cambridge, MA (2006).

50 | ENERGY FUTURE: Think Efficiency American Physical Society • September 2008
M. A Kromer and J. B. Heywood, “Electric Powertrains: Opportunities and Challenges in the U.S. •Light-duty Fleet,” LFEE 2007-03 RP, MIT, Cambridge, MA (May 2007).
D. M. Lemoine, D. M. Kammen and A. E. Farrell, “An Innovative and Policy Agenda for •Commercially Competitive Plug-in Hybrid Electric Vehicles,” Environ. Res. Lett. 3, 014003 (2008).
N. Lutsey and D. Sperling, “Energy Efficiency, Fuel Economy, and Policy Implications,” •Transportation Research Record 1941, 8 (2005).
A. D. May and D. S. Milne, “Effects of Alternative Road Pricing Systems on Network Performance,” •Transportation Research A, 34 ( 6) pp. 407-436 (2000).
S. Murtishaw and L. Schipper, “Disaggregated Analysis of US Energy Consumption in the 1990s: •Evidence of the Effects of the Internet and Rapid Economic Growth,” Energy Policy 29, 1335 (2001).
NAS 2002: National Academy of Sciences, • Effectiveness and Impact of Corporate Average Fuel Economy (CAFE) Standards, NAS, Washington, DC (2002).
NAS 2005: National Academy of Sciences, • Review of the Research Program of the FreedomCAR and Fuel Partnership: First Report, NAS, Washington, DC (2005), http://books.nap.edu/openbook.php?isbn=0309097304
NAS 2008a: National Academy of Sciences, • Review of the 21st Century Truck Partnership, NAS, Washington, DC (2008), http://books.nap.edu/openbook.php?record_id=12258&page=R1
NAS 2008b: National Academy of Sciences, • Review of the Research Program of the FreedomCAR and Fuel Partnership: Second Report, NAS, Washington, DC (2008).
National Petroleum Council 2007, • Hard Truths; citing U.S. EPA/NHTSA, Light-Duty Automotive Technology and Fuel Economy Trends: 1975-2006.
C. Rodier, • A Review of the International Modeling Literature: Transit, Land Use, and Auto Pricing Strategies to Reduce Vehicle Miles Traveled and Greenhouse Gas Emissions, Transportation Sustainability Research Center, University of California, Berkeley (2008).
D. Santini and A. Vyas, “How to Use Life-cycle Analysis Comparisons of PHEVs to Competing •Powertrains,” presented at 8th International Advanced Automotive Battery and Ultracapacitor Conference May 12-16, 2008, Tampa, Florida; D. Santini and A. Vyas, “More Complications in Estimation of Oil Savings via Electrification of Light-duty Vehicles,” presented at PLUG-IN 2008 Conference in San Jose, CA, July 2008.
L. Schipper, 2008, http://embarq.wri.org/en/Article.131.aspx.•
D. Shoup, • The High Cost of Free Parking, American Planning Association Press, Chicago (2004).
Smart Growth America and National Association of Realtors, 2004• National Community Preference Survey, 2004
V. Srinivasan, private communication (2007).•
American Physical Society • September 2008 ENERGY FUTURE: Think Efficiency | 51
V. R. Stamenkovic• et al., Science 315, 493 (2007).
R. M. Van Auken and J. W. Zelner, “An Assessment of the Effects of Vehicle Weight and Size on •Fatality Risk in 1985 to 1998 Model Year Passenger Cars and 1985 to 1997 Model Year Light Trucks and Vans,” SAE Transactions 114 (6) 1354 (2004).
A. Vyas and D. Santini, “Use of National Surveys for Estimating ‘Full’ PHEV Potential for Oil-•use Reduction,” presented at PLUG-IN 2008 Conference in San Jose, CA, July 2008.
A. Vyas, D. Santini, M. Duoba M. Alexander, “Plug-in Hybrid Electric Vehicles: How Does •One Determine Their Potential for Reducing U.S. Oil Dependence?” presented at the EVS-23 symposium, Anaheim, CA, December 2007.