Embed Size (px)
Citation preview

© Transport Research Laboratory 2012
Transport Research Laboratory Creating the future of transport
PUBLISHED PROJECT REPORT PPR620
Analysis of police collision files for pedestrian fatalities in
London, 2006-10
J Knowles, L Smith, R Cuerden and E Delmonte
Prepared for: Transport for London, Delivery Planning - Surface Planning
Project Ref: TfL2520
Quality approved:
Jenny Stannard
(Project Manager)
Richard Cuerden
(Technical Referee)

Disclaimer
This report has been produced by the Transport Research Laboratory under a contract
with Transport for London. Any views expressed in this report are not necessarily those
of Transport for London.
The information contained herein is the property of TRL Limited and does not necessarily
reflect the views or policies of the customer for whom this report was prepared. Whilst
every effort has been made to ensure that the matter presented in this report is
relevant, accurate and up-to-date, TRL Limited cannot accept any liability for any error
or omission, or reliance on part or all of the content in another context.
When purchased in hard copy, this publication is printed on paper that is FSC (Forest
Stewardship Council) and TCF (Totally Chlorine Free) registered.
Contents amendment record
This report has been amended and issued as follows:
Version Date Description Editor Technical Referee
1 March 2012 Draft for client comment LS/JK RC
2 July 2012 Final version LS/JK RC
Pedestrian fatalities in London
1 PPR620
Contents
Executive summary 3
1 Introduction 5
2 Research Methods 6
2.1 Overview of STATS19 data 6
2.2 Police Fatal Road Traffic Collision Files 6
2.3 Sampling 7
2.4 File content analysis approach 8
3 Literature review 11
3.1 Introduction 11
3.2 Literature search 11
3.3 Causes of pedestrian collisions 11
3.4 Interventions/countermeasures 12
3.5 Summary 14
4 Analysis of police files in terms of Haddon‟s Matrix 15
4.1 Pre-event 15
4.2 The event 27
4.3 Post-event 38
5 Interventions for pedestrian safety 43
5.1 Countermeasures 43
5.2 In-depth analysis of fatality groups 46
6 Conclusions 98
6.1 Key results in terms of Haddon‟s matrix 98
6.2 Collision types 100
7 Recommendations 101
8 Acknowledgments 104
References 105
Appendix A Haddon‟s Matrix for pedestrian fatalities 107
Appendix B Database coding guidelines 110
Appendix C List of available countermeasures and descriptions 122
1 Primary interventions 125
1.1 Engineering - Road 125
1.2 Engineering -vehicles 129

Pedestrian fatalities in London
2 PPR620
1.3 Education - Pedestrians 132
1.4 Education - Drivers 133
1.5 Enforcement - Drivers 133
2 Secondary interventions 134
2.1 Engineering – Roads 134
2.2 Engineering - Vehicles 135
2.3 Education - pedestrians 136
2.4 Education –Drivers 136
2.5 Enforcement –Drivers 137
Appendix D STATS19 overview (2007-2010) 138

Pedestrian fatalities in London
3
Executive summary
In 2010 the Mayor‟s Transport Strategy included a commitment to improve the safety
and security of all Londoners (Greater London Authority, 2010). The Transport Strategy
states (page 201): “Despite a fall in the number of casualties from road traffic collisions
in recent years there is still an unacceptable number of casualties each year”. In 2010,
126 people were killed on London‟s roads, of which almost half (58) were pedestrians
(TfL, 2011).
This study analysed approximately 200 police fatal files where a pedestrian was killed in
London in the period 2006-2010, with the overall aim of providing a better
understanding of how fatal pedestrian collisions in London could be prevented. The files
were broadly representative of fatal pedestrian collisions in London over the period.
The fatal files were coded into a database based on Haddon‟s Matrix, which included
items related to the environment, the pedestrian, vehicle(s) and their driver(s)/rider(s)
in terms of pre-event, event and post-event.
The project identified the factors or primary interventions, which if they had been in
place may have prevented the collision occurring (primary prevention). Further, the
project considered the causes of the injuries and where practical identified the secondary
interventions, which if they had been in place may have reduced their severity.
In total, 198 fatalities from 197 collisions were coded. Several groups of fatalities were
identified as being of special interest because of particular characteristics of the
collisions. These groups generally accounted for a substantial proportion of the fatalities
although some fatalities are included in more than one group. The groups with the
largest numbers of fatalities were:
Pedestrians impaired with alcohol (46, 23%);
Pedestrians aged 80 years and above (41, 21%);
Pedestrians using a pedestrian facility (49, 25%);
Pedestrians crossing the carriageway choosing not to use the available crossing
facility (37, 19%);
Pedestrians in collisions with buses/coaches (33, 17%);
Pedestrians struck by speeding vehicles (32, 16%).
Other groups of interest included pedestrians in collisions with HGVs (27, 14%),
pedestrians in collisions with motorcycles (14, 7%), child pedestrians (18, 9%) and
vehicles that mounted the footway (12, 6%).
In each case, the collisions within each group were analysed in terms of who was
involved, the contributory factors, injuries and possible countermeasures.
For the pre-event:
65 pedestrians (33%) were 70 years or over
48 of the pedestrians (24%) were impaired by alcohol (combined with drugs in 10
cases) and 1 pedestrian was impaired by drugs only;
56% of the pedestrians were struck by a car, 17% by a bus or coach and 14% by
an HGV;

Pedestrian fatalities in London
4
The vast majority of vehicles had no defects prior to the collision;
178 of the 197 collisions (90%) were on roads with a speed limit of 30mph or
lower and 145 collisions (74%) occurred on A-roads;
64% of the collisions were within 20m of a junction; most commonly at a T,
staggered junction or crossroads;
There was a crossing facility within 50m of the collision site in 91 locations
(46%);
117 (59%) pedestrian fatalities occurred between 6am and 6pm; however, at
weekends there were greater numbers of pedestrian fatalities at night compared
with during the day.
For the event:
In 177 of the collisions (90%), the pedestrian was crossing the road, most
commonly whilst the vehicle was travelling straight ahead;
49 pedestrians (25%) were crossing at a facility and 37 (19%) were crossing
within 50m of a facility;
15 of the 27 HGVs which hit a pedestrian were moving off when they struck the
pedestrian.
Contributory factors:
96 pedestrians (48%) were recorded with „failed to look properly‟ as a
contributory factor and this factor was most common for all age groups;
38% of adults aged between 16 and 59 were recorded with „impaired by alcohol‟
as a contributory factor;
13 of the 82 pedestrians aged 60 or over (16%) were recorded with „wrong use of
pedestrian crossing facility‟ as a factor;
The most commonly recorded contributory factor for vehicles was „failed to look
properly‟, recorded for 20% of vehicles; this was most common for all vehicle
types except for HGVs, for which „vision affected by blind spot‟ was more common
(recorded for 12 out of 27 HGVs).
For the post event:
68 drivers/riders (35%) were convicted following the collision, most commonly for
careless driving (40);
24 vehicles (12%) failed to stop at the scene of the collision, all of which were
later traced. For large vehicles such as HGVs or buses/coaches, the driver may
not have realised that a collision had occurred.
For the 50 cases where the post mortems were coded, the most common life-
threatening injuries were head (34) and thorax (31) injuries; 18 had both head
and thorax;
Overall, the most common countermeasures recorded were primary countermeasures.

Pedestrian fatalities in London
5
1 Introduction
In 2010 the Mayor of London published the Mayor‟s Transport Strategy which included a
commitment to improve the safety and security of all Londoners (Greater London
Authority, 2010). The Transport Strategy states (page 201): “Despite a fall in the
number of casualties from road traffic collisions in recent years there is still an
unacceptable number of casualties each year”. In 2010, 126 people were killed on
London‟s roads, of which almost half (58) were pedestrians (TfL, 2011). This study
aimed to provide a better understanding of how fatal pedestrian collisions in London
could be prevented.
Police fatal road traffic collision reports provide a unique insight into the causes and
consequences of fatal collisions and what may have prevented the collision or reduced its
severity. By investigating the nature and causes of collisions it may be possible to
understand how they could have been prevented. This study analysed 197 police fatal
files where a pedestrian was killed in London during 2006-2010.
By analysing police fatal files, the project identified the factors or primary interventions
which, if they had been in place, may have prevented the collision occurring (primary
prevention). Further, the project considered the causes of the injuries and where
practical identified the secondary interventions which, if in place, may have reduced the
severity of the resulting injury (secondary prevention). The research methods presented
here do not attempt to repeat the collision investigation carried out by the police but use
a systematic approach based on the Haddon‟s Matrix (Haddon Jr, 1999).

Pedestrian fatalities in London
6
2 Research Methods
A principal aim of the research was to identify the characteristics of collisions that result
in fatally injured pedestrians, and to subsequently identify the relevant risk factors and
propose prevention strategies.
The research involved several stages:
an overview analysis of the STATS19 (ACCSTATS) data for 2006-2010;
a small targeted literature review;
a detailed content analysis of 200 police fatal files.
These stages are described below.
2.1 Overview of STATS19 data
STATS19 is the national database of all reported injury accidents on public roads. About
50 variables are recorded for each accident, including details of the accident
circumstances, the vehicles involved and the resulting casualties. TfL maintains a
database of collisions in London based on the STATS19 data named ACCSTATS, and the
ACCSTATS data for pedestrian collisions between 2006 and 2010 was provided to TRL for
this project. A brief overview of these data was used to set the context of the findings
from the detailed analysis, the results of which are described in Appendix D. This
ACCSTATS data was also used as a reference source to identify collisions in London
where a pedestrian had been killed from 2006 to 2010, to enable the Metropolitan Police
fatal files for a sample of these cases to be obtained.
2.2 Police Fatal Road Traffic Collision Files
The Archive of Police Fatal Road Traffic Collision Files held at TRL on behalf of the
Department for Transport (DfT) includes collisions until mid 2009 and provides a unique
insight into how and why fatal collisions occur on our roads. This detailed information is
not available from any other source and can be used to gain a fuller understanding of the
causes and consequences of a fatal collision.
The police fatal files include:
Accident investigators‟ reports;
Witness statements;
Police summaries;
Vehicle examiners‟ reports;
Post-mortem reports;
Scene photographs and plans; and
Other expert evidence.
The data provide information to enable the study of the circumstances and contributory
causes as well as the potential countermeasures.
The fatal files in the archive have been linked to STATS19 which allowed searches of the
archive for relevant files. This study covers the period 2006-2010 where pedestrians

Pedestrian fatalities in London
7
were killed in collisions within the Metropolitan and the City of London police force areas.
A target of 200 pedestrian fatality files (see Section 2.3) was set for the analysis.
The level of detail within the files is high, however, there is no provision for knowing
certain details if the information was not pertinent to the collision. For example, the
location where the pedestrian had started their journey was often unknown because it is
not relevant to the Police investigation so they do not always record it. Thus for some
variables there is a high proportion of unknowns.
All of the interpretation and coding of the police fatal road traffic collision files followed
strict data handling and confidentiality guidelines defined in the Department for
Transport protocol for accessing the fatal collision files. No personal information was
collected or retained by this work programme.
2.3 Sampling
Most of the fatal files for 2006 and 2007 are contained in the archive and are stored at
TRL. However, many of the 2008 files were not contained in the archive because the
police do not release the files for at least one year (and possibly two) to allow for the
investigations to be completed. In addition, the archive has not been added to by the
Metropolitan Police since July 2009.
The number of files in total and in the sample is shown in Table 2-1.
Table 2-1: Location of the pedestrian fatal files by year
Year File in TRL archive
File held by Metropolitan Police
Total Sample achieved
2006 85 14 99 19
2007 75 34 109 81
2008 23 70 93 52
2009 0 87 87 36
2010 0 58 58 9
Total 183 263 446 197
It was the original intention to review 200 files, using a combination of those files held at
TRL and those held by the Metropolitan Police. The sample was selected to be
representative based on the following criteria (shown in Table 2-2):
Inner/outer London;
Vehicle which hit the pedestrian (motorcycle, car, bus or coach, LGV, HGV)
Pedestrian age group (0-15, 16-24, 25-59, 60+)
This gave a total of 40 groups, for example „pedestrians aged 16-24 hit by a car in inner
London‟.
All of the files held in the TRL archive were used, with the files from the Police used to
complete the sample. Initially, the sample was selected at TRL and the Police were asked
to provide details for specific cases. However, due to difficulties in locating some of the
files, the Police were supplied with a list of all of the possible files in each of the 40
groups, together with the number of files needed in the sample for that group. Once the
files had been located and transferred, the TRL team visited the Metropolitan Police
Pedestrian fatalities in London
8
Traffic Criminal Justice Unit, at the North West Traffic Unit, Wembley to carry out the
analysis of the files.
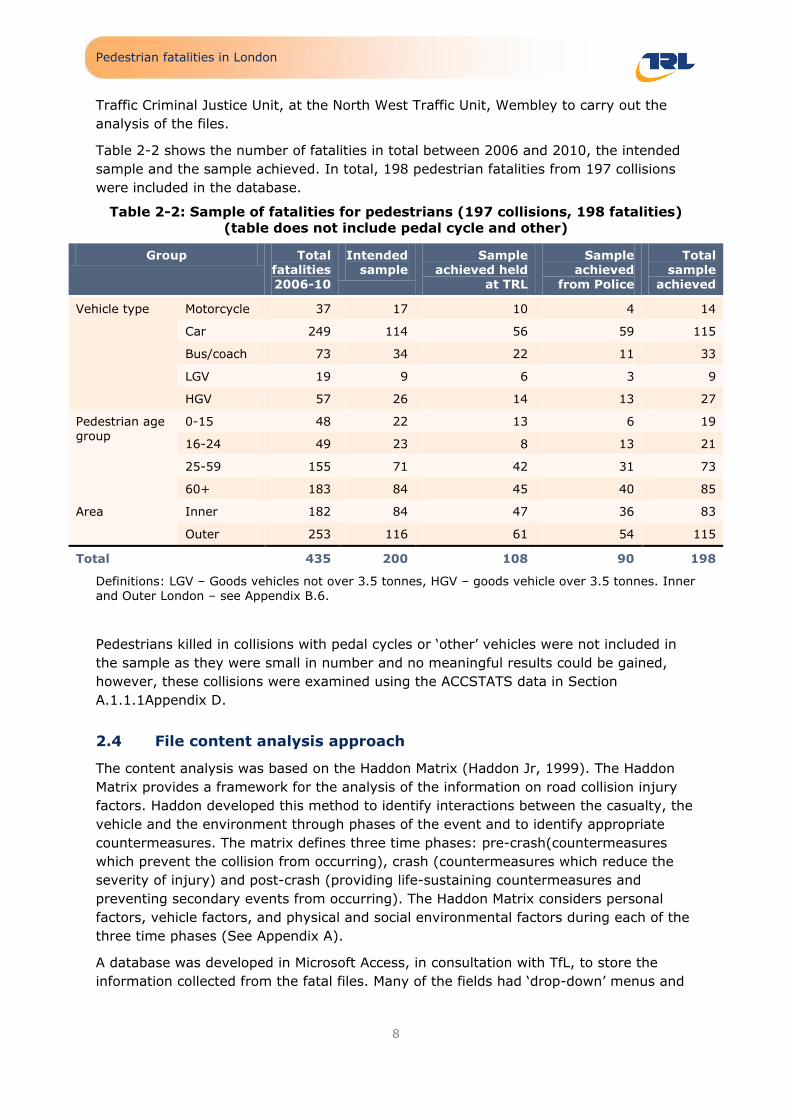
Table 2-2 shows the number of fatalities in total between 2006 and 2010, the intended
sample and the sample achieved. In total, 198 pedestrian fatalities from 197 collisions
were included in the database.
Table 2-2: Sample of fatalities for pedestrians (197 collisions, 198 fatalities) (table does not include pedal cycle and other)
Group Total fatalities 2006-10
Intended sample
Sample achieved held
at TRL
Sample achieved
from Police
Total sample
achieved
Vehicle type Motorcycle 37 17 10 4 14
Car 249 114 56 59 115
Bus/coach 73 34 22 11 33
LGV 19 9 6 3 9
HGV 57 26 14 13 27
Pedestrian age group
0-15 48 22 13 6 19
16-24 49 23 8 13 21
25-59 155 71 42 31 73
60+ 183 84 45 40 85
Area Inner 182 84 47 36 83
Outer 253 116 61 54 115
Total 435 200 108 90 198
Definitions: LGV – Goods vehicles not over 3.5 tonnes, HGV – goods vehicle over 3.5 tonnes. Inner
and Outer London – see Appendix B.6.
Pedestrians killed in collisions with pedal cycles or „other‟ vehicles were not included in
the sample as they were small in number and no meaningful results could be gained,
however, these collisions were examined using the ACCSTATS data in Section
A.1.1.1Appendix D.
2.4 File content analysis approach
The content analysis was based on the Haddon Matrix (Haddon Jr, 1999). The Haddon
Matrix provides a framework for the analysis of the information on road collision injury
factors. Haddon developed this method to identify interactions between the casualty, the
vehicle and the environment through phases of the event and to identify appropriate
countermeasures. The matrix defines three time phases: pre-crash(countermeasures
which prevent the collision from occurring), crash (countermeasures which reduce the
severity of injury) and post-crash (providing life-sustaining countermeasures and
preventing secondary events from occurring). The Haddon Matrix considers personal
factors, vehicle factors, and physical and social environmental factors during each of the
three time phases (See Appendix A).
A database was developed in Microsoft Access, in consultation with TfL, to store the
information collected from the fatal files. Many of the fields had „drop-down‟ menus and

Pedestrian fatalities in London
9
check boxes which allowed searches. In addition several descriptive text fields were
included to enrich the findings and provide a narrative of the collision.
The database is a hierarchical design with a unique code for each collision. There was a
record for the environment, a record for information about the fatal casualty and a
record for each vehicle involved (vehicle information and driver information). Detailed
coding instructions were developed and are included in Appendix B. The database also
included the ACCSTATS reference number so that records could be linked to the
STATS19 information for the collision.
As part of the content analysis the researchers considered the evidence contained in the
file and suggested contributory factors (based on the STATS19 system, see Appendix
B.8) and potential countermeasures from a list of possible interventions (see Appendix
C). The researchers could enter as many contributory factors and countermeasures as
were applicable to the case, although STATS19 only allows for six factors, assigning
them to the pedestrian or drivers/riders of vehicles involved in the collisions, each as
„possible‟ or „maybe‟.
Instructions were written to assist the coders and to ensure that the files were coded in
a similar and consistent manner, and several files were coded by more than one team
member to check inter-coder reliability. In addition, an experienced senior team member
checked all the coding for the files, in particular the assigning of countermeasures and
collision types.
In addition to this database a TRL specialist classified the injuries from a subset of 50
post mortem reports that were available at TRL using the Abbreviated Injury Scale
(AAAM, 2005) which is an internationally recognised method of classifying trauma and
measuring injury severity. Each injury description is assigned a unique six digit
numerical code in addition to the AIS severity score. The first digit summarises the body
region; the second digit identifies the type of anatomical structure; the third and fourth
digits identify the specific anatomical structure or, in the case of injuries to the external
region, the specific nature of the injury; the fifth and sixth digits identify the level of
injury within a specific body region or anatomical structure. Finally, the digit to the right
of the decimal point is the AIS severity score. MAIS denotes the Maximum AIS severity
score of all injuries sustained by a casualty. It is a single number that attempts to
describe the seriousness of the injuries suffered by a casualty. The AIS system therefore
allows injuries to be coded by their type and severity in terms of threat to life. The AIS
code (851812.3) shown in Figure 2-1 represents a fracture of the femur, where the AIS
severity score is 3 (serious). This study specifically uses the AIS code for the body region
injured and the AIS severity score.

Pedestrian fatalities in London
10
Figure 2-1: Example of an AIS code
The AIS severity score classifies individual injuries by body region on a six point ordinal
severity scale ranging from AIS 1 (minor) to AIS 6 (currently untreatable), shown in
Table 2-3.
Table 2-3: Description of AIS severity scores
AIS severity score Description
1 Minor
2 Moderate
3 Serious
4 Severe
5 Critical
6 Maximum (currently untreatable)
Bo
dy r
eg
ion
Typ
e o
f an
ato
mic
str
uctu
re
Sp
ecif
ic
An
ato
mic
str
uctu
re
Level
AIS
severit
y s
co
re
.
8 5 1 8 1 2 . 3

Pedestrian fatalities in London
11
3 Literature review
3.1 Introduction
The aim of the literature review was to summarise key pieces of literature relating to the
causes of pedestrian collisions, especially fatal collisions and countermeasures which
could help to prevent collisions or reduce the severity of the injury.
3.2 Literature search
The review was conducted using literature provided by TfL as well as key pieces of
literature acquired from a brief, targeted literature search. Six papers relating to
pedestrian casualties were reviewed. Causes of incidents were reviewed, along with
interventions and countermeasures (primary and secondary).
3.3 Causes of pedestrian collisions
3.3.1 The New York City Pedestrian Safety Study and Action Plan (New
York City Department of Transportation, 2010)
The Department of Transport in New York City undertook an extensive study of
pedestrian safety using data from over 7,000 severe and fatal pedestrian injury collisions
over eight years. The following factors were found to contribute to pedestrian-involved
collisions:
Driver inattention was a factor in over one third (36%) of pedestrian KSI collisions. Collisions involving driver inattention were more than twice as likely to
be fatal than other collisions.
Many collisions (27%) occurred when the driver failed to yield to a pedestrian,
mainly at signalised junctions.
Pedestrian KSI collisions often occurred while the pedestrian was crossing against the signal (20%). A fatality was over 50% more likely when the
pedestrian was crossing against the signal rather than with it.
Pedestrian KSI collisions were more than three times as likely if the vehicle was
turning left [equivalent of right in the UK] rather than right [equivalent of right in the UK]. One reason for this is that the driver‟s visibility can be obscured by
the A-pillar.
Speed was a factor in 21% of pedestrian KSI collisions (including excessive
speed, unsuitable speed for the conditions, and limited sight distance). Twenty
percent of pedestrian KSI collisions which involved „unsafe vehicle speeds‟ were fatal, compared to 10% of those which did not involve „unsafe vehicle speeds‟.
In New York City, 8% of fatal pedestrian collisions involved a driver who had been drinking, and again these collisions were more than twice as likely to be fatal.
Collisions which occurred while the vehicle was lane changing were also more than twice as likely to result in a fatality.
Pedestrian fatalities in London
12
3.4 Interventions/countermeasures
3.4.1 Factors influencing pedestrian safety: A literature review (UK, Martin, 2006)
Martin (2006) undertook a review of technical literature relating to pedestrians and ways
in which their behaviour might be influenced to reduce numbers of casualties on
London‟s roads. The following interventions and countermeasures relating to the
pedestrian environment were identified:
Road safety education can be delivered via a variety of methods which aim to
promote safe behaviour. For example pedestrians could be educated to improve awareness of other road users‟ needs, to develop strategies to minimise the risk
of being involved in a collision, or to increase general road safety knowledge. Young pedestrians are generally easier to influence than older pedestrians.
Footway widening is likely to result in improved pedestrian safety and reduce
conflict with traffic.
Carriageway narrowing has also been shown to reduce average driving speeds
and thus improve pedestrian safety
Removal of on-street parking can help to improve pedestrian safety as
collisions often occur when pedestrians are crossing between parked cars (although the presence of parked cars on the street is also associated with a
reduction in travelling speed).
The introduction of 20mph zones is associated with a substantial reduction in
pedestrian injury collisions and casualty severity.
The use of stop lines at crossings can encourage drivers to stop further back from the crossing and therefore reduce the risk of drivers running red lights or
edging onto the pedestrian crossing before the green light. This has been shown to reduce pedestrian conflicts.
Raised zebra or signal-controlled crossings can help to reduce vehicle speed on the approach to the crossing and encourage vehicles to give way to
pedestrians.
A central refuge can improve safety by providing pedestrians with a safe place
to stop while crossing a busy road.
Guard railings are intended to reduce conflicts between pedestrians and vehicles and to discourage pedestrians from crossing the road at unsuitable points.
Improved lighting can improve pedestrian safety at night.
3.4.2 Designing road vehicles for pedestrian protection (USA, Crandall,
Bhalla, & Madeley, 2002)
Vehicle design features aimed to improve pedestrian protection were reviewed including:
Pop-up bonnets (also known as active hood lift systems in America), which provide a greater clearance between the bonnet and stiff underlying structures
(e.g. engine components) in the event of a frontal impact, thus allowing for controlled deceleration of the pedestrian‟s head and reduced risk of head injury.
Pop-up bonnets are currently available on only a few car models.
The application of an energy-absorbing layer on the bumper combined with
altered bumper geometry, height and orientation can reduce the risk of lower
limb injuries.

Pedestrian fatalities in London
13
Deeper bumper profiles and support bars positioned below the bumper can
also reduce knee-related injury by limiting rotation of the leg.
3.4.3 Protecting vulnerable road users from injury (France, Constant &
Lagarde, 2010)
This study described further measures to protect vulnerable road users from injury,
including:
In-vehicle advanced sensing systems to track road users.
Pedestrian education to improve awareness of road hazards and pedestrian
responsibilities.
The use of conspicuity aids, especially at night, to improve the visibility of pedestrians.
3.4.4 Development of night-vision system (Japan, Tsuji, Hattori, Watanabe, & Nagaoka, 2002)
This study developed a night vision system to detect high-temperature objects using
infrared cameras. The position and location of the pedestrian are used to calculate the
risk of a collision. Active night vision systems are currently available on certain premium
vehicles only.
3.4.5 EU Regulation 78/2009
The EC Directive on pedestrian protection (2003/102/EC) was originally written in two
phases. Phase one came into force in October 2005 and was applicable to new type-
approvals, with the intention that all old type-approved vehicles that are still in
production must be approved to the Phase one requirements by the end of 2012.
Originally, Phase two of the EC Directive was to come into force for new type-approvals
in September 2010 and new vehicles by September 2015. However, it was suggested
that Phase two of the EC Directive was not achievable and consequently TRL were
commissioned to conduct a feasibility study. As a result of the feasibility study, Phase
two of the European legislation was revised; the revised Phase two was included in EC
Regulation Number 78/2009, which was published in February 2009. This superseded
the EC Directive and also brought together the Frontal Protection Systems (Bull-bar)
legislation and adds requirements for Brake Assist Systems (the latter being required to
compensate for the pedestrian protection feasibility adjustments).
Table 3-1 outlines the effective dates for each of the pedestrian protection phases of the
EC Regulation and for the Brake Assist System (BAS) requirement (but Front Protection
System requirements are not shown).

Pedestrian fatalities in London
14
Table 3-1: Outline of dates from when each phase of the Regulation is effective
Vehicles
EC Regulation (78/2009)
Phase one Phase two Brake Assist System
New Types
New Vehicles
New Types
New Vehicles
New Types
New Vehicles
M1 ≤ 2500 kg and N1 derived from M1 ≤2500 kg
11/2009 12/2012 2/2013 2/2018 11/2009 2/2011
M1 > 2500 kg 2/2015 8/2019 11/2009 2/2011
N1 other (not derived and/or >2500 kg)
2/2015 8/2019 2/2015 8/2015
EU Regulation 78/2009 outlines manufacturer and member state obligations relating to
type-approval, and states that “pedestrian protection can be significantly improved by a
combination of passive and active measures which afford a higher level of protection
than the previously existing provisions”.
3.5 Summary
A number of interventions and countermeasures relating to the pedestrian environment
have been identified, including education, infrastructure changes, and improved lighting.
Vehicle design also has an important role to play in the protection of passengers.

Pedestrian fatalities in London
15
4 Analysis of police files in terms of Haddon’s Matrix
The sample consisted of 198 pedestrian fatalities from 197 collisions that occurred in
London between 2006 and 2010. This section shows the results related to Haddon‟s
Matrix, which splits the details of the collision and its participants into nine cells in a
matrix as shown below. The matrix below shows examples in each cell; the full Haddon‟s
Matrix is shown in Appendix A.
Table 4-1: Haddon’s Matrix with examples (full matrix in Appendix A)
Pedestrian Environment Vehicle and driver
Pre-event Age, gender,
impairments
Date, time,
traffic conditions
Vehicle type, driver
age, vehicle speed
Event Manoeuvre Crossing
facilities
Manoeuvre
Post-event Injuries
occurred
Convictions
following collision
4.1 Pre-event
This section describes the pre-event, namely the personal characteristics of the
pedestrian, the other vehicles and participants involved and the road environment.
4.1.1 The pedestrian
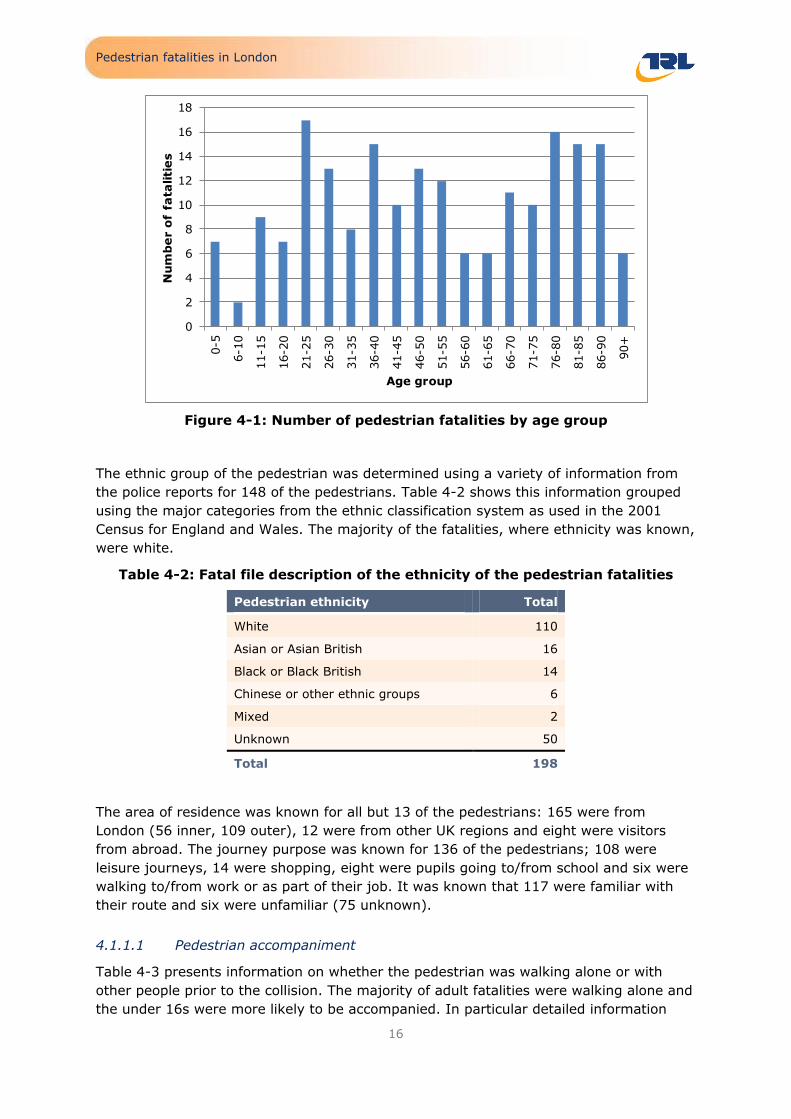
There were 112 male and 86 female pedestrians in the sample of fatalities. Figure 4-1
presents the age distribution of the pedestrians. From this it can be seen that a large
proportion of the sample were aged over 70 and one-fifth of the sample were aged 80 or
over (41 fatalities).
Pedestrian fatalities in London
16
Figure 4-1: Number of pedestrian fatalities by age group
The ethnic group of the pedestrian was determined using a variety of information from
the police reports for 148 of the pedestrians. Table 4-2 shows this information grouped
using the major categories from the ethnic classification system as used in the 2001
Census for England and Wales. The majority of the fatalities, where ethnicity was known,
were white.
Table 4-2: Fatal file description of the ethnicity of the pedestrian fatalities
Pedestrian ethnicity Total
White 110
Asian or Asian British 16
Black or Black British 14
Chinese or other ethnic groups 6
Mixed 2
Unknown 50
Total 198
The area of residence was known for all but 13 of the pedestrians: 165 were from
London (56 inner, 109 outer), 12 were from other UK regions and eight were visitors
from abroad. The journey purpose was known for 136 of the pedestrians; 108 were
leisure journeys, 14 were shopping, eight were pupils going to/from school and six were
walking to/from work or as part of their job. It was known that 117 were familiar with
their route and six were unfamiliar (75 unknown).
4.1.1.1 Pedestrian accompaniment
Table 4-3 presents information on whether the pedestrian was walking alone or with
other people prior to the collision. The majority of adult fatalities were walking alone and
the under 16s were more likely to be accompanied. In particular detailed information
0
2
4
6
8
10
12
14
16
18
0-5
6-1
0
11-1
5
16-2
0
21-2
5
26-3
0
31-3
5
36-4
0
41-4
5
46-5
0
51-5
5
56-6
0
61-6
5
66-7
0
71-7
5
76-8
0
81-8
5
86-9
0
90+
Nu
mb
er o
f fa
taliti
es
Age group

Pedestrian fatalities in London
17
was collected for the ten children aged less than 11 years. Of these, two were travelling
in a pram/pushchair, one was holding an adult‟s hand, two were in close proximity to an
adult, one was with an adult but it was unknown how close they were, two were in a
group and two were alone. The collisions involving children are looked at in detail in
Section 5.2.5.
Table 4-3: Pedestrian accompaniment by age group
Age group Alone Child & adult Group Unknown Total
Under 16 5 7 6 0 18
16-24 20 0 4 0 24
25-29 7 0 1 1 9
30-39 21 1 3 0 25
40-49 18 0 4 1 23
50-59 15 0 2 0 17
60-69 16 0 1 0 17
70+ 61 0 3 1 65
Total 163 8 24 3 198
4.1.1.2 Distractions
It was of interest to determine whether the pedestrian was distracted prior to the
collision and so evidence of mobile phone use, interaction with other pedestrians and
other distractions was looked for in the police files. The results are shown in Table 4-4.
Overall 25 pedestrians were distracted. Four pedestrians were using a mobile phone
prior to the collision; they were aged 19, 21, 38 and 74. Two pedestrians (aged 29 and
37) were known to be wearing headphones. Ten pedestrians were following other
pedestrians across the road, 3 of which were known to be in a group.
Table 4-4: Pedestrian distractions
Distraction Yes No Unknown Total
Following other pedestrians 10 188 0 198
Talking to other pedestrians 6 192 0 198
Playing 4 194 0 198
Using a mobile phone 4 193 1 198
Wearing headphones 2 195 1 198
Yelling across the road 2 195 1 198
Eating & drinking 2 195 1 198
Reading 1 196 1 198
Walking a dog 0 198 0 198
Any distraction 25 172 1 198
4.1.1.3 Pedestrian visibility and items carried
The clothing that the pedestrian wore was known for 166 pedestrians. Of these, only
three people were wearing high visibility clothing (one in the dark with streetlights, two
in the daylight, all three were aged over 50). „Pedestrian wearing dark clothing at night‟
Pedestrian fatalities in London
18
was thought to be a contributory factor in four collisions (contributory factors are
discussed in more detail in Section 4.2.8).
It is known that two of the fatalities were pushing a pushchair/pram prior to the collision
and that five pedestrians were pushing a shopping trolley/basket (they were all aged
over 60).
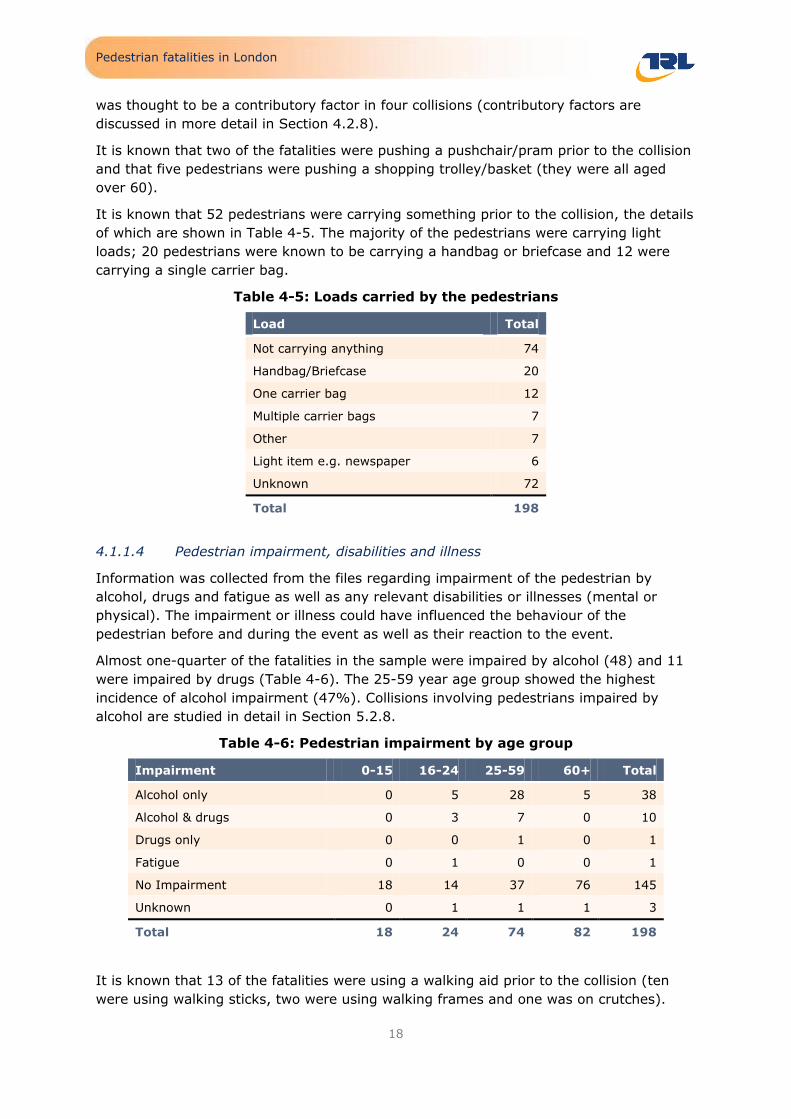
It is known that 52 pedestrians were carrying something prior to the collision, the details
of which are shown in Table 4-5. The majority of the pedestrians were carrying light
loads; 20 pedestrians were known to be carrying a handbag or briefcase and 12 were
carrying a single carrier bag.
Table 4-5: Loads carried by the pedestrians
Load Total
Not carrying anything 74
Handbag/Briefcase 20
One carrier bag 12
Multiple carrier bags 7
Other 7
Light item e.g. newspaper 6
Unknown 72
Total 198
4.1.1.4 Pedestrian impairment, disabilities and illness
Information was collected from the files regarding impairment of the pedestrian by
alcohol, drugs and fatigue as well as any relevant disabilities or illnesses (mental or
physical). The impairment or illness could have influenced the behaviour of the
pedestrian before and during the event as well as their reaction to the event.
Almost one-quarter of the fatalities in the sample were impaired by alcohol (48) and 11
were impaired by drugs (Table 4-6). The 25-59 year age group showed the highest
incidence of alcohol impairment (47%). Collisions involving pedestrians impaired by
alcohol are studied in detail in Section 5.2.8.
Table 4-6: Pedestrian impairment by age group
Impairment 0-15 16-24 25-59 60+ Total
Alcohol only 0 5 28 5 38
Alcohol & drugs 0 3 7 0 10
Drugs only 0 0 1 0 1
Fatigue 0 1 0 0 1
No Impairment 18 14 37 76 145
Unknown 0 1 1 1 3
Total 18 24 74 82 198
It is known that 13 of the fatalities were using a walking aid prior to the collision (ten
were using walking sticks, two were using walking frames and one was on crutches).

Pedestrian fatalities in London
19
Apart from the person using the crutches (age 46) all were aged over 67 years. It can be
seen from Table 4-7 that three pedestrians had uncorrected, defective eyesight, five had
impaired hearing and five had another relevant illness or disability.
Table 4-7: Pedestrian disabilities and illnesses (mental or physical)
Disability or illness Yes No Unknown Total
Walking aid 13 151 34 198
Uncorrected defective eyesight 3 190 5 198
Impaired hearing 5 188 5 198
Other relevant illness or disability 5 189 4 198
4.1.2 Vehicles and other participants in the collision
4.1.2.1 The vehicles involved
There were 205 vehicles involved in the 197 collisions. 189 collisions involved one
vehicle and this was the vehicle that struck the pedestrian. Eight of the collisions
involved two vehicles, one of which struck the pedestrian. The vehicle types are shown
in Table 4-8. For the remainder of this report, only the vehicles that struck the
pedestrian are included in the analysis.
Table 4-8: Other vehicles involved in the collision
Vehicle type Vehicle that struck
the pedestrian Other vehicle
involved Total vehicles
Car/taxi 111 7 118
Bus/coach 33 0 33
HGV 27 1 28
LGV 12 0 12
Motorcycle 14 0 14
Number of vehicles 197 8 205
The pre-event condition was known for 185 of the vehicles involved and of these 176
had no defects, shown in Table 4-9. Nine vehicles had defects although only four were
considered likely to have contributed to the collision. It was known that six vehicles that
struck the pedestrian did not have a valid car tax out of the 132 for which information
was known.

Pedestrian fatalities in London
20
Table 4-9: Vehicle defects
Defect description Total vehicles
No defects – „good condition‟ 174
Defective lights 2
Defect to front tyre
(may have contributed to the collision in one case) 2
Mirror defect
(may have contributed to the collision in one case) 2
Defective horn 1
Suspension fault 1
Non road worthy condition
(may have contributed to the collision) 1
Badly worn wipers and marked windscreen 1
Defective ABS, allowing brakes to be locked during
emergency braking (may have contributed to the collision) 1
Unknown 12
Total vehicles that struck the pedestrian 197
A number of different mirrors are required by law to be fitted to HGVs, buses and
coaches to improve the field of vision for drivers. These are intended to reduce blind
spots in the immediate area surrounding the vehicle. Table 4-10 shows the types of
mirrors fitted to the 60 HGVs and buses/coaches in the sample. Two HGVs were known
not to have the front mirror fitted1 and one HGV did not have the nearside wide angle
mirror fitted. The missing mirrors were not a contributory factor in these collisions. In
addition to mirrors, the researchers checked the files for evidence of off-side and near-
side protective guards where it was relevant.
Table 4-10: Mirrors fitted to HGVs, buses and coaches
Type of mirror Fitted Not fitted Not known Total
Nearside main mirror (class II) 28 - 32 60
Offside main mirror (class II) 27 - 33 60
Nearside wide angle mirror (class IV) 17 1 42 60
Offside wide angle mirror (class IV) 9 - 51 60
Close proximity mirror (class V) 15 - 45 60
Front mirror (class VI) 12 2 46 60
1 Front mirrors were required on new trucks (>7.5t) first registered after 2006. Trucks
registered before that date have no requirement. Close proximity mirrors at the side were required on new trucks from the same time but in addition to this any truck (7.5t)
registered since August 2000 not already equipped with a side mirror was required to
retro-fit them by March 2009. The requirement was only enforced at annual inspection so in reality some may not have been equipped until mar 2010.

Pedestrian fatalities in London
21
4.1.2.2 The drivers of the vehicle
Of the 197 vehicles that struck the pedestrian, 160 drivers were male and 36 were
female (one unknown). Table 4-11 presents the age distribution of these drivers by
vehicle type and Table 4-12 shows the ethnicity. The majority of the drivers were aged
between 16 and 49 years, there was one underage driver and seven drivers were aged
over 70 years.
Table 4-11: Age distribution of the driver of the vehicle that struck the
pedestrian by vehicle type
Driver age group Car Bus/coach HGV LGV Motorcycle Total
under 16 1 0 0 0 0 1
16-24 24 1 0 1 0 26
25-29 13 1 3 3 2 22
30-39 37 8 11 2 6 64
40-49 15 13 5 3 3 39
50-59 4 5 5 2 2 18
60-69 6 4 2 1 1 14
70+ 7 0 0 0 0 7
Unknown 4 1 1 0 0 6
Total drivers 111 33 27 12 14 197
Table 4-12: Fatal file description of the ethnicity of the drivers
Driver ethnicity Total
White 106
Asian or Asian British 26
Black or Black British 23
Mixed 1
Chinese or other ethnic groups 1
Unknown 40
Total drivers 197
Just over three-quarters of the drivers lived in London, 41 from inner and 110 from outer
London (see definition given in Section A.1.1.1D.2.1). Eighteen drivers lived in other
parts of the UK and three were drivers from abroad. This is shown in Table 4-13 by
vehicle type.
Table 4-13: Area of residence of the drivers by vehicle type
Area of residence Car Bus/coach HGV LGV Motorcycle Total
Outer London 69 16 14 7 4 110
Inner London 23 9 3 2 4 41
UK – non-London 5 3 7 0 3 18
Non-UK 2 0 1 0 0 3

Pedestrian fatalities in London
22
Unknown 12 5 2 3 3 25
Total drivers 111 33 27 12 14 197
Table 4-14 shows the journey purpose by vehicle type. As would be expected the drivers
of the HGVs, buses/coaches and the majority of LGVs were driving as part of their job.
For the car drivers around two-thirds of the known journeys were for leisure purposes.
The majority of the drivers were either very familiar or familiar with the route they were
driving (132) with only five car drivers and one HGV driver being unfamiliar (Table
4-15).
Table 4-14: Journey purpose by vehicle type
Journey purpose Car/taxi Bus/coach HGV LGV Motorcycle Total
Part of job 11 32 27 7 1 78
Leisure 57 0 0 0 3 60
Journey to/from work 15 0 0 3 8 26
Shopping, school run 4 0 0 1 0 5
Unknown 24 1 0 1 2 28
Total drivers 111 33 27 12 14 197
Table 4-15: Driver familiarity with route by vehicle type
Driver familiarity Car/taxi Bus/coach HGV LGV Motorcycle Total
Very familiar 37 15 8 4 5 69
Familiar 30 17 10 3 3 63
Regular commuting 14 0 0 3 4 21
Unfamiliar 5 0 1 0 0 6
Unknown 25 1 8 2 2 38
Total drivers 111 33 27 12 14 197
There was no evidence of alcohol or drug impairment in the police files of drivers/riders
of HGVs, buses/coaches, LGVs or motorcycles. In contrast six car drivers were known to
be impaired by drugs and/or alcohol. Three drivers suffered a medical incident just prior
to the collision and one bus driver was fatigued.
Table 4-16: Driver/rider impairment by vehicle type
Driver impairment Car/taxi Bus/coach HGV LGV Motorcycle Total
None 83 29 26 12 12 161
Alcohol 4 0 0 0 0 4
Drugs 1 0 0 0 0 1
Alcohol & Drugs 1 0 0 0 0 1
Defective eyesight 1 0 0 0 0 1
Illness or disability 2 1 0 0 0 3
Fatigue 0 1 0 0 0 1
Unknown 20 2 1 0 2 25

Pedestrian fatalities in London
23
Total drivers 111 33 27 12 14 197
Evidence of driver distraction was looked for in the fatal files and in the majority of cases
there was none (150). In eight collisions there was some evidence of driver distraction
inside the vehicle (such as a newspaper on the steering wheel, a bus passenger, a driver
having a coughing episode) and in four collisions the distraction was due to pedestrians
outside the vehicle. Four drivers were possibly distracted by a mobile phone and this was
likely to have contributed to the cause of the collision in three cases.
Table 4-17: Driver distraction by vehicle type
Driver distraction Car/taxi Bus/coach HGV LGV Motorcycle Total
None 79 25 24 10 12 150
Distraction in vehicle 3 3 2 0 0 8
Distraction outside vehicle 1 1 1 0 1 4
Mobile phone 4 0 0 0 0 4
Unknown 24 4 0 2 1 31
Total drivers 111 33 27 12 14 197
Information on whether the driving licence was appropriate was found in the police
records for 167 drivers and of these six did not hold a licence, one HGV driver did not
have the correct licence for the vehicle and one driver had a fake Portuguese licence.
Information on how long the driver had held their full driving licence was known for 114
drivers. Half of these drivers had held a full licence for more than ten years (59 drivers)
while a sixth were inexperienced/novice drivers2 (19 drivers).
Evidence was gathered from the police files regarding the conviction history for the
drivers that struck the pedestrian. Eighteen drivers had previous convictions (unknown
for 34 drivers). Eleven were for driving offences, 6 drivers had criminal records and 1
driver had an adult caution.
4.1.3 The road environment
4.1.3.1 Infrastructure
Road class, road type and speed limit at the location of the collision are presented in
Table 4-18. The majority (178) of the collisions were on low speed roads (30mph or
less), predominantly on single carriageway A-roads. Traffic conditions at the time of the
collision were known for 142 locations. They were described as heavy at 39 locations (26
heavy and moving, 13 heavy and queued), moderate traffic in 54 locations and 49
collisions occurred in light traffic.
2 defined as holding a full driving licence less than one year

Pedestrian fatalities in London
24
Table 4-18: Number of collisions by road class by speed limit
Road Class
Road Type Speed limit
Total 10/20/30 mph 40 mph 50 mph 60/70 mph
Motorways (M & A(M)) 0 0 1 0 1
A-roads Dual 36 11 3 2 52
Single 84 0 1 0 85
One way 6 0 0 0 6
Unknown 2 0 0 0 2
B-roads 13 1 0 0 14
C & unclassified roads 37 0 0 0 37
Total 178 12 5 2 197
The majority of the pedestrian collisions were within 20m of a junction, the detail of
which is shown in Table 4-19. At just over half of the locations was a T, staggered
junction or crossroads.
Table 4-19: Junctions at the collision locations
Junction detail Total
Not at or within 20m of junction 71
T or staggered junction 80
Crossroads 28
Roundabout 5
Multiple junction 6
Other junction 1
Private drive or entrance 2
Slip road 2
Unknown 2
Total collisions 197
The presence of a pedestrian crossing facility within 50m of the collision site was also
recorded and this is presented in Table 4-20 There was a crossing facility within 50m of
the collision site in 91 locations; note this does not mean that the pedestrian was using
the crossing at the time of the collision (see Section 5.2.9).

Pedestrian fatalities in London
25
Table 4-20: Pedestrian crossing facility within 50m of the collision locations
Crossing facility detail Total
No crossing facility within 50m 104
Pedestrian phase at traffic lights (ATS) 24
Pelican/Puffin/Toucan/Other non junction crossing facility 38
Staggered Pelican/Puffin/Toucan/Other non junction facility 7
Zebra crossing 12
Central refuge - no controls 9
Subway 1
Unknown 2
Total collisions 197
The presence of a bus lane was recorded at 19 locations (not present at 105 locations).
Table 4-21 shows whether a bus stop was close to the collision site and in 45 collisions a
bus stop was within 50m. One-third of the collisions involving buses/coaches occurred
within 20m of a bus stop while this proportion was lower for the other vehicle types that
came into contact with the pedestrian. It is of interest to know whether the pedestrians
involved in collisions near to bus stops were intending to catch the bus or had recently
alighted from the bus. These variables have been analysed in Section 5.2.3.
Table 4-21: Distance from a bus stop by vehicle type
Distance from bus stop Car/taxi Bus/coach HGV LGV Motorcycle Total
At the bus stop 5 3 1 2 0 11
<10m 8 4 1 0 0 13
10-20m 6 3 2 1 1 13
21-30m 4 0 0 0 2 6
31-40m 0 0 1 0 0 1
41-50m 1 0 0 0 0 1
Not within 50m of a bus stop 87 23 22 9 11 152
Total 111 33 27 12 14 197
Guard rails (that is, railings intended to stop pedestrians leaving the pavement) were
known to be present at 42 locations (not present at 62 locations). This was determined
from the photographs or descriptions in the files. Road works/construction sites were
present at 4 locations (the vehicles involved were all cars at these sites). Shared road
space is defined as a street shared by all modes of traffic with no clearly defined
boundaries or segregation and was found at two locations.
Pre-event pedestrian flows were estimated based on descriptions provided by the police
and witnesses at the scene. Heavy flow was assumed to be where pedestrian‟s often
interrupted each other‟s movements; this was found in only nine collisions. Light flow
was most common, defined as „pedestrians‟ were able to move freely‟, at 73 locations.
Moderate flow was recorded at 49 sites and flow was unknown for 67 collisions.

Pedestrian fatalities in London
26
4.1.3.2 Time, lighting, weather and road surface
The distribution of fatalities by the month of the collision is shown in Figure 4-2. The
numbers of fatalities per month varied from ten in May to 21 in June and January.
Figure 4-2: The number of pedestrians killed by month of collision
Figure 4-3 shows the number of pedestrians killed by day of week and whether it was
during the day (6am-6pm) or night (6pm-6am). Overall, 117 of the pedestrian fatalities
(59%) occurred between 6am and 6pm. On Mondays to Fridays there were more
fatalities during the daytime compared to at night, whereas on Saturday and Sunday
there were more fatalities at nights (that is, midnight to 6am and 6pm to midnight)
compared to during the day, and may be as a result of increased social activity in the
evenings involving alcohol. The influence of alcohol is discussed in more detail in Section
5.2.8.

Pedestrian fatalities in London
27
Figure 4-3: The number of pedestrians killed by day of week
Note that each time group includes times up to, but not including the end of the range listed, for example, 6am is included in the 6am-6pm group.
The light conditions were known for all of the collisions; 114 were in the daylight, 73
were in the dark with street lights, six in the dark with no or unknown streetlights and
five at dusk/dawn. In addition to the lighting, the weather conditions were also recorded.
The majority of the collisions were in dry conditions (176), 13 were in the rain, one in
snow, one in „hazardous‟ fog and seven unknown. The road surface was described as
wet/damp in 38 collisions and icy in one collision.
4.2 The event
This section describes the types of conflicts and the main factors that were thought to
have contributed to the collision. Section 5.2 presents an in depth analysis of the main
fatality groups identified in this section.
4.2.1 Conflict types
Each of the 197 pedestrian collisions was classified into a conflict type. There were three
possible conflict types („pedestrian crossing road‟, „pedestrian other‟ and miscellaneous)
and within these up to seven detailed conflict scenarios. Table 4-22 shows the type of
collisions that resulted in a pedestrian fatality in London.

Pedestrian fatalities in London
28
Table 4-22: Conflict types
Conflict Total
N - Pedestrian crossing road 177
N1 Vehicle going ahead,
pedestrian left side 86
N2 Vehicle going ahead, pedestrian right side
67
N3 Vehicle left turn, pedestrian left side
9
N4 Vehicle right turn,
pedestrian right side 2
N5 Vehicle left turn, pedestrian right side
0
N6 Vehicle right turn, pedestrian left side
5
N7 Manoeuvring vehicle 7
P - Pedestrian other 16
P1 Walking with traffic 0
P2 Walking facing traffic 1
P3 Walking on footpath 12
P4 Child playing/tricycle 0
P5 Attending to vehicle 1
P6 Entering or leaving a vehicle
0
P7 Other 3
Q - Miscellaneous 4
Q8 Other 4
Total collisions 197
By far the most common collision type was the vehicle going straight ahead and the
pedestrian was crossing the road. This collision type accounted for over three-quarters of
the sample (153), most commonly Vehicle going ahead, pedestrian left side (86) and
Vehicle going ahead, pedestrian right side (67). There were 16 collisions which involved
the pedestrian crossing the road and the vehicle turning left or right, and seven collisions
which involved a manoeuvring vehicle (in all of these cases the vehicle was reversing).
There were 12 collisions where a vehicle hit a pedestrian that was on the footpath.
The „other‟ seven conflicts (P7 and Q8) were as follows:
Pedestrian impaired by alcohol laying in the carriageway;
Pedestrian stumbled off kerb into carriageway (2 cases);

Pedestrian fatalities in London
29
Person climbing on railings fell into the carriageway;
Alcohol impaired person hanging from a bridge and fell into the carriageway;
Car collided into a tree, the tree fell onto a pram, the child was thrown against a
wall;
Bus driver pressed the accelerator instead of the brake and another bus driver
was trapped between two buses.
Table 4-23 presents the most common conflicts by vehicle type. For the eight collisions
that involved two vehicles, the vehicle type is defined as the first vehicle that came into
contact with the pedestrian. For all vehicle types, the most common conflict involved the
pedestrian crossing the road and the vehicle travelling straight ahead. Six out of the
seven manoeuvring vehicles were cars and all the collisions of this conflict type involved
the vehicle reversing.
Table 4-23: The most frequent conflicts by vehicle type
Conflict Car/taxi
Bus/ Coach HGV LGV
Motorcycle
Total
N1 Vehicle going ahead, pedestrian left side
41 16 21 4 4 86
N2 Vehicle going ahead, pedestrian right side
44 5 3 5 10 67
P3 Walking on footpath 9 3 0 0 0 12
N3 Vehicle left turn,
pedestrian left side 1 5 2 1 0 9
N7 Manoeuvring vehicle 6 0 0 1 0 7
N6 Vehicle right turn,
pedestrian left side 3 1 0 1 0 5
Q8 Miscellaneous other 3 1 0 0 0 4
P7 Pedestrian other 2 0 1 0 0 3
N4 Vehicle right turn, pedestrian right side
1 1 0 0 0 2
P2 Walking facing traffic 0 1 0 0 0 1
P5 Attending to vehicle 1 0 0 0 0 1
Total vehicles that struck the pedestrian 111 33 27 12 14 197
Table 4-24 presents the most common conflicts by pedestrian age. Note that this table
shows the total number of fatalities (198) whereas the previous tables count the number
of collisions (197) this is because one collision resulted in two pedestrian fatalities and
both have been included. For all age groups the most common conflicts involved the
pedestrian crossing the road whilst the vehicle was travelling straight ahead. For the
under 16 and 16-24 age groups, the pedestrian at the vehicle‟s right side was more
common, however, for the 25-59 and 60+ age groups the pedestrian was more
commonly approached from the vehicle‟s left side.

Pedestrian fatalities in London
30
Table 4-24: The most frequent conflicts by pedestrian age group
Conflict under 16 16-24 25-59 60+ Total
N1 Vehicle going ahead, pedestrian left side
5 8 38 35 86
N2 Vehicle going ahead,
pedestrian right side 10 12 21 24 67
P3 Walking on footpath 1 1 8 2 12
N3 Vehicle left turn, pedestrian left side
0 1 2 6 9
N7 Manoeuvring vehicle 0 0 0 7 7
N6 Vehicle right turn, pedestrian left side
0 0 0 5 5
Q8 Other 1 1 1 1 4
P7 Other 0 0 2 1 3
N4 Vehicle right turn,
pedestrian right side 1 0 0 1 2
P2 Walking facing traffic 0 0 1 0 1
P5 Attending to vehicle 0 1 1 0 2
Total fatalities 18 24 74 82 198
4.2.2 Pedestrian manoeuvre and road position
The pedestrian manoeuvre and speed at the time of the event was recorded and this is
shown in Table 4-25. In total 49 pedestrians were crossing the road using a pedestrian
facility while 37 pedestrians had chosen to cross the road without using a crossing
facility despite the presence of one within 50m of the collision site. These collisions are
discussed in more detail in section 5.2.9. Fifteen of the pedestrians were on the
footway/verge at the time of the collision; the vehicle mounted the footpath in 12 cases
(conflict P3), the pedestrian was attending to their vehicle in two collisions (conflict P5)
and one collision involved the vehicle knocking down a tree (Q8). These collisions are
discussed in detail in section 5.2.10.
Whilst the majority of the pedestrians were walking across the road, 34 pedestrians were
running. It was known that of the 34 running pedestrians, 11 were within 30m of a bus
stop although the evidence suggested that only two were likely to have been running to
catch a bus. Collisions involving buses/coaches are discussed in more detail in section
5.2.3.

Pedestrian fatalities in London
31
Table 4-25: Pedestrian manoeuvre by pedestrian speed
Pedestrian Manoeuvre Walking Running Stationary Unknown Total
In carriageway - crossing elsewhere 45 15 7 14 81
In carriageway - crossing at a facility 38 7 2 2 49
In carriageway - crossing within 50m of a facility 23 11 1 2 37
On footway or verge 8 0 4 3 15
In carriageway - not crossing/playing 2 1 2 0 5
On refuge / central island / central reservation 0 0 2 0 2
Unknown or other 3 0 2 4 9
Total fatalities 119 34 20 25 198
The majority of the pedestrians were upright (standing) at the time of the collision as
shown in Table 4-26. It was known that 14 pedestrians accidently stumbled/fell and of
these nine were impaired by alcohol (three also with drugs).
Table 4-26: Pedestrian stance
Stance Total
Accidentally stumbled/fell 14
Lying in road 1
In pushchair/pram 2
Other 1
Standing 169
Unknown 11
Total fatalities 198
4.2.3 Pedestrian’s line of vision
The pedestrian‟s line of vision was affected in 39 collisions and the detail is shown in
Table 4-27. Parked vehicles obscured the vision at the time of the event for the majority
(17 pedestrians) and slow moving vehicles for six of the fatalities. In fact pedestrians
crossing the road masked by vehicles was a likely/possible cause in 21 collisions (Section
4.2.8 discusses contributory factors in more detail).

Pedestrian fatalities in London
32
Table 4-27: pedestrian line of vision affected by an object
Line of vision affected by: Total
Bus at bus stop 2
Parked vehicle 17
Slow moving vehicle 6
Other vehicle 6
Street furniture 2
Vegetation 1
Road layout 1
Rain, sleet, snow or fog 4
Not affected 112
Unknown 47
Total 198
Two pedestrian‟s had their vision obscured by hoods.
4.2.4 Pedestrian’s first point of impact with the vehicle
Table 4-28 shows the part of the vehicle the pedestrian came into contact with first. This
is important when looking at the type of injuries the pedestrian sustained (described in
Section 4.3.3). The majority of collisions involved the pedestrian coming into contact
with the front of the vehicle. In the case of HGVs the majority of pedestrians were in
front of the vehicle at the time of the collision.
Table 4-28: First point of impact with the vehicle
First point of impact Car/taxi Bus/coach HGV LGV Motorcycle Total
Front-nearside 42 15 7 3 3 70
Front 23 9 11 0 7 50
Front-offside 29 3 4 4 1 41
Rear-nearside 1 3 4 1 0 9
Nearside 1 1 1 1 3 7
Rear 5 0 0 1 0 6
Offside 3 1 0 0 0 4
Rear-offside 1 0 0 1 0 2
Underneath 1 1 0 0 0 2
Top 1 0 0 0 0 1
Unknown 4 0 0 1 0 5
Total vehicles 111 33 27 12 14 197
4.2.5 Driver manoeuvre
The manoeuvre or movement the vehicle was undertaking when it collided with the
pedestrian is shown in Table 4-29. The majority of the vehicles were going straight

Pedestrian fatalities in London
33
ahead at the time of the collision (134). All vehicles that were reversing were cars and
all pedestrians hit by reversing vehicles were adults (seven were aged over 70 years).
Over half of the HGVs were moving off when they made contact with the pedestrians
(15). Collisions involving HGVs are discussed in more detail in section 5.2.4.
Table 4-29: Vehicle manoeuvre by vehicle type
Vehicle manoeuvre Car/taxi Bus/coach HGV LGV Motorcycle Total
vehicles
Going ahead 87 17 10 6 14 134
Moving off 2 5 15 1 0 23
Turning left 3 5 1 1 0 10
Turning right 5 3 0 1 0 9
Reversing 7 0 0 1 0 8
Overtaking 2 1 0 2 0 5
Changing lane 3 0 0 0 0 3
Slowing or stopping 1 1 0 0 0 2
Waiting to turn/go ahead 0 1 1 0 0 2
Parked 1 0 0 0 0 1
Total vehicles 111 33 27 12 14 197
For completeness Table 4-30 presents the vehicle manoeuvre by conflict type. The seven
manoeuvring conflicts (N7) all involved a reversing vehicle and one pedestrian on the footpath was knocked over by a reversing vehicle.
Table 4-30: Vehicle manoeuvre by conflict type
Vehicle manoeuvre N1/N2 N3/N5 N4/N6 N7 P3 P2/P5 P8/Q8 Total
Going ahead 122 0 0 0 9 0 3 134
Moving off 22 0 0 0 0 0 1 23
Turning left 0 8 0 0 1 0 1 10
Turning right 0 0 7 0 1 0 1 9
Reversing 0 0 0 7 1 0 0 8
Overtaking 5 0 0 0 0 0 0 5
Changing lane 3 0 0 0 0 0 0 3
Slowing or stopping 1 0 0 0 0 1 0 2
Waiting to turn/go ahead 0 1 0 0 0 0 1 2
Parked 0 0 0 0 0 1 0 1
Total vehicles 153 9 7 7 12 2 7 197
4.2.6 Drivers’ line of vision
The driver‟s line of vision was known to be affected in 69 collisions and the detail is
shown in Table 4-31. The most commonly recorded was „vehicle‟s blind spot‟, recorded
for 20 drivers, including 13 HGV drivers. Parked vehicles obscured the vision for 19
drivers and slow moving and other vehicles for 15 drivers.

Pedestrian fatalities in London
34
It was known whether the driver‟s vision was obscured by an item of clothing such as
sunglasses, sun visor, hood, scarf etc. for 169 drivers and of these eight had their vision
obscured.
Table 4-31: Driver’s line of vision affected by vehicle type
Driver’s line of vision affected
by: Car/taxi Bus/coach HGV LGV Motorcycle Total
Not affected 63 18 11 5 7 104
Parked vehicle 12 3 0 2 2 19
Slow moving vehicle 4 0 0 0 1 5
Other vehicle 4 3 1 0 2 10
Vehicle blind spot 3 4 13 0 0 20
Dazzling sun 1 0 0 2 1 4
Dirty windscreen 0 0 0 1 0 1
Street furniture 2 2 0 0 1 5
Vegetation 1 0 0 0 0 1
Rain, sleet, snow or fog 3 1 0 0 0 4
Unknown 18 2 2 2 0 24
Total drivers of the vehicles
that struck the pedestrian 111 33 27 12 14 197
4.2.7 Drivers’ and riders’ compliance with the law and Highway Code
The content analysis of the files involved gathering evidence as to whether the
driver/rider of the vehicle was compliant with the traffic law and Highway Code. It was
found that whilst 107 drivers/riders were compliant with both the law and the Highway
Code, 44 drivers/riders were not compliant with the law and 53 were not compliant with
the Highway Code at the time of the collision.
Insurance information was known for 144 of the 197 drivers/riders and of these
drivers/riders 14 did not have the appropriate insurance. Eight drivers/riders did not
have the correct driving licence of which two were driving whilst disqualified and one
driver was underage. Four drivers/riders were possibly using a mobile phone and six
were known to be impaired by drugs and/or alcohol. The speed of the vehicle was known
in 122 cases, and 23 drivers/riders were travelling at a speed greater than the posted
speed limit (these collisions are considered in more detail in Section 5.2.7). Twenty-four
vehicles failed to stop following the collision (these collisions area analysed in more
detail in Section 4.3.5). One vehicle was not in a roadworthy condition and one vehicle
was known not to have a valid MOT. One car driver drove through a red light at a
pedestrian crossing and one car driver drove through the amber flashing light at a
crossing. One car driver was not wearing the appropriate glasses at the time of the
collision.
Convictions of the drivers as a result of the collision are discussed in Section 4.3.4.
4.2.8 Contributory factors
A contributory factor in a road collision is a key action and/or failure that, in the
reporting officer‟s opinion led to the collision. Each collision is assigned up to six

Pedestrian fatalities in London
35
contributory factors, and they are based on the researcher‟s opinion after a detailed
examination of the police file. A contributory factor is an indication of why the collision
occurred rather than who was to blame. As part of the content analysis the researchers
considered the evidence contained in the files and assigned up to six contributory factors
to any of the vehicles, drivers, riders or casualties involved, based on the STATS19
system. The contributory factors were considered without referring to those in the file or
in ACCSTATS.
The collisions were classified according to the attribution of factors between the
pedestrian and vehicle, driver or rider. This suggests whose actions or behaviours
contributed to the collision. Although doesn‟t necessarily imply who was to blame:
Contributory factors assigned to the pedestrian only;
Contributory factors assigned to the vehicle or driver/rider only;
Contributory factors assigned to both the pedestrian and the vehicle or
driver/rider.
Thirty-eight percent of collisions had factors attributed to both the pedestrian and the
vehicle or driver/rider, 37% of collisions only had factors attributed to the pedestrian and
26% had factors attributed to the vehicle or driver only.
Table 4-32 shows this attribution by pedestrian age group. Although in some cases the
number of collisions is small, generally the younger age groups (0-15 and 16-24) had a
higher proportion of collisions with pedestrian factors only and a lower proportion with
vehicle factors only. This trend was reversed for the oldest age group (60+).
Table 4-32: Number of collisions by attribution of contributory factors by
pedestrian age group
Attribution of contributory factors
0-15 16-24 25-29 60+ Total
Pedestrian factors only 8 11 31 22 72
Vehicle or driver/rider factors only 3 3 18 27 51
Both pedestrian and
vehicle/driver/rider factors
7 9 25 33 74
Total 18 23 74 82 197
Table 4-33 shows the attribution of contributory factor by the type of vehicle which
struck the pedestrian. HGVs and motorcycles showed a different pattern to the other
vehicle types; in these collisions it was less common for only the vehicle/driver/rider to
have contributory factors and more common for the pedestrian only to have contributory
factors. Collisions involving a bus/coach or cars were more commonly attributed
vehicle/driver/rider factors only than the other vehicle types.

Pedestrian fatalities in London
36
Table 4-33: Number of collisions by attribution of contributory factors by
vehicle type
Attribution of contributory factors
Motorcycle Car Bus/Coach LGV HGV Total
Pedestrian factors only 6 40 11 4 11 72
Vehicle or driver/rider factors only 2 31 11 3 4 51
Both pedestrian and
vehicle/driver/rider factors 6 40 11 5 12 74
Total 14 111 33 12 27 197
There are 76 different contributory factors that can be assigned to a collision (see the
contributory factor coding guidelines in Appendix B.8). Of these 76 factors, ten are for
pedestrians only (factors 801 to 810) and a pedestrian can be coded with up to six
factors. Table 4-34 shows the number of pedestrians with each of these factors by
pedestrian age group.
Table 4-34: Pedestrian contributory factors attributed by pedestrian age group
Contributory factor 0-15 16-24 25-59 60+ Total
801 Crossing road masked by stationary or parked vehicle
4 2 7 8 21
802 Failed to look properly 14 10 38 34 96
803 Failed to judge vehicle‟s path or speed 3 6 14 9 32
804 Wrong use of pedestrian crossing facility 3 3 10 13 29
805 Dangerous action in carriageway 1 1 2 4
806 Impaired by alcohol 0 8 29 5 42
807 Impaired by drugs 0 2 6 8
808 Careless, reckless or in a hurry 1 3 4 4 12
809 Pedestrian wearing dark clothing at night 1 1 1 1 4
810 Disability or illness, mental or physical 0 2 2 4 8
Any pedestrian factor 15 30 57 55 147
No pedestrian factors 3 4 17 27 51
Total 18 24 74 82 198
Across all age groups, the most commonly recorded contributory factor for pedestrians
was „failed to look properly‟, with 96 pedestrians (49%) being assigned this factor. For
children (0-15 age group), the occurrence of this was factor was higher (14 out of 18).
„Impaired by alcohol‟ was the second most commonly recorded factor for the 25-59 age
group, recorded for 39% of pedestrians in this age group. Pedestrians impaired by
alcohol are considered in more detail in Section 5.2.8. The second most common factor
for the 60+ age group was „wrong use of pedestrian crossing facility‟.

Pedestrian fatalities in London
37
There are 66 contributory factors on the coding guidelines (see Appendix B.8) that can
be attributed to vehicles or drivers/riders. Table 4-35 shows the ten contributory factors
reported which are most frequently attributed to the vehicle/driver/rider which struck the
pedestrian.
Table 4-35: The ten most frequently recorded contributory factors attributed to
the vehicle/driver/rider by vehicle type
Contributory factor Car Bus/Coach LGV HGV Motorcycle Total
405 Failed to look properly 23 6 5 3 3 40
306 Exceeding speed limit 20 0 1 1 2 24
710 Vision affected by vehicle
blind spot
2 3 1 12 0 18
701 Vision affected by stationary or parked
vehicle
7 3 2 0 1 13
602 Careless, reckless or in a hurry
8 2 0 0 0 10
406 Failed to judge other
person‟s path or speed
5 3 1 0 1 10
410 Loss of control 8 2 0 0 0 10
501 Impaired by alcohol 6 1 0 0 0 7
509 Distraction in vehicle 3 3 0 0 0 6
304 Disobeyed pedestrian crossing facility
2 1 0 1 1 5
301 Disobeyed automatic traffic signal
5 0 0 0 0 5
607 Unfamiliar with model of vehicle
3 0 0 1 0 4
309 Vehicle travelling along pavement
4 0 0 0 0 4
Any vehicle/driver/rider factor 8 71 22 8 16 125
No vehicle/driver/rider factors 6 40 11 4 11 72
Total 111 33 12 27 14 197
The most commonly recorded contributory factor for the drivers or riders that struck the
pedestrian was „failed to look properly‟, followed by „exceeding the speed limit‟ and
„vision affected by blind spot‟ (see Table 4-35). For HGV drivers the most common factor
was „vision obscured by vehicle blind spot‟ and for car drivers, the second most common
factor was „exceeding speed limit‟, recorded for 20 out of 111 vehicles.
There were 74 collisions where both the pedestrian and the vehicle or driver/rider were
attributed contributory factors. The most common combination was both the pedestrian
and the vehicle driver/rider failing to look, recorded in 16 collisions (see Table 4-36).

Pedestrian fatalities in London
38
Table 4-36: The most frequent combinations of pedestrian and
vehicle/driver/rider factors
Pedestrian factor Vehicle/driver/rider factor Number of collisions
802 Failed to look properly 405 Failed to look properly 16
802 Failed to look properly 701 Vision obscured by stationary or parked vehicles
8
802 Failed to look properly 306 Exceeding speed limit 6
802 Failed to look properly 710 Vision obscured by vehicle blind spot
6
803 Failed to judge vehicle‟s path or speed
405 Failed to look properly 6
806 Impaired by alcohol 306 Exceeding speed limit 5
806 Impaired by alcohol 405 Failed to look properly 5
4.3 Post-event
This section describes the post-event, namely the injuries of the pedestrian and whether
there were any convictions of the other participants involved.
4.3.1 Pedestrian trajectory
Table 4-37 shows the trajectory of the pedestrian following the collision. The most
common trajectory was the pedestrian being knocked to the ground and not run over
(62). In total 56 pedestrians were run over (36 not thrown and run over, 12 thrown and
run over and 8 thrown unknown and run over).
Table 4-37: Pedestrian fatalities by trajectory
Pedestrian trajectory Total
Knocked to ground - not run over 62
Thrown over top of vehicle 19
Thrown/knocked forwards - then run over 12
Thrown/knocked to side of vehicle 35
Not thrown - run over 36
Throw unknown - run over 8
Throw unknown - not run over 2
Other 4
Unknown 20
Total fatalities 198
4.3.2 Impact with other objects
Table 4-38 shows whether the pedestrian impacted any objects following the collision
with the vehicle. In 161 collisions the pedestrian did not impact any other object. The
most common object was the kerb (9), followed by street furniture (7) and further
vehicles (5). Further impacts are likely to be associated with further injuries.

Pedestrian fatalities in London
39
Table 4-38: Impact with other objects
Impact with object Total
Nothing further 161
Unknown 15
Kerb 8
Street furniture 6
Further vehicle(s) 5
Tree 2
Kerb and street furniture 1
Total fatalities 198
4.3.3 The pedestrian’s injuries
The majority (115) of the pedestrians died at the scene of the collision, 37 died between
one and three days later, 26 died between four and ten days later and 14 died more
than ten days later.
The detailed injuries of the pedestrians were coded from the post mortem data in 50 of
the files, using the abbreviated injury scale (AIS). The scale uses a scoring system for
each body region, where zero is uninjured and six is the maximum. Although all of the
pedestrians in this study died as a result of their injuries, scores of three or above are
described as „life threatening‟. The injuries that were life-threatening can be used to
identify the body regions where the most serious injuries occurred.
Table 4-39 shows the number of pedestrians with „life-threatening‟ (AIS>=3) injuries to
each body part by age group. Since each pedestrian can have injuries to more than one
body part, the individual rows should not be summed.
Table 4-39: Injuries by body regions (with AIS >=3) and pedestrian age group
Body region with life threatening injury 0-15 16-24 25-59 60+ Total
Head 4 3 9 18 34
Thorax 2 3 10 16 31
Abdomen 0 1 0 3 4
Pelvis 0 1 1 3 5
Left lower limb 0 1 0 5 6
Right lower limb 0 0 2 4 6
Left upper limb 0 0 0 1 1
Right upper limb 0 0 0 1 1
Other 0 0 0 0 0
Any life threatening injury 4 4 13 28 49
No life threatening injuries (AIS <3) 0 0 0 1 1
Total 4 4 13 29 50
Note: „Any life threatening injury‟ gives the number of pedestrians that had a life threatening injury to any body regions. This is less than the sum of each column since each fatality can have life threatening injuries to multiple body regions.

Pedestrian fatalities in London
40
Head and thorax injuries were most common, with 34 and 31 fatalities with these life-
threatening injuries, respectively. There were 18 fatalities with both head and thorax
life-threatening injuries.
Table 4-40 shows the number of pedestrians by combination of life-threatening injuries.
Table 4-40: Number of pedestrians by combination of life-threatening injuries
Injury pattern Head Thorax Abdomen Pelvis Limb Other Total
Head 13 - - - - - 13
Head, Limb 2 - - - 2 - 2
Head, Abdomen 1 - 1 - - - 1
Head, Thorax 12 12 - - - - 12
Head, Thorax, Limb 4 4 - - 4 - 4
Head, Thorax, Pelvis 1 1 - 1 - 1
Head, Thorax, Abdomen 1 1 1 - - - 1
Thorax - 7 - - - - 7
Thorax, Limb - 2 - - 2 - 2
Thorax, Pelvis, Limb - 2 - 2 2 - 2
Thorax, Abdomen, Pelvis - 2 2 2 - - 2
Limb - - - - 2 - 2
Total 34 31 4 5 12 0 49
Note: This table does not include the pedestrian who was classed as having no life-threatening
injuries. This pedestrian was aged 89 and died due to multiple organ failure following surgery for a
fractured hip (AIS 2).
The most common injury was head only, accounting for 13 fatalities. There were 12
fatalities with life-threatening injuries to both the head and the thorax (only) and a
further six fatalities with head and thorax injuries in addition to other injuries. The
majority of limb injuries were in combination with other injuries, although there were
two pedestrians with limb injuries alone. There were five fatalities where the cause of
death described in the post mortem suggested that the death was due to complications
following treatment for their injuries.
The Injury Severity Score (ISS) is based on the AIS coding and is used to assess trauma
severity. The score is calculated as the sum of the squares of the highest three AIS
scores by body region, except where a body region scores has an AIS of 6, in which
case, the ISS is the maximum of 75. The maximum score of 75 (AIS 6 for at least one
body region or three AIS 5 scores) is often classed as „untreatable‟ or „unsurvivable‟. A
score of 15 and above is sometimes used to define „major trauma‟. Table 4-41 shows the
injury severity score for the 50 pedestrians by age group.
Table 4-41: Injury Severity Scores by pedestrian age group
Injury Severity Score 0-15 16-24 25-59 60+ Total
4-14 1 0 1 8 10
15-29 3 2 8 10 23
30-50 0 2 3 9 14
75 0 0 1 2 3
Total 4 4 13 29 50

Pedestrian fatalities in London
41
All but ten of the pedestrian were classed as „major trauma‟ (ISS score of at least 15).
There were three fatalities (all adults) classed as „unsurvivable‟ (ISS score of 75).
4.3.4 Convictions of the drivers of the vehicles that came into contact with
the pedestrians
In total 68 of the 197 drivers of the vehicles that struck the pedestrian were convicted of
a driving offence as a result of the collision. The majority of the drivers were convicted of
one offence (52), 11 drivers were convicted of two offences and five drivers were
convicted of three or more offences. Almost half of the car and motorcycle drivers/riders
were convicted of a driving offence following the collision compared with just under a
fifth of HGV and bus/coach drivers (43% compared to 18%).
Table 4-42 presents the type of convictions the drivers/riders received following the
collision. Note the totals do not add to 68 as some drivers received more than one
conviction.
Table 4-42: Type of conviction the drivers/riders received by vehicle type
Conviction type Car/taxi Bus/coach HGV LGV Motorcycle Total
Drink driving 4 0 0 0 0 4
Speeding 3 0 0 0 2 5
Careless driving 27 5 4 2 2 40
Dangerous driving 19 1 0 1 2 23
Construction and use 2 0 0 0 0 2
Other motoring offences 13 2 1 0 1 17
Total number of drivers/riders convicted 48 6 5 3 6 68
Note: „Total number of drivers/riders convicted‟ gives the number of drivers/riders who were
convicted for at least one offence. This is greater than the sum of the individual conviction types since some drivers/riders were convicted of more than one offence.
4.3.5 Vehicles that failed to stop
There were 24 vehicles that struck the pedestrian and failed to stop following the
collision. In all cases the vehicle and driver was later traced. .
Table 4-43 shows the vehicles that failed to stop by vehicle type.
Table 4-43: Vehicles which failed to stop following collision
Vehicle type Total
Bus/Coach 1
Car 19
HGV 4
Total 24

Pedestrian fatalities in London
42
The majority of the collisions where a vehicle failed to stop occurred on A-roads (21).
The most common period for these collisions was between 6pm and 6am on a Friday,
Saturday or Sunday (14 collisions), as shown in Table 5-44.
Table 4-44: Vehicles which failed to stop following collision
Time period Friday-Sunday Monday-Thursday Total
6am-6pm 3 4 7
6pm-6am 14 3 17
Total 17 7 24
Note that each time group includes times up to, but not including the end of the range listed, for example, 6pm is included in the 6pm-6am group.
Table 4-45 shows the convictions of the drivers in hit and run collisions following the
collision. In total, 14 drivers were convicted of a driving offence, most commonly
„dangerous driving‟. Six of the cars were exceeding the speed limit, although none of
these drivers were convicted for a speeding offence.
Table 4-45: Convictions of drivers/riders of vehicles which failed to stop
following collision
Conviction following collision Total
Dangerous driving 8
Careless driving 7
Drink driving 1
Construction and use 1
Speeding 0
Other 6
Any conviction 14
No convictions 10
Total 24
Note: „Any conviction‟ gives the number of drivers/riders who were convicted for at least one
offence. This is greater than the sum of the individual conviction types since some drivers/riders were convicted of more than one offence.
Pedestrian fatalities in London
43
5 Interventions for pedestrian safety
The overall aim of this study is to provide a better understanding of how fatal pedestrian
collisions in London occur and could be prevented. Two approaches have been taken to
describe the interventions identified:
Countermeasures: A „top-down‟ summary of the overall countermeasures for all
the collisions investigated by the study (Section 5.1); and
In-depth analysis of fatality groups: A breakdown of the different collision
types or groups that were identified as being relatively common for the
pedestrian fatalities (Section 5.2).
The „top-down‟ approach provides a broad overview of the common countermeasures
identified, which by their nature are intrinsically linked to the contributory factors.
Because collisions are complex events, the in-depth analysis of fatality groups provides
more contextual descriptions of their characteristics. The groups described are not
mutually exclusive, and the overlaps are explicitly summarised in Table 5-5.
5.1 Countermeasures
Countermeasures aimed at preventing the collision (primary) and aimed at reducing the
severity (secondary) were proposed for 195 of the 197 collisions based on evidence in
the fatal files3. The amount of evidence in each file varied and so an indication of
whether the countermeasure was „likely, „probably‟ or „maybe‟ was also given. The
interventions have been grouped into three categories; those related to engineering,
education (including training and publicity) and enforcement. A list of countermeasures
was based on the literature review and expert knowledge before the files were coded
and can be found in Appendix C.
Collisions and their outcome are determined by multiple factors. The proposed
countermeasures may eliminate one factor but may not always be effective in preventing
the collision. The effectiveness of each countermeasure has not been assessed.
In Table 5-1, the countermeasures are grouped by type. That is, if a collision had two
countermeasures of the same type (for example, pedestrian education), it is only
counted once in Table 5-1. Overall, primary countermeasures were identified more
frequently than secondary countermeasures. The most frequent primary
countermeasures were educational measures aimed at the pedestrian, followed by
vehicle engineering and driver education measures.
3 For two collisions, no countermeasures could be identified. One of these collisions had an unknown cause and
there was not enough evidence to identify a countermeasure (pedestrians fell into road for unknown reasons).
The other collision occurred when the pedestrian tried to force entry to HGV and was run over by the HGV.

Pedestrian fatalities in London
44
Table 5-1: Number of collisions with each countermeasure type
Countermeasure type Number of collisions
Primary Engineering - environment 46
Engineering - vehicle 96
Education - pedestrian 114
Education - drivers 89
Enforcement 36
Secondary Engineering - environment 3
Engineering - vehicle 7
Education - drivers 5
Table 5-2 shows the number of collisions by the primary countermeasures in each
category and whether they were coded as likely, probably or maybe. The
countermeasure types in Table 5-2 sum to greater than the totals given in Table 5-1
because some collisions had multiple countermeasures of the same type.
The most commonly recorded countermeasure was „improved pedestrian awareness of
other road users‟, recorded for 77 collisions (39% of cases). In order for this
countermeasure to be effective, it needs to be targeted at appropriate groups, and the
education needs to be effective at improving awareness.
„Improving driver awareness of pedestrians and speed‟ was recorded in 70 collisions, this
reflects the number of vehicles that were speeding, and also additional collisions where
although the vehicle was not speeding, a reduced speed may have helped prevent the
collision.
The most common vehicle engineering primary countermeasures were automated
emergency brake systems. This intervention would either alert the driver to the presence
of the pedestrian and may allow more time for avoidance action, or some systems would
automatically apply the brakes to reduce the collision speed if the driver failed to do so.

Pedestrian fatalities in London
45
Table 5-2: Number of collisions with each primary countermeasure
Type Countermeasure description Likely Probably Maybe Total
Engineering - road
103 Removal of on-street parking 0 6 3 9
104 Reduce speed limit/20mph zones 0 1 1 2
105 Provide traffic calming 0 1 4 5
106 The use of advanced stop signs at pedestrian crossings
0 1 0 1
108 (Other) improvements to existing
pedestrian crossing facilities
1 2 4 7
109 Provide or re-site pedestrian crossings 1 9 9 19
110 Provide a central refuge 0 1 2 3
111 Measures at signal-controlled junctions 0 1 0 1
112 Improve existing street lighting 0 0 1 1
113 Install street lighting 0 1 0 1
114 Introduce guard railings 2 2 4
Engineering - vehicle
121 Improve forward, rear and side vision of the vehicle - mirrors
2 12 7 21
122 Improve forward, rear and side vision of
the vehicle sensors
10 15 3 28
123 Improve forward, rear and side vision of the vehicle CCTV
1 11 5 17
124 Automated emergency brake systems 1 15 44 60
126 Intelligent speed adaptation 1 2 11 14
Education - pedestrian
131 Improved pedestrian awareness of other road users
3 30 44 77
132 Highlight dangers of crossing road whilst distracted
0 2 2 4
133 Improved pedestrian conspicuity 0 1 9 10
134 Highlight dangers of pedestrians impaired by alcohol or drugs
0 9 38 47
Education –
drivers/riders
141 Improve driver awareness of pedestrians
and speed
1 7 62 70
142 Work related road safety training 0 1 21 22
143 Roadworthiness of vehicle 0 5 5
Enforcement 151 Speed enforcement 1 4 23 28
152 Drinking and driving 3 3 6
153 Driving/riding without a licence/uninsured 0 0 2 2
154 General traffic law enforcement 0 1 7 8
Secondary countermeasures that were recorded are shown in Table 5-3. The most
commonly recorded secondary countermeasure was „pop up bonnets and improved
bumper design, recorded in 6 collisions; far fewer than many of the primary
countermeasures above.

Pedestrian fatalities in London
46
Table 5-3: Secondary countermeasures
Type Code Description Likely Probably Maybe Total
Engineering – road
211 Traffic calming interventions targeted at reducing vehicle speeds
0 2 2 4
Engineering
- vehicle
221 Improved side guards on heavy goods
vehicles
0 0 1 1
222 Vehicle design standards 0 0 1 1
223 Pop up bonnets and improved bumper
design
0 0 6 6
Education - drivers
241 Reducing speed 0 1 2 3
242 Ensuring good road worthiness of
vehicle
0 0 2 2
The countermeasures recorded for various groups of fatalities are considered in the next
section.
5.2 In-depth analysis of fatality groups
5.2.1 Introduction
This section identifies the interactions between the pedestrian, the vehicle and the
environment for subsets of the sample along with the appropriate countermeasures.
These subsets were identified by experts as part of the analysis as being common
groups, or groups that are of special interest. The subsets overlap and individual
collisions may be included in more than one subset. For example an elderly pedestrian
having been struck by an HGV will be included in both the „collisions with HGVs‟ subset
and the „elderly‟ subset.
Table 5-4 gives a summary of the collision types considered, the definitions used and the
number of pedestrian fatalities in each type.

Pedestrian fatalities in London
47
Table 5-4: Collision types, definitions and number of casualties
Collision subset Definition Number of pedestrian fatalities in
sample
Details given in section
Collisions with motorcycles Pedestrian hit by motorcycle 14 5.2.2
Collisions with bus/coach Pedestrian hit by bus or coach 33 5.2.3
Collisions with HGV Pedestrian hit by HGV 27 5.2.4
Children Pedestrians aged less than 16 18 5.2.5
Elderly Pedestrians aged 80 or over 41 5.2.6
Speeding vehicles Vehicles which hit a pedestrian which
either: had a speeding conviction following the collision, had „exceeding speed limit‟ as a contributory factor or were estimated to be travelling above the speed limit.
31 5.2.7
Alcohol-impaired pedestrians Pedestrians with „impaired by alcohol‟ 46 5.2.8
Fail to stop vehicles vehicles which hit a pedestrian which failed to stop at the scene
24 4.3.5
Pedestrians at crossings The collision occurred while the pedestrian was using a crossing facility
49 5.2.9.1
Pedestrians near crossings The collision occurred when the pedestrian
was crossing the road within 50m of a pedestrian facility
37 5.2.9.2
Pedestrians on the pavement The vehicle hit the pedestrian while they
were on the footpath
12 5.2.10
Table 5-5 gives the number of pedestrian fatalities by combination of collision type.
These are explored in more detail in the sections relating to each collision type.

Pedestrian fatalities in London
48
Table 5-5: Number of pedestrian fatalities by combination of collision type
Mo
torcycle
s
Bu
s/
co
ach
HG
V
Ch
ild
ren
Eld
erly
Sp
eed
ing
Alc
oh
ol
Failed
to
sto
p
Pavem
en
t
At
cro
ssin
g
Near c
ro
ssin
g
To
tal
Motorcycles 14 - - 0 3 3 3 0 0 6 0 14
Bus/coach - 33 - 2 4 0 10 1 3 9 7 33
HGV - - 27 0 10 1 4 4 0 4 11 27
Children 0 2 0 18 - 2 0 2 1 3 2 18
Elderly 3 4 10 - 41 2 1 4 2 11 10 41
Speeding 3 0 1 2 2 32 5 6 3 11 4 32
Alcohol 3 10 4 0 1 5 46 10 0 6 15 46
Failed to stop 0 1 4 2 4 6 10 24 1 5 6 24
Pavement 0 3 0 1 2 3 0 1 12 - - 12
At crossing 6 9 4 3 11 11 6 5 - 49 - 49
Near crossing 0 7 11 2 10 4 15 6 - - 37 37
Total 14 33 27 18 41 32 46 24 12 49 37 198
5.2.2 Collisions with motorcycles
5.2.2.1 Who was involved?
There were 14 collisions involving a motorcycle (14 fatalities), six of the pedestrians
were female and eight were male. Almost half of the pedestrians were aged over 70
years but it was unknown if any of the older pedestrians had mobility issues. Three
pedestrians were impaired by alcohol (aged between 30-59 years) and none were
impaired by drugs.
Table 5-6: The age of the pedestrian fatalities in collisions with motorcycles
Age group Total Impaired with alcohol
Under 16 0 0
16-24 1 0
25-29 0 0
30-39 1 1
40-49 2 0
50-59 3 2
60-69 1 0
70+ 6 0
Total 14 3
Thirteen of the motorcycle riders were male and one was female. Table 5-7 shows the
age groups of the riders; all were aged over 25 years. Eleven of the riders held a full
licence, six of which had held it for more than nine years (one for one year, and four for

Pedestrian fatalities in London
49
an unknown length of time). One rider did not hold a licence because of a previous
disqualification and one rider held a provisional licence. None of the riders were impaired
by alcohol or drugs. Two riders had previous driving offences and both were breaking the
law in this collision also (one riding whilst disqualified and one was exceeding the speed
limit).
Table 5-7: The age of the motorcycle riders in collisions with pedestrians
Age group Total
Under 16 0
16-24 0
25-29 2
30-39 6
40-49 3
50-59 2
60-69 1
70+ 0
Total 14
5.2.2.2 Where and when?
All the roads where these collisions occurred had a posted speed limit of 30mph; ten
collisions occurred on A-roads, one on a B-road, two on C-roads and one on an
unclassified road. It was known that in nine of the locations the motorcyclist was not
travelling in a bus lane (unknown if there was a bus lane at five locations). Nine of the
collisions occurred at a crossroads, T or staggered junction.
All the collisions took place between 6am and 9pm, five of which were in the dark. Wet
roads that retain surface water can increase stopping distances or cause instability for
motorcycles. However, thirteen of these collisions were in fine weather conditions (one in
the rain) and the road surface was most commonly dry. It was wet/damp in one
collision. High friction surfacing was present in one location. No oil/diesel spillages,
ironworks, potholes or debris were found at these collision locations.
5.2.2.3 What happened – the event
Table 4-23 shows the types of conflicts between the motorcycles and pedestrians. All the
motorcycles were going ahead and one was known to be filtering. Two riders were
known to be exceeding the speed limit at the time of the collision (one in excess of
50mph in a 30mph speed limit).
Six pedestrians were crossing at a facility (five against the lights) at the time of the
collision. One rider was speeding and one rider was dazzled by the low sun.
Eight pedestrians were crossing the road where there was no pedestrian crossing facility
to use within 50 metres. One of these pedestrians was reading a newspaper as they
crossed the road. Of these eight collisions, the vision of five riders was obscured; 2 by
parked cars, 2 by slow moving vehicles and 1 by street furniture.
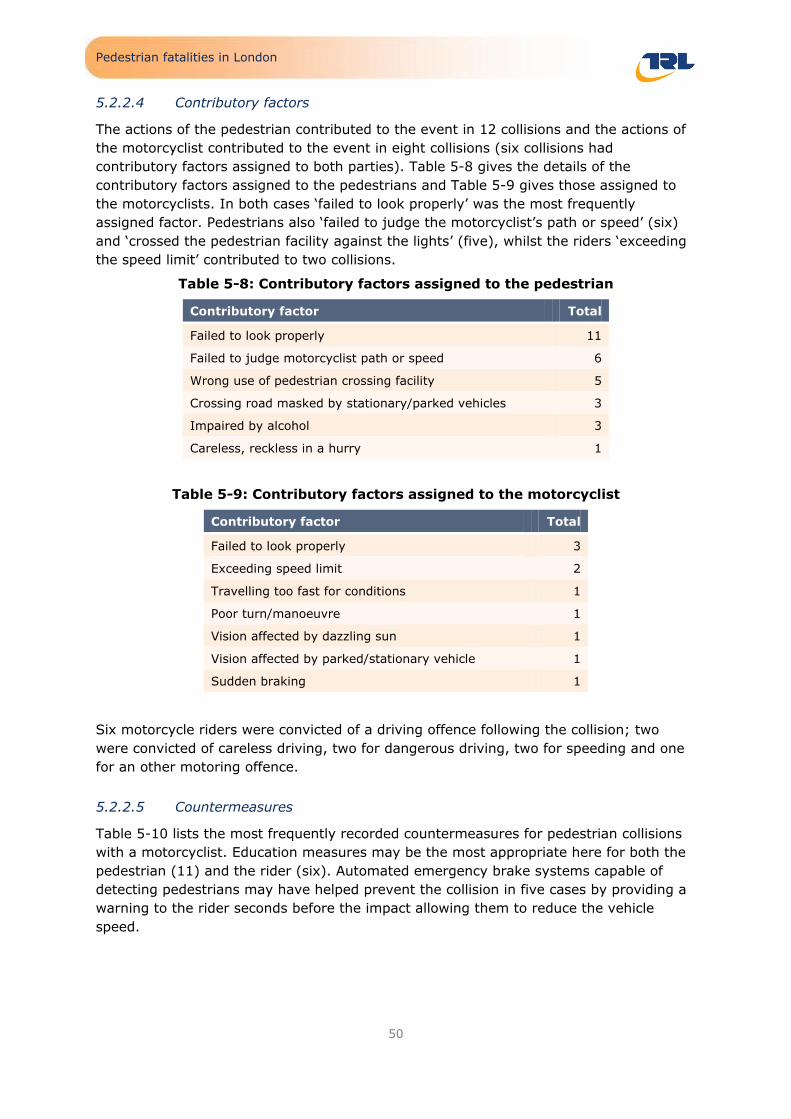
Pedestrian fatalities in London
50
5.2.2.4 Contributory factors
The actions of the pedestrian contributed to the event in 12 collisions and the actions of
the motorcyclist contributed to the event in eight collisions (six collisions had
contributory factors assigned to both parties). Table 5-8 gives the details of the
contributory factors assigned to the pedestrians and Table 5-9 gives those assigned to
the motorcyclists. In both cases „failed to look properly‟ was the most frequently
assigned factor. Pedestrians also „failed to judge the motorcyclist‟s path or speed‟ (six)
and „crossed the pedestrian facility against the lights‟ (five), whilst the riders „exceeding
the speed limit‟ contributed to two collisions.
Table 5-8: Contributory factors assigned to the pedestrian
Contributory factor Total
Failed to look properly 11
Failed to judge motorcyclist path or speed 6
Wrong use of pedestrian crossing facility 5
Crossing road masked by stationary/parked vehicles 3
Impaired by alcohol 3
Careless, reckless in a hurry 1
Table 5-9: Contributory factors assigned to the motorcyclist
Contributory factor Total
Failed to look properly 3
Exceeding speed limit 2
Travelling too fast for conditions 1
Poor turn/manoeuvre 1
Vision affected by dazzling sun 1
Vision affected by parked/stationary vehicle 1
Sudden braking 1
Six motorcycle riders were convicted of a driving offence following the collision; two
were convicted of careless driving, two for dangerous driving, two for speeding and one
for an other motoring offence.
5.2.2.5 Countermeasures
Table 5-10 lists the most frequently recorded countermeasures for pedestrian collisions
with a motorcyclist. Education measures may be the most appropriate here for both the
pedestrian (11) and the rider (six). Automated emergency brake systems capable of
detecting pedestrians may have helped prevent the collision in five cases by providing a
warning to the rider seconds before the impact allowing them to reduce the vehicle
speed.

Pedestrian fatalities in London
51
Table 5-10: The most frequently recorded countermeasures for pedestrian
collisions with a motorcyclist
Counter measure Likely Probably Maybe Total
131 Improve pedestrian awareness of other road users 1 3 7 11
141 Improve driver awareness of pedestrians and speed 0 0 6 6
124 Automated emergency brake systems 0 1 4 5
134 Highlight the dangers of pedestrians impaired by
alcohol or drugs 0 0 3 3
133 Improved pedestrian conspicuity 0 0 2 2
151 General enforcement 0 0 2 2
126 Intelligent speed adaptation 0 1 1 2
5.2.3 Pedestrians involved in collisions with buses/coaches
5.2.3.1 Who was involved?
There were 33 pedestrian fatalities involved in a collision with a bus/coach, 16 were
female and 17 were male. One-third of the pedestrians were aged over 60 years (12)
and one-third were aged between 30 and 49 years (12). Ten of the pedestrians were
impaired by alcohol (and four of these were also impaired with drugs). The majority of
impaired pedestrians were aged 30-39 years, shown in Table 5-11.
Table 5-11: Pedestrian fatalities in collisions with buses or coaches
Age group Total Impaired with alcohol
Under 16 2 0
16-24 3 1
25-29 2 0
30-39 9 7
40-49 3 2
50-59 2 0
60-69 5 0
70+ 7 0
Total 33 10
Three pedestrians had mobility difficulties; two were using walking sticks and one was on
crutches although these were not the pedestrians who stumbled and fell. Four out of the
six pedestrians who stumbled and fell were impaired by alcohol.
Five pedestrians were part of a group and 26 were alone (unknown for 2). None of the
pedestrians were using mobile phones or headphones, none were reading (e.g.
maps/books etc) and none were eating or drinking. Three pedestrians were talking to
other pedestrians, two were yelling across the road and four were following other people
at the time of the collision.
It was not possible to determine whether the vehicles were buses or coaches because
the ACCSTATS uses one category for both buses and coaches and it was unclear in the
fatal files. Thirty of the bus drivers were male and three were female. The majority of

Pedestrian fatalities in London
52
drivers were aged 40-49 years. Twenty five drivers were London residents and three
were from other UK regions (unknown for five).
Table 5-12: Age of bus driver
Age group Male Female Total
16-24 1 0 1
25-29 1 0 1
30-39 7 1 7
40-49 11 2 13
50-59 5 0 5
60-69 4 0 4
Unknown 1 0 1
Total 30 3 33
The length of time that bus drivers had held their Public Service Vehicle (PSV) licence
was known in 19 cases, shown in Table 5-13. All drivers had held them longer than 1
year and 12 drivers had held it longer than 5 years. None of the drivers were impaired
by alcohol or drugs. One driver suffered a medical attack at the time of the collision.
Four drivers were distracted at the time of the collision: one by a passenger, one by a
coughing episode, one driver had a newspaper on the steering wheel, and one where a
driver was distracted by people outside the vehicle.
Table 5-13: Length of time bus drivers held their PSV licence
Number of years Total
1-2 years 4
3-4 years 3
5-10 years 7
Over 10 years 5
Unknown 14
Total 33
The types of mirrors fitted to the buses/coaches are shown in Table 5-14. In the majority
of cases the mirror configuration was not easily determined from the photographs and
evidence contained in the files.
Table 5-14: Mirrors fitted to buses/coaches
Type of mirror Fitted Not
fitted Not
known Total
Offside main mirror (class II) 12 21 33
Nearside main mirror (class II) 12 21 33
Offside wide angle mirror (class IV) 1 32 33
Nearside wide angle mirror (class IV) 2 31 33
Close proximity mirror (class V) 1 32 33
Front mirror (class VI) 4 29 33

Pedestrian fatalities in London
53
5.2.3.2 Where and when?
All the collisions, except one, were on 30mph roads, the majority being A-roads. The
traffic conditions at the time of the collision were described as being heavy in five cases,
light traffic in six and moderate in nine (13 unknown).
Table 5-15: Bus/coach involved pedestrian fatalities by road class and speed limit
Road class 30mph 40mph Total
A road 25 1 26
B road 1 0 1
C road 3 0 3
Unclassified 3 0 3
Total 32 1 33
Twelve of the collisions were in the evening or at night (between 7pm-5am) and there
were no clear differences between the days of the week. Eighteen were in the daylight
and 14 in darkness. Thirty-two of these collisions occurred in fine weather and one
occurred in the rain. Twenty-three of the collisions occurred at junctions. There was no
pedestrian crossing facility at 14 of the locations.
Around one-third of the collisions involving a bus/coach were within 20 metres of a bus
stop (ten fatalities). Of these it was thought that four pedestrians were intending to
catch the bus (two were observed by witnesses to be running across the road in an
attempt to catch the bus).
5.2.3.3 What happened?
Table 5-16 presents the type of collisions the buses/coaches and pedestrians were
involved in. The majority of conflicts involved the bus/coach travelling ahead with the
pedestrian crossing the road (21 fatalities). Of these eight were at a pedestrian crossing
(six were crossing against the lights), six were crossing within 50m of a pedestrian
crossing and six were crossing where no crossing facilities were present. There were
three fatalities where the pedestrian was on the footpath and the bus driver lost control
of their vehicle, mounted the footpath and struck the pedestrian. In these collisions, the
loss of control was caused by the bus drivers coughing, suffering a medical episode and
possibly reading a newspaper while driving.

Pedestrian fatalities in London
54
Table 5-16: Collision types by pedestrian manoeuvre
Conflict
In carriageway:
On
fo
otw
ay
Oth
er/
un
kn
ow
n
Total
At
ped
estr
ian
cro
ssin
g
Wit
hin
50
m o
f
ped
estr
ian
cro
ssin
g
Cro
ssin
g
els
ew
here
On
cen
tral
isla
nd
N1 Bus/coach going ahead, pedestrian crossing left side
6 4 5 0 0 1 16
N2 Bus/coach going ahead, pedestrian crossing right
side
2 2 1 0 0 0 5
N3 Bus/coach left turn, pedestrian crossing left side
0 1 3 0 0 1 5
P3 Walking on footpath 0 0 0 0 3 0 3
N4 Bus/coach right turn, pedestrian crossing right
side
0 0 0 1 0 0 1
N6 Bus/coach right turn, pedestrian crossing left side
1 0 0 0 0 0 1
P2 Walking facing traffic 0 0 1 0 0 0 1
Q8 Miscellaneous other 0 0 0 0 0 1 1
Total 9 7 10 1 3 3 33
The bus/coach drivers‟ line of vision was affected in 13 of the 33 collisions, as shown in
Table 5-17, most commonly by a vehicle blind spot, parked or other vehicle.
Table 5-17: Bus/coach driver’s line of vision affected prior to the collision
Driver vision affected by: Total drivers
Vehicle blind spot 4
Parked vehicle 3
Other vehicle 3
Street furniture 2
Rain, sleet, snow or fog 1
Driver vision not affected 18
Unknown 2
Total drivers 33
It was of interest to know how many pedestrians were involved in collisions after getting
off a bus/coach. It was known that three pedestrians had collisions attempting to cross
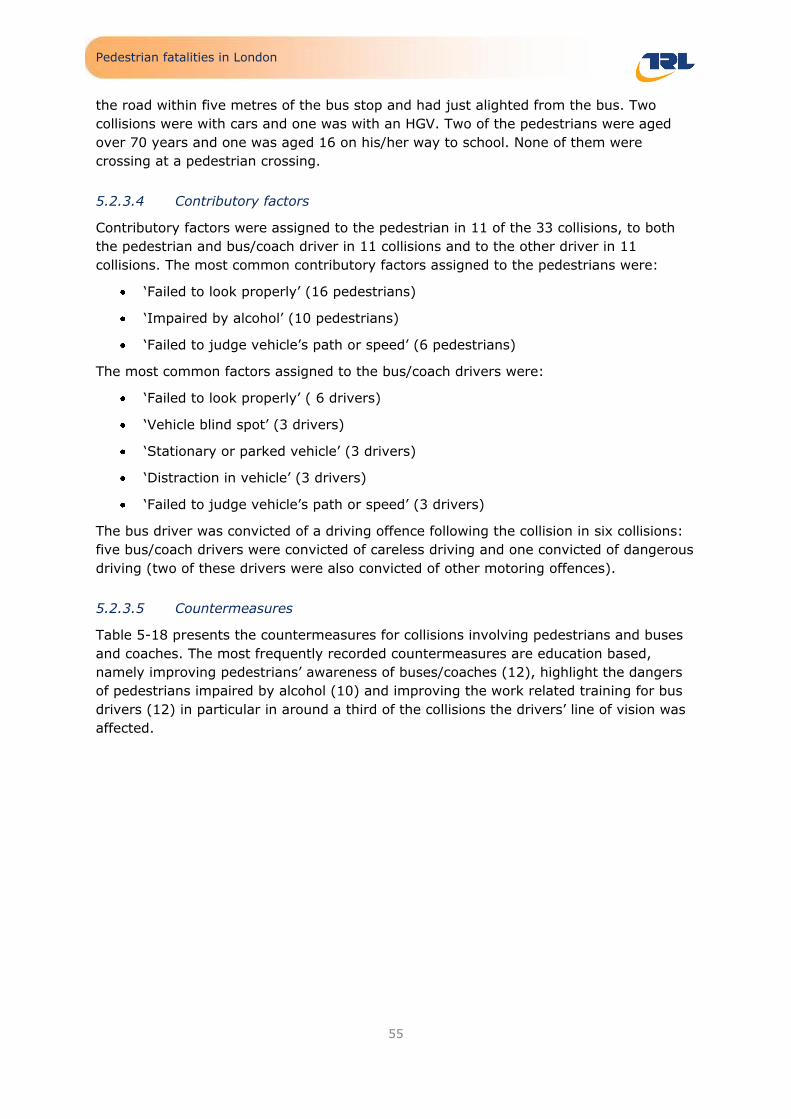
Pedestrian fatalities in London
55
the road within five metres of the bus stop and had just alighted from the bus. Two
collisions were with cars and one was with an HGV. Two of the pedestrians were aged
over 70 years and one was aged 16 on his/her way to school. None of them were
crossing at a pedestrian crossing.
5.2.3.4 Contributory factors
Contributory factors were assigned to the pedestrian in 11 of the 33 collisions, to both
the pedestrian and bus/coach driver in 11 collisions and to the other driver in 11
collisions. The most common contributory factors assigned to the pedestrians were:
„Failed to look properly‟ (16 pedestrians)
„Impaired by alcohol‟ (10 pedestrians)
„Failed to judge vehicle‟s path or speed‟ (6 pedestrians)
The most common factors assigned to the bus/coach drivers were:
„Failed to look properly‟ ( 6 drivers)
„Vehicle blind spot‟ (3 drivers)
„Stationary or parked vehicle‟ (3 drivers)
„Distraction in vehicle‟ (3 drivers)
„Failed to judge vehicle‟s path or speed‟ (3 drivers)
The bus driver was convicted of a driving offence following the collision in six collisions:
five bus/coach drivers were convicted of careless driving and one convicted of dangerous
driving (two of these drivers were also convicted of other motoring offences).
5.2.3.5 Countermeasures
Table 5-18 presents the countermeasures for collisions involving pedestrians and buses
and coaches. The most frequently recorded countermeasures are education based,
namely improving pedestrians‟ awareness of buses/coaches (12), highlight the dangers
of pedestrians impaired by alcohol (10) and improving the work related training for bus
drivers (12) in particular in around a third of the collisions the drivers‟ line of vision was
affected.

Pedestrian fatalities in London
56
Table 5-18: The most frequently recorded countermeasures for collisions
involving buses/coaches
Counter measure Likely Probably Maybe Total
142 Work related road safety training for bus drivers 0 11 1 12
131 Improve pedestrian awareness of other road users 0 5 7 12
134 Highlight the dangers of pedestrians impaired by alcohol or drugs
0 7 3 10
124 Automated emergency brake systems 0 7 2 9
122 Improve forward, rear and side vision for large vehicles – CCTV
1 1 4 6
141 Improve driver awareness of pedestrians and speed 0 4 2 6
108 Improvements to existing pedestrian crossing facilities
1 2 1 4
121 Improve forward, rear and side vision for large
vehicles – mirrors 1 3
4
123 Improve forward, rear and side vision for large vehicles – sensors
1 1 1 3
5.2.4 Collisions with HGVs
5.2.4.1 Who was involved?
There were 27 pedestrians killed in collisions with HGVs. Fifteen were male and 12 were
female and almost two-thirds were aged over 60 years old (17).
Table 5-19: Ages of pedestrian fatalities in collisions with HGVs
Age group Male Female Total
Under 16 0 0 0
16-24 1 2 3
25-29 0 1 1
30-39 1 0 1
40-49 2 2 4
50-59 1 0 1
60-69 1 3 4
70+ 6 7 13
Total 12 15 27
Four of the pedestrians were impaired by alcohol (one also with drugs), two pedestrians
were using walking aids, one had impaired hearing and one had poor eyesight and was
fatigued. Five pedestrians had a disability/illness that contributed to the collision.
All the HGV drivers were male most commonly aged between 30-39 years (Table 5-20).
All were driving as part of their job and all held a full driving licence. None of the drivers
were impaired by alcohol or drugs but three were distracted. All drivers were compliant
with the law except one who was speeding. One driver had a criminal record and two
drivers had previous driving offences.

Pedestrian fatalities in London
57
Table 5-20: Ages of HGV drivers
Age group Total
16-24 0
25-29 3
30-39 11
40-49 5
50-59 5
60-69 2
Unknown 1
Total 27
Six of the HGVs were construction type vehicles. The types of mirrors fitted to HGVs are
shown in Table 5-21. Two HGVs did not have the front mirror fitted and one did not have
a nearside wide angle mirror.
Table 5-21: Mirrors fitted to HGVs
Type of mirror Fitted Not fitted Not known Total
Offside main mirror (class II) 15 - 12 27
Nearside main mirror (class II) 16 - 11 27
Offside wide angle mirror (class IV) 8 - 19 27
Nearside wide angle mirror (class IV) 15 1 11 27
Close proximity mirror (class V) 14 - 13 27
Front mirror (class VI) 8 2 17 27
5.2.4.2 Where and when?
The majority of the collisions involving pedestrians and HGVs were on A roads in a
30mph posted speed limit. The traffic conditions were described as heavy in 12
collisions, moderate in seven and light in four. None of the collisions involving HGVs
were at a road works or construction site.
Table 5-22: HGV pedestrian fatalities by road class and speed limit
Road class 30mph 50mph Total
A road 22 2 24
B road 2 0 2
Unclassified 1 0 1
Total 25 2 27
The majority of the collisions were during the day; nine were between 6am-noon and 13
were between noon-6pm. It follows that 22 were in the daylight and only four in the
dark, and one at dawn. Twenty-six were in fine weather conditions and one in the rain.
Pedestrian flow conditions were described as heavy in four locations.
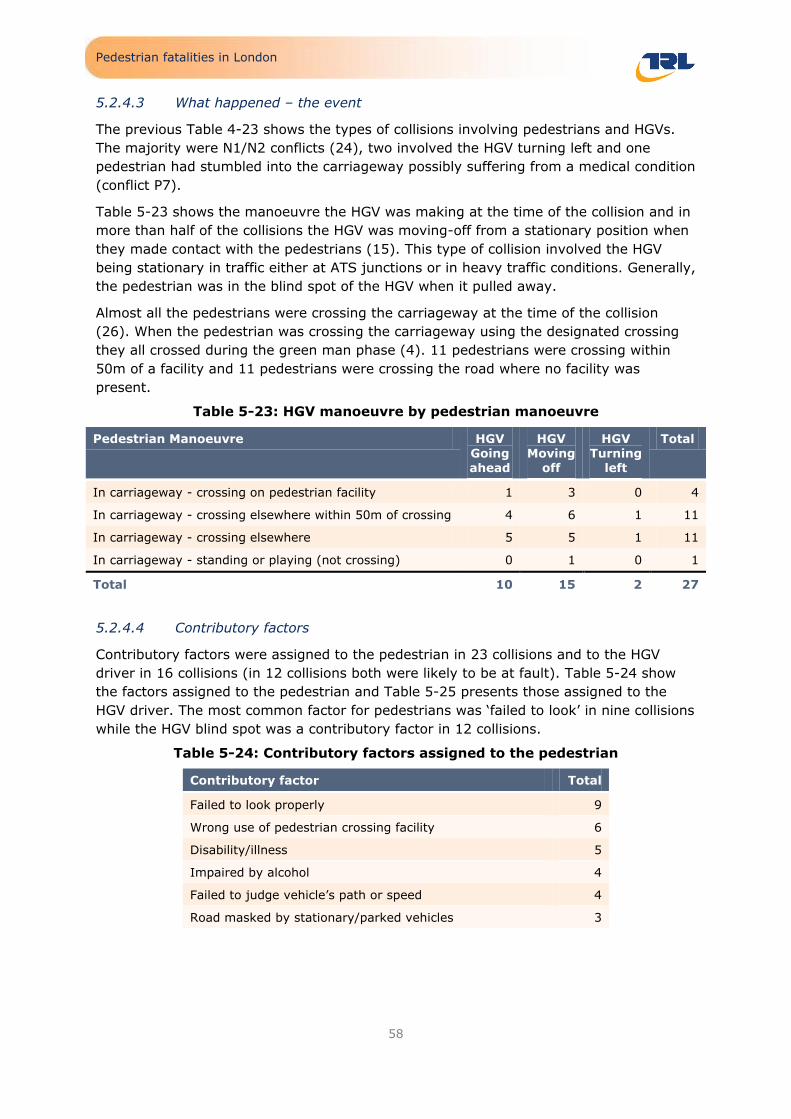
Pedestrian fatalities in London
58
5.2.4.3 What happened – the event
The previous Table 4-23 shows the types of collisions involving pedestrians and HGVs.
The majority were N1/N2 conflicts (24), two involved the HGV turning left and one
pedestrian had stumbled into the carriageway possibly suffering from a medical condition
(conflict P7).
Table 5-23 shows the manoeuvre the HGV was making at the time of the collision and in
more than half of the collisions the HGV was moving-off from a stationary position when
they made contact with the pedestrians (15). This type of collision involved the HGV
being stationary in traffic either at ATS junctions or in heavy traffic conditions. Generally,
the pedestrian was in the blind spot of the HGV when it pulled away.
Almost all the pedestrians were crossing the carriageway at the time of the collision
(26). When the pedestrian was crossing the carriageway using the designated crossing
they all crossed during the green man phase (4). 11 pedestrians were crossing within
50m of a facility and 11 pedestrians were crossing the road where no facility was
present.
Table 5-23: HGV manoeuvre by pedestrian manoeuvre
Pedestrian Manoeuvre HGV Going ahead
HGV Moving
off
HGV Turning
left
Total
In carriageway - crossing on pedestrian facility 1 3 0 4
In carriageway - crossing elsewhere within 50m of crossing 4 6 1 11
In carriageway - crossing elsewhere 5 5 1 11
In carriageway - standing or playing (not crossing) 0 1 0 1
Total 10 15 2 27
5.2.4.4 Contributory factors
Contributory factors were assigned to the pedestrian in 23 collisions and to the HGV
driver in 16 collisions (in 12 collisions both were likely to be at fault). Table 5-24 show
the factors assigned to the pedestrian and Table 5-25 presents those assigned to the
HGV driver. The most common factor for pedestrians was „failed to look‟ in nine collisions
while the HGV blind spot was a contributory factor in 12 collisions.
Table 5-24: Contributory factors assigned to the pedestrian
Contributory factor Total
Failed to look properly 9
Wrong use of pedestrian crossing facility 6
Disability/illness 5
Impaired by alcohol 4
Failed to judge vehicle‟s path or speed 4
Road masked by stationary/parked vehicles 3

Pedestrian fatalities in London
59
Table 5-25: Contributory factors assigned to the HGV driver
Contributory factor Total
Vehicle blind spot 12
Failed to look properly 3
Exceeding speed limit 1
Poor turn/manoeuvre 1
Unfamiliar with model of vehicle 1
Defective or missing mirrors 1
5.2.4.5 Countermeasures
Table 5-26 lists the most frequently recorded countermeasures for pedestrian collisions
with HGVs.
Engineering measures may be the most appropriate here by improving the forward and
side vision for HGVs using CCTV (17), mirrors (14) and sensors (12). When an HGV is in
stationary traffic and a pedestrian attempts to cross the road very close to the front of
the HGV, the driver is sometimes completely unable to see them due to the height at
which the driver sits in the vehicle reduces the line of vision close to the vehicle. Hence
when the traffic clears or the lights turn green the driver pulls away, unable to see the
pedestrian crossing in front of the vehicle and consequently hits the pedestrian. If the
forward vision was improved to enable the driver to see the pedestrian it is almost
certain the collision would not have happened. These improvements in combination with
educating the pedestrian about the dangers of crossing the road directly in front of an
HGV may have avoided the majority of HGV collisions.

Pedestrian fatalities in London
60
Table 5-26: The most frequently recorded countermeasures for collisions
involving HGVs
Counter measure
Name Likely Probably Maybe Total
122 Improve forward, rear and side vision for large vehicles – CCTV
9 6 2 17
121 Improve forward, rear and side vision for large
vehicles – mirrors 1 10 3 14
131 Improve pedestrian awareness of HGVs 0 7 6 13
123 Improve forward, rear and side vision for large
vehicles – sensors 0 9 3 12
142 Work related road safety training for bus drivers
0 0 7 7
134 Highlight the dangers of pedestrians impaired
by alcohol or drugs 0 0 4 4
124 Automated emergency brake systems 0 2 1 3
141 Improve driver awareness of pedestrians and
speed 0 0 2 2
108 Improvements to existing pedestrian crossing facilities
0 0 1 1
106 The use of advanced stop signs at pedestrian crossings
0 1 0 1
109 Provide or re-site pedestrian crossing 0 1 0 1
221 Improve side-guards on HGV 0 0 1 1
5.2.5 Children
There were 18 child pedestrians killed in the sample of files. This represents 9% of
pedestrian fatalities. Eight of the pedestrians were aged 12 to 15 and five were aged less
than five. All of the collisions involved a single fatality.
5.2.5.1 When and where
Eight of the child pedestrian fatalities occurred on an A-road, six of which were aged 12-
15, as shown in the table below. The younger age groups were more commonly in
collisions on unclassified roads. Twelve of the children were in collisions in outer London,
and six in inner London.
Table 5-27: Child pedestrian fatalities by age group and road class
1st road class (ACCSTATS) 0-4 5-7 8-11 12-15 Total
A road 0 1 1 6 8
B road 1 0 0 0 1
C road 0 0 0 2 2
Unclassified 4 2 1 0 7
Total 5 3 2 8 18
Table 5-28 and Table 5-29 show the number of child pedestrian fatalities in each age
group by day of the week and time period of the collision. The number of child fatalities

Pedestrian fatalities in London
61
on each day was small, although there was a slightly higher number of children,
especially older children in collisions on a Friday or Saturday. The most common time for
collisions was between 4pm and 8pm, which coincides with after school activities.
Table 5-28: Child pedestrian fatalities by age group and day of week
Weekday 0-4 5-7 8-11 12-15 Total
Monday 1 1 0 0 2
Tuesday 0 0 0 0 0
Wednesday 1 0 0 1 2
Thursday 2 1 0 1 4
Friday 1 0 2 3 6
Saturday 0 1 0 3 4
Sunday 0 0 0 0 0
Total 5 3 2 8 18
Table 5-29: Child pedestrian fatalities by age group and time period
Time period 0-4 5-7 8-11 12-15 Total
midnight-4am 0 0 0 0 0
4am-8am 0 0 0 0 0
8am-noon 1 0 1 1 3
noon-4pm 2 1 0 1 4
4pm-8pm 1 2 1 5 9
8pm-midnight 1 0 0 1 2
Total 5 3 2 8 18
Note that each time group includes times up to, but not including the end of the range listed, for example, 4am is included in the 4am-8am group.
5.2.5.2 Child pedestrian
11 of the child pedestrians were male and 7 were female. Table 5-30 shows the
accompaniment of the child pedestrians. Generally the younger age groups were
accompanied by a parent or guardian, whilst the older ages were more commonly alone
or part of a group.
Table 5-30: Child pedestrian fatalities by age group and accompaniment
Pedestrian accompaniment 0-4 5-7 8-11 12-15 Total
Child with parent/guardian 5 1 1 0 7
Part of group 0 2 1 3 6
Alone 0 0 0 5 5
Total 5 3 2 8 18

Pedestrian fatalities in London
62
Table 5-31 shows the child travel mode. The pedestrians in the youngest age group
included 2 in a pushchair or pram.
Table 5-31: Child pedestrian fatalities by age group and child travel mode
Travel mode (if child <11) 0-4 5-7 8-11 12-15 Total
Holding adult hand 1 0 0 0 1
In close proximity to adult 1 0 1 0 2
In pushchair/pram 2 0 0 0 2
Other 1 2 0 1 4
Not applicable 0 1 1 7 9
Total 5 3 2 8 18
The action or distraction of the child pedestrian was recorded where known, and the
results shown in the table below. None of the children were reported to be using a
mobile phone or headphones. Two pedestrians were talking with other pedestrians and
three were following other pedestrians. Three children were reported as „playing‟.
Table 5-32: Child pedestrian fatalities by age group and action/distraction
Action or distraction 0-4 5-7 8-11 12-15 Total
Walking dog 0 0 0 0 0
Eating & drinking 0 0 0 0 0
Reading 0 0 0 0 0
Mobile to ear 0 0 0 0 0
Headphones 0 0 0 0 0
Other interaction with mobile 0 0 0 0 0
Talking to other pedestrians 0 1 0 1 2
Yelling across road 0 1 0 0 1
Following other pedestrians 0 1 1 1 3
Playing 0 1 0 2 3
Total child pedestrians 5 3 2 8 18
13 of the children were crossing the road, most commonly away from a pedestrian
facility (8). Half of this latter group (4) were aged 12-15, all of whom were on A-roads.
Table 5-33 shows the speed of the pedestrian. The speed of nine of the children was
recorded as running, including seven of the eight children aged 12 to 15 years.
Table 5-33: Child pedestrian fatalities by age group and action/distraction
Pedestrian speed 0-4 5-7 8-11 12-15 Total
Running 0 2 0 7 9
Walking 2 1 0 0 3
Stationary 1 0 0 0 1
Unknown 2 0 2 1 5
Total 5 3 2 8 18

Pedestrian fatalities in London
63
Two children were on the footway or verge (see Section 5.2.10 for more details
regarding pedestrians injured on the footway). Thirteen of the children were crossing the
road and 2 were in the carriageway, standing or playing. One pedestrian was recorded
as having accidentally stumbled/fell.
Table 5-34: Child pedestrian fatalities by pedestrian manoeuvre
Pedestrian Manoeuvre 0-4 5-7 8-11 12-15 Total
In carriageway - crossing elsewhere 2 1 1 4 8
In carriageway - crossing on pedestrian facility 0 1 1 1 3
In carriageway - crossing elsewhere within 50m of crossing 0 0 0 2 2
In carriageway - standing or playing (not crossing) 0 1 0 1 2
On footway or verge 2 0 0 0 2
Unknown or other 1 0 0 0 1
Total 5 3 2 8 18
5.2.5.3 Vehicle/driver
The majority of child pedestrians were struck by a car (15), two were struck by a bus or
coach and one (a child aged less than five) was struck by an LGV.
Table 5-35: Vehicles which struck child pedestrians by pedestrian age group and vehicle type
Vehicle Type 0-4 5-7 8-11 12-15 Total
Car 4 2 2 7 15
Bus/Coach 0 1 0 1 2
LGV 1 0 0 0 1
Total 5 3 2 8 18
All of the vehicles were „going ahead other‟ except for three vehicles (see Table 6-36),
which were all cars.
Table 5-36: Vehicles which struck child pedestrians by pedestrian age group
and vehicle manoeuvre
Vehicle Manoeuvres 0-4 5-7 8-11 12-15 Total
05 Moving Off 1 0 0 0 1
07 Turning Left 1 0 0 0 1
14 Overtake Stat Veh O/S 0 0 0 1 1
18 Going Ahead Other 3 3 2 7 15
Total 5 3 2 8 18
Two of the vehicles failed to stop at the scene, and two were travelling over the speed
limit.

Pedestrian fatalities in London
64
5.2.5.4 What happened
The majority of the conflicts involved the pedestrian crossing the road and the vehicle
going ahead straight (conflicts N1 or N2). All the children aged over five were recorded
with these conflicts. The younger age group were involved in conflicts which involved the
vehicle turning or on the footpath.
Table 5-37: Vehicles which struck child pedestrians by pedestrian age group and vehicle manoeuvre
Conflicts 0-4 5-7 8-11 12-15 Total
N1 Vehicle going ahead, pedestrian left side 1 1 1 2 5
N2 Vehicle going ahead, pedestrian right side
1 2 1 6 10
N4 Vehicle right turn, pedestrian right side 1 0 0 0 1
P3 Walking on footpath 1 0 0 0 1
Q8 Other 1 0 0 0 1
Total 5 3 2 8 18
5.2.5.5 Contributory factors
In nine of the child pedestrian collisions only the pedestrian was assigned contributory
factors. In six collisions both the pedestrian and striking vehicle/driver/rider were
assigned factors and in three collisions only the vehicle was assigned factors. These
latter three collisions all involved a pedestrian aged less than five.
Table 5-38: Contributory factor types assigned to child pedestrians
Type 0-4 5-7 8-11 12-15 Total
Pedestrian factors only 1 3 1 4 9
Vehicle/driver/rider factors only 3 0 0 0 3
Both pedestrian and vehicle/driver/rider factors
1 0 1 4 6
Total 5 3 2 8 18
Table 5-37 shows the number of child pedestrians with each of the pedestrian
contributory factors. The most commonly recorded contributory factor for the child
pedestrians was „failed to look properly‟, recorded for 13 of the collisions. „Crossing road
masked by stationary or parked vehicles‟ was recorded in four collisions.
In both cases where a child aged less than five was assigned a contributory factor, the
factor assigned was „pedestrian failed to look properly‟. Both cases involved a very young
child (ages one and two) running into the road, in one case having broken away from
their accompaniment. These young children may not have known that they should have
looked, and the dangers of not doing so.

Pedestrian fatalities in London
65
Table 5-39: Pedestrian contributory factors for child pedestrians
Contributory factor 0-4 5-7 8-11 12-15 Total
801 Crossing road masked by stationary or parked vehicles
0 1 1 2 4
802 Failed to look properly 2 2 2 7 13
803 Failed to judge vehicle‟s path or speed 0 1 0 2 3
804 Wrong use of pedestrian crossing facility 0 0 0 2 2
805 Dangerous action in carriageway 0 0 0 1 1
806 Impaired by alcohol 0 0 0 0 0
807 Impaired by drugs 0 0 0 0 0
808 Careless, reckless in a hurry 0 0 1 0 1
809 Pedestrian wearing dark clothing at night 0 0 0 1 1
Pedestrians with any pedestrian factor 2 3 2 8 15
Pedestrians with no pedestrian factor 3 0 0 0 3
Total child pedestrians 5 3 2 8 18
Table 5-39 shows the contributory factors assigned to vehicles, drivers or riders in
collisions with child pedestrians. The most commonly recorded factor was „vision affected
by stationary or parked vehicles, recorded in three cases.
Table 5-40: Vehicle, driver and rider contributory factors in collisions with child
pedestrians
Factor Code Bus/Coach Car LGV Total
701 Vision affected by stationary or parked vehicles
0 2 1 3
607 Unfamiliar with model of vehicle 0 2 0 2
410 Loss of control 0 2 0 2
405 Failed to look properly 1 0 1
306 Exceeding speed limit 0 1 0 1
709 Vision affected by visor or windscreen
dirty or scratched
0 1 1
707 Vision affected by rain, sleet, snow or fog
0 1 0 1
710 Vision affected by vehicle blind spot 0 0 1 1
502 Impaired by drugs 0 1 0 1
203 Defective brakes 0 1 0 1
501 Impaired by alcohol 0 1 0 1
5.2.5.6 Countermeasures
The countermeasures recorded for the child pedestrian collisions are shown in Table
5-41. The most commonly recorded were „improved pedestrian awareness of other road
users‟ (10) and „automated emergency brake systems‟.

Pedestrian fatalities in London
66
Table 5-41: Countermeasures for collisions involving children
Countermeasure Maybe Probably Total
103 Removal of on-street parking 0 3 3
104 Reduce speed limit/20mph zones 0 1 1
105 Provide traffic calming 2 1 3
109 Provide or re-site pedestrian crossings 2 1 3
114 Introduce guard railings 1 0 1
124 Automated emergency brake systems 7 1 8
126 Intelligent speed adaptation 1 0 1
131 Improved pedestrian awareness of other road users 7 3 10
133 Improved pedestrian conspicuity 2 0 2
141 Improve driver awareness of pedestrians and speed 3 1 4
143 Roadworthiness of vehicle 1 0 1
151 Speed enforcement 1 0 1
152 Drinking and driving 0 1 1
153 Driving/riding without a licence/uninsured 1 0 1
154 General traffic law enforcement 2 0 2
223 Pop up bonnets and improved bumper design 3 0 3
5.2.6 Elderly
There were 41 pedestrians that were aged 80 or older. This group may have mobility
difficulties which have an effect on their risk on the road. When involved in a collision
this group are very vulnerable and may have higher injury severities or complications
following the injuries. All of the collisions involved a single fatality.
5.2.6.1 Pedestrians
Table 5-42 shows the distribution of elderly pedestrians by age and sex. There were
more females than males and more pedestrians aged less than 90 in the sample. This is
likely to reflect the population and travel patterns of these age groups.
Table 5-42: Elderly pedestrians by pedestrian age group and sex
Age group Female Male Total
80-84 8 6 14
85-89 10 8 18
90-94 5 1 6
95-99 1 1 2
100+ 1 0 1
Total 25 16 41
The majority of the elderly pedestrians were alone (37). Three were part of a group and
one was unknown. Two of the pedestrians were recorded as having accidentally
stumbled or fell.

Pedestrian fatalities in London
67
Table 5-43 shows the pedestrian manoeuvres for the elderly pedestrians by road class.
27 of the pedestrians were crossing the road, of which 16 were away from a pedestrian
facility. These latter 16 were most commonly on an A-road.
Table 5-43: Elderly pedestrians by pedestrian manoeuvre and road class
Pedestrian Manoeuvre A road B road C road Unclassified Total
In carriageway - crossing elsewhere 10 1 3 2 16
In carriageway - crossing on pedestrian facility 10 0 1 0 11
In carriageway - crossing elsewhere within
50m of crossing
8 2 0 0 10
On footway or verge 2 0 0 0 2
Unknown or other 0 0 2 2
Total 30 3 4 4 41
Table 5-44 shows the mobility of the elderly pedestrians and Table 5-45 shows the
number of pedestrians with impairments.
There were ten pedestrians who used a walking frame or walking stick. Five of these
were crossing an A-road within 50 metres from a crossing, but not at the crossing itself.
Table 5-44: Elderly pedestrians by pedestrian mobility
Mobility Total
Walking frame 2
Walking stick 8
None 21
Unknown 10
Total 41
A small number of the pedestrians were impaired, most commonly with hearing
problems (three). There were also two pedestrians with uncorrected or defective eye
sight.
Table 5-45: Elderly pedestrians by pedestrian impairment
Impairment Total
Alcohol 1
Drugs 0
fatigue 0
Uncorrected, defective eyesight 2
Hearing issues 3
Other relevant illness or disability 2
Total elderly pedestrians 41

Pedestrian fatalities in London
68
5.2.6.2 Collision circumstances
Table 5-46 shows the elderly pedestrians by the road class and junction detail of the
collision. Two-thirds of the casualties occurred at or within 20 metres of a junction.
Table 5-46: Elderly pedestrians by road class and junction detail
Junction detail A roads B roads C roads Unclassified Total
T or staggered junction 15 2 1 1 19
Not at or within 20m of junction 9 1 2 2 14
Crossroads 5 0 0 0 5
Multiple junction 1 0 0 0 1
Private drive or entrance 0 0 0 1 1
Roundabout 0 0 1 0 1
Total 30 3 4 4 41
Table 5-47 shows the number of elderly pedestrian fatalities by day of week and time of
day. The casualties were spread throughout the week, with the majority of casualties
occurring between 8am and 8pm.
Table 5-47: Elderly pedestrians by day of week and time period
Time period Sun Mon Tue Wed Thur Fri Sat Total
00-04 0 0 0 0 0 0 0 0
04-08 0 0 0 0 0 0 1 1
08-12 1 3 3 3 2 2 2 16
12-16 2 0 2 1 2 3 2 12
16-20 1 3 2 2 2 1 1 12
20-00 0 0 0 0 0 0 0 0
Total 4 6 7 6 6 6 6 41
Note that each time group includes times up to, but not including the end of the range listed, for
example, 4am is included in the 04-08 group.
5.2.6.3 Vehicles
There were 41 vehicles which struck the 41 elderly pedestrians. These were most
commonly cars (as shown in Table 5-48), although there were also ten HGVs.
Table 5-48: Vehicles which struck elderly pedestrians
Vehicle type Total
Car 19
HGV 10
LGV 5
Bus/Coach 4
PTW 3
Total 41

Pedestrian fatalities in London
69
Over half of the vehicles were „going ahead other‟ (Table 5-49). Five of the car collisions
and one LGV collision involved the vehicle reversing, and four of the 1ten HGV collisions
involved the HGV moving off.
Table 5-49: Vehicle manoeuvres of vehicles in collisions with elderly
pedestrians
Vehicle Manoeuvre Bus/Coach PTW Car LGV HGV Total
Going Ahead Other 2 3 11 3 3 22
Reversing 0 0 5 1 0 6
Moving Off 0 0 0 0 4 4
Turning Left 1 0 2 0 1 4
Turning Right 1 0 0 0 1 2
Going Ahead Held Up 0 0 0 0 1 1
Overtake Stat Veh O/S 0 0 0 1 0 1
Going Ahead Left Bend 0 0 1 0 0 1
Total 4 3 19 5 10 41
Two cars and two HGVs failed to stop at the collision (although in both cases the HGV
drivers did not realise they had been involved in a collision as these collisions occurred
when the HGV was „moving off‟ and „going ahead, but held up‟ with the pedestrian
crossing in the HGV‟s blind spot directly in front of the vehicle). Two of the vehicles (one
car and one HGV) were speeding.
5.2.6.4 What happened
Table 5-50 shows the conflicts for the elderly pedestrians by vehicle type. Collisions
involving the pedestrian crossing the road with the vehicle travelling straight ahead were
the most common (N1 and N2, 16 and 11 collisions respectively). There were six
conflicts which involved the vehicle manoeuvring (N7); in all cases the vehicle was
reversing.
Table 5-50: Conflicts of collisions involving an elderly pedestrian by vehicle
type
Conflict Motorcycle Car Bus/Coach LGV HGV Total
N1 Vehicle going ahead, pedestrian left side
0 5 1 3 7 16
N2 Vehicle going ahead,
pedestrian right side
3 7 0 1 0 11
N3 Vehicle left turn, pedestrian left side
0 1 1 0 2 4
N6 Vehicle right turn, pedestrian left side
0 0 1 0 0 1
N7 Manoeuvring vehicle 0 5 0 1 0 6
P3 Walking on footpath 0 1 1 0 0 2
Q8 Other 0 0 0 0 1 1
Total 3 19 4 5 10 41
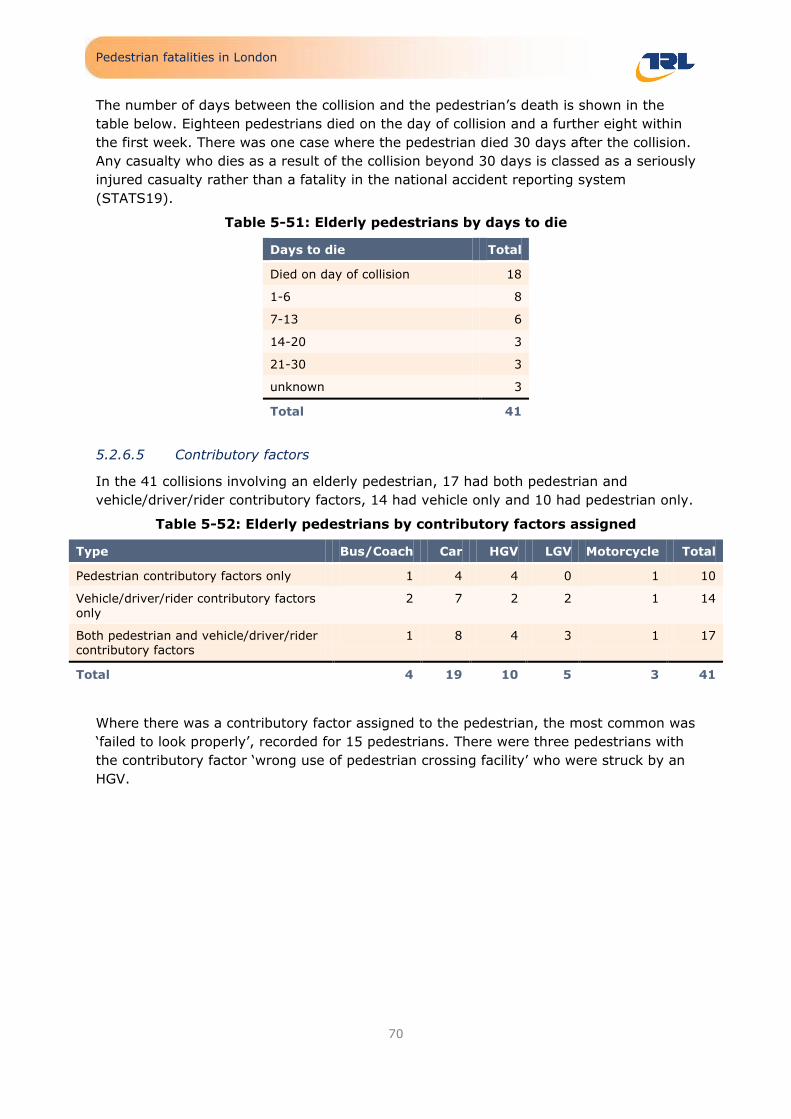
Pedestrian fatalities in London
70
The number of days between the collision and the pedestrian‟s death is shown in the
table below. Eighteen pedestrians died on the day of collision and a further eight within
the first week. There was one case where the pedestrian died 30 days after the collision.
Any casualty who dies as a result of the collision beyond 30 days is classed as a seriously
injured casualty rather than a fatality in the national accident reporting system
(STATS19).
Table 5-51: Elderly pedestrians by days to die
Days to die Total
Died on day of collision 18
1-6 8
7-13 6
14-20 3
21-30 3
unknown 3
Total 41
5.2.6.5 Contributory factors
In the 41 collisions involving an elderly pedestrian, 17 had both pedestrian and
vehicle/driver/rider contributory factors, 14 had vehicle only and 10 had pedestrian only.
Table 5-52: Elderly pedestrians by contributory factors assigned
Type Bus/Coach Car HGV LGV Motorcycle Total
Pedestrian contributory factors only 1 4 4 0 1 10
Vehicle/driver/rider contributory factors
only
2 7 2 2 1 14
Both pedestrian and vehicle/driver/rider contributory factors
1 8 4 3 1 17
Total 4 19 10 5 3 41
Where there was a contributory factor assigned to the pedestrian, the most common was
„failed to look properly‟, recorded for 15 pedestrians. There were three pedestrians with
the contributory factor „wrong use of pedestrian crossing facility‟ who were struck by an
HGV.

Pedestrian fatalities in London
71
Table 5-53: Pedestrian contributory factors for elderly pedestrians
Factor Code Bus/Coach Car HGV LGV Motorcycle Total
801 Crossing road masked by stationary or parked vehicle
1 0 2 1 1 5
802 Failed to look properly 1 10 1 1 2 15
803 Failed to judge vehicle‟s path or speed
0 1 1 2 1 5
804 Wrong use of pedestrian
crossing facility
1 1 3 0 0 5
805 Dangerous action in carriageway
0 0 0 0 0 0
806 Impaired by alcohol 0 1 0 0 0 1
807 Impaired by drugs 0 0 0 0 0 0
808 Careless, reckless or in a hurry
0 1 0 0 1 2
809 Pedestrian wearing dark clothing at night
0 0 0 0 0 0
810 Disability or illness, mental
or physical
0 0 3 0 0 3
Any pedestrian factor 2 12 8 3 2 27
No pedestrian factor 2 7 2 2 1 14
All pedestrians 4 19 10 5 3 41
The most common factor for vehicles/drivers/riders was „failed to look properly‟,
recorded in 19 collisions. „Vision obscured by vehicle blind spot‟ was the second most
common, recorded in four collisions.
Table 5-54: Top 8 vehicle/driver/rider contributory factors for vehicles which struck elderly pedestrians
Factor Bus/Coach Car HGV LGV Motorcycle Total
405 Failed to look properly 2 10 3 4 0 19
710 Vision affected by vehicle
blind spot
1 1 2 0 0 4
701 Vision affected by stationary or parked vehicles
0 2 0 1 0 3
403 Poor turn or manoeuvre 0 1 1 0 0 2
706 Vision affected by dazzling sun
0 0 0 1 1 2
306 Exceeding speed limit 0 1 1 0 0 2
406 Failed to judge other person‟s path or speed
1 1 0 0 0 2
410 Loss of control 0 2 0 0 0 2
Any vehicle/driver/rider factor 3 15 6 5 2 31
No vehicle/driver/rider factor 1 4 4 0 1 10
Total Vehicles 4 19 10 5 3 41
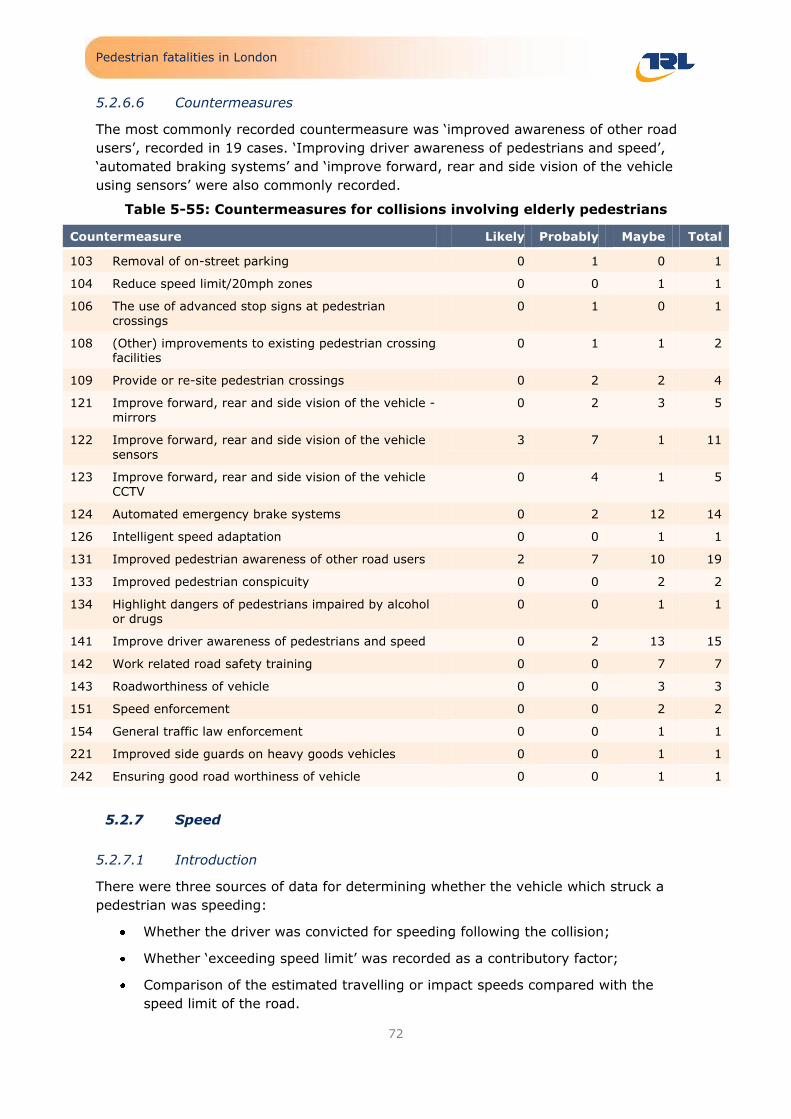
Pedestrian fatalities in London
72
5.2.6.6 Countermeasures
The most commonly recorded countermeasure was „improved awareness of other road
users‟, recorded in 19 cases. „Improving driver awareness of pedestrians and speed‟,
„automated braking systems‟ and „improve forward, rear and side vision of the vehicle
using sensors‟ were also commonly recorded.
Table 5-55: Countermeasures for collisions involving elderly pedestrians
Countermeasure Likely Probably Maybe Total
103 Removal of on-street parking 0 1 0 1
104 Reduce speed limit/20mph zones 0 0 1 1
106 The use of advanced stop signs at pedestrian
crossings
0 1 0 1
108 (Other) improvements to existing pedestrian crossing facilities
0 1 1 2
109 Provide or re-site pedestrian crossings 0 2 2 4
121 Improve forward, rear and side vision of the vehicle - mirrors
0 2 3 5
122 Improve forward, rear and side vision of the vehicle
sensors
3 7 1 11
123 Improve forward, rear and side vision of the vehicle CCTV
0 4 1 5
124 Automated emergency brake systems 0 2 12 14
126 Intelligent speed adaptation 0 0 1 1
131 Improved pedestrian awareness of other road users 2 7 10 19
133 Improved pedestrian conspicuity 0 0 2 2
134 Highlight dangers of pedestrians impaired by alcohol or drugs
0 0 1 1
141 Improve driver awareness of pedestrians and speed 0 2 13 15
142 Work related road safety training 0 0 7 7
143 Roadworthiness of vehicle 0 0 3 3
151 Speed enforcement 0 0 2 2
154 General traffic law enforcement 0 0 1 1
221 Improved side guards on heavy goods vehicles 0 0 1 1
242 Ensuring good road worthiness of vehicle 0 0 1 1
5.2.7 Speed
5.2.7.1 Introduction
There were three sources of data for determining whether the vehicle which struck a
pedestrian was speeding:
Whether the driver was convicted for speeding following the collision;
Whether „exceeding speed limit‟ was recorded as a contributory factor;
Comparison of the estimated travelling or impact speeds compared with the
speed limit of the road.

Pedestrian fatalities in London
73
Table 5-56 shows the number of vehicles the hit the pedestrian by whether the vehicle
was convicted for speeding following the collision. There were two motorcyclists and
three car drivers convicted for speeding.
Table 5-56: Speeding convictions following collision by vehicle type
Speeding conviction following collision
Motorcycle Car Bus/Coach LGV HGV Total
Yes 2 3 0 0 0 5
No 12 107 33 12 27 191
Unknown 1 0 0 0 1
Total 14 111 33 12 27 197
Table 5-57 shows the number of vehicles which were classed as exceeding the speed
limit by vehicle type. Overall, 24 vehicles were attributed this contributory factor, the
majority (20) being car drivers.
Table 5-57: Exceeding speed limit contributory factor by vehicle type
Was ‘exceeding
speed limit’ a contributory factor
Motorcycle Car Bus/Coach LGV HGV Total
Yes 2 20 0 1 1 24
No 12 91 33 11 26 173
Total 14 111 33 12 27 197
The estimated travelling speed of each vehicle, where known, was compared with the
speed limit of the road. Where the minimum estimated speed was greater than 10% +
2mph of the speed limit the vehicle was classed as speeding (ACPO, 2000). Where the
maximum travelling speed was lower than the speed limit of the road the vehicle was
classed as not speeding. If the range of the travelling speed included the speed limit
then it is uncertain whether the vehicle was speeding or not, and are classed as „unsure‟
in Table 5-58. There were 122 vehicles with known travelling speed.
There were 23 vehicles, mainly cars (19), which were classed as travelling above the
speed limit.
Table 5-58: Travelling speed by vehicle type
Was the vehicle’s travelling speed in excess of the speed limit?
Motorcycle Car Bus/Coach LGV HGV Total
Yes 2 19 0 1 1 23
No 5 42 16 5 16 84
Unsure 3 9 0 3 0 15
Unknown 4 41 17 3 10 75
Total 14 111 33 12 27 197
The chart below shows the estimated ranges of travelling speed (vertical bars) compared
to the speed limit (horizontal lines). Each speed limit is shown with different coloured

Pedestrian fatalities in London
74
bars. The bars that are clearly above the horizontal line represent those vehicles which
were speeding.
Figure 5-1: Travelling speeds of riders/drivers that struck pedestrians
The majority of collisions occurred on a road with a 30mph speed limit. On these roads
the estimated travelling speeds of those exceeding the speed limit ranged from 35mph
to 76mph.
The analysis in the reminder of this section is based on 31 drivers and vehicles which
met at least one of the three criteria used above. There were just two drivers who met
all three criteria.
5.2.7.2 Collision details
20 of the 31 collision involving speeding vehicles occurred in outer London.
Table 5-59: Speeding vehicles in pedestrian fatal collisions by area and vehicle type
Area Motorcycle Car LGV HGV Total
Inner London 1 8 1 1 11
Outer London 2 18 0 0 20
Total 3 26 1 1 31

Pedestrian fatalities in London
75
The collisions involving speeding occurred throughout the day (Table 5-60), although the
speeding collisions between midnight and 8am represented a higher proportion of all
collisions (32%) than at other times of the day (13%).
Table 5-60: Speeding vehicles in pedestrian fatal collisions by time of day and
vehicle type
Time period Motorcycle Car LGV HGV Total
midnight-4am 0 7 0 0 7
4am-8am 1 1 1 0 3
8am-noon 1 2 0 1 4
noon-4pm 1 5 0 0 6
4pm-8pm 0 6 0 0 6
8pm-midnight 0 5 0 0 5
Total 3 26 1 1 31
The vast majority of collisions involving speeding were conflicts N1 or N2, as shown in
Table 5-61, that is, those where the pedestrian was crossing the road and the vehicle
was travelling straight ahead.
Table 5-61: Speeding vehicles in pedestrian fatal collisions by conflict and vehicle type
Conflicts Motorcycle Car LGV HGV Total
N1 0 12 1 1 14
N2 3 10 0 0 13
P3 0 3 0 0 3
P5 0 1 0 0 1
Total 3 26 1 1 31
Twenty of the speeding vehicles were in collisions on A-roads (see Table 5-62). However,
the small numbers of speeding vehicles on B roads (4) represents a larger proportion of
all collisions on these roads (see Table 4-18).
Table 5-62: Speeding vehicles in pedestrian fatal collisions by road class and
vehicle type
Road Class Motorcycle Car LGV HGV Total
A road 1 17 1 1 20
4 B road 1 3 0 0 4
5 C and unclassified 1 6 0 0 7
Total 3 26 1 1 31
5.2.7.3 Vehicle and driver
The conviction history of the driver was known in 19 of the 31 cases where the driver
was speeding. The majority (14) had no conviction history, three had DVLA offences and
two had a criminal court conviction. There were two car drivers who had no licence.

Pedestrian fatalities in London
76
Table 5-63: Conviction history of speeding drivers
Conviction history Motorcycle Car LGV HGV Total
Criminal record - court conviction(s) 0 2 0 0 2
DVLA offences only 1 2 0 0 3
No conviction history 2 10 1 1 14
Unknown 0 12 0 0 12
Total 3 26 1 1 31
Drivers aged between 20 and 29 years were over-represented in collisions where the
vehicle was speeding (Figure 5-2); 13 of the speeders were in this age group and 30%
of drivers in the sample in this age group were speeding compared with 16% of all
drivers in the sample.
Figure 5-2: Driver age distribution of speeding vehicles
Table 5-64 shows the ethnicity of drivers that were speeding compared with those not
speeding. Whilst the majority of speeders were recorded as White, the smaller numbers
of Asian and Black drivers that were speeding represented a larger proportion of drivers
in the collisions in the sample of that ethnicity.
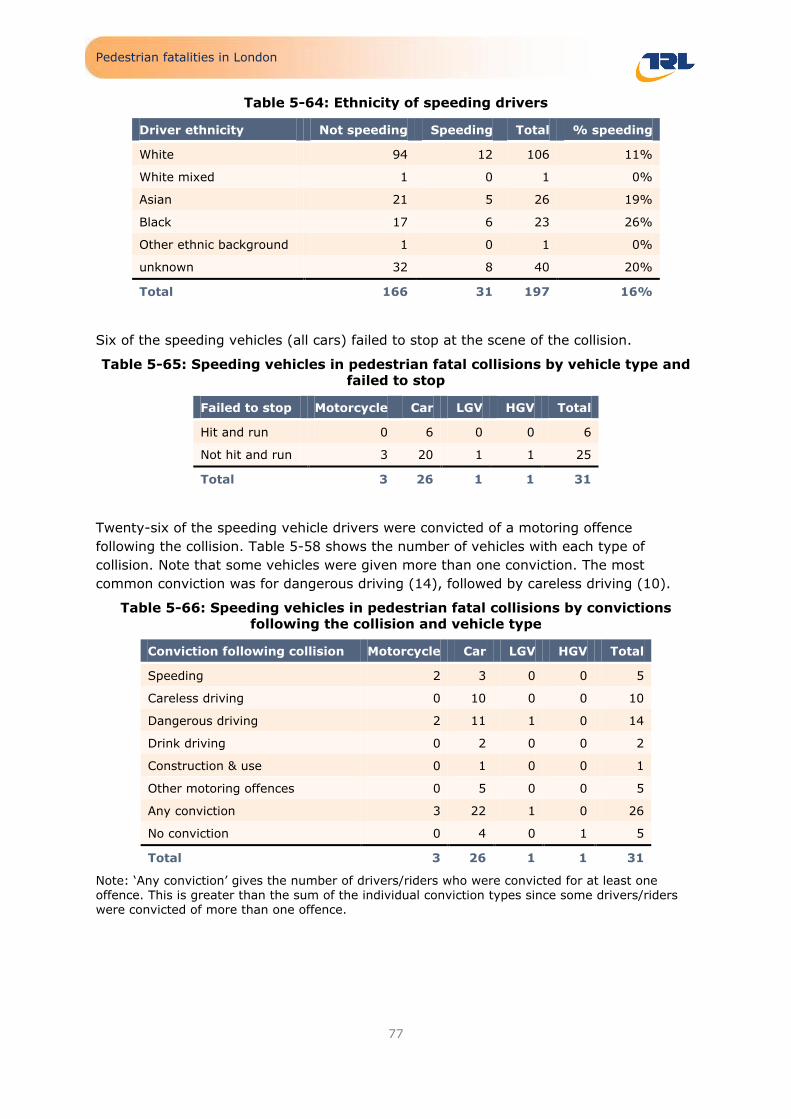
Pedestrian fatalities in London
77
Table 5-64: Ethnicity of speeding drivers
Driver ethnicity Not speeding Speeding Total % speeding
White 94 12 106 11%
White mixed 1 0 1 0%
Asian 21 5 26 19%
Black 17 6 23 26%
Other ethnic background 1 0 1 0%
unknown 32 8 40 20%
Total 166 31 197 16%
Six of the speeding vehicles (all cars) failed to stop at the scene of the collision.
Table 5-65: Speeding vehicles in pedestrian fatal collisions by vehicle type and failed to stop
Failed to stop Motorcycle Car LGV HGV Total
Hit and run 0 6 0 0 6
Not hit and run 3 20 1 1 25
Total 3 26 1 1 31
Twenty-six of the speeding vehicle drivers were convicted of a motoring offence
following the collision. Table 5-58 shows the number of vehicles with each type of
collision. Note that some vehicles were given more than one conviction. The most
common conviction was for dangerous driving (14), followed by careless driving (10).
Table 5-66: Speeding vehicles in pedestrian fatal collisions by convictions following the collision and vehicle type
Conviction following collision Motorcycle Car LGV HGV Total
Speeding 2 3 0 0 5
Careless driving 0 10 0 0 10
Dangerous driving 2 11 1 0 14
Drink driving 0 2 0 0 2
Construction & use 0 1 0 0 1
Other motoring offences 0 5 0 0 5
Any conviction 3 22 1 0 26
No conviction 0 4 0 1 5
Total 3 26 1 1 31
Note: „Any conviction‟ gives the number of drivers/riders who were convicted for at least one offence. This is greater than the sum of the individual conviction types since some drivers/riders were convicted of more than one offence.

Pedestrian fatalities in London
78
5.2.7.4 Pedestrian
There were 32 pedestrians which were struck by a speeding vehicle. The majority were
adults, including two pedestrians aged 80 or over, and there were also two children
struck by a speeding vehicle. Six of the pedestrians were impaired by alcohol.
Table 5-67: Pedestrians struck by speeding vehicles by pedestrian age group and vehicle type
Pedestrian age group Motorcycle Car LGV HGV Total
0-15 0 2 0 0 2
16-24 1 7 0 0 8
25-59 1 14 1 0 16
60-79 1 3 0 0 4
80+ 0 1 0 1 2
Total 3 27 1 1 32
The majority of the pedestrians in these collisions were crossing the road; 11 at a
pedestrian facility, four near a facility and 10 elsewhere. There were also five
pedestrians on the footway or verge which were struck by a speeding vehicle (see
Section 5.2.10 for more detailed analysis of pedestrians on the pavement).
Table 5-68: Pedestrians struck by speeding vehicles by pedestrian manoeuvre
and vehicle type
Pedestrian manoeuvre Motorcycle Car LGV HGV Total
In carriageway - crossing on pedestrian facility 1 9 0 1 11
In carriageway - crossing elsewhere within 50m of crossing 0 4 0 0 4
In carriageway - crossing elsewhere 2 7 1 0 10
In carriageway - standing or playing (not crossing) 0 1 0 0 1
On footway or verge 0 5 0 0 5
Unknown or other 0 1 0 0 1
Total 3 27 1 1 32
5.2.7.5 Contributory factors
The attribution of contributory factors to the pedestrian and/or the vehicle or driver was
as follows:
Two collisions with factors only attributed to the pedestrian
11 collisions with factors only attributed to the vehicle or driver
18 collisions with factors attributed to both the pedestrian and the vehicle or
driver.
The factors for the pedestrian are shown in the table below. The most common factors
for the pedestrians were „failed to look properly‟, recorded in ten collisions, and „disability
or illness, mental or physical‟, recorded in eight collisions.

Pedestrian fatalities in London
79
Table 5-69: Pedestrian factors in collisions where the vehicle was speeding
Contributory Factor Number of collisions
801 Crossing road masked by stationary vehicle 3
802 Failed to look properly 10
803 Failed to judge vehicle‟s path or speed 5
804 Wrong use of pedestrian crossing facility 6
805 Dangerous action in carriageway 2
806 Impaired by alcohol 5
807 Impaired by drugs 1
808 Careless, reckless or in a hurry 0
809 Pedestrian wearing dark clothing at night 0
810 Disability or illness, mental or physical 8
Any pedestrian factor 20
No pedestrian factor 11
Total 31
Unsurprisingly, the most common contributory factor in speeding collisions was
„exceeding speed limit‟, recorded in 23 collisions. Although there were 18 collisions with
more than one vehicle/driver/rider factor, the occurrence of any particular other factor
was small, with the second most common factors „failed to look properly‟ and „careless,
reckless in a hurry‟, recorded in four collisions.

Pedestrian fatalities in London
80
Table 5-70: Vehicle/driver/rider factors in collisions where the vehicle was
speeding
Contributory factor Number of collisions
306 Exceeding speed limit 24
405 Failed to look properly 4
602 Careless, reckless or in a hurry 4
406 Failed to judge other person‟s path or speed 3
501 Impaired by alcohol 2
601 Aggressive driving 2
301 Disobeyed automatic traffic signal 2
410 Loss of control 2
605 Learner or inexperienced driver/rider 1
403 Poor turn or manoeuvre 1
701 Vision affected by stationary or parked vehicles 1
304 Disobeyed pedestrian crossing facility 1
409 Swerved 1
505 Illness or disability, mental or physical 1
607 Unfamiliar with model of vehicle 1
509 Distraction in vehicle 1
203 Defective brakes 1
510 Distraction outside vehicle 1
Any vehicle/driver/rider factor 29
No vehicle/driver/rider factor 2
Total 31
5.2.7.6 Countermeasures
Almost all of the collisions had the countermeasure „speed enforcement‟ recorded. With
this countermeasure, it is likely that speed enforcement at the time and location of the
collision would have prevented the collision, but it is unknown whether a higher level of
enforcement at locations across London would have been acted as a deterrent to reduce
the driving speed.
„Improving driver awareness of pedestrians and speed‟ was recorded in 25 cases. The
focus of this educational measure might include improved awareness of pedestrians near
to pedestrian crossings and high pedestrian activity areas. In some cases this measure
was not appropriate, for example, where speeding contributed to the vehicle losing
control and mounting the pavement.
Vehicle engineering measures based on reducing speed, for example, automated brake
systems and intelligent speed adaptation were also commonly recorded.

Pedestrian fatalities in London
81
Table 5-71: Countermeasures for collisions involving a speeding vehicle
Countermeasure Likely Probably Maybe Total
103 Removal of on-street parking 0 0 1 1
105 Provide traffic calming 0 0 3 3
109 Provide or re-site pedestrian crossings 0 1 2 3
110 Provide a central refuge 0 0 2 2
124 Automated emergency brake systems 1 3 7 11
126 Intelligent speed adaptation 1 2 11 14
131 Improved pedestrian awareness of other road users
0 0 9 9
132 Highlight dangers of crossing road whilst
distracted
0 0 2 2
134 Highlight dangers of pedestrians impaired by alcohol or drugs
0 1 4 5
141 Improve driver awareness of pedestrians
and speed
1 3 21 25
143 Roadworthiness of vehicle 0 0 1 1
151 Speed enforcement 1 4 23 28
152 Drinking and driving 1 1 0 2
154 General traffic law enforcement 0 0 3 3
211 Traffic calming interventions targeted at
reducing vehicle speeds
0 2 2 4
241 reducing speed 0 1 1 2
5.2.8 Pedestrians impaired by alcohol
5.2.8.1 Introduction
There are three measures of the impairment of pedestrians due to alcohol or drugs:
Pedestrians where information in the fatal file led to the researchers coding that
the pedestrian was impaired by drugs and/or alcohol;
Pedestrians with „pedestrian impaired by alcohol‟ as a contributory factor‟;
The blood alcohol concentration (BAC) of the 50 pedestrians for which the post
mortem data and detailed injures were coded.
Table 5-72 shows the number of pedestrians that were impaired by alcohol and/or drugs.
In total there were 48 pedestrians impaired by alcohol, of which 10 were also impaired
by drugs, and one pedestrian impaired by drugs only. The occurrence of impairment was
highest for adults aged 25 to 59, with 26 out of the 74 pedestrians in this age group
impaired.

Pedestrian fatalities in London
82
Table 5-72: Impaired by alcohol and/or drugs by pedestrian age
Pedestrian impaired by… 0-15 16-24 25-59 60+ Total
Alcohol only 0 5 28 5 38
Drugs only 0 0 1 0 1
Alcohol and drugs 0 3 7 0 10
Total sample 18 24 74 82 198
Table 5-73 shows that there were 46 pedestrians with „impaired by alcohol‟ as a
contributory factor. There were two fatalities that were impaired by alcohol, but this did
not contribute to the collision. In both cases the pedestrian was on the pavement.
Table 5-73: Pedestrians where ‘impaired by alcohol was a contributory factor
by pedestrian age by pedestrian age
Impaired by alcohol
a contributory factor
0-15 16-24 25-59 60+ Total
Yes 0 8 33 5 46
No 18 16 41 77 152
Total 18 24 74 82 198
Table 5-74 shows the BAC levels recorded in the post mortems of the 50 fatalities for
which these data were available. The BAC was known in 33 cases, and in the majority
(25) there was no alcohol (<10mg/100ml) detected. Where alcohol was detected, it was
often found at very high levels; five pedestrians had a BAC of over 160, twice the
current drink drive limit, including one pedestrian with a level of more than four times
the current drink drive limit.
Table 5-74: Post mortem data by pedestrian age
BAC (mg/100ml)
0-15 16-24 25-59 60+ Total
unknown 1 1 2 13 17
<10 (none) 3 2 5 15 25
10-80 0 0 0 1 1
81-160 0 1 1 0 2
161+ 0 0 5 0 5
Total 4 4 13 29 50
5.2.8.2 Characteristics of pedestrians where ‘pedestrian impaired by alcohol’ was a
contributory factor
As shown above, 33 out of 74 pedestrians aged 25-59 were recorded with „impaired by
alcohol‟ as a contributory factor. Figure 5-3 shows the age distribution in more detail.
The highest incidence of alcohol impairment was for the 30-39 and 40-49 age groups,
with about half of these pedestrians impaired by alcohol. 40 of the 46 pedestrians
impaired by alcohol were male.

Pedestrian fatalities in London
83
Figure 5-3: Age distribution of pedestrians impaired by alcohol
Table 5-75 shows the pedestrian manoeuvres for pedestrians by whether they were
impaired by alcohol. In all cases where the pedestrian was impaired by alcohol the
pedestrians was in the carriageway, and in all cases except one, the pedestrian was
crossing the road. Whilst the percentage of pedestrians crossing elsewhere (away from a
facility) was similar for those impaired and those not impaired, there was a higher
percentage of pedestrians impaired by alcohol that were crossing within 50m of a
crossing (but not at the crossing) (33%) compared with the unimpaired pedestrians
(14%). (See Section 5.2.9 for further analysis of use of crossing facilities.)
Table 5-75: Pedestrian manoeuvres for pedestrians impaired by alcohol
Pedestrian Manoeuvre Pedestrians impaired by
alcohol
Pedestrians not impaired
by alcohol
Total
In carriageway - crossing on pedestrian facility 6 43 49
In carriageway - crossing elsewhere within 50m of crossing 15 22 37
In carriageway - crossing elsewhere 19 62 81
On footway or verge 0 15 15
In carriageway - standing or playing (not crossing) 0 4 4
On refuge / central island / central reservation 0 2 2
In Road - Not Crossing 1 0 1
Unknown or other 5 4 9
Total 46 152 198

Pedestrian fatalities in London
84
5.2.8.3 Characteristics of collisions where ‘pedestrian impaired by alcohol’ was a
contributory factor
Thirty nine of the 46 pedestrians impaired by alcohol were in collisions on A-roads,
including 22 on dual carriageways.
Figure 5-4 shows the number of pedestrian fatalities throughout the week by time period
for pedestrians impaired by alcohol and unimpaired pedestrians. Twenty of the 46
pedestrians impaired by alcohol occurred on a Friday or Saturday and 21 occurred
throughout the week between 6pm and midnight.
Figure 5-4: Pedestrians impaired by alcohol by day and time
Note that each time group includes times up to, but not including the end of the range listed, for example, 6am is included in the 06-12 group.
The majority of the conflicts were the pedestrain crossing the road whilst the vehicle was
travelling straight ahead (conflicts N1 and N2).

Pedestrian fatalities in London
85
Table 5-76: Pedestrian manoeuvres for pedestrians impaired by alcohol
Conflicts Total
N1 Vehicle going ahead, pedestrian left side 21
N2 Vehicle going ahead, pedestrian right side 17
N3 Vehicle left turn, pedestrian left side 3
N7 Manoeuvring vehicle 1
P2 Walking facing traffic 1
P7 Other 2
Q8 Other 1
Total 46
5.2.8.4 Vehicles
Twenty-eight of the pedestrians impaired by alcohol were struck by a car. This included
two taxis/private hire vehicles (Table 5-77). The majority of vehicles were „going ahead
other‟, although four were „moving off‟ and five were turning left or right.
Table 5-77: Vehicle types that struck pedestrians impaired by alcohol
Vehicle type Pedestrian impaired
by alcohol
Pedestrian
unimpaired
Total
Bus/coach 10 23 33
Motorcycle 3 11 14
Car 28 83 111
LGV 1 11 12
HGV 4 23 27
Total 46 151 197
Five of the drivers/riders were speeding and seven hit and ran. Nine drivers were
convicted for a driving offence following the collision, most commonly for careless driving
(5).
5.2.8.5 Contributory factors
Table 5-83 shows how the contributory factors were assigned to the participants of the
collision. Since this collision group is defined by the pedestrian contributory factor
„impaired by alcohol‟ there were no collisions with vehicle/driver/rider factors only.
Nineteen of the collisions had vehicle/driver/rider contributory factors in addition to any
pedestrian contributory factors.

Pedestrian fatalities in London
86
Table 5-78: Contributory factor types in collision where the pedestrian was
impaired by alcohol
Vehicle type Pedestrian factors
only
Pedestrian and vehicle/driver/rider
factors
Total
Bus/Coach 6 4 10
Car 15 13 28
HGV 2 2 4
LGV 1 0 1
Motorcycle 3 0 3
Total 27 19 46
In eight collisions „pedestrian impaired by alcohol was the only pedestrian factor. After
„pedestrian impaired by alcohol‟, the most common pedestrian contributory factor was
„failed to look properly‟, recorded in 27 collisions.
Table 5-79: Pedestrian contributory factors in collision where the pedestrian
was impaired by alcohol
Contributory factor Total
806 Impaired by alcohol 46
802 Failed to look properly 27
803 Failed to judge vehicle‟s path or speed 8
807 Impaired by drugs 7
804 Wrong use of pedestrian crossing facility 5
808 Careless, reckless or in a hurry 4
805 Dangerous action in carriageway 3
810 Disability or illness, mental or physical 2
809 Pedestrian wearing dark clothing at night 1
801 Crossing road masked by stationary vehicle 1
All pedestrians 46

Pedestrian fatalities in London
87
Table 5-80: Top 10 vehicle/driver/rider contributory factors in collision where
the pedestrian was impaired by alcohol
Contributory factor Bus/Coach Car HGV LGV Motorcycle Total
405 Failed to look properly 6 23 3 5 3 40
306 Exceeding speed limit 0 20 1 1 2 24
710 Vision affected by vehicle blind spot
3 2 12 1 18
701 Vision affected by stationary or parked vehicles
3 6 0 2 1 12
602 Careless, reckless or in a hurry 2 8 0 0 0 10
406 Failed to judge other person‟s path or speed
3 5 0 1 1 10
410 Loss of control 2 8 0 0 0 10
509 Distraction in vehicle 3 3 0 0 0 6
501 Impaired by alcohol 0 6 0 0 0 6
304 Disobeyed pedestrian crossing facility
1 2 1 0 1 5
Any vehicle/driver/rider factor 4 13 2 0 0 19
No vehicle/driver/rider factors 6 15 2 1 3 27
All vehicles 10 28 4 1 3 46
5.2.8.6 Countermeasures
All of the collisions involving pedestrians impaired by alcohol were recorded with the
countermeasure „highlight dangers of pedestrians impaired by alcohol or drugs‟. The
perceptions and behaviour of pedestrians impaired by alcohol may be different from
when they were sober, and it is difficult to know whether road safety education to sober
pedestrians would be heeded when they are impaired. Road safety messages could be
included in general education about the dangers of alcohol.

Pedestrian fatalities in London
88
Table 5-81: Countermeasures in collisions where the pedestrian was impaired
by alcohol
Countermeasure Likely Probably Maybe Total
103 Removal of on-street parking 0 1 1 2
109 Provide or re-site pedestrian crossings 0 1 0 1
121 Improve forward, rear and side vision of the vehicle - mirrors
0 2 1 3
122 Improve forward, rear and side vision of the vehicle sensors
1 1 2 4
123 Improve forward, rear and side vision of
the vehicle CCTV
0 1 1 2
124 Automated emergency brake systems 0 3 10 13
126 Intelligent speed adaptation 1 2 3
131 Improved pedestrian awareness of other
road users
0 5 10 15
132 Highlight dangers of crossing road whilst distracted
0 1 0 1
133 Improved pedestrian conspicuity 0 0 1 1
134 Highlight dangers of pedestrians impaired by alcohol or drugs
0 8 38 46
141 Improve driver awareness of pedestrians and speed
0 1 9 10
142 Work related road safety training 0 0 4 4
151 Speed enforcement 0 1 4 5
152 Drinking and driving 0 1 0 1
222 Vehicle design standards 0 0 1 1
223 Pop-up bonnets and improved bumper
design
0 0 2 2
241 Reducing speed 0 0 1 1
5.2.9 Pedestrian crossing facilities
In the majority of cases it was known whether the pedestrian was using a pedestrian
crossing facility during the collision event (unknown for nine pedestrians). Forty-nine
pedestrians were using a crossing facility and 37 pedestrians were crossing the road
within 50m of a crossing facility but had chosen for whatever reason to not use it (Table
5-82).
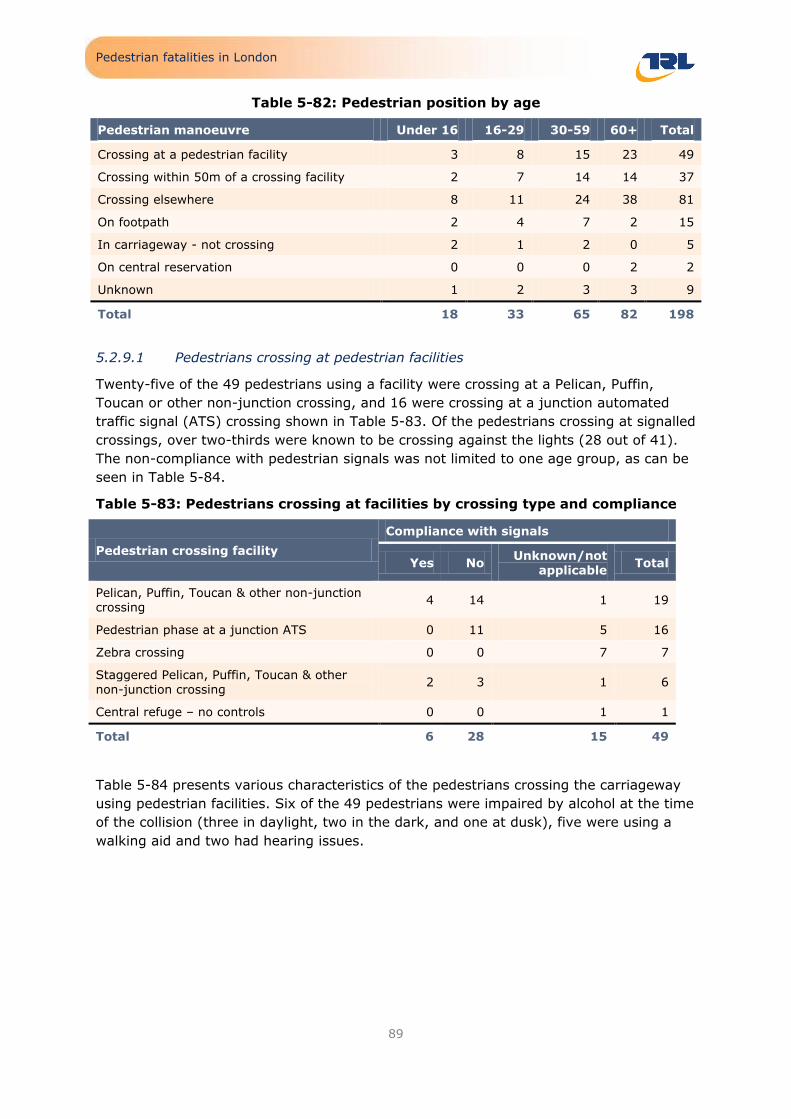
Pedestrian fatalities in London
89
Table 5-82: Pedestrian position by age
Pedestrian manoeuvre Under 16 16-29 30-59 60+ Total
Crossing at a pedestrian facility 3 8 15 23 49
Crossing within 50m of a crossing facility 2 7 14 14 37
Crossing elsewhere 8 11 24 38 81
On footpath 2 4 7 2 15
In carriageway - not crossing 2 1 2 0 5
On central reservation 0 0 0 2 2
Unknown 1 2 3 3 9
Total 18 33 65 82 198
5.2.9.1 Pedestrians crossing at pedestrian facilities
Twenty-five of the 49 pedestrians using a facility were crossing at a Pelican, Puffin,
Toucan or other non-junction crossing, and 16 were crossing at a junction automated
traffic signal (ATS) crossing shown in Table 5-83. Of the pedestrians crossing at signalled
crossings, over two-thirds were known to be crossing against the lights (28 out of 41).
The non-compliance with pedestrian signals was not limited to one age group, as can be
seen in Table 5-84.
Table 5-83: Pedestrians crossing at facilities by crossing type and compliance
Pedestrian crossing facility
Compliance with signals
Yes No Unknown/not
applicable Total
Pelican, Puffin, Toucan & other non-junction crossing
4 14 1 19
Pedestrian phase at a junction ATS 0 11 5 16
Zebra crossing 0 0 7 7
Staggered Pelican, Puffin, Toucan & other
non-junction crossing 2 3 1 6
Central refuge – no controls 0 0 1 1
Total 6 28 15 49
Table 5-84 presents various characteristics of the pedestrians crossing the carriageway
using pedestrian facilities. Six of the 49 pedestrians were impaired by alcohol at the time
of the collision (three in daylight, two in the dark, and one at dusk), five were using a
walking aid and two had hearing issues.

Pedestrian fatalities in London
90
Table 5-84: Characteristics of the pedestrians crossing at facilities by age group
Characteristic Under 16 16-29 30-59 60+ Total
Total crossing at a facility 3 8 15 23 49
Not compliant with signals 2 4 10 13 28
Impaired by alcohol 0 0 5 1 6
Using a walking frame/ stick 0 0 0 5 5
Hearing issues 0 0 0 2 2
Using a mobile phone/headphones 0 3 1 0 4
Note that these categories are not exclusive
The vehicles involved in these collisions are shown in Table 5-85, of which the majority
were cars (28). The drivers/riders of the vehicles were not all complaint with the law or
Highway Code. Three car drivers were impaired by alcohol and five drivers failed to stop
at the collision (one was impaired by alcohol). Four drivers were driving without
insurance of which one had no vehicle tax and two did not have a valid driving licence.
Three of these drivers also failed to stop at the scene. Ten drivers and one rider were
exceeding the speed limit.
Table 5-85: The vehicles involved in collisions at pedestrian crossings
Vehicle Total Impaired by
alcohol Failed
to stop
Car 28 3 5
Bus/coach 9 0 0
Motorcycle 6 0 0
HGV 4 0 0
LGV 2 0 0
Total 49 3 5
The driver/rider was convicted of a driving offence following the event in 20 of the 49
collisions (five drivers were convicted of multiple offences). These are shown in Table
5-86. Fifteen of these drivers were car drivers, two rode motorcycles, one was a bus
driver, one was an HGV driver and one was an LGV driver.
Table 5-86: Driver convictions
Conviction
(note a driver may be convicted of more than one offence) Total
Dangerous driving 8
Careless driving 11
Speeding 2
Drink driving 3
Other motoring offence 5

Pedestrian fatalities in London
91
5.2.9.2 Pedestrians crossing within 50m of a pedestrian facility
Thirty-seven pedestrians were crossing the road within 50m of a crossing facility but had
chosen not use it. This is not limited to one age group and represents around one-fifth of
pedestrians in each adult age group.
Fifteen of the pedestrians who did not use the crossing facility were impaired by alcohol
(three were also impaired by drugs). Alcohol impaired pedestrians appeared not to use a
pedestrian crossing more often than unimpaired pedestrians, Table 5-88. Five
pedestrians using walking aids chose not to use the crossing.
Table 5-87: Characteristics of pedestrians crossing within 50m of a crossing
Characteristic Under 16 16-29 30-59 60+ Total
Total crossing within 50m of a facility 2 7 14 14 37
Impaired by alcohol 0 4 10 1 15
Using a walking frame/ stick 0 0 0 5 5
Running 2 4 5 0 11
Note that these categories are not exclusive
Eleven pedestrians were running across the road at the time of the collision. Table 5-88
suggests that pedestrians choosing not to cross at the available facility were more likely
to be running than those using the crossing.
Table 5-88: Pedestrians’ choice to use a crossing facility by impairment and
travel speed
Characteristic Crossing at a
pedestrian facility
Crossing within 50m
of pedestrian facility Total
Impaired by alcohol 6 15 21
Not impaired by alcohol 42 21 63
Unknown 1 1 2
Running across the road 7 11 18
Not running across the road 40 24 64
Unknown 2 2 4
Total fatalities 49 37 86
It was interesting to see that 13 pedestrians chose to cross away from the crossing
facility when the traffic was heavy (Table 5-89). In fact in heavy queued traffic
conditions and light traffic, pedestrians were more likely to not use the crossing available
to them as shown in Table 5-90 (note this observation is based on very small numbers).

Pedestrian fatalities in London
92
Table 5-89: Pedestrians crossing within 50m of a facility by vehicle type and
traffic conditions
Vehicle Heavy traffic -
moving Heavy traffic -
queued Light/ moderate
traffic Unknown Total
Car 5 2 8 3 18
Bus/coach 0 0 4 3 7
HGV 2 3 4 2 11
LGV 0 1 0 0 1
Total 7 6 16 8 37
Table 5-90: Pedestrians’ choice to use a crossing facility by traffic conditions
Traffic conditions Crossing at a pedestrian facility
Crossing within 50m of pedestrian facility Total
Heavy traffic -moving 7 7 14
Heavy traffic - queued 0 6 6
Moderate traffic 18 6 24
Light traffic 7 10 17
Unknown conditions 17 8 25
Total 49 37 86
The driver was convicted of a driving offence following the event in eight of the 37
collisions. These are shown in Table 5-91. Seventeen of these drivers were car drivers
and one was an HGV driver.
Table 5-91: Driver convictions
Conviction
(note a driver may be convicted of more than one offence) Total
Dangerous driving 1
Careless driving 3
Speeding 2
Drink driving 1
Other motoring offence 2
5.2.9.3 Contributory factors
Contributory factors give an indication of the causes of the collision. These can be
assigned to the pedestrian, driver/rider of the vehicle or to both. Of the 49 collisions
where a pedestrian was crossing at a crossing facility, 17 were thought to have been
caused by the pedestrian, 15 by the driver/rider of the vehicle and in 17 collisions it was
thought both the pedestrian and vehicle/driver/rider contributed to the incident. Of the
37 collisions where a pedestrian chose not to use the available crossing facility, 18 were
thought to have been caused by the pedestrian, one by the driver of the vehicle and in
18 collisions it was thought both the pedestrian and vehicle/driver/rider contributed to
the incident.

Pedestrian fatalities in London
93
Table 5-92: The most common pedestrian contributory factors where
pedestrians were crossing at or within 50m of a crossing facility
Contributory factor Crossing at a pedestrian
facility
Crossing within 50m of
pedestrian
facility
„Wrong use of pedestrian crossing facility‟ 23 6
„Failed to look properly‟ 18 24
„Impaired by alcohol‟ 6 15
„Failed to judge vehicle‟s path or speed‟ 5 8
„Careless, reckless in a hurry‟ 4 3
Total pedestrians assigned factors 34 36
Table 5-93: The most common vehicle/driver/rider contributory factors where
pedestrians were crossing at or within 50m of a crossing facility
Contributory factor Crossing at a pedestrian facility
Crossing within 50m of pedestrian facility
„Failed to look properly‟ 13 8
„Exceeding the speed limit‟ 8 3
„Vehicle blind spot‟ 5 5
„Disobeyed automatic traffic signal‟ 4 0
„Distraction in vehicle‟ 4 0
„Careless, reckless in a hurry‟ 4 1
„Impaired by alcohol‟ 3 1
„Disobeyed a pedestrian crossing facility‟ 3 1
Total vehicles/drivers/riders assigned factors 32 19
5.2.9.4 Countermeasures
Table 5-94 lists the most frequently recorded countermeasures for collisions at
pedestrian crossings. Education measures are suggested such as improving pedestrian
awareness of other road users (25) and improving driver awareness of pedestrians and
speed (24). This is directly related to the high frequency of the contributory factors
„wrong use of pedestrian crossing‟ and drivers „failing to look properly‟ and „exceeding
the speed limit‟. The engineering measure, automated emergency brake systems may
have helped to prevent 21 collisions.
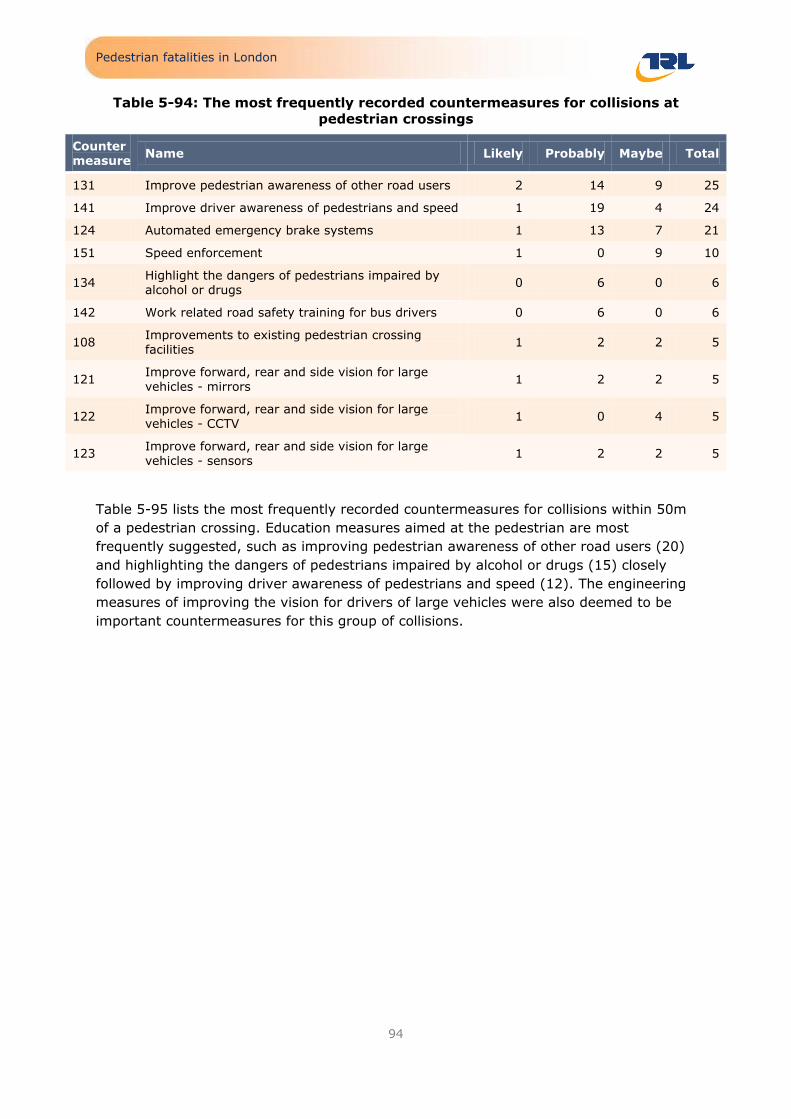
Pedestrian fatalities in London
94
Table 5-94: The most frequently recorded countermeasures for collisions at
pedestrian crossings
Counter measure
Name Likely Probably Maybe Total
131 Improve pedestrian awareness of other road users 2 14 9 25
141 Improve driver awareness of pedestrians and speed 1 19 4 24
124 Automated emergency brake systems 1 13 7 21
151 Speed enforcement 1 0 9 10
134 Highlight the dangers of pedestrians impaired by alcohol or drugs
0 6 0 6
142 Work related road safety training for bus drivers 0 6 0 6
108 Improvements to existing pedestrian crossing facilities
1 2 2 5
121 Improve forward, rear and side vision for large
vehicles - mirrors 1 2 2 5
122 Improve forward, rear and side vision for large vehicles - CCTV
1 0 4 5
123 Improve forward, rear and side vision for large vehicles - sensors
1 2 2 5
Table 5-95 lists the most frequently recorded countermeasures for collisions within 50m
of a pedestrian crossing. Education measures aimed at the pedestrian are most
frequently suggested, such as improving pedestrian awareness of other road users (20)
and highlighting the dangers of pedestrians impaired by alcohol or drugs (15) closely
followed by improving driver awareness of pedestrians and speed (12). The engineering
measures of improving the vision for drivers of large vehicles were also deemed to be
important countermeasures for this group of collisions.

Pedestrian fatalities in London
95
Table 5-95: The most frequently recorded countermeasures for collisions within
50m of a pedestrian crossing
Counter measure
Name Likely Probably Maybe Total
131 Improve pedestrian awareness of other road users 0 11 9 20
134 Highlight the dangers of pedestrians impaired by alcohol or drugs
0 11 4 15
141 Improve driver awareness of pedestrians and speed 0 1 11 12
122 Improve forward, rear and side vision for large vehicles - CCTV
4 1 4 9
121 Improve forward, rear and side vision for large vehicles - mirrors
0 2 5 7
123 Improve forward, rear and side vision for large vehicles - sensors
0 2 4 6
124 Automated emergency brake systems 0 5 1 6
142 Work related road safety training for bus drivers 0 6
6
151 Speed enforcement 0 1 3 4
114 Reduce speed limit or create 20mph zone 0 1 2 3
5.2.10 Pedestrians on the pavement
5.2.10.1 Who was involved?
There were ten male drivers and two female drivers that mounted the pavement and
collided with a pedestrian. From Table 5-96, it can be seen that all ages of driver are
involved in this type of conflict.
Table 5-96: Age groups of drivers in collisions with pedestrians on the footpath
Age group Male Female Total
Under 16 0 0 0
16-24 2 0 2
25-29 2 0 2
30-39 0 1 1
40-49 2 0 2
50-59 2 0 2
60-69 2 0 2
70+ 0 1 2
Total 10 2 12
Two drivers had no regard for the law; both were impaired by alcohol, both had no tax
or insurance and one of these also did not hold a driving licence. Two drivers were
speeding and one driver was using a mobile phone. Three drivers had a medical
condition.

Pedestrian fatalities in London
96
The pedestrians involved have not been described here as their personal characteristics
are not relevant to the collision or how it could be avoided. The pedestrians were all on
the footpath and just happened to be in the wrong place at the wrong time.
5.2.10.2 What happened?
Nine cars and three buses/coaches were involved in these collisions (see previous Table
4-23). Nine of the vehicles were going ahead, one was turning left, one was turning right
and one vehicle was reversing.
Eleven of the vehicles mounted the footpath and struck the pedestrian:
Driver experienced a medical event (3 collisions);
Driver lost control (4 collisions):
o Speeding driver turning left
o Speeding driver struck kerb
o Driver coughed
o Mechanic testing an unfamiliar sports car
Alcohol impaired driver (2 collisions):
o Stuck kerb
o Struck two vehicles & ended up on pavement
Driver distracted (2 collisions):
o By a newspaper and fatigued
o By a mobile phone
One car was reversing out of a drive into the road and did not see the pedestrian on the
pavement.
5.2.10.3 Contributory factors
Contributory factors were assigned to the driver in all cases as the pedestrian just
happened to be on the pavement at that particular point in time. Table 5-97 shows the
details.
Table 5-97: Contributory factors assigned to the driver
Contributory factor Total
Loss of control 4
Illness, disability, mental or physical 3
Exceeding the speed limit 2
Impaired by alcohol 2
Distraction in vehicle 2
The three drivers that experienced a medical episode at the time of the collision were not
convicted of a driving offence. Eight drivers were convicted of a driving offence; five
were convicted of careless driving, four dangerous driving and one other motoring
offence. One driver received a fine and a driving ban.

Pedestrian fatalities in London
97
5.2.10.4 Countermeasures
Table 5-98 lists the recorded countermeasures for vehicles on the footpath conflicts.
Engineering measures are suggested such as automated emergency brake systems (6),
intelligent speed adaption (2) and improving the rear vision of the vehicles via sensors
and mirrors (1). Speed enforcement and drinking and driving enforcement may have
prevented two collisions. Reducing the vehicle speed through engineering methods such
as traffic calming and educating drivers may have lead to a reduction in the pedestrian‟s
injury severity.
Table 5-98: The most frequently recorded countermeasures for collisions where the vehicle mounted the footpath
Counter measure
Name Likely Probably Maybe Total
124 Automated emergency brake systems 0 0 6 6
141 Improve driver awareness of pedestrians and speed
0 0 3 3
142 Work related road safety training for bus
drivers 0 1 2 3
151 Speed enforcement 0 0 2 2
152 Drinking and driving enforcement 1 1
2
126 Intelligent speed adaptation 0 0 2 2
121 Improve forward, rear and side vision of the vehicle - mirrors
0 1 0 1
122 Improve forward, rear and side vision of
the vehicle sensors 0 1 0 1
154 General enforcement 0 0 1 1
211 Traffic calming interventions targeted at
reducing vehicle speeds 0 0 1 1
241 Reducing speed 0 1 0 1

Pedestrian fatalities in London
98
6 Conclusions
The fatal files for 197 pedestrians who died in road traffic collisions in London were
reviewed as part of this project. The sample covered years 2006-10 and was selected to
be broadly representative in terms of pedestrian age group, the vehicles involved and
geography (inner or outer London).
A structured database was created, based on Haddon‟s Matrix (Haddon Jr, 1999), which
included items related to the environment, the pedestrian, and vehicle(s) and their
driver(s)/rider(s) in terms of pre-event, event and post-event.
The analysis did not include other pedestrian casualty injury severities, nor did it
consider damage only collisions or account for exposure to risk.
STATS19, or ACCSTATS data, recorded for all reported collisions in Great Britain includes
over 50 items of data, although this does not provide detailed information on every
element of the collision, vehicle or casualty. The fatal collision files used for this research
are a rich source of information and contain much greater detail about the collisions,
vehicles and casualties than are routinely available. However, this is not an exhaustive
collection of data due to the practical limitations of reviewing the files.
6.1 Key results in terms of Haddon’s matrix
The key results from the 197 fatalities in terms of Haddon‟s matrix are:
Pre-event
o Pedestrians:
57% of the fatalities were male;
65 pedestrians (33%) were 70 years or over
Where known, the majority of pedestrians were familiar with their
route;
Where known, the majority of journeys were leisure journeys;
165 of the fatalities (83%) were from London;
The majority of adult pedestrians were walking alone while the
under 16s were more likely to be accompanied;
Four pedestrians were using a mobile phone prior to the collision
and two were wearing headphones (none of these were children);
Only three pedestrians were wearing high visibility clothing;
48 of the pedestrians (24%)were impaired by alcohol (combined
with drugs in 10 cases) and one pedestrian was impaired by drugs
only;
The majority of the pedestrians did not have a disability or illness,
although 13 fatalities were using a walking aid.
o Vehicles and drivers/riders
56% of the pedestrians were struck by a car, 17% by a bus or
coach and 14% by an HGV;

Pedestrian fatalities in London
99
The vast majority of vehicles had no defects prior to the collision;
About half of the drivers/riders were aged between 30 and 50;
there was one underage driver and seven drivers aged 70 or over;
Where known, the majority of the drivers/riders were from London;
There was no evidence of alcohol or drug impairment for drivers of
motorcycles, LGVs, HGVs or buses/coaches, but there were six car
drivers impaired by drugs and/or alcohol;
Three drivers suffered a medical incident just prior to the collision;
four were using a mobile phone and 12 had another distraction.
o Road environment
178 of the 197 collisions (90%) were on roads with a speed limit of
30mph or lower and 145 collisions (74%) occurred on A-roads;
64% of the collisions were within 20m of a junction; most
commonly at a T, staggered junction or crossroads;
There was a crossing facility within 50m of the collision site in 91
locations (46%);
117 (59%) pedestrian fatalities occurred between 6am and 6pm;
however, at weekends there were greater numbers of pedestrian
fatalities at night compared with during the day.
Event
o Pedestrian
In 177 of the collisions (90%), the pedestrian was crossing the
road, most commonly whilst the vehicle was travelling straight
ahead;
49 pedestrians (25%) were crossing at a facility and 37 (19%)
were crossing within 50m of a facility;
14 of the pedestrians accidentally stumbled or fell (9 of which were
impaired by alcohol) just prior to the collision.
12 pedestrians were in collisions on the footpath;
7 pedestrians were in collisions with a reversing vehicle; all of
these conflicts involved a car and an elderly pedestrian;
o Vehicle and driver/rider:
15 of the 27 HGVs which hit a pedestrian were moving off when
they struck the pedestrian.
o Contributory factors:
96 pedestrians (48%) were recorded with „failed to look properly‟
as a contributory factor and this factor was most common for all
age groups;
38% of adults aged between 16 and 59 were recorded with
„impaired by alcohol‟ as a contributory factor;

Pedestrian fatalities in London
100
13 of the 82 pedestrians aged 60 or over (16%) were recorded
with „wrong use of pedestrian crossing facility‟ as a factor;
The most commonly recorded contributory factor for vehicles was
„failed to look properly‟, recorded for 20% of vehicles; this was
most common for all vehicle types except for HGVs, for which
„vision affected by blind spot‟ was more common (recorded for 12
out of 27 HGVs).
Post-event
o The most common trajectory for the pedestrians was being knocked to the
ground, but not run over (62 collisions). In 56 cases the pedestrian was
run over;
o 115 the pedestrians (58%) died at the scene of the collision, and there
were 14 who died more than 10 days later;
o 68 drivers/riders (35%) were convicted following the collision, most
commonly for careless driving (40);
o 24 vehicles (12%) failed to stop at the scene of the collision, all of which
were later traced. For large vehicles such as HGVs or buses/coaches, the
driver may not have realised that a collision occurred;
o For the 50 cases where the post mortems were coded, the most common
life-threatening injuries were head (34) and thorax (31) injuries; 18 had
both head and thorax.
6.2 Collision types
The following groups were identified as being of special interest. In each case the
collisions within each group were analysed in terms of who was involved, the
contributory factors, injuries and possible countermeasures. The groups of fatalities and
the number of pedestrians in the sample are as follows (note that these groups are not
exclusive):
Table 6-1: Collision types and number of fatalities in sample
Collision type Number of pedestrian fatalities in sample
Pedestrians using a pedestrian facility 49
Pedestrians impaired by alcohol 46
Pedestrians aged 80 years and over 41
Pedestrians crossing the carriageway choosing not to use the available crossing facility
37
Pedestrians in collisions with buses/coaches 33
Pedestrians struck by speeding vehicles 32
Pedestrians in collisions with HGVs 27
Drivers that failed to stop 24
Child pedestrians 18
Pedestrians in collisions with motorcycles 14
Vehicles mounting the pavement/footpath 12

Pedestrian fatalities in London
101
7 Recommendations
Overall, the most common countermeasures recorded were primary countermeasures,
aimed at preventing the collision. Secondary countermeasures, aimed at reducing the
severity of the collision were less frequently recorded, partly because a large proportion
of the pedestrian sample was elderly and vulnerable to injury.
For primary countermeasures, the most commonly recorded type of countermeasure was
pedestrian education. Vehicle engineering countermeasures and driver/rider education
were also commonly recorded.
This project did not seek to consider the effectiveness of the countermeasures; therefore
whilst they could have prevented the incident or reduced the severity of the incident,
further work should be undertaken to understand the likely effect of any intervention on
fatal collisions, other casualties and any other implications. The exact details of any
educational measures, such as how these should be delivered, have not been
considered.
Countermeasures may not be immediately applicable and may be developed in the
medium to longer term.
The following countermeasures should be considered for action or further evaluation.
Improved pedestrian awareness of other road users (77 collisions)
This was the most commonly reported countermeasure overall, recorded in 77 collisions
(39% of sample). It was also commonly recorded in the following collision types:
Motorcycles (11)
o The most common contributory factor for pedestrians was „failed to look
properly‟ and „failed to judge motorcyclist path or speed‟. Education and
publicity measures which address these factors may help to reduce the
number of these collisions.
Buses and coaches (12)
o As with other vehicle types, „failed to look properly‟ was the most common
contributory factor, therefore education and/or publicity measures which
highlight the importance of looking properly for these vehicles may be of
use.
HGVs (12)
o The most common contributory factor for this collision type was „driver
vision affected by vehicle blind spot‟. In addition to ensuring that mirrors
and/or sensors are fitted to these vehicles and used, education or publicity
measures aimed at pedestrians, highlighting the problem of blind spots
and discouraging pedestrians from crossing where they cannot be seen by
a driver may help to reduce the number of collisions of this type.
Children (10)
o Children‟s failure to look was the most commonly recorded contributory
factor. Education or publicity measures aimed at increasing children‟s

Pedestrian fatalities in London
102
awareness of other road users in terms of looking may be beneficial. For
some of the youngest age group, education or publicity aimed at people
with responsibility for the young pedestrians may also be beneficial.
Elderly (19)
o Failed to look properly was the most common contributory factor.
Common collision scenarios included crossing within 50m of a pedestrian
crossing facility and crossing in a vehicle‟s blind spot. Education or
publicity measures aimed at this group might include these problems in
particular. The delivery of such education or publicity to this group may be
difficult as the pedestrians may have long-term habits and may not feel
the need for re-education. A study to investigate the behaviours of this
group may be beneficial in order to target the education or publicity.
Crossing at or near a crossing (25 and 20 respectively)
o There were a considerable number of fatalities which occurred within 50m
or a crossing or where the pedestrian crossed against the pedestrian
signals. Education or publicity measures to improve the correct use of
crossing may help to improve safety on the roads. In addition, there were
several collisions involving impaired pedestrians (alcohol or mobility)
which occurred within 50m of a crossing, and several collisions where a
pedestrian crossed in the blind spot in front of a vehicle at a queue at
traffic signals.
Highlight dangers of pedestrians impaired by alcohol or drugs (47 collisions)
Almost half of pedestrian fatalities aged between 30 and 49 were impaired by
alcohol. These collisions generally occurred on evenings/nights and at weekends.
Collisions often occurred within 50m of a pedestrian crossing. Where the level of
alcohol was known, it was present in high concentrations. The perceptions and
behaviour of pedestrians impaired by alcohol may be different from when they
were sober, and it is difficult to know whether road safety education to sober
pedestrians would be heeded when they are impaired. Road safety messages
could be included in general education about the dangers of alcohol.
Countermeasures to reduce the incidence of speed-related collisions
Countermeasures aimed at reducing speed may reduce the incidence of speed-
related collisions, that is, collisions where the vehicle was travelling above the speed
limit. These countermeasures may also reduce the number of collisions where,
although the vehicle was travelling within the speed limit, a reduced speed may have
prevented or reduced the severity of the collision. The particular countermeasures
identified were:
Improve driver awareness of pedestrians and speed (70)
This countermeasure, aimed at drivers, was the most common countermeasure
for collisions which involved a vehicle speeding. Speeding drivers were more likely
to be aged 20 to 29, and the majority occurred on a 30mph limit road at speeds
between 35mph and 76mph. Some of the speed-related collisions occurred near
to a pedestrian crossing facility, and some of the collisions involving elderly
pedestrians were also speed-related. Education or publicity measures focused on

Pedestrian fatalities in London
103
speed and pedestrians may help to reduce the incidence of these types of
collisions.
Automated emergency brake systems (60)
This countermeasure may avoid a collision entirely or reduce the speed of the
vehicle so that the severity is reduced. These systems automatically apply the
brakes when the vehicle senses an impending impact. These systems are
developed by vehicle manufacturers and their penetration into the vehicle fleet
may be difficult to influence.
Speed enforcement (28)
The number of speed-related collisions may be reduced with speed enforcement.
With this countermeasure, it is likely that speed enforcement at the time and
location of a collision would have prevented the collision, but it is unknown
whether a higher level of enforcement on locations across London would have
been acted as a deterrent to reduce the driving speed. Enforcement across
London would need to be targeted to locations and time periods where maximum
benefit could be achieved.
Improve forward, rear and side vision of the vehicle
There were 20 collisions (13 of which involved an HGV) where the driver‟s vision
was affected by a vehicle blind spot. The number of such collisions could be
reduced by improving the vision of the driver; by ensuring that the required
mirrors are installed, or by installing sensors, or by ensuring that the mirrors
and/or sensors are used.
Secondary countermeasures
Pop up bonnets and improved bumper designs were recorded as important
potential countermeasures in six collisions. However, because of the difficulty of
assessing how well an improved, more forgiving vehicle structure could have
performed to prevent or mitigate injuries, this is likely to be an underestimate.

Pedestrian fatalities in London
104
8 Acknowledgments
The work described in this report was carried out by the Safety Division of TRL. The
authors are grateful to Richard Cuerden and Iain Knight who carried out the technical
review and auditing of this study and report and to the team who coded the data from
the fatal files.
The authors are also grateful to the Department for Transport for granting permission to
use the archive of fatal files held at TRL; and TRL also appreciate the co-operation of the
Metropolitan Police during this project for allowing us to access their fatal files.

Pedestrian fatalities in London
105
References
AAAM. (2005). Abbreviated Injury Scale 2005. Association for the Advancement of
Automotive Medicine, PO Box 4176, Barrington, IL 60011-4176, USA.
ACPO. (2000). ACPO enforcement guidelines. Retrieved from PePiPoo:
http://www.pepipoo.com/files/ACPO/ACPO_enforcement_guidelines.htm
Constant, A., & Lagarde, E. (2010). Protecting vulnerable road users from injury.
Retrieved February 2012, from PLoS Medecine:
http://www.plosmedicine.org/article/info%3Adoi%2F10.1371%2Fjournal.pmed.1000228
Crandall, J. R., Bhalla, K. S., & Madeley, N. J. (2002). Designing road vehciles for
pedestrian protection. British Medical Journal, 34, 1145-1148.
DfT. (2004). Instructions for the completion of road accident reports. Retrieved October
2011, from http://www.dft.gov.uk/collisionreporting/Stats/stats20.pdf
DfT. (2010). Reported Road Casualties Great Britain 2009. London: The Stationery
Office.
DfT. (2009). Reported Road Casualties Great Britain: 2008 - Annual Report. Retrieved
October 2011, from Department for Transport:
http://www2.dft.gov.uk/pgr/statistics/datatablespublications/accidents/casualtiesgbar/rr
cgb2008.html
DfT. (2011). Reported road casualties in Great Britain: annual report 2010. Retrieved
October 2011, from Department for Transport:
http://www.dft.gov.uk/statistics/releases/road-accidents-and-safety-annual-report-2010
DfT. (2007). Road Casualties Great Britain: 2006 - Annual Report. Retrieved October
2011, from Department for Transport:
http://webarchive.nationalarchives.gov.uk/+/http://www.dft.gov.uk/pgr/statistics/datat
ablespublications/accidents/casualtiesgbar/roadcasualtiesgreatbritain2006
DfT. (2008). Road Casualties Great Britain: 2007 - Annual Report. Retrieved October
2011, from Department for Transport:
http://www2.dft.gov.uk/pgr/statistics/datatablespublications/accidents/casualtiesgbar/ro
adcasualtiesgreatbritain20071.html
Greater London Authority. (2010). Mayor's Transport Strategy. London: Greater London
Authority.
Haddon Jr, W. (1999). The changing approach to the epidemiology, prevention, and
amelioration of trauma: the transistion approaches etiologically rather than descriptively
based. Volume 5(3):231-235. Injury Prevention. Retrieved July 21, 2011, from Pub Med
Central: http://www.ncbi.nlm.nih.gov/pmc/articles/PMC1730511/pdf/v005p00231.pdf
Martin, A. (2006). TfL. Retrieved February 2012, from Factors influencing pedestrian
safety: A literature review. TRL report PPR 241:
http://www.tfl.gov.uk/assets/downloads/Factors-Influencing-pedestrian-safety-
literature-review.pdf
New York City Department of Transportation. (2010). New York City. Retrieved February
2012, from The New York City Pedestrian Safety Study and Action Plan:
http://www.nyc.gov/html/dot/downloads/pdf/nyc_ped_safety_study_action_plan.pdf

Pedestrian fatalities in London
106
Office for National Statistics Population Estimates. (2011). Retrieved March 2012, from
Greater London Authority: http://data.london.gov.uk/datastore/package/office-national-
statistics-ons-population-estimates-borough
TfL. (2008). Casualties in Greater London during 2007. Retrieved October 2011, from
TfL: http://www.tfl.gov.uk/assets/downloads/casualties-in-Greater-London-during-
2007.pdf
TfL. (2010). Casualties in Greater London during 2009. Retrieved October 2011, from
http://www.pacts.org.uk/docs/pdf-bank/casualties-in-greater-london-during-2009.pdf
TfL. (2009). Casualties in Greater London in 2008. Retrieved October 2011, from TfL:
http://www.tfl.gov.uk/assets/downloads/casualties-greater-london-2008.pdf
TfL. (2011, May). Casualties in Greater London in 2010. Retrieved May 15, 2011, from
TfL: http://www.tfl.gov.uk/assets/downloads/Cycling/casualties-in-greater-london-
2010.pdf
Tsuji, T., Hattori, H., Watanabe, M., & Nagaoka, N. (2002). Development of night-vision
system. Intellegent Transportation Systems, 3 (3), 203-209.

Pedestrian fatalities in London
107
Appendix A Haddon’s Matrix for pedestrian fatalities
The structure of the Haddon‟s matrix which guided the content analysis of the police
fatal files is shown below. It was developed by the project team drawing on their
previous experience of what is available in the files and what is poorly collected. The
matrix was used as the basis for the coding structure of the database.

Pedestrian fatalities in London
108
Pedestrian
Other vehicle/s involved
(information collected for each vehicle involved) Environment
Vehicle Driver
Pre event
Personal characteristics:
Age/date of birth,
gender,
ethnicity,
postcode,
UK resident,
impairment (alcohol, drugs, fatigue)
Uncorrected eyesight, illness, hearing
issues, disability
Mobility
special personal circumstances
Situation:
journey purpose,
knowledge of route/location,
pedestrian accompaniment,
travel mode if child <11
mobile phone, reading, headphones,
eating/drinking, talking/interaction, playing,
manoeuvre,
stance (standing/fall/trip)
using pedestrian crossing
compliance with signals
Equipment etc:
high visibility clothing,
eyes/face restricted by sun glasses,
hood etc
carrying a load
pushing/pulling an object
Vehicle characteristics:
vehicle type, vehicle make/model, year of registration/age
insurance, tax, vehicle condition,
engine type/position, For Buses/HGVs - details of mirrors fitted and protective
guards,
Situation: travelling speed,
manoeuvres,
Personal characteristics:
age, gender, ethnicity,
postcode, UK resident, impairment (e.g. alcohol,
drugs, illness, fatigue), driving licence status conviction history,
special personal
circumstances,
Situation:
journey purpose (e.g. private/work),
journey start point
type of route knowledge of route/location, distractions (mobile phone/passengers),
vision affected (e.g. by parked cars, road layout, vehicle blind spot,
number of passengers, compliance with law, compliance with highway
code, Appropriate signalling,
vision restricted by sun
glasses, hood etc
Situation:
date/time, day of week, light conditions,
weather, road class road type (e.g. single,
dual) Borough, speed limit,
traffic conditions (e.g.
congested)
Road layout: junction details, bus lane,
guard rails, pedestrian infrastructure, traffic controls, crossing type

Pedestrian fatalities in London
109
Event
Situation:
Manoeuvres
road position,
vision affected by parked vehicles,
vegetation, road layout, dazzling headlight etc)
speed (walking, running),
distractions,
first vehicle hit
impact with objects
Interaction with vehicle
Situation:
impact speed,
manoeuvres - evasion,
first object hit,
interaction with
pedestrian/other vehicles
details of other vehicles
involved.
Situation:
Impairment,
distractions (internal/external
to vehicle),
Situation:
using crossing facility,
proximity to bus stop,
road surface (quality,
state including contamination, wet),
site maintenance (e.g.
potholes, ironwork,
debris),
Detailed description of the event (the „story‟)
Post Event
Outcome:
cause of death,
date of death,
injuries incurred.
Outcome:
convictions in relation to this
collision,
legal advice,
counselling.

Pedestrian fatalities in London
110
Appendix B Database coding guidelines
B.1 Introduction
This appendix was given to the coders to assist with coding police fatal files for the
Pedestrian fatality project.
The majority of responses are in one of three formats:
1. Drop down lists
Select the relevant answer; if regularly using the „other‟ option discuss
making changes to the drop down list. If „other‟ is selected specify in the
notes what the „other‟ is. Do not leave these entries blank: select unknown
or none from the drop down menus. If unknown is not an option on the
drop down list, leave field blank and raise issue.
2. Tick boxes
Tick = yes, blank = no, shaded = unknown / not applicable.
3. Free text
Complete as appropriate, keep text as similar between records, and as
concise, as possible. Where the information is unavailable enter
“unknown” in a text field or “-9” in a numerical field.
The accident reference number is a unique reference that identifies each collision in the
database and comprises the police force reference (01 for all of these files), the last two
digits from the year and the 7 digit reference from the police (on the front of the file in
pencil), for example, 0107TE00017. The database can be linked to the STATS19 report
of the collision using this reference.
B.2 Guidance for each table/form/variable in database
B.2.1 Environment
The “Environment” form summarises the key circumstance of the collision. Several fields
should be prefilled from the STATS19 records, although these will need to be checked,
and additional information added.
Variable Comments
ID This is an automatically generated number field. This field does not need checking or changing.
Coded by
STATS19 accident reference
number
This is assigned to an accident by the police and consists of 11 digits. Where the
STATS19 data has been prefilled this field will already be completed and accident records should be found by filtering on this field.
Accident date Entered in the format dd/mm/yyyy. All dates in the pedestrian database are prefilled from STATS19 as 1st of the month change to the correct date.
Accident time Enter in the format hh:mm using the 24 hour clock.
Light conditions

Pedestrian fatalities in London
111
Weather This should have been prefilled with STATS19 data; however, the STATS19 list is
different to the fatal files list so some records will need adjusting.
Speed limit The speed limit of the road at the time of the collision, i.e. the maximum speed
that any vehicle can travel. If a temporary speed limit is in operation then record this rather than the permanent speed limit on the road.
Borough Filled in from STATS19
Road Class Filled in from STATS19
Road Type Filled in from STATS19
Traffic conditions Light, Moderate, Heavy but free flowing, Heavy stop/start, Unknown
Bus lane Was there a bus lane present at the scene of the collision that could have influenced the behaviour of the vehicles involved? If a bus lane is present but on
the opposite side of the road to all vehicles involved in the collision this is unlikely to have contributed and hence tick box should be left blank.
Proximity to bus stop (pedestrian database only)
Rough distance to bus stop
Traffic control Look at photographs and description if none seen or described mark as „no‟, if seen
or observed tick yes, else leave as unknown
Junction detail filled in from STATS19
Road surface condition filled in from STATS19
Site maintenance Select none if none stated, only use unknown if collision circumstances are very unclear.
High friction surfacing If described then yes. If not mentioned, then put unknown. Do not rely on photos.
Conflicts Write code for conflict, see B.7
Story/Summary Text This should concentrate on answering three main questions: what was the pedestrian/PTW doing before the collision? How did the pedestrian/PTW interact and what happened next. The story must be anonymous.
Road closed following acc? If file says that road was closed then yes, if not mentioned then unknown
Pedestrian crossing type (pedestrian database only)
Guard rails (Pedestrian database only)
look at photographs and description if none seen or described mark as „no‟ else leave as unknown
Distance to crossing (Pedestrian database only)
Pedestrian flow conditions (pedestrian database only)
Light: Pedestrians can move freely
Moderate: Pedestrians occasionally interrupt each other‟s movement on the footway
Heavy: Pedestrians often interrupt each other‟s movement on the footway
Roadworks or construction site present
Shared space / pedestrianised
Shared space: A street shared by all modes of traffic that has no clearly defined boundaries of segregation
Pedestrianised: A street which generally has no vehicular access

Pedestrian fatalities in London
112
B.2.2 Pedestrian data
Variable Comments
Pedestrian ID A number that is unique within each accident in order to identify a selected pedestrian
fatality. Usually there will only be one pedestrian fatality per accident so the pedestrian ID will be 1
1st vehicle hit by The vehicle ID of the first vehicle to make contact with the pedestrian.
Age
Date of birth
Gender
Ethnicity
Postcode Home postcode of the pedestrian.
Nationality Was the pedestrian from the local area, from a nearby area or a visitor from another county or country?
Mobility Assume none if not mentioned, or unknown if details are unclear.
Alcohol
Tick if pedestrian was IMPAIRED by.
If not mentioned, assume none.
Unknown if details are unclear
Drugs
Fatigue
Uncorrected, defective eyesight
Hearing issues
Other relevant illness or disability
Journey purpose
Knowledge of route/location
Regular commuting: journeys taken on most days of the week
Familiar: journeys that have been taken before, but not on a regular basis
unfamiliar: unknown routes
Pedestrian accompaniment
Walking dog
Pedestrian distractions
If not mentioned, assume none.
Unknown if details are unclear
Eating & drinking
Reading
Mobile to ear
Headphones
Other interaction with mobile
Talking to other pedestrians
Yelling across road
Following other pedestrians
Playing
Other
Manoeuvre
Stance If not mentioned use „standing‟. „Standing includes walking, running

Pedestrian fatalities in London
113
Travel mode (if child <11)
Pushing/Pulling if not mentioned use none, use unknown if details are unclear
Pedestrian using crossing Was pedestrian using the pedestrian crossing – includes refuge with no control. If unclear then unknown
Compliance with signals Tick yes if the pedestrian crossed on green man (or flashing) phase. No if red man phase. Unknown if unclear
High visibility clothing
Carrying load
Evasion attempted
Eyes/face covered/restricted by?
Assume none if not specifically stated that item restricted vision. If item mentioned
but unclear whether it contributed to accident, select unknown
Line of vision affected by If „other‟ please specify in the pedestrian special details what this is and possibly give
extra detail here. For example, vision may have been affected by a passing car.
Pedestrian speed
Impact with objects
Pedestrian trajectory
Cause of death: Injury to
Date of death
Special personal circumstances
wearing dark clothing at night’
B.2.3 Other vehicle
Variable Comments
Environment ID Automatically completed from Environment form
Vehicle ID The ID given to the other vehicle in the accident (must be completed)
Registration plate year http://www.motorcycle.co.uk/reference-material/uk-registration-letters.aspx
Veh make
Veh model
Insurance Tick if valid insurance mentioned, blank if definitely not, else unknown
Tax Tick if valid tax mentioned, blank if definitely not, else unknown
Pre event vehicle condition Was there any damage to the vehicle before the collision which may have
contributed to the collision taking place? write „unknown‟ if not stated
Engine type
Engine position
Offside main mirror HGV and buses only
Nearside main mirror
Offside wide angle mirror
Nearside wide angle mirror
Close proximity mirror

Pedestrian fatalities in London
114
Front mirror
Off-side protective guard
Near-side protective guard
Driver age
Driver gender
Driver ethnicity
Driver postcode
Driver nationality
Driving licence
appropriate?
Journey purpose
Journey start point enter a postcode or address
Knowledge of route/location
Driver distraction Assume none if not mentioned, or unknown if details are unclear. Select only if directly contributory to the collision
Driver impairment Assume none if not mentioned, or unknown if details are unclear. Select only if
directly contributory to the collision
Vision restriction
Number of occupants/passengers
not including the driver
Manoeuvre
Appropriate signalling
Compliance with law
If no state non compliance with law
Compliance with highway code
If no state non compliance with HC
Line of vision affected by
Evasion attempted Long
Min travelling speed Take information from police officer‟s report and not from the witness statements.
Max travelling speed
Min impact speed
Min impact speed
1st point of impact with
PTW
12 = front, 3 = left, 6 = rear, 9 = back etc
1st object hit
Was vehicle driveable after acc?
Conviction history
Drink driving Convictions as a result of this collision. Use the DVLA offence codes. So for example

Pedestrian fatalities in London
115
Speeding if the driver was convicted of driving without due care and attention, this should be
recorded as Careless driving. Careless driving
Dangerous driving
Construction & use
Other motoring offences
Special personal
circumstances
Legal advice
Counselling
B.3 Countermeasures/interventions
These are listed in Appendix C
B.4 Notes
Use to record important elements which are not recorded elsewhere.
B.5 Convictions
Code Accident Offences
AC10 Failing to stop after an accident
AC20 Failing to give particulars or to report an accident within 24 hours
AC30 Undefined accident offences
Disqualified Driver
BA10 Driving while disqualified by order of court
BA30 Attempting to drive while disqualified by order of court
Careless Driving
CD10 Driving without due care and attention
CD20 Driving without reasonable consideration for other road users
CD30 Driving without due care and attention or without reasonable consideration for other
road users
CD40 Causing death through careless driving when unfit through drink
CD50 Causing death by careless driving when unfit through drugs
CD60 Causing death by careless driving with alcohol level above the limit
CD70 Causing death by careless driving then failing to supply a specimen for alcohol analysis
CD71 Causing death by careless driving then failing to supply a specimen for drug analysis
Construction & Use Offences
CU10 Using a vehicle with defective brakes

Pedestrian fatalities in London
116
CU20 Causing or likely to cause danger by reason of use of unsuitable vehicle or using a
vehicle with parts or accessories (excluding brakes, steering or tyres) in a dangerous
condition
CU30 Using a vehicle with defective tyre(s)
CU40 Using a vehicle with defective steering
CU50 Causing or likely to cause danger by reason of load or passengers
CU80 Breach of requirements as to control of the vehicle, mobile telephones etc
Reckless/Dangerous Driving
DD40 Dangerous Driving
DD60 Manslaughter or culpable homicide while driving a vehicle
DD80 Causing death by dangerous driving
Drink or Drugs
DR10 Driving or attempting to drive with alcohol level above limit
DR20 Driving or attempting to drive while unfit through drink
DR30 Driving or attempting to drive then failing to supply a specimen for alcohol analysis
DR31 Driving or attempting to drive then failing to supply a specimen for drug analysis
DR40 In charge of a vehicle while alcohol level above limit
DR50 In charge of a vehicle while unfit through drink
DR60 Failure to provide a specimen for alcohol analysis in circumstances other than driving or
attempting to drive
DR61 Failure to provide a specimen for drug analysis in circumstances other than driving or
attempting to drive
DR70 Failing to provide specimen for breath test
DR80 Driving or attempting to drive when unfit through drugs
DR90 In charge of a vehicle when unfit through drugs
Insurance Offences
IN10 Using a vehicle uninsured against third party risks
Licence Offences
LC20 Driving otherwise than in accordance with a licence
LC30 Driving after making a false declaration about fitness when applying for a licence
LC40 Driving a vehicle having failed to notify a disability
LC50 Driving after a licence has been revoked or refused on medical grounds
Miscellaneous Offences
MS10 Leaving a vehicle in a dangerous position
MS20 Unlawful pillion riding

Pedestrian fatalities in London
117
MS30 Play street offences
MS50 Motor racing on the highway
MS60 Offences not covered by other codes as appropriate
MS70 Driving with uncorrected defective eyesight
MS80 Refusing to submit to an eyesight test
MS90 Failure to give information as to identity of driver etc.
Motorway Offences
MW10 Contravention of Special Roads Regulations (excluding speed limits)
Pedestrian Crossings
PC10 Undefined Contravention of Pedestrian Crossing Regulations
PC20 Contravention of Pedestrian Crossing Regulations with moving vehicle
PC30 Contravention of Pedestrian Crossing Regulations with stationary vehicle
Speed Limits
SP10 Exceeding goods vehicle speed limits
SP20 Exceeding speed limit for type of vehicle (excluding goods or passenger vehicles).
SP30 Exceeding statutory speed limit on a public road
SP40 Exceeding passenger vehicle speed limit
SP50 Exceeding speed limit on a motorway
SP60 Undefined speed limit offence
Traffic Direction and Signs
TS10 Failing to comply with traffic light signals
TS20 Failing to comply with double white lines
TS30 Failing to comply with a „Stop‟ sign
TS40 Failing to comply with direction of a constable/warden
TS50 Failing to comply with a traffic sign (excluding „stop‟ signs, traffic lights or double white
lines)
TS60 Failing to comply with a school crossing patrol sign
TS70 Undefined failure to comply with a traffic direction sign

Pedestrian fatalities in London
118
B.6 Boroughs and Inner/Outer London

Pedestrian fatalities in London
119
B.7 Conflict options
TYPE 1 2 3 4 5 6 7 8
A OVERTAKING AND LANE CHANGE
PULLING OUT
OR CHANGING
LANE TO RIGHT HEAD ON
CUTTING IN OR
CHANGING
LANE TO LEFT
LOST CONTROL
(OVERTAKING
VEHICLE) SIDE ROAD
LOST CONTROL
(OVERTAKEN
VEHICLE)
WEAVING IN
HEAVY TRAFFIC
OTHER
B HEAD ON
ON STRAIGHT CUTTING
CORNER SWINGING
WIDE
BOTH OR
UNKNOWN
LOST CONTROL
ON STRAIGHT
LOST CONTROL
OF CURVE
OTHER
C
LOST CONTROL OR OFF ROAD (STRAIGHT ROADS)
OUT OF
CONTROL ON
ROADWAY OFF ROADWAY
TO LEFT OFF ROADWAY
TO RIGHT
OTHER
D CORNERING LOST CONTROL
TURNING
RIGHT LOST CONTROL
TURNING LEFT
MISSED
INTERSECTION
OR END OF
ROAD
OTHER
E COLLISION WITH OBSTRUCTION
PARKED
VEHICLE ACCIDENT OR
BROKEN DOWN
NON-
VEHICULAR
OBSTRUCTION
S (INCLUDING
ANIMALS)
WORKMAN‟S
VEHICLE OPENING
DOOR
OTHER
F REAR END SLOW VEHICLE CROSS
TRAFFIC PEDESTRIAN QUEUE SIGNALS
OTHER
OTHER
G TURNING VERSUS SAME DIRECTION
REAR OF LEFT
TURNING
VEHICLE LEFT SIDE
SIDE SWIPE
STOPPED OR
TURNING FROM
LEFT SIDE
NEAR CENTRE
LANE OVERTAKING
VEHICLE TWO TURNING
OTHER
H CROSSING (NO TURNS)
RIGHT ANGLE
(70 TO 110
DEGREES)
OTHER
J CROSSING (VEHICLE TURNING)
RIGHT TURN
RIGHT SIDE
LEFT TURN
LEFT SIDE TWO TURNING
OTHER
K MERGING
LEFT TURN IN RIGHT TURN IN
TWO TURNING
OTHER
L RIGHT TURN AGAINST
STOPPED
WAITING TO
TURN
MAKING TURN
OTHER
M MANOEUVRING PARKING OR
LEAVING “U” TURN “U” TURN DRIVEWAY
MANOEUVRE PARKING
OPPOSITE
ANGLE
PARKING
REVERSING
DOWN ROAD
OTHER
N PEDESTRIANS CROSSING ROAD
LEFT SIDE
RIGHT SIDE LEFT TURN
LEFT SIDE RIGHT TURN
RIGHT SIDE
LEFT TURN
RIGHT SIDE
RIGHT TURN
LEFT SIDE MANOEUVRING
VEHICLE
OTHER

Pedestrian fatalities in London
120
P PEDESTRIANS OTHER
WALKING WITH
TRAFFIC
WALKING
FACING
TRAFFIC
WALKING ON
FOOTPATH CHILD PLAYING
(TRICYCLE)
ATTENDING TO
VEHICLE
ENTERING OR
LEAVING
VEHICLE
OTHER
Q MISCELLANEOUS
FELL WHILE
BOARDING/ALI
GHTING
FELL FROM
MOVING
VEHICLE TRAIN
PARKED
VEHICLE RAN
AWAY EQUESTRIAN FELL INSIDE
VEHICLE TRAILER OR
LOAD
OTHER
B.8 Contributory factor codes
The figure below, reproduced from Stats20 (DfT, 2004) shows the contributory factors
used in STATS19 which were used for this project, and brief guidelines on how to record
the contributory factors. Further definitions are given in Stats20 (DfT, 2004).

Pedestrian fatalities in London
121
Pedestrian fatalities in London
122
Appendix C List of available countermeasures and
descriptions
This appendix provides a comprehensive list of interventions to improve pedestrian
safety in London, including those considered by the researchers to be appropriate for the
cases investigated. The list has been compiled based on published work, readily available
grey literature and inputs from TRL and Transport for London pedestrian experts.
The interventions are grouped into the following types based on the Haddon‟s matrix:
Primary safety interventions - those that may prevent the collision from occurring
in the pre-collision phase;
Secondary safety interventions - those that may reduce the severity of the
injuries in the collision phase.
Within these groups the interventions have been further divided into three groups (the 3
E‟s):
Engineering (environment and vehicles),
Education (including training and publicity),
Enforcement.
Some interventions include activity in more than one of the three E‟s. The three E‟s are
commonly understood areas of activity within road safety. The funding, resources, skills
and people charged with delivering each of these types of activity are often distinct.
Sometimes, the interventions themselves are not so distinctly categorised. In such
cases, the intervention has been assigned to one category (Engineering, Education or
Enforcement), but the relevance to other categories has been noted. Working across
these boundaries is strongly encouraged and can be expected to lead to improved
delivery. For example, publicity advising of changes to enforcement practices is expected
to lead to greater compliance, and therefore improved safety, than would be achieved
with enforcement alone.

Pedestrian fatalities in London
123
Primary
(collision prevention)
Secondary
(Injury prevention)
Engineering - Road 1.1.1 Footway widening
1.1.2 Carriageway narrowing
1.1.3 Removal of on-street parking
1.1.4 Reduce speed limit or create 20mph zones
1.1.5 Provide traffic calming
1.1.6 The use of advanced stop signs at pedestrian crossings
1.1.7 Use raised pedestrian crossings
1.1.8 (Other) improvements to existing pedestrian crossing facilities
1.1.9 Provide or re-site pedestrian crossings
1.1.10 Provide a central refuge
1.1.11 Measures at signal-controlled junctions
1.1.12 Improve existing street lighting
1.1.13 Install street lighting
1.1.14 Introduce guard railings
1.1.15 Pedestrianisation/home zones/play streets
2.1.1 Traffic calming
interventions targeted at
reducing vehicle speeds
Engineering - Vehicle 1.2.1 Improve forward, rear and side vision for large vehicles – mirrors
1.2.2 Improve forward, rear and side vision for large vehicles – CCTV
1.2.3 Improve forward, rear and side vision for large vehicles – sensors
1.2.4 Automated emergency brake systems
1.2.5 „Noise‟ for electric cars
1.2.6 Intelligent speed Adaptation (ISA)
1.2.7 Improved conspicuity of the vehicle
2.2.1 Improved side guards on
heavy goods vehicles
2.2.2 Vehicle design standards
2.2.3 Pop-up bonnets and improved bumper design

Pedestrian fatalities in London
124
Education – Pedestrians 1.3.1 Improved pedestrian awareness of other road users
1.3.2 Highlight the dangers of pedestrians crossing the road whilst distracted with earphones, texting on the phone.
1.3.3 Improved pedestrian conspicuity
1.3.4 Highlight the dangers of pedestrians impaired by alcohol or drugs
Education - Drivers 1.4.1 Improve driver awareness of pedestrians and speed
1.4.2 Work related road safety training – bus drivers
1.4.3 Roadworthiness of vehicle
2.4.1 Reducing speed
2.4.2 Ensuring good roadworthiness of vehicle
Enforcement - Drivers 1.5.1 Speed enforcement
1.5.2 Drinking and driving
1.5.3 Driving/riding without a licence/uninsured
1.5.4 General traffic law enforcement
2.5.1 Speed enforcement

Pedestrian fatalities in London
125
1 Primary interventions
These interventions are measures that may have prevented the collision from occurring.
1.1 Engineering - Road
1.1.1 Footway widening
This should be coded when for example
The footway was overly narrow (less than 1.2m) or was particularly overcrowded causing the pedestrian to be in the carriageway which led to the conflict.
Footway widening is likely to result in improved pedestrian safety and reduce conflict
with traffic. Footways less than 1.2m wide can be difficult to use and can make it
necessary for pedestrians to step into the carriageway to pass each other, causing
potential conflicts with vehicles.
1.1.2 Carriageway narrowing
This should be coded when:
Small reductions in speed may have enabled the collision to have been avoided as the driver would have had more opportunity to notice the pedestrian (or to have
reduced the severity of the injury – use code 2.1.1).
Higher probability should be used where alert, compliant drivers were involved, lower probabilities where non-compliant drivers were driving recklessly or at
severely excessive speed.
Carriageway narrowing has been shown to reduce average driving speeds.
1.1.3 Removal of on-street parking
This should be coded when:
the pedestrian has emerged from between or behind parked cars and the parked
vehicle obscured either the pedestrian‟s view of the approaching vehicle and/or
the driver‟s view of the emerging pedestrian and removing this impediment to view might have prevented the collision.
This would be more likely to be relevant to collisions where both parties were alert and
speeds were sensible, less likely if one or more parties were distracted, agitated or
impaired or if other impediments to view could have been a factor (e.g. A-pillar, heavy
rain).
Removal of on-street parking can help to improve pedestrian safety the presence of
parked cars on the street is also associated with a reduction in travelling speed so
consideration should be given as to whether this might have eroded any of the benefit of
removing the parked vehicles.
1.1.4 Reduce speed limit or create 20mph zones
This should be coded when:
Excessive speed is a contributory factor in the cause of the collision
The driver of the vehicle was travelling at the posted speed limit but this was still too fast for conditions
Pedestrian fatalities in London
126
Reductions in speed may have enabled the collision to have been avoided as the
driver would have had more opportunity to notice the pedestrian (or to have reduced the severity of the injury – use code 2.1.1)
It would be more likely to be effective where a driver was complying with the existing
speed limit but this was still too fast for condition and less likely where existing speed
limits were grossly exceeded.
1.1.5 Provide traffic calming
This should be coded when:
The driver of the vehicle was travelling above the posted speed limit (excessive speed was a contributory factor) and failed to give way such that a reduced speed
on approach could have prevented the collision (or to have reduced the severity of the injury – use code 2.1.1)
Traffic calming measures reduce vehicle speed which is associated with a substantial
reduction in pedestrian injury collisions and casualty severity. These include:
Speed humps/cushions
Chicanes/pinch points
Rumbleweave surfacing.
1.1.6 The use of advanced stop signs at pedestrian crossings
This should be coded when:
Drivers running red lights, edging onto the crossing before the green light or
blocking the crossing has contributed to the cause of a collision.
Drivers of stationary large vehicles failed to see a pedestrian in front of their
vehicle because of the frontal blind spot and have pulled away from rest resulting in a collision, if moving the stop line a few metres back would have enabled the
driver to see the pedestrian and thus prevented the collision.
The use of advanced stop lines at crossings are designed to hold traffic back further from
the crossing compared to standard crossings. Research has found that moving the stop
signs further from the crossing reduces the risk of drivers running red lights, edging onto
the pedestrian crossing before the green light and blocking the crossing.
1.1.7 Use raised pedestrian crossings
This should be coded when:
drivers have failed to give way or have attempted to stop but failed to do so such that reduced speed on approach could have prevented the collision
Raised zebra or signal-controlled crossings can help to reduce vehicle speed on the
approach to the crossing and encourage vehicles to give way to pedestrians.
1.1.8 (Other) improvements to existing pedestrian crossing facilities
This should be coded when:
Collisions on a zebra crossing where drivers failed to give way or tried to but
failed.

Pedestrian fatalities in London
127
Collisions on a crossing where added time to cross the road would have prevented
the collision from occurring.
Collisions when the pedestrian crossed at a crossing on a red man (possibly due
to impatience).
When 1.1.6 and 1.1.7 is coded.
This countermeasure includes:
The upgrading of zebra crossings to pelican or puffin crossings;
The use of countdown devices showing how much longer the pedestrian has to wait for the green man;
Changes to waiting time or green man phase;
Road markings on approach to crossings;
Writing on the road surface reminding foreign tourists to look left/right as appropriate;
Skid resistant surfacing on the approach to the crossing to enable drivers to stop
more easily;
Widening the crossing so that pedestrians are less likely to walk off the crossing;
Reducing the road width at the pedestrian crossing so the pedestrians have a shorter distance to cross;
Flashing road studs to alert drivers to the presence of the crossing
Add a central refuge so that pedestrians have fewer lanes to cross at a time
Coloured surfacing on crossings
1.1.9 Provide or re-site pedestrian crossings
This should be coded when:
The pedestrian tried to cross busy/fast roads between traffic that was not
expecting the pedestrian and failed to stop and there was no other crossing within 50 metres.
The pedestrian crossed near to the crossing but not on it
This countermeasure includes the installation of appropriate crossing facilities or
improved siting of pedestrian crossings (to better cater for optimum route choice and
encourage pedestrians to use the crossing). Clearly this countermeasure will not be
suitable for all locations.
1.1.10 Provide a central refuge
This should be coded when:
Pedestrians have tried to cross busy/fast roads between traffic that was not expecting the pedestrian and failed to stop.
A central refuge can improve safety by providing pedestrians with a safe place to stop
while crossing a busy road.

Pedestrian fatalities in London
128
1.1.11 Measures at signal-controlled junctions
This should be coded when:
the pedestrian crossed at a signal controlled junction such that if there was a pedestrian phase the collision could have been avoided;
the pedestrian crossed at a signal controlled junction on a red man (possibly due
to impatience).
Measures include signal strategies that shorten waiting time for pedestrians, adding a
pedestrian phase and providing an all red signal. This may be achieved by using shorter
cycle times or increasing the window of opportunity for the pedestrian phase. These
countermeasures will tend to increase delays to vehicles and will not be suitable for all
locations.
1.1.12 Improve existing street lighting
This should be coded when:
The collision took place in darkness where street lighting is already installed but where the pedestrian was still not very conspicuous, an alert vehicle driver failed
to see the pedestrian and the sight lines were such that if the pedestrian had been seen at the earliest opportunity there would have been time for the driver to
react and avoid a collision or at least to have braked and reduced the collision speed to the extent that the injury severity was less.
1.1.13 Install street lighting
This should be coded when:
The collision took place in darkness with no street lighting and the pedestrian was not very conspicuous and an alert vehicle driver failed to see the pedestrian and if
there was lighting and the sight lines were such that is the pedestrian had been
seen there would have been time for the driver to react and avoid the collision.
1.1.14 Introduce guard railings
This should be coded when:
The pedestrian crossed the road at an unsuitable point and the presence of a
guard rail would have prevented the pedestrian from crossing and thus prevented the collision
Guard railings are intended to reduce conflicts between pedestrians and vehicles and to
discourage pedestrians from crossing the road at unsuitable points; they also keep
pedestrians on overcrowded footways from spilling into the road.
1.1.15 Pedestrianisation/home zones/play streets
This should be coded:
For appropriate busy shopping streets with high pedestrian flow
Residential minor streets and cul-de-sacs where a child pedestrian was playing
Busy shopping streets with high pedestrian flow are good candidates for
pedestrianisation or semi-pedestrianisation which excludes private traffic and public
transport. Such areas are designed to provide a safer environment for pedestrians
leaving the space open for uncontrolled pedestrian movement.

Pedestrian fatalities in London
129
A home zone is appropriate for residential streets. The road is shared between the
pedestrians, cyclists and motorists where no one road user has priority but through
design the road may be configured to make it more favourable to pedestrians and
cyclists. http://www.rudi.net/files/dft_susttravel_612270.pdf. The road should have low
vehicle flows (<100 vehicles per hour at peak time) and low vehicle speeds (<20mph)
A play street is appropriate for residential streets. The road is closed to all traffic during
specific hours to permit a supervised program of recreational activity to take place in the
road.
1.2 Engineering -vehicles
1.2.1 Improve forward, rear and side vision for large vehicles – mirrors
This should be coded:
When the collision involved an HGV or large vehicle and the alert driver of the
vehicle looking in the appropriate areas failed to see the pedestrian because the pedestrian was in the vehicle‟s blind spot and a correctly adjusted mirror or
additional mirror would have meant the driver would have seen the pedestrian
and prevented the collision.
This intervention is largely aimed at heavy goods vehicle and bus drivers. Examples of
relevant collision types include:
Where an HGV is waiting at a pedestrian crossing and a pedestrian attempts to cross just before the lights change. When a pedestrian is very close to the front of
an HGV the driver is sometimes completely unable to see them, particularly if they are not very tall. Hence, when the lights turn green the HGV driver pulls
away, because they cannot see anything in front of them, and runs the
pedestrian over. If the forward vision is improved such that the driver is physically able to see the pedestrian it is almost certain that the collision could be
avoided.
A vehicle that is reversing fails to see a pedestrian behind and runs them over. If
the view to the rear were improved such that the third party could be seen then the collision could be avoided.
A number of different types of mirrors are fitted to large vehicles to improve the field of
view for the drivers. These are intended to reduce blind spots in the immediate area
surrounding the vehicle. The intention of providing these mirrors to improve the field of
view for the drivers depends on them being adjusted correctly and being used before
and during the turning manoeuvre. It is the driver‟s responsibility to adjust the vehicle
mirrors correctly before each journey and to use them while driving. Thus lower
probabilities should be used if there is evidence to suggest the existing mirrors were
poorly adjusted. Recent European Legislation (2007/38/EC) made it mandatory for most
HGVs (those registered after 1/1/2000 and >3.5 tonnes) to be retrofitted with class IV
wide angle mirrors and class V close proximity/kerb mirrors. This will not affect most of
the collisions studied which will pre-date implementation of this Directive. It does also
not affect the frontal blind spot because class VI frontal mirrors were not included.
New trucks and buses registered since the end of 2006 will have been required by
Directive 2003/97/EC to have all the new mirrors including close proximity/blind spot

Pedestrian fatalities in London
130
mirrors at the front and side. Some of these vehicles may appear in the collisions being
studied
1.2.2 Improve forward, rear and side vision for large vehicles – CCTV
This should be coded:
When the collision involved an HGV or large vehicle and the alert driver of the vehicle looking in the appropriate areas failed to see the pedestrian because the
pedestrian was blocked from view by the vehicle structure and a vehicle sensor or CCTV would have alerted the driver that a pedestrian was there and prevented
the collision.
This should be coded whenever 1.2.1 is coded for mirrors.
The position of mirrors is constrained by the required view and during one left turn
manoeuvre the driver needs to check the nearside blind spot mirror to check for the
presence of cyclists, the frontal mirror to check for the presence of pedestrians then the
offside mirror to assess any risks from tail swing, check the nearside mirror (and
possibly wide angle mirror) to monitor the positioning of the rear axle relative to the
road. All of this in addition to looking forward through the windscreen. This leads to a
very high workload. CCTV screens can be placed in a position that makes it easier for the
driver (e.g. less head movement) to monitor the multiple locations he or she is required
to. Thus the probability assigned to CCTV should be greater than for mirrors if there is
evidence to suggest the driver may have been struggling to monitor all the required
mirrors. However, it should be noted that some systems can give a reduced quality of
picture making it more difficult to identify what an object is. Therefore consideration
should be given to reducing the probability if the view would have been complex
(multiple indistinct objects in view).
1.2.3 Improve forward, rear and side vision for large vehicles – sensors
This should be coded:
When the collision involved an HGV or large vehicle and the driver of the vehicle
failed to see the pedestrian either through some form of inattention or because
the pedestrian was blocked from view by the vehicle structure and making the driver aware that a pedestrian was in close proximity could have prevented the
collision.
This should be coded whenever 1.2.1 is coded for mirrors.
However, a sensor system would be expected to work by identifying the presence of a
pedestrian (or other vulnerable road user) in a dangerous position and sounding some
form of alarm such as a visual, audible or tactile warning to attract the driver‟s attention
to the danger. This means that in addition to blind spot collisions where 1.2.1 might be
coded, it might also be effective in collisions where the pedestrian would have been
visible in the mirror but as a result either of excess workload, inattention or impairment
the driver failed to see them.
The HMI is likely to be critical to the success of any sensor system to ensure that the
driver‟s attention is attracted to the correct place and to ensure the danger is
understood. This may require combination with CCTV or perhaps directional alarms
where the sound or visual cue comes from the location of the hazard. For the purposes
of this assessment it has been assumed that the HMI will be of sufficiently high quality to
Pedestrian fatalities in London
131
ensure adequate detection without any unintended effects through providing excess
information to the driver.
Lower probabilities should be used if the driver was seriously impaired or distracted.
1.2.4 Automated emergency brake systems
This should be coded:
When the pedestrian has been in the road at risk of collision for a period of time before collision sufficient to allow significant braking to take place (e.g. >1sec)
but where the driver did not brake or braked only gently prior to impact.
Collision avoidance/mitigation systems capable of detecting pedestrians and pedal
cyclists as well as vehicles are becoming available on some new vehicles. Systems will
typically function by providing a warning to the driver about 2 seconds before impact
and if the driver does not take avoiding action then the system will autonomously brake
the vehicle at about 1 second before impact in order to either avoid the collision or, more
commonly, to reduce the vehicle speed at impact and hence injury severity.
1.2.5 ‘Noise’ for electric cars
This should be coded when:
The pedestrian was in a collision with an electric car and it was likely that the
pedestrian was not aware of the car because of the lack of noise.
Pedestrians will often tend to rely on both visual and audible cues when assessing
whether a vehicle is approaching and thus whether it is safe to cross, or walk in, the
road. Audible cues are particularly important for visually impaired people. Electric
vehicles are becoming more common and tend to be quieter than ICE vehicles,
particularly at lower speeds where engine noise is more important than tyre noise.
Research in the USA (Hanna, 2009) compared the „collision experience‟ of hybrid electric
vehicles (HEVs) and internal combustion engine (ICE) vehicles under similar
circumstances, using state collision files. A higher incidence rate of both pedestrian and
pedal cycle collisions was found for HEVs. By studying a variety of collision factors, it was
found that HEVs were twice as likely as ICE vehicles to be involved in a pedestrian
collision when the vehicle was slowing, stopping, backing up, or entering or leaving a
parking space. During these manoeuvres, Hanna (2009) considered that the difference
between the levels of sound produced by the two engine types would be greatest.
The probability should be higher for this where the pedestrian was visually impaired,
and/or it was a pure electric vehicle travelling at low speed. Lower probability should be
used where a fully sighted pedestrian was involved and/or it was a hybrid vehicle with an
operating ICE and/or the vehicle was travelling at higher speed where significant tyre
noise would be expected.
1.2.6 Intelligent speed Adaptation (ISA)
This should be coded when:
The driver of the vehicle was travelling above the posted speed limit (excessive
speed was a contributory factor) and failed to give way such that a reduced speed
on approach could have prevented the collision
Pedestrian fatalities in London
132
ISA is a technology designed to influence drivers speed by using roadside beacons,
transmitters or tags to convey information to the car. This could be to advise the driver
when they were reaching the speed limit through visual, auditory or haptic (in which the
accelerator pedal becomes harder to press) means. It could also prevent the driver from
driving above the speed limit by automatic application of the brakes.
1.2.7 Improved conspicuity of the vehicle
This should be coded when:
Where the collision was caused because the pedestrian failed to see the vehicle because the vehicle did not stand out enough (but not due to street or vehicle
lighting).
Improvements to conspicuity include making the vehicle stand out using reflective strips
to the side, front or rear of a vehicle.
1.3 Education - Pedestrians
1.3.1 Improved pedestrian awareness of other road users
This should be coded when:
The following contributory factors were assigned to the pedestrian: „pedestrian failed to look properly‟, „pedestrian careless/reckless/in a hurry‟, „pedestrian failed
to judge the vehicle‟s path or speed‟ and an improved awareness of other road users would have prevented the collision from occurring.
Road safety education can be delivered via a variety of methods which aim to promote
safe behaviour. For example pedestrians could be educated to improve awareness of
other road users‟ needs, to develop strategies to minimise the risk of being involved in a
collision, or to increase general road safety knowledge (Highway Code)., Young
pedestrians are generally easier to influence than older pedestrians possibly through
education in schools.
This includes improving awareness of blind spots of large vehicles.
1.3.2 Highlight the dangers of pedestrians crossing the road whilst
distracted with earphones, texting on the phone.
This should be coded when:
The pedestrian was distracted whilst crossing the road and if they were not distracted the collision would have been avoided.
1.3.3 Improved pedestrian conspicuity
This should be coded when:
The pedestrian was wearing dark clothing at night and the alert driver would have seen the pedestrian if they were wearing light coloured clothing or a conspicuity
aid.
The use of conspicuity aids, especially at night, to improve the visibility of pedestrians.
Pedestrian fatalities in London
133
1.3.4 Highlight the dangers of pedestrians impaired by alcohol or drugs
This should be coded when:
The pedestrian was “impaired by alcohol” or “impaired by drugs” and this contributed to the collision
1.4 Education - Drivers
1.4.1 Improve driver awareness of pedestrians and speed
This should be coded when:
The alert driver failed to see the pedestrian, passed too close to the pedestrian, was exceeding the speed limit or travelling too fast for conditions and if they were
travelling at a slower speed they would have had more time for avoidance action.
For example, drivers slowing down near schools, busy shopping areas
1.4.2 Work related road safety training – bus drivers
This should be used when:
The pedestrian was hit by a bus or there was a bus involved which was not hit
and the collision could have been avoided if the bus driver had been given specific
work related training.
1.4.3 Roadworthiness of vehicle
This should be coded when:
The vehicle was found to be not road worthy and this contributed to the collision.
For example, illegal tyres, defective lights, defective brakes, defective steering,
defective mirrors, overloaded or poorly loaded vehicle.
Education interventions that ensure the driver understands the importance of the
roadworthiness of their vehicle should reduce the likelihood that a vehicle will respond
adversely when involved in a collision, for example, very low brake fluid may result in
brake failure which could affect the severity of a collision.
1.5 Enforcement - Drivers
1.5.1 Speed enforcement
This should be used when:
The driver was travelling above the posted speed limit and this contributed to the
collision
The considerations for this are similar to those described for ISA but relate to the likely
effects if more police and camera based enforcement was undertaken.
1.5.2 Drinking and driving
This should be used when:

Pedestrian fatalities in London
134
The driver was found to be over the legal limit of alcohol and the resultant
impairment contributed to the collision.
1.5.3 Driving/riding without a licence/uninsured
This should be used when:
The driver was found to not have the appropriate licence and/or was uninsured
A review (Greenaway, 2004) for the Department for Transport of the extent and costs of
uninsured driving in the UK reported that 5% of vehicles are being driven without
insurance, uninsured drivers are more likely to be involved in a collision, more likely to
be non-compliant with other road traffic requirements and obligations and potentially to
be involved in other criminal activity. Education, training and publicity addressing
uninsured driving could be considered with the corresponding enforcement intervention
1.5.4 General traffic law enforcement
This should be used when:
The driver was found to be impaired by drugs and this contributed to the collision.
The driver was found to be not displaying lights at night and this contributed to
the collision.
The driver was found to be using a mobile phone and this contributed to the
collision.
The driver was found to be driving carelessly or dangerously and this contributed
to the collision.
The driver was breaking any other traffic law and this contributed to the collision.
The vehicle was stolen or being used in the course of a crime and this contributed
to the collision
And not when the offences with separate countermeasures listed above are listed.
If a particular category was being coded in several cases this should be recorded in the
notes.
Law enforcement is necessary to ensure that laws and regulations relating to pedestrian
safety are complied with, particularly regarding excessive speed which is a contributory
factor in many collisions.
2 Secondary interventions
These interventions are measures that may reduce the severity of the injuries in the
event of a collision.
2.1 Engineering – Roads
2.1.1 Traffic calming interventions targeted at reducing vehicle speeds
This should be coded when:
Small reductions in speed may have reduced the severity of the injury.

Pedestrian fatalities in London
135
Higher probability should be used where alert, compliant drivers were involved, lower
probabilities where non-compliant drivers were driving recklessly or at severely
excessive speed.
Traffic calming measures reduce vehicle speed which is associated with a substantial
reduction in pedestrian injury severity. Interventions include:
Vehicle speed-activated signs;
20 mph zones;
Speed humps and cushions;
Chicanes and pinch points;
Rumblewave surfacing;
Carriageway narrowing.
2.2 Engineering - Vehicles
2.2.1 Improved side guards on heavy goods vehicles
This should be coded:
When a pedestrian fell sideways into the side of an HGV equipped with current
side guards and experienced crush injuries (AIS 3 or greater to their thorax and
at least one other body region) which contributed to their fatal injury.
A project carried out by TRL for the Department for Transport studied the integration of
safety guards and spray suppression for heavy goods vehicles (Knight et al., 2005).
Under consideration was the development of a stronger and lower integrated structure
all the way round the lower part of a heavy goods vehicle. This presents a smooth
uninterrupted surface to the vulnerable road user and is usually flush with the outer
edge of the vehicle and covers the wheels with very low ground clearance. The smooth
surface of this structure, originally intended to enhance aerodynamic performance, has
been shown through test work to prevent violent head strikes on the side of the vehicle
body and the load hooks, and also prevents heavy chest strikes on the outer edge of the
rear tyre. An additional benefit is that clothing and limbs are less likely to get caught or
dragged by the vehicle and the pedestrian is not thrown to the ground with as much
force. Computer simulation showed that smooth flat panelled side guards did offer
potential for improved protection for vulnerable road users. Although, in simulation, the
vulnerable road user ends up very close to the wheels and there may be a risk of limbs
being run over, this design may reduce the risk of head/thorax/abdomen being run over.
It should be noted that all of this work considered the effectiveness of a sideguard when
the HGV was travelling in a straight line. The effectiveness of sideguards will, at best, be
much reduced in collisions where the HGV was turning left or right, particularly where
the initial contact with the pedestrian was near the front of the vehicle. This is because
the pedestrian will be knocked to the ground and the trailer axles will cut in to the
corner. During this process the sideguard is able to pass over the top of the prone
pedestrian so that they are still run over by the rear wheels.
2.2.2 Vehicle design standards – pedestrian friendly front structure
This should be coded when:
Pedestrian fatalities in London
136
The pedestrian was NOT run over and the pedestrian was fit and healthy and
aged under 60 years (over 60 years code as a maybe) and the impact speed was under 20mph (over 20mph code as a maybe) and the pedestrian hit the front of
the vehicle.
This intervention is largely aimed at vehicle design regulators. Fatal collisions involving
an impact with a car often result in the pedestrian‟s head striking the windscreen or
bonnet. In the European New Car Assessment Programme (Euro NCAP, (NCAP,2008))
tests for pedestrians have been carried out replicating child and adult pedestrian
collisions at 25mph. The new cars are awarded a star rating from one (least safe) to four
(most safe).
EU Regulation 78/2009 lays down requirements for the construction and functioning of
motor vehicles and frontal protection systems, with the aim of reducing the number and
severity of injuries to pedestrians. It outlines manufacturer and member state
obligations relating to type-approval, and states that “pedestrian protection can be
significantly improved by a combination of passive and active measures which afford a
higher level of protection than the previously existing provisions.”
Although not yet implemented, these principles could also be applied to collisions
involving vans, trucks and buses.
2.2.3 Pop-up bonnets and improved bumper design
This should be coded when:
The pedestrian was NOT run over and the pedestrian was fit and healthy and aged under 60 years (over 60 years code as a maybe) and the impact speed was
under 25mph (over 25mph code as a maybe) and the pedestrian hit the bonnet of the vehicle and suffered a head injury (AIS 3 or greater) or hit the bumper of
the vehicle and suffered a fatal lower limb injury (AIS 3 or greater).
In the event of a frontal impact, pop-up bonnets (also known as active hood lift systems)
provide a greater clearance between the bonnet and stiff underlying structures (e.g.
engine components), thus allowing for controlled deceleration of the pedestrian‟s head
and reduced risk of head injury. Pop-up bonnets are currently available on only a few car
models.
The application of an energy-absorbing layer on the bumper combined with altered
bumper geometry, height and orientation can reduce the risk of lower limb injuries.
Deeper bumper profiles and support bars positioned below the bumper can also reduce
knee-related injury by limiting rotation of the leg.
2.3 Education - pedestrians
2.4 Education –Drivers
2.4.1 Reducing speed
This could apply when:
Speed has been coded as a contributory factor and a reduction in speed may lead
to a reduction in injury severity

Pedestrian fatalities in London
137
2.4.2 Ensuring good roadworthiness of vehicle
This could apply if:
If countermeasure 1.4.3 has been coded
Education interventions that ensure the roadworthiness of vehicles on the road should
reduce the likelihood that a vehicle will respond adversely when involved in a collision,
for example, very low brake fluid may result in brake failure which could affect the
severity of a collision.
2.5 Enforcement –Drivers
2.5.1 Speed enforcement
This could apply when:
Speed has been coded as a contributory factor and a reduction in speed may lead
to a reduction in injury severity of the pedestrian.
Speed, which is a major factor in pedestrian collisions, should be controlled for example
through increased use of speed cameras and enhanced enforcement of speeding laws.
Speed enforcement could be undertaken by fixed speed camera sites or by mobile
enforcement.

Pedestrian fatalities in London
138
Appendix D STATS19 overview (2007-2010)
D.1 Comparison with GB
In the last four years (2007-2010) there were 351 pedestrians killed in London, 17% of
all those pedestrians killed in Great Britain (2,123) and 48% of all fatalities in London
(736).
Table D-1 shows the number of pedestrians killed in London and Great Britain by year.
Table D-1: Number of pedestrian fatalities in London and Great Britain, 2007-10
Year London1 Great Britain2
Pedestrian fatalities
All fatalities
% pedestrians
Pedestrian fatalities
All fatalities
% pedestrians
2007 109 222 49% 646 2,946 22%
2008 95 204 47% 572 2,538 23%
2009 89 184 48% 500 2,222 23%
2010 58 126 46% 405 1,850 22%
Total 351 736 48% 2,123 9,556 22%
1 Reproduced from Casualties in Greater London (2007-2010): (TfL, 2008), (TfL, 2009), (TfL, 2010), (TfL, 2011) 2 Reproduced from Reported Road Casualties Great Britain (DfT, 2011)
The percentage of fatalities that were pedestrians over the four-year period was higher
in London (48%) compared with Great Britain as a whole (22%).Table D-2 shows a
comparison of fatalities in London with fatalities in all urban areas in Great Britain. In
urban areas in Great Britain, 45% of fatalities were pedestrians. Over the four-year
period the number of pedestrian fatalities in London has reduced by 47%, compared to
37% in all urban areas in Great Britain.
Table D-2: Number of pedestrian fatalities in London and urban areas in Great
Britain, 2007-10 1 2
Year London1 Great Britain urban areas2
Pedestrian fatalities
All fatalities
% pedestrians
Pedestrian fatalities
All fatalities
% pedestrians
2007 109 222 49% 427 973 44%
2008 95 204 47% 405 883 46%
2009 89 184 48% 357 771 46%
2010 58 126 46% 270 597 45%
Total 351 736 48% 1,459 3,224 45%
1 GB figures from Reported Road Casualties Great Britain, 2006-2010: (DfT, 2007), (DfT, 2008), (DfT, 2009), (DfT, 2010) and (DfT, 2011). 2 London data from TfL ACCSTATS data, 2006-2010.

Pedestrian fatalities in London
139
D.2 Pedestrian fatalities in London
D.2.1 Collision conditions
Table D-3 shows the number of pedestrian fatalities in each of the London boroughs
between 2007 and 2010 (also shown in the map below, Figure D-1). Of the 351
pedestrian fatalities in the period, 201 (57%) occurred in outer London. The highest
number of pedestrian fatalities occurred in Westminster (27). The number of pedestrian
fatalities in a borough will depend on a number of factors, including the road length and
pedestrian and vehicular traffic.
Figure D-1: Number of pedestrian fatalities by borough (2007-2010)

Pedestrian fatalities in London
140
Table D-3: Number of pedestrian fatalities in London by borough, 2007-2010
Area Borough 2007 2008 2009 2010 Total
Inner Westminster 3 12 10 2 27
Lambeth 9 5 1 1 16
Camden 4 1 4 4 13
Lewisham 6 2 3 2 13
Southwark 2 4 3 3 12
Tower Hamlets 1 5 3 3 12
Greenwich 1 5 3 2 11
Wandsworth 1 2 5 2 10
Kensington & Chelsea 4 3 2 9
Hammersmith & Fulham 5 1 1 1 8
Islington 4 3 1 8
Hackney 2 3 2 7
City of London 1 2 1 4
Inner Total 40 46 39 25 150
Outer Barnet 8 6 5 5 24
Ealing 7 8 5 2 22
Brent 5 5 5 3 18
Enfield 6 3 3 4 16
Hounslow 6 1 3 2 12
Bromley 4 7 11
Hillingdon 1 6 1 3 11
Redbridge 3 2 3 3 11
Haringey 3 3 4 10
Newham 4 4 1 9
Croydon 2 1 4 1 8
Bexley 3 2 2 7
Barking & Dagenham 3 2 2 7
Kingston-upon-Thames 4 1 1 1 7
Merton 4 2 1 7
Richmond-upon-Thames 1 3 1 5
Havering 3 1 4
Harrow 1 2 3
Waltham Forest 2 1 1 4
Sutton 1 1 1 3
Heathrow Airport 1 1 2
Outer Total 69 49 50 33 201
Grand Total 109 95 89 58 351

Pedestrian fatalities in London
141
In total over the four year period, 68 pedestrian fatalities (19%) occurred on a Saturday
compared to 39 (11%) on Sundays and Mondays. Overall the most common time period
for fatalities was between 4pm and 8pm, when 28% of fatalities occurred. On a
Saturday, pedestrian fatalities were most common between midnight and 4am (18 out of
68). Figure D-2 shows the distribution of pedestrian fatalities throughout the week by
time period.
Figure D-2: Number of pedestrian fatalities by day of week and time period
(2007-2010)
Note that each time group includes times up to, but not including the end of the range listed, for example, 4am is included in the 4am-8am group.
D.2.2 Pedestrians
Figure D-3 shows the distribution of pedestrian fatalities by age and sex. Overall 59% of
fatalities were male, and for age groups between 0 and 59 there were more male
fatalities than female fatalities but for ages 60 and above there were similar numbers of
males and females.
Overall, 43% of pedestrian fatalities were age 60 or more, with 18% aged 80 or more,
representing the most common age group for pedestrian fatalities. The second largest
age group for pedestrian fatalities was the 20-29 age group, accounting for 15% of
pedestrian fatalities

Pedestrian fatalities in London
142
Figure D-3: Number of pedestrian fatalities by age and sex (2007-2010)
Figure D-4 shows the pedestrian fatality rate in terms of the number of pedestrian
fatalities (between 2007 and 2010) per million population of Greater London (population
estimates based on Office for National Statistics Population Estimates, 2011). These
figures include all pedestrian fatalities, even though some of the fatalities were not
London residents.
Figure D-4 shows that from the 40-49 age group, the fatality rate increases with
increasing age group. The highest fatality rate was for the 80 year and over age group,
with a fatality rate almost ten times greater than the 40-49 age group. For all age
groups the male rate is higher than the female rate.
These figures do not take into account distance or time spent as a pedestrian for the
different age groups.

Pedestrian fatalities in London
143
Figure D-4: Pedestrian fatality rate (fatalities per year per million population of
Greater London) by age and sex (2007-2010 average)
D.2.3 Vehicles
Table D-4 shows the type of vehicles which struck the pedestrians. There were 347
vehicles involved in the 351 fatal pedestrian collisions. Of these vehicles, 193 were cars,
including eight taxi or private hire vehicles and two minibuses.
Table D-4: Pedestrian fatalities London by vehicle hit by and year (2007-2010)
Vehicle Type 2007 2008 2009 2010 Total
Car 51 54 54 34 193
Bus/Coach 17 15 16 6 54
HGV 13 9 10 11 43
Motorcycle 12 8 0 4 24
LGV 10 1 4 1 16
Pedal Cycle 3 0 0 1 4
Other 3 6 3 1 13
Total 109 93 87 58 347
Overall, 42 vehicles failed to stop at the scene. This represented 12% of vehicles,
slightly higher than the figure for all GB pedestrian fatalities (10%, derived from
STATS19 data). The majority of vehicles that failed to stop in hit and run collisions with
pedestrians were cars (see Table D-5).

Pedestrian fatalities in London
144
Table D-5: Vehicles in fatal pedestrian collisions by hit and run (2007-2010)
Vehicle Type Not hit and run Hit and run Total
Car 161 32 193
Bus/Coach 52 2 54
HGV 39 4 43
Motorcycle 22 2 24
LGV 14 2 16
Pedal Cycle 4 0 4
Other 13 0 13
Total 305 42 347
D.3 Pedestrian fatalities in London in collisions with pedal cycles and
‘other vehicles’
Collisions involving a pedestrian and a pedal cycle or an „other‟ vehicle (e.g. agricultural
vehicle, ridden horse) were not included in this report. Fatal collisions involving
pedestrians and these vehicle types were too small in number to be able to draw
meaningful insights and were therefore excluded.