Embed Size (px)
Citation preview
1
TRANSPORT CHICAGO 2009 Paper Title: Pace Suburban Bus Transit Signal Priority Regional Plan Name and Affiliation: Kevin O’Neill, PE URS Corporation 100 S WACKER DR STE 500 CHICAGO, IL 60606 Phone: 312.697.7231 Fax: 312.939.4198 Taqhi Mohammed Senior Transit ITS Engineer Pace Suburban Bus 550 W ALGONQUIN RD ARLINGTON HEIGHTS, IL 60005 Phone: 847.228.4287 Fax: 847.364.9020
For Charlotte:
My education details:
BS- Civil Engineering – Madras University
Ms -Civil Engineering (Advanced Transportation Systems) – Virginia Polytechnic Inst & State
University (Virginia Tech)
Graduate Certificate in Public Transportation Systems- Virginia Tech
2
Pace Suburban Bus Transit Signal Priority Regional Plan
Background:
Pace is the premier suburban transit provider, quickly moving people to work and school safely
and efficiently. The backbone of Chicago's suburbs, Pace serves of daily riders with more fixed
bus routes, vanpools and Dial-a-Ride programs. Pace covers 3,500 square miles and is the one of
the largest bus services in North America. Pace service Area includes DuPage, Kane, Lake,
McHenry, Will and Cook Counties in Northeast IL. It serves 210 Communities with Population
of 5.2 million. Total ridership in 2007 is 39.2 million. Pace operates fixed bus 240 routes with an
average length of 12.5 miles. Pace also provides Paratransit, Vanpool & Carshare program.
Pace has developed a Regional Plan for deploying Transit Signal Priority (TSP) throughout its
service area. The project included analyzing approximately 850 miles of roadway along 27
potential TSP corridors to allow the transit agency to identify the areas of greatest need for future
TSP funding and deployment throughout its entire service area.
What is Transit Signal Priority (TSP)
TSP facilitates the movement of transit vehicles through traffic-signal controlled intersections.
When buses are behind schedule, special devices on the buses send signals to detectors installed
at traffic-signal controlled intersections, which automatically give the bus priority by extending a
green, shortening a red or providing queue jumps. TSP is a great benefit because it ensures
schedule adherence and improves travel times along busy arterial routes. The time savings,
though small at each intersection, create a significant decrease in travel time over the course of
our entire bus route. There is evidence of this along Cermak Road where TSP has been active for
several years; there has been a 7 to 20% reduction in transit travel times along this route. Also
Pace successfully tested Wi-fi Based TSP along four signalized intersection of 159th
street and
place 20 more signalized intersections along Halsted, US6 & 159th
Street.
3
Goals for Regional TSP System Deployment
TSP Deployment will promote the vision presented in Pace's Vision 2020: Blueprint for the
Future: ―Pace's vision for the future is to provide a publicly acceptable level of efficient
suburban mobility.‖1 Three main goals identified in Pace's 5-year plan from 2007-2011 that
work toward this Vision 2020 are:
1. Improved access and mobility for the elderly and disabled throughout the region without
constraints of local governmental bodies.
2. Provide access to jobs through an expansion of City to Suburban trips.
3. Reduce congestion in the suburb to suburb commute.
It is Pace’s goal to provide better access to trip origins and destinations through a time-
competitive, long-distance line-haul service between multiple suburban centers. As the suburban
job market has grown, the demand for transit services that connect locations in the City of
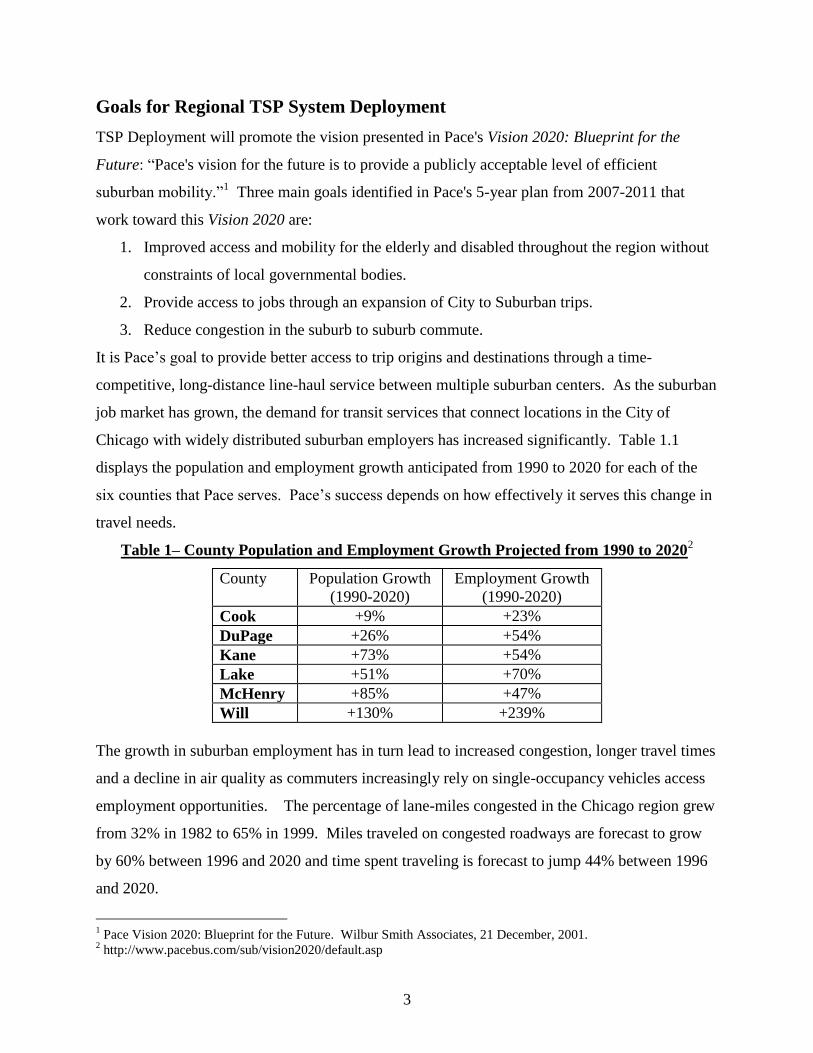
Chicago with widely distributed suburban employers has increased significantly. Table 1.1
displays the population and employment growth anticipated from 1990 to 2020 for each of the
six counties that Pace serves. Pace’s success depends on how effectively it serves this change in
travel needs.
Table 1– County Population and Employment Growth Projected from 1990 to 20202
County Population Growth
(1990-2020)
Employment Growth
(1990-2020)
Cook +9% +23%
DuPage +26% +54%
Kane +73% +54%
Lake +51% +70%
McHenry +85% +47%
Will +130% +239%
The growth in suburban employment has in turn lead to increased congestion, longer travel times
and a decline in air quality as commuters increasingly rely on single-occupancy vehicles access
employment opportunities. The percentage of lane-miles congested in the Chicago region grew
from 32% in 1982 to 65% in 1999. Miles traveled on congested roadways are forecast to grow
by 60% between 1996 and 2020 and time spent traveling is forecast to jump 44% between 1996
and 2020.
1 Pace Vision 2020: Blueprint for the Future. Wilbur Smith Associates, 21 December, 2001.
2 http://www.pacebus.com/sub/vision2020/default.asp
4
Vision 2020 is the blueprint for Pace’s vision of developing a network of new services,
infrastructure improvements and a decrease in travel times. Transit Signal Priority is one of the
many tools that Pace can use to meet the needs of city-to-suburb and suburb-to-suburb transit
commuters.
Regional TSP System Objectives
Improving the schedule adherence of Pace bus routes is among the goals of the HTC TSP
Demonstration. TSP can work to accomplish other objectives that may be more ideal for future
TSP Corridors, such as:
1. The improvement of transit travel times along an entire TSP Corridor
2. The improvement of transit operations at isolated intersections
3. The establishment of a Bus Rapid Transit line, through the application of procedures and
technologies in addition to TSP
These objectives are presented here as examples of how TSP can be utilized along other
Corridors to achieve the goals of Pace’s Vision 2020. Although the main objective for the
Regional TSP System will be to improve schedule adherence, other objectives may be deemed
more appropriate for other TSP Corridors in the future.
Reduction of Traffic Signal Delay
While TSP is one tool that can improve transit travel times, it is limited to reducing the delays to
transit vehicles caused only by traffic signals. For the signal delay data collection process
(discussed in Section 3.0), signal delay was objectively defined as the sum of two time periods:
1) the time between when a transit vehicle stops at the end of a queue while waiting for a green
light and when that light first turns green, and 2) the time between when the light first turns
green and when the transit vehicle (waiting at the end of the queue or at the stop bar) first begins
moving.
Delay can occur at that same intersection for other reasons as well. Slow-moving traffic can
prevent the transit vehicle from clearing the intersection, thus causing it to be delayed through an
5
additional red signal cycle. Delay can also be caused by other factors on the roadway, such as
train crossings, which may be creating lengthy vehicle queues beyond the intersection which the
transit vehicle is waiting to clear. Thus, TSP cannot be guaranteed to eliminate all of the delay
that can potentially occur at a signalized intersection.
Regional Framework
This plan fits within the regional framework of key transit and transportation agencies, as
displayed in Figure 1.1. This plan fulfills the vision of the Northeastern Illinois ITS Deployment
Plan3, which is to:
Use advanced technologies (including computer, electronic, and communications
devices) to share information to improve the operation, management and use of the
region's transportation system in order to provide safer, more accessible, more reliable,
and more secure roadway and transit services to our customers.
With regard to TSP, the ITS Deployment Plan recognizes the efforts of Pace to plan for a TSP
Demonstration and use that as a base for ―developing TSP standards and in formulating a
technology oversight policy/plan for the region.‖
The Regional Transportation Authority (RTA) of Northeastern Illinois developed in May 2000 a
Regional Transit Intelligent Transportation Systems (ITS) Plan (RTIP). This plan presented a
vision for further transit ITS deployments that ensure regional ITS project coordination and
integration. A key mission of the RTA is ―to ensure a comprehensive and coordinated public
transit system for the residents of northeastern Illinois.‖4 The RTA works to ensure that the
technologies deployed by transit agencies are in coordination with other transportation agencies
in the Gary-Chicago-Milwaukee (GCM) Corridor, composed of 16 counties stretching across
Wisconsin, Illinois, and Indiana. The Regional TSP Deployment / Implementation Plan will
fulfill this vision of integration and coordination through meeting the objective of improving bus
schedule adherence.
3 Northeastern Illinois ITS Deployment Final Plan Update: Final Report, July 2005. Prepared by: Chicago Area
Transportation Study Advanced Technology Task Force (ATTF), with the support of: Parsons Transportation
Group, Consensus Systems Technologies, and National Engineering Technology (NET). 4 RTA Regional Transit ITS Plan, Exec Sum., p. 1
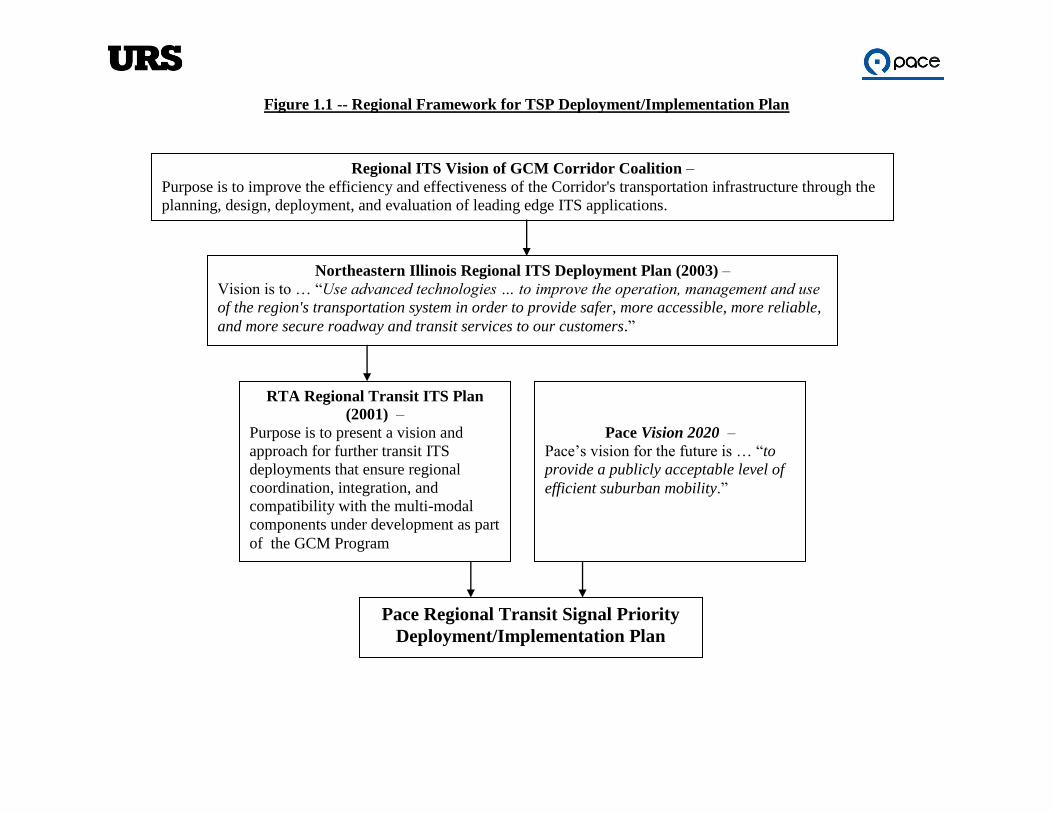
Figure 1.1 -- Regional Framework for TSP Deployment/Implementation Plan
Regional ITS Vision of GCM Corridor Coalition –
Purpose is to improve the efficiency and effectiveness of the Corridor's transportation infrastructure through the
planning, design, deployment, and evaluation of leading edge ITS applications.
Northeastern Illinois Regional ITS Deployment Plan (2003) –
Vision is to … ―Use advanced technologies … to improve the operation, management and use
of the region's transportation system in order to provide safer, more accessible, more reliable,
and more secure roadway and transit services to our customers.‖
RTA Regional Transit ITS Plan
(2001) –
Purpose is to present a vision and
approach for further transit ITS
deployments that ensure regional
coordination, integration, and
compatibility with the multi-modal
components under development as part
of the GCM Program
Pace Vision 2020 –
Pace’s vision for the future is … ―to
provide a publicly acceptable level of
efficient suburban mobility.‖
Pace Regional Transit Signal Priority
Deployment/Implementation Plan
Regional TSP System Benefits and Costs
The benefits realized with TSP vary depending on the objectives, but the most common benefits
have been an improved bus schedule adherence and reduced travel times, which, in turn, lead to
a better quality of transit service. Travel time savings lead to variable operating cost savings in
the form of less fuel consumption which, in turn, cause fewer bus emissions and improve the
surrounding environment. Travel time savings can also increase the satisfaction of Pace
commuters and may even lead to an increase in ridership along a TSP Corridor.
The direct costs to implementing TSP vary on the technology used and the extent of TSP
deployment. Traffic signal controllers may need to be upgraded or replaced in order to
communicate with TSP components. Other potential costs include extensive delay for cross
street traffic and a reduction in the safety of travel along the TSP Corridor. However, side street
delay is minimal in most cases and does not offset the travel time savings gained on TSP
Corridors. Also, TSP has not been proven to significantly decrease the safety of travel along a
TSP Corridor.
The direct benefits to transit operations are realized through variable operational cost savings.
Fuel savings, as a result of fewer stops and idling through traffic, are realized by transit vehicles
with TSP. The direct benefit to general traffic is similar in nature and can be measured as part of
the signal system optimization that is performed in conjunction with TSP. The direct benefit to
Pace bus passengers is travel time savings.
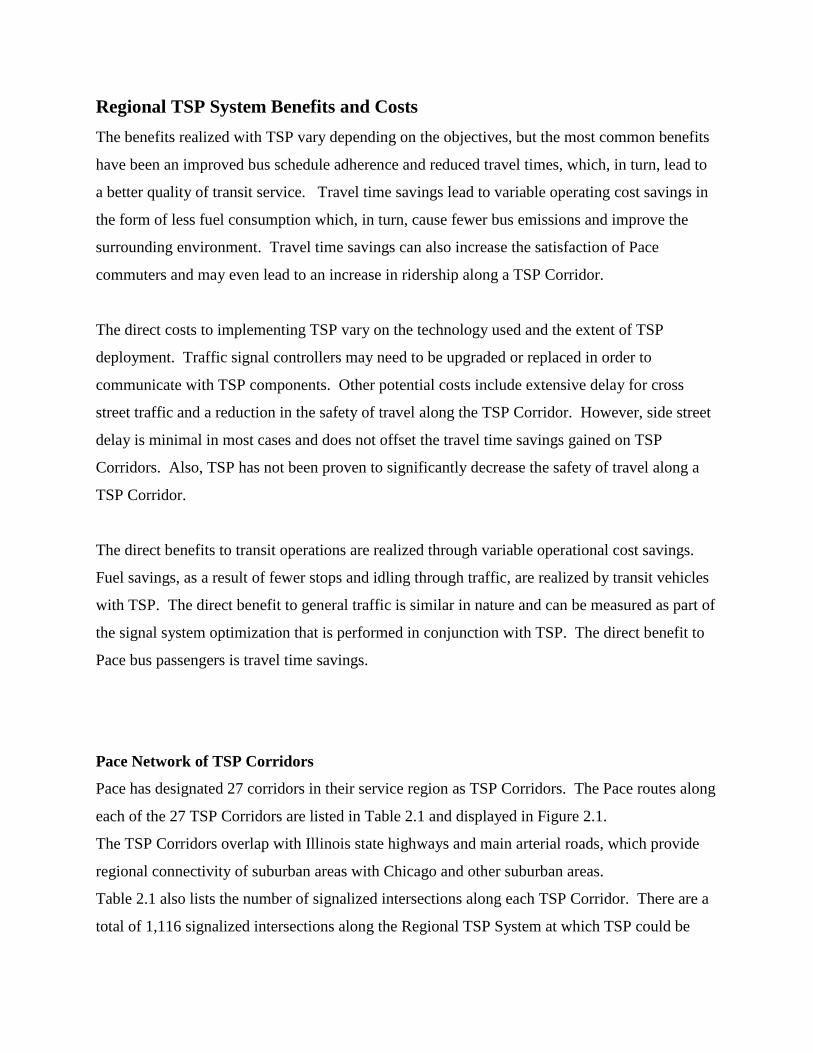
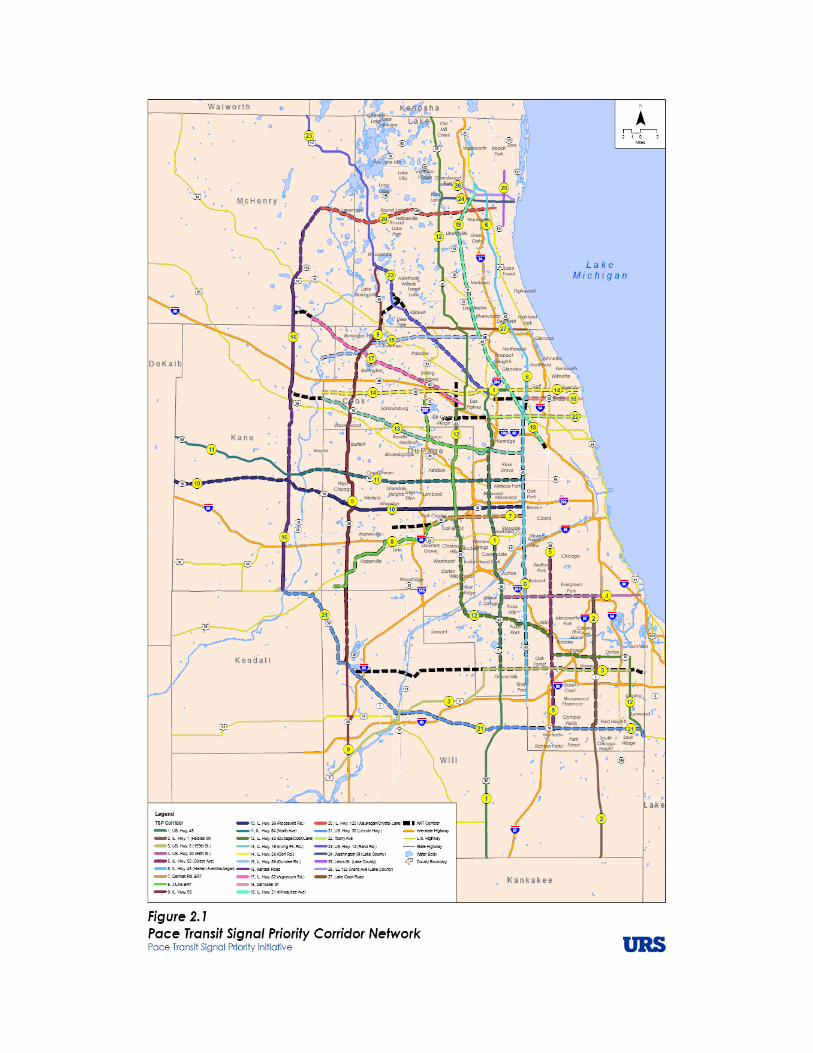
Pace Network of TSP Corridors
Pace has designated 27 corridors in their service region as TSP Corridors. The Pace routes along
each of the 27 TSP Corridors are listed in Table 2.1 and displayed in Figure 2.1.
The TSP Corridors overlap with Illinois state highways and main arterial roads, which provide
regional connectivity of suburban areas with Chicago and other suburban areas.
Table 2.1 also lists the number of signalized intersections along each TSP Corridor. There are a
total of 1,116 signalized intersections along the Regional TSP System at which TSP could be
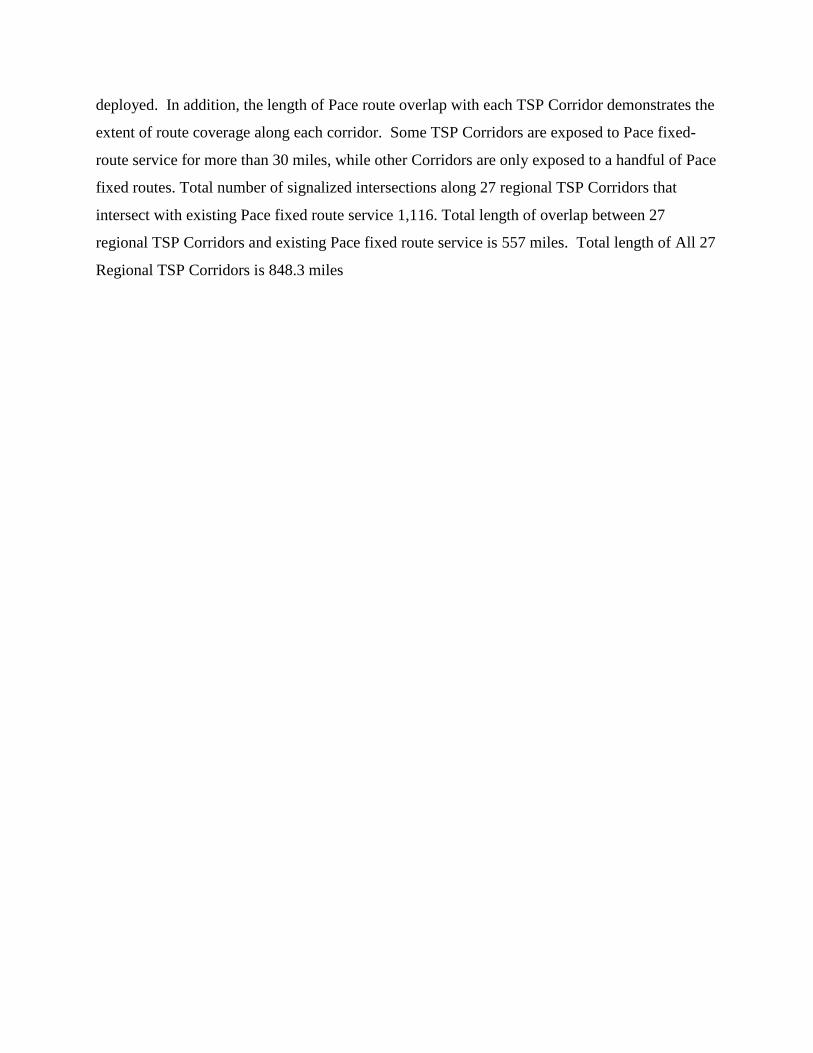
deployed. In addition, the length of Pace route overlap with each TSP Corridor demonstrates the
extent of route coverage along each corridor. Some TSP Corridors are exposed to Pace fixed-
route service for more than 30 miles, while other Corridors are only exposed to a handful of Pace
fixed routes. Total number of signalized intersections along 27 regional TSP Corridors that
intersect with existing Pace fixed route service 1,116. Total length of overlap between 27
regional TSP Corridors and existing Pace fixed route service is 557 miles. Total length of All 27
Regional TSP Corridors is 848.3 miles

Pace Routes along TSP Corridor
Currently, 145 Pace routes overlap with the 27 TSP Corridors for a total length of 557 miles.
This total length does not account for the overlap of one route with another route along a TSP
Corridor. In general, Pace routes cover approximately one-half of the 850 mile-long TSP
Corridor Network. Each Pace route and the numbered TSP Corridors with which they overlap
are contained in the Appendix.
Traffic Signal Controllers along TSP Corridors
A key element to successful TSP operations is the ability of signal controllers to process requests
for TSP from approaching Pace buses. Throughout the suburban Chicago region, signal
controllers are provided by two major manufacturers -- Econolite Control Products, Inc., which
manufactures Econolite signal controllers, and Siemens, which manufactures Eagle signal
controllers.
As of 2005, there were approximately 120 coordinated Econolite signal systems and 50
coordinated Eagle signal systems along TSP Corridors in the region. A large majority of these
systems are owned and owned and maintained by IDOT, while some systems are owned
maintained by individual counties and municipalities.
The differences in how these signal controllers function complicates the technology that can be
selected for TSP Deployment. Different versions of Econolite and Eagle controllers have
varying capabilities for processing TSP requests and older versions require hardware and
software upgrades for TSP operations.
Pace ART Corridor Network
The network of TSP Corridors overlaps closely with Pace’s Arterial Rapid Transit (ART)
network. This is because TSP is one tool that achieves the goals of ART, which are to connect
the region’s suburban centers, improve schedule reliability, and reduce transit travel times for
commuters. The overlap of ART Corridors with TSP Corridors is displayed in Figure 2.1.
Pace’s ART Corridor Network serves as the high-quality trunk-route frame for Pace’s family of
services. It is integrated with Pace’s Express Bus Service to provide regional connectivity. It is
supported by Pace’s integrated community services as its feeder service.
Prioritization of TSP Corridors and Segments
This section presents the prioritization of segments of Pace’s 27 TSP Corridors that will guide
future TSP Deployments. Three scenarios of TSP Deployment were created to reflect changing
conditions with respect to state and federal funding and transit service expansion. The following
scenarios will assist Pace in the decision-making process of when and where to deploy TSP in
the future:
Scenario One: Prioritize all segments of all Pace TSP Corridors to assist in the decision
that may need to be made in deploying TSP along an existing fixed-route and a new
fixed-route in a previously un-served area along a TSP Corridor
Scenario Two: Prioritize only those segments of TSP Corridors with current fixed-route
service along them to determine where TSP can be deployed in the immediate-term.
Scenario Three: Prioritize only those segments of TSP Corridors without fixed-route
service along them to determine where TSP can be deployed in the long-term if fixed-
route service is extended to those un-served areas.
While it cannot be predicted when Pace transit could be extended to un-served areas of TSP
Corridors, these scenarios provide Pace with the flexibility to address TSP Deployment under
changing conditions in the coming years.
The remainder of this section outlines the methodology followed in prioritizing segments of the
27 TSP Corridors for system-wide TSP deployment. The methodology features three main steps:
1) The collection of traffic and transit data relevant to TSP Deployment,
2) The assembly of all data in GIS to visually display the information, and
3) The prioritization of TSP Corridors based on all transit and traffic characteristics.
The result of the prioritization of segments of TSP Corridors provides Pace with a mile-by-mile
analysis of where it will be most beneficial to deploy and maintain TSP along each of the 27 TSP
Corridors.
TSP Corridor Segmentation and Data Collection
Understanding the transit and traffic conditions along each TSP Corridor is critical in taking the
first step to Regional TSP Deployment. Since these conditions vary along the length of a TSP
Corridor, it is ideal to divide the TSP Corridors into segments, because TSP may benefit
passengers in some areas of a corridor more than others. For example, the transit and traffic
conditions along the north end of the Harlem Avenue TSP Corridor may indicate a greater need
for TSP while different conditions along the south end of the Corridor might indicate a lesser
need for TSP.
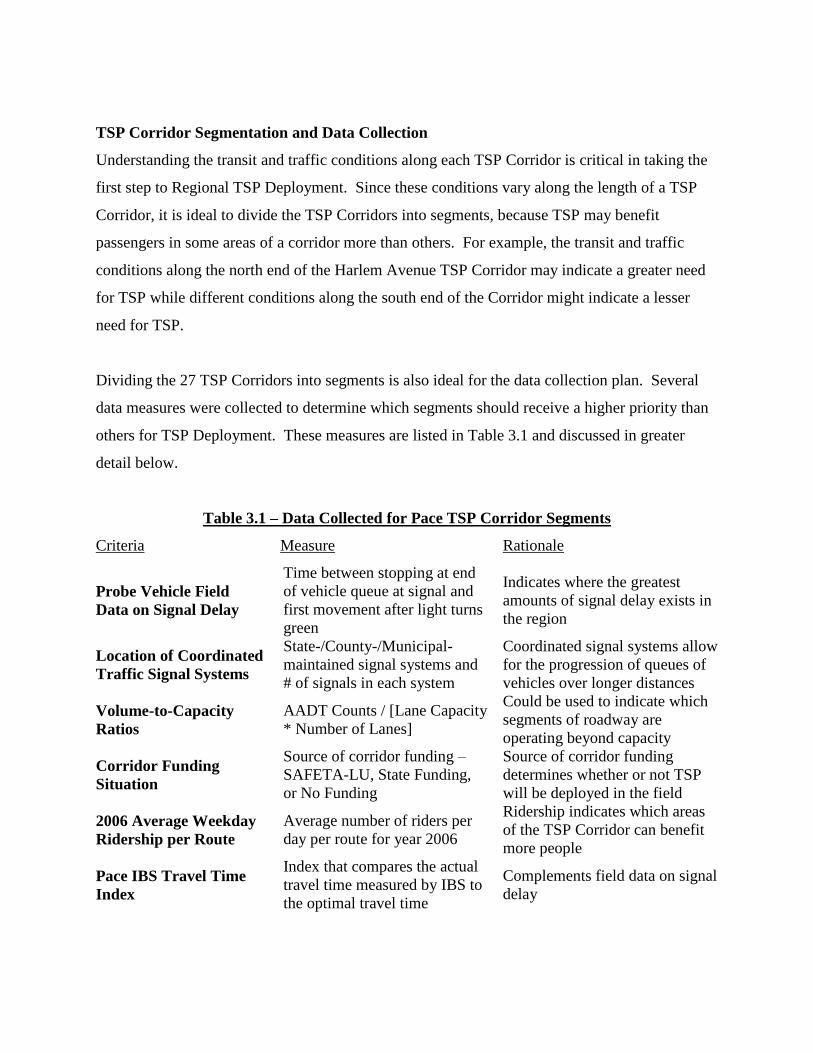
Dividing the 27 TSP Corridors into segments is also ideal for the data collection plan. Several
data measures were collected to determine which segments should receive a higher priority than
others for TSP Deployment. These measures are listed in Table 3.1 and discussed in greater
detail below.
Table 3.1 – Data Collected for Pace TSP Corridor Segments
Criteria Measure Rationale
Probe Vehicle Field
Data on Signal Delay
Time between stopping at end
of vehicle queue at signal and
first movement after light turns
green
Indicates where the greatest
amounts of signal delay exists in
the region
Location of Coordinated
Traffic Signal Systems
State-/County-/Municipal-
maintained signal systems and
# of signals in each system
Coordinated signal systems allow
for the progression of queues of
vehicles over longer distances
Volume-to-Capacity
Ratios
AADT Counts / [Lane Capacity
* Number of Lanes]
Could be used to indicate which
segments of roadway are
operating beyond capacity
Corridor Funding
Situation
Source of corridor funding –
SAFETA-LU, State Funding,
or No Funding
Source of corridor funding
determines whether or not TSP
will be deployed in the field
2006 Average Weekday
Ridership per Route
Average number of riders per
day per route for year 2006
Ridership indicates which areas
of the TSP Corridor can benefit
more people
Pace IBS Travel Time
Index
Index that compares the actual
travel time measured by IBS to
the optimal travel time
Complements field data on signal
delay
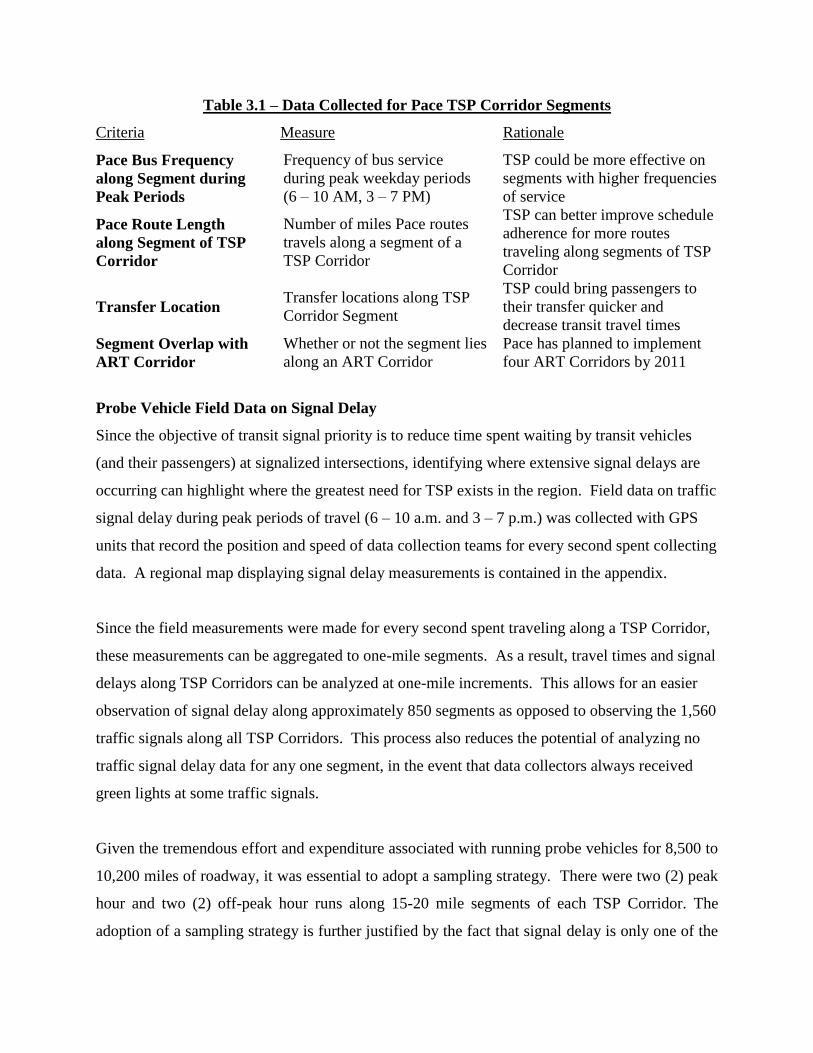
Table 3.1 – Data Collected for Pace TSP Corridor Segments
Criteria Measure Rationale
Pace Bus Frequency
along Segment during
Peak Periods
Frequency of bus service
during peak weekday periods
(6 – 10 AM, 3 – 7 PM)
TSP could be more effective on
segments with higher frequencies
of service
Pace Route Length
along Segment of TSP
Corridor
Number of miles Pace routes
travels along a segment of a
TSP Corridor
TSP can better improve schedule
adherence for more routes
traveling along segments of TSP
Corridor
Transfer Location Transfer locations along TSP
Corridor Segment
TSP could bring passengers to
their transfer quicker and
decrease transit travel times
Segment Overlap with
ART Corridor
Whether or not the segment lies
along an ART Corridor
Pace has planned to implement
four ART Corridors by 2011
Probe Vehicle Field Data on Signal Delay
Since the objective of transit signal priority is to reduce time spent waiting by transit vehicles
(and their passengers) at signalized intersections, identifying where extensive signal delays are
occurring can highlight where the greatest need for TSP exists in the region. Field data on traffic
signal delay during peak periods of travel (6 – 10 a.m. and 3 – 7 p.m.) was collected with GPS
units that record the position and speed of data collection teams for every second spent collecting
data. A regional map displaying signal delay measurements is contained in the appendix.
Since the field measurements were made for every second spent traveling along a TSP Corridor,
these measurements can be aggregated to one-mile segments. As a result, travel times and signal
delays along TSP Corridors can be analyzed at one-mile increments. This allows for an easier
observation of signal delay along approximately 850 segments as opposed to observing the 1,560
traffic signals along all TSP Corridors. This process also reduces the potential of analyzing no
traffic signal delay data for any one segment, in the event that data collectors always received
green lights at some traffic signals.
Given the tremendous effort and expenditure associated with running probe vehicles for 8,500 to
10,200 miles of roadway, it was essential to adopt a sampling strategy. There were two (2) peak
hour and two (2) off-peak hour runs along 15-20 mile segments of each TSP Corridor. The
adoption of a sampling strategy is further justified by the fact that signal delay is only one of the
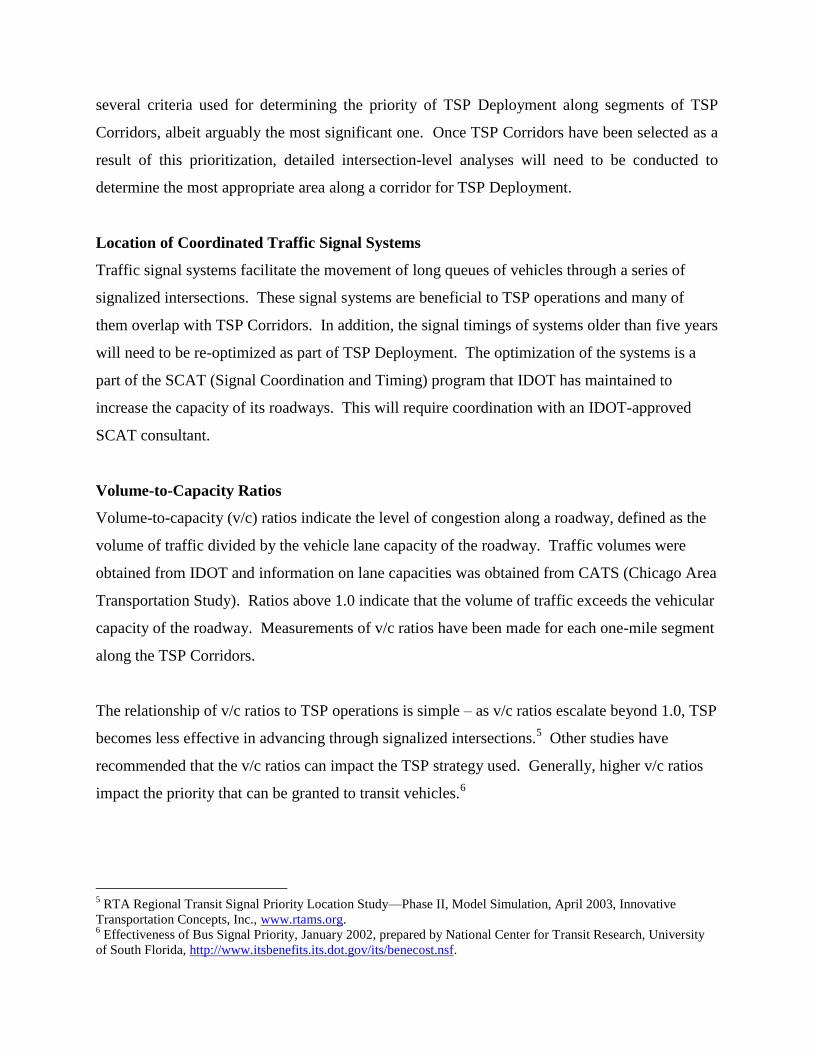
several criteria used for determining the priority of TSP Deployment along segments of TSP
Corridors, albeit arguably the most significant one. Once TSP Corridors have been selected as a
result of this prioritization, detailed intersection-level analyses will need to be conducted to
determine the most appropriate area along a corridor for TSP Deployment.
Location of Coordinated Traffic Signal Systems
Traffic signal systems facilitate the movement of long queues of vehicles through a series of
signalized intersections. These signal systems are beneficial to TSP operations and many of
them overlap with TSP Corridors. In addition, the signal timings of systems older than five years
will need to be re-optimized as part of TSP Deployment. The optimization of the systems is a
part of the SCAT (Signal Coordination and Timing) program that IDOT has maintained to
increase the capacity of its roadways. This will require coordination with an IDOT-approved
SCAT consultant.
Volume-to-Capacity Ratios
Volume-to-capacity (v/c) ratios indicate the level of congestion along a roadway, defined as the
volume of traffic divided by the vehicle lane capacity of the roadway. Traffic volumes were
obtained from IDOT and information on lane capacities was obtained from CATS (Chicago Area
Transportation Study). Ratios above 1.0 indicate that the volume of traffic exceeds the vehicular
capacity of the roadway. Measurements of v/c ratios have been made for each one-mile segment
along the TSP Corridors.
The relationship of v/c ratios to TSP operations is simple – as v/c ratios escalate beyond 1.0, TSP
becomes less effective in advancing through signalized intersections.5 Other studies have
recommended that the v/c ratios can impact the TSP strategy used. Generally, higher v/c ratios
impact the priority that can be granted to transit vehicles.6
5 RTA Regional Transit Signal Priority Location Study—Phase II, Model Simulation, April 2003, Innovative
Transportation Concepts, Inc., www.rtams.org. 6 Effectiveness of Bus Signal Priority, January 2002, prepared by National Center for Transit Research, University
of South Florida, http://www.itsbenefits.its.dot.gov/its/benecost.nsf.
TSP Corridor Funding
TSP Corridor funding was addressed in Section 2 and is vital to TSP Deployment. Whether or
not a corridor has received funding may not determine the need for TSP, but obtaining a source
of funding is the first and most critical obstacle to deployment. Therefore, those corridors with a
funding source will receive a measure of priority over those corridors without funding. In
addition, corridors with SAFETEA-LU funding will receive priority over those corridors with an
FY 2007 Appropriated source of funding.
2006 Average Weekday Ridership per Route
The measure of average weekday passengers per route could be used to determine where TSP
could directly serve the most passengers. The HTC TSP Demonstration centered on heavily
traveled routes around the HTC. Route 352 currently serves an average of more than 6,000
passengers per day, which is the most passengers of any Pace route and nearly twice the amount
of the second most heavily traveled Pace route. Future deployments of TSP can be planned
around other heavily traveled routes along TSP Corridor.
Pace IBS Travel Time Index
Using three months of IBS data from September to December of 2006, an IBS Travel Time
Index (TTI) was calculated to compare the actual travel time along a segment to the optimal
travel time. Higher values of TTI indicate higher travel times along a segment and thus, better
candidate locations for TSP Deployment.
Pace Bus Frequency along Segment during Peak Periods
Based on the three months of IBS data collected, the peak period frequency of Pace transit
service along each segment was calculated. The frequency of Pace bus service along segments
can impact the number of TSP calls that are made. Higher frequencies of bus travel will lead to
more frequent calls for TSP at the intersection level and serve greater amounts of Pace
commuters. There are 145 Pace routes that overlap with the 27 TSP Corridors with a mix of
high and low frequency routes.
Pace Route Length along Segment of TSP Corridor
The length of Pace routes along a segment of a TSP Corridor impacts the number of TSP calls
that can be made. Multiple routes traveling along a one-mile segment affect the amount of TSP
service provided. For example, three bus routes traveling the entire length of a one-mile segment
equates to three miles of TSP service that could potentially be provided.
Transfer Locations
Deploying TSP near transfer locations can increase the reliability of transfers made by
passengers between Pace routes and other forms of public transportation. Transfer locations are
identified from the RTA Transfer Location Study.7 These are locations where Pace, CTA, and
Metra public transportation services meet to provide for an enhanced regional connectivity of
Chicago with surrounding suburban areas. These are also locations where a majority of Pace
routes transfer to other Pace routes. TSP Deployment along a Pace route connecting to any of
these transfer locations can reduce the transit travel times and increase Pace transit reliability.
ART and TSP Corridor Overlap
TSP is one component of the ART Corridor Network that will work to improve schedule
adherence, transit travel times, and customer service. Pace has planned to implement four ART
Corridors operating over approximately 12 miles of service each by 2011, and many of them
overlap with TSP Corridors. A regional map displaying the overlap of ART Corridors with TSP
Corridors is displayed in the appendix.
Transit and Traffic Data Assembly
With the criteria in Table 3.1 collected for the 27 TSP Corridors, the second step involves the
assembly of the criteria into a database that can be used to prioritize the TSP Corridors. The
assembly of a GIS database assists primarily in the graphical representation of the criteria along
TSP Corridors. The database also allows for the approximate definitions of one-mile segments
with specific intersections along a TSP Corridors. GIS was also utilized in the field data
collection process for signal delay along the TSP Corridors and in the measurements of v/c ratios
7 Regional Transit Coordination Plan: Location Study. July 2001, prepared by Booz-Allen & Hamilton, Inc. in
association with Welsh Planning.
for each one-mile segment. The data assembled in GIS was transferred into a Microsoft Excel
database for further analysis in the prioritization of the 27 TSP Corridors.
Scenarios of TSP Deployment
The prioritization of segments of TSP Corridors is the final step in the methodology. It is
presented in three different scenarios that account for changing conditions with respect to
funding and levels of transit service. Each of the scenarios are discussed below along with the
criteria used to prioritize the segments of TSP Corridors. Section 3.4 describes in more detail the
methodology for how and where TSP can be deployed along each TSP Corridor.
Scenario One: Deploying TSP on New/Restructured Routes vs. Existing Fixed-Route
Service Segments
This scenario accounts for future route restructuring initiatives that might result in new or
restructured lines of fixed-route service along a TSP Corridor where no transit service previously
existed. At that time, Pace may want to determine if the route would be a good candidate for
TSP deployment.
Nearly half of Pace’s network of 27 regional TSP Corridors is covered with fixed-route service
while the remaining half currently has no fixed-route service. Given this fact, all potential TSP
deployment areas considered under this scenario will need to be evaluated using comparable
criteria to make an objective determination. The criteria that are used to evaluate these potential
TSP deployment areas are:
Vehicle Probe Signal Delay Data
Presence of coordinated signal systems
Volume-to-Capacity Ratio of segment
Segment overlap with Pace Arterial Rapid Transit (ART) Corridor
RTA Transfer Location(s) along segment
Scenario Two: Deploying TSP on Existing Fixed-Route Service Segments
The second scenario considers only those areas of the regional TSP corridors with existing fixed-
route service. Given the potential for TSP deployment along other routes based on the success of
the HTC TSP Demonstration and the current funding situation, it is important to understand
where TSP could benefit areas with existing fixed-route service in the near term. The following
criteria listed below include all five of the measures described in Scenario One and five
additional criteria:
2006 Average Weekday Ridership per Route
Pace IBS Travel Time Index
Bus Frequency along Segments of TSP Corridor
Corridor Funding Situation
Route exposure to TSP Corridor
Scenario Three: Deploying TSP on Segments without Existing Fixed-Route Service
Scenario Three considers only the segments without existing fixed-route service. In the event
that new fixed-route transit service is extended to currently un-served areas, this scenario depicts
the value of TSP to segments without Pace transit service. Similar to Scenario One, it will assist
in the decision on whether or not to deploy TSP along new or restructured lines of fixed-route
service. The criteria used to prioritize segments without fixed-route service are:
Vehicle Probe Signal Delay Data
Presence of coordinated signal systems
Volume-to-Capacity Ratio of segment
Segment overlap with Pace Arterial Rapid Transit (ART) Corridor
RTA Transfer Location(s) along segment
This prioritization is simply a subset of Scenario One and will require minimal effort to
determine. While these segments currently have no fixed-route service, a prioritization of the
segments may help Pace determine whether or not they would be good candidates for TSP
deployment in the event of new routes and/or route restructuring.
Prioritizing Segments for TSP Deployment
Three considerations were made in how the criteria in Table 3.1 were used to prioritize segments
for TSP Deployment under each of the three scenarios.
The first consideration is how to treat the different criteria in a similar manner. Six of the
measures in Table 3.1 (signal delay, bus frequency, ridership, IBS TTI, route length along
segment, and v/c ratios) are continuous variables, in that they can take on any numerical value.
The other four measures are nominal variables, and can only be one of a finite number of values.
For example, there either is or is not a transfer location along a one-mile segment. In order to
objectively compare the need for TSP on one segment with another, the continuous variables
need to be converted into nominal variables by creating categories of values.
The second consideration is an assignment of points that indicate the need for, and feasibility of,
TSP Deployment. A point scale from 1 to 5 objectively assimilates the different characteristics
into a single prioritization scheme for prioritizing segments for TSP deployment. A value of 1
indicates either a low need for TSP or low amount of feasibility for deployment based on the
segment criterion. A value of 5 indicates a great need for TSP or high amount of feasibility for
TSP Deployment along that segment. Since higher measures of signal delay will indicate a
greater need for TSP, those segments are assigned higher point values for having that
characteristic.
The points assigned for each continuous variable were proportional to its position within each
defined range. For example, one segment with an average daily ridership of 3,500 could have
been assigned the same score as another segment with an average daily ridership of 5,000
(between the range 3,000 and 5,500). A score that is proportional to the variable's place within
the specified range (i.e., 4.2 for the former segment and 4.8 for the latter) assigns more priority to
the segment with 5,000 passengers and provides a more accurate set of final rankings.
The last consideration is how to weight the different criteria for TSP Deployment. Assigning
weights to all criteria reflects the importance of that measure in determining where TSP should
be deployed. For example, field data on signal delay relates directly to the objectives of TSP
and, therefore, could account for a larger part of the decision on where to deploy TSP throughout
the region. Likewise, the frequency of bus service indicates that TSP will impact more
passengers along that segment than other segments.
The weights are represented by percentages that account for a part of the decision on where to
deploy TSP. Given the value of field data on signal delay, it will account for at least 20% of the
decision on segment prioritization in each of the three scenarios. The point values that each one-
mile segment receives for having a desirable characteristic are then multiplied by each respective
weight to arrive at a final score for each one-mile segment that determines the order of
prioritization.
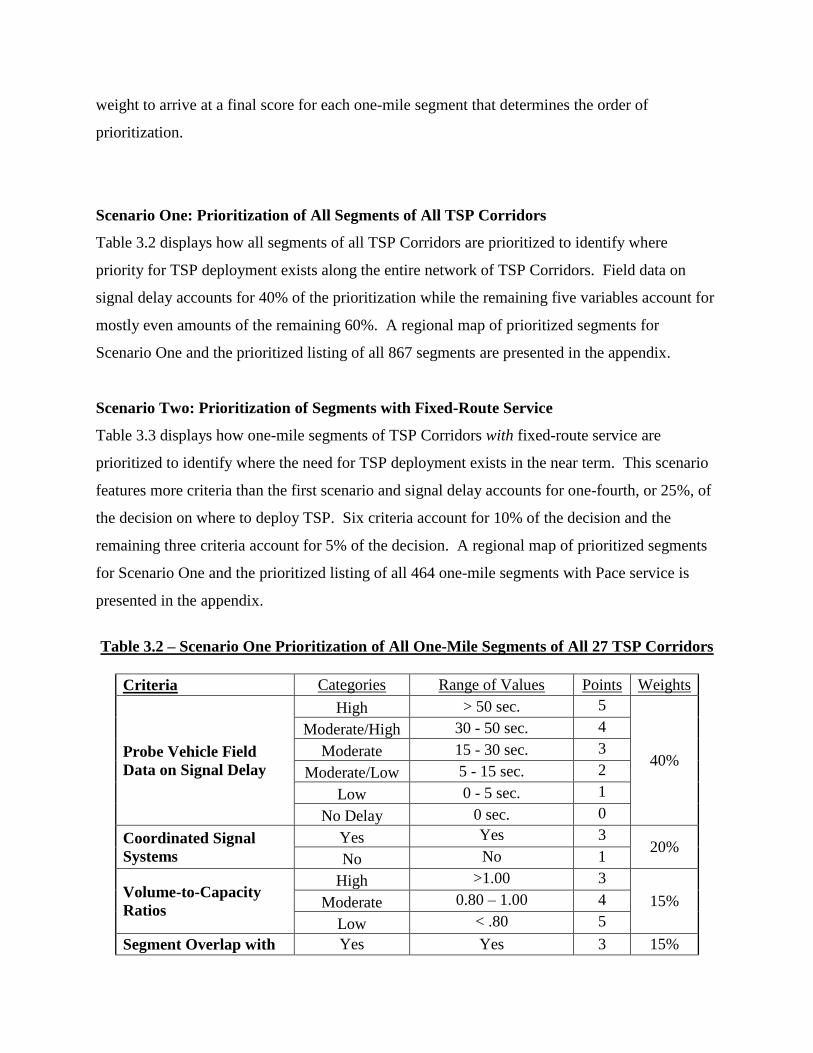
Scenario One: Prioritization of All Segments of All TSP Corridors
Table 3.2 displays how all segments of all TSP Corridors are prioritized to identify where
priority for TSP deployment exists along the entire network of TSP Corridors. Field data on
signal delay accounts for 40% of the prioritization while the remaining five variables account for
mostly even amounts of the remaining 60%. A regional map of prioritized segments for
Scenario One and the prioritized listing of all 867 segments are presented in the appendix.
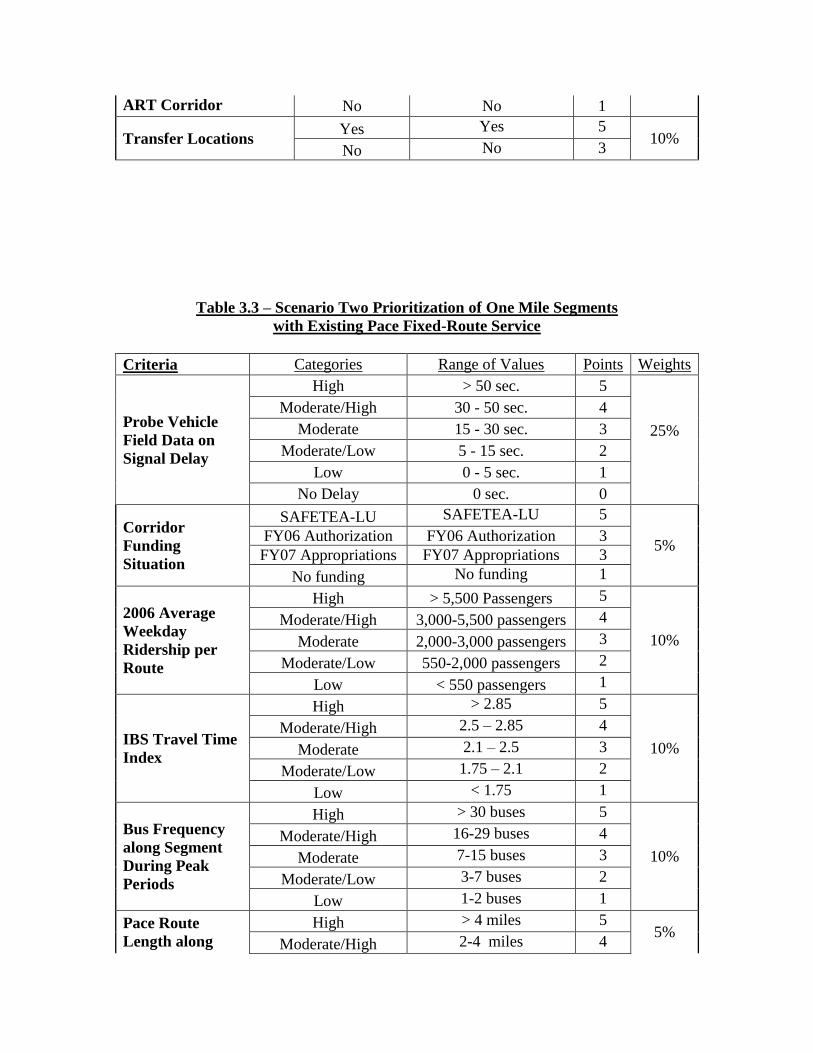
Scenario Two: Prioritization of Segments with Fixed-Route Service
Table 3.3 displays how one-mile segments of TSP Corridors with fixed-route service are
prioritized to identify where the need for TSP deployment exists in the near term. This scenario
features more criteria than the first scenario and signal delay accounts for one-fourth, or 25%, of
the decision on where to deploy TSP. Six criteria account for 10% of the decision and the
remaining three criteria account for 5% of the decision. A regional map of prioritized segments
for Scenario One and the prioritized listing of all 464 one-mile segments with Pace service is
presented in the appendix.
Table 3.2 – Scenario One Prioritization of All One-Mile Segments of All 27 TSP Corridors
Criteria Categories Range of Values Points Weights
Probe Vehicle Field
Data on Signal Delay
High > 50 sec. 5
40%
Moderate/High 30 - 50 sec. 4
Moderate 15 - 30 sec. 3
Moderate/Low 5 - 15 sec. 2
Low 0 - 5 sec. 1
No Delay 0 sec. 0
Coordinated Signal
Systems
Yes Yes 3 20%
No No 1
Volume-to-Capacity
Ratios
High >1.00 3
15% Moderate 0.80 – 1.00 4
Low < .80 5
Segment Overlap with Yes Yes 3 15%
ART Corridor No No 1
Transfer Locations Yes Yes 5
10% No No 3
Table 3.3 – Scenario Two Prioritization of One Mile Segments
with Existing Pace Fixed-Route Service
Criteria Categories Range of Values Points Weights
Probe Vehicle
Field Data on
Signal Delay
High > 50 sec. 5
25%
Moderate/High 30 - 50 sec. 4
Moderate 15 - 30 sec. 3
Moderate/Low 5 - 15 sec. 2
Low 0 - 5 sec. 1
No Delay 0 sec. 0
Corridor
Funding
Situation
SAFETEA-LU SAFETEA-LU 5
5% FY06 Authorization FY06 Authorization 3
FY07 Appropriations FY07 Appropriations 3
No funding No funding 1
2006 Average
Weekday
Ridership per
Route
High > 5,500 Passengers 5
10%
Moderate/High 3,000-5,500 passengers 4
Moderate 2,000-3,000 passengers 3
Moderate/Low 550-2,000 passengers 2
Low < 550 passengers 1
IBS Travel Time
Index
High > 2.85 5
10%
Moderate/High 2.5 – 2.85 4
Moderate 2.1 – 2.5 3
Moderate/Low 1.75 – 2.1 2
Low < 1.75 1
Bus Frequency
along Segment
During Peak
Periods
High > 30 buses 5
10%
Moderate/High 16-29 buses 4
Moderate 7-15 buses 3
Moderate/Low 3-7 buses 2
Low 1-2 buses 1
Pace Route
Length along
High > 4 miles 5 5%
Moderate/High 2-4 miles 4
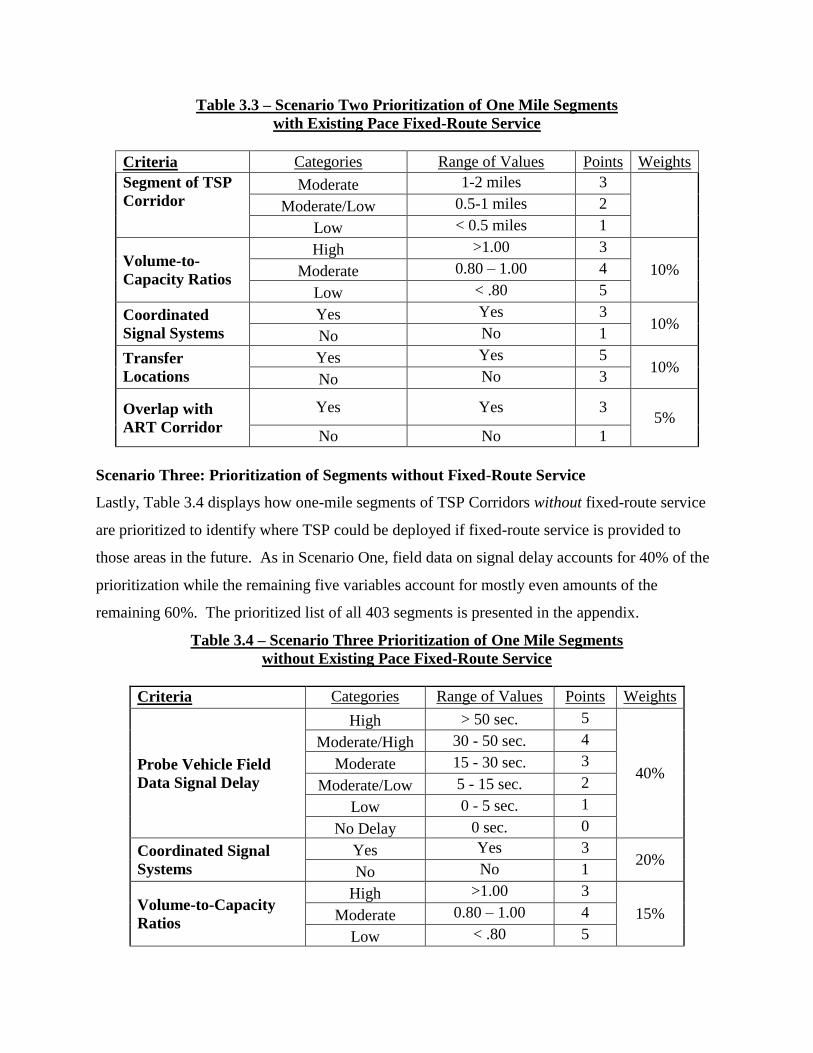
Table 3.3 – Scenario Two Prioritization of One Mile Segments
with Existing Pace Fixed-Route Service
Criteria Categories Range of Values Points Weights
Segment of TSP
Corridor Moderate 1-2 miles 3
Moderate/Low 0.5-1 miles 2
Low < 0.5 miles 1
Volume-to-
Capacity Ratios
High >1.00 3
10% Moderate 0.80 – 1.00 4
Low < .80 5
Coordinated
Signal Systems
Yes Yes 3 10%
No No 1
Transfer
Locations
Yes Yes 5 10%
No No 3
Overlap with
ART Corridor
Yes Yes 3 5%
No No 1
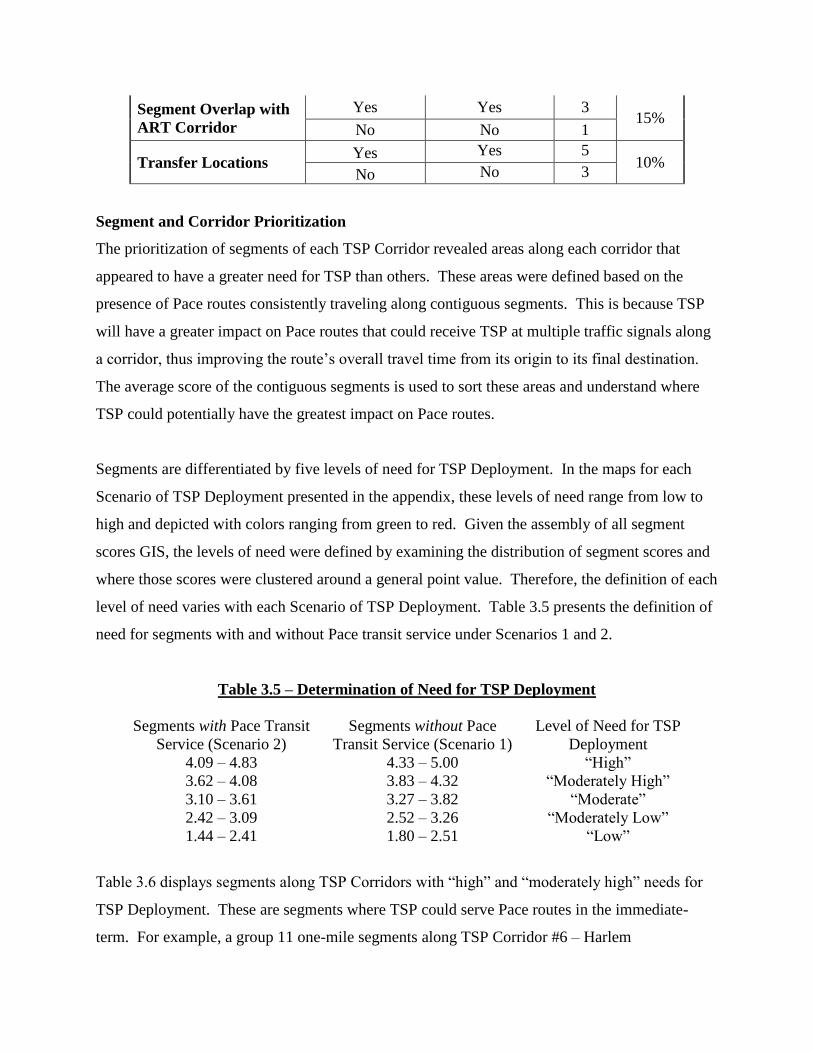
Scenario Three: Prioritization of Segments without Fixed-Route Service
Lastly, Table 3.4 displays how one-mile segments of TSP Corridors without fixed-route service
are prioritized to identify where TSP could be deployed if fixed-route service is provided to
those areas in the future. As in Scenario One, field data on signal delay accounts for 40% of the
prioritization while the remaining five variables account for mostly even amounts of the
remaining 60%. The prioritized list of all 403 segments is presented in the appendix.
Table 3.4 – Scenario Three Prioritization of One Mile Segments
without Existing Pace Fixed-Route Service
Criteria Categories Range of Values Points Weights
Probe Vehicle Field
Data Signal Delay
High > 50 sec. 5
40%
Moderate/High 30 - 50 sec. 4
Moderate 15 - 30 sec. 3
Moderate/Low 5 - 15 sec. 2
Low 0 - 5 sec. 1
No Delay 0 sec. 0
Coordinated Signal
Systems
Yes Yes 3 20%
No No 1
Volume-to-Capacity
Ratios
High >1.00 3
15% Moderate 0.80 – 1.00 4
Low < .80 5
Segment Overlap with
ART Corridor
Yes Yes 3 15%
No No 1
Transfer Locations Yes Yes 5
10% No No 3
Segment and Corridor Prioritization
The prioritization of segments of each TSP Corridor revealed areas along each corridor that
appeared to have a greater need for TSP than others. These areas were defined based on the
presence of Pace routes consistently traveling along contiguous segments. This is because TSP
will have a greater impact on Pace routes that could receive TSP at multiple traffic signals along
a corridor, thus improving the route’s overall travel time from its origin to its final destination.
The average score of the contiguous segments is used to sort these areas and understand where
TSP could potentially have the greatest impact on Pace routes.
Segments are differentiated by five levels of need for TSP Deployment. In the maps for each
Scenario of TSP Deployment presented in the appendix, these levels of need range from low to
high and depicted with colors ranging from green to red. Given the assembly of all segment
scores GIS, the levels of need were defined by examining the distribution of segment scores and
where those scores were clustered around a general point value. Therefore, the definition of each
level of need varies with each Scenario of TSP Deployment. Table 3.5 presents the definition of
need for segments with and without Pace transit service under Scenarios 1 and 2.
Table 3.5 – Determination of Need for TSP Deployment
Segments with Pace Transit
Service (Scenario 2)
Segments without Pace
Transit Service (Scenario 1)
Level of Need for TSP
Deployment
4.09 – 4.83 4.33 – 5.00 ―High‖
3.62 – 4.08 3.83 – 4.32 ―Moderately High‖
3.10 – 3.61 3.27 – 3.82 ―Moderate‖
2.42 – 3.09 2.52 – 3.26 ―Moderately Low‖
1.44 – 2.41 1.80 – 2.51 ―Low‖
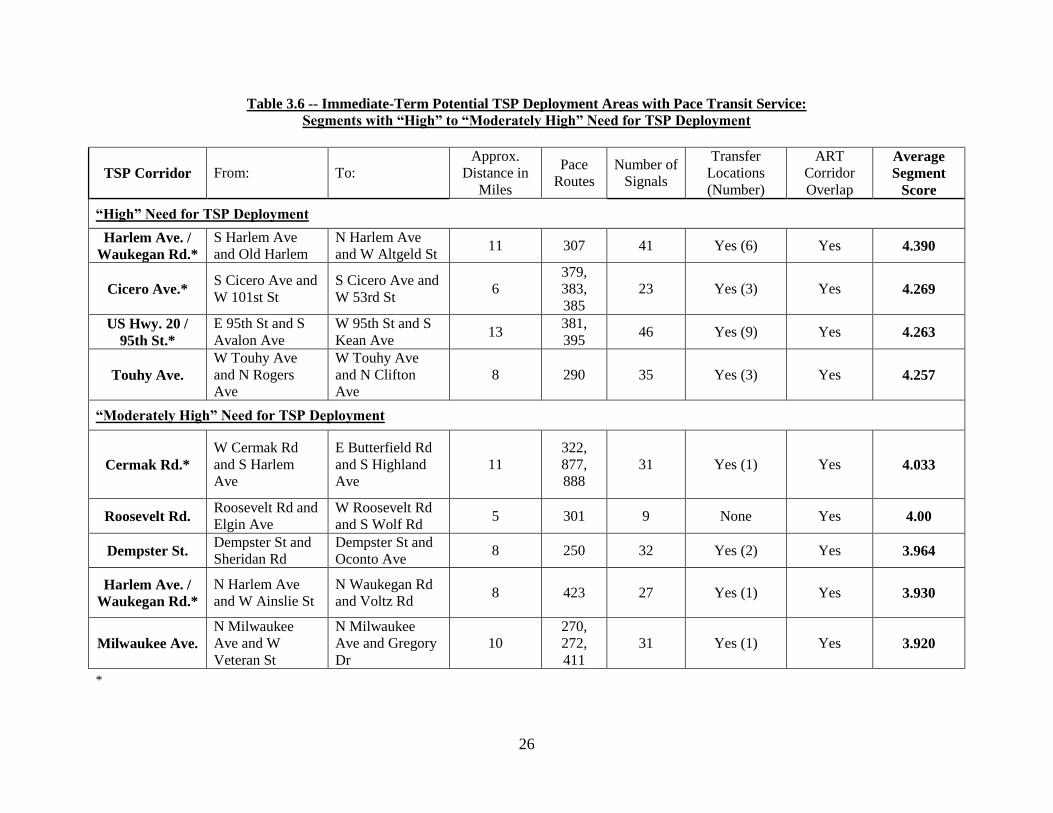
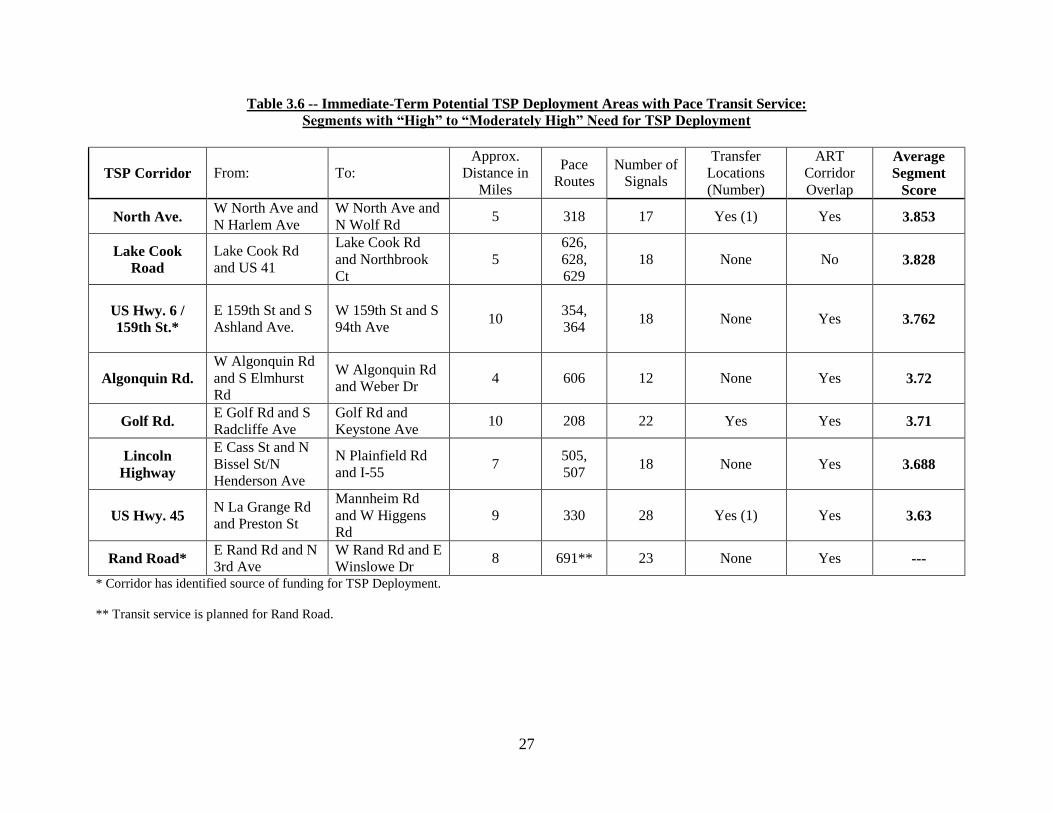
Table 3.6 displays segments along TSP Corridors with ―high‖ and ―moderately high‖ needs for
TSP Deployment. These are segments where TSP could serve Pace routes in the immediate-
term. For example, a group 11 one-mile segments along TSP Corridor #6 – Harlem
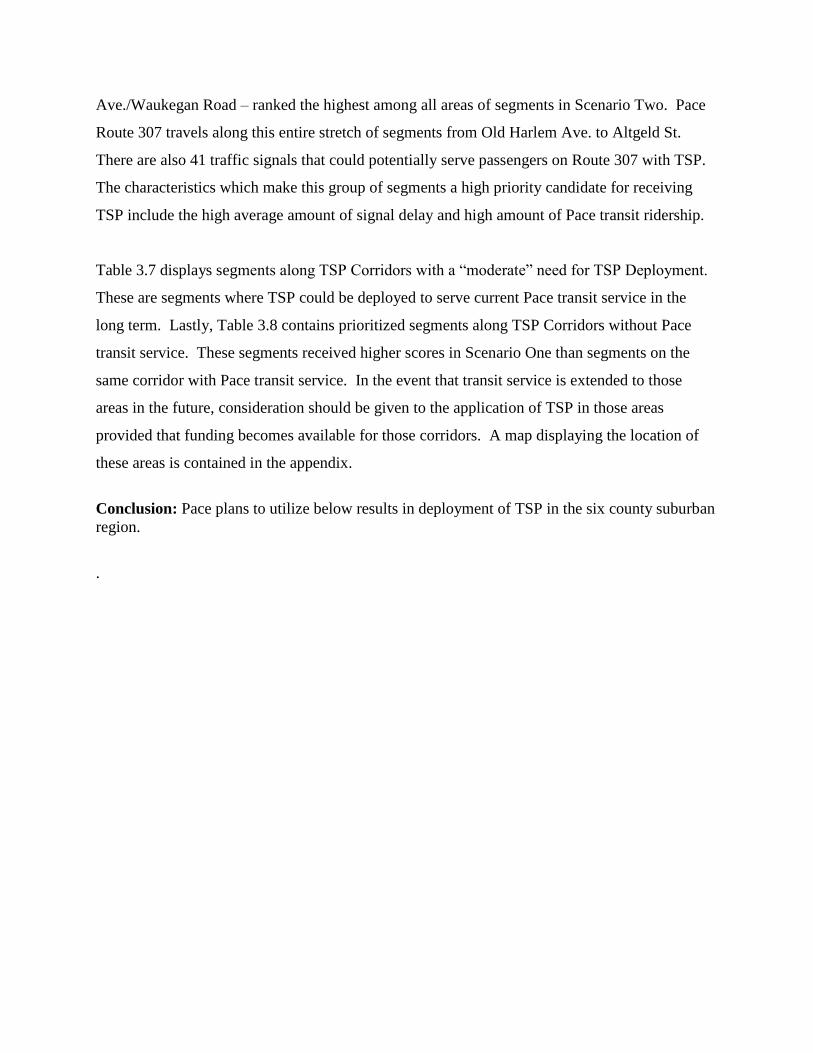
Ave./Waukegan Road – ranked the highest among all areas of segments in Scenario Two. Pace
Route 307 travels along this entire stretch of segments from Old Harlem Ave. to Altgeld St.
There are also 41 traffic signals that could potentially serve passengers on Route 307 with TSP.
The characteristics which make this group of segments a high priority candidate for receiving
TSP include the high average amount of signal delay and high amount of Pace transit ridership.
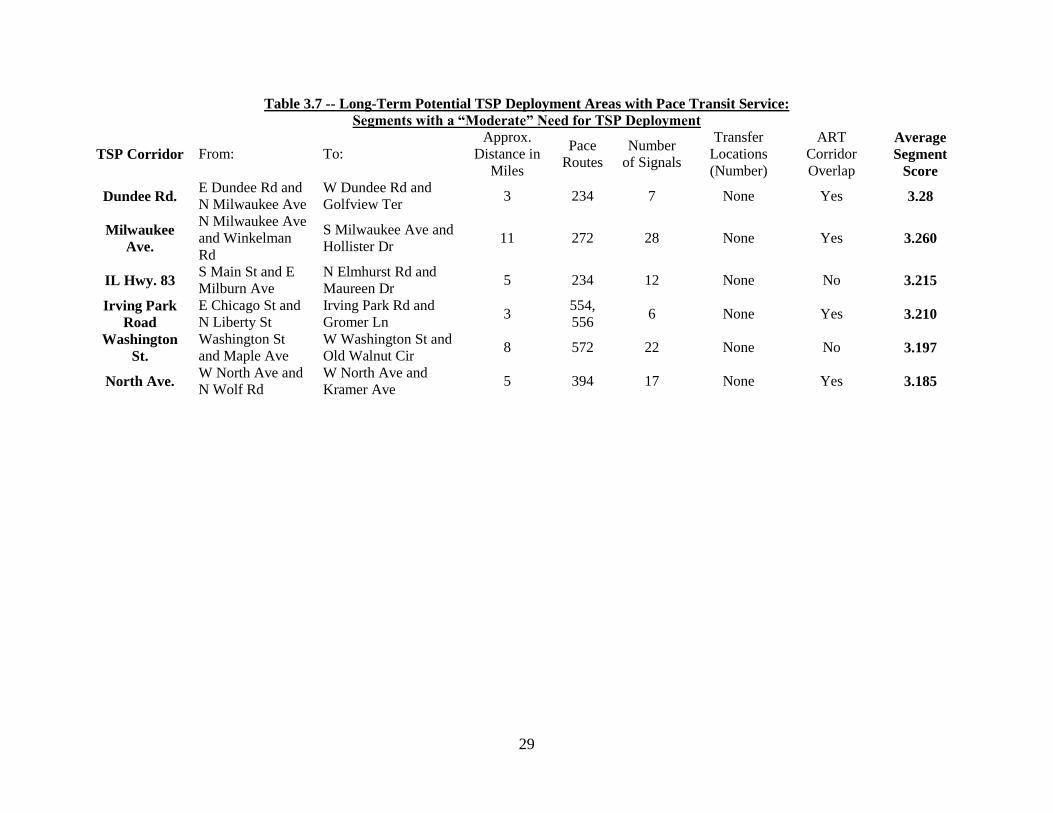
Table 3.7 displays segments along TSP Corridors with a ―moderate‖ need for TSP Deployment.
These are segments where TSP could be deployed to serve current Pace transit service in the
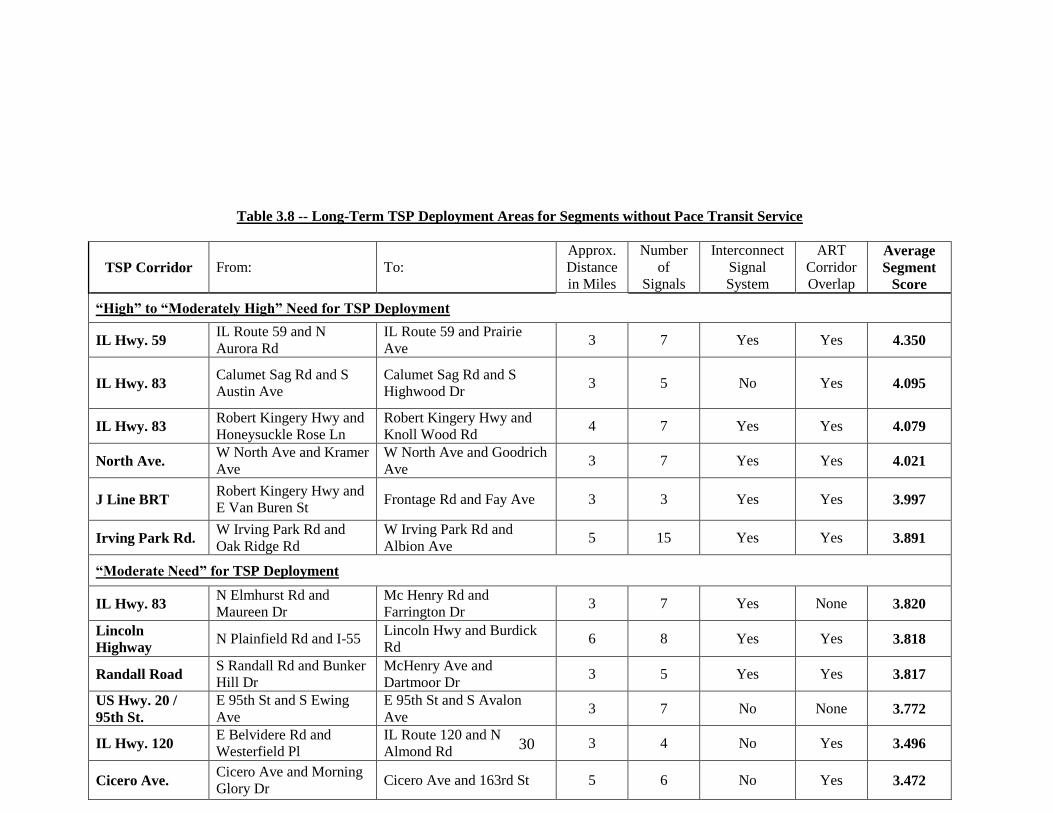
long term. Lastly, Table 3.8 contains prioritized segments along TSP Corridors without Pace
transit service. These segments received higher scores in Scenario One than segments on the
same corridor with Pace transit service. In the event that transit service is extended to those
areas in the future, consideration should be given to the application of TSP in those areas
provided that funding becomes available for those corridors. A map displaying the location of
these areas is contained in the appendix.
Conclusion: Pace plans to utilize below results in deployment of TSP in the six county suburban
region.
.
26
Table 3.6 -- Immediate-Term Potential TSP Deployment Areas with Pace Transit Service:
Segments with “High” to “Moderately High” Need for TSP Deployment
TSP Corridor From: To:
Approx.
Distance in
Miles
Pace
Routes
Number of
Signals
Transfer
Locations
(Number)
ART
Corridor
Overlap
Average
Segment
Score
“High” Need for TSP Deployment
Harlem Ave. /
Waukegan Rd.*
S Harlem Ave
and Old Harlem
N Harlem Ave
and W Altgeld St 11 307 41 Yes (6) Yes 4.390
Cicero Ave.* S Cicero Ave and
W 101st St
S Cicero Ave and
W 53rd St 6
379,
383,
385
23 Yes (3) Yes 4.269
US Hwy. 20 /
95th St.*
E 95th St and S
Avalon Ave
W 95th St and S
Kean Ave 13
381,
395 46 Yes (9) Yes 4.263
Touhy Ave.
W Touhy Ave
and N Rogers
Ave
W Touhy Ave
and N Clifton
Ave
8 290 35 Yes (3) Yes 4.257
“Moderately High” Need for TSP Deployment
Cermak Rd.*
W Cermak Rd
and S Harlem
Ave
E Butterfield Rd
and S Highland
Ave
11
322,
877,
888
31 Yes (1) Yes 4.033
Roosevelt Rd. Roosevelt Rd and
Elgin Ave
W Roosevelt Rd
and S Wolf Rd 5 301 9 None Yes 4.00
Dempster St. Dempster St and
Sheridan Rd
Dempster St and
Oconto Ave 8 250 32 Yes (2) Yes 3.964
Harlem Ave. /
Waukegan Rd.*
N Harlem Ave
and W Ainslie St
N Waukegan Rd
and Voltz Rd 8 423 27 Yes (1) Yes 3.930
Milwaukee Ave.
N Milwaukee
Ave and W
Veteran St
N Milwaukee
Ave and Gregory
Dr
10
270,
272,
411
31 Yes (1) Yes 3.920
*
27
Table 3.6 -- Immediate-Term Potential TSP Deployment Areas with Pace Transit Service:
Segments with “High” to “Moderately High” Need for TSP Deployment
TSP Corridor From: To:
Approx.
Distance in
Miles
Pace
Routes
Number of
Signals
Transfer
Locations
(Number)
ART
Corridor
Overlap
Average
Segment
Score
North Ave. W North Ave and
N Harlem Ave
W North Ave and
N Wolf Rd 5 318 17 Yes (1) Yes 3.853
Lake Cook
Road
Lake Cook Rd
and US 41
Lake Cook Rd
and Northbrook
Ct
5
626,
628,
629
18 None No 3.828
US Hwy. 6 /
159th St.*
E 159th St and S
Ashland Ave.
W 159th St and S
94th Ave 10
354,
364 18 None Yes 3.762
Algonquin Rd.
W Algonquin Rd
and S Elmhurst
Rd
W Algonquin Rd
and Weber Dr 4 606 12 None Yes 3.72
Golf Rd. E Golf Rd and S
Radcliffe Ave
Golf Rd and
Keystone Ave 10 208 22 Yes Yes 3.71
Lincoln
Highway
E Cass St and N
Bissel St/N
Henderson Ave
N Plainfield Rd
and I-55 7
505,
507 18 None Yes 3.688
US Hwy. 45 N La Grange Rd
and Preston St
Mannheim Rd
and W Higgens
Rd
9 330 28 Yes (1) Yes 3.63
Rand Road* E Rand Rd and N
3rd Ave
W Rand Rd and E
Winslowe Dr 8 691** 23 None Yes ---
* Corridor has identified source of funding for TSP Deployment.
** Transit service is planned for Rand Road.

28
Table 3.7 -- Long-Term Potential TSP Deployment Areas with Pace Transit Service:
Segments with a “Moderate” Need for TSP Deployment
TSP Corridor From: To:
Approx.
Distance in
Miles
Pace
Routes
Number
of Signals
Transfer
Locations
(Number)
ART
Corridor
Overlap
Average
Segment
Score
Touhy Ave. W Touhy Ave and
N Clifton Ave
E Touhy Ave and
Mannheim Rd 3
221,
241 5 None Yes 3.561
IL Hwy. 83
Robert Kingery
Hwy and W
Belmont Ave
S Elmhurst Rd and W
Montgomery St 8
223,
757 15 None
Segments
49-55 3.553
Lincoln
Highway
E Lincoln Hwy
and Lexington
Ave
W Lincoln Hwy and
Central
Ave/Ridgeland Ave
8 357,
753 23 Yes (1) Yes 3.543
US Hwy. 6 /
159th St.
Maple Rd and N
Parkwood Dr
St Ottowa St and W
McDonough St 4
501,
502 12 None No 3.492
IL Hwy. 83 Torrence Ave and
Michigan City Rd
Cicero Ave and
Sibley Blvd./147th
Ave
10 350,
354 28 Yes (2)
Segments
13-18 3.478
Cicero Ave.* Cicero Ave and
163rd St
S Cicero Ave and W
101st St 8 383 22 None Yes 3.456
Randall Rd. Randall Rd and
Hopps Rd
S Randall Rd and
Brookside Dr 3 549 6 None Yes 3.44
Lewis Street Lewis Ave and
MLK Jr Dr
Lewis Ave and 14th
St 6 569 13 None No 3.436
Grand Ave. Grand Ave and N
Genesee St
Grand Ave and Pine
St 8 565 21 None No 3.431
Milwaukee
Ave.
S Milwaukee Ave
and Hollister Dr
N Milwaukee Ave
and W Buckley Rd 4 572 14 None Yes 3.411
IL Hwy. 83
Glenwood-Dyer
Rd and S
Burnham Ave
Torrence Ave and
Michigan City Rd 6 358 16 None None 3.390
Harlem Ave.* S Harlem Ave and
W 131st St
S Harlem Ave and
Old Harlem 8 386 21 None Yes 3.389
Irving Park
Road
W Irving Park Rd
and Spruce Ave
W Irving Park Rd and
N Harlem Ave 9
326,
332 14 Yes (2) Yes 3.356
29
Table 3.7 -- Long-Term Potential TSP Deployment Areas with Pace Transit Service:
Segments with a “Moderate” Need for TSP Deployment
TSP Corridor From: To:
Approx.
Distance in
Miles
Pace
Routes
Number
of Signals
Transfer
Locations
(Number)
ART
Corridor
Overlap
Average
Segment
Score
Dundee Rd. E Dundee Rd and
N Milwaukee Ave
W Dundee Rd and
Golfview Ter 3 234 7 None Yes 3.28
Milwaukee
Ave.
N Milwaukee Ave
and Winkelman
Rd
S Milwaukee Ave and
Hollister Dr 11 272 28 None Yes 3.260
IL Hwy. 83 S Main St and E
Milburn Ave
N Elmhurst Rd and
Maureen Dr 5 234 12 None No 3.215
Irving Park
Road
E Chicago St and
N Liberty St
Irving Park Rd and
Gromer Ln 3
554,
556 6 None Yes 3.210
Washington
St.
Washington St
and Maple Ave
W Washington St and
Old Walnut Cir 8 572 22 None No 3.197
North Ave. W North Ave and
N Wolf Rd
W North Ave and
Kramer Ave 5 394 17 None Yes 3.185
30
Table 3.8 -- Long-Term TSP Deployment Areas for Segments without Pace Transit Service
TSP Corridor From: To:
Approx.
Distance
in Miles
Number
of
Signals
Interconnect
Signal
System
ART
Corridor
Overlap
Average
Segment
Score
“High” to “Moderately High” Need for TSP Deployment
IL Hwy. 59 IL Route 59 and N
Aurora Rd
IL Route 59 and Prairie
Ave 3 7 Yes Yes 4.350
IL Hwy. 83 Calumet Sag Rd and S
Austin Ave
Calumet Sag Rd and S
Highwood Dr 3 5 No Yes 4.095
IL Hwy. 83 Robert Kingery Hwy and
Honeysuckle Rose Ln
Robert Kingery Hwy and
Knoll Wood Rd 4 7 Yes Yes 4.079
North Ave. W North Ave and Kramer
Ave
W North Ave and Goodrich
Ave 3 7 Yes Yes 4.021
J Line BRT Robert Kingery Hwy and
E Van Buren St Frontage Rd and Fay Ave 3 3 Yes Yes 3.997
Irving Park Rd. W Irving Park Rd and
Oak Ridge Rd
W Irving Park Rd and
Albion Ave 5 15 Yes Yes 3.891
“Moderate Need” for TSP Deployment
IL Hwy. 83 N Elmhurst Rd and
Maureen Dr
Mc Henry Rd and
Farrington Dr 3 7 Yes None 3.820
Lincoln
Highway N Plainfield Rd and I-55
Lincoln Hwy and Burdick
Rd 6 8 Yes Yes 3.818
Randall Road S Randall Rd and Bunker
Hill Dr
McHenry Ave and
Dartmoor Dr 3 5 Yes Yes 3.817
US Hwy. 20 /
95th St.
E 95th St and S Ewing
Ave
E 95th St and S Avalon
Ave 3 7 No None 3.772
IL Hwy. 120 E Belvidere Rd and
Westerfield Pl
IL Route 120 and N
Almond Rd 3 4 No Yes 3.496
Cicero Ave. Cicero Ave and Morning
Glory Dr Cicero Ave and 163rd St 5 6 No Yes 3.472

31