Embed Size (px)
Citation preview
Transparent Earth/Seismic Imaging Team Steven D. Glaser, working group herdsman
Towards the full Homestake Transparent Earth Observatory – installa;on and opera;on of a full complement of seismic, ;lt, and EM instrument sta;ons
Steven Glaser, UC Berkeley, Bill Roggenthen, SDSMT, Lane Johnson, LBNL
EM Passive Imaging as a Hazards Assessment Methodology
Dante FraDa – University of Wisconsin‐Madison
Examining seismic sources from micro to macro through mul;‐sensor inversion
Steven Glaser, UC Berkeley, Lane Johnson, LBNL, Bill Roggenthen, SDSMT
Ac;ve source experiment to study anisotropy
Gary Pavlis, Indiana University
Installa;on of the Rapid City long‐period sta;on at the Homestake
Lind S. Gee, scienLst‐in‐charge USGS Albuquerque
3D, Time‐Lapse Seismic Tomography for Imaging Overburden Changes due to Dewatering
Erik Westman, Virginia Tech
Stress Monitoring with high precision seismic travel ;me measurements
Fenglin Niu, Rice U; Tom Daley, LBNL
Understanding the complexity of the crustal Earth system
ChrisLan Klose, Columbia University
Advanced Imaging of Gravity Varia;ons and Rock Structures
Don Pool, USGS, Phoenix; Joe Wang, LBNL
3‐D passive electromagne;cs for structural imaging, anisotropy, and methodological studies
Paul Bedrosian, Vic Labson, US Geological Survey, Denver
Prototype Broadband Array for DUSEL Gary Pavlis, Indiana University
3D resis;vity & self‐poten;al monitoring of mine dewatering phase
Burke Minsley; Vic Labson, US Geological Survey, Denver
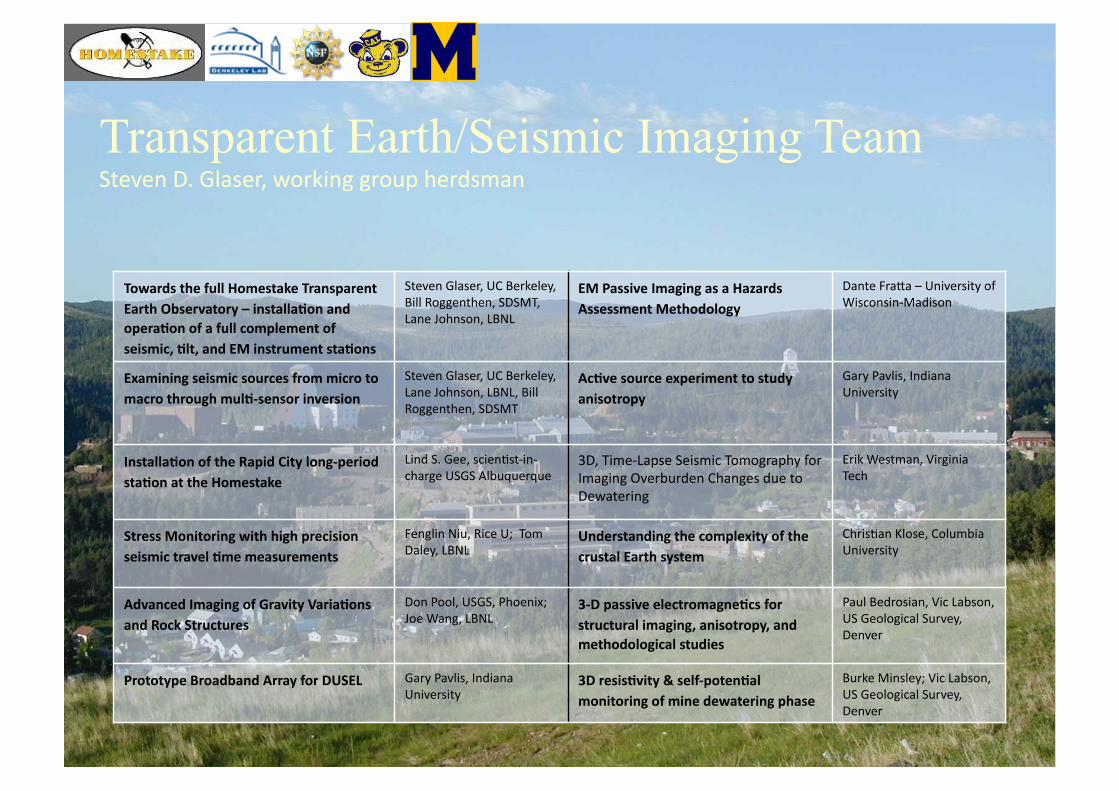
All experiments in the mine will require some minimum of service and facility. We assume that all experiments will need at least the following infrastructure.
• High‐speed fiber internet links that provide IEEE1588 Lme synchronizaLon.
• Power over ethernet? • A clean, dry, venLlated, and very well lit enclosed space approximately the
size of a half‐container (6 x 2.5 x 2.5 m). Referred to here as a “doghouse.”
• Clean, condiLoned power, 30 to 50 amps at 110/120 VAC.
• Access to drinking water and sanitary faciliLes. • Each team needs a full‐Lme, high level tech at the DUSEL.
Infrastructure needs prior to conducLng any experiments at Homestake

• Ongoing work to provide reasonable esLmates of bulk
Vp and Vs.
• Detailed velocity models to characterize the effects of the mined out volumes.
• Areas of low EM
• Access to far reaches of the mine.
Infrastructure needs prior to conducLng any experiments at Homestake
• Effects of ferrous materials dependent
upon the EM applicaLon.
• Find isolated locaLons for measurements
extremely sensiLve to possible near field
effects.
• The ramp systems, which connect the levels
with ~50m verLcal separaLon will provide
areas without metal.
• Fiberglass rock bolts could be used in these areas to reduce the effects of steel ground
control equipment even further.
Seismic Imaging of Subsurface Stress
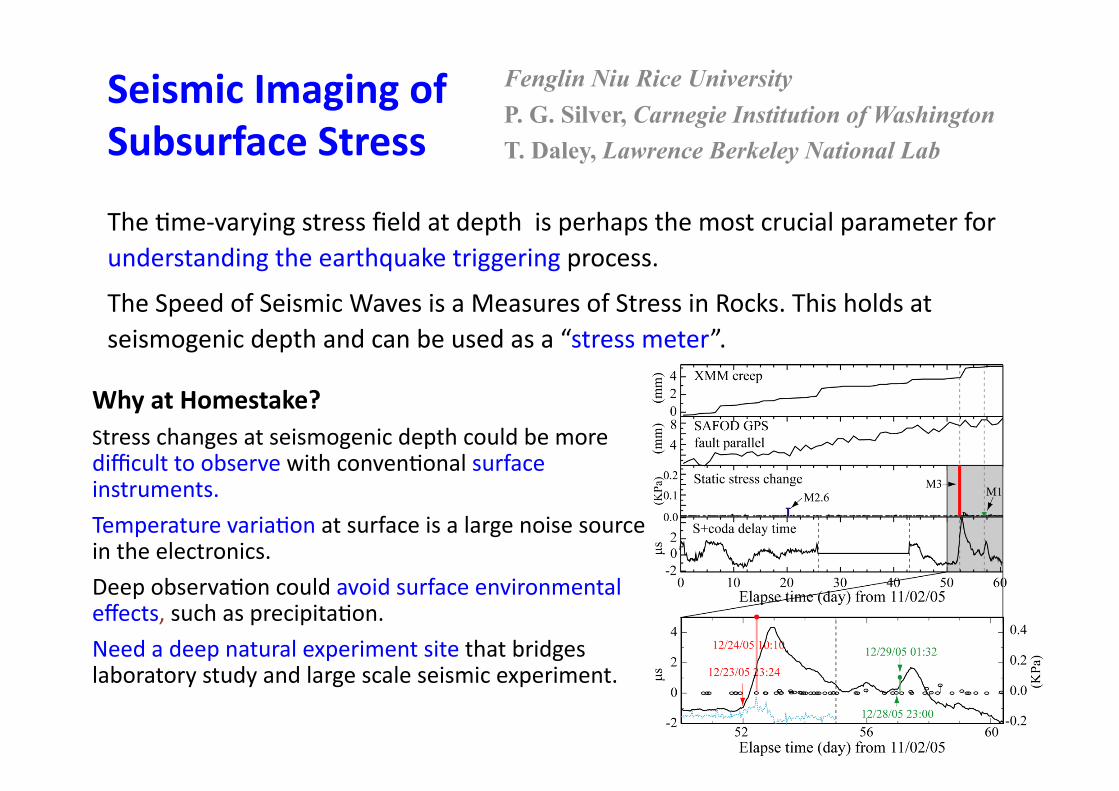
The Lme‐varying stress field at depth is perhaps the most crucial parameter for understanding the earthquake triggering process.
The Speed of Seismic Waves is a Measures of Stress in Rocks. This holds at seismogenic depth and can be used as a “stress meter”.
Fenglin Niu Rice University P. G. Silver, Carnegie Institution of Washington T. Daley, Lawrence Berkeley National Lab
Why at Homestake? Stress changes at seismogenic depth could be more difficult to observe with convenLonal surface instruments.
Temperature variaLon at surface is a large noise source in the electronics.
Deep observaLon could avoid surface environmental effects, such as precipitaLon.
Need a deep natural experiment site that bridges laboratory study and large scale seismic experiment.
Stress Monitoring with high precision seismic travel Lme measurements. Fenglin Niu, Rice U; Paul Silver Carnegie InsLtute, Tom Daley, LBNL.
• High‐precision mulL‐path travel Lme measurement to determine relaLon between stress and velocity, stress
and seismic anisotropy
• Use coda wave interferometery to image change in the
scaDering field that links to fluid migraLons
• 3 wells, ~10‐50 m long or deep, variable spacing
• Wells ideally near fracture zone or spanning the zone.
• Temperature controlled facility (21 ~ 22℃, rH 65 ~ 70%)
• Max occupancy four persons, with an average of one
3D, Time‐Lapse Seismic Tomography for Imaging Overburden Changes due to Dewatering. Erik
Westman, Virginia Tech
• This project will use data collected by the permanent seismic observatory. No infrastructure needed
Understanding the complexity of the crustal Earth system. Chris;an Klose, Columbia University.
• This experiment will make use of almost all streams of data from the observatory, and extensive calculations and imaging will be performed off-site.
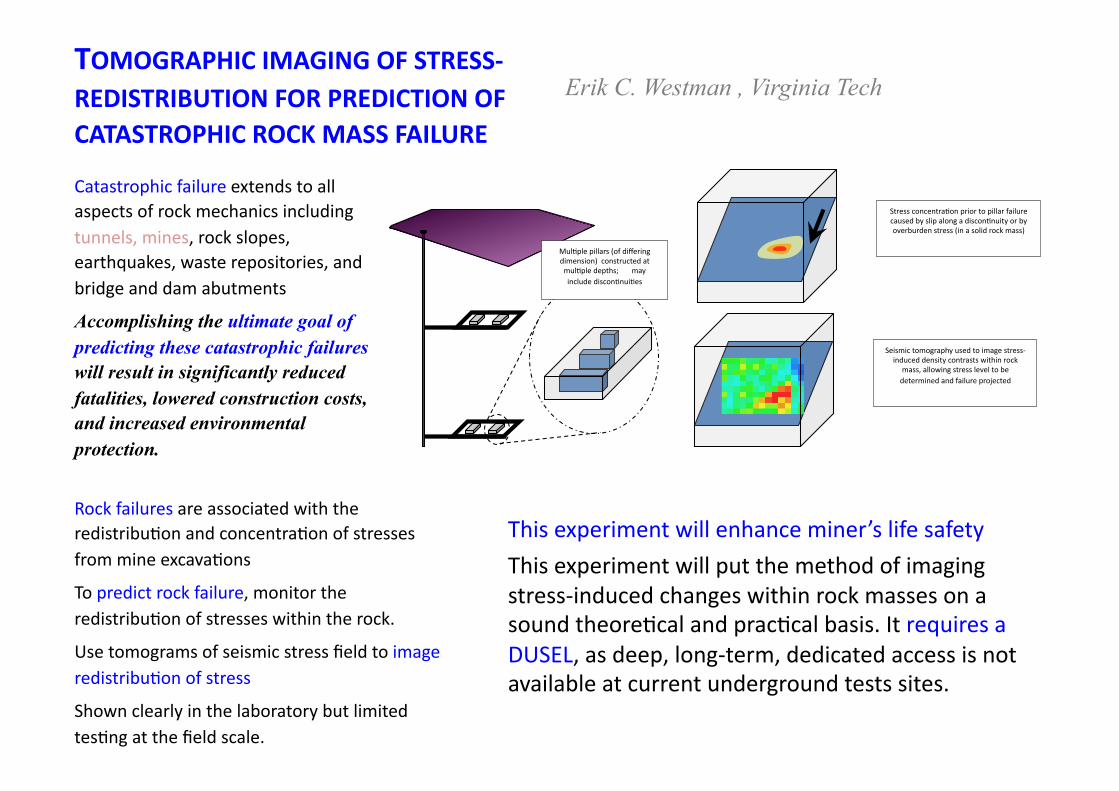
Catastrophic failure extends to all aspects of rock mechanics including tunnels, mines, rock slopes, earthquakes, waste repositories, and bridge and dam abutments
Accomplishing the ultimate goal of predicting these catastrophic failures will result in significantly reduced fatalities, lowered construction costs, and increased environmental protection.
Rock failures are associated with the redistribuLon and concentraLon of stresses from mine excavaLons
To predict rock failure, monitor the redistribuLon of stresses within the rock.
Use tomograms of seismic stress field to image redistribuLon of stress
Shown clearly in the laboratory but limited tesLng at the field scale.
This experiment will enhance miner’s life safety
This experiment will put the method of imaging stress‐induced changes within rock masses on a sound theoreLcal and pracLcal basis. It requires a DUSEL, as deep, long‐term, dedicated access is not available at current underground tests sites.
MulLple pillars (of differing dimension) constructed at mulLple depths; may include disconLnuiLes
Stress concentraLon prior to pillar failure caused by slip along a disconLnuity or by overburden stress (in a solid rock mass)
Seismic tomography used to image stress‐induced density contrasts within rock
mass, allowing stress level to be determined and failure projected
TOMOGRAPHIC IMAGING OF STRESS‐REDISTRIBUTION FOR PREDICTION OF CATASTROPHIC ROCK MASS FAILURE
Erik C. Westman , Virginia Tech
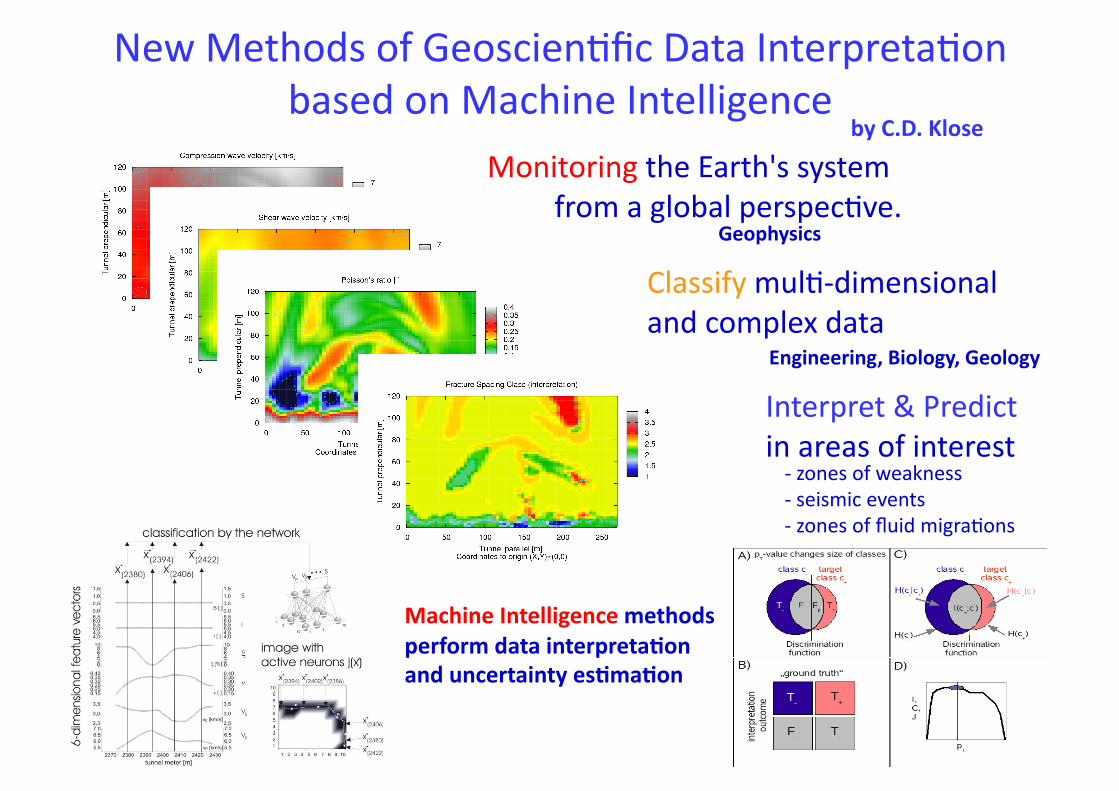
New Methods of GeoscienLfic Data InterpretaLon based on Machine Intelligence
Monitoring the Earth's system from a global perspecLve.
Classify mulL‐dimensional and complex data
Interpret & Predict in areas of interest ‐ zones of weakness ‐ seismic events ‐ zones of fluid migraLons
Machine Intelligence methods perform data interpreta;on and uncertainty es;ma;on
Geophysics
Engineering, Biology, Geology
by C.D. Klose
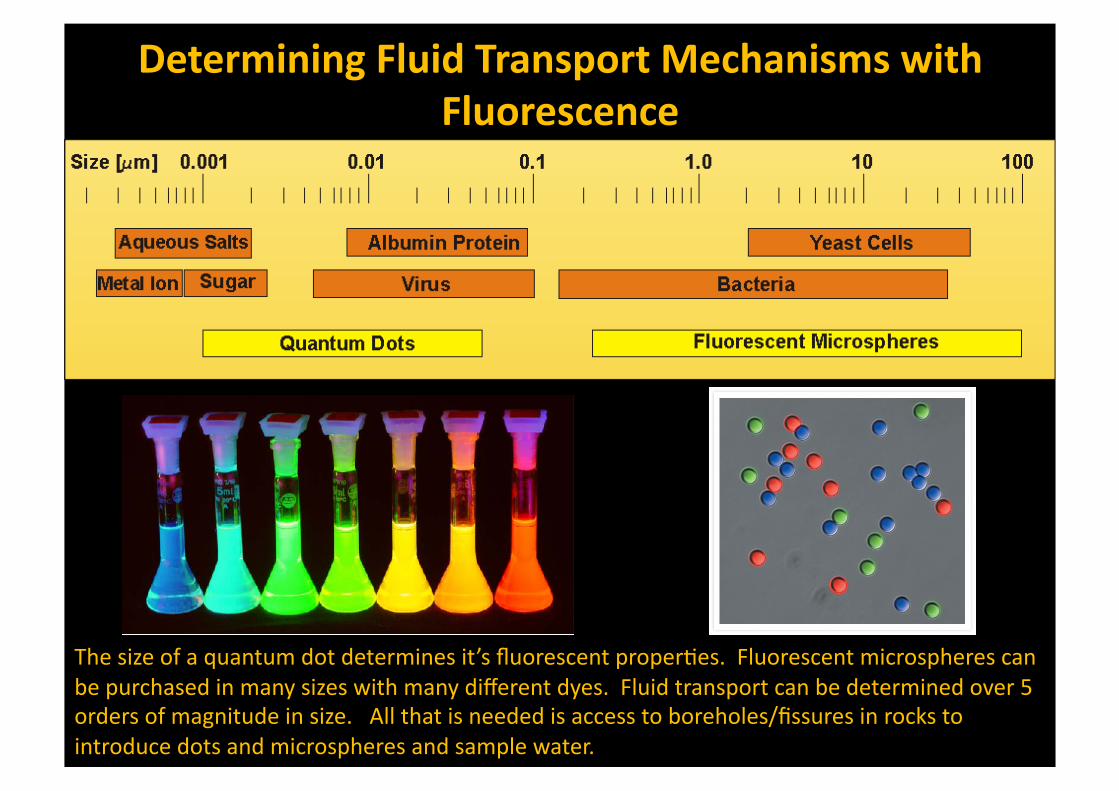
Determining Fluid Transport Mechanisms with Fluorescence
The size of a quantum dot determines it’s fluorescent properLes. Fluorescent microspheres can be purchased in many sizes with many different dyes. Fluid transport can be determined over 5 orders of magnitude in size. All that is needed is access to boreholes/fissures in rocks to introduce dots and microspheres and sample water.
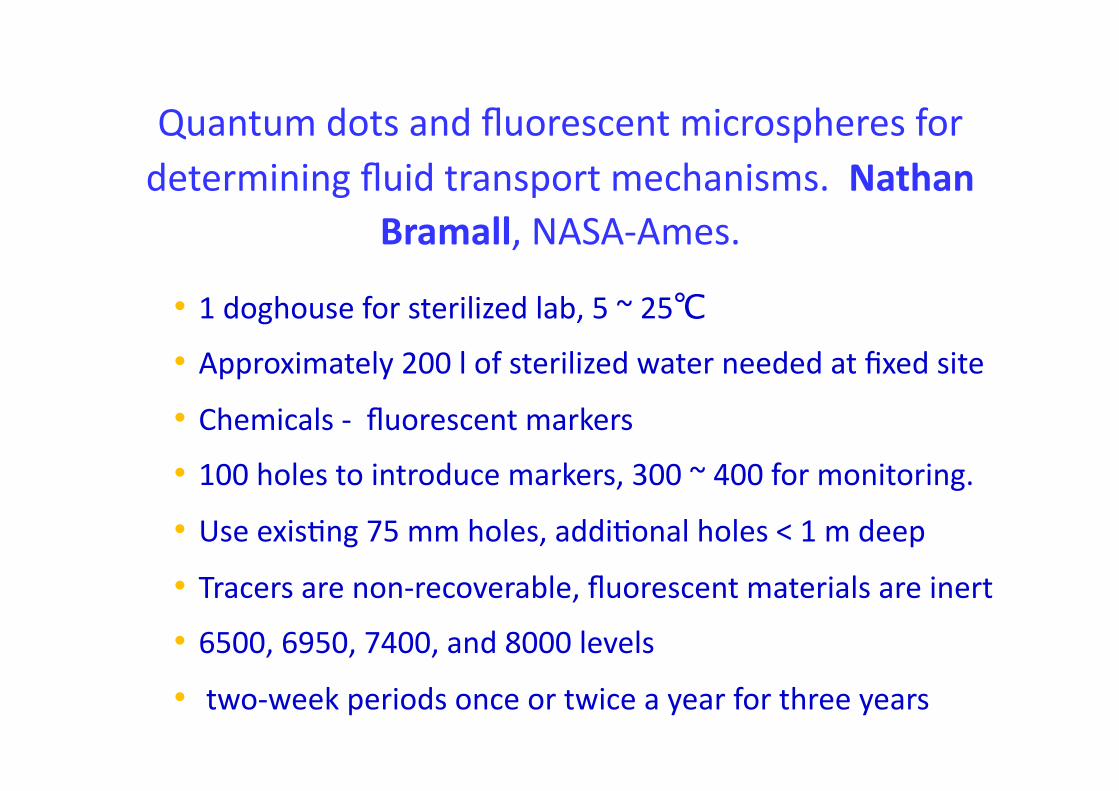
Quantum dots and fluorescent microspheres for determining fluid transport mechanisms. Nathan
Bramall, NASA‐Ames.
• 1 doghouse for sterilized lab, 5 ~ 25℃
• Approximately 200 l of sterilized water needed at fixed site
• Chemicals ‐ fluorescent markers
• 100 holes to introduce markers, 300 ~ 400 for monitoring.
• Use exisLng 75 mm holes, addiLonal holes < 1 m deep
• Tracers are non‐recoverable, fluorescent materials are inert
• 6500, 6950, 7400, and 8000 levels • two‐week periods once or twice a year for three years
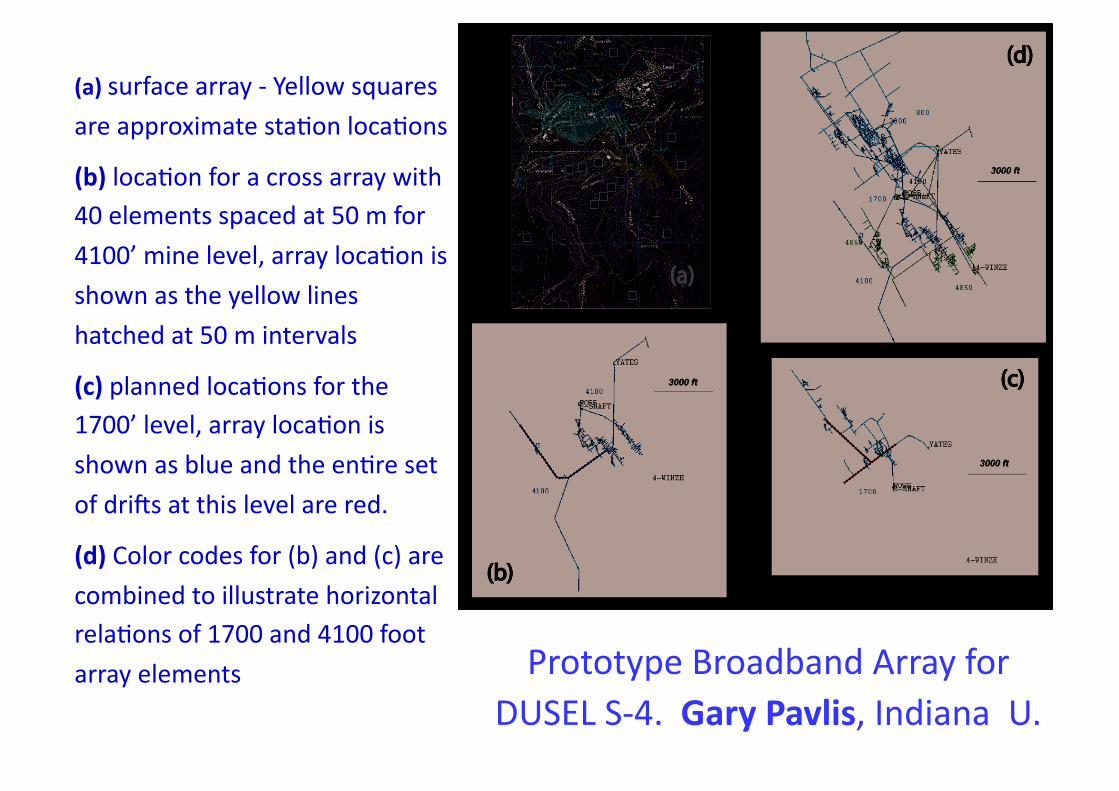
(a) surface array ‐ Yellow squares
are approximate staLon locaLons
(b) locaLon for a cross array with 40 elements spaced at 50 m for
4100’ mine level, array locaLon is
shown as the yellow lines
hatched at 50 m intervals
(c) planned locaLons for the 1700’ level, array locaLon is
shown as blue and the enLre set
of drius at this level are red.
(d) Color codes for (b) and (c) are
combined to illustrate horizontal relaLons of 1700 and 4100 foot
array elements Prototype Broadband Array for DUSEL S‐4. Gary Pavlis, Indiana U.
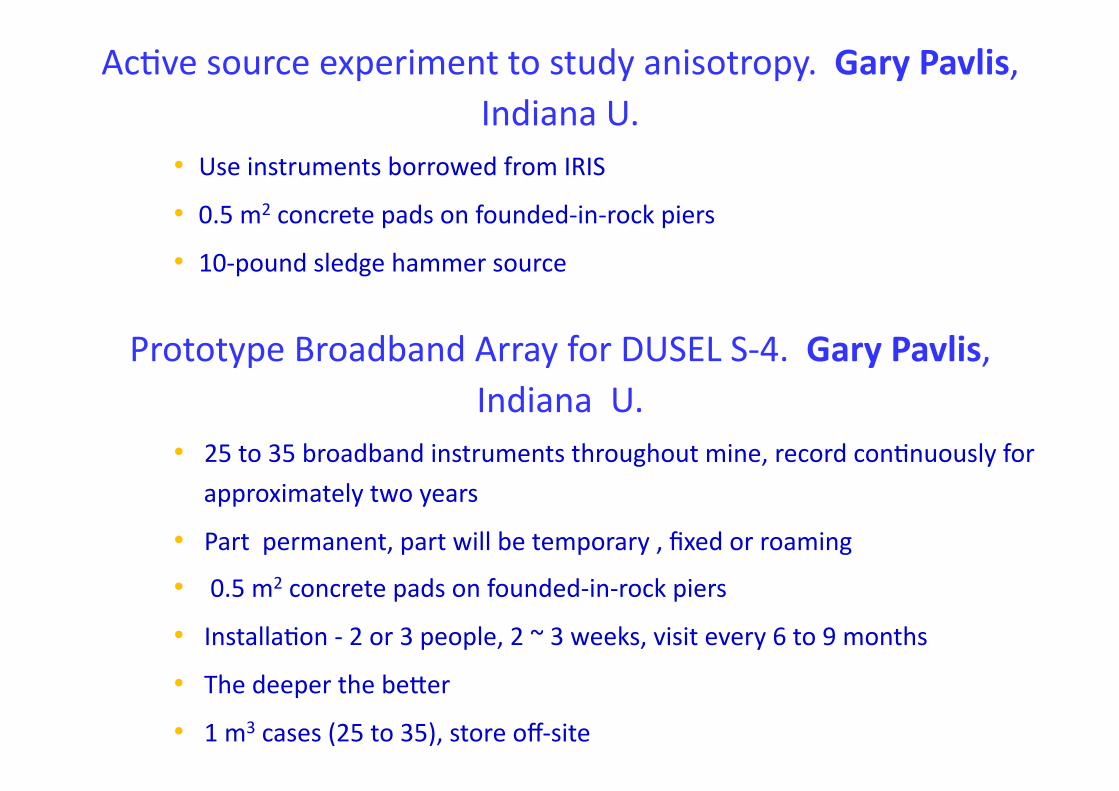
AcLve source experiment to study anisotropy. Gary Pavlis, Indiana U.
• Use instruments borrowed from IRIS
• 0.5 m2 concrete pads on founded‐in‐rock piers
• 10‐pound sledge hammer source
Prototype Broadband Array for DUSEL S‐4. Gary Pavlis, Indiana U.
• 25 to 35 broadband instruments throughout mine, record conLnuously for
approximately two years
• Part permanent, part will be temporary , fixed or roaming
• 0.5 m2 concrete pads on founded‐in‐rock piers
• InstallaLon ‐ 2 or 3 people, 2 ~ 3 weeks, visit every 6 to 9 months
• The deeper the beDer • 1 m3 cases (25 to 35), store off‐site
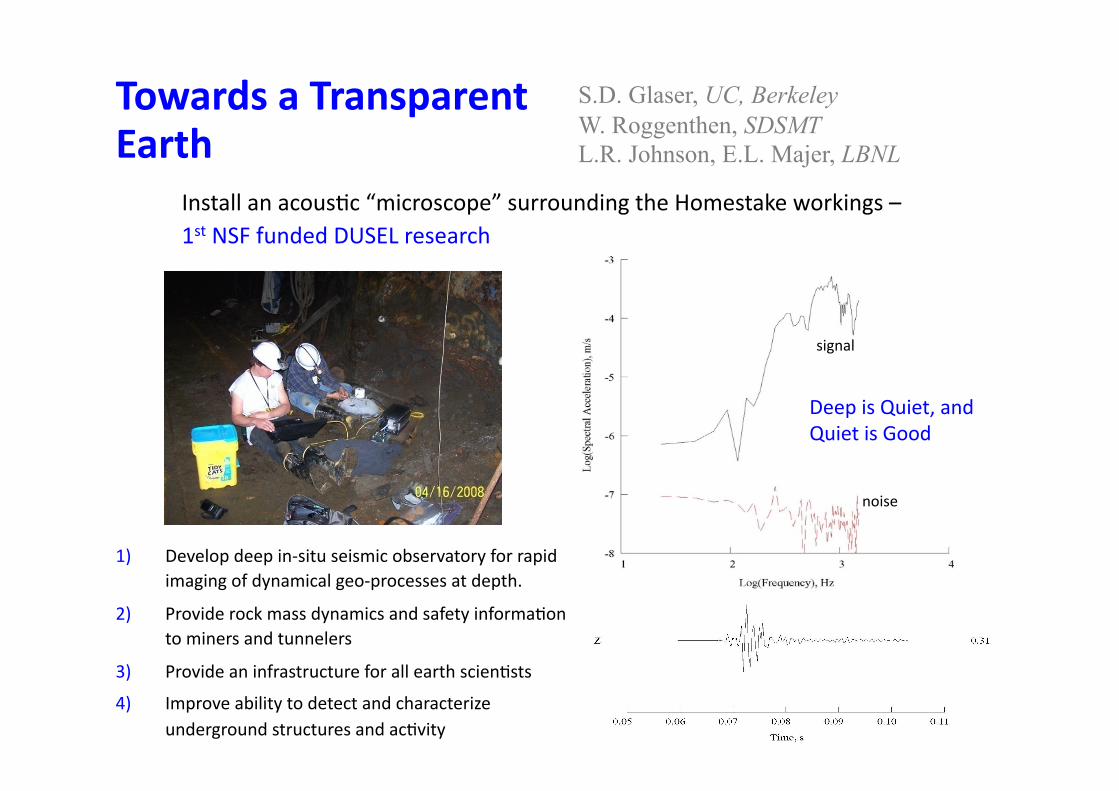
1) Develop deep in‐situ seismic observatory for rapid imaging of dynamical geo‐processes at depth.
2) Provide rock mass dynamics and safety informaLon to miners and tunnelers
3) Provide an infrastructure for all earth scienLsts
4) Improve ability to detect and characterize underground structures and acLvity
Towards a Transparent Earth
Install an acousLc “microscope” surrounding the Homestake workings – 1st NSF funded DUSEL research
S.D. Glaser, UC, Berkeley W. Roggenthen, SDSMT L.R. Johnson, E.L. Majer, LBNL
signal
noise
Deep is Quiet, and Quiet is Good
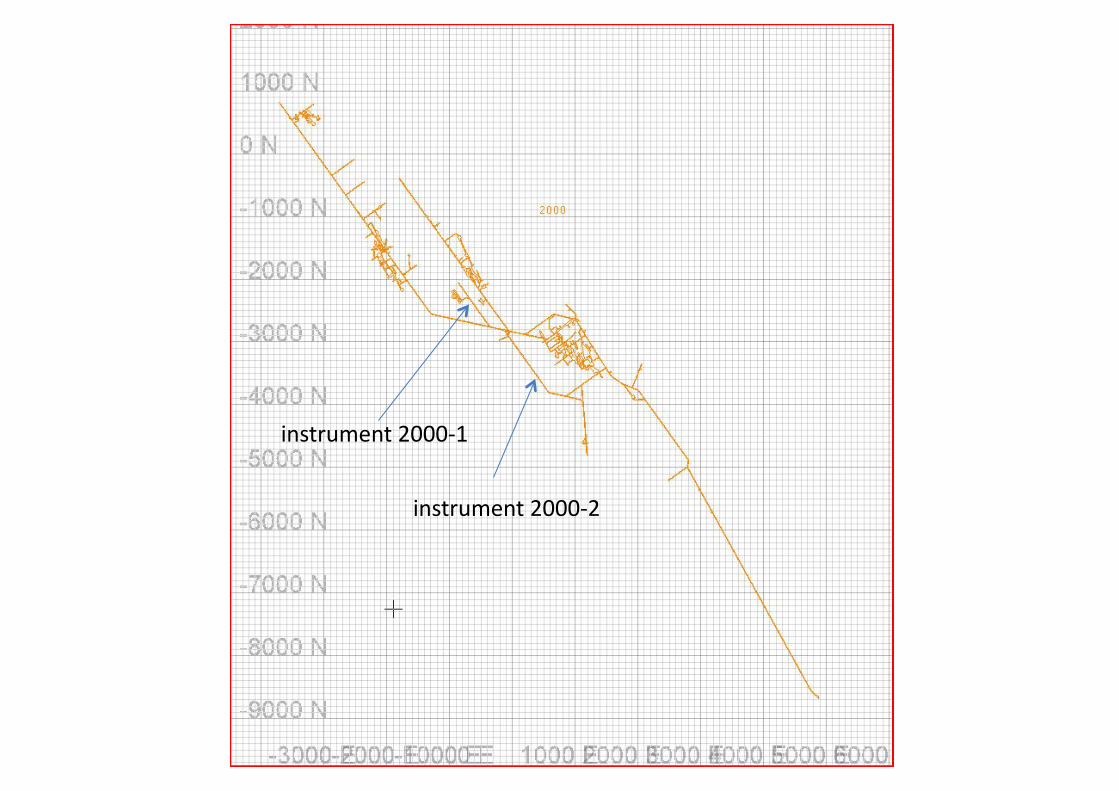
instrument 2000‐1
instrument 2000‐2
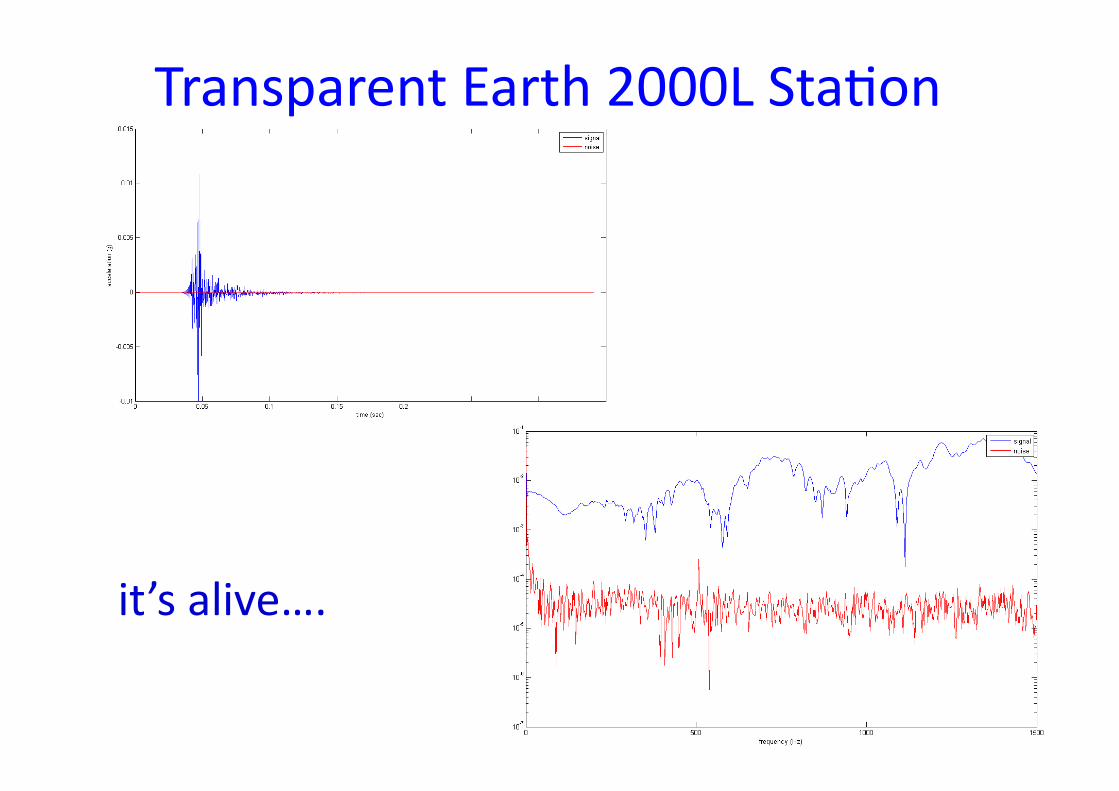
Transparent Earth 2000L StaLon
it’s alive….
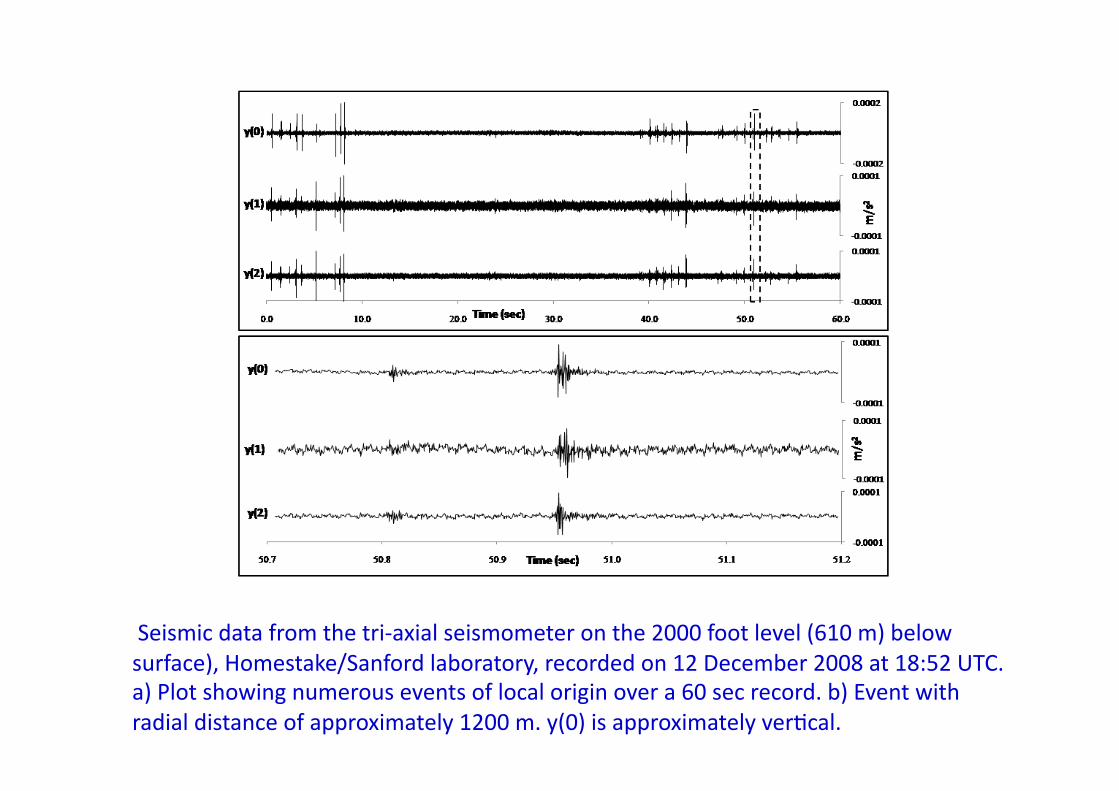
Seismic data from the tri‐axial seismometer on the 2000 foot level (610 m) below surface), Homestake/Sanford laboratory, recorded on 12 December 2008 at 18:52 UTC. a) Plot showing numerous events of local origin over a 60 sec record. b) Event with radial distance of approximately 1200 m. y(0) is approximately verLcal.
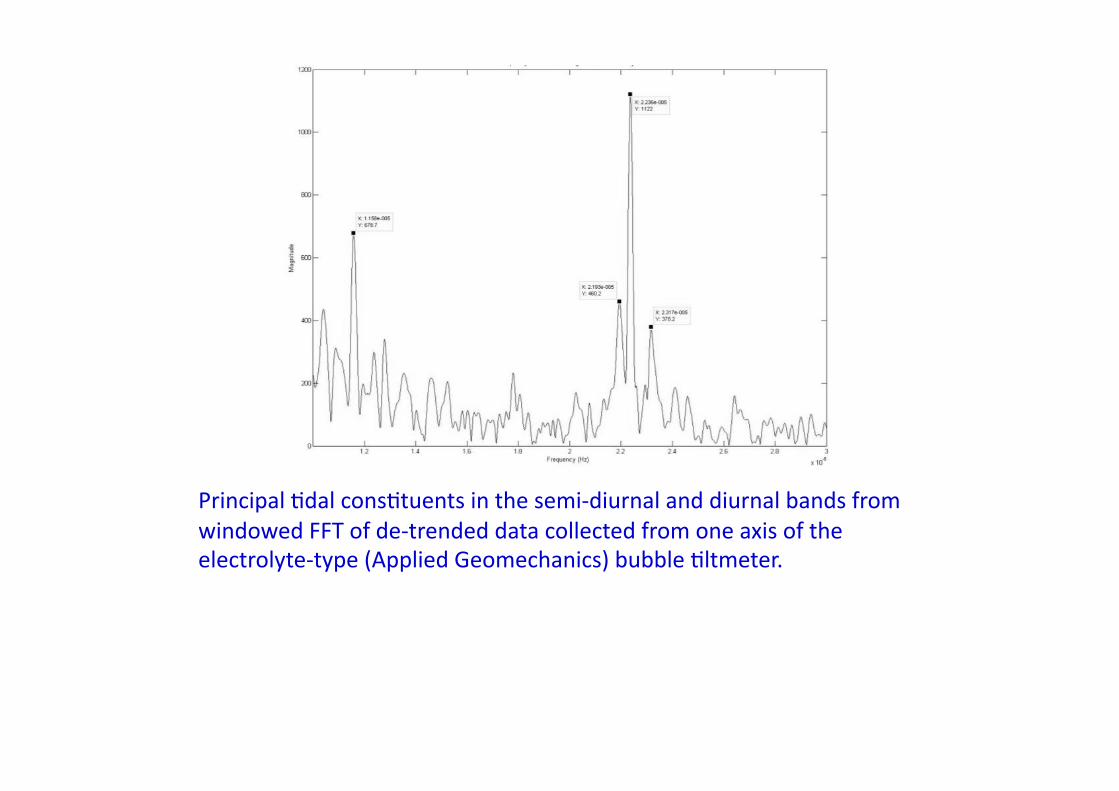
Principal Ldal consLtuents in the semi‐diurnal and diurnal bands from windowed FFT of de‐trended data collected from one axis of the electrolyte‐type (Applied Geomechanics) bubble Lltmeter.
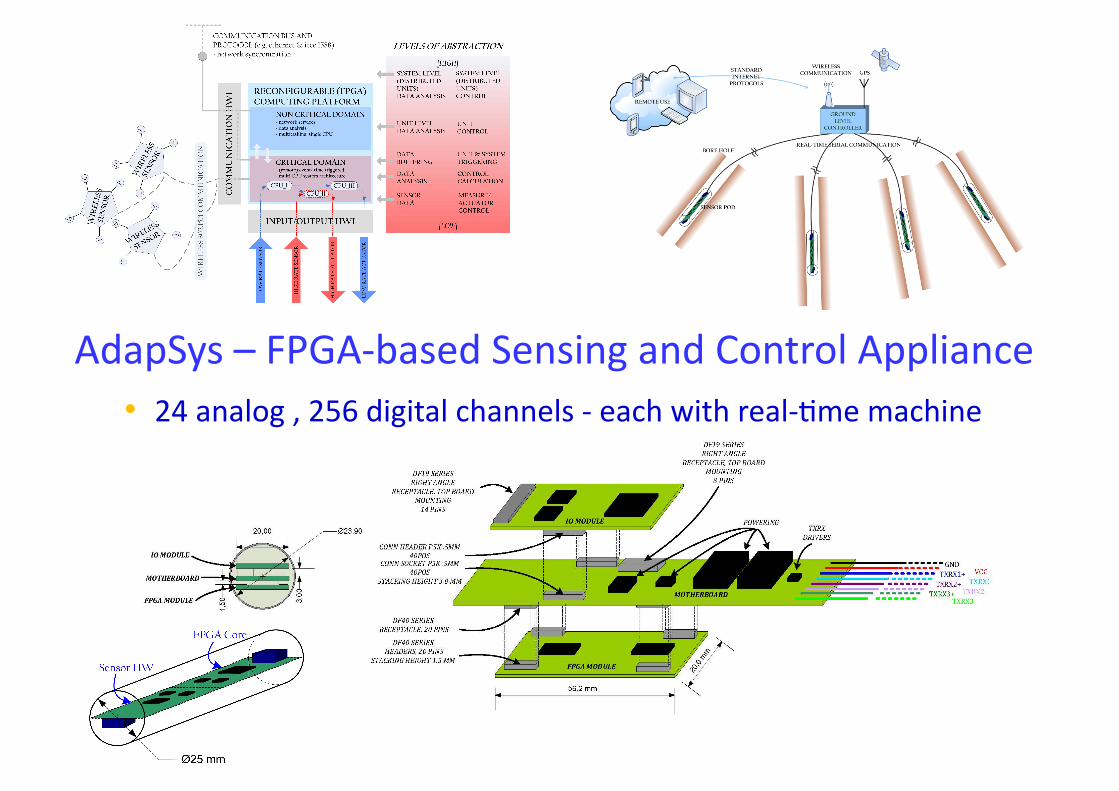
AdapSys – FPGA‐based Sensing and Control Appliance • 24 analog , 256 digital channels ‐ each with real‐Lme machine
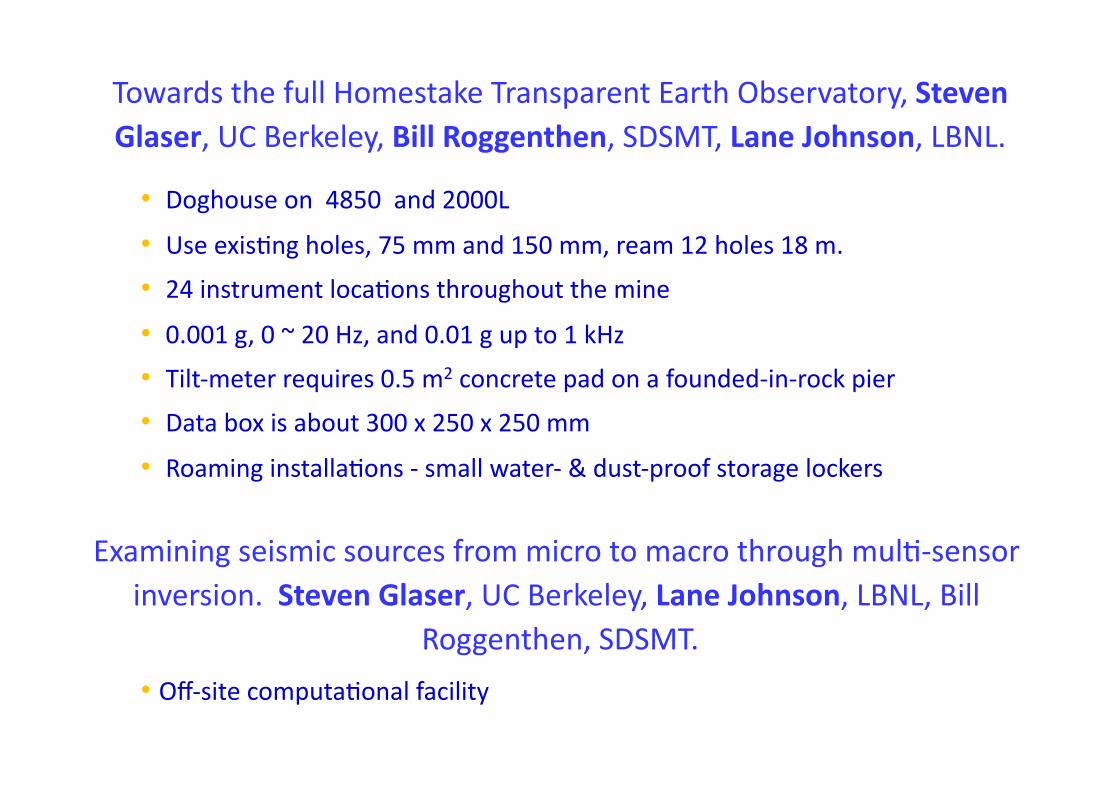
Towards the full Homestake Transparent Earth Observatory, Steven Glaser, UC Berkeley, Bill Roggenthen, SDSMT, Lane Johnson, LBNL.
• Doghouse on 4850 and 2000L • Use exisLng holes, 75 mm and 150 mm, ream 12 holes 18 m.
• 24 instrument locaLons throughout the mine
• 0.001 g, 0 ~ 20 Hz, and 0.01 g up to 1 kHz • Tilt‐meter requires 0.5 m2 concrete pad on a founded‐in‐rock pier
• Data box is about 300 x 250 x 250 mm
• Roaming installaLons ‐ small water‐ & dust‐proof storage lockers
Examining seismic sources from micro to macro through mulL‐sensor inversion. Steven Glaser, UC Berkeley, Lane Johnson, LBNL, Bill
Roggenthen, SDSMT.
• Off‐site computaLonal facility
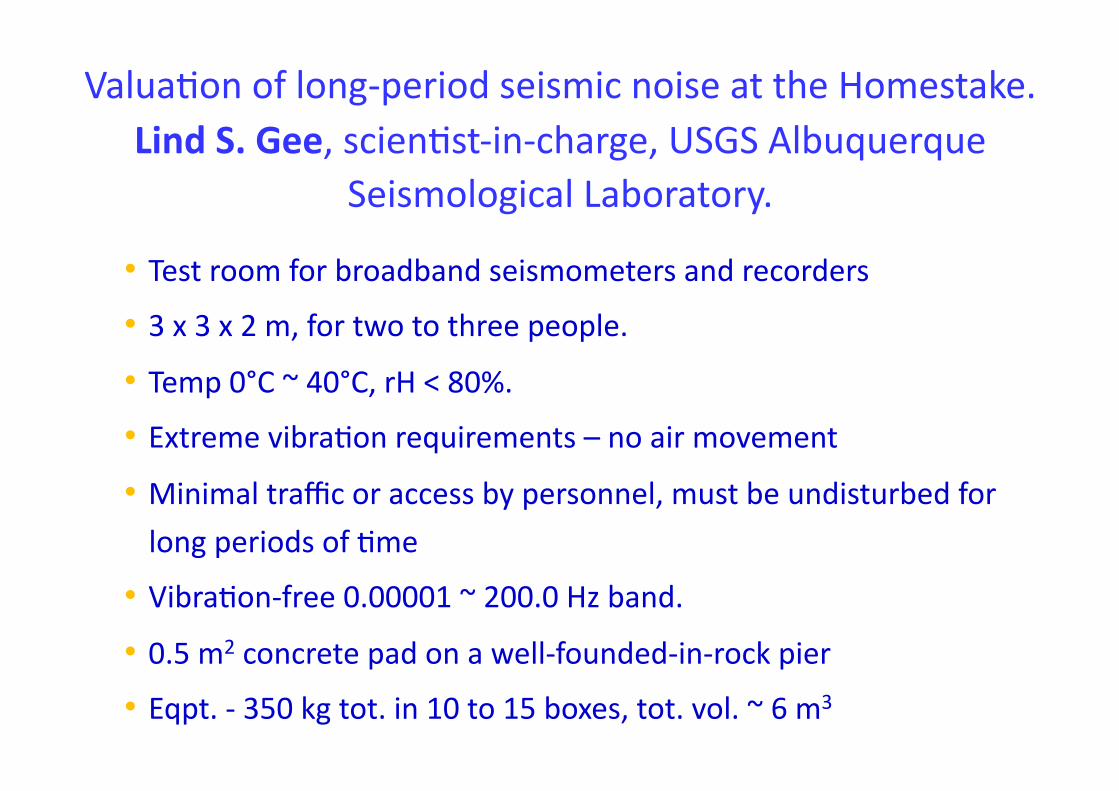
ValuaLon of long‐period seismic noise at the Homestake. Lind S. Gee, scienLst‐in‐charge, USGS Albuquerque
Seismological Laboratory.
• Test room for broadband seismometers and recorders
• 3 x 3 x 2 m, for two to three people.
• Temp 0°C ~ 40°C, rH < 80%.
• Extreme vibraLon requirements – no air movement
• Minimal traffic or access by personnel, must be undisturbed for
long periods of Lme
• VibraLon‐free 0.00001 ~ 200.0 Hz band. • 0.5 m2 concrete pad on a well‐founded‐in‐rock pier
• Eqpt. ‐ 350 kg tot. in 10 to 15 boxes, tot. vol. ~ 6 m3
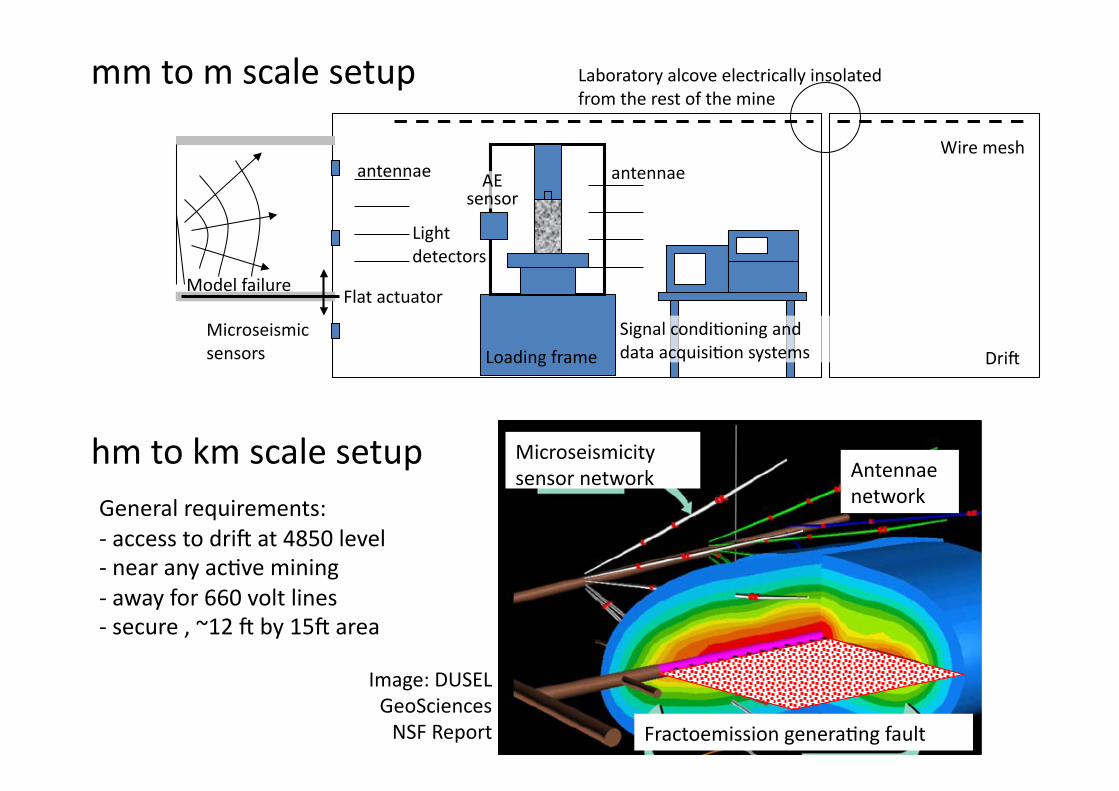
Microseismicity sensor network Antennae
network
Fractoemission generaLng fault
Image: DUSEL GeoSciences NSF Report
Wire mesh
Light detectors
Loading frame
antennae
Laboratory alcove electrically insolated from the rest of the mine
Signal condiLoning and data acquisiLon systems
AE sensor
Driu
antennae
Model failure
Microseismic sensors
Flat actuator
mm to m scale setup
hm to km scale setup General requirements: ‐ access to driu at 4850 level ‐ near any acLve mining ‐ away for 660 volt lines ‐ secure , ~12 u by 15u area
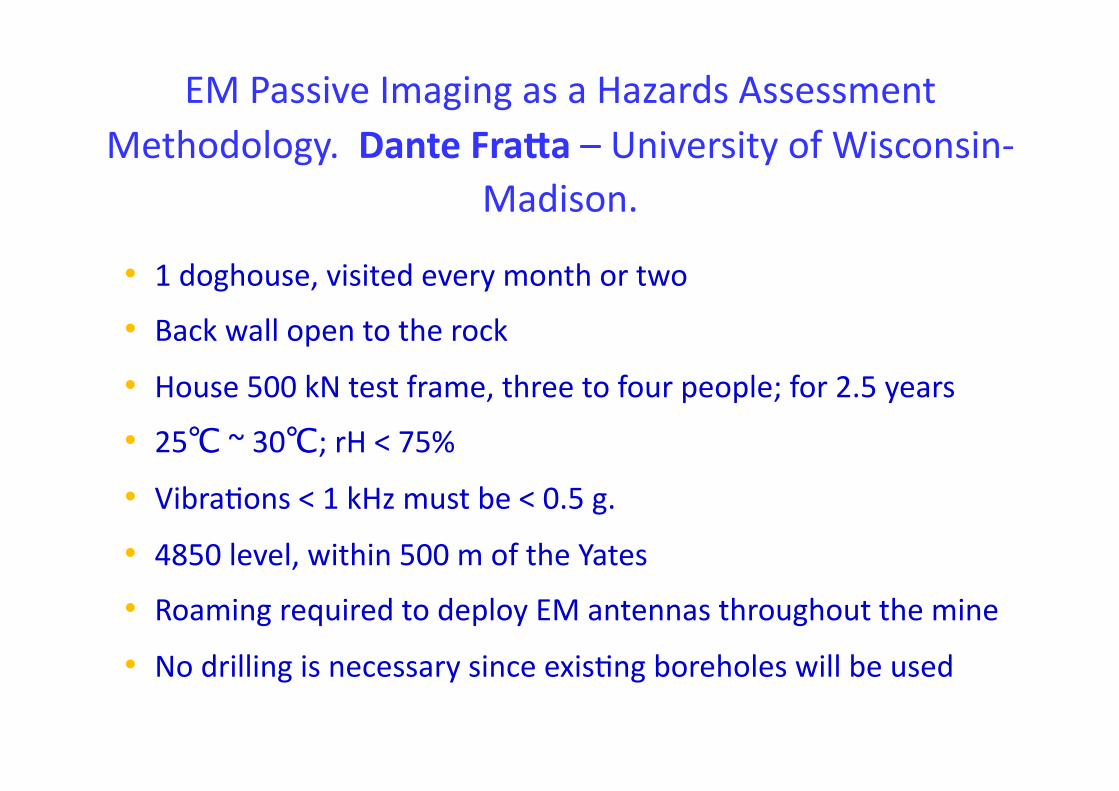
EM Passive Imaging as a Hazards Assessment Methodology. Dante FraZa – University of Wisconsin‐
Madison.
• 1 doghouse, visited every month or two
• Back wall open to the rock • House 500 kN test frame, three to four people; for 2.5 years
• 25℃ ~ 30℃; rH < 75%
• VibraLons < 1 kHz must be < 0.5 g.
• 4850 level, within 500 m of the Yates
• Roaming required to deploy EM antennas throughout the mine
• No drilling is necessary since exisLng boreholes will be used
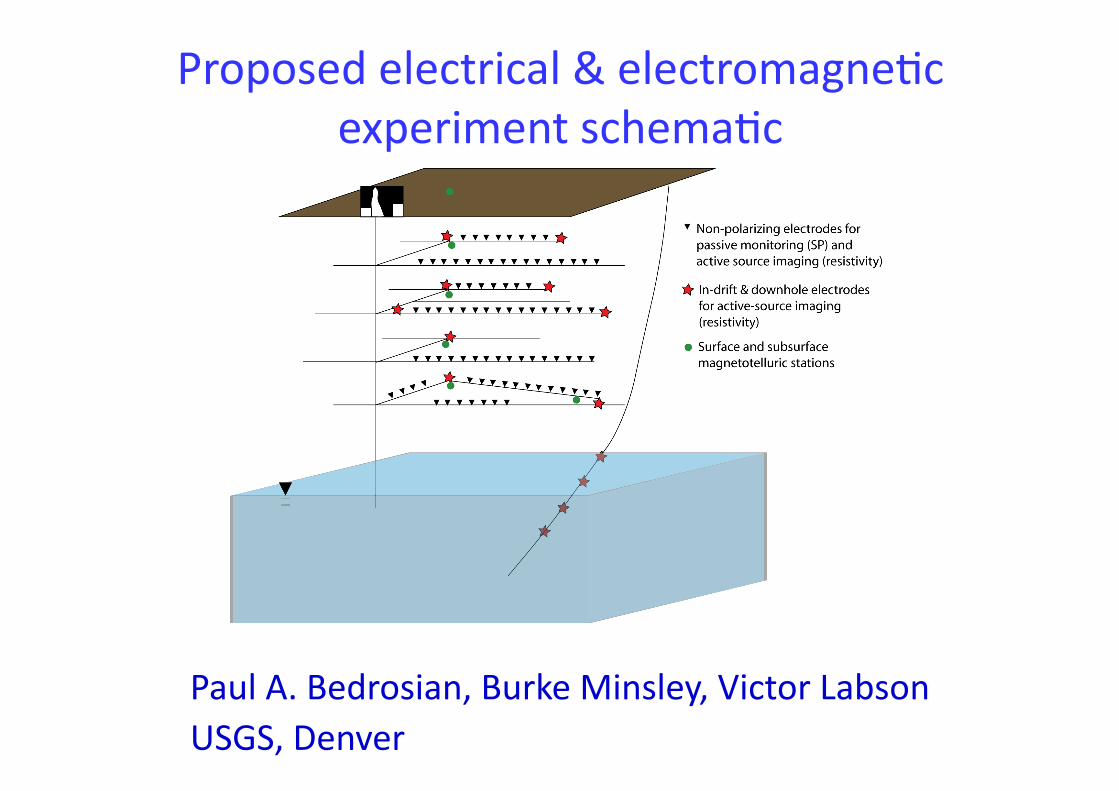
Proposed electrical & electromagneLc experiment schemaLc
Paul A. Bedrosian, Burke Minsley, Victor Labson USGS, Denver
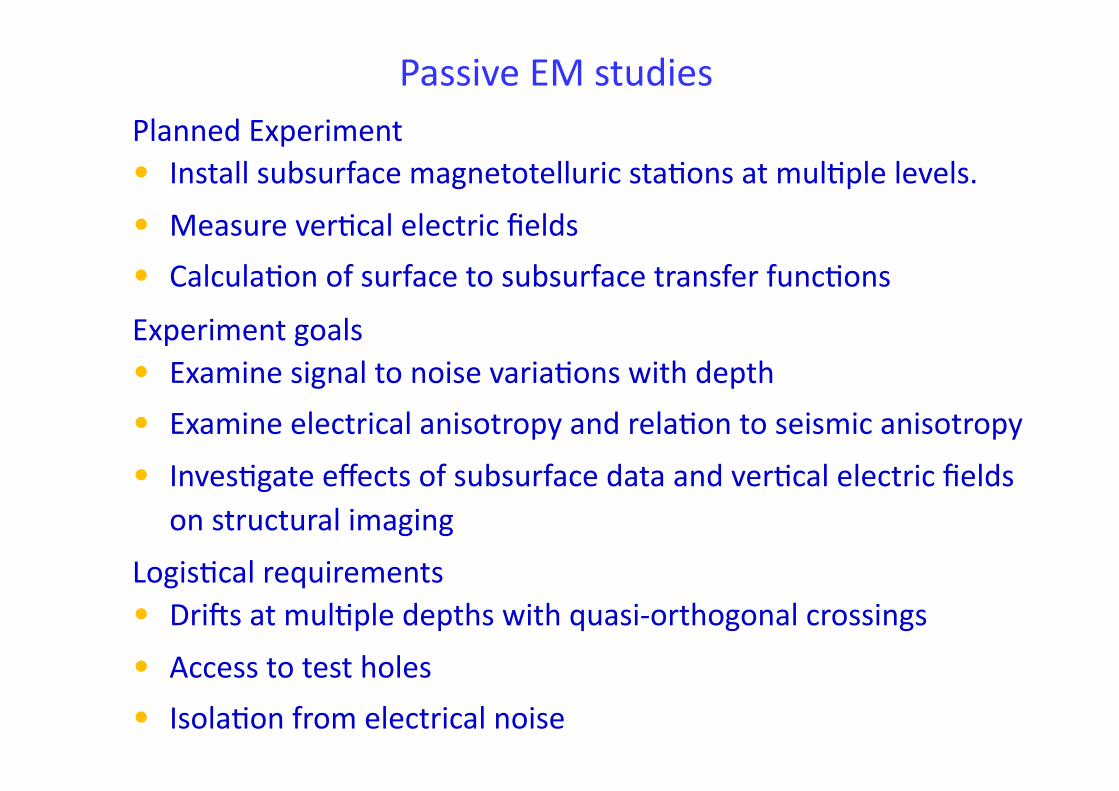
Passive EM studies Planned Experiment • Install subsurface magnetotelluric staLons at mulLple levels.
• Measure verLcal electric fields
• CalculaLon of surface to subsurface transfer funcLons Experiment goals • Examine signal to noise variaLons with depth
• Examine electrical anisotropy and relaLon to seismic anisotropy
• InvesLgate effects of subsurface data and verLcal electric fields on structural imaging
LogisLcal requirements • Drius at mulLple depths with quasi‐orthogonal crossings
• Access to test holes • IsolaLon from electrical noise
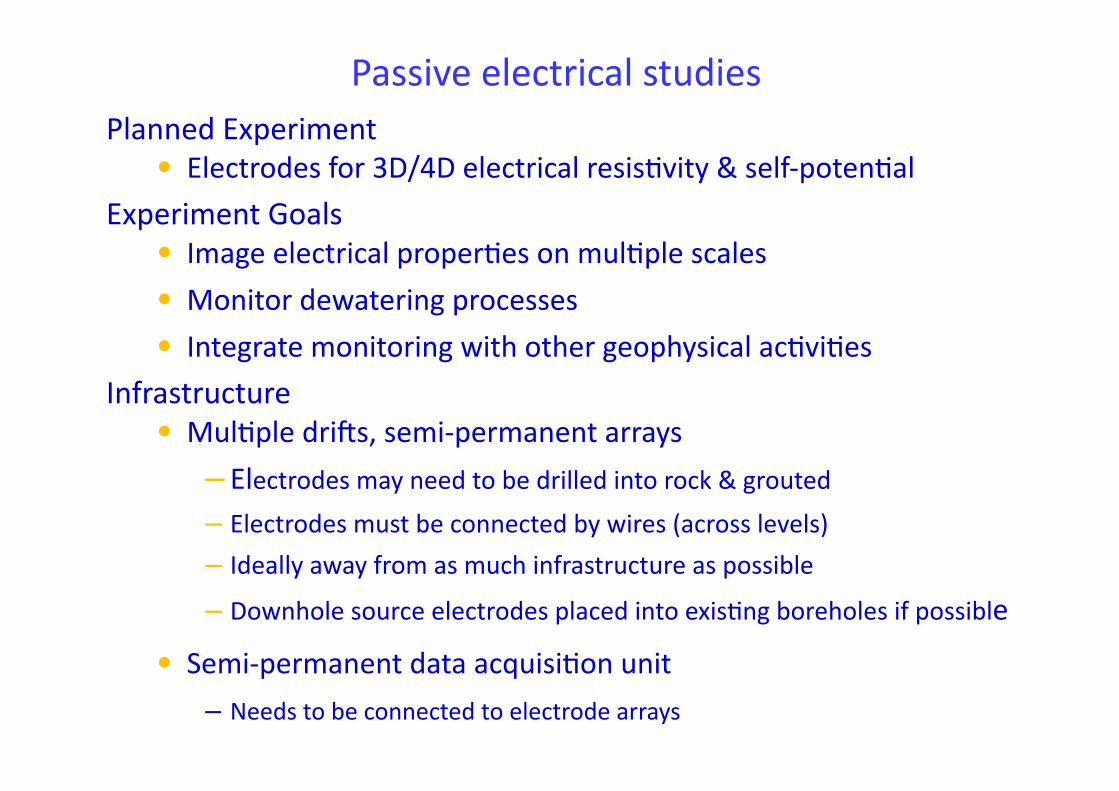
Passive electrical studies Planned Experiment
• Electrodes for 3D/4D electrical resisLvity & self‐potenLal Experiment Goals
• Image electrical properLes on mulLple scales
• Monitor dewatering processes
• Integrate monitoring with other geophysical acLviLes
Infrastructure • MulLple drius, semi‐permanent arrays
– Electrodes may need to be drilled into rock & grouted
– Electrodes must be connected by wires (across levels)
– Ideally away from as much infrastructure as possible
– Downhole source electrodes placed into exisLng boreholes if possible • Semi‐permanent data acquisiLon unit
– Needs to be connected to electrode arrays
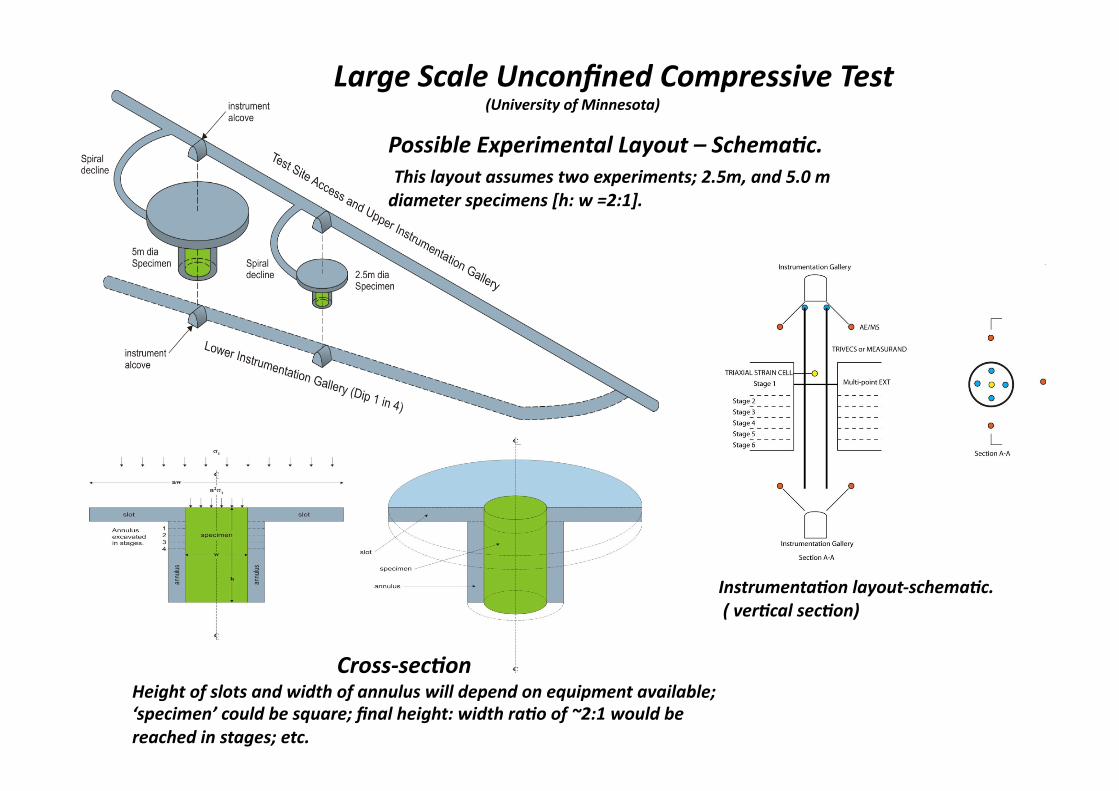
Large Scale Unconfined Compressive Test (University of Minnesota)
Possible Experimental Layout – SchemaCc. This layout assumes two experiments; 2.5m, and 5.0 m diameter specimens [h: w =2:1].
Cross‐secCon Height of slots and width of annulus will depend on equipment available; ‘specimen’ could be square; final height: width raCo of ~2:1 would be reached in stages; etc.
InstrumentaCon layout‐schemaCc. ( verCcal secCon)
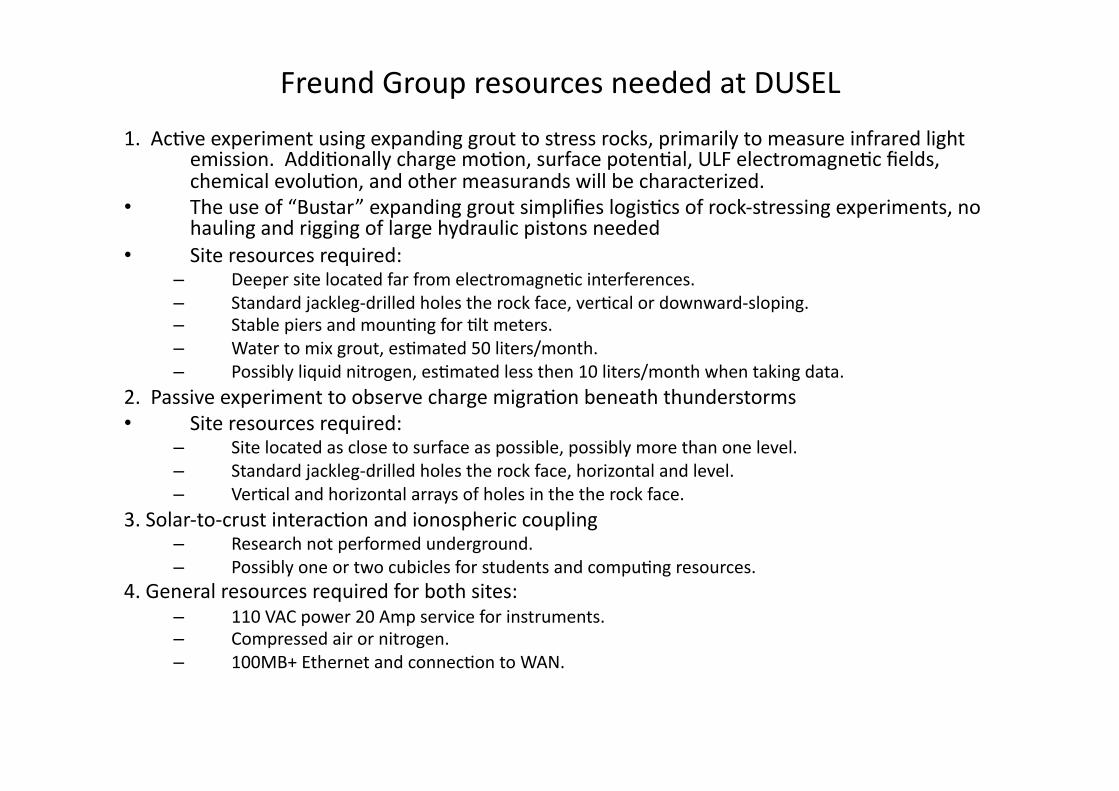
Freund Group resources needed at DUSEL
1. AcLve experiment using expanding grout to stress rocks, primarily to measure infrared light emission. AddiLonally charge moLon, surface potenLal, ULF electromagneLc fields, chemical evoluLon, and other measurands will be characterized.
• The use of “Bustar” expanding grout simplifies logisLcs of rock‐stressing experiments, no hauling and rigging of large hydraulic pistons needed
• Site resources required: – Deeper site located far from electromagneLc interferences. – Standard jackleg‐drilled holes the rock face, verLcal or downward‐sloping. – Stable piers and mounLng for Llt meters. – Water to mix grout, esLmated 50 liters/month. – Possibly liquid nitrogen, esLmated less then 10 liters/month when taking data.
2. Passive experiment to observe charge migraLon beneath thunderstorms • Site resources required:
– Site located as close to surface as possible, possibly more than one level. – Standard jackleg‐drilled holes the rock face, horizontal and level. – VerLcal and horizontal arrays of holes in the the rock face.
3. Solar‐to‐crust interacLon and ionospheric coupling – Research not performed underground. – Possibly one or two cubicles for students and compuLng resources.
4. General resources required for both sites: – 110 VAC power 20 Amp service for instruments. – Compressed air or nitrogen. – 100MB+ Ethernet and connecLon to WAN.

Catherine Peters – CO2 SequestraLon
Larry Murdoch ‐ Ground water flow system at DUSEL
Larry Stetler ‐ Hydrological and Ground MoLon Studies
Herb Wang ‐ Fiber‐OpLc Strain and Temperature Monitoring
S‐4 Earth Science Teams and Partners
Future AcLve
Partners
Current AcLve
Partners
Eric Sonnenthal ‐ THMCB Experiment
Leonid Germanovich – Induced Fracture Laboratory
Steven Glaser – Transparent Earth
ALL experiments are partners of the Homestake Transparent
Earth Observatory
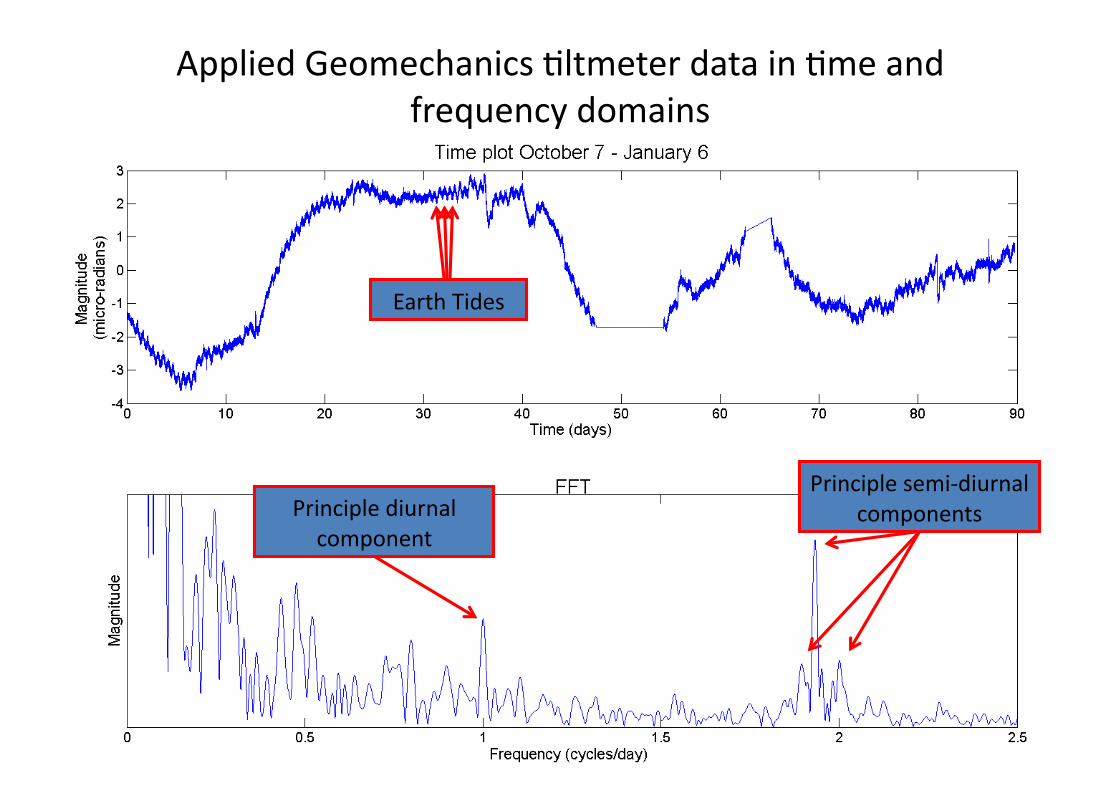
Principle semi‐diurnal components Principle diurnal
component
Applied Geomechanics Lltmeter data in Lme and frequency domains
Earth Tides


![Lawrence Berkeley National Laboratory Title: Author: Bhat ...3H]Azidodantrolene photoaffinity... · Lawrence Berkeley National Laboratory Title: [3H]Azidodantrolene photoaffinity](https://img.pdfslide.us/doc/110x75/5e1fd0c77fb4f741772956eb/lawrence-berkeley-national-laboratory-title-author-bhat-3hazidodantrolene.jpg)