Embed Size (px)
Citation preview

TRANSNET PRESENTATION TO PORTFOLIO COMMITTEE OF PUBLIC
ENTERPRISES
BRIEFING BY STATE OWNED ENTERPRISES ON
BUDGETS AND STRATEGIC PLANS 2009/10 Mr Chris Wells
Acting Group Chief Executive
17 June 2009
Mr Chris Wells
Acting Group Chief Executive
17 June 2009
CONTENT OF THE PRESENTATION
• Introduction
• Overview – Achievements
• Changes in Economic Environment
• Transnet Strategy
• Regulatory Environment
• 2009/10 Corporate Plan
• Risks and Mitigating Plans
• Conclusion - Strategic Priorities 2009/10
• Introduction
• Overview – Achievements
• Changes in Economic Environment
• Transnet Strategy
• Regulatory Environment
• 2009/10 Corporate Plan
• Risks and Mitigating Plans
• Conclusion - Strategic Priorities 2009/10
2
INTRODUCTION
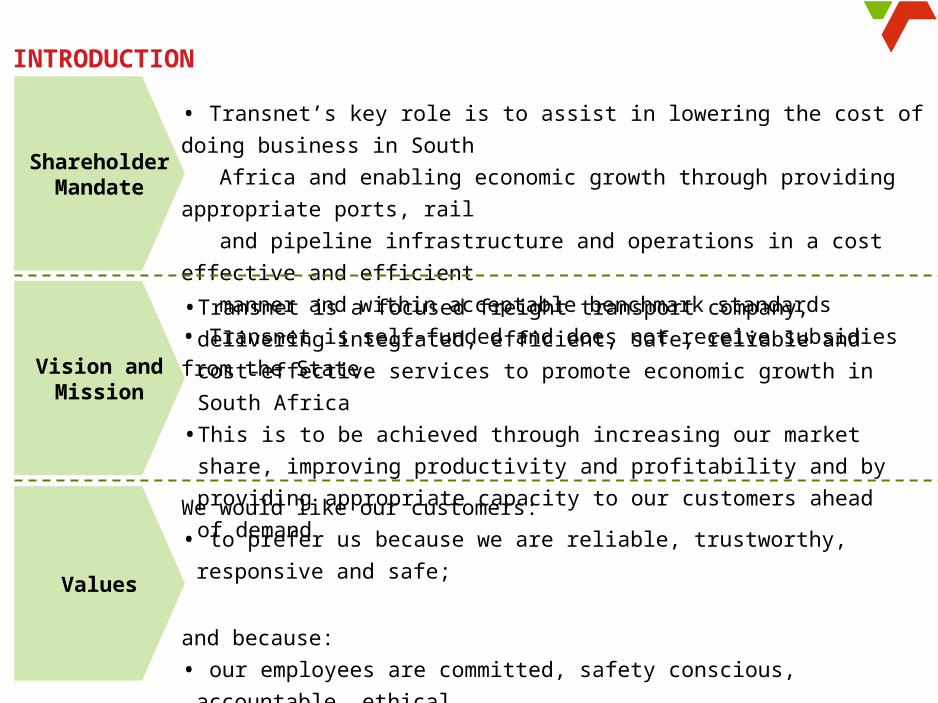
• Transnet is a focused freight transport company, delivering integrated,
efficient, safe, reliable and cost-effective services to promote economic
growth in South Africa
• This is to be achieved through increasing our market share, improving
productivity and profitability and by providing appropriate capacity to our
customers ahead of demand
Vision and Mission
Shareholder Mandate
• Transnet’s key role is to assist in lowering the cost of doing business
in South
Africa and enabling economic growth through providing appropriate
ports, rail
and pipeline infrastructure and operations in a cost effective and
efficient
manner and within acceptable benchmark standards
• Transnet is self-funded and does not receive subsidies from the
State.
Values
We would like our customers:
• to prefer us because we are reliable, trustworthy, responsive and
safe;
and because:
• our employees are committed, safety conscious, accountable,
ethical,
disciplined and results orientated
3

TRANSNET STRUCTURE
*• Luxrail• arivia.kom
4
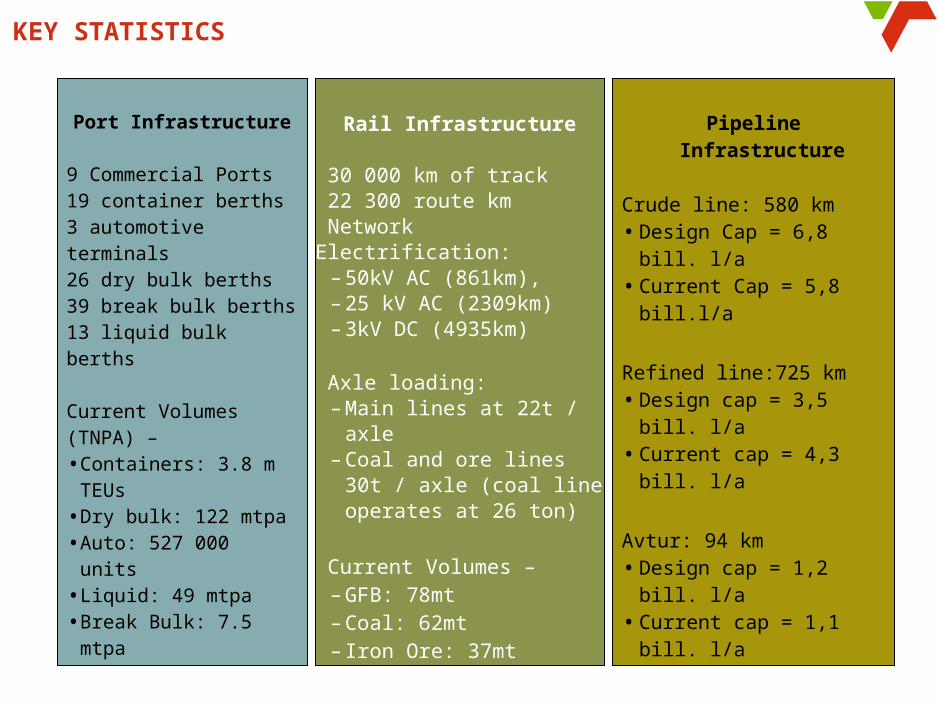
Rail Infrastructure
30 000 km of track 22 300 route km Network Electrification:
– 50kV AC (861km), – 25 kV AC (2309km) – 3kV DC (4935km)
Axle loading:– Main lines at 22t / axle– Coal and ore lines 30t /
axle (coal line operates at 26 ton)
Current Volumes – – GFB: 78mt– Coal: 62mt– Iron Ore: 37mt
Port Infrastructure
9 Commercial Ports19 container berths3 automotive terminals26 dry bulk berths39 break bulk berths13 liquid bulk berths
Current Volumes (TNPA) – • Containers: 3.8 m
TEUs• Dry bulk: 122 mtpa• Auto: 527 000 units• Liquid: 49 mtpa• Break Bulk: 7.5 mtpa
Pipeline Infrastructure
Crude line: 580 km• Design Cap = 6,8 bill. l/a• Current Cap = 5,8 bill.l/a
Refined line:725 km• Design cap = 3,5 bill. l/a• Current cap = 4,3 bill. l/a
Avtur: 94 km• Design cap = 1,2 bill. l/a• Current cap = 1,1 bill. l/a
KEY STATISTICS
CONTENT OF THE PRESENTATION
• Introduction
• Overview – Achievements
• Changes in Economic Environment
• Transnet Strategy
• Regulatory Environment
• 2009/10 Corporate Plan
• Risks and Mitigating Plans
• Conclusion - Strategic Priorities
2009/10
• Introduction
• Overview – Achievements
• Changes in Economic Environment
• Transnet Strategy
• Regulatory Environment
• 2009/10 Corporate Plan
• Risks and Mitigating Plans
• Conclusion - Strategic Priorities
2009/10
6

RevenueRevenue
• Continuous increase in revenue showing results of
initiatives to grow the business, with revenue
increasing from R25.3bn in 2004/05 to R30.1bn in
2007/08 (19.0% increase) – 2008/09 in process of
being finalised
EBITDAEBITDA
• Improvements through:
Operational efficiency improvements, effective cost cutting initiatives mainly due to reengineering projects
Sale of discontinuing non-core businesses
• Improvement from R7.3bn in 2004/05 to R12.8bn in 2007/08 (75.3% improvement)
R billionR billion
Gearing (%)Gearing (%)
•Balance sheet restructuring and cost effective debt structures yielding positive results with consistent below target gearing from 61% in 2004/05 to 30% in 2007/08 (50.8% improvement)
•This enables Transnet to fund capital investments more cost effectively and without government guarantees
TRANSNET HAS EFFECTED A SUCCESSFUL FINANCIAL TURNAROUND OVER THE PAST FIVE YEARS
33.630.1
26.926.025.3
+7%
08/09
07/08
06/07
05/06
04/05
12.012.811.110.37.3
07/08
06/07
05/06
04/05
+13%
08/09
-11%
08/09
39%
07/08
30%
06/07
39%
05/06
46%
04/05
61%
CAGR
Budge
tB
udge
tB
ud
get
50%Max
7

Rail
Ports
Pipe-
lines
Key Performance Indicators
Moves per Crane Hour(No. of moves)
SIGNIFICANT IMPROVEMENT IN OPERATIONAL EFFICIENCIES
Containers per Berth (No.)
Weighted Loco Availability
(GFB, Coal and Ore - %)
* Net ton kilometer excluding the weight of the wagon
Net Ton Kilometre per Loco(GFB ‘000)
27
23
08/0904/05
+15% 88%
08/0904/05
82%
+7%
Net Ton Kilometre per Wagon
(GFB ‘000)637
620
04/05 08/09
+3%Improvement in asset utilization releasing the pressure on rolling stock requirements.
1817
18
2221
23
CTCTDCT PE
189,989
08/0904/05
150,261
+26%Sweating the Port assets to create additional capacity and alleviate pressure on investment
Capacity Utilisation(%)
88.5% 83.0%71.7%
87.1%76.5%
104.2%
AvturCrudeRefined
Production Interruptions (Internal & External - Hours)
06/07
965
755
08/09
-22%
Operational improvements and introduction of Drag Reducing Agents allow TPL to exceed design capacities for Refined products
04/05 08/09 04/05 08/09 04/05 08/09
04/05 08/09 04/05 08/09 04/05 08/09

CONTENT OF THE PRESENTATION
• Introduction
• Overview – Achievements
• Changes in Economic Environment
• Transnet Strategy
• Regulatory Environment
• 2009/10 Corporate Plan
• Risks and Mitigating Plans
• Conclusion - Strategic Priorities
2009/10
• Introduction
• Overview – Achievements
• Changes in Economic Environment
• Transnet Strategy
• Regulatory Environment
• 2009/10 Corporate Plan
• Risks and Mitigating Plans
• Conclusion - Strategic Priorities
2009/10
9
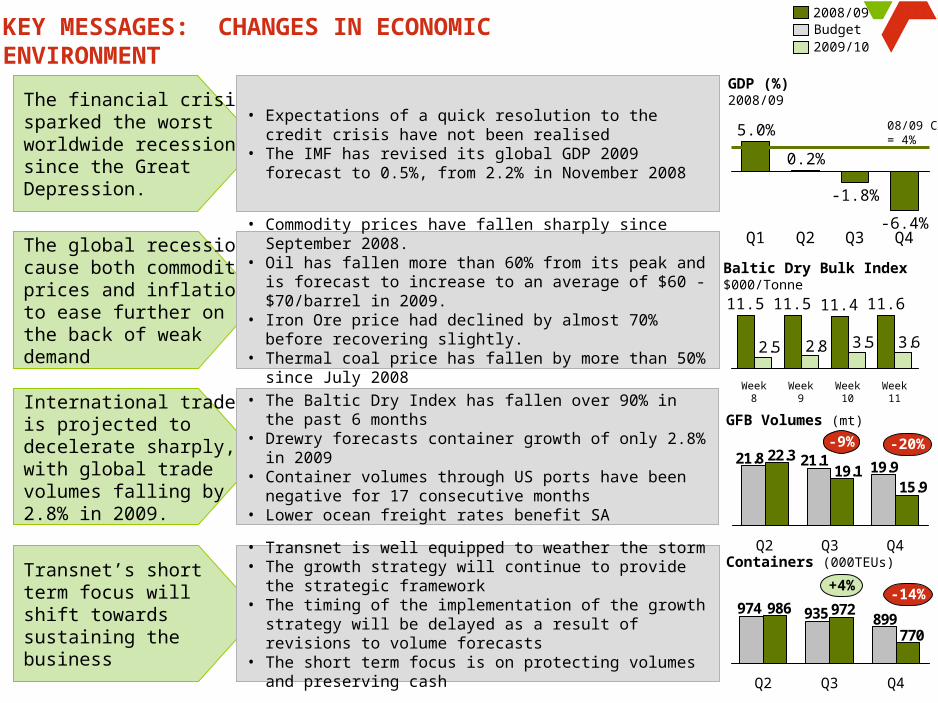
KEY MESSAGES: CHANGES IN ECONOMIC ENVIRONMENT
The global recession cause both commodity prices and inflation to ease further on the back of weak demand
International trade is projected to decelerate sharply, with global trade volumes falling by 2.8% in 2009.
• Commodity prices have fallen sharply since September 2008.
• Oil has fallen more than 60% from its peak and is forecast to increase to an average of $60 -$70/barrel in 2009.
• Iron Ore price had declined by almost 70% before recovering slightly.
• Thermal coal price has fallen by more than 50% since July 2008
• The Baltic Dry Index has fallen over 90% in the past 6 months
• Drewry forecasts container growth of only 2.8% in 2009
• Container volumes through US ports have been negative for 17 consecutive months
• Lower ocean freight rates benefit SA
The financial crisis sparked the worst worldwide recession since the Great Depression.
• Expectations of a quick resolution to the credit crisis have not been realised
• The IMF has revised its global GDP 2009 forecast to 0.5%, from 2.2% in November 2008
Transnet’s short term focus will shift towards sustaining the business
• Transnet is well equipped to weather the storm• The growth strategy will continue to provide the
strategic framework• The timing of the implementation of the growth
strategy will be delayed as a result of revisions to volume forecasts
• The short term focus is on protecting volumes and preserving cash
10
-6.4%
-1.8%
0.2%
5.0%
GDP (%) 2008/09
08/09 CP = 4%
Baltic Dry Bulk Index $000/Tonne
3.63.52.82.5
Week 9
11.5
Week 8
11.5
Week 11
11.6
Week 10
11.4
GFB Volumes (mt)
Containers (000TEUs)
Q4Q3Q2Q1
19.921.121.8
15.919.1
22.3
Q3Q2 Q4
-9% -20%
899935974
770
972986
Q4Q3Q2
+4%-14%
2008/09Budget2009/10

CONTENT OF THE PRESENTATION
• Introduction
• Overview – Achievements
• Changes in Economic Environment
• Transnet Strategy
• Regulatory Environment
• 2009/10 Corporate Plan
• Risks and Mitigating Plans
• Conclusion - Strategic Priorities
2009/10
• Introduction
• Overview – Achievements
• Changes in Economic Environment
• Transnet Strategy
• Regulatory Environment
• 2009/10 Corporate Plan
• Risks and Mitigating Plans
• Conclusion - Strategic Priorities
2009/10
11

GROWTH STRATEGY: THE NEXT HORIZON OF THE TRANSFORMATION PROCESS
Individual programme focus:
• Getting the basics right
• Stabilising operations
Interactions:
• Leveraging benefits of an intermodal business
• Effective commercial management of the network business
• Operational and functional teams jointly optimise their interaction areas
Integration:
• Accelerated rollout of operational improvements
• Integrated business model
– End-to-end corridor view
– Integrated customer view
• Achieve world class performance
Stabilise
Optimise
Grow
2010
Three turnaround horizons
2005Four-point turnaround strategy Four-point growth strategy
1
4 3
2Reengi-neering – integration, productivity and efficiency
Capital optimisa-tion and financial manage-ment
Safety, risk and effective governance
Human capital execution
Growth through :Corporate governance and risk
Redirect and re-engineer
Balance sheet restructuring
Human capital development
2007/2008
Transformation horizon
Positioning the Company for growth in the future12

• Focusing on 5 key corridors, providing end-to-end logistics services to customers
• Focus on key commodities
• Productivity and efficiency improvements
Client orientated planning and execution through integrated commercial management
• Financial strength and sustainability
• Enterprise wide performance management linked to benchmarked operating KPIs
• Risk and safety management
• Transnet culture charter
Governance and performance management
• Replacement and expansion of existing infrastructure to support growth
• Integrated investments of R80bn across rail, ports and pipelines
• Maintenance of core asset base
• Disposal of non-core properties (e.g. hostels/houses)
Investment plans
Re-engineering, integration, productivity and efficiency
Capital optimisation and financial management
Safety, risk and effective governance
Human capital execution
Growth through
TRANSNET’S GROWTH STRATEGY
13

GOVERNANCE – MEDIA REPORTS
14
• Article attempted to conflate two different issues both apparently the subject of leaks from employees with their own agendas
• Succession • Totally incorrect and without foundation• Capital Projects Report has neither served at Board or provoked discussion at
prior Board meetings therefore has of course no bearing on succession discussion
• Acting CEO, Chris Wells informed Board in January 2009 that he was not available to be appointed as CEO. This also is in Public Domain.
• Board united on process.
• Capital Project Internal Audit Report• Alleged evidence of financial mismanagement• Transnet Internal Audit outsourced to Ernst & young• Strong control environment in line with best international practice• Audit report in question was the result of a normal audit and evidence of
proactive and very thorough governance processes• Senior Ernst & Young partner responsible issued press release saying that
issues are “not material” and are part of normal process. • Normal forensics in place to find source of leaks as this was a breach of
Transnet’s ethics and employment contract and sought to bring harm to Transnet
• Other• Transnet has an independent tip-offs line for any anonymous reports of
alleged corruption or malpractice.

Benefits of corridor approach
• Transnet as a network business needs to operate in an integrated manner throughout the logistics corridor
• Provide a common transformation and long-term planning backbone
• Maximise growth opportunities across all operating divisions (rail, port, pipeline)
• Capture operational and functional synergies across operating divisions through integrated solutions
• Improve efficiency and effectiveness of logistics supply chain
• Providing an end-to-end logistics service to customers
• Provide optimal capital base for network infrastructure evolution
• Focus on key commodities and aligning capital investment to high-growth potential corridors
Functions
NOC
Projects
Maintenance
Yards
Procurement
Network
Touwsrivier
Mid Ilovo
Plaston
Kelso
Eshowe
Utrecht
Hawerklip
Naboomspruit
Middelwit
Vierfontein
Sishen
Saldanha
Cape Town
East London
Port Elizabeth
Mosselbaai
Bredasdorp
ProtemStrandSimonstad
StellenboschFranschhoek
Bitterfontein
Porterville
Atlantis
Prins Alfred Hamlet
Riversdale
Knysna
Calitzdorp
George
Ladysmith
AvontuurPatensie
Klipplaat
Oudtshoorn
Rosmead
Kirkwood
AlexandriaPort Alfred
CookhouseSomerset East
Noupoort
De Aar
Prieska
Upington
Kakamas
Naroegas
Worcester
Sakrivier
CalviniaHutchinson
Kootjieskolk
Beaufort West
Belmont
Douglas
Hotazel
Warrenton
Pudimoe Makwassie
Mafikeng
Ottosdal
Vermaas
Schweizer-RenekeKlerksdorp
Orkney
Coligny
Bultfontein
Whites
Westleigh
Bloemfontein
Aliwal North
Sannaspos
Dreunberg
Springfontein
Koffiefontein
HofmeyerSchoombee
JamestownBarkley East
Maclear
Tarkastad QamataQueenstown
Blaney
Bethulie
Seymour
Umtata
FortBeaufort
Amabele
Maseru
Marquard
Ladybrand
Bethlehem
Wolwehoek
Lichtenburg
Warden
Harrismith
Bergville
Kokstad
Matatiele
HardingPort Shepstone
Durban
Kranskop
RichmondUnderberg
Stanger
NkwaliniRichards Bay
VryheidHlobane
Moorleigh
Ladysmith
Roossenekal
SteelpoortGraskop
MachadodorpBelfast
Lothair
Komatipoort
Baberton
Phalaborwa
Messina
Louis Trichardt
Soekmekaar
ZebedielaVaalwater
Nylstroom
J’burg
Pretoria
O/fontein
Ellisras
Northam
CharlestownVrede
Potchestroom
Empangeni
Donnybrook
Greytown
Franklin
Kimberley
Marble Hall
Standerton
BethalB/plaas
Simuma
Mandonela
Winburg
Theunisen
ChroomvalleiDrummondlea
VirginiaGlen H
HiltonCopperton
Cullinan
Rayton
Uitenhage
Klawer
Thabazimbi
Pietersburg
Beit Bridge
Howick
Nakop
Postmasburg
ErtsManganore
Palingpan
Rustenburg
Hoedspruit
Glencoe
Newcastle
Arlington
Witbank
Ogies
Breyten
Krugersdorp
WelverdiendSentrarand
Welgedag
Kroonstad
Golela
Ancona
Sentrarand
DCT
PortNewcastle
Durban
Yard
Depot
Danskraal
Kaserne
Corridors
Ex
am
ple
STRATEGY IMPLEMENTATION THROUGH CORRIDOR APPROACH
15

Growth Strategy
Key Focus Areas
Financial Value Creation
KEY OPERATIONAL AND FINANCIAL STRATEGIC INITIATIVES
Revenue optimisation-
Deliver on committed volumes for export coal and
iron ore Domestic coal Containers on rail
Targeted cost reduction including introducing shared
services & procurement
review
Improve key productivities and
operational efficiencies
Implement funding plan at cost effective
rates
Optimise Capex on value creating
growth and sustainability
R80,5 billion Capex spend over five years on key
corridors
Target coal (74mt) and iron ore (60mt)
volumes by 2013/14
Maintain operating cost increases below revenue
increases over the 5 year plan
Drive KPI’s to benchmark levels
Proactive cash management
Gearing to remain <47% and cash interest cover >3 times over
5 year plan
Growth throughReengineering integration, productivity and efficiency
Reengineering integration, productivity and efficiency
Capital optimi-sation and financial management
Capital optimi-sation and financial management
Safety, risk and effective governance
Safety, risk and effective governance
Human capital executionHuman capital execution
16
CONTENT OF THE PRESENTATION
• Introduction
• Overview – Achievements
• Changes in Economic Environment
• Transnet Strategy
• Regulatory Environment
• 2009/10 Corporate Plan
• Risks and Mitigating Plans
• Conclusion - Strategic Priorities
2009/10
• Introduction
• Overview – Achievements
• Changes in Economic Environment
• Transnet Strategy
• Regulatory Environment
• 2009/10 Corporate Plan
• Risks and Mitigating Plans
• Conclusion - Strategic Priorities
2009/10
17

REGULATORY ENVIRONMENT
The following Acts impact on the operations of the business
• National Port Act (2005) – Transnet National Ports Authority responsible for
ensuring safety efficient and effective functioning of the ports. Setting of
tariffs.
Ports regulatory body appointed
• Petroleum Pipelines Act (2003) – to licence petroleum pipelines and storage
facilities and to set tariffs
Nersa as regulated body
Port directives/regulations not finalised as yet which makes it difficult to manage
and plan future revenues
Pipeline regulations /directives issued but principles inconsistently applied
between years
• Significant uncertainty on future revenues do not allow for alternative funding
options
• No policy on funding for capital work in progress
Regulation in its current form and application is not conducive for investment
in major infrastructure projects.

CONTENT OF THE PRESENTATION
• Introduction
• Overview – Achievements
• Changes in Economic Environment
• Transnet Strategy
• Regulatory Environment
• 2009/10 Corporate Plan
• Risks and Mitigating Plans
• Conclusion - Strategic Priorities
2009/10
• Introduction
• Overview – Achievements
• Changes in Economic Environment
• Transnet Strategy
• Regulatory Environment
• 2009/10 Corporate Plan
• Risks and Mitigating Plans
• Conclusion - Strategic Priorities
2009/10
19

SALIENT FEATURES: TRANSNET CORPORATE PLAN 2009/10(as submitted to Shareholder)
Economic recession put Transnet volumes under pressure (-4.7%
average growth against 2008/09) and lower volumes specifically in:
General Freight
Containers
Export volumes (excluding iron ore and coal)
Revenue growth 8.8% y-o-y
Cost containment to keep cost increases to 8.4%, notwithstanding
sharp increases in input costs such as electricity, fuel and other input
costs.
Profitability (EBITDA) of the Group increases by 9.6% y-o-y
The 5 year capital investment program remains on a R80bn level and
approximately R21bn to be invested in 2009/10
Cash from operations will remain a healthy R10.6bn in 2009/10
Gearing and cash interest cover remain within set limits over the 5
years
20

KEY COMMODITY VOLUMES AND TARIFF INCREASES: 5 YEAR PLAN
Containers(000 TEUs)
ExportIron Ore
(mtpa)
ExportCoal
(mtpa)
GFB(mtpa)
11/12
4,059
10/11
3,666
09/10
3,315
08/09
3,710
47.644.443.0
36.8
11/12
10/11
09/10
08/09
72.071.069.061.9
08/09
11/12
10/11
09/10
76.271.6
68.0
78.4
11/12
10/11
09/10
08/09
Commodity Volumes Average Tariff increases
09/10-13/14
5.9%
09/10-13/14
7.4%
09/10-13/14
9.7%
Avera
ge
09/10-13/14
6.3%
• Average tariff increase impacted by underlying product mix (Containers & GFB)
• Including negotiated contract tariffs (export coal and iron ore) to:
• Increase infrastructure capacity to meet customer demand, and
• Service requirements of clients
• Average tariff increase impacted by underlying product mix (Containers & GFB)
• Including negotiated contract tariffs (export coal and iron ore) to:
• Increase infrastructure capacity to meet customer demand, and
• Service requirements of clients
All numbers reflected as per Corporate Plan
21
Avera
ge
Avera
ge
Avera
ge

INCOME STATEMENT – CORPORATE PLAN 2009/10
Critical to maintain profitability to be able
to fund major component of capex
plans through internal funding sources
All numbers as per Corporate Plan
22
33 615
(21 569)
12 046
(5 329)
6 717
Budget
2 682
(2 477)
205
(921)
(716)
8.0
(11.5)
1.7
(17.3)
(10.7)
13/14
20,8
12/13
19,7
11/12
17,1
10/11
15,0
09/10
16,5
Operating Profit Margin (%)

EXTERNAL REVENUE CONTRIBUTION BY DIVISION – 5 YEAR VIEW
18%
TPT 14%
TPL
6%TRE
8%
TNPA
TFR53%
1%
Specialist Units
All numbers as per Corporate Plan
23
Budget
33.6

OPERATING COST CONTRIBUTION – 5 YEAR VIEW
• Labour cost increase over 5 year period on average 6% (reduction in numbers 3%)• Electricity cost increases by 158% from 2008/09 to 2013/14
8%
30%
Electricity6%
Fuel
Personnel56%
Materials &
Other
All numbers as per Corporate Plan
24
Budget
21.6

BALANCE SHEET
50
13/14
39,3
12/13
44,6
11/12
46,8
10/11
46,4
09/10
43,1
Gearing (%)Must maintain headroom to be
able to withstand unforeseen economic
circumstances
All numbers as per Corporate Plan
25
Budget
109 421
8 454
54 216
12 661
41 555
41 98813 217
109 421
100 967

CASH FLOW : CORPORATE PLAN 2009/10
Estimate Budget2008/09 2009/10 2010/11 2011/12 2012/13 2013/14R million R million R million R million R million R million
Cash flow from operating activities 7 747 10 557 11 577 13 156 14 440 16 840
Cash flow from investing activities (19 451) (23 438) (21 137) (18 765) (14 140) (10 151)
Capital expenditure (19 373) (21 913) (19 442) (16 337) (13 330) (9 480)Capitalised borrowing costs ( 682) (1 849) (1 854) (2 213) ( 663) ( 488)Other investing activities 604 324 158 ( 215) ( 147) ( 183)
Net cash surplus / (shortfall) (11 704) *(12 880) (9 560) (5 609) 300 6 689
Projections
* Excluding the redemption of current loans
Cash Interest Cover (times)
11/12
12/13
4,4
13/14
3,63,5
3,1
10/11
3,3
09/10
3,6
Critical ratio for investors to
ensure sufficient cash to service and repay loans
All numbers as per Corporate Plan
26

SALIENT FEATURES OF FIVE YEAR CAPITAL INVESTMENT PLAN
The 5 year capital investment plan approved in the 2008/09 Corporate Plan amounts
to R80.5bn
Latest approved 5-Year Investment Plan amounts to R80.5bn.
• Projects in plan have been reviewed and re-prioritised as well as rescheduling of
cash flows over 5 years to
- Remain within the financial parameters
- Ensuring that revised customer demands are still met
- Capacity is created on time to meet future volume demands
Of the planned Capital Investment of R80.5bn spending will be as follows:
• 32% in rolling stock (R25.8bn)
• 59% in Infrastructure related projects (R47.5bn)
• 9% in Acquisition of machinery & equipment and floating craft (R7.2bn)
The capital expenditure over the next three years of R57.7bn will be funded by
borrowings of R28.4bn and cash from operations of R29.3bn.
27

TRANSNET 5 YEAR CAPITAL HISTORICAL SPEND AND INVESTMENT PLAN
11.7
15.8
19.4
21.9
19.4
16.3
13.3
9.5
46.9
80.5
2006/07 5 yr plan2009/10 2010/11Cumulative 3 yr Actual
2011/122007/08 2013/142008/09 2012/13
R billion Average investment per annum 2000/01 – 2004/05
Invested cumulatively the last 4 years more than the previous 15 years
28

CAPITAL INVESTMENT: 5-YEAR PLAN R80.5bn
9,071
12,841
21,912
09/10
8,121
11,321
19,442
10/11
7,180
9,156
16,336
11/12
9,439
3,892
13,331
12/13
7,718
1,762
9,480
13/14
Annual Capex (Rbn)Annual Capex (Rbn) Sustaining vs Expansion (3 year view)
Sustaining vs Expansion (3 year view)
58%
42%
Capital spending will be closely monitored during year to ensure that financial metrics
are maintained
Sustaining
Expansion
54%TFR
R43.5bn
3%TRE
R2.1bn
20%TNPA
R16.3bn
8%
TPT
R6.3bn14%
TPL
R11.1bn
1%
Other
R1.2bn
Capex per DivisionCapex per Division

CAPITAL INVESTMENT: PLANNED SPENDING PER CORRIDOR
Capex spread over the Country
All numbers as per Corporate Plan
30

MAJOR EXISTING PROJECTTNPA: DURBAN HARBOUR ENTRANCE CHANNEL WIDENING
Investment Criteria
Cost Time Quality Local Content
Safety Risk
OverviewThe Durban Harbour Entrance Channel Widening and Deepening project is essential in enabling the Port of Durban to accommodate larger vessels through its entrance and to improve the safety of navigation. The widening of the entrance to 330m will enable the super post panamax container vessels to enter the port without any constraining factors.
Current StatusExcavation of the North revetment continues and is progressing well. Armouring of the new north grove and the south breakwater is making good progress. Design of the sand bypass system at A-berth is nearing completion while commissioning of the temporary bypass system is scheduled for June 2009. The project has reached a 60% stage of completion.
Spending (Rm)
Latest Estimated Total Cost (ETC)
2008/09 Spending
Spending since inception Actual
3 756 1 942 1 176
31
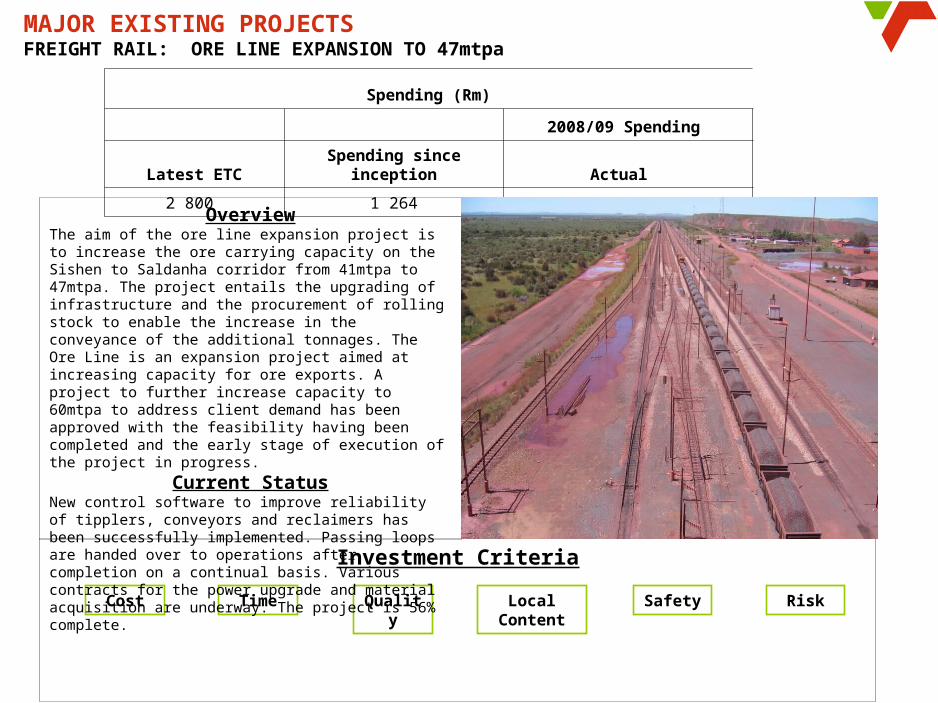
MAJOR EXISTING PROJECTSFREIGHT RAIL: ORE LINE EXPANSION TO 47mtpa
Investment Criteria
Cost Time Quality Local Content
Safety Risk
OverviewThe aim of the ore line expansion project is to increase the ore carrying capacity on the Sishen to Saldanha corridor from 41mtpa to 47mtpa. The project entails the upgrading of infrastructure and the procurement of rolling stock to enable the increase in the conveyance of the additional tonnages. The Ore Line is an expansion project aimed at increasing capacity for ore exports. A project to further increase capacity to 60mtpa to address client demand has been approved with the feasibility having been completed and the early stage of execution of the project in progress.
Current StatusNew control software to improve reliability of tipplers, conveyors and reclaimers has been successfully implemented. Passing loops are handed over to operations after completion on a continual basis. Various contracts for the power upgrade and material acquisition are underway. The project is 56% complete.
Spending (Rm)
2008/09 Spending
Latest ETC Spending since inception Actual
2 800 1 264 516
32
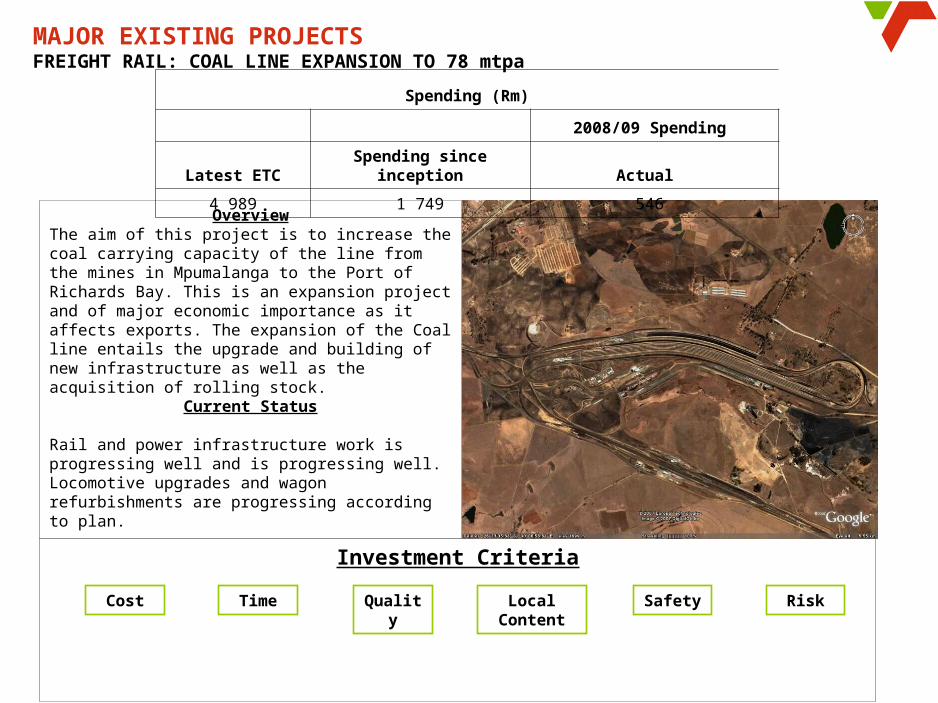
Investment Criteria
Cost Time Quality Local Content
Safety Risk
OverviewThe aim of this project is to increase the coal carrying capacity of the line from the mines in Mpumalanga to the Port of Richards Bay. This is an expansion project and of major economic importance as it affects exports. The expansion of the Coal line entails the upgrade and building of new infrastructure as well as the acquisition of rolling stock.
Current Status
Rail and power infrastructure work is progressing well and is progressing well. Locomotive upgrades and wagon refurbishments are progressing according to plan.
Spending (Rm)
2008/09 Spending
Latest ETC Spending since inception Actual
4 989 1 749 546
MAJOR EXISTING PROJECTSFREIGHT RAIL: COAL LINE EXPANSION TO 78 mtpa
33

Investment Criteria
Cost Time Quality Local Content
Safety Risk
OverviewNgqura Container Terminal is a Greenfield project with the objective of providing a full service container terminal together with rail links to the port. The scope is to develop a 4 berth container terminal and further extending the port infrastructure for a small craft basin, tugs, buildings and other landside infrastructure for the functioning of a container terminal. The project will provide 700 000 TEUs/a capacity when complete.
Current Status30 hectares of paving have been completed behind the first 2 berths while work on the trailer park and admin buildings is progressing well. The terminal handled its first two vessels in September 2008. Transformers for Eskom and cargo handling equipment for Port Terminals were offloaded from these vessels.
Spending (Rm)
2008/09 Spending
Latest ETC Spending since inception Actual
4 142 1 372 1 009
MAJOR EXISTING PROJECTSTNPA: NGQURA CONTAINER TERMINAL
34

Investment Criteria
Cost Time Quality Local Content
Safety Risk
OverviewThe aim of this project is to build a 550 km new trunk line from Durban to Jameson Park (Gauteng), 24 inch in diameter, addressing the increased demand for fuel in Gauteng and surrounding areas. The trunk line will connect an inland and coastal terminal with significant storage capacity. The existing pipeline is 40 years old and needs replacing. With the front-end engineering design phase completed, Transnet was granted licence to construct the NMPP by NERSA. It also entails the replacement of two northern network pipelines that have outlived their sustainable life. Given the energy problem facing South Africa, the Board has granted unconditional approval to commence construction in February 2008. This project is considered a strategic project for the Company, and is of national importance. Current StatusIn May 2008 a R3.3 Billion contract was awarded to Spiecapag Group 5, a South African French Consortium for the construction of the NMPP. Favorable Environmental Approvals for the project scope has also been received. Manufacturing for the 16” pipe commenced in April 2008 and all 105 000 tons of steel for the main 24” pipe has arrived in South Africa. As at end March 2009, the first 6 out of a total of 170 km of 16” pipe had been laid in the Kendall/Waltloo area. It is expected that the last phase of this project will be completed at the end of 2011.
Spending (Rm)
2008/09 Spending
Latest ETC Spending since inception Actual
12 600 3 278 2 565
MAJOR EXISTING PROJECTSTPL: NEW MULTI-PRODUCT PIPELINE
0
INDIANINDIANOCEANOCEAN
DURBANDURBAN
HOWICK
LADYSMITHLADYSMITH
BETHLEHEM
VOLKSRUST
NEWCASTLEKROONSTAD
KLERKSDORP
POTCHEFSTROOM
WITBANK
WALTLOOWALTLOOPRETORIA WEST
SECUNDA
STANDERTON
ALRODEALRODE
COALBROOKSASOLBURG
SCHEEPERSNEK
MAHLABATINI
HILLCREST
TARLTON
LESOTHO
NATAL
FREE
STATE
GAUTENG
ø457,2
ø406,4ø323,8
QUAGGA
N
RUSTENBURG
MAGDALA
NORTH - WESTMPUMALANGA
KWAZULU /
AIRPORT
VRYHEID
RICHARDS BAY
PPT-0231-/L
( 18" )
( 16" )( 12" )
ø457,2(18")
ø406,4( 16" )
BHT
MEYERTON
MNGENI
VAN REENEN
DUZI
INGOGO
WILGE
LANGLAAGTELANGLAAGTE
FORT MISTAKE
EMPANGENI
VREDE
MOOIRIVER
“T”
1
6
10
2
NMPP System Configuration in 2010
JAMESON PARKJAMESON PARK
KENDAL

36
COMPETITIVE SUPPLIER DEVELOPMENT PROGRAMME (CSDP)• The aim of the Transnet Competitive Supplier Development Programme (CSDP) is to localise Transnet supply chain
to a reasonable level and to promote South Africa as an off-shore source of goods and services for Original Equipment Manufacturers (OEM’s).
• This will secure source of supply, provide industrialisation opportunities for national businesses and reduce lead times
• Initially, the programme is being piloted over three years with rolling stock and port equipment purchases as its focus. The following is the progress to date:
• The aim of the Transnet Competitive Supplier Development Programme (CSDP) is to localise Transnet supply chain to a reasonable level and to promote South Africa as an off-shore source of goods and services for Original Equipment Manufacturers (OEM’s).
• This will secure source of supply, provide industrialisation opportunities for national businesses and reduce lead times
• Initially, the programme is being piloted over three years with rolling stock and port equipment purchases as its focus. The following is the progress to date:
Company & Investment Programme
Kalmar - R350 million port equipment and maintenance
• Kalmar has a previous NIPP obligation. They are first building a Cargotec (port handling equipment and freight solutions) training school. Their initial obligation for CSDP will be for free training hours and a discount rate per R10 million purchased
• Working with Kalmar on skills transfer to local organisations in respect of motor and engine maintenance
EMD - R800 million :5 year parts deal • EMD has already committed to the transfer of Intellectual Property to TRE in building a world class traction motor assembly line (EMD’s estimate of $15 million value)
EMD - R800m contract “50 Like New” Locomotives
• Local assembly and engineering done by TRE and with transfer of skills, TRE now able to do substantially more of the total Loco’s build.
Mitsui (VENUS /MARS) - Extension of the 19E contract - electric locomotive - by 35 vehicles – R600 million
• Original contract has NIPP obligations – Significant portion of assembly & engineering done locally.
• Mitsui will build a training facility to satisfy their NIPP obligations. We have also negotiated free training for TRE maintenance practitioners
Current 100 Locomotive tender (first time CSDP was used in a tender) -
• Both companies are proposing approximately a R1 billion investment over several years
• Adjudication process currently underway. Locomotive steering Committee set up to ensure adequate governance

5-YEAR FUNDING REQUIREMENT PER 2009/10 CORPORATE PLAN
* Excluding the redemption of current loans
More than 50% of the funding requirements for the 2009/10 financial year has already been raised to date on the strength of Transnet’s
balance sheet.
All numbers reflected as per Corporate Plan
37
Budget Projections
2009/10R million
2010/11R million
2011/12R million
2012/13R million
2013/14R million
Cash flow from operating activities 10 572 11 696 13 169 14 474 16 941
Cash flow from investing activities (23 438) (21 137) (18 765) (14 140) (10 151)
Capital investment (21 912) (19 442) (16 336) (13 331) (9 480)
Capitalised borrowing cost (1 850) (1 854) (2 212) (663) (489)
Other investing activities 324 159 (217) (146) (182)
Net cash surplus / (shortfall)* (12 866) (9 441) (5 596) 334 6 790

TRANSNET FUNDING SOURCES TO TAP INTO
The following funding sources have been initiated. The amounts are indicative & subject to market conditions
• Domestic bonds (TN17, TN23 and T27 Bonds)(±R6 bn)Currently tapping R1 bn per month and plan to launch at least 1 new bond & increase the size as liquidity increases
• ECA Supported Funding (R2 bn)1st transaction with Finvera to be concluded by early April 2009.
• Development Finance Institutions (R4bn) – JBIC loan agreement signed 26 March –first drawdown mid April 2009 approximately R2 bn and balance (R2bn) in
line with project payment dates– AfDB at due diligence stage expected to conclude end May 2009
• Domestic Loans (R7 bn)Rand Bilateral loans from banks(8) and other financial institutions(2)
• International Bond (±R5 bn)Close to concluding documentation & update with year-end financials, if not implemented will replace with domestic bonds
• Other International InitiativesAFLAC Loan (±R1.5 bn) – legal documentation finalized - still negotiating pricing levels
• Commercial Paper Bi-weekly issues of CP varying between R500m and R750m – plan to replace maturities with bonds.
• Pipeline FinancingConsidering a ring-fenced financing structure to align with regulatory environment.
Transnet has committed banking facilities in excess of R4 billion that can be utilised when required
CONTENT OF THE PRESENTATION
• Introduction
• Overview – 2008/09 Preliminary Results
• Changes in Economic Environment
• Transnet Strategy
• Regulatory Environment
• 2009/10 Corporate Plan
• Risks and Mitigating Plans
• Strategic Priorities 2009/10
• Conclusion
• Introduction
• Overview – 2008/09 Preliminary Results
• Changes in Economic Environment
• Transnet Strategy
• Regulatory Environment
• 2009/10 Corporate Plan
• Risks and Mitigating Plans
• Strategic Priorities 2009/10
• Conclusion
39

E
D
C
B
A
7 6 5 4 3 2 1
3
1
26
587
49
Consequence Rating
Lik
elih
ood
Rati
ng
Revenue/Volume Growth
Non compliance with Safety and Standard Operating Procedures (SOPs)
Economic Regulation (Ports Regulator and National Energy Regulator of South Africa)
Funding/Liquidity Risk
Delivery of capital projects on time and within budgets and affordability thereof
Asset Performance and Maintenance Regime
Human Resources Capability to deliver on growth strategy
Environmental Risks
Input costs including: Energy (electricity), Fuel, Steel, Pricing & Supply
Commodity & Concentration Risks (Third Party Supplier Risks)
GROUP’S KEY RISKS(as at May 2009)
Strategic residual risks heat map
10
Priority I risk – Transnet Group CE and Board levelPriority II risk - Operating Divisions’ CEOs LevelPriority III risk -General Managers’ levelPriority IV risk – Managers’ levelPriority V risk –Employees’ level
3
1
2
6
5
8
7
4
9
10
Mitigating plans are in place to manage the key risks
Mitigating plans are in place to manage the key risks
40

IMPLEMENTED A DYNAMIC MANAGEMENT FRAMEWORK WITHIN EPM OPERATING MODEL
Performance interactions
Performance Assessmentand Rewards
Strategyand
Targets
Track andmonitoring
Creating RealisticBudgets
and plans
EPM
Dynamic Management Framework to actively assess performance and plan/reallocate resources to achieve goals
Weekly Activity Reporting
Monthly Performance Assessment
Quarterly Performance Assessment
Focus on weekly trends volume trends, year end
estimates and impact analysis on Group Revenue
Monthly assessment of performance, success of cost cutting and capex initiatives
and updated year end estimates
Quarterly workshop (Ext. Exco) on year-to-date results,
year-end estimates and effectiveness of initiatives
Dynamic Process
Where we are?(measurement)Where we are?(measurement)
Where we planned to be?
(evaluation)
Where we planned to be?
(evaluation)
Corrective measures(action)
Corrective measures(action)
41
80%
90%
95%
100%
105%
Corporate Plan

2009/10EXECUTIVE SUMMARYWEEKLY ACTIVITY REPORTINGWeek 11 Results – Key Commodities
1,41
GFB (mt)
1,354,1% 66,644
Containers
(TPT)
61,102+9%
1,24
Export Coal
(mt)
1,37-9,5%
0.69
Export Iron Ore
(mt)
0.83 -17%
June 2009 Estimate
5.95
GFB
(mt)
5.897.39
1.0%
Analysis of Volume and Revenue Variance - Year end Estimate (2009/10)
Current EstimateBudget
268
Containers
(000 TEUs)
271
251
-1,0%3.72
Export Iron Ore
(mt)
3.68
2.50
1.1%
Revenue contribution to Group
Comments
5,8
Export Coal
(mt)
6,15,1
-3,6%
BudgetActual
Previous year
• The Transnet weighted volume variance estimate for 2009/10 is negative 1.4% (estimated 2.5% negative for June 2009).
• Group revenue (all commodities) is estimated to be 4.7% below budget for the 2009/10 year, mainly due to limitation on petroleum tariff increases, container volumes and negative price mix, export coal volumes and other bulk commodities.
• The Group revenue variance for 2009/10 would only be 2.0% below budget if the impact of TPL’s tariff increases are excluded.
447
Liquid Bulk (TNPA)
872 -49%
109,400
Break Bulk (TPT)
166,613 -34%358,376
Other Bulk (TPT)
369,753 -3%
% V
olu
me
Var
ian
ce
% Revenue Variance
Size
-22%
-20%
-18%
-16%
-14%
-12%
-10%
-8%
-6%
-4%
-2%
0%
2%
4%
6%
8%
-8% -6%-42% -4% -2%-10% 6%4%2%0%
Gas
Petroleum
Other Bulk
Liquid Bulk
Automotives
Containers
Iron Ore (TPT)
Coal (TNPA)
Iron Ore (TNPA)
Coal (TFR)
Iron Ore (TFR)
GFB
56.15 56.15 59.2 60.6
115.75 122.95133.5 129.15
8 9 10 11
Spot Price $/Tonne Coal
Spot Price $/Tonne Iron Ore
Baltic Dry Bulk Index $/Tonne
Current YearPrior Year
2544 2786 3494 3646
11,459 11,465 11440 11612
8 9 10 11
67 69 76.567.5
177.5 181.5 181.5 172.5
8 9 10 10
Global Bulk Indicators
TRANSNET STATUS
Level 1 Negative 2% revenue
variance, excluding TPL tariffs
Negative 4.7% revenue variance, including TPL tariffs
Extract of Week 11 Report
42

CONTENT OF THE PRESENTATION
• Introduction
• Overview – 2008/09 Preliminary Results
• Changes in Economic Environment
• Transnet Strategy
• Regulatory Environment
• 2009/10 Corporate Plan
• Risks and Mitigating Plans
• Conclusion - Strategic Priorities 2009/10
• Introduction
• Overview – 2008/09 Preliminary Results
• Changes in Economic Environment
• Transnet Strategy
• Regulatory Environment
• 2009/10 Corporate Plan
• Risks and Mitigating Plans
• Conclusion - Strategic Priorities 2009/10
43

CONCLUSION - 2009/10 STRATEGIC PRIORITIES • Increasing export iron ore volumes by 11.6% above the budget to contractual levels (47.9mt
compared to budget of 43mt);• Increasing current throughput in domestic coal to at least achieve the budgeted volumes of
21.5mt;• Containers on rail to increase by 10% above the current budget of 544 460 TEUs to 600 000
TEUs;• To maintain at least the current trends in magnetite and cement volumes which are on
average 70% and 20% in excess of budgets respectively.
Volume and revenue
opportunities
Volume and revenue
opportunities
• Whilst most divisions have made good progress on committing to cost savings initiatives, we have only managed to obtain plans to substantiate R1bn savings compared to the R1.4bn (level 1) required.
• It is essential that the cost structures must be reduced through efficiency improvement and elimination of non-revenue related costs.
• The Group minimum requirement remains R1.4bn reduction in costs and operating divisions will be measured monthly against these targets going forward.
Cost savings
Cost savings
• Focusing on the execution of the capex plans with optimal phasing• Committed to investing R80.5bn over the next 5 years
Capital optimisatio
n
Capital optimisatio
n
• We will drive to achieve “a world-class” (otherwise known as best-in-breed) operational performance in each key area of operations, in the near future. Accordingly, the KPI project will be driven hard this year with the focus on at least achieving the KPIs set out in the Corporate Plan
Operational efficienciesOperational efficiencies
44
• The objective is to reduce the number of incidents and the cost of losses by 33% from 2009/08 actual levels (approximately R200m reduction at Group level).
• Environmental compliance has been elevated as a key priority in Transnet and we agreed to perform the following at all main areas of operations:
• Review of maintenance and implementation of proper and structured maintenance programmes
• Getting housekeeping up to standard and comply with all environmental requirements• To start with a compliance review/audit to identify areas of
non-compliance/unsatisfactory standards
Safety and environmen
t
Safety and environmen
t

THANK YOU
END OF PRESENTATIONEND OF PRESENTATION


![Transnet Port Terminal, a division of · Transnet Port Terminal, a division of TRANSNET SOC LTD Registration Number 1990/000900/30 [Hereinafter referred to as Transnet] REQUEST FOR](https://img.pdfslide.us/doc/110x75/5f5e4faa6b0e6821912b906b/transnet-port-terminal-a-division-of-transnet-port-terminal-a-division-of-transnet.jpg)
![TRANSNET PORT TERMINALS Notices... · TRANSNET PORT TERMINALS An Operating Division of TRANSNET SOC LTD [Hereinafter referred to as Transnet] Registration Number 1990/000900/30 REQUEST](https://img.pdfslide.us/doc/110x75/600560c52af56b6cdb7b80d6/transnet-port-notices-transnet-port-terminals-an-operating-division-of-transnet.jpg)


![Transnet]...TRANSNET FRAIGHT RAIL, a division of TRANSNET SOC LTD Registration Number 1990/000900/30 [thereinafter referred to as Transnet] REQUEST FOR QUOTATION …](https://img.pdfslide.us/doc/110x75/6050751b455b0f3d741c0d14/transnet-transnet-fraight-rail-a-division-of-transnet-soc-ltd-registration.jpg)