Embed Size (px)
Citation preview
Transnet: Progress report
Select Committee on Labour and Public Enterprises
Parliament
21 June 2006

Contents
1. Global trends in the transport and logistics industry
2. Macro economic view of SA’s transport & logistics industry
3. Transnet strategy
3. Restructuring update
Contents
1. Global trends in the transport and logistics industry
2. Macro economic view of SA’s transport & logistics industry
3. Transnet strategy
3. Restructuring update
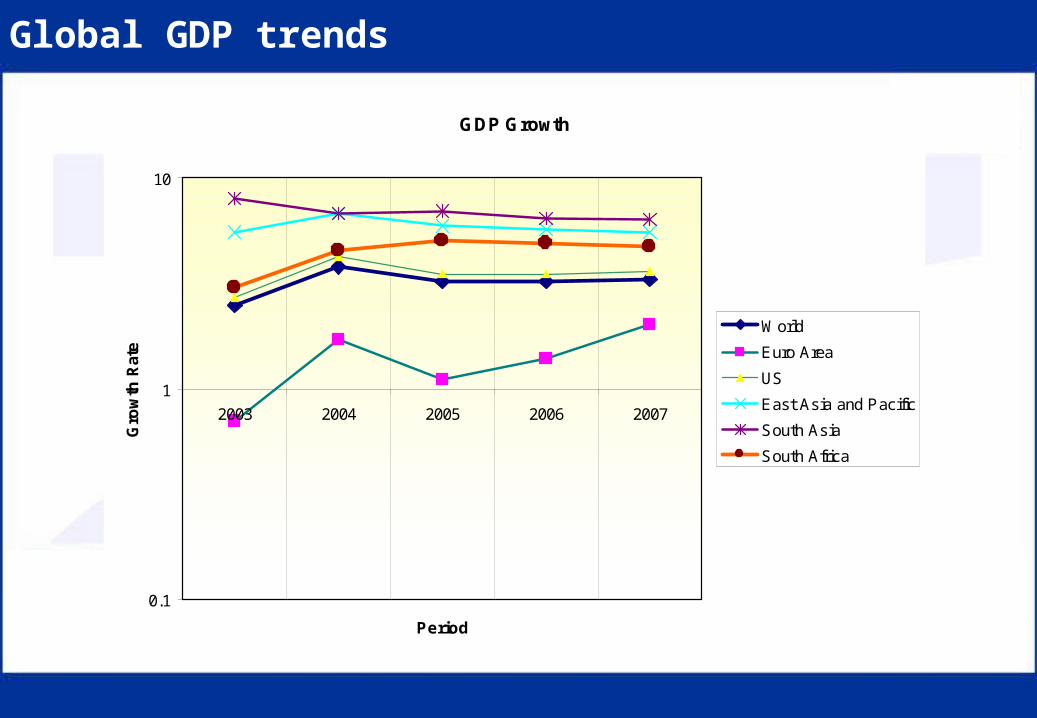
Global GDP trends
GDP Growth
0.1
1
10
2003 2004 2005 2006 2007
Period
Gro
wth
Rat
e
World
Euro Area
US
East Asia and Pacific
South Asia
South Africa

Regional growth in container traffic, 2003 - 2008
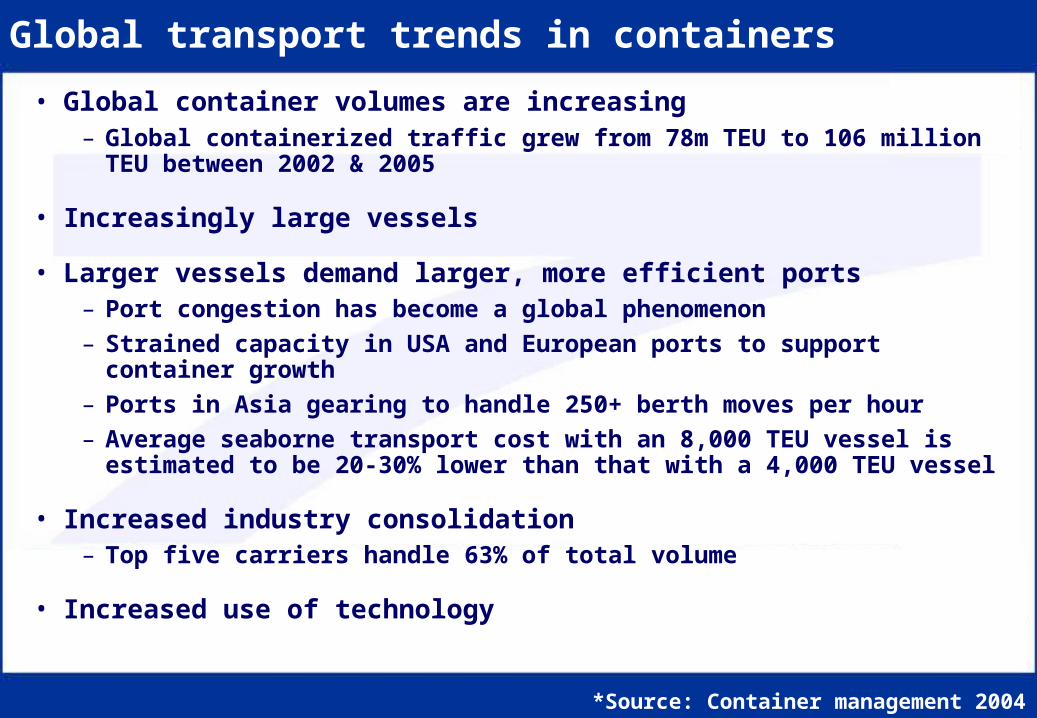
Global transport trends in containers
• Global container volumes are increasing– Global containerized traffic grew from 78m TEU to 106 million TEU between
2002 & 2005
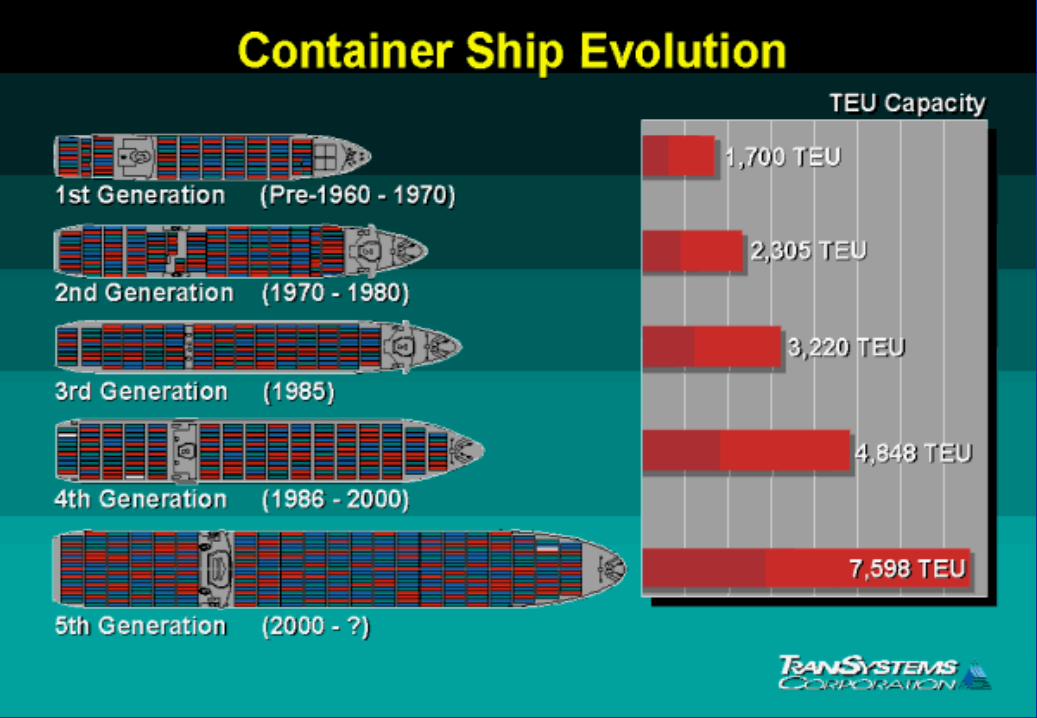
• Increasingly large vessels
• Larger vessels demand larger, more efficient ports – Port congestion has become a global phenomenon
– Strained capacity in USA and European ports to support container growth
– Ports in Asia gearing to handle 250+ berth moves per hour
– Average seaborne transport cost with an 8,000 TEU vessel is estimated to be 20-30% lower than that with a 4,000 TEU vessel
• Increased industry consolidation– Top five carriers handle 63% of total volume
• Increased use of technology
*Source: Container management 2004
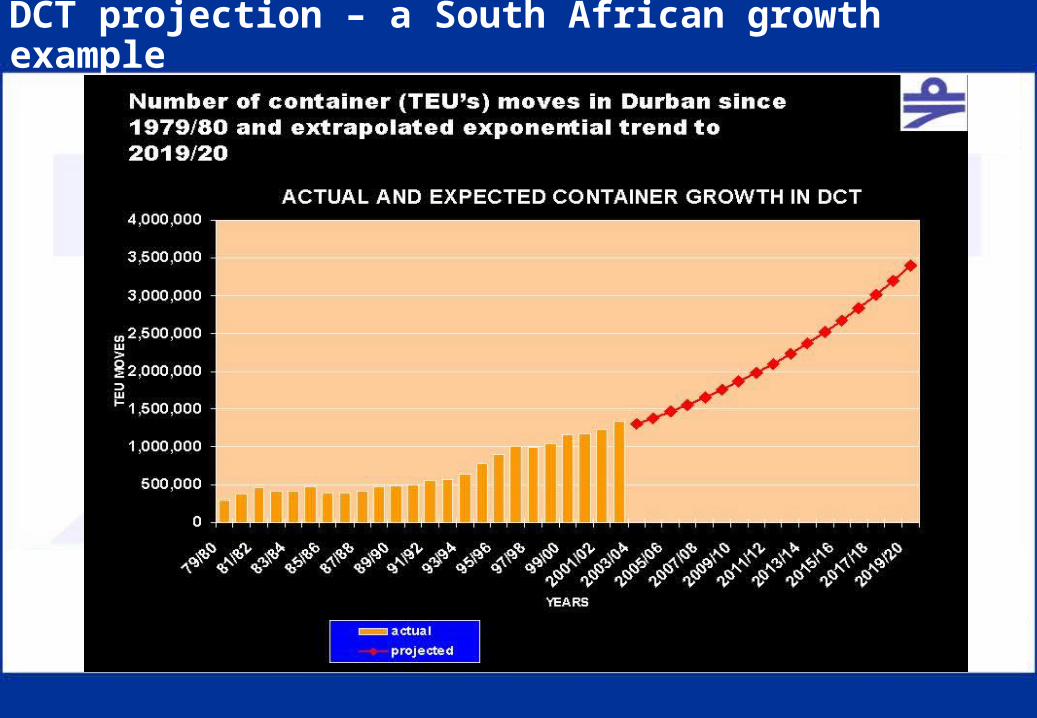
DCT projection – a South African growth example
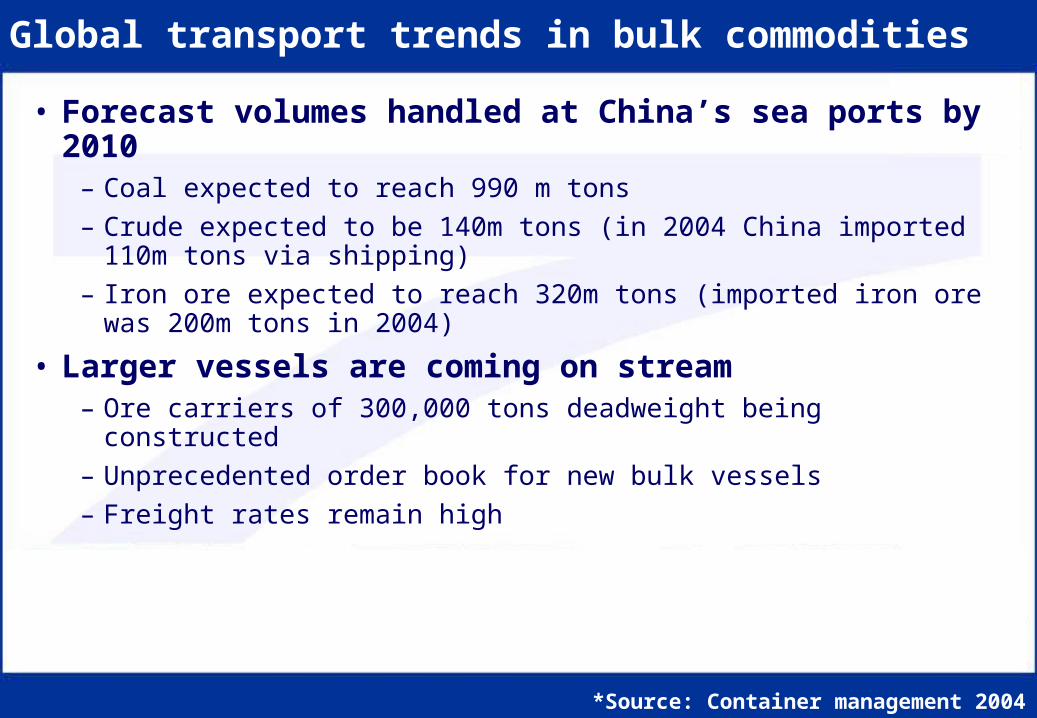
Global transport trends in bulk commodities
• Forecast volumes handled at China’s sea ports by 2010– Coal expected to reach 990 m tons
– Crude expected to be 140m tons (in 2004 China imported 110m tons via shipping)
– Iron ore expected to reach 320m tons (imported iron ore was 200m tons in 2004)
• Larger vessels are coming on stream – Ore carriers of 300,000 tons deadweight being constructed
– Unprecedented order book for new bulk vessels
– Freight rates remain high
*Source: Container management 2004
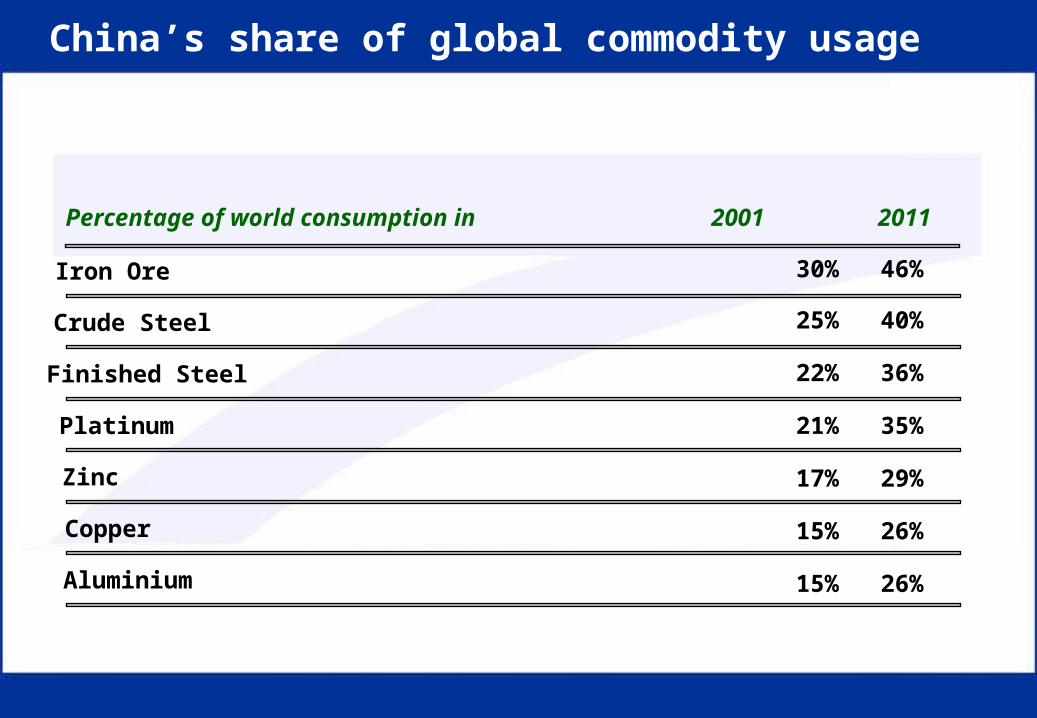
Percentage of world consumption in 2001
Iron Ore
Crude Steel
Finished Steel
Platinum
Zinc
Copper
Aluminium
30%
25%
22%
21%
17%
15%
15%
China’s share of global commodity usage
2011
46%
40%
36%
35%
29%
26%
26%
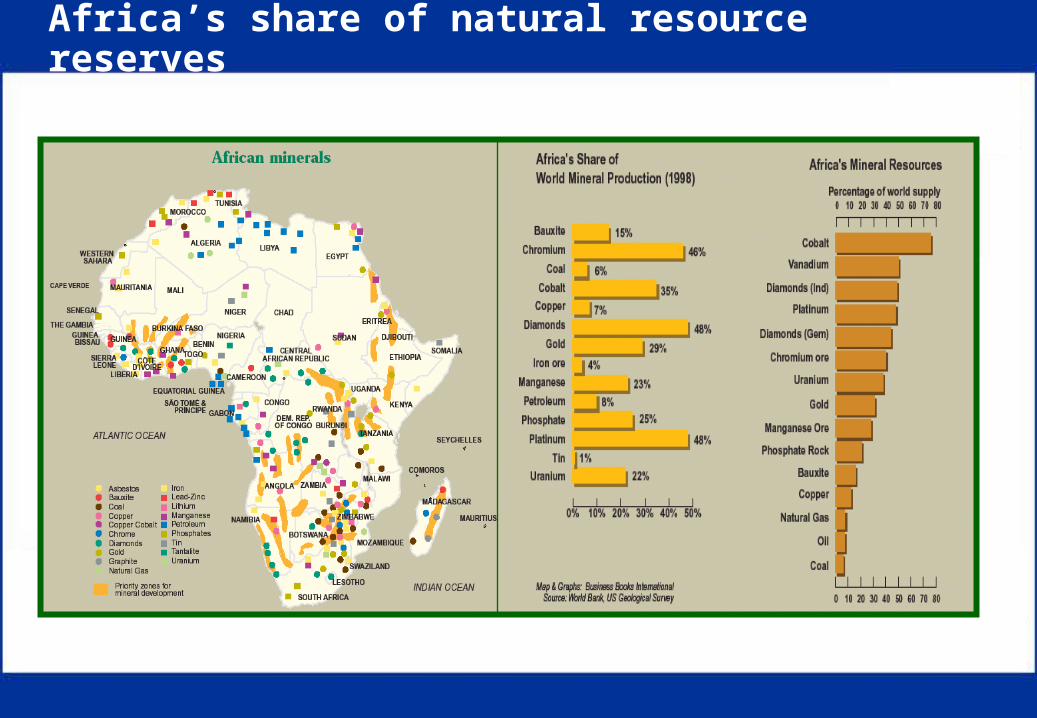
Africa’s share of natural resource reserves
Agenda
1. Global trends in the transport and logistics industry
2. Macro economic view of SA’s transport & logistics industry
3. Transnet strategy
3. Restructuring update
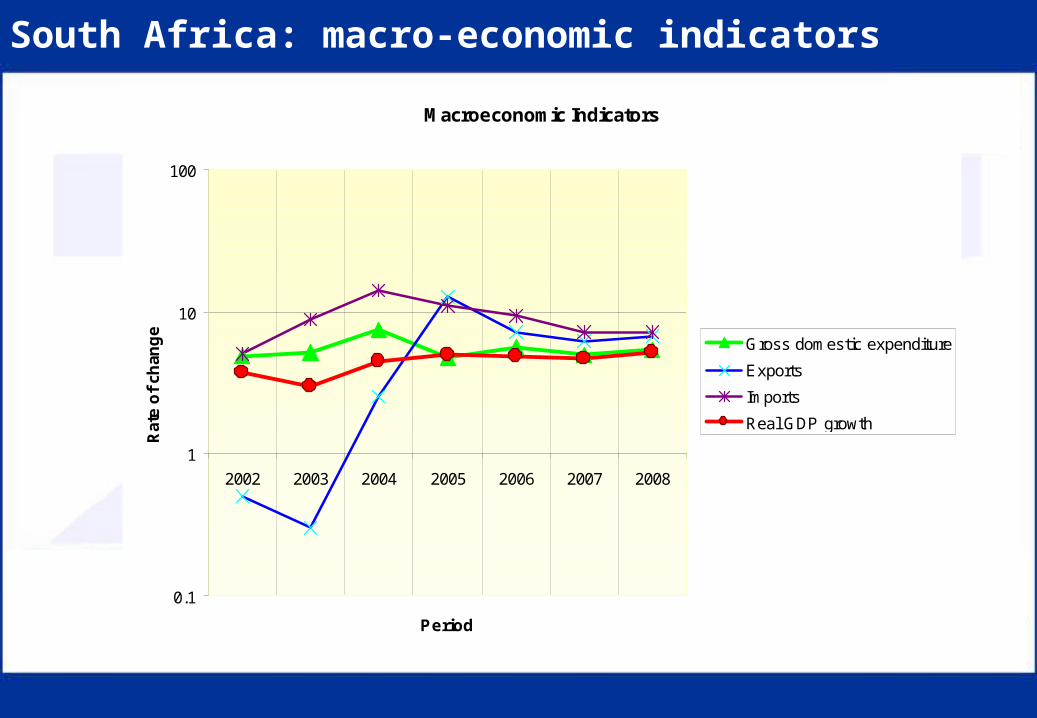
South Africa: macro-economic indicators
Macroeconomic Indicators
0.1
1
10
100
2002 2003 2004 2005 2006 2007 2008
Period
Rat
e o
f ch
ang
e
Gross domestic expenditure
Exports
Imports
Real GDP growth

745 million tons freight per annum. Total transport cost R135bn per annum. Biggest portion of total is long-haul road transport.
Pipeline & Water
0%
Air9%Rail
9%
Road - Corridor
38%
Road - Metro24%
Road - Rural20%
R11bn
R50bn
R30bn
R11bn
R0.3bn
Rail corridor = R135/tonRoad corridor = R360/ton
R25bn
SA’s logistics costs: 15.2% of GDP
75% long-haul goes by road
(CSIR 2005)

Modal split of traffic
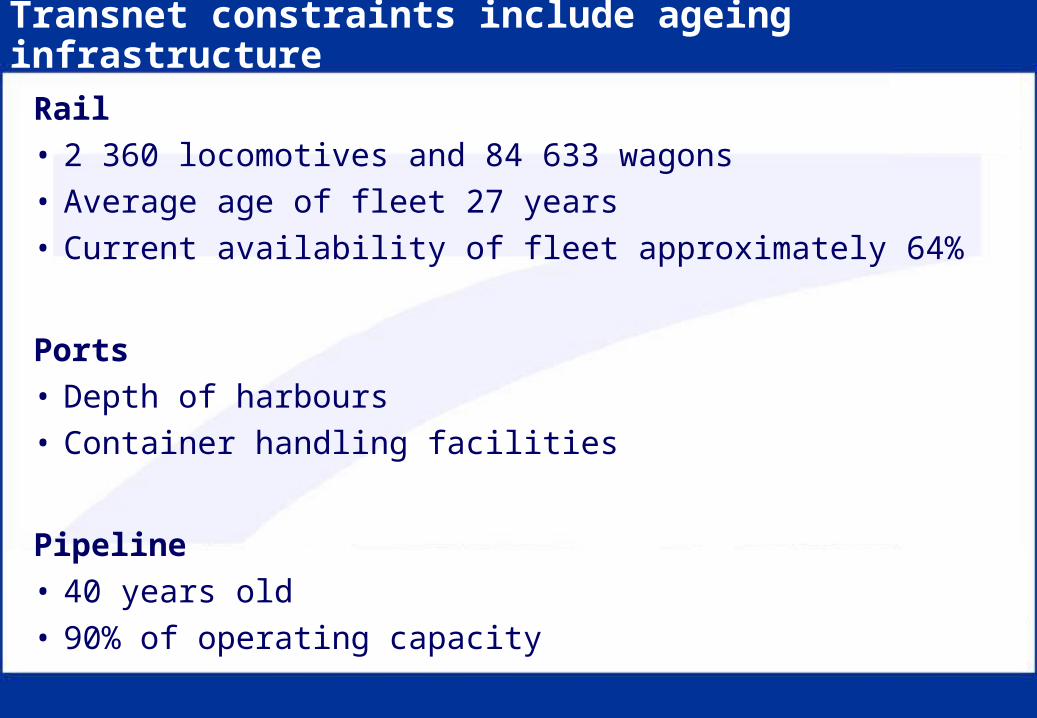
Transnet constraints include ageing infrastructure
Rail
• 2 360 locomotives and 84 633 wagons
• Average age of fleet 27 years
• Current availability of fleet approximately 64%
Ports
• Depth of harbours
• Container handling facilities
Pipeline
• 40 years old
• 90% of operating capacity
contents
1. Global trends in the transport and logistics industry
2. Macro economic view of SA’s transport & logistics industry
3. Transnet strategy
3. Restructuring update
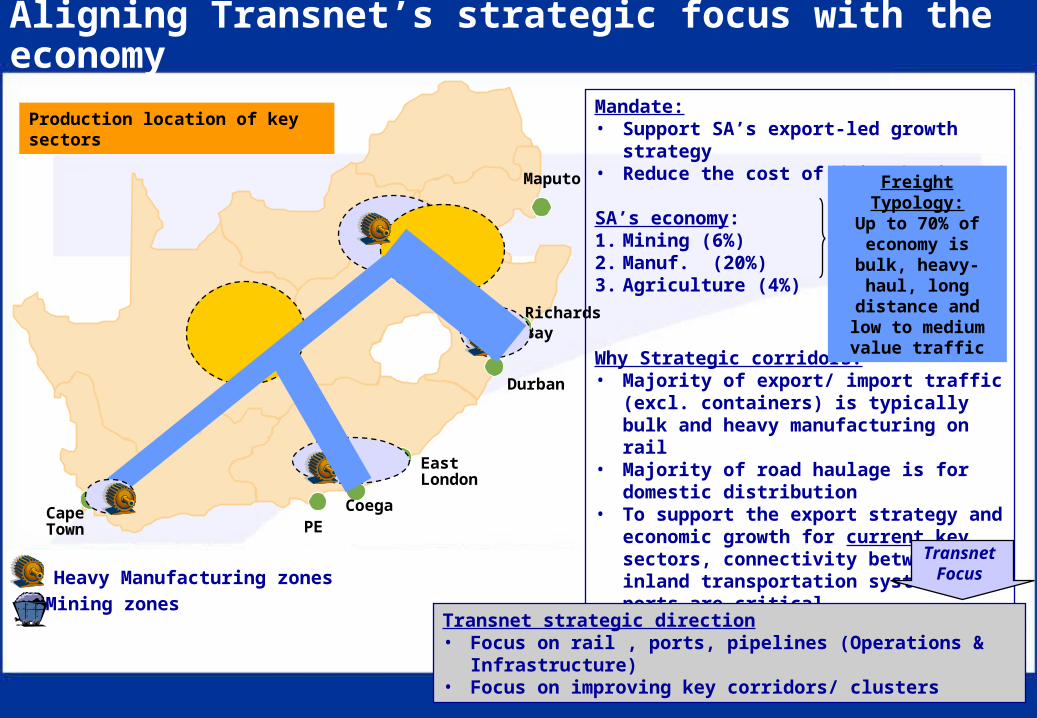
Aligning Transnet’s strategic focus with the economy
PE
East London
Maputo
RichardsBay
Durban
Cape Town
Coega
Heavy Manufacturing zones
Mining zones
Mandate:• Support SA’s export-led growth strategy• Reduce the cost of doing business
SA’s economy:1. Mining (6%) 49%2. Manuf. (20%) 45%3. Agriculture (4%) 6%
Why Strategic corridors?• Majority of export/ import traffic (excl.
containers) is typically bulk and heavy manufacturing on rail
• Majority of road haulage is for domestic distribution
• To support the export strategy and economic growth for current key sectors, connectivity between inland transportation systems and ports are critical
• Create efficient export systems for growing sectors
Freight Typology:Up to 70% of
economy is bulk, heavy-haul, long
distance and low to medium value
traffic
Production location of key sectors
Transnet strategic direction• Focus on rail , ports, pipelines (Operations & Infrastructure)• Focus on improving key corridors/ clusters
TransnetFocus
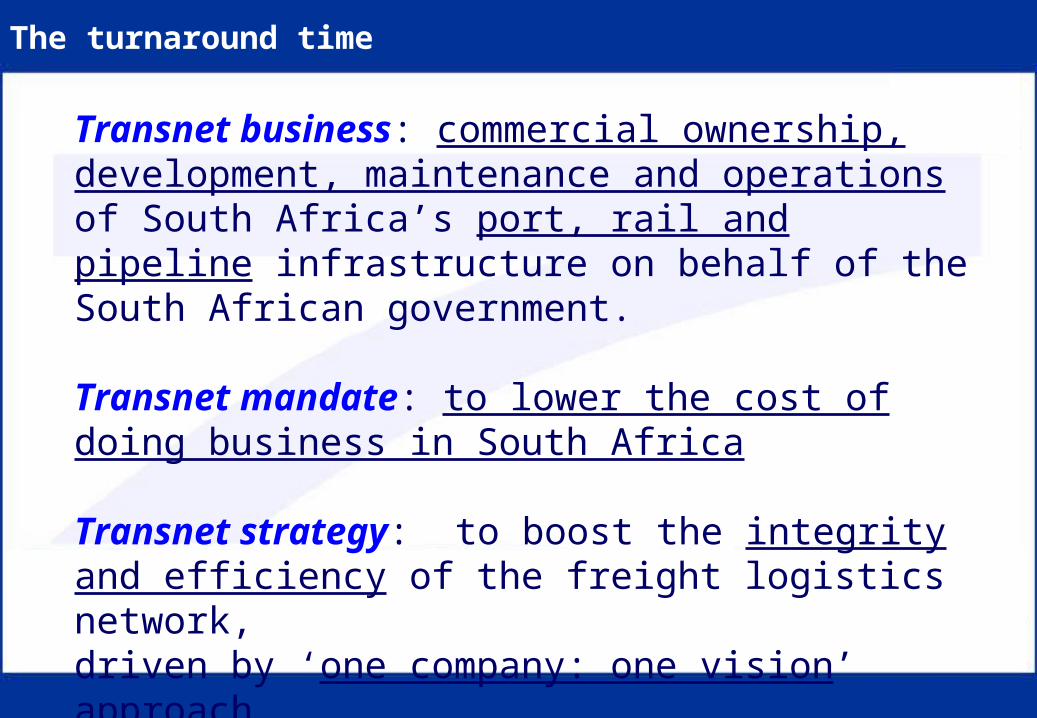
The turnaround time
Transnet business: commercial ownership, development, maintenance and operations of South Africa’s port, rail and pipeline infrastructure on behalf of the South African government.
Transnet mandate: to lower the cost of doing business in South Africa
Transnet strategy: to boost the integrity and efficiency of the freight logistics network, driven by ‘one company: one vision’ approach.

RAIL PORTS
Independent Regulators
PETRONET
RAILTelecomms
Transport HSA
Core Transport Portfolio
Strategic Support Divisions
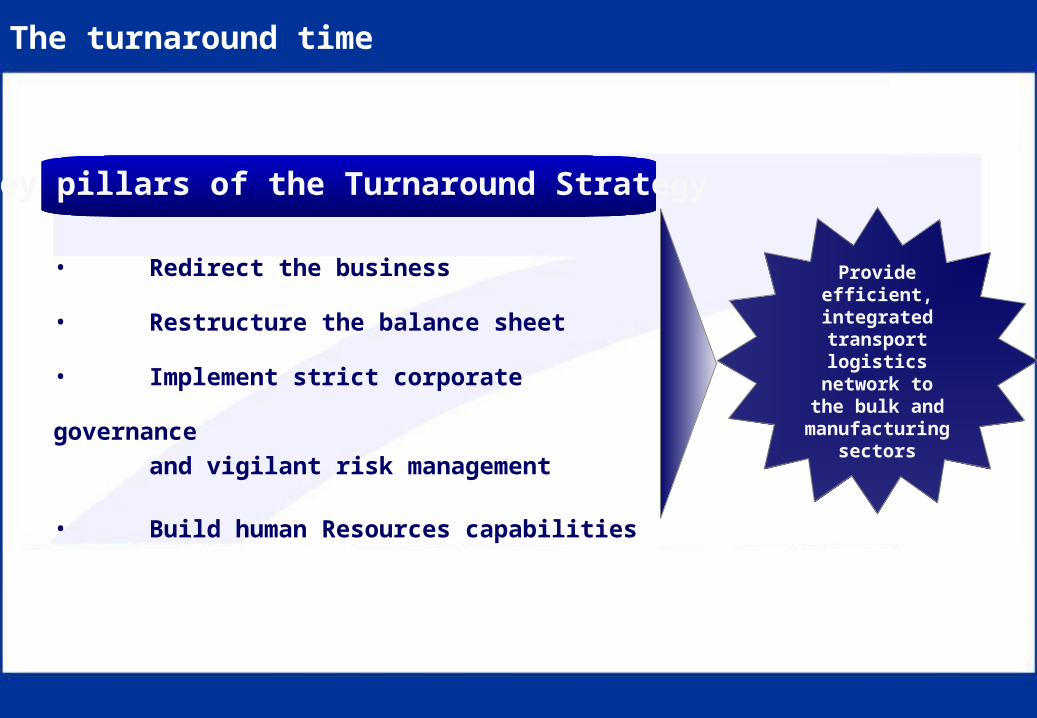
The turnaround time
Key pillars of the Turnaround Strategy
• Redirect the business
• Restructure the balance sheet
• Implement strict corporate governance
and vigilant risk management
• Build human Resources capabilities
Provide efficient, integrated transport
logistics network to the bulk and manufacturing
sectors
Lower cost of doing business
Targeted sectors
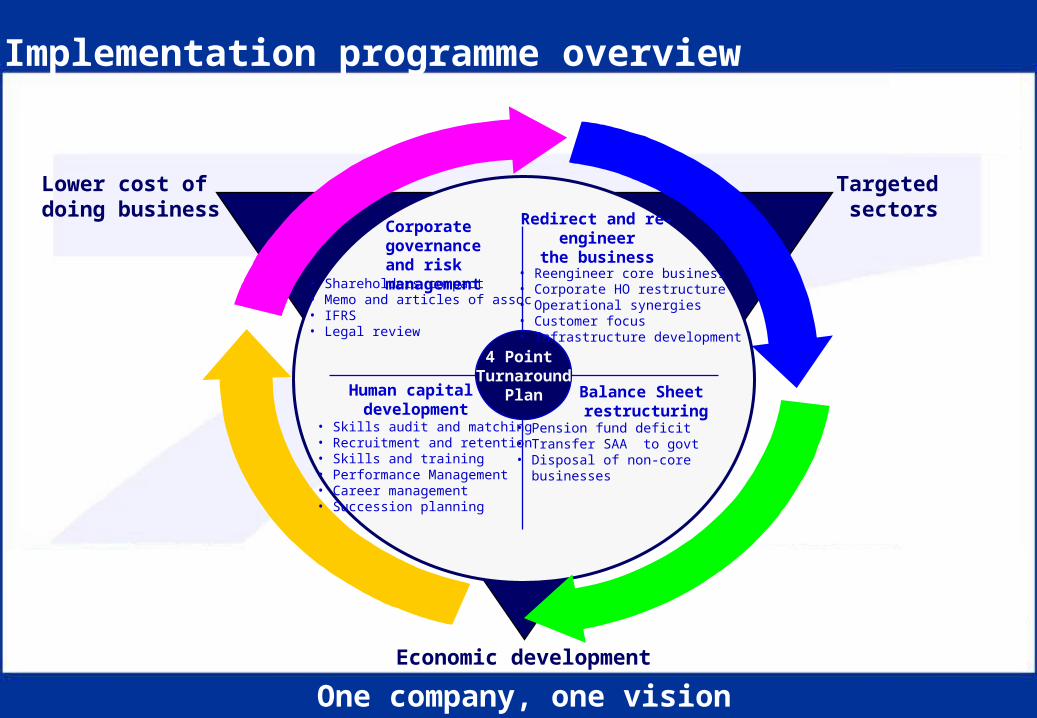
4 Point Turnaround
Plan
Redirect and re-engineer
the business
Balance Sheet restructuring
Human capital development
• Reengineer core business • Corporate HO restructure• Operational synergies• Customer focus• Infrastructure development
• Pension fund deficit• Transfer SAA to govt• Disposal of non-core businesses
• Skills audit and matching • Recruitment and retention• Skills and training• Performance Management• Career management• Succession planning
• Shareholders compact• Memo and articles of assoc• IFRS • Legal review
Economic development
Corporate governance and risk management
One company, one vision
Implementation programme overview

CAPEX 5-YEAR PLAN (CORE)
Rail (R31.5bn)
Replacement:•Ore Line sustain (R460m)•Coal Line sustain (R6192m)•Capitalization of Maintenance (R8124m)•General Freight (R10827m)•Other smaller replacement projects (R1475m)
Expansion:•Ore Line expansion (R2283m)•Coal Line expansion (R1765m)•Other smaller projects (R345m)
Ports (R18.6bn)
Replacement:•Pier 1 re-surfacing (R659m)•Reconstruct Island View Berths (R134m)•Remodel Maydon Wharf (R1249m)•Remodel South Arm (R633m)•Other smaller replacement projects (R836m)
Expansion:• Construction of the Port of Ngqura (R2493m)• Container Terminal Expansion- Salisbury and Bayhead (R3837m)• Cape Town Capacity expansion (R1838m)• Other smaller expansion projects (R6888m)
5-Year Capex total projection: R 64bn
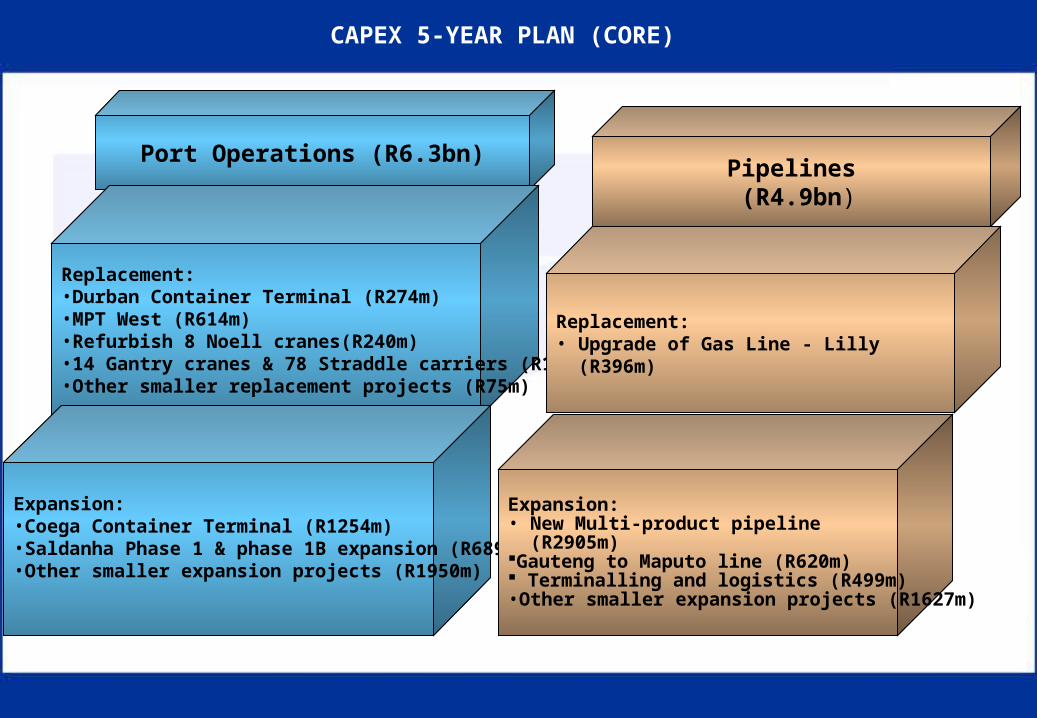
CAPEX 5-YEAR PLAN (CORE)
Port Operations (R6.3bn)
Replacement:•Durban Container Terminal (R274m)•MPT West (R614m)•Refurbish 8 Noell cranes(R240m)•14 Gantry cranes & 78 Straddle carriers (R1167m)•Other smaller replacement projects (R75m)
Expansion:•Coega Container Terminal (R1254m)•Saldanha Phase 1 & phase 1B expansion (R689m)•Other smaller expansion projects (R1950m)
Pipelines (R4.9bn)
Replacement:• Upgrade of Gas Line - Lilly (R396m)
Expansion:• New Multi-product pipeline (R2905m)Gauteng to Maputo line (R620m) Terminalling and logistics (R499m)•Other smaller expansion projects (R1627m)
contents
1. Global trends in the transport and logistics industry
2. Macro economic view of SA’s transport & logistics industry
3. Transnet strategy
4. Restructuring update
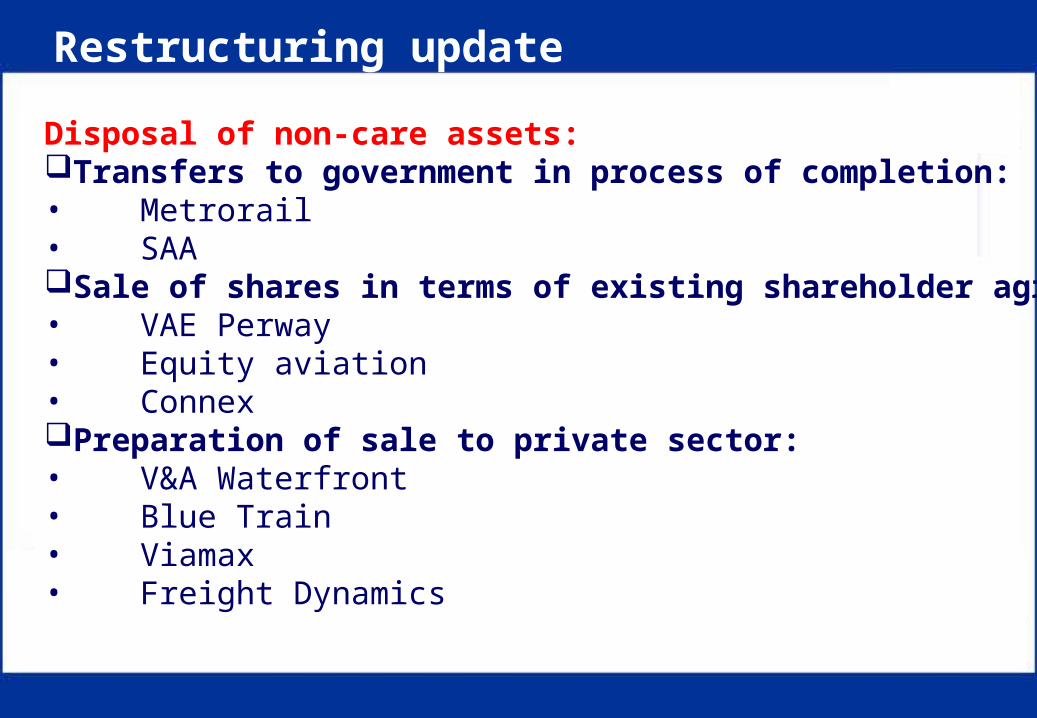
Disposal of non-care assets:Transfers to government in process of completion:• Metrorail• SAASale of shares in terms of existing shareholder agreements:• VAE Perway• Equity aviation• ConnexPreparation of sale to private sector:• V&A Waterfront• Blue Train• Viamax• Freight Dynamics
Restructuring update

Agreement has been reached with trade unions on disposals.
Only outstanding entities requiring finalisation of agreement:• Autopax• Transtel• Arivia
Agreed framework for different types of disposals and protection of employee benefits
Restructuring update
Thank you


![Transnet]...TRANSNET FRAIGHT RAIL, a division of TRANSNET SOC LTD Registration Number 1990/000900/30 [thereinafter referred to as Transnet] REQUEST FOR QUOTATION …](https://img.pdfslide.us/doc/110x75/6050751b455b0f3d741c0d14/transnet-transnet-fraight-rail-a-division-of-transnet-soc-ltd-registration.jpg)