Embed Size (px)
Citation preview


Transnational Corporations Review:
• Published in English and Chinese
• Supported by international experts and partners
• Focuses on TNC, FDI, Innovation, and Development
• Provides opportunities to recent graduates and young professionals in the fields of policy and economics
It’s Easy to Ask for a Copy!
Just write to [email protected] and we will respond to you immediately
Visit the Website to Learn More!
To learn more about Transnational Corporations Review and relevant information, please visit the website at www.tnc-online.net
Ottawa International Students Entrepreneurship:
• Supported by the Ottawa United Learning Academy
• Managed by a group of senior students and professionals
• Assists students with their studies and career development
• Reduces the cost of education for international students
FOREIGN DIRECT INVESTMENT AND DEVELOPMENT IN INDIA
Guest Editor
Jaya Prakash Pradhan
Transnational Corporations Review
Ottawa United Learning Academy, Canada
June 2011
Transnational Corporations Review www.tnc-online.net [email protected] i-ii
i
Editorial Statement
Transnational Corporations Review (TNCR), published by the Ottawa United Learning Academy (OULA) and Denfar Transnational Development (Denfar), is a modern media journal dedicated to providing economic, policy, and business analysis of current issues related to transnational corporations (TNCs), foreign direct investment (FDI), institutional innovation, and international development. The journal puts emphasis on China's growing involvement in the global economy. FDI by TNCs is the most dominant and dynamic element of the world economy in terms of production value; TNCR fills the urgent need for a journal on the topic that is available in both English and Chinese. It is the only journal published in the West that addresses the topic from modern theoretical and practical including knowledge management perspectives. The journal particularly serves the needs of globally dispersed young professionals and senior graduate students majoring in Chinese business and international economics.
Special Advisors
Dr. Manfred Bienefeld, Carleton University, Canada Dr. Someshwar Rao, Industry Canada (Government of Canada)Dr. Anne Miroux, United Nations Conference on
Trade and Development (UNCTAD) Dr. Karl Sauvant, Vale Columbia Center on Sustainable
International Investment, Columbia University, USA Dr. Elinor Ostrom, Indiana University, USA Dr. Yongding Yu, Chinese Academy of Social Sciences, China Dr. Vincent Ostrom, Indiana University, USA Dr. Yanzhong Zhang, Aviation Industry Corporation of China
Editorial & Review Board
Dr. Connie Carter, School of Business, Royal Roads University, Canada Dr. Arthur Cheung, City University of Hong Kong Dr. Xinjian Cui, School of Business, Central University of Finance and Economics, China Dr. Michael Hansen, Copenhagen Business School, Denmark Dr. Manqing He, Research Center on Transnational Corporations, MOFCOM, P.R. China Dr. Hafiz Mirza, United Nations Conference on Trade and Development (UNCTAD), Geneva Dr. Val Samonis, The Web Professor of Global Management(SM), Lansbridge University, Canada Dr. Jianmin Tang, Productivity and Competitiveness Analysis Directorate, Industry Canada Dr. Theo Toonen, Delft University of Technology & Leiden University, The Netherlands Dr. Tim Wang, Chinese eBusiness Association of Canada (CeBA) Dr. Hong-Xing Wu, Public Health Agency of Canada (Government of Canada) Dr. Guomin Xian, Center for Transnationals’ Studies, Nankai University, China Dr. George Xue, School of Management, Fudan University, China Dr. Zhizhong Yao, Chinese Academy of Social Scienences, P.R. China Dr. Joe Zhao, School of Economics and Management, Northwest University, China
Development & Management
Hugh Dang, Managing Editor Denny Liao, Online Manager Someshwar Rao, Special Editor Karl Sauvant, Editor (Honorary)
Val Samonis, Special Editor (knowledge) Gloria Yuan, Communications Manager Helen Zhang, Consultant Editor Joe Zhao, Associate Editor (China)

Editorial Statement
ii
Copyright and Disclaimer
This journal retains copyright to all published documents in order to circulate as widely as possible the work of those authors selected for the publication. The opinions expressed in this publication are those of the authors and do not necessarily reflect the views of the publisher and relevant partners. While every effort has been made to ensure that the information is accurate, TNCR does not accept any liability for error of fact or opinion present.
Publisher’s Information
ISSN 1918-6444 (Print); 1925-2099 (Online)
Indexes ALJC, AMICUS, EBSCO, EconLit, SSCI/SCI (under review)
Production Printed on acid-free paper (required)
Printing Merriam Print Canada
Acknowledgements
For more information − Visit our Web sites:
www.tnc-online.net, www.tnc-online.org
− Contact us by mail: 58 Rideau Heights Dr. Ottawa, ON K2E 7A6 Canada
To submit an inquiry − Send us an e-mail at: [email protected]
To submit an article − Send us an e-mail at: [email protected]
To subscribe to TNCR (yearly)
− Print only: US$168; Electronic only: US$100 − Print and electronic: US$150

Transnational Corporations Review Volume 3, Number 2 June 2011 www.tnc-online.net [email protected]
TABLE OF CONTENTS
In This Issue ………………….…………….………………………………………….………….…….....I FDI in India
Non-Equity Operation of Multinational Enterprises in India: Focus on Outsourcing Jaya Prakash Pradhan…………………………………...………………………………...…..……….…..….1
DOI: 10.5148/tncr.2011.1110
Location of FDI in India: Some Less-Explored Aspects K.S. Chalapati Rao and M.R. Murthy…………………….…………………………....................................12
DOI: 10.5148/tncr.2011.1111
Korean FDI in India: Perspectives on POSCO-India ProjectJongsoo Park………………………………………………………………………..…….………………..……….22
DOI: 10.5148/tncr.2011.1112
FDI from India India’s Agriculture and Food Multinationals: a First Look
Premila Nazareth Satyanand……………………………………………………………………………..….31DOI: 10.5148/tncr.2011.1113
Technology Sourcing and Outward FDI: Comparison of Chemicals and Information Technology Industries in India
Savita Bhat and K. Narayanan………………………………………………………………………………50DOI: 10.5148/tncr.2011.1114
Outward FDI from India in the United StatesVinod K. Jain……………………………………………………………………….……………………..…...65
DOI: 10.5148/tncr.2011.1115
Economic Liberalisation and Financing Pattern of Indian Acquiring Firms Abroad P.L. Beena……………………………………………………………………………………………………..76
DOI: 10.5148/tncr.2011.1116
Issues in FDI and Internationalization Foreign Equity and Technological Capabilities: a Comparison of Joint-Venture and National Automotive Suppliers
Rajah Rasiah…………………………………………………………………………………………………..87DOI: 10.5148/tncr.2011.1117
Change of Subsidiary Mandates in Emerging Markets: the Case of Danish MNCs in India Michael W. Hansen, Bent Petersen and Peter Wad…………………………………………….……….104
DOI: 10.5148/tncr.2011.1118
Internationalization of India’s Information Technology Sector and its Implications on Market StructureVinoj Abraham…………………………………………….……………………………………………….....117
DOI: 10.5148/tncr.2011.1119
The Role of Networks in the Accelerated Internationalization of Indian FirmsSumati Varma…………………………………………….……………………………………………..…...128
DOI: 10.5148/tncr.2011.1120
Analysis of Cross-Border and Domestic M&A Deals in Technology Sector in India and China Arindam Das and Sheeba Kapil …………………………………………….…………………………..…...148
DOI: 10.5148/tncr.2011.1121 Book Review
How Human Psychology Drives the Economy and Why It Matters for Global Capitalism……..……......164 Call for Submissions Subscriptions
Transnational Corporations Review Volume 3, Number 2 June 2011 www.tnc-online.net, [email protected] I-VI
I
Guest Editorial
Foreign Direct Investment and Development in India
Jaya Prakash Pradhan
Central University of Karnataka & Sardar Patel Institute of Social and Economic Research
Abstract: This editorial introduction provides an overview of different issues and topics analyzed in the present TNCR special issue. Topics surrounding the rise of India as a host to FDI and a home for emerging Indian TNCs are discussed. The special issue makes a significant contribution to the current debate on internationalization of emerging economies like India. Keywords: Emerging economies, India, FDI, TNCs
JEL: O50, F23 1. Introduction The rise of relatively large emerging economies is leading to significant structural transformation of global industries, international institutions and global power arrangements (Pradhan and Lazaroiu, 2011). Accelerated internationalization involving foreign direct investment (FDI) is turning out to be an important medium of these economies’ expanding global influence. Being the sources of higher growth, they are the most sought after destination for global firms from developed countries looking for growth, opportunities and stability of performance. These emerging economies’ share in global FDI inflows has gone up sharply in the past decade with developing and transition economies receiving more than half of global FDI inflows in 2010 (UNCTAD, 2011). Besides, the growth of global firms based in emerging economies is making market competition ever more challenging across sectors and geographies. Outward FDI undertaken by emerging transnational corporations (TNCs) is growing faster as they are on a buying spree of assets and companies abroad. The share of developing and transition economies in global FDI outflows increased to 19 per cent in 2008 and further to 25 per cent in 2009 (UNCTAD, 2010). This changing importance of emerging economies as a host to and source of global FDI flows therefore raises important issues regarding the activities and role of established and emerging TNCs. Among relatively large emerging economies, India represents an interesting case of rapid growth and internationalization witnessed during the past two decades. It achieved the second highest real GDP growth (8.4 per cent) after China (10.1 per cent) during 2006−20101 and became the top ninth host to global FDI inflows in 2009 (UNCTAD, 2010). Although, India lagged behind China in terms of the scale of FDI inflows received (e.g. China received US$95 billion in 2009 as compared to US$34.6 billion of
1 This is among top 15 populated economies and based on the average growth rate obtained from the data on 'Real Historical Gross Domestic Product (GDP) and Growth Rates of GDP for Baseline Countries/Regions (in billions of 2005 dollars) 1969-2010’ available from www.ers.usda.gov.
Foreign Direct Investment and Development in India
II
India), the former outpaced the latter if the intensity of such investment is considered in relation to the gross fixed capital formation of the host country during 2005−2009 (this ratio is 5.9 per cent for China while it is 6.8 per cent for India). Clearly, India turns out to be an attractive emerging economy host for global TNCs seeking new sources of growth, efficiency and low-cost innovation. As the gravity of global growth shifts from developed to emerging markets, it appears that securing a successful presence in a growing emerging economy like India is a crucial strategy of TNCs to ensure their future growth. A stronger domestic demand, pursuance of a liberal policy regime for FDI and opening up of new domestic sectors to foreign operations in India since 1990s seem to have supported this intensifying involvement of global TNCs in India. The internationalization of Indian economy has also assumed even stronger sense with the transformation of a large number of Indian firms into TNCs. The outflows of FDI from India grew by a whopping 119 per cent on annual average during 2000−09 far exceeding that of China at 97 per cent. Similar to the case of inward FDI flows, India falls behind China substantially in terms of the scale of OFDI but outperform by OFDI intensity. In 2009 Chinese OFDI flows stood at US$48 billion as compared to US$15 billion of outflows from India. However, as a per cent of gross fixed capital formation such flows from China averaged 1.8 per cent during 2005−2008 which is nearly half of that relates to India (3.6 per cent). The emergence of Indian multinationals and their expanding profile in global markets through large sized acquisitions and green-field projects abroad may possess implications for a host country’s market structure, capital formation, productivity, technology, employment and trade performance. In the above context, understanding the role of global TNCs in India and Indian TNCs in global markets are clearly crucial issues worthy of analysis and learning. While there are voluminous studies about the Chinese experience, it is only fitting that the study of India should complement the literature on internationalization of emerging economies. The present special issue of the Transnational Corporations Review (TNCR) was imagined precisely to deals with the recent FDI experience of the emerging economy of India. The contributions in the special issue can be broadly grouped under three main headings: ‘FDI in India’, ‘FDI from India’ and ‘Issues in FDI and Internationalization’ each presenting state of the art knowledge, thoughts, assessments and research findings about the operation of TNCs in India and that of Indian TNCs. 2. FDI in India The first part of the special issue reviews some of the emerging subjects related to the operation of foreign firms in India. Special attention is given to the role of non-equity operation of TNCs, locational distribution of their investments, and challenges emanating for operationalizing natural resource-based FDI projects in India. TNC involvements in India is not just limited to equity modes like establishing joint ventures and wholly-owned subsidiaries recently but the same is assuming new forms of non-equity modes like outsourcing, strategic alliances and licensing. Pradhan’s essay is primarily concerned with the outsourcing as an important form of TNC operation in India. While India is well known as an attractiveness destination for outsourcing by global services TNCs, such outsourcing activities of global firms to India in manufacturing is less recognized. In addition to their captive sourcing of raw materials and inputs locally in India, a growing number of MNCs can be observed to have resorted to contract manufacturing from independent
Jaya Prakash Pradhan
III
suppliers in pharmaceuticals and automotive sectors. These emerging non-equity modes of TNC operations can have significant development implications for the host country. Rao and Murthy revisit the analysis of the location of FDI in India. They argue that existing studies on state-wise distribution of FDI in India are mostly based on aggregate flows data and could offer inadequate perspectives into the location choice of foreign firms. However, as the location of FDI is being deeply related to the specific characters of FDI projects such as modes of entry (greenfield vs. acquisitions; joint ventures vs. wholly-owned subsidiaries), nature of the foreign investor, sector of investment, etc. Incorporating these characteristics would yields more illuminating views of regional dimension of FDI distribution in India. Analysis of India shows that FDI inflows have been largely dominated by services and infrastructure projects, equity hikes by existing foreign firms, and takeover of existing companies/units and therefore, relating aggregate FDI flows with state level characteristics such as level of industrialisation, infrastructure development, growth trend, reform-orientation, corruption and quality of governance, is less appropriate. The paper by Park explores host country issues associated with the entry of natural resource-based FDI into India. His analysis of the experience of India’s biggest foreign direct investment (FDI) project, namely the proposed Posco integrated steel plant in Orissa, reveals a complex set of issues from regulatory clearances especially forest and environmental clearances and the socially and politically sensitive issue of land acquisition and displacement. This natural resource-based project has faced long drawn protests by local people against land acquisition and got entangled in environmental concerns and livelihood issues. The delay in the beginning of the project is a clear reflection on the failure of state and local administration in building local consensus about the benefits of it and in addressing effectively the compensation and livelihood issues of the local people being displaced. This would suggests that massive FDI in natural resource sector is required to be facilitated in an holistic environment of consensus building and assurance of new employment in the relocation zone for the displaced population. 3. FDI from India The second part of the special issue raises and discusses issues concerning the rise of Indian TNCs and their outward FDI (OFDI) activities. The study by Nazareth Satyanand provides preliminary account of Indian OFDI in the agriculture and food sector. India provides an interesting example of a rapidly internationalizing economy with a broad-based sectoral OFDI profile (Pradhan, 2011). However, when it comes to agriculture, the emergence of Indian TNCs is of more recent origin. With the consistently growing food prices and relaxation on restrictions on corporate involvement in agriculture during the last decade, a number of Indian firms turn translational. An upsurge of overseas acquisitions by Indian firms can be seen in beverages, tea, crop protection and floriculture. These acquisitions are driven by a multiplicity of firm-specific objectives like access to new technology, products, networks, raw materials, etc. Bhat and Narayanan focuses on the OFDI behaviour of Indian TNCs from chemicals and information technology (IT) sectors. Specifically they examined Indian TNCs investment in their existing affiliates abroad. Their analysis shows that Indian firms from both these sectors are more likely to undertake investment in their foreign affiliates if parent entities are engaged in in-house R&D. In the chemical industry, imports of capital goods and disembodied technologies also play a positive role. This would

Foreign Direct Investment and Development in India
IV
verify that acquisition of technology internally by firms or through external purchase may encourage their OFDI involvements. Firm’s spending on labour is found to be positively related to the OFDI probability and OFDI level of IT and chemical firms respectively. The United States has emerged as the third largest host to Indian OFDI flows during the period April 2000 to March 2009 (Pradhan, 2010). It attracted about US$6.2 billion of FDI accounting for 8.6 per cent of total FDI flows from India. In this context, Jain’s paper is a rich empirical account of the operation of Indian firms in the U.S. through greenfield investments and mergers and acquisitions (M&As). It presents a number of interesting characteristics of Indian FDI in the U.S. that are worth exploring further. Between greenfield investments and M&As, Indian TNCs are observed to prefer the latter while entering the U.S. market and even in M&As they tend to target high-technology, knowledge-intensive manufacturing industries and services, such as pharmaceuticals, automotive and IT. It appears that U.S. bound Indian FDI projects are motivated by the desire to acquire technology and brands and facilitated by the liberal U.S. business environment and opportunities to acquire valuable assets at low valuations. Are Indian acquisitions abroad simply a result of cash-rich Indian firms? Beena’s paper introduces the debate on whether recent foreign shopping of Indian firms is due to their internal resource base. The data presented in the paper pertaining to the period 1991–2009 shows that internal finances constitute about 40 per cent of total resource mobilization by Indian acquiring firms for their business operation. In comparison, the share of external finances reached 60 per cent. Borrowings and resources raised from capital markets played a key role in the financing patterns of these companies. The case studies of selected acquiring Indian TNCs further confirm that these firms have resorted to foreign borrowings and issues of Foreign Currency Convertible Bonds and Foreign Currency Exchangeable Bonds in order to acquire large sized foreign entities. 4. Issues in FDI and internationalization The third part of the special issue contains the remaining set of five papers each offering thoughtful analysis of emerging topics related to India’s experience with internationalization. The essay by Rasiah explores the contribution of joint ventures to the firm-level technological capability building in the rapidly evolving Indian automotive sector. This knowledge-based sector has been significantly liberalized since 1990s and restriction on foreign ownership has been removed. It is to be expected that enterprises with foreign ownership would go for higher local R&D activities given the large size of the host market, stiff competition, stringent quality and regulatory conditions and adequate supply of human capital. The findings on technological performance of a sample of firms from the greater Delhi region do seem to bode well for local innovation. Firm’s overall technological capabilities through human resource practices, process technology and R&D are found to be higher for joint-venture firms with over 10% foreign equity as compared to fully domestic owned firms. The superior performance of firms with foreign equity also hold true at the disaggregated level for human resources and process technology. The contribution by Hansen, Petersen and Wad analyzed the interesting issue of how subsidiary mandates changes with the shifting characteristics of a host emerging economy like India. Unlike the previous period, India has adopted a progressively outward-looking trade and investment regimes since 1990s and considerably liberalized its business environment. Rapid growth of Indian market, access to skilled labour, cost effective production, quality changes in local industry and growing capability of local suppliers have

Jaya Prakash Pradhan
V
positively affected the mandates of Danish subsidiaries in India. These subsidiaries have evolved being small assisting operations with relatively low standing in the global strategy of their parents in 2001, to be assigned with larger and more significant operations in 2008. The impression gathered in the survey suggests that Danish subsidiaries are preparing for increased activities related to after-sales services, R&D expansion and export mandate for regional markets. In his paper Abraham dealt with the changes in the competitive structure and composition of the Indian IT industry among three types of firms distinguished based on the perspective of internationalization. They are the Indian owned IT firms having overseas subsidiaries (Indian TNCs), those Indian firms without such affiliates (Indian domestic firms) and subsidiaries of foreign firms operating in the Indian IT sector (foreign TNCs). Statistics presented in the paper suggests that Indian TNCs, on an average, are larger than foreign TNCs and both these TNCs in turn are larger than domestic Indian IT firms. In addition, there is a secular decline in the share of both foreign TNCs and domestic firms in the industry sales since 2004. Domestic firms constituted about three-fourth of the total number of IT firms but were small in size, least export-oriented and claimed marginal market share. On the contrary, Indian TNCs represented only a small share in the total number of firms (20 per cent) but are export oriented and large sized entities that dominated the Indian IT industry. From this the author argues that there exists a dual industrial structure in the IT sector between Indian TNCs and domestic firms. To understand the internationalization of Indian firms, it is also important to explore the role of business networks that help firms to access critical resources and deal with environmental uncertainty. Varma devoted her attention to the theoretical underpinnings of networks affecting the rise of born global firms from India. Though her main hypotheses remained untested empirically, findings from another study tend to suggest that business ties are important for firm’s internationalization pattern. While dealing with the locational patterns of Indian overaseas M&As, business group (BG) affiliated Indian TNCs are found to be guided by a broader set of considerations than standalone Indian TNCs mainly due to BG’s derived resources and access to parental networks (Pradhan and Sing, 2011). Finally, the article by Das and Kapil delves into the characteristics of M&A transactions involving Indian and Chinese companies in the technology sector comprising of computer and electronic manufacturing, IT, telecommunication, media, and professional, scientific and technical services. Empirical results suggest that while outbound M&A deals from India and China are not significantly different, domestic and inbound deal types in these two countries are significantly different. It is found that in most cases Indian and Chinese TNCs opted for similar acquisition strategy, namely acquisition of controlling stake. 5. Concluding remarks In closing, it is our hope that this special issue of TNCR offers reader with new insights and perspectives for understanding the current and emerging trends in India’s FDI experience. The variety of issues discussed and analyzed for India may also be useful and relevant for other emerging economies.

Foreign Direct Investment and Development in India
VI
Reference Pradhan, J.P. (2010) ‘Emerging Multinationals from India and China: Origin, Impetus and Growth’ in H. Esho and P.
Xu (eds.) International Competitiveness, Globalization and Multinationalization of Firms: A Comparison of China and India, Institute of Comparative Economic Studies, Hosei University, Tokyo, Japan, pp. 95–135.
Pradhan, J.P. (2011) ‘Emerging Multinationals: A Comparison of Chinese and Indian Outward FDI’, International
Journal of Institutions and Economies, 3(1), pp.113–148. Available at http://ijie.um.edu.my/RePEc/umk/journl/v3i1/Fulltext6.pdf
Pradhan, J.P. and G. Lazaroiu (2011) ‘Rise of Emerging Economies: An Introduction’, Economics, Management,
and Financial Markets, 6(1), pp. 8–18. Pradhan, J.P. and N. Singh (2011) ‘Business Group Affiliation and Location of Indian Firms’ Foreign Acquisitions’,
Journal of International Commerce, Economics and Policy, 2(1), pp. 19–41. DOI: 10.1142/S1793993311000208, available at: http://www.worldscinet.com/jicep/02/0201/S1793993311000208.html
UNCTAD (2010), ‘World Investment Report 2010: Investing in a Low-Carbon Economy’, New York and Geneva:
United Nations. UNCTAD (2011), ‘Global and Regional FDI Trends in 2010’, UNCTAD Global Investment Trends Monitor 5, New
York and Geneva: United Nations. Acknowledgement I am highly thankful to Professor Hugh Deng for putting forward the idea of the TNCR special issue on India and kindly inviting me to be its special editor. The present shape of the special issue largely owes to his unstinting support and constant pursuance. I am also indebted to my distinguished colleagues―Vinoj Abraham, Aradhna Aggarwal, Amita Shah, P.L Beena, Nandita Dasgupta, Ranjan Kumar Dash, Elumalai Kannan, Santosh Kumar, Premila Nazareth Satyanand, S. Puttaswamaiah, Subhas Sasidharan, Sumati Varma, and Mohammad Zohair for accepting the role of anonymous referee and helping this special issue achieve the present scholarly standards.
Transnational Corporations Review Volume 3, Number 2 June 2011 www.tnc-online.net, [email protected], DOI:10.5148/tncr.2011.1110 1-11
1
Non-equity Operation of Multinational Enterprises in India Focus on Outsourcing
Jaya Prakash Pradhan1
Abstract: The development policy literature on multinational enterprises (MNEs) is yet to adequately analyze the emerging cross-border activities of MNEs through emerging modes of non-equity operation like international outsourcing. As a result of accelerating globalization process and growing trend of vertical disintegration of value-chains, MNEs and their foreign affiliates are increasingly sourcing raw materials, intermediates, parts and services from independent suppliers based in emerging and developing economies like India. It is, therefore, necessary that host countries like India should appreciate this non-equity operation of MNEs and formulate suitable policies for enhancing their development impacts. Keywords: MNEs, foreign affiliates, non-equity modes, outsourcing, India JEL classification: F23, L24, N65 1. Introduction Multinational enterprises (MNEs) are key players in the growth of global business and their role has only increased during the last two decades of globalization. They dominate the world markets by a network of affiliates located across different countries with inter-affiliates flows of investment, trade and technology and their non-affiliate business transactions. The growing trends of international outsourcing and offshoring in the global value chain of goods and services are clearly changing the operative functions of MNEs in the global business. MNEs involvements in a host country is assuming a complex combination of equity modes like establishing wholly-owned subsidiaries and joint ventures and various non-equity modes like international subcontracting, licensing, franchising, management contracts, etc. (UNCTAD, 2010). MNEs are outsourcing their business functions over the value chain hitherto done in-house to companies based overseas. In addition to the captive offshoring, such activities are increasingly being rendered by external suppliers in the host economy. It is not just the parent MNEs that are relying on overseas outsourcing but their affiliates operating in the host country are likely to depend on purchasing of local intermediate and raw materials for their operation. That means that the parent MNE and its network of foreign affiliates are adopting the tool of strategic outsourcing to reduce cost, improve quality and competitiveness. Their choice of outsourcing can be at any level like low-skilled labuor-intensive tasks, manufacturing of a product or a component, R&D and logistics depending upon the business environment and comparative advantages of a host country and capabilities of host local firms.
1 Acknowledgement: This paper has been prepared for the UNCTAD Expert Meeting on World Investment Report 2011, Geneva, February 15, 2011.
Non-equity Operation of Multinational Enterprises in India Focus on Outsourcing
2
In addition, MNEs are entering into strategic alliances with local companies for joint R&D or product development and marketing arrangements. Sometime they are sourcing technologies for niche products from local firms in a host country. For a host country promoting or facilitating such non-equity operation of MNEs can be critical for improving technological efforts of local firms and exports in the global value chain. Therefore issues of what determine MNEs outsourcing and other non-equity operation to a host country at macro, sectoral and firm-level is a critical policy issue. In this brief note, we document outsourcing to India by global MNEs for selected industries and explore on the key determinants of such process. Due to paucity of information at the economy level, we will also supplement the analysis by presenting data on the sourcing of local raw materials and intermediates by foreign affiliates operating in India. 2. Outsourcing and MNE: a theoretical view As outsourcing shifts outside some activities internal to the firm, it can be seen as a process of redrawing the boundary of it (Coombs and Battaglia, 1998). In the transaction cost theory, the boundary of a firm gets larger if the transaction costs of using markets for its activities are greater than the costs of performing in-house, reflecting greater levels of uncertainty, frequency and asset specificity (Williamson, 1985; Holmstrom and Roberts, 1998). Within the firm production by integration is more optimal in this situation and the firm will bypass the market. However, firms’ make or buy decision are not independent of the dynamics of the evolution of industries or value chain structures. The emergence of specialist departments representing different parts of the value chain within a single organization (i.e. intraorganizational boundaries) and the associated learning process ultimately pave the use of a market (Jacobides, 2005). According to Jacobides, the simplification and minimization of the coordination between the adjoining stages along a value chain and standardization of information and ease of their transfer finally led to the creation and growth of intermediate markets. Vertically specialized firms are driving the disintegrated industry structure with significant value creation in the form of gains from specialization and trade. The rise of the vertically disintegrated value chains can significantly alter the modes of global operation by an MNE. It allows MNEs to adopt new forms of interaction with their host countries in addition to establishing affiliated units like wholly owned subsidiaries and joint ventures. An MNE can source services and inputs from unaffiliated foreign suppliers or resort to procurement from their affiliated overseas ventures. When MNEs prefer offshore external sourcing of inputs due to existence of specialized suppliers they have little need to do FDI for sourcing abroad. Therefore, there is a trade-off between FDI to procure inputs in a host country and outsourcing (Grossman and Helpman, 2003) and given the standardization of information (Jacobides, 2005), MNEs are likely to opt for outsourcing from efficient local suppliers. Clearly, MNEs involvements in host input markets is likely to be more in the form of non-equity modes (i.e. outsourcing) than FDI. 3. MNE outsourcing in India In the last two decades, India has emerged as an attractive destination for global outsourcing in many areas of service and manufacturing sectors. India ranked the top attractive outsourcing destination in the A.T. Kearney Global Services Location Index (GSLI) throughout during 2004–2011 (Figure 1). The most important locational advantage that India enjoys over her competitors is on the category of

people skcumulativadvantageimprovemsector arecompanieIndian adv As per t(NASSCOcent in 20ITeS-BPO2010 (DeFortune 5century aInterestinggrowth inmode of MPhilippinecentres, co MNE outthe manufpharmaceincidents emerging
Source: B
2 Internation
February 43 NASSCOM
www.nass
kills and avaive business pe of English
ment in telecoe all contribues in moving vantage as a l
the informatOM), India’s 0092. About O (Informatiopartment of I00 were outs
and this propgly, this incrn sourcing frMNE operatioes, Indonesiaost advantage
sourcing in Ifacturing sectuticals and auof internationas important
Based on AT. K
nal Businesss Tim4. M (undated) ‘Indscom.in/downloa
ilability (Figurocess experilanguage (A
ommunicationuting to the
up the valuleader in serv
tion from thshare in the g25 per cent o
on TechnologInformation Tourcing their portion increreasing MNEom third-paron (Reuters, 2
a and Vietname and strategic
India is not cotor now coverutomotives tonal outsourcinform of MNE
Kearney global Figure 1.
mes (2011), ‘Ind
dian IT Industry–ad/IndianITIndu
Jaya Pra
ure 2). It repience and ski
A.T. Kearney,n infrastructur
global attracue chain whilvices outsourc
he National global outsouof the Indiangy Enabled STechnology, software req
eased to arouE outsourcingrty service pr2009). Moreom are catchinc government
onfined to thrs a wide rano low-technolng vary considE operation in
services locatiGlobal servic
dia's share in glo
– A Success Stoustry.doc; www.e
kash Pradha
presents Indiaills and a larg, 2004; Chanre and proactictiveness of le maintainincing.
Association urcing marketn software anServices- Bus
2010). Abouquirements to und two-thirg trend to Inroviders thanover, other emng up with It efforts.
he services senge of activitilogy productsderably amonn India.
ion index, varies location ind
obal outsourcing
ory’, accessible aescindia.com/htm
an
a’s first movge pool of ednda, 2008). Live governmeIndia. The a
ng their low-
of Softwart rose to 55 pd services exiness Process
ut one-third oIndia in the e
rds in the landia is assocn captives immerging econoIndia due to
ector alone. Gies from knows like apparelng different m
ous years dex, 2004–201
market rises to
at mlsite/AboutUs.
ver advantageducated manpLow cost of ent policies foattempt of Incost arbitrag
re & Servicer cent in 201
xports is conts Outsourcingf the global early half of tatter half of iated with re
mplying growiomies like Chmaturing of
Global firms’ wledge-based l and footwea
manufacturing
11
55 pct in 2010, s
aspx?Id=35
e in possessinpower with thskilled labouor the softwandian softwae is furtherin
es Companie10 from 51 ptributed by thg) segments firms from ththe twenty-firf the decadeelatively fasting non-equihina, Malaysif their service
outsourcing d industries likar. Though thg activities, it
says Nasscom’,
ng he ur, are re ng
es er he in he rst 3 .
ter ty ia, es
in ke he is

N
Source: Ba
Figure Pharmac Internationcompaniesterm comproducers manufactu(InternatioGood Manregulatorysuppliers clinical tri A large noutsourcinfrom RanbRanbaxy Chemical As per thSchwarz P The U.S. Mwith Lupinproducts t
4 India Info
(2003), ‘PIndia for c
5 Ranabxy (Release, Ju
6 Hindu Bus
Non-equity O
ased on AT. Ke 2. Category-w
ceuticals
nal contract ms in the 1990
mpetitiveness of active ph
uring capabilonal Organizanufacturing P
y bodies fromfor MNEs in
ials, data man
number of Mng deals can bbaxy in 1993to acquire tEntity RBx-2
he agreement Pharma.
MNE, DSM n Limited whto DSM und
oline (2000), ‘CPharma outsourccost managemen(2002) ‘Ranbaxyune 27.
siness Line (2005
Operation of
earney global swise average l
manufacturin0s (Pradhan, 2
and create eharmaceuticalities approveation for StanPractices), U.Sm other coun contract m
nagement and
MNEs have rbe elaborated. In June 200
the exclusive2258 for the tRanbaxy wo
Anti-Infectivhere the Indiaer the allianc
Contract Manufa
ing: The next bnt’, August 6. y and Schwarz P
5), ‘Lupin signs
Multinationa
services locatiolocational attr
ng emerged a2006). Pharmeconomic valal ingredients,ed by intern
ndardization) S. FDA’s (F
untries, Indianmanufacturingd laboratory se
resorted to cd here. The U.02, Schwarz Pe rights of dtreatment of B
ould manufac
ves, entered inn entity is to ce6. In the sa
acturing: Growthbig thing’, Augu
Pharma Sign a D
pact with DSM’
al Enterprise
4
on index, varioractiveness sco
as an importamaceutical MN
lues by outs, raw materinational qualicertificationsood and Drugn pharmaceu
g as well as ervices4.
contract man.S. MNE Eli Pharma AG odeveloping, mBenign Prost
cture and sup
nto a supply asupply the acame year, Lu
h Engine for Inst 25; India Bra
eal to Develop N
’, September 3.
es in India Fo
ous years. ore in services
ant growth mNEs realized tourcing fromials and bulkity and regu, WHO’s GMg Administrautical compacontract serv
nufacturing frLilly started
of Germany amarketing antate Hyperplapply finished
and marketingctive pharmacupin had ano
ndian Pharma Cand Equity Foun
New Drug to Tre
ocus on Out
s offshoring du
model for Indithat they can
m worlds’ onk drugs. Wi
ulatory standaMP (World He
tion) current anies turn ouvices like m
rom India busourcing Cefaannounced a lnd distributinsia in USA, Jformulations
g agreement iceutical ingredther marketin
ompanies?’, Aundation (2004), ‘
eat Benign Prost
tsourcing
uring 2004–20
ian pharmacen harness theirne of the cheith their lowards like theealth OrganizGMP (cGMP
ut to be attrmarketing, res
ut cases of afaclor intermelicensing deag Ranbaxy's Japan and Eus of the prod
in Septemberdient for a ranng agreement
ugust 16; Equity‘Pharma MNCs
tate Hyperplasia
011
eutical r long eapest
w cost e ISO zation-P) and ractive earch,
a few ediates al with
New urope5. duct to
r 2005 nge of t with
ymaster turn to
’, Press
Jaya Prakash Pradhan
5
GlaxoSmithKline (GSK) to manufacture and supply certain fixed dose combinations of tuberculosis drugs to GSK for marketing in the Philippines7. In December 2003, Nicholas Piramal got a five-year outsourcing deal from Advanced Medical Optics Inc. of the US. As per the deal, Nicholas Piramal will supply the opthalmic products to the American company for developed markets like the US, Europe and Japan. The Indian company expected additional annual revenue in the range of around $15–25 million from this contract manufacturing arrangement8. The year 2004 has seen Nicholas Piramal entered into two new custom manufacturing agreements with two US drug companies, which are expected to add $30 million revenues per annum9. One contract deal is from Allergan Inc of the US to whom Nicholas Piramal would supply two eye-related, anti-glaucoma active pharmaceutical ingredients, namely Levobunolol and Brimonidine. In November 2005, AstraZeneca AB, Sweden, signed a development and know-how agreement with Nicholas Piramal. As per this agreement, Nicholas Piramal is chosen as a partner in development of processes for the manufacture of intermediates, active ingredients or bulk drugs for supply to AstraZeneca10. In December 2005, a long-term contract manufacturing agreement between Pfizer International LLC and Nicholas Piramal was signed for animal health products11. Under this agreement, Nicholas Piramal will develop processes for Pfizer, provide scale-up batches for Phase trials and contract manufacture after the product is launched. In the first case of a patented molecule to be manufactured in India on a contract basis, Solvay Pharmaceuticals of Netherlands signed its contract manufacturing agreement with Dishman Pharmaceuticals in 2001 for production and supply of an active ingredient of an anti-hypertension drug, Teveten. The contract was for eight years with an estimated value of more than $10 million12. Since then Dishman is providing contract services to a growing number of global pharmaceutical firms including AstraZeneca, GlaxoSmithKline and Merck. In July 2005, Dishman entered into an agreement with NU SCAAN of the UK to develop and manufacture bulk actives for nutraceutical products of NU Scaan13. Shasun Chemicals and Drugs another Indian company chosen by MNEs for contract manufacturing, was found to derive nearly 12 per cent of its turnover from contract research and manufacturing business in the third quarter that ended on December 200514. The the US-based company, Austin Chemical, entered into a joint venture with Shasun in December 1999 for joint process development and custom manufacturing to serve multinational pharmaceutical companies operating in the regulated American market. In June 2004, Shasun achieved a strategic partnership with another US firm, Eastman Chemical, to collaborate on the development and manufacture of performance chemicals for the pharmaceutical industry15. In May 2005, US firm Codexis and Shasun entered into a manufacturing and supply agreement under which Shashun will manufacture the intermediate for a generic drug and Codexis will market the products worldwide to
7 Hindu Business Line (2005), ‘Lupin joins hands with GSK to market TB drugs in Philippines’, October 25. 8 Financial Express (2003), ‘NPIL In Outsourcing Deal With Advanced Medical Optics’, Wednesday, December 10. 9 Hindu Business Line (2004), ‘NPIL inks two custom mfg contracts’, November 04. 10 Express Pharma (2005), ‘AstraZeneca, Nicholas Piramal clinch R&D pact’, 16-30 November. 11 Hindu Business Line (2005), ‘NPIL-Pfizer deal on animal health products’, Dec 27. 12 Hindu Business Line (2001) ‘Dishman inks supply pact with Dutch co’, March 22. 13 Express Pharma (2005) ‘Dishman Pharma enters into an agreement with NU SCAAN, UK’, July 05. 14 Hindu Business Line (2006) ‘Shasun Chemicals net up 43 pc’, Saturday, Jan 21. 15 Hindu Business Line (2004) ‘Shasun, Eastman Chemical in tie-up — To make performance chemicals for pharma cos’,
Wednesday, Jun 16.
Non-equity Operation of Multinational Enterprises in India Focus on Outsourcing
6
the generic pharmaceutical industry16. Shasun also had other strategic partnerships for supplying ranitidine (anti-ulcer drug) and ibuprofen (anti-inflammatory pain reducer) to the US-based Apotex and for anti TB drugs with Eli Lilly. Automotives The Indian automotive industry is also turning out to be another centre for outsourcing by automotive MNEs. According to the online data released by the Automotive Component Manufacturers Association of India (ACMA), the auto component segment of the industry had grown nearly 19 per cent per annum in terms of production during 2000–09 and exports accounted for about 18 per cent of Indian auto component output in the same period17. Again in this industry, India offers MNEs the advantage of sourcing from low cost auto component suppliers possessing the globally preferred industry-specific quality standards. Singh (2010) noted that two-thirds of the ACMA members are ISO/TS-16949 accredited and some of them possessed more than one quality management system accredits. Most of the vehicle MNEs operating in India through local subsidiaries shows a strong preference for local component sourcing. Take for example the cases of Japanese MNEs like Maruti, Toyota, and Nissan and the U.S. MNEs like Ford Motor Company. The crucial role of Maruti (then a joint venture with Government of India) during the 1980s in establishing a chain of subcontracting for component manufacturing in India with a supportive vendor development programme is well documented in the literature (Suneja, 2000). For this Japanese MNE the use of local components account for as high as 90 per cent of the total components for manufacturing of its cars in India. Maruti has played a very important role in the technological developments of Indian auto component suppliers. The Indian subsidiary of Toyota Motor Corporation, Toyota Kirloskar Motor (TKM), currently sources components from some 67 domestic suppliers and is planning to expand its supplier base to 101 when the production of its model Etios starts in India18. Another Japanese MNE Nissan Motor Company sources auto components from India through its Indian subsidiary Nissan Motor (India) Limited for local production as well as its production units in China, Japan and Thailand. As per the company source, it has a target of sourcing components worth $25-30 million from India during 2010-1119. Similar to Maruti, Ford India’s model the Ikon has an indigenisation level close to 90 per cent. It had a supplier base of 100 in 2003. In addition to its own procurement of local components, in January 2003 Ford India Limited selected about 7 local suppliers to supply components to the parent’s subsidiaries elsewhere20 . The company also extended help to its Indian suppliers to earn Q1 quality certification so that the latter becomes eligible to supply to any of the Ford affiliates across the globe. As per the newspaper report, the Fiat Group Purchasing and General Motors are targeting sourcing of auto components worth $1 billion each from India and Ford is looking at Indian components purchase worth $500 million for its world-wide operations21.
16 Hindu (2005), ‘Shasun Chemicals pact with Codexis of U.S.’, Thursday, May 12. 17 Industry data is available here: http://www.acmainfo.com/#stat 18 Financial Express (2010), ‘Toyota to widen supplier base after Etios launch’, June 10. 19 Hindu Business Line (2010), ‘Nissan revises parts-sourcing target from India to $30 m’, December 12. 20 Hindu Business Line (2003), ‘India to become component sourcing base for Ford’, January 28. 21 Financial Express (2009), ‘Auto parts sourcing from India on a steady upswing’, October 17.

4. Trend As emphamotivatingbut their creation. strengthen However, MNEs is India. As affiliates osection, a purchase o The studyCentre forforeign mlatest year Figure 3 smanufactuhas been oand then rtotal manu2000–08. given that
ds and patt
asized before,g them to extforeign subsThe rise of
n the process
the data on not readily aa result, a n
operating in similar exerof local raw m
y has draws upr Monitoring
manufacturing r information
summarizes turing during on the rise in reached to $1ufacturing enNevertheless
t foreign affili
terns of loc
the fragmentternalize theisidiaries are cost efficienof local sourc
the exact extavailable for number of sta host countrrcise has beematerials has b
pon a sampleIndian Econoaffiliates couon the firm-l
the trends in 1991–2008. Tthe last two
12 billion in nterprise spens, this share oiates constitut
Jaya Pr
cal sourcing
tation of valur upstream analso adopting
nt and qualitycing by MNE
tent of total many host c
tudies have ary (Giroud an
en undertakenbeen presente
of 8369 Indiomy (CMIE).uld be identifievel foreign e
the size of loThe spendingdecades. It in2008. In the
nding on locaof foreign firmte about just 7
rakash Prad
7
g by MNE
ue chains has nd downstreag outsourciny intermedia
Es.
outsourcing (countries and analyzed the nd Mirza, 20n for India aned.
ian manufactu. Out of the tofied based onequity particip
ocal raw matg by foreign ncreased from1990s, foreig
al raw materiams in all firm7 per cent of t
han
affiliates i
changed the bam functions.g model for te suppliers
(i.e. captive aparticularly local inputs
006; Giroud, nd statistics
uring firms frotal number othe CMIE grpation.
erial sourcingmanufacturin
m $4.7 billiongn firms accoals; the ratio ms spending othe total of nu
n Indian m
boundary of t. It is not just
reaping the in a host co
and standalonso for emergsourcing beh
2007; De Beon the size o
rom the Prowof sample firmroup classifica
g by foreign ng firms on ln in 1991 to $ounted for abslightly fell ton local mateumber of firm
manufactur
the global firmt the parent Mbenefits of
ountry is like
ne outsourcinging countriehaviour of fo
eule, 2009). Iof MNE affil
wess database ms, a subset oation and ava
affiliates in Ilocal raw mat$7.4 billion inbout 15 per cto 13.5 per cerials is signi
ms in the samp
ring
ms by MNEs value
ely to
ng) by es like oreign In this liates’
of the of 566 ailable
Indian terials
n 2000 ent of
cent in ificant ple.
N
Source: BaF
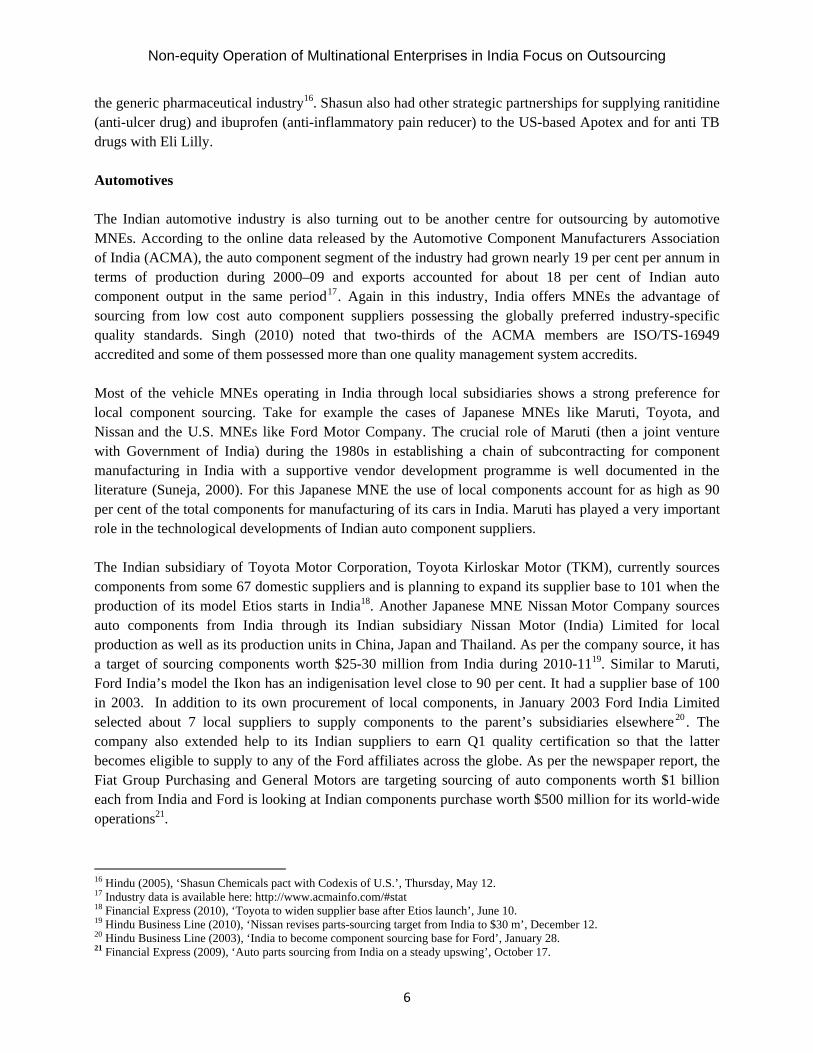
As the fomaterials in the totadone by fo In the caslocalized flocally in While theduring 20foreign firthan whatmore thanand more foreign firwith local
Source: Ba
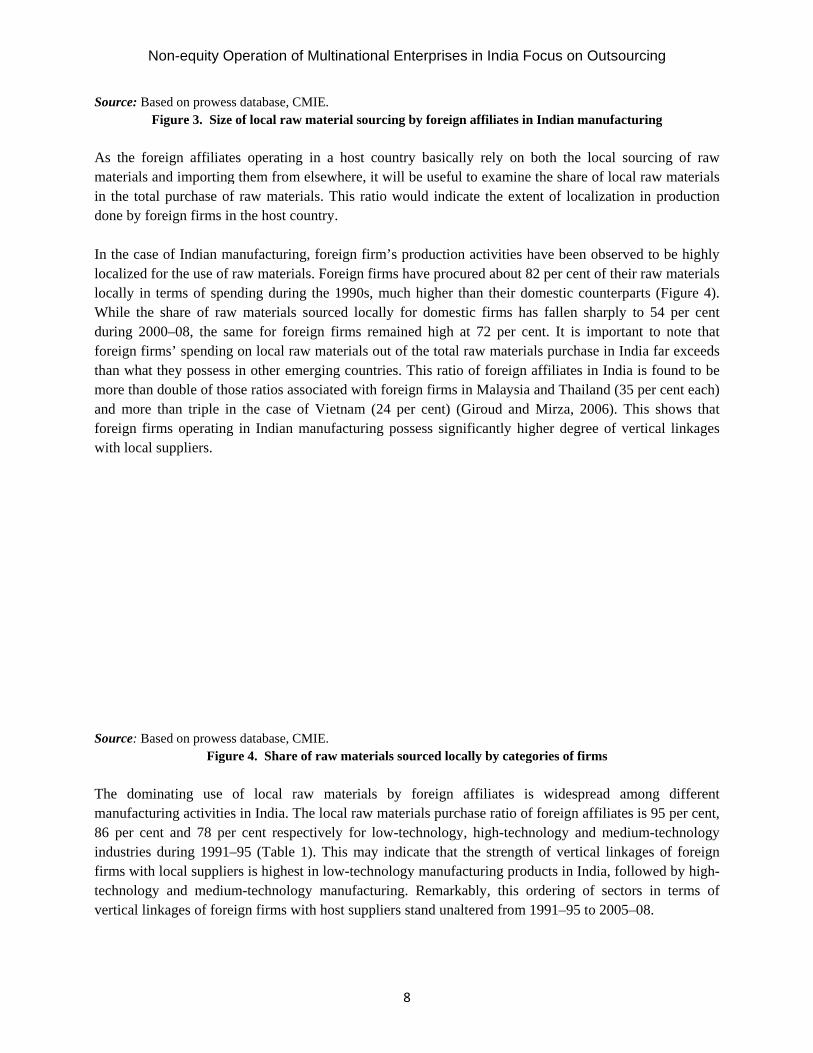
The dommanufactu86 per ceindustries firms withtechnologvertical lin
Non-equity O
ased on prowesFigure 3. Size
oreign affiliatand importingal purchase ooreign firms i
e of Indian mfor the use ofterms of spe
e share of raw000–08, the srms’ spendingt they possessn double of th
than triple irms operatingl suppliers.
ased on prowesFigu
minating use uring activitient and 78 peduring 1991
h local suppliey and mediunkages of fore
Operation of
ss database, CMe of local raw
tes operating g them from
of raw materiin the host cou
manufacturingf raw materialending duringw materials ssame for foreg on local raws in other emeose ratios assin the case og in Indian m
ss database, CMure 4. Share o
of local rawes in India. Ther cent respec–95 (Table 1ers is highest um-technologeign firms wi
Multinationa
MIE. material sour
in a host coelsewhere, it als. This ratiountry.
g, foreign firmls. Foreign firg the 1990s, msourced localeign firms remw materials ouerging countrsociated with f Vietnam (2
manufacturing
MIE. of raw materia
w materials he local raw mctively for lo1). This may in low-techn
gy manufactuith host suppl
al Enterprise
8
rcing by foreig
ountry basicawill be usefuo would indi
m’s productiorms have procmuch higher lly for domesmained high ut of the totalries. This ratiforeign firms
24 per cent) g possess sign
als sourced loc
by foreign materials purcow-technology
indicate thatnology manufauring. Remarkiers stand una
es in India Fo
gn affiliates in
ally rely on bul to examine cate the exte
on activities hcured about 8than their dostic firms haat 72 per ce
l raw materiao of foreign a
s in Malaysia (Giroud and nificantly hig
cally by categ
affiliates ischase ratio ofy, high-technt the strengthfacturing prodkably, this oaltered from 1
ocus on Out
n Indian manu
both the locathe share of lnt of localiza
have been obs2 per cent of
omestic counts fallen sharp
ent. It is impals purchase inaffiliates in Inand ThailandMirza, 2006
gher degree o
ories of firms
s widespreadf foreign affilinology and mh of vertical lducts in India,ordering of se1991–95 to 20
tsourcing
ufacturing
al sourcing olocal raw matation in produ
served to be htheir raw matterparts (Figuply to 54 pe
portant to notn India far exndia is found
d (35 per cent 6). This showof vertical lin
d among difiates is 95 per
medium-technlinkages of fo, followed byectors in term005–08.
of raw terials uction
highly terials
ure 4). r cent te that xceeds d to be
each) ws that nkages
fferent r cent,
nology oreign
y high-ms of
Jaya Prakash Pradhan
9
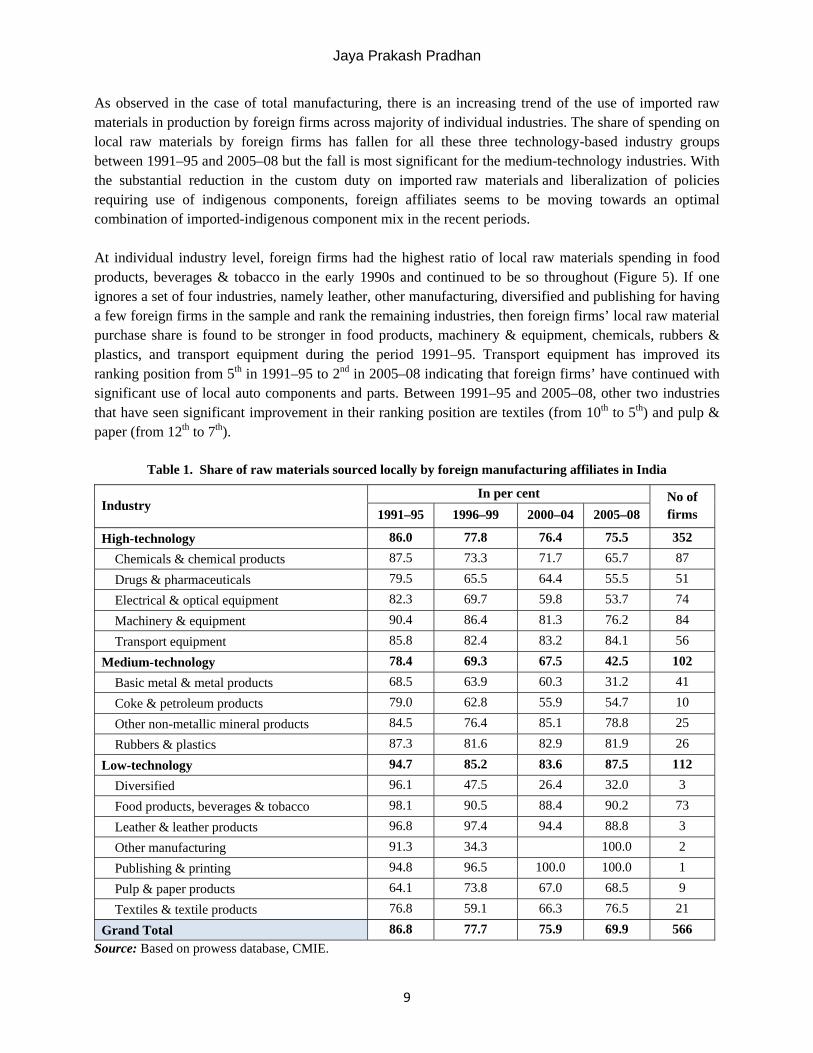
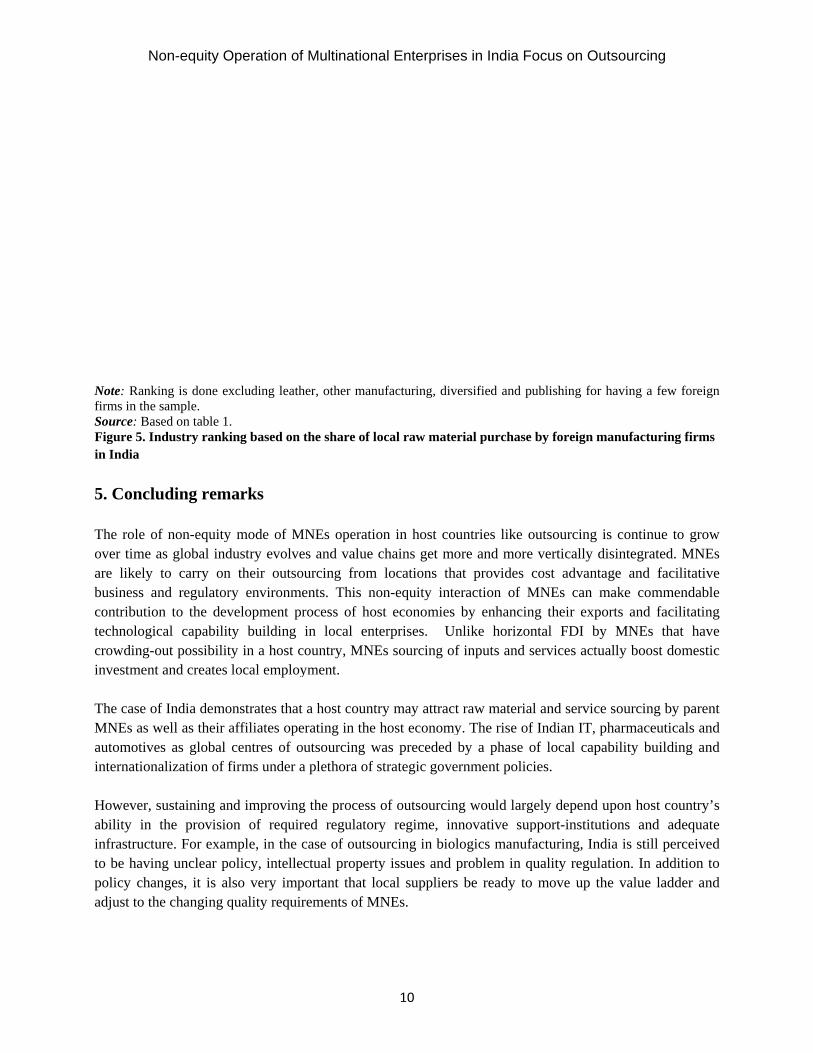
As observed in the case of total manufacturing, there is an increasing trend of the use of imported raw materials in production by foreign firms across majority of individual industries. The share of spending on local raw materials by foreign firms has fallen for all these three technology-based industry groups between 1991–95 and 2005–08 but the fall is most significant for the medium-technology industries. With the substantial reduction in the custom duty on imported raw materials and liberalization of policies requiring use of indigenous components, foreign affiliates seems to be moving towards an optimal combination of imported-indigenous component mix in the recent periods. At individual industry level, foreign firms had the highest ratio of local raw materials spending in food products, beverages & tobacco in the early 1990s and continued to be so throughout (Figure 5). If one ignores a set of four industries, namely leather, other manufacturing, diversified and publishing for having a few foreign firms in the sample and rank the remaining industries, then foreign firms’ local raw material purchase share is found to be stronger in food products, machinery & equipment, chemicals, rubbers & plastics, and transport equipment during the period 1991–95. Transport equipment has improved its ranking position from 5th in 1991–95 to 2nd in 2005–08 indicating that foreign firms’ have continued with significant use of local auto components and parts. Between 1991–95 and 2005–08, other two industries that have seen significant improvement in their ranking position are textiles (from 10th to 5th) and pulp & paper (from 12th to 7th).
Table 1. Share of raw materials sourced locally by foreign manufacturing affiliates in India
Industry In per cent No of
firms 1991–95 1996–99 2000–04 2005–08
High-technology 86.0 77.8 76.4 75.5 352 Chemicals & chemical products 87.5 73.3 71.7 65.7 87 Drugs & pharmaceuticals 79.5 65.5 64.4 55.5 51 Electrical & optical equipment 82.3 69.7 59.8 53.7 74 Machinery & equipment 90.4 86.4 81.3 76.2 84 Transport equipment 85.8 82.4 83.2 84.1 56
Medium-technology 78.4 69.3 67.5 42.5 102 Basic metal & metal products 68.5 63.9 60.3 31.2 41 Coke & petroleum products 79.0 62.8 55.9 54.7 10 Other non-metallic mineral products 84.5 76.4 85.1 78.8 25 Rubbers & plastics 87.3 81.6 82.9 81.9 26
Low-technology 94.7 85.2 83.6 87.5 112 Diversified 96.1 47.5 26.4 32.0 3 Food products, beverages & tobacco 98.1 90.5 88.4 90.2 73 Leather & leather products 96.8 97.4 94.4 88.8 3 Other manufacturing 91.3 34.3 100.0 2 Publishing & printing 94.8 96.5 100.0 100.0 1 Pulp & paper products 64.1 73.8 67.0 68.5 9 Textiles & textile products 76.8 59.1 66.3 76.5 21
Grand Total 86.8 77.7 75.9 69.9 566 Source: Based on prowess database, CMIE.
N
Note: Rankfirms in theSource: BaFigure 5. Iin India 5. Concl The role oover time are likelybusiness acontributiotechnologcrowding-investmen The case oMNEs as automotivinternation However, ability in infrastructto be havipolicy chaadjust to t
Non-equity O
king is done ee sample. ased on table 1Industry rank
luding rem
of non-equityas global ind
y to carry onand regulatoron to the devical capabilit-out possibilitnt and creates
of India demowell as their
ves as global nalization of f
sustaining anthe provisio
ture. For examing unclear panges, it is ahe changing q
Operation of
xcluding leath
. king based on t
marks
y mode of Mdustry evolven their outsoury environmevelopment prty building ty in a host clocal employ
onstrates that affiliates opecentres of ou
firms under a
nd improvingon of requirmple, in the c
policy, intelleclso very impquality requir
Multinationa
her, other manu
the share of lo
MNEs operatioes and value curcing from ents. This norocess of hosin local enteountry, MNE
yment.
a host countrrating in the hutsourcing w
a plethora of s
g the process ed regulatorycase of outsouctual propertyortant that lorements of MN
al Enterprise
10
ufacturing, div
ocal raw mate
on in host couchains get molocations tha
on-equity intest economies erprises. Un
Es sourcing of
ry may attracthost economy
was preceded strategic gove
of outsourciny regime, inurcing in bioly issues and pocal suppliersNEs.
es in India Fo
versified and pu
erial purchase
untries like oore and moreat provides ceraction of Mby enhancin
nlike horizonf inputs and s
t raw materiay. The rise ofby a phase o
ernment polic
ng would largnnovative suplogics manufproblem in qs be ready to
ocus on Out
ublishing for h
by foreign ma
outsourcing ise vertically dicost advantag
MNEs can mng their expontal FDI by services actua
l and service f Indian IT, phof local capabies.
gely depend upport-institutifacturing, Indiquality regulat move up the
tsourcing
having a few f
anufacturing
s continue to isintegrated. Mge and facili
make commenrts and faciliMNEs that
ally boost dom
sourcing by pharmaceuticability buildin
upon host couions and adeia is still perction. In addite value ladde
foreign
firms
grow MNEs itative ndable itating
have mestic
parent als and ng and
untry’s equate ceived tion to er and
Jaya Prakash Pradhan
11
Reference A.T. Kearney (2004), Making Offshore Decisions, Chicago: A.T. Kearney, Inc. Chanda, R. (2008), ‘India and Services Outsourcing in Asia’, Singapore Economic Review, 53(3), pp. 1–29. Coombs, R. and P. Battaglia (1998), ‘Outsourcing of Business Services and the Boundaries of the Firm’, CRIC
Working Paper, No. 5, Centre for Research on Innovation and Competition, Manchester: University of Manchester. De Beule, F. (2009), ‘Sourcing of multinational enterprises in China’, Paper presented at the Annual Research
Center for International Economics (RCIE) Conference 2009, University of International Business and Economics, Beijing, June 22–23.
Department of Information Technology (2010), Annual Report 2009–10, Ministry of Communications & Information Technology, New Delhi: Government of India.
Giroud, A. (2007), ‘MNEs vertical linkages: The experience of Vietnam after Malaysia’, International Business Review, 16(2), pp.159–176.
Giroud, A. and H. Mirza (2006), ‘Factors determining supply linkages between transnational corporations and local suppliers in ASEAN’, Transnational Corporations, 15(3), pp. 1-34.
Grossman, G.M., and E. Helpman, (2003), ‘Outsourcing versus FDI in Industry Equilibrium’, Journal of European Economic Association 1(2–3), pp. 317–327.
Holmstrom, B. and J. Roberts (1998), ‘The Boundaries of the Firm Revisited’, Journal of Economic Perspectives, 12(4), pp. 73–94.
Jacobides, M.G. (2005) ‘Industry Change through Vertical Disintegration: How and Why Markets Emerged In Mortgage Banking’, Academy of Management Journal, 48(3), 465–498.
Pradhan, J.P. (2006), ‘Global Competitiveness of Indian Pharmaceutical Industry: Trends and Strategies, ISID Working Paper, No.2006/05, New Delhi: Institute for Studies in Industrial Development.
Reuters (2009), ‘Captives in India: Is the honeymoon over?’, November 3, available at: http://in.reuters.com/article/2009/11/03/idINIndia-43637520091103.
Singh, N. (2010), ‘Adoption of industry-specific quality management system standards: determinants for auto component firms in India’, International Journal of Productivity and Quality Management, 5(1), pp. 88-107.
Suneja, J.S. (2000), ‘TNC-SME Co-operation: The Experience of India’, in UNCTAD (eds.) TNC-SME Linkages for Development: Issues-Experiences-Best Practices, pp. 85-97, New York and Geneva: United Nations.
UNCTAD (2010), World Investment Report 2010: Investing in a Low-carbon Economy, New York and Geneva: United Nations.
Williamson, O. (1985), The Economic Institutions of Capitalism. New York: The Free Press. About the Author
Jaya Prakash Pradhan, (PhD, Jawaharlal Nehru University) is an Associate Professor of Economics at the Central University of Karnataka, India. He has served on faculties of leading academic institutions in India including the Sardar Patel Institute of Economic & Social Research (Ahmedabad), Institute for Studies in Industrial Development (New Delhi), Gujarat Institute of Development Research (Ahmadabad), and worked as a consultant to the Research and Information System for Developing Countries (New Delhi). He is the authour of Indian Multinationals in the World Economy: Implications for Development (Bookwell Publisher, New Delhi, 2008); co-editor of The Rise of Indian Multinationals: Perspectives on Indian Outward Foreign Direct Investment (Palgrave
Macmillan, New York, 2010) and Industrialization, Economic Reforms and Regional Development: Essays in Honour of Professor Ashok Mathur (Shipra Publication, New Delhi, 2005); and co-authour of Transnationalization of Indian Pharmaceutical SMEs (Bookwell Publisher, New Delhi, 2008). He is also the co-editor of the special issue of International Journal of Emerging Markets on Emerging Multinationals (2010) and that of the special issue of Economics, Management, and Financial Markets on The Rise of Emerging Economies (2011).
Contact Information: Jaya Prakash Pradhan, Associate Professor, Department of Economic Studies & Planning, School of Business Studies, Central University of Karnataka, II Floor, Karya Soudha, Gulbarga University Campus, Gulbarga-585106, Karnataka, India. Telefax: 08472-272 066 (off.), [email protected] .
Transnational Corporations Review Volume 3, Number 2 June 2011 www.tnc-online.net, [email protected], DOI:10.5148/tncr.2011.1111 12-21
12
Location of FDI in India: Some Less-explored Aspects
K.S. Chalapati Rao and M.R. Murthy* Abstract: While there has been extensive research to identify the factors which influence FDI’s choice of host countries to invest in, considerable interest is also being attached to location of FDI establishments within specific countries. In India too, a few studies focused on the distribution of FDI in different states. Most of these were, however, based on aggregate FDI and that too of approvals only. Even those attempted at some level of disaggregation do not take note of specific characteristics of FDI like modes of entry, nature of the foreign investor, sector of investment, characteristics of local partner if any, etc. Since mid-2000s even this information is not available and it has become more difficult to identify FDI flows/establishments in different states. Based on India’s experience since 1991, this note seeks to underline the need for disaggregated analysis which takes into account investor/sectoral characteristics, mode of entry, size of investment, etc. Keywords: Foreign direct investment, location choice, India, investor characteristics, manufacturing 1. Introduction As in most developing countries, the perceived benefits of foreign direct investment (FDI) have led to heavy emphasis being placed on attracting large sums of FDI into India in the post-1991 period. Within the country, the same perception has led to different states to vie with each other for attracting major foreign direct investment projects which could be the nuclei for further industrialisation and generation of employment opportunities. Sub-national location of FDI has been a subject matter of research not only for developing countries but also the developed ones. Identification of influencing factors could in turn help attract FDI to the host country. The identified factors include agglomeration (Guimaraes, et. al., 2000; Crozet, et. al., 2004; Lee, et. al., 2008; Kim et. al., 2003; Dinh, 2008), imitation/demonstration (Barry, et. al., 2001; Araujo, 2009), governance (Du, et.al., 2007), already developed areas (Ögütçü, 2002), infrastructure (Chiang, 2010), labour quality (Gao, 2005; Liu, 2009), country affinity (Shannon et. al., 1999; Tan and Meyer, 2011), etc. Chadee, et. al. (2003) noted that for equity joint ventures (EJVs) in China level of foreign equity ownership, home country of the foreign partner, industry/sector, duration of the contract, and size and timing of investment influenced the location. Those investing in the service sector showed preference for major metropolitan cities. In a similar vein and in the context of India’s quest to attract large FDI inflows, a few studies examined the issue of location of FDI at the state level. The findings varied widely. Some have argued that the ability of a state to attract FDI depends on the policies of the individual state. For instance, based on the
* K.S. Chalapati Rao, Institute for Studies in Industrial Development, 4 Institutional Area, Vasant Kunj, New Delhi – 110070, India. Tel: 91 11 26761607, Fax: 91 11 26761631, E-mail: [email protected] M.R. Murthy, Institute for Studies in Industrial Development, 4 Institutional Area, Vasant Kunj, New Delhi – 110070, India. Tel: 91 11 26132791, Fax: 91 11 26761631, E-mail: [email protected]

Location of FDI in India: Some Less-explored Aspects
13
state-wise FDI approvals, Bajpai and Sachs (1999) noted that relatively fast moving reformers tended to attract larger investments, both from foreign and domestic investors. The ability to attract FDI was also associated with development of physical and human infrastructure. Similarly, based on an examination of state-wise aggregate approved FDI during 1991-2001, Singh and Srinivasan (2004) noted that variations in FDI across states could be influenced by specific policy initiatives and narrowly focused government investments in infrastructure. Sachs, Bajpai & Ramiah (2002) found that FDI was getting attracted to urban areas and natural resource deposits. It was, however, pointed out that despite being well-publicised as reform-oriented, Andhra Pradesh could attract only about 4.6 per cent of the total FDI approved till 2003 (Mahendra Dev, 2004). Padhi (2002), again based on state-wise approvals of FDI, noted that the initial level of manufacturing influences the location of FDI more than the infrastructure. Morris (2004), by analysing individual cases of approvals instead of state-wise aggregates, observed that leaving aside the cases of investment whose location is strictly related to availability of natural resources or those requiring nearness to markets, FDI tends to concentrate in the largest and best cities and attributed the modest FDI in Gujarat to its inability to develop cities like Bangalore and Hyderabad. Chakravorty (2002), based on a study of new projects that were implemented or were under implementation during 1992 to early 1998, noted that FDI preferred the coastal and metropolitan districts. He, however, noted that with a very small share in the overall, FDI projects were not significant in the total investment. Archana (2006) also based on state-level approval data, found infrastructure, quality of human capital and labour cost to be important factors for attracting FDI. Siddharthan (2008), based on an analysis of state-wise FDI approval data in case of India and inflows in case of China, noted that governance indicators played a crucial role in attracting FDI and domestic investment. It was therefore suggested that states instead of competing with each other in offering tax concessions should concentrate on good governance and in providing better infrastructure (both physical and human) facilities to attract investments. NCAER (2009) was based on Capitaline corporate database and a primary sample survey based on company level records provided by the government. It found that a significant proportion of FDI plants were located in Class-3 cities and that regions generally did not have an influence on FDI plants to locate in Class-3 cities. Based on a study of district-level data on individual FDI approvals during 1991-2005, Mukim & Nunnenkamp (2010) found that foreign investors have strong preference for locations where other foreign investors are. They are also attracted to industrially diverse locations and those with better infrastructure. Horna, et. al. (2010) noted that the involvement of Japanese automobile investors in four regions (New Delhi, Bangalore, Mumbai/Pune and Chennai) suggests that what constitutes an ‘agglomeration’ in emerging markets may involve a wider geographic area and more numerous business clusters than is typically the case for Japanese investment in other contexts. As seen above, studies on FDI inflows during the post-liberalisation period in India have generally dealt with aggregate level data and/or of approvals. In contrast to international studies, the disaggregation attempted in case of India was to a limited extent only. All these studies practically refer to the period till the early 2000s when the inflows were higher but the increase over the pre-1991 period was rather modest. In the absence of state-wise data on actual inflows, these had to work with approvals data. This was, however, often justified that approvals would reflect foreign investors’ intentions better than actual inflows. The criteria adopted by some studies to identify FDI companies in India and the data sources they relied upon were also open to question. The limited objective of this note is to underline that the Indian data on FDI approvals and inflows is not easily amenable to firm conclusions on the locational choices of
K.S. Chalapati Rao and M.R. Murthy
14
foreign investors and if the studies have to be meaningful there is a strong case for taking a closer look at individual investments. 2. India’s FDI experience Studies of location of FDI in India generally take the official data as given and do not pay particular attention to its categorisation, composition and reporting. The basic features associated with FDI are the presence of significant influence and long-term interest of the foreign investor in the host-country’s enterprise. The expectations from FDI make it also imperative that in addition to capital, it should be a bundle of assets like technology, skills, management techniques, access to foreign markets, etc. In practice it was found that India has not been following any of these criteria and it appears that all the equity investments other than those by foreign institutional investors through the stock market are treated as FDI.1 Irrespective of the way FDI is measured it is logical to expect that the mode of entry and investor type could have a bearing on the observed location. The main modes of entry and the possible interpretations in the absence of detailed information are shown in Table 1.2
Table 1. Relationship between mode of entry and choice of project location
S. No. Mode of Entry Choice of Project Location/ Possible Interpretation (1) (2)
1
Setting up new projects (greenfield ventures). (a) New foreign investor (having no local
partner) Free to choose
(b) New foreign investor (with local partner)
Possible influence of domestic partner
(c) Existing foreign investor Tendency to locate nearer to the existing operations. Possible interpretation as demonstration effect/same country investors flocking together/preference for already industrialized areas, etc.
(d) Foreign investor is a non-resident Indian
Possible home state bias
(e) Foreign Investor is a financial investor Unlikely to influence the location. Domestic investor decides the location
(f) Foreign investment is a case of round-tripping
The choice of location is akin to that of domestic companies. Domestic investor decides the location
2
Acquiring controlling stakes in existing companies
No choice. Possible interpretation as demonstration effect/same country investors flocking together/preference for already industrialized areas, etc.
3
Infusing fresh capital from abroad in existing FDI companies by the same foreign investor either to maintain the existing share or to increase it.
-do-
4
Incorporation of new companies for taking over operations of existing companies’ operations
No choice. Possible reflection of domestic entrepreneur’s choice. Could be interpreted as attraction of already industrialized states.
Source: Authors’ own compilation. It is evident that except in 1(a) either there is no foreignness with the investor or, the foreign investor’s choice of location is restricted/non-existent. An existing foreign investor may prefer to locate his new

Location of FDI in India: Some Less-explored Aspects
15
ventures nearer to the other ventures already promoted by him. In case of joint ventures the local partner would have some say as he is likely to prefer his state of domicile especially if he is a small or medium entrepreneur and also when the local entrepreneur made the initial move by identifying a project and sought a foreign partner thereafter. Similarly, non-resident Indians (NRIs) could exhibit some bias towards their home states. There is also the possibility that some of the FDI is controlled by Indians themselves (round-tripping) and hence unlikely to exhibit the characteristics of FDI. In case of takeover of companies or specific units, it is inevitable that the FDI venture has practically no alternative but to continue at the same location. In case of hike in foreign equity in existing ventures by the same foreign investor, once again, one cannot expect any other criteria to come into play. On the other hand, what appears to be a wholly-owned venture now, might actually had been started as a joint venture in the past. Within wholly-owned ones a distinction can be made between operating enterprises and holding companies. The holding companies’ downstream investments need not necessarily be within the same state. Thus, to meaningfully explain the locational preferences of FDI in India since 1991, it is necessary to take note of the nature of the foreign investor and the mode of entry. Sectoral composition is another important aspect of FDI. The factors influencing location of manufacturing projects could vary from those of services and infrastructure sectors. Services being quite broad in composition the choice of location could vary significantly from one to another. Even infrastructure sectors like power, ports, roads, etc. would have different sets of determinants. Unlike most manufacturing enterprises, operations of some service enterprises could be spread over different parts of the country. In case of manufacturing companies too there can be multi-plant operations. Even if a company falls under the manufacturing category, it would be worth examining the extent of own production versus outsourced products and the extent of localisation of inputs as also the market – domestic versus exports. The data on individual approvals need not represent the number of projects as the same project might have received FDI more than once during the course of its implementation, at times even from different foreign investors. Also, size of FDI may not be related to the size of project and its impact on the regional economy. This is especially in case of minority FDI participation and high debt-equity ratios. Studies based on new FDI inflows would also not be in a position to assess the importance of FDI in the state’s economy as the already existing FDI companies may take up greenfield projects or acquire other plants/businesses or demerge some of their operations. Also, in case a foreign investor replaces another one in a venture, it is treated as fresh inflow thereby causing double counting. India’s FDI story in the post-liberalisation period can be described in two parts. In the first phase which extended till the mid-2000s, the annual inflows, though considerably higher than in the past, were rather modest. Thereafter there was a quantum jump. The average amount of FDI equity inflows increased from $1.72 bn. during 1991-92 to 1999-00, to $2.85 bn. during 2000-01 to 2004-05 and further to $19.73 bn. during 2005-06 to 2009-10. However, similar to Chakravorty (2002), our quick exercises suggested that in the new manufacturing projects announced during 1991 to 2010, FDI (comprising both new entrants and further investments by the already existing ones) played a limited role: 12.28% in the overall cost of the projects; 14.71% in the cost of completed ones; and 3.66% of those under implementation.3 Studies on
K.S. Chalapati Rao and M.R. Murthy
16
location of FDI in India should also be seen in this context. 2.1 Period – I The two broad periods also differ from the point of availability of data on FDI as the reporting pattern has changed from approvals in the first to actual inflows in the second. While the approvals were reported at the level of individual states, inflows are available for cluster of states represented by Reserve Bank of India’s (RBI) regional offices. Rao and Murthy (2006), covering the first period, noted that industrial policy changes, especially with regard to the public sector reserved areas, led to a dramatic upsurge in approvals for new projects in power, oil and telecommunications. Forty five per cent of the FDI approved during August 1991 to August 2004 was proposed in these heavy investment sectors which also suffered from serious policy uncertainties. Indeed, in most leading states (excluding Delhi and to a lesser extent Maharashtra) the top most important contributor was power and fuels. In case of Delhi, telecommunications had a majority share at nearly 54 per cent. Incidentally, in the case of telecommunications, Delhi accounted for as much as 35 per cent of the total approved investment. In view of the character of telecommunications service one should not attach much significance to these figures. Maharashtra, the top ranking state, witnessed equity hikes by a number of former FERA companies and takeovers by foreign investors. It is only after one ignores power and fuels and telecommunications, that the relationship with a state’s resource endowment or, its existing prominence in an industry emerges. For instance, transportation equipment occupied the second position in case of Maharashtra, which was a base for many automobile companies even in the pre-1991 period. Similar is the case with Tamil Nadu, which has a major truck manufacturer and two two-wheeler manufacturers apart from a number of auto ancillary units. Prominence of transportation sector for Delhi could only be explained by its hosting the registered offices of companies in neighbouring Uttar Pradesh and Haryana. Interestingly, in case of Uttar Pradesh, DCM-Toyota was taken over by Daewoo of South Korea (its Surajpur plant was later acquired by General Motors) and SRF Nippondenso (now Denso India) was turned into a subsidiary by the foreign collaborator after buying out the Indian partner. Foreign collaborators increased their stakes substantially in Maruti Udyog, Sona Steering and GKN Driveline. While in Gujarat, chemicals occupying third place is easy to understand, the relative high position secured by transport equipment could be attributed to the fact that the General Motors’ venture in the state was started by taking over Hindustan Motors unit in Halol. In case of Orissa, fuels and metallurgical industries accounted for as much as over 94 per cent of the investment. In the case of Madhya Pradesh, the two sectors had a share of 84 per cent possibly reflecting resource endowment. With high shares of services and infrastructure, contribution of equity hikes and takeover of many existing companies/units, relating total approved investment or per capita FDI with a state’s characteristics such as level of industrialisation, infrastructure development, growth trend, reform-orientation, corruption and quality of governance, which most studies of FDI location in India followed, may not be appropriate. This was the major lacuna of the studies referred to in the above.

Location of FDI in India: Some Less-explored Aspects
17
2.2 Period II The second phase, which started in 2005-06, witnessed acceleration in inflows. The manufacturing sector lost further ground and constituted only about one-fifth of the reported inflows. (Table 2) The low emphasis on manufacturing can also be seen from the fact that the automobiles industry, the largest recipient among the manufacturing industries, was way below at the seventh position with a little less than 4 percent of the reported total equity inflows. The nature of foreign investors has also undergone a major change with the emergence of foreign financial investors and round-tripping. What could be realistically called FDI accounted for only a little less than half (48.85%) of the reported inflows. Irrespective of their suitability as being classified as FDI, portfolio/financial investors are not expected to influence locational choices. In case of round-tripping type of investments, one can hardly expect the attributes associated with FDI and the decisions will be like any other domestic entrepreneur’s.
Table 2. Sector and entry mode-wise distribution of top 2,748 individual FDI inflows#
(September 2004 -- December 2009)
Sector
Reported FDI Inflows Inflows Classified as Realistic FDI@Amount (US
$ mn.) Share in Total
(%) Amount (US
$ mn.) Share in the
Reported Inflows of the Sector (%)
(1) (2) (3) (4) (5) Manufacturing 18,022 22.27 11,099 61.59Services 54,744 67.66 24,112 44.05− Construction & Real
Estate Development 14,536
17.961,872 12.88
− Financial 13,974 17.27 8,203 58.70− IT & ITES 8,283 10.24 5,082 61.35− Telecommunications 6,292 7.78 5,081 80.75− Other Infrastructure 4,357 5.38 609 13.97− Research & Development 90 0.11 51 56.87− Other Services 7,212 8.91 3,215 44.58
Energy 6,239 7.71 2,255 36.15Mining & Agriculture 1,911 2.36 1,250 65.42Total 80,915 100.00 38,717 48.85
Source: Based on Rao & Dhar (2011) # Each amounting to US $ 5 mn. or more. These covered 88% of the reported equity inflows for the period. @ Foreign investors investing in their respective lines of business. Within manufacturing only about 60% can be realistically treated as FDI. Further, a good part of the reported FDI inflows came through the acquisition route. Going by the official classification, acquisitions accounted for 25% of the realistic FDI inflows into the manufacturing sector. A quick examination of the individual cases for transfer of units and other takeovers, which were not reflected in the mode of inflows by the government4, however, revealed that the share could be almost half of the total. (Table 3) Taken together, older companies and acquisitions account for a little more than half of the companies and more than two-thirds of the inflows. In the remaining ones, choice of plant location could really have been with the new sole ventures which form 28% of the companies and 18% of the inflows. Even among these, it is

K.S. Chalapati Rao and M.R. Murthy
18
reasonable to expect that the 11 automobile component manufacturers would be located near the assembling plants.
Table 3. A Tentative classification of the manufacturing realistic FDI companies
Category No. of Companies
FDI Inflow (US $ mn.)
Share in Total (%) No. of
Companies Inflow
(1) (2) (3) (4) (5) New Sole Ventures 78 1947.54 28.06 17.73 Joint Ventures 38 983.53 13.66 8.95 New Ventures by those already having manufacturing operations 15 503.26 5.40 4.58 Older Companies 78 2178.69 28.06 19.83 Acquisitions 69 5374.45 24.82 48.91 Total 278 10,987.47 100.00 100.00
Source: From the database developed for Rao & Dhar (2011). While the RBI’s office-wise reporting itself is misleading, the nature of reported FDI inflows make them even more irrelevant for study of locational preferences of foreign investors. In line with the arguments proffered in Rao & Murthy (2006), the OECD (2009:35) indeed cautioned that:
The caveat is that the amount of FDI flows recorded at each RBI regional office may not correspond to the amount of FDI projects actually implemented in its respective jurisdiction. A foreign enterprise may transfer funds to a headquarters set up in one state but eventually use the funds for projects in another state. This is especially the case for service sector enterprises, which may have a registered headquarters in one metropolitan area but spread operations across the country.. … The concentration of FDI inflows in the two main cities of Mumbai and New Delhi hence may simply reflect the concentration there of many headquarters of foreign-invested enterprises.
When looking for FDI as a distinct form of investment with associated attributes and the benefits that could flow to a specific region, the very low share of the manufacturing sector, substantial share of acquisitions and the major contribution of financial investments and round-tripping cannot be ignored. 3. Conclusions The official data on state-wise FDI inflows offered only a limited and at times even misleading picture. Overtime the data deteriorated further and as a result it helps little in understanding the locational preferences of FDI investors. Understandably, one did not come across many location-related studies in the second period when the inflows are far larger than in the first. A liberal definition of FDI applied indiscriminately may obliterate the differences between domestic and FDI companies defeating the very purpose for which the investigations are carried out. Also, study of new FDI inflows offers only a limited view of the developments on the ground. What the FDI companies do further in the economy are not reflected in the inflows data.
Location of FDI in India: Some Less-explored Aspects
19
However, given the poor information base of the Indian corporate sector, it is not possible to say with any degree of confidence the extent of FDI in a state. The focus, therefore, has been on studying the location of fresh inflows while ignoring the further investments of the existing ones. Even those based on location of plants could fail to properly identify foreign investors’ preferences if the mode of entry is not incorporated into the analysis. The high incidence of takeovers is something that cannot be lost sight of in the analysis of ‘location’ of FDI projects. For understanding the impact of FDI on the regional economy, both the types of investments are important. Further, with states actively pursuing large investments implying that the larger ones would have more choices and greater incentives, it is possible that smaller projects/investments may face less-friendly investment climate. The already existing ones may also have a better knowledge of the investment climate than new entrants. Unless these characteristics are taken into account, what seem to be logical explanations for the observed phenomenon based on aggregates might turn out to be misleading and the underlying reality could be quite different. In India, nothing much has been done so far in this direction. More elaborate studies are required with proper care to identify FDI establishments and the characteristics like sector, mode of entry and expansion, size, home country, etc. Given the limitations of data, at present there seems to be no alternative but to focus on some important sectors and derive reliable and appropriate policy conclusions. 1 See Rao and Dhar (2011) for a detailed discussion. 2 Joint stock company is the main form in which FDI operates in India. Except in case of banks and airlines, branches of
foreign companies have a very limited role. Quite a large number of them operate as liaison offices. Hence their location will not be of any significance especially in respect of manufacturing sector.
3 Based on CMIE Capex database. The Classification is as per CMIE. 4 For instance, Dresser-Rand (India) Pvt Ltd was incorporated in 1998 in Mumbai, Maharashtra. The company began
operations in April 2000 after taking over the long existing Naroda (Gujarat) plant manufacturing low-horsepower D-R reciprocating compressors from Ingersoll-Rand (India) Ltd. Thus, while the company is new, the plant is old and Mumbai where the company has its registered office is different from the location of the plant. Similar is the case of VE Commercial Vehicles Ltd having its registered office in Delhi and which was formed as a joint venture of the Delhi-based Eicher group and Volvo to take over the Pithampur (Madhya Pradesh) unit of the former. The inflow on account of the joint venture was recorded against the RBI’s Regional office in Delhi. Incidentally, the official inflow data does not show these two as acquisitions.
References Araujo, Sonia (2009). Imitative Behaviour and FDI Location Choice: an Empirical Assessment, presented in the
ETSG 2009 Eleventh Annual Conference, Rome, September. Accessed at www.etsg.org/ETSG2009/papers/araujo.pdf
Archana, Vani (2006). Foreign Direct Investment in India: Industry and State Level Analysis, unpublished Ph.D. thesis, Indian Institute of Technology, Kharagpur.
Bajpai, Nirupam & Jeffrey D. Sachs (1999). The Progress of Policy Reform and Variations in Performance at the Sub-national Level in India, Development Discussion Paper No. 730, Harvard Institute for International Development.
Barry, F, H. Görg & E. Strobl (2001). Foreign Direct Investment, Agglomerations and Demonstration Effects: An Empirical Investigation, Research Paper 2001/25
Chadee, Doren D., Feng Qiu & Elizabeth L. Rose (2003). FDI Location at the Sub-national level: A Study of EJVs in China, Journal of Business Research, 56: 835– 845.

K.S. Chalapati Rao and M.R. Murthy
20
Chakravorty, Sanjay (2002). How does Structural Reform Affect Regional Development? Resolving Contradictory
Theory with Evidence from India, Economic Geography, vol. 76, no. 4: 367-94. Chiang, Yuan-Hsin Rita (2010). FDI Location Choice at Provincial China, International Review of Business
Research Papers, Vol. 6. No. 5. November: 174 – 292. Accessed at http://www.bizresearchpapers.com/22.%20Rita%20Chiang.pdf
Crozet, Matthieu, Thierry Mayer & Jean-Louis Mucchielli (2004). How Do Firms agglomerate? A Study of FDI in France, Regional Science and Urban Economics, 34: 27– 54.
Dev, Mahendra, S. (2004). Post-reform Regional Variations, Seminar, Issue No. 537, May, available at http://www.india-seminar.com/2004/537/537%20s.%20mahendra% 20dev.htm.
Dinh, Binh Thi Thanh (2008). Agglomeration Economies and Location Choices of Foreign Investors In Vietnam, Paper to be presented at the 25th Celebration Conference 2008 on Entrepreneurship and Innovation - Organizations, Institutions, Systems And Regions, Copenhagen, CBS, Denmark, June 17 – 20.
Du, Julan, Yi Lu and Zhigang Tao (2008). Economic Institutions and FDI Location Choice: Evidence from U.S. Multinationals in China, April, accessed at http://www2.fbe.hku.hk/~ztao/_private/pdf/FDI_Location_Choice16April2008.pdf
Gao, Ting (2005). Labor Quality and the Location of Foreign Direct Investment: Evidence from China, China Economic Review, 16, 274– 292.
Guimaraes, Paulo, Octavio Figueiredo and Douglas Woodward (2000). Agglomeration and the Location of Foreign Direct Investment in Portugal, Journal of Urban Economics, 47, 115-135. accessed at http://www.fep.up.pt/docentes/pcosme/Artigos/18-JUE.pdf
Horn, Sierk A., Nicolas Forsans and Adam R. Cross (2010). The Strategies of Japanese Firms in Emerging Markets: The Case of the Automobile Industry in India, Asian Business & Management, Vol. 9, 3: 341–378.
Kim, Seong-Hee, Todd S. Pickton, Shelby Gerking (2003). Foreign Direct Investment: Agglomeration Economies and Returns to Promotion Expenditures, The Review of Regional Studies, Vol. 33, No. 1: 61-72
Lee, Ki-Dong, Seok-Joon Hwang, Min-hwan Lee (2008). Agglomeration Economies and Location Choice of Inward Foreign Direct Investments in Korea, paper presented at the Regional Studies Association Annual Conference 2008, 27th-29th May, Prague, Czech Republic accessed at http://www.regional-studies-assoc.ac.uk/events/2008/may-prague/papers/Lee.pdf
Liu, Shuli (2009). Location Determinants of Japanese Direct Investment by Industry In China, Global Institute for Asian Regional Integration, Graduate School of Asia-Pacific Studies, Waseda University, accessed at www.waseda-giari.jp/sysimg/imgs/200908_si_st_19liu_paper.pdf
Morris, Sebastian. (2004). A Study of Regional Determinants of Foreign Direct Investments in India, and the Case of Gujarat, Working Paper No. 2004/03/07, Ahmedabad: Indian Institute of Management.
Mukim Megha & Peter Nunnenkamp (2010). The Location Choices of Foreign Investors: A District-level Analysis in India, Kiel Working Paper No. 1628, June.
OECD (2009), Investment Policy Review: India. NCAER (2009), FDI in India and its Growth Linkages, sponsored by Department of Industrial Policy and Promotion,
Ministry of Commerce and Industry, Government of India. Ögütçü, Mehmet (2002). Foreign Direct Investment and Regional Development: Sharing Experiences from Brazil,
China, Russia and Turkey, OECD Secretariat, in the International Conference on Regional Development and Foreign Investment in Brazil, Fortaleza, Brazil, 12-13 December.
Padhi, Satya Prasad. (2002). Attracting Foreign Direct Investment: A Regional Perspective, Foreign Trade Review, vol. 37, nos. 3-4: 32-47.
Pelegrín, Angels & Catalina Bolancé (2002). Regional Foreign Direct investment in Manufacturing: Do Agglomeration Economies Matter?, Document de Treball 2006/2, Instituto de Economía de Barcelona.
Rao, K.S. Chalapati & M.R. Murthy (2006), Towards Understanding the State-wise Distribution of Foreign Direct Investments in the Post-Liberalisation Period, ISID Working Paper No. WP2006/01 available at http://isid.org.in/pdf/WP0601.pdf.
Location of FDI in India: Some Less-explored Aspects
21
Rao, K.S. Chalapati & Biswajit Dhar (2011). India’s FDI Inflows: Trends and Concepts, Institute for Studies in
Industrial Development, Working Paper No. WP2011/01 available at http://isid.org.in/pdf/WP1101.pdf. Sachs, Jeffrey D., Nirupam Bajpai & Ananthi Ramiah (2002). Understanding Regional Economic Growth in India,
CID Working Paper No. 88, March. Shannon, Dale P., William J Zeile & Kenneth P. Johnson (1999). Regional Pattern in Location of Foreign-Owned
U.S. Manufacturing Establishments, Survey of Current Business, vol. 79, no. 5: 8-25. Siddharthan N.S. (2008). Corruption, Governance and FDI inflows, paper presented in the Seminar on Development
Through Planning, Market, or Decentralization?, January 21-23, 2008, organized by Department of Humanities and Social Sciences, Indian Institute of Technology Bombay, Mumbai.
Singh, Nirvikar & T N Srinivasan (2004). Indian Federalism, Economic Reform and Globalization, September, Revised, available at: http://econwpa.wustl.edu:80/eps/pe/ papers/0412/0412007.pdf.
Tan, Danchi & Klaus E Meyer, Country-of-origin and Industry FDI Agglomeration of Foreign Investors in An Emerging Economy, Journal of International Business Studies, online publication.
UNCTAD (2010), World Investment Report: Investing in a Low Carbon Economy. About the Authors
K.S. Chalapati Rao, M.Phil. is a Professor at the Institute for Studies in Industrial Development (ISID), New Delhi, a non-profit public policy think tank. His research interests encompass stock markets, corporate governance, foreign investments, international trade, industrial regulations and SMEs. Over the past three decades he has dealt with studies sponsored by national and international bodies such as the Union Ministry of Finance, Ministry of Commerce & Industry, Planning Commission, United Nations Centre on Transnational Corporations (UNCTC), Indo-Dutch Programme on Alternatives in Development (IDPAD) and International Labour Organisation (ILO).
M.R. Murthy, Ph.D. (Economics) is a Professor and Director of the Institute for Studies in Industrial Development (ISID), New Delhi, a non-profit public policy think tank. His research interests include corporate sector, capital markets, development financial institutions and foreign investments. Besides carrying out autonomous policy relevant studies, he has contributed to a number of research projects of the institute. He has also been closely associated with planning and building of ISID corporate databases.
Contact Information K.S. Chalapati Rao, Institute for Studies in Industrial Development, 4 Institutional Area, Vasant Kunj, New Delhi – 110070, India. Tel: 91 11 26761607, Fax: 91 11 26761631, Email: [email protected] M.R. Murthy, Institute for Studies in Industrial Development, 4 Institutional Area, Vasant Kunj, New Delhi – 110070, India. Tel: 91 11 26132791, Fax: 91 11 26761631, Email: [email protected]
Transnational Corporations Review Volume 3, Number 2 June 2011 www.tnc-online.net, [email protected], DOI:10.5148/tncr.2011.1112 22-30
22
Korean FDI in India: Perspectives on POSCO-India Project
Jongsoo Park∗ Abstract: This paper reviews the dynamics of POSCO-India project, a combined “mine-steel plant-port” project in Orissa, India during the last five years. In contrast with the market oriented FDI undertaken by Korean companies like LG, Samsung, HMI in India, POSCO-India project is a natural resource seeking FDI that has faced hurdles from the very beginning in setting up its integrated steel plant. Especially there has been strong protest against this Korean project from the prospective displaced persons. The main reasons for the delay in the project are the failure to build local political consensus on the project, regulatory complexities, dispute on government record on the land, and compensation. We conclude that it is important to recognize the difference between the market oriented FDI and resource seeking FDI like Posco-India project. In this regard, the reasonable and fair compensation for the affected peoples is essential. Creating sustainable new employment in the relocation zone is necessary as well. Framing of socially responsible resettlement policy and fostering of local consensus on the cost and benefits of resource seeking FDI projects can be useful in expediting the implementation of such projects. Keywords: Korean FDI in India, POSCO-India project, Orissa, Anti-POSCO factors, displacement issues 1. Introduction Since the launch of reforms in 1991, India has been a host to increasing number of Korean companies that have formed joint ventures with Indian companies or made greenfield investment in automobiles, consumer goods and other sectors. With the basic objective of accessing host market, the major triple Korean companies such as HMI (Hyundai Motors India), LG and Samsung have developed their industrial clusters in India that now encompasses a wide range of fields. More recently, Pohang Steel Company (POSCO), the world’s fourth-largest Korean steel company signed a Memorandum of Understanding (MoU) on June 22, 2005 with the Government of Orissa to set up an integrated steel plant and a captive port in the Ersama Block of Jagatsinghpur District, Orissa. POSCO has plans to invest about 12 billion US dollars to produce 12 million tons of steel per annum. It is so far going to be the largest single FDI project in India. In contrast with earlier market oriented Korean FDIs, the POSCO-India project had been embroiled in legal, procedural quagmires and protested by many anti-POSCO groups. Especially, the project has been one of the most controversial issues in the state and has generated a lot of protests. What has happened over the last five years that prevented the project from moving ahead? Why has POSCO-India faced
∗ Jongsoo Park, Department of Economics, Gyeongsang National University, 501 Jinju-daero, Jinju, Gyeongnam 660-701, Republic of Korea. Tel. +82-55-772-1223, Fax. +82-55-772-1219, Email [email protected]

Korean FDI in India: Perspectives on POSCO-India Project
23
strong opposition and barriers unlike earlier Korean FDI into India? In this paper an attempt has been made to seek answer to some of these questions. The paper is organized as follows. Section 2 examines the contents of POSCO-India project. Section 3 highlights the factors that led to the delay and unsatisfactory progress in the starting of the project. In Section 4, we discuss on the measures to tackle displacement and civil protest. Section 5, summarizes a few lessons that can be learned from POSCO-India project for expediting Korean FDI project in India and conclude the paper. 2. POSCO-India project and orissa One of the key developments in the mineral sector in the wake of economic reforms in India was the New Mineral Policy of 1993 and the amendments to the Mines and Minerals Act 1957, which brought about the deregulation of the mining sector by allowing 50% investment by foreign companies in mining and opening all non-atomic and non-mining minerals to private investment. In December 1999, the Act was renamed as the Mines and Minerals Development and Regulation (MMDR) Act, which has introduced a provision for reconnaissance permits, provided the states the right to grant leases for exploiting 15 minerals and raised the cap on foreign direct investment to 100% in February 2000 (Asher, 2009). Given the rising metal prices and deregulation, mineral rich states like Orissa started aggressively attracting both domestic and foreign investment into this crucial sector. Orissa had only two iron and steel plants until 1995. Growth in the iron and steel sector remained marginal in the 1995-2000, but saw a rapid spurt in the post-2000 period. By November 2005, the BJD-led government in Orissa had signed 43 MoUs in the iron and steel sector. Of these, six (including POSCO-India) were mega steel projects, all above 3 MTPA capacity (Table 1). The Orissa government notified its new industrial policy in March 2007. In order to attract investors, the policy created a framework of governance structures with the sole purpose of speedy and easy establishment of industrial projects (Asher, 2009).
Table 1. List of mega-steel plant project in Orissa (as on Nov. 2005)
Company Location Capacity (million ton per annum)
Investment (crore Rs.)
Year of MoU
Tata Iron and Steel Kalinganagar, Duburi,Jajpur 6.0 15,400 2004
Sterlite Iron and Steel Palasponga, Keonjhar 5.1 12,502 2004
Hygrade Pellets Paradeep 4.0 10,721 2005
POSCO-India Paradeep 12.0 51,000 2005
Jindal Steel and Power Deojhar,Keonjhar,Angul 6.0 13,135 2005
Bhushan Steel and Strips Meramundali, Dhenkanal 3.0 5,828 2005
Total 36.1 108,586 Source: http://orissagov.nic.in/
Jongsoo Park
24
On June 22, 2005, the Orissa government entered into an MoU with the Korean steel major, Pohang Iron and Steel Company (POSCO), for the establishment of POSCO-India project. Increasing demand for steel in Asia and the availability of abundant iron ore in Orissa prompted the POSCO to look towards India. As per the MoU between POSCO and Government of Orissa, based on the needs of the ‘Steel Project’, the Company will also develop and operate the following infrastructure (http://POSCO-india.com):
1) Mining facilities in the areas allocated by Government of Orissa/Government of India (the ‘Mining Project’);
2) Road, rail and port infrastructure (the ‘Transportation Project’), including the dedicated railway
line from the mine-belt to Paradeep; 3) Integrated township; 4) Water supply infrastructure (the ‘Water Project’).
The project has three parts; a steel plant, captive iron ore mines and a private port. The 12 million ton plant was to be supplied with 600 million tons of iron ore from captive mines, 30% of which is to be exchanged with low-alumina-content iron ore, along with 400 million tons more to be sourced for export. The objective of the project is “to build one of the world’s most competitive steelworks with advanced technology and stable iron ore supply from captive mines, together with the economic development of Orissa”(http://POSCO-india.com). NCAER observes large gains from the state. It estimates that the project would contribute about 10 to 11 per cent of state gross domestic product by year 2016/17, contribute about 24.2 billion US dollars to the central exchequer and 19.5 billion US dollars to state exchequer during the 30 years life of the project and generate direct and indirect employment of 870 thousand per annum for thirty years. Clearly the expected contribution of the project is quite large (NCAER, 2007). Of course POSCO-India could get large benefit from the project. According to the estimates of J.N. Mahanty, the major benefits the company could get from the ‘mining project’ are:
1) 20 million tons of high grade iron ore at a cost of 12.5 US dollars / ton (the cost of mining and handling) as against the international price of 100 US dollars / ton. Thus the amount saved by POSCO is 1.75 billion US dollars per year, as POSCO is buying iron ore from the international market for her Korean plants.
2) On an average to produce one ton of steel, it need to procure about 4 tons of various raw Materials - iron ore, coal, lime stone, manganese, dolomite, etc. Thus POSCO is saving the sea freight for 48 million tons of raw materials per annum. On the basis of a flat sea freight rate of 50 US dollars /ton, the savings on account of this parameter is estimated as 2,400 million US dollars per annum (http://hindtoday.com/Blogs/ViewBlogs.aspx?HTAdvtId=975&HTAdvtPlaceCode=IND674ORISSA).
3. Reasons that delayed POSCO-India project
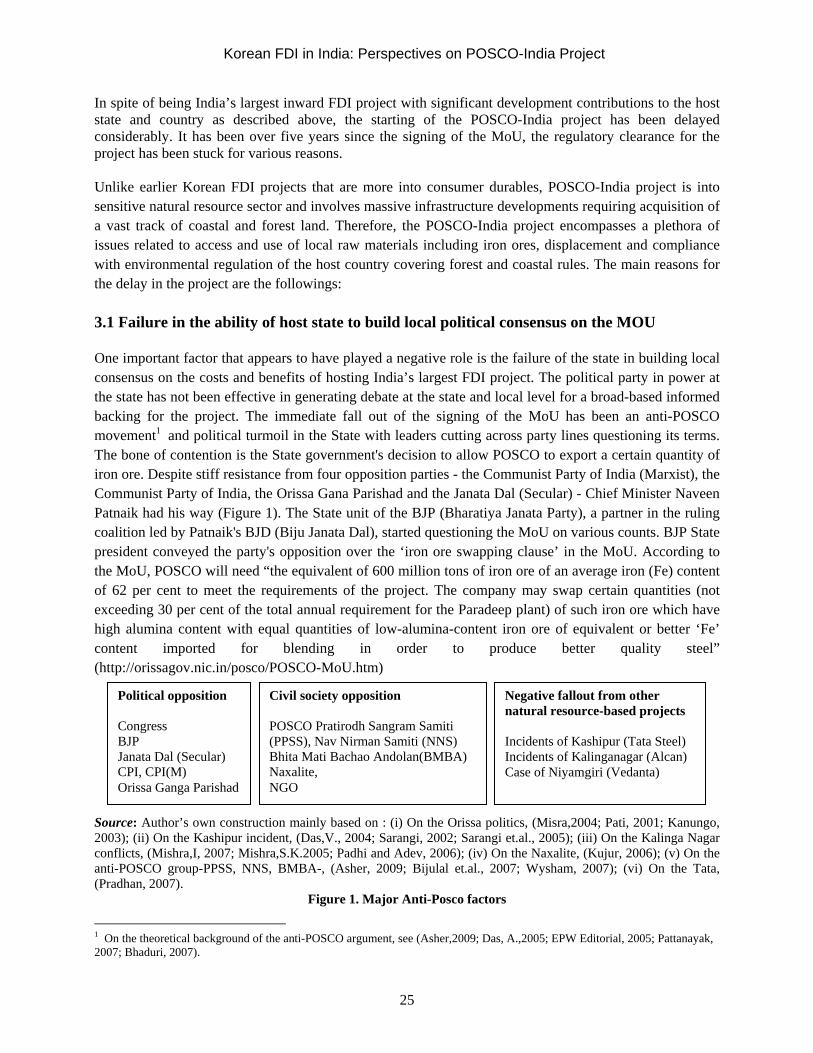
Korean FDI in India: Perspectives on POSCO-India Project
25
In spite of being India’s largest inward FDI project with significant development contributions to the host state and country as described above, the starting of the POSCO-India project has been delayed considerably. It has been over five years since the signing of the MoU, the regulatory clearance for the project has been stuck for various reasons. Unlike earlier Korean FDI projects that are more into consumer durables, POSCO-India project is into sensitive natural resource sector and involves massive infrastructure developments requiring acquisition of a vast track of coastal and forest land. Therefore, the POSCO-India project encompasses a plethora of issues related to access and use of local raw materials including iron ores, displacement and compliance with environmental regulation of the host country covering forest and coastal rules. The main reasons for the delay in the project are the followings: 3.1 Failure in the ability of host state to build local political consensus on the MOU One important factor that appears to have played a negative role is the failure of the state in building local consensus on the costs and benefits of hosting India’s largest FDI project. The political party in power at the state has not been effective in generating debate at the state and local level for a broad-based informed backing for the project. The immediate fall out of the signing of the MoU has been an anti-POSCO movement1 and political turmoil in the State with leaders cutting across party lines questioning its terms. The bone of contention is the State government's decision to allow POSCO to export a certain quantity of iron ore. Despite stiff resistance from four opposition parties - the Communist Party of India (Marxist), the Communist Party of India, the Orissa Gana Parishad and the Janata Dal (Secular) - Chief Minister Naveen Patnaik had his way (Figure 1). The State unit of the BJP (Bharatiya Janata Party), a partner in the ruling coalition led by Patnaik's BJD (Biju Janata Dal), started questioning the MoU on various counts. BJP State president conveyed the party's opposition over the ‘iron ore swapping clause’ in the MoU. According to the MoU, POSCO will need “the equivalent of 600 million tons of iron ore of an average iron (Fe) content of 62 per cent to meet the requirements of the project. The company may swap certain quantities (not exceeding 30 per cent of the total annual requirement for the Paradeep plant) of such iron ore which have high alumina content with equal quantities of low-alumina-content iron ore of equivalent or better ‘Fe’ content imported for blending in order to produce better quality steel” (http://orissagov.nic.in/posco/POSCO-MoU.htm)
Source: Author’s own construction mainly based on : (i) On the Orissa politics, (Misra,2004; Pati, 2001; Kanungo, 2003); (ii) On the Kashipur incident, (Das,V., 2004; Sarangi, 2002; Sarangi et.al., 2005); (iii) On the Kalinga Nagar conflicts, (Mishra,I, 2007; Mishra,S.K.2005; Padhi and Adev, 2006); (iv) On the Naxalite, (Kujur, 2006); (v) On the anti-POSCO group-PPSS, NNS, BMBA-, (Asher, 2009; Bijulal et.al., 2007; Wysham, 2007); (vi) On the Tata, (Pradhan, 2007).
Figure 1. Major Anti-Posco factors
1 On the theoretical background of the anti-POSCO argument, see (Asher,2009; Das, A.,2005; EPW Editorial, 2005; Pattanayak, 2007; Bhaduri, 2007).
Negative fallout from other natural resource-based projects Incidents of Kashipur (Tata Steel) Incidents of Kalinganagar (Alcan) Case of Niyamgiri (Vedanta)
Civil society opposition POSCO Pratirodh Sangram Samiti (PPSS), Nav Nirman Samiti (NNS) Bhita Mati Bachao Andolan(BMBA) Naxalite, NGO
Political opposition Congress BJP Janata Dal (Secular) CPI, CPI(M) Orissa Ganga Parishad

Jongsoo Park
26
3.2 Legal and procedural clearance While clearances from State Government and State Pollution Control Board were received fairly early, on 19 November 2006 (for the captive port) and 12 June 2007 (for the steel plant), clearances from central regulation has not been smooth. It received Environment and Coastal Regulation Zone(CRZ) clearances from the Government of India in 2007 but the clearance under the Forest (Conservation) Act from Government of India came late in December 2009 to be suspended since November 2010 for non-compliance with the Forest Rights Act 2006 and again granted conditional clearance in February 2011. The suspension of forest clearance has forced the State government of Orissa to halt land acquisition and transfer to Posco (Government of India, 2010, b). The present conditional clearance that came in early 2011 has some 60 additional conditions on Posco's steel plant and captive port project in Orissa. Environmental clearance for the steel-cum-captive power plant is being accorded with 28 additional conditions over and above stipulated in the original environmental clearance of July 19, 2007. The environmental clearance for captive port is being accorded with 32 additional conditions over and above stipulated in the original environmental clearance of May 15, 2007. The Environmental Minister has also sought categorical assurance from the state government that there is no violation of Forest Rights Act (FRA) in the land acquisition process. Orissa government's assurance that those claiming dependence on land in the project area were not categorized as “other traditional forest dwellers (OTFD)” under Forest Rights Act is necessary (Government of India, 2010, b). 3.3 Influences of government decision on vedanta case On 16 August, 2010, N.C. Saxena committee, was appointed to look into the forest clearance proposal for bauxite mining in the Niyamgiri hills of Orissa for the Vedanta aluminum project, gave its report (Government of India, 2010,a), categorically stating that the proposed mining lease in the area should be disallowed because it would deprive tribal people, particularly Primitive Tribal Groups(TPGs) of their forest rights and destroy their lives. The Ministry of Environment and Forests acting on this report disallowed the forest clearance, rendering the mine inoperable. Since POSCO, like Vedanta is a large mineral based company in the process of establishing a major project in Orissa, the two projects are often equated in the public mind. There was an immediate assumption, therefore, that the POSCO project, too, would be disallowed.2 The police firing and death of adivasis opposing the Tata Steel Plant at Kalinganagar in January 2006, and in Nandigram over forced acquisition of land by the state has played a major role in putting pressure on the BJD-led government to treat cautiously in the POSCO case. 3.4 Displacement issues The numerous protests from local people and environmental experts on land acquisition that delayed the green clearance clearly shows that state and central government are not able to address the displacement
2 It is important to point out that POSCO and Vedanta are different projects and operate in different environments and circumstances. Vedanta’s alumina plant (and the bauxite mine for which lease was applied for by the Orissa Mining Corporation), is located in the less developed western part of Orissa, in a Scheduled Area which is home to two Primitive Tribal Groups. POSCO’s plant, on the other hand is to be located in a coastal district, in the more developed eastern part of Orissa; the area is not a Scheduled Area and has virtually no Scheduled Tribe people. A very important difference also is that while the construction of the Vedanta project is almost complete (including unauthorized construction of the expanded portion for which no environment clearance had been taken), construction on the POSCO project is yet to start, the land not having been handed over to the company by the State Government, so far(Government of India,2010,b).

Korean FDI in India: Perspectives on POSCO-India Project
27
issue properly and to make the local people aware of the prosperity that POSCO project can bring with it. Much of the opposition to the project happen because the displaced people do not see any marked improvement in their lives after being displaced. The construction of the POSCO-India steel plant and captive port are expected to have far-reaching socio-economic impacts on their traditional life. As a result, there has been growing opposition to the project in the project affected area as well as the State in general. The three Gram Panchayats in Jagatsinghpur district - Dhinkia, Nuagaon and Gadakujang - that were to be affected came together to oppose the project. In all, 471 families would be affected from three panchayats. More 90% of people in the area are engaged in cultivation and allied activities. Dhan (paddy), Pan (betel), Mina (fish) are the staple sources of livelihood in the area. Only 438 acres of the 4,004 acres required for the POSCO-India steel plant site are private land, the rest being government land, recorded as ‘under forest’ or ‘anabadi’. The fertile ‘anabadi’ land is under the possession of the local people for ages as it is suitable for the growth of Pan (betel), more than 15,000 Pan Baraj are in the Government land. Government records do not show that most of this land has been under betel, cashew and other cultivation for generations. The last settlement record was prepared in 1984. It recognizes only claims on agricultural lands under regular occupation. Other uses like grazing, collection of firewood, forest produce and cashew cultivation or even fishing are unrecorded. These are livelihood activities that account for the subsistence of a large number of families in the area. Yet the records show the land as belonging to the government. That’s why resistance to POSCO-India is so strong (Bijulal, et.al., 2007; Asher, 2009). 4. Measures to tackle displacement and civil protest-impoverishment risks and
reconstruction (IRR) model Compulsory displacements that occur for development reasons embody a perverse and intrinsic contradiction in the context of development. Development-induced displacement unleashes widespread social, economic and environmental changes that follow well-established patterns. Although they vary in severity, these patterns are remarkably consistent regardless of what type of project or industry is responsible for the displacement. Forced displacement epitomizes social exclusion of certain groups of people. It cumulates physical exclusion from a geographic territory with economic and social exclusion out of a set of functioning social networks. The most widespread effect of involuntary displacement is the impoverishment of considerable numbers of people. If impoverishment is the looming risk in displacement, the challenge is to organize risk prevention and provide safeguards. This can increase the benefits of development by eliminating some of its avoidable pathologies (Cernea, 2000; Downing, 2002).
Table 2. How displacement produces new poverty? Landlessness in Orissa resettlement
Project Families displaced (numbers)
landless among displaced families(%)
Before displacement After displacement
Sam Barrage 318 24 38
ITPS 44 12 75
Lb Valley 39 56 92
UKP 74 12 31
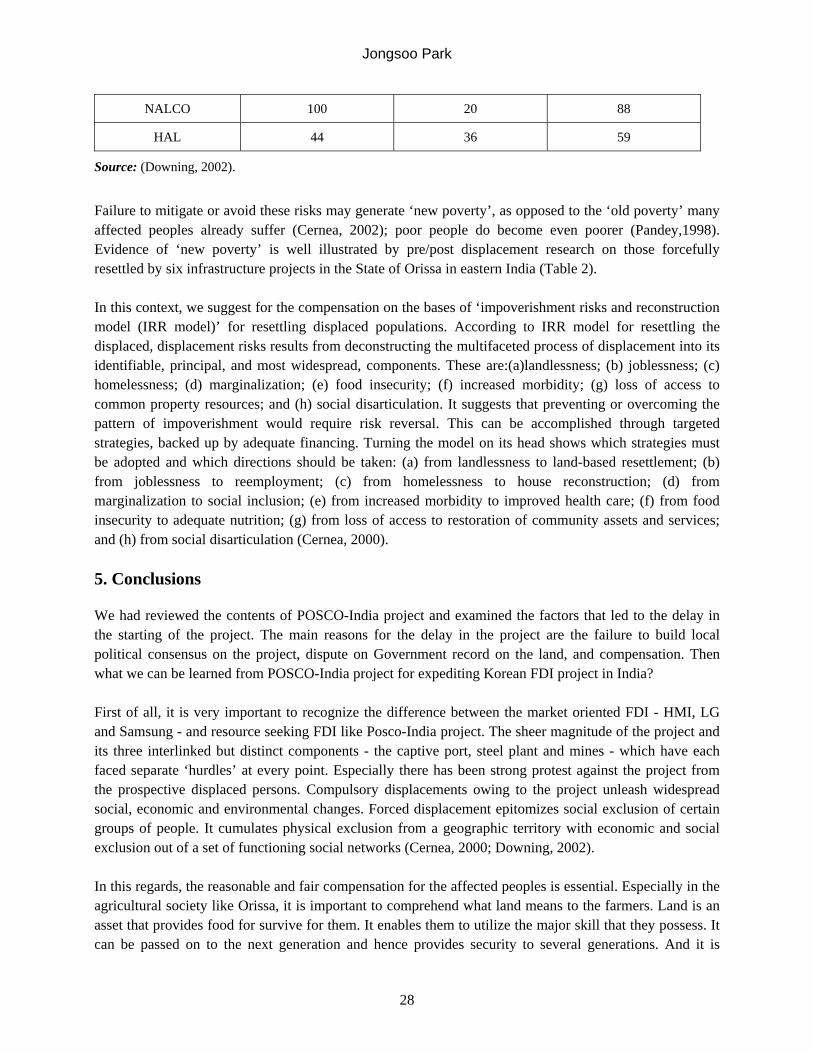
Jongsoo Park
28
NALCO 100 20 88
HAL 44 36 59 Source: (Downing, 2002).
Failure to mitigate or avoid these risks may generate ‘new poverty’, as opposed to the ‘old poverty’ many affected peoples already suffer (Cernea, 2002); poor people do become even poorer (Pandey,1998). Evidence of ‘new poverty’ is well illustrated by pre/post displacement research on those forcefully resettled by six infrastructure projects in the State of Orissa in eastern India (Table 2). In this context, we suggest for the compensation on the bases of ‘impoverishment risks and reconstruction model (IRR model)’ for resettling displaced populations. According to IRR model for resettling the displaced, displacement risks results from deconstructing the multifaceted process of displacement into its identifiable, principal, and most widespread, components. These are:(a)landlessness; (b) joblessness; (c) homelessness; (d) marginalization; (e) food insecurity; (f) increased morbidity; (g) loss of access to common property resources; and (h) social disarticulation. It suggests that preventing or overcoming the pattern of impoverishment would require risk reversal. This can be accomplished through targeted strategies, backed up by adequate financing. Turning the model on its head shows which strategies must be adopted and which directions should be taken: (a) from landlessness to land-based resettlement; (b) from joblessness to reemployment; (c) from homelessness to house reconstruction; (d) from marginalization to social inclusion; (e) from increased morbidity to improved health care; (f) from food insecurity to adequate nutrition; (g) from loss of access to restoration of community assets and services; and (h) from social disarticulation (Cernea, 2000). 5. Conclusions We had reviewed the contents of POSCO-India project and examined the factors that led to the delay in the starting of the project. The main reasons for the delay in the project are the failure to build local political consensus on the project, dispute on Government record on the land, and compensation. Then what we can be learned from POSCO-India project for expediting Korean FDI project in India? First of all, it is very important to recognize the difference between the market oriented FDI - HMI, LG and Samsung - and resource seeking FDI like Posco-India project. The sheer magnitude of the project and its three interlinked but distinct components - the captive port, steel plant and mines - which have each faced separate ‘hurdles’ at every point. Especially there has been strong protest against the project from the prospective displaced persons. Compulsory displacements owing to the project unleash widespread social, economic and environmental changes. Forced displacement epitomizes social exclusion of certain groups of people. It cumulates physical exclusion from a geographic territory with economic and social exclusion out of a set of functioning social networks (Cernea, 2000; Downing, 2002). In this regards, the reasonable and fair compensation for the affected peoples is essential. Especially in the agricultural society like Orissa, it is important to comprehend what land means to the farmers. Land is an asset that provides food for survive for them. It enables them to utilize the major skill that they possess. It can be passed on to the next generation and hence provides security to several generations. And it is

Korean FDI in India: Perspectives on POSCO-India Project
29
marketable and in times of distress, serves as collateral. Displacement is more severe to the landless. The only economic opportunity the landless have in rural India is to work in other people’s land. And this relationship is not simply a one-time transactional one but has a history and complex social dimensions. So, when the landless are displaced, they have to be compensated more carefully (Venkateswaran, 2007). Settling displaced people back on cultivatable land or in income-generating employment is the heart of the matter in reconstructing livelihoods. Creating sustainable new employment in the relocation zone is essential as well. Furthermore, it should not overlook the socio-cultural and psychological dimensions, and should be concerned with facilitating reintegration within host populations or compensating community-owned assets (Cernea, 2000). But compensation alone is not a solution. It would be unrealistic to conceive of reconstruction only as a top-down, paternalistic effort, without the participation and initiative of the displaced people themselves. The required strategy is not a one-actor strategy, for the state alone; rather, it is an all-actors strategy. Despite the polarized situation to be expected a displacement context, the participation of all relevant actors (POSCO-India and the affected peoples, local leaders, Orissa Government and non-governmental organizations, host populations) in reconstruction is indispensable. Socially responsible resettlement can counteract lasting impoverishment and generate local consensus on the cost and benefits of POSCO-India FDI project. References Asher Manshi (2009), Striking while the iron is hot: A case study of the Pohang Steel Company (POSCO)'s proposed
project in Orissa, National Centre for Advocacy Studies, 2009, Pune, India. Bhaduri, Amit (2007), Alternatives in Industrialization, Economic and Political Weekly, Mumbai, India,
2007,5(5):1597-1601. Bijulal,M.V., M.Asher, S.Panikkar, S.Chakravartty (2007), Report of an Independent Fact Finding Team on Orissa’s
POSCO Project, Mainstream, India, 2007, 14(5). Cernea, Michael M.(2000), Risks, Safeguards and Reconstruction: A Model for Population Displacement and
Resettlement, Economic and Political Weekly, Mumbai, India, 2000, 7(10): 3659-3678. Das, A.(2005), POSCO Deal: Natural Resource Implication, Economic and Political Weekly, Mumbai,
India,2005,29(10): 4678-4680. Das, V.(2004), Kashipur: Politics of Underdevelopment, Economic and Political Weekly, 2004, Mumbai, India,2004,
4(1): 81-84. Downing,T.E.(2002), Avoiding new poverty: Mining-Induced Displacement and Resettlement, International Institute
for Environment and Development, London, U.K.,2002. EPW Editorial (2005), POSCO Project: A Mega Deal, Economic and Political Weekly, Mumbai, India, 2005, 25(7):
2888. Government of India(2010,a), Report of The Four Member Committee For Investigation Into The Proposal
Submitted By The Orissa Mining Company For Bauxite Mining in Niyamgiri, submitted to the Ministry of Environment and Forest, Delhi, India, 2010, 16(8).
Government of India(2010,b), Report of the Committee Constituted to Investigate into the proposal submitted by POSCO India Pvt. Limited for establishment of an Integrated Steel Plant and Captive Port in Jagatsinghpur District, Orissa, submitted to the Ministry of Environment and Forest, Delhi, India, 2010,18(10).
Kanungo, P.(2003), Hindutva’s Entry into a Hindu Province: Early Years of RSS in Orissa, Economic and Political Weekly, EPW Special Article, Mumbai, India, 2003,2(8): 3293-3303.

Jongsoo Park
30
Kujur, R. K.(2006), Underdevelopment and Naxal Movement, Economic and Political Weekly, Mumbai, India,2006,18(2): 557-559.
Mishra, I.(2007), Heat and Dust of Highway at Kalinganagar, Economic and Political Weekly, Mumbai, India,2007,10(3): 822-825.
Mishra, S.K.(2005), Impact of Rehabilitation Policy and Low Crop Yield: Rengali Dam in Orissa, Economic and Political Weekly, Mumbai, India, 2005,25(6): 2688-2691.
Misra, S. N.(2004), Ruling Coalition Returns, Economic and Political Weekly, Mumbai, India, 2004,18(12):5521-5523.
NCAER (2007), Social Cost Benefit Analysis of the POSCO Steel project in Orissa, National Council of Applied Economic Research, New Delhi, India,2007.
Padhi, R. and N. Adev(2006), Endemic to Development-Police Killings in Kalinga Nagar, Economic and Political Weekly, Mumbai, India, 2006,21(1): 186-187.
Pandey, B.(1998), “Depriving the Underprivileged for Development”, Institute for Social Economic Development, Bhubaneswar, India.
Pati, B.(2001), Identity, Hegemony, Resistance: Conversions in Orissa,1800-2000, Economic and Political Weekly,Mumbai, India, 2001,3(11): 4204-4212.
Pattanayak, S.(2007), POSCO in Orissa - A Case of Global Masters against Local Preys, Radical Notes( http://radicalnotes.com).
Pradhan, J.P.(2007), Tata Steel’s Romance with Orissa – Minerals-based Underdevelopment and Federal Politics in India, Working Paper, No. 2007/03, ISID, New Delhi, India, 2007.
Sarangi, D. R.(2002), Surviving against Odds: Case of Kashipur”, Economic and Political Weekly, Mumbai, India,2002,3(8): 3239-3241.
Sarangi, D., R. Pradhan, S. Mohanty(2005), State Repression in Kashipur, Economic and Political Weekly, Mumbai, India, 2005,26(3): 1312-1314.
Venkateswaran, S.(2007), Industrial Displacement: Looking beyond Cash Compensation, Economic and Political Weekly, Mumbai, India, 2007,2(6): 2050-2051.
Wysham, D. (2007), “Blood Money: US Bank Funds Korean Project that will Destroy Native Community”, www.alternet.org/rights/50774/
About the Author
Professor in the Department of Economics, Gyeongsang National University. Republic of Korea. Dr. Park works primarily on the Indian Economy. He has research interest in the areas of industrial organization, especially on the big business groups in India. Dr. Park maintains a standing interest in the dynamics of FDI since the liberalization in India.
Contract Information Jongsoo Park, Department of Economics, Gyeongsang National University, 501 Jinju-daero, Jinju, Gyeongnam 660-701, Republic of Korea. Tel: +82-55-772-1223, Fax: +82-55-772-1219, Email: [email protected], Website http://nongae.gnu.ac.kr/~india93.

Transnational Corporations Review Volume 3, Number 2 June 2011 www.tnc-online.net, [email protected], DOI:10.5148/tncr.2011.1113 31-49
31
India’s Agriculture and Food Multinationals: A First Look
Premila Nazareth Satyanand1*
Abstract: India, one of the world’s largest agricultural economies and now amongst its Top 25 outward investors, is as yet an insignificant outward investor in agriculture. This is largely because of long-standing restrictions on corporate involvement in agriculture. However, with India’s agricultural sector now gradually liberalising, Indian firms from this and allied sectors have begun to invest outward. Among them are Indian crop, seed, and agricultural equipment firms, all seeking to build the capacity and product portfolio to better service India’s immense market and international customers. Indian food, beverage and fertiliser firms have also begun to globalise to secure raw material supplies, expand global market share, and bring the Indian consumer new offerings. This paper takes a first look at these developments through an analysis of the publicly-announced Indian outward M&As in the agriculture, food and beverages sector from January 2005 to December 2010. Keywords: Transnational corporations, India, outward foreign direct investment, agriculture, Mergers and acquisitions.
1. Introduction
India is now the world’s 21st largest foreign direct investor. 1 It is also one of the world’s largest agricultural producers and exporters. It would thus seem natural that India be amongst the world’s largest outward investors in agriculture, a sector in which it would have an advantage, along with China, South Korea, Chile, Brazil, Colombia and Taiwan.2 Yet, only one Indian company – Karuturi Global – ranked amongst the world’s top agriculture, food and beverage firms in UNCTAD’s World Investment Report 2009: Transnational Corporations, Agricultural Production and Development.3 India’s historical restrictions on corporate involvement in agriculture, on landholding sizes, on interstate trade in agricultural produce, and on inward FDI in agriculture – all intended to protect India’s poor farming millions – largely account for a loss of natural advantage. However, gradual liberalisation in India’s agricultural sector over the past five years is enabling corporate involvement in contract farming and agricultural retail. This, together with rising incomes and changing food habits has radically boosted the domestic consumption of fruits, vegetables, pulses, dairy, and poultry products, and is propelling a nascent structural shift in Indian agriculture. Highlighting the shift is the emergence of Indian outward FDI in agriculture and food, a development much hyped by the international press in its coverage of India’s alleged agricultural ‘land grab’ in Africa.
*Premila Nazareth Satyanand, Independent Researcher, S-349, Panchshila Park, New Delhi – 110017, India. Tel: 91-9811852889. Email: [email protected]

India’s Agriculture and Food Multinationals: A First Look
32
Yet, there has been little or no effort to comprehensively analyse this rise in Indian agricultural and food OFDI by studying the companies driving it and their individual compulsions. Equally important is to understand the impact of this OFDI in boosting the global competitiveness of Indian agriculture. In other words, is OFDI bringing home international technology and best practice that puts Indian agriculture on a higher growth path? This is a first effort to explore some of these issues, all of which require more detailed research attention. 2. Outward FDI in the Indian agriculture, food and beverages sector
India is the world’s largest milk producer, its second-largest fruit and vegetable grower, and its third-largest fish and food-grain producer. Agriculture generates a sixth of national GDP and occupies 70% of the Indian population. India’s food industry is worth US$ 180 billion. Within it, food processing accounts for US$ 67 billion4 (14% of manufacturing GDP), and directly or indirectly employs 50 million people.
However, over 70% of production volume still comes from the unorganised sector. India also processes significantly less of its produce than global counterparts.5 As a result, India accounted for just 1.5% of global processed food exports in FY 2008-2009. India currently has 1,759 agriculture, food and beverage firms listed in The Centre for Monitoring Indian Economy database.6 Of these, fifty-seven report overseas investments (Annexure 1), up from twenty firms in 2000 and thirty-nine firms in 2005. Together, they accounted for US$20.3 billion of the Indian food and beverage industry’s US$67 billion in sales and for US$21.3 billion of its US$57 billion in assets.7 They have also grown faster than the food and beverage industry (Table 1).
Table 1. India’s food and beverage industry: average annual sales growth (%)
2003-4 2004-5 2005-6 2006-7 2007-8 2008-09
India’s 57 food & beverage TNCs 10.2 18.4 28.3 20.4 20.7 14.5
Food & beverage industry 6.8 10 19.7 20.9 18.0 14.1 Of which:
Food products 6.3 9.2 18.7 20.4 18.8 14.7 Sugar -0.9 16.2 32.7 14.0 -5.0 14.2
Vegetable oils & products 21.0 1.2 19.6 19.6 29.8 13.9 Beer and alcohol 13.1 13.8 26.9 29.4 25.8 17.4 Tobacco products 5.7 11.3 19.0 17.8 8.8 9.0
Fertilisers 4.8 21.1 15.4 8.4 12.2 82.7
Others: Services (non-financial) 26.4 22.2 12.7 21.8 19.3 16.7
Manufacturing 13.7 20.5 18.9 24.0 16.1 14.9 Source: Centre for Monitoring Indian Economy, Corporate Sector, January 2010: 12

Premila Nazareth Satyanand
33
Not surprisingly, thirty-one of India’s fifty-seven ‘food and beverage multinationals’ top their domestic market segments, and rank amongst India’s top 1000 companies by net sales. (Annexure1). The reported total OFDI stock for these fifty-seven multinationals has grown from US$115 million in 2000 to US$1.35 billion in 2010.8 Extrapolating from this data, average foreign assets (US$23 million) are still a fraction of average total assets (US$348 million).
However, the total value of Indian outward agriculture, food and beverage M&As 2010 is US$3.4 billion for the 2000-2010 period. This means that Indian OFDI stock in this sector is at least 3% to 4% India’s total OFDI stock of over US$90 billion during this period.9
3. India’s agriculture, food and beverage multinationals: a closer look India’s outward agriculture, food and beverage M&As offer an insight into the nature and compulsions of its emerging multinationals in this sector. The data set used are the agriculture, food and beverage M&As listed by the Grant Thornton Dealtracker10 in the six years from 1 January 2005 to 31 December 2010. (These M&As are listed in Annexure 2). The database lists 66 overseas Indian M&As in the agriculture, food & beverage sector for this period.11 Table 2 lists how many occurred each year, showing that the global crisis’ impact on M&As in this sector followed the pattern seen across Indian M&As in general. That is, a sudden jump in 2006/2007, then a slump, and another peak in 2010.
Table 2. Indian outward M&As in the agriculture and food sector: Incidence (2005-2010)
Year 2005 2006 2007 2008 2009 2010 No of M&As 5 17 13 10 5 18
However, it is not possible to compare average deal sizes across years, sectors and companies, since the database does not provide complete financial data for each transaction. But a general observation from Annexure 2 is that average deal sizes tend to be smaller than those in other sectors. 3.1 Who are India’s most active agriculture, food and beverage multinationals?
Table 3 lists India’s most energetic globalisers in this sector, by number of outward M&As between 2005 and 2010.
Table 3. India’s most internationally-acquisitive agriculture, food and beverage multinationals (2005-2010)
Company M&As Company M&As United Phosporus
(Agrochemicals) 8 Jain Irrigation Systems
(Irrigation and food ingredients) 8 Tata Tea/ Tata Global Beverages
(Tea and health/wellness drinks) 6 Advanta
(Seeds) 4
UB Group/ United Spirits (Alcoholic beverages) 3
McLeod Russel (Tea) 3
Punjab Chemicals & Crop Protection (Agrochemicals) 3
Champagne Indage (Alcoholic beverages) 3
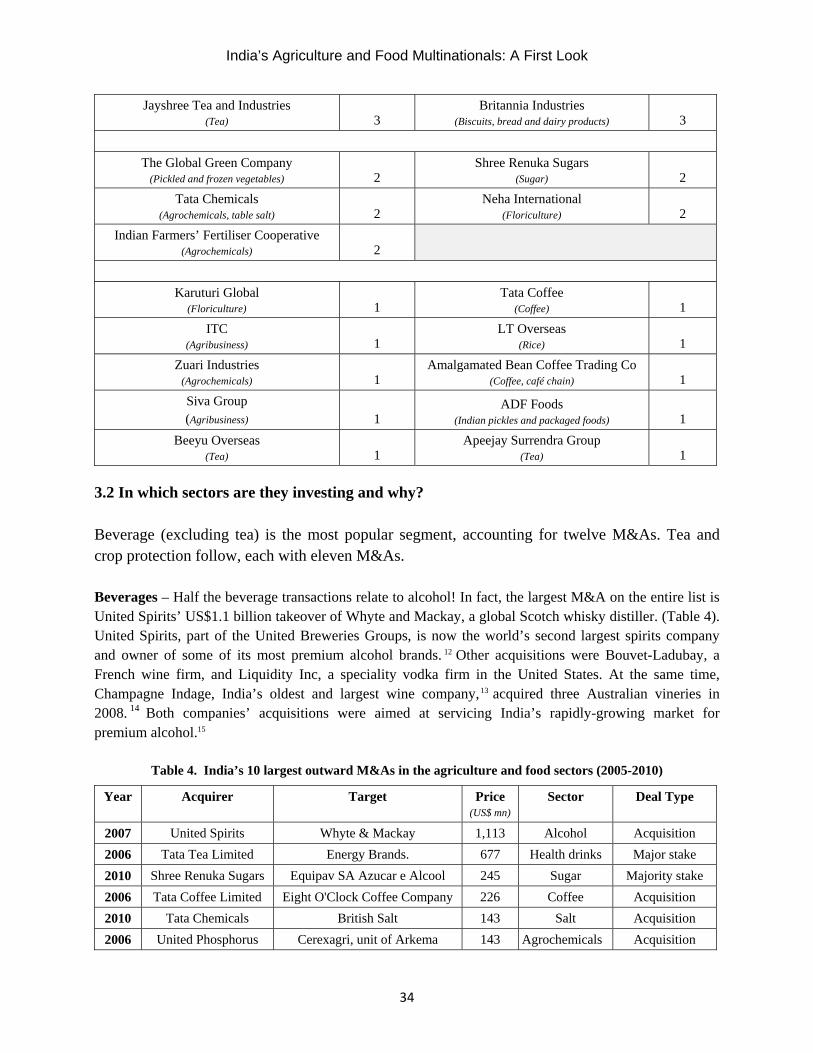
India’s Agriculture and Food Multinationals: A First Look
34
Jayshree Tea and Industries (Tea) 3
Britannia Industries (Biscuits, bread and dairy products) 3
The Global Green Company
(Pickled and frozen vegetables) 2 Shree Renuka Sugars
(Sugar) 2 Tata Chemicals
(Agrochemicals, table salt) 2 Neha International
(Floriculture) 2 Indian Farmers’ Fertiliser Cooperative
(Agrochemicals) 2
Karuturi Global (Floriculture) 1
Tata Coffee (Coffee) 1
ITC (Agribusiness) 1
LT Overseas (Rice) 1
Zuari Industries (Agrochemicals) 1
Amalgamated Bean Coffee Trading Co (Coffee, café chain) 1
Siva Group (Agribusiness) 1
ADF Foods (Indian pickles and packaged foods) 1
Beeyu Overseas (Tea) 1
Apeejay Surrendra Group (Tea) 1
3.2 In which sectors are they investing and why?
Beverage (excluding tea) is the most popular segment, accounting for twelve M&As. Tea and crop protection follow, each with eleven M&As. Beverages – Half the beverage transactions relate to alcohol! In fact, the largest M&A on the entire list is United Spirits’ US$1.1 billion takeover of Whyte and Mackay, a global Scotch whisky distiller. (Table 4). United Spirits, part of the United Breweries Groups, is now the world’s second largest spirits company and owner of some of its most premium alcohol brands. 12 Other acquisitions were Bouvet-Ladubay, a French wine firm, and Liquidity Inc, a speciality vodka firm in the United States. At the same time, Champagne Indage, India’s oldest and largest wine company,13 acquired three Australian vineries in 2008. 14 Both companies’ acquisitions were aimed at servicing India’s rapidly-growing market for premium alcohol.15
Table 4. India’s 10 largest outward M&As in the agriculture and food sectors (2005-2010) Year
Acquirer Target Price
(US$ mn)Sector Deal Type
2007 United Spirits Whyte & Mackay 1,113 Alcohol Acquisition 2006 Tata Tea Limited Energy Brands. 677 Health drinks Major stake 2010 Shree Renuka Sugars Equipav SA Azucar e Alcool 245 Sugar Majority stake 2006 Tata Coffee Limited Eight O'Clock Coffee Company 226 Coffee Acquisition 2010 Tata Chemicals British Salt 143 Salt Acquisition 2006 United Phosphorus Cerexagri, unit of Arkema 143 Agrochemicals Acquisition

Premila Nazareth Satyanand
35
2005 Apeejay Surrendra Group
Premier Foods 138 Tea Acquisition
2006 United Phosphorus Advanta Netherlands Holdings 124 Seeds Acquisition 2009 Shree Renuka Sugars Vale do Ivai Acucar e Alcool 82 Sugar Acquisition 2007 Karuturi Global Sher Agencies 69 Floriculture Acquisition
Source: Grant Thornton Dealtracker Annual. (Issues - 2005, 2006, 2007, 2008, 2009, 2010). Tata Tea’s three acquisitions target global leadership in the emerging ‘health and wellness’ drinks area, particularly in the key United States market. (The company is now known as Tata Global Beverages). It first bought 30% of Energy Brands, an American health drinks firm,16 as also a minority stake in The Rising Beverage Company, a United States’ performance beverage and bottled water company, as also in the latter’s Activate brand of vitamin-enhanced functional beverages. 17 The Siva Group, a conglomerate with agro business interests, has bought a 50% stake in Isklar, a pure Norwegian glacial natural mineral water sold in the United Kingdom’s largest supermarkets, which it intends to market internationally and in India. Café Coffee Day, India’s leading café chain, is the first beverage retail chain to go global, even though Indian restaurants are an established phenomenon the world over. Café Coffee Day, part of the Amalgamated Bean Coffee Trading Company, India’s largest coffee conglomerate, opened three outlets in Vienna in 2005. Most noteworthy, it used its own brand to bring Indian coffee to Austrian connoisseurs. In 2006, it commenced operations in Pakistan and, in mid-2010, bought out Café Emporio, a successful Czech cafe chain with 11 outlets, for US$3 million. With over 1,100 outlets in India, Café Coffee Day is targeting 50 international outlets by 2013, particularly in Central and Eastern Europe. Crop protection, seeds and fertilisers – United Phosphorus, India’s largest agrochemical company and one of its first globalizers,18 by itself accounts for eight of the eleven crop protection M&As. It is now the world’s fifth-largest agrochemical firm,19 thanks to its takeovers of Cequisa, a Spanish crop protection firm, and of some fungicide/ pesticide businesses of Dow AgroSciences, Bayer Crop Science, and Dupont. In March 2011, it bought a 50% stake in Brazil's Sipcam Isagro Brasil, gaining a significant foothold in the $7-billion Brazilian agrochemicals market, one of the world’s Top Five agrochemical markets.20 Punjab Chemicals and Crop Protection has used similar takeovers and stake purchases to build its formulations capacity and domestic/global market share. For both companies, acquisitions have been crucial in securing quick entry to the large, but highly-regulated agrochemicals markets of Latin America, Europe and the United States, where obtaining regulatory approvals takes years.
United Phosphorus also undertook a parallel series of acquisitions (starting with the 2006 purchase of Advanta, a leading Dutch seeds firm) to build a global hybrid seeds business, with specialised offerings in wheat (LongReach Plant Breeders, Australia), sorghum and forage (Garrison & Townsend Seed Company and Crosbyton Seed Company, both in Texas), and sunflower (Limagrain Europe’s sunflower seed business). ITC, a leading agribusiness firm, bought Technico, an Australian firm, whose “Technituber” miniature seed potatoes are far more virus-resistant and quicker-yielding than traditional counterparts.
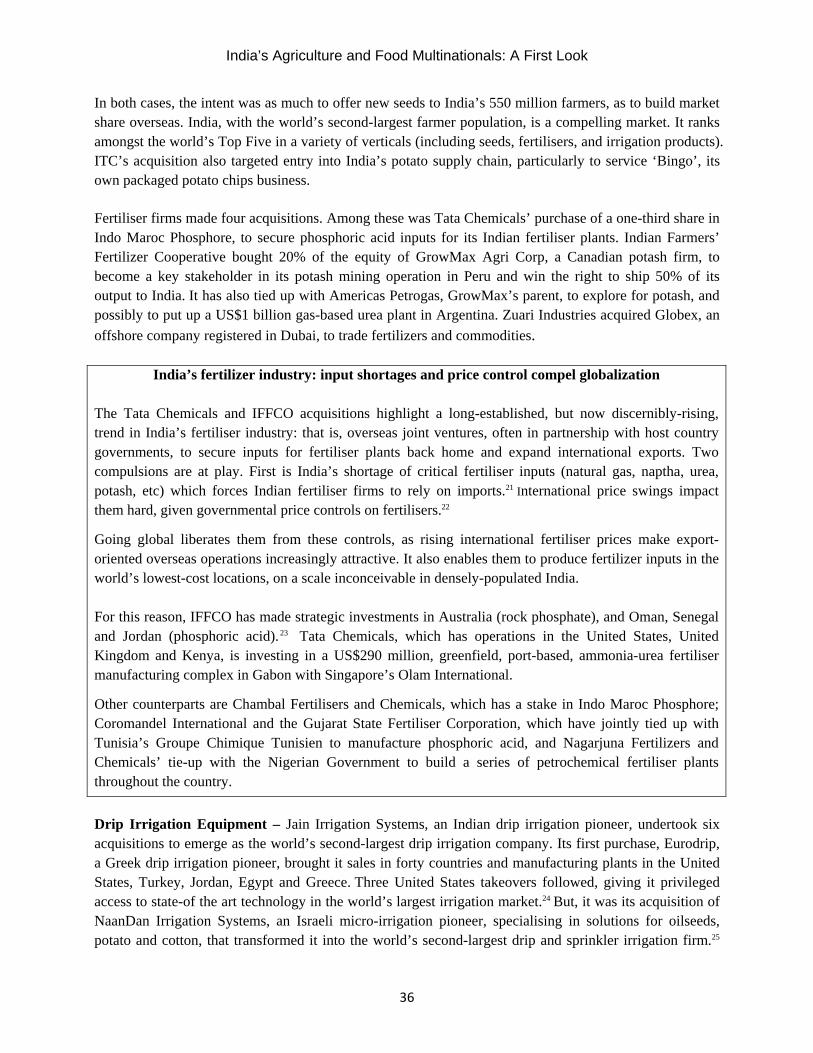
India’s Agriculture and Food Multinationals: A First Look
36
In both cases, the intent was as much to offer new seeds to India’s 550 million farmers, as to build market share overseas. India, with the world’s second-largest farmer population, is a compelling market. It ranks amongst the world’s Top Five in a variety of verticals (including seeds, fertilisers, and irrigation products). ITC’s acquisition also targeted entry into India’s potato supply chain, particularly to service ‘Bingo’, its own packaged potato chips business.
Fertiliser firms made four acquisitions. Among these was Tata Chemicals’ purchase of a one-third share in Indo Maroc Phosphore, to secure phosphoric acid inputs for its Indian fertiliser plants. Indian Farmers’ Fertilizer Cooperative bought 20% of the equity of GrowMax Agri Corp, a Canadian potash firm, to become a key stakeholder in its potash mining operation in Peru and win the right to ship 50% of its output to India. It has also tied up with Americas Petrogas, GrowMax’s parent, to explore for potash, and possibly to put up a US$1 billion gas-based urea plant in Argentina. Zuari Industries acquired Globex, an offshore company registered in Dubai, to trade fertilizers and commodities.
India’s fertilizer industry: input shortages and price control compel globalization The Tata Chemicals and IFFCO acquisitions highlight a long-established, but now discernibly-rising, trend in India’s fertiliser industry: that is, overseas joint ventures, often in partnership with host country governments, to secure inputs for fertiliser plants back home and expand international exports. Two compulsions are at play. First is India’s shortage of critical fertiliser inputs (natural gas, naptha, urea, potash, etc) which forces Indian fertiliser firms to rely on imports.21 International price swings impact them hard, given governmental price controls on fertilisers.22
Going global liberates them from these controls, as rising international fertiliser prices make export-oriented overseas operations increasingly attractive. It also enables them to produce fertilizer inputs in the world’s lowest-cost locations, on a scale inconceivable in densely-populated India. For this reason, IFFCO has made strategic investments in Australia (rock phosphate), and Oman, Senegal and Jordan (phosphoric acid).23 Tata Chemicals, which has operations in the United States, United Kingdom and Kenya, is investing in a US$290 million, greenfield, port-based, ammonia-urea fertiliser manufacturing complex in Gabon with Singapore’s Olam International.
Other counterparts are Chambal Fertilisers and Chemicals, which has a stake in Indo Maroc Phosphore; Coromandel International and the Gujarat State Fertiliser Corporation, which have jointly tied up with Tunisia’s Groupe Chimique Tunisien to manufacture phosphoric acid, and Nagarjuna Fertilizers and Chemicals’ tie-up with the Nigerian Government to build a series of petrochemical fertiliser plants throughout the country.
Drip Irrigation Equipment – Jain Irrigation Systems, an Indian drip irrigation pioneer, undertook six acquisitions to emerge as the world’s second-largest drip irrigation company. Its first purchase, Eurodrip, a Greek drip irrigation pioneer, brought it sales in forty countries and manufacturing plants in the United States, Turkey, Jordan, Egypt and Greece. Three United States takeovers followed, giving it privileged access to state-of the art technology in the world’s largest irrigation market.24 But, it was its acquisition of NaanDan Irrigation Systems, an Israeli micro-irrigation pioneer, specialising in solutions for oilseeds, potato and cotton, that transformed it into the world’s second-largest drip and sprinkler irrigation firm.25

Premila Nazareth Satyanand
37
Though the company’s dominant market is still India26 (the world’s fastest micro-irrigation market27), its longer term strategy is to dramatically grow business in Africa, Central Asia and the Middle East by creating innovative solutions for small farmers in water-strapped countries.
Tea – Tata Tea, the Apeejay Surrendra Group, McLeod Russel, and Jayshree Tea made eleven tea-related acquisitions between them. First to globalise were Tata Tea and the Apeejay Surrendra Group. Tata Tea bought the United Kingdom’s Tetley Tea for US$450 million in 2000, and the latter Premier Foods’ Typhoo Tea/related brands28 for US$138 million in 2005. Both companies sought to penetrate deeper and wider into profitable industrialised markets, by integrating well-recognised global brands and state-of-the-art tea British processing and packaging facilities with extensive tea production back home.
McLeod Russel’s and Jayshree Tea & Industries’ purchases are tea plantations, primarily in Africa. Here, governments are seeking experienced private partners for public-sector tea companies to boost capacity and global competitiveness. McLeod Russel, which acquired Vietnam’s Phu Ben Company, bought Uganda’s Rwenzori Tea Investments and a majority stake in Rwanda’s Gisovu Tea Company (by acquiring Olyana Holdings). It is now the world’s largest tea planter, producing 100 million kilograms of high-quality tea a year and employing 90,000 people.29 Following the purchase of Uganda’s Kijura and Bondo tea companies and majority stakes in Rwanda’s government-owned Mata Tea and Gisakura Tea companies, Jayshree Tea is the world’s third-largest tea producer.30
Foods – Packaged foods account for eight M&As, and food ingredients and raw foods for two M&As each. The Global Green Company took over Belgian’s Intergarden Group and Hungary’s Puszta Konzerv to emerge as a global pickled/ frozen vegetable food company, with a ten-country operation growing, manufacturing, distributing and selling pickled gherkins and cornichons, sweet-corn, silver-skin onions, jalapeno and paprika, cherries, capers and mixed vegetables to customers in over 50 countries.. Britannia Industries invested in, and then acquired, two leading Middle Eastern biscuit/cookie makers: Al Sallan Food Industries and Strategic Foods International. Together, these firms have global sales of US$33 million and offer over 55 biscuit/wafer varieties. Tata Chemicals, which commands nearly half of the Indian market for table salt, bought British Salt, which controls 50% of the British market. The LT Overseas and ADF Foods acquisitions show Indian packaged and processed food firms positioning themselves to serve the rapidly-expanding market for international foods in the United States and Europe. LT, which is one of India’s top basmati rice millers and marketers, bought Kusha Inc, a United States basmati rice importer and retailer, with 42% of the local market. The first Indian food firm to take over an American counterpart, LT Overseas now ranks amongst the United States’ largest basmati retailers. ADF Foods, a global retailer of Indian packaged foods (including pickles, chutneys, spices, and ethnic Indian canned and frozen foods) acquired Elena’s Food Specialities, a leading United States producer of natural, organic and Mexican foods. It thus gained control of Elena’s strong brand credibility and distribution network in the mainstream American market. Jain Irrigation Systems has built a dehydrated foods/ foods ingredients business by acquiring Cascade Specialities, a United States firm specializing in vegetable dehydration, and a majority stake in Sleaford

India’s Agriculture and Food Multinationals: A First Look
38
Quality Foods, a leading British supplier of dehydrated vegetables, spices, herbs, dehydrated fruits, soup mixes, pulses, and canned vegetables to the local and international food industries.31 In the ‘raw foods’ space, Shree Renuka Sugars’ $245 million acquisition of a 51% stake in Equipav SA Açúcar e Álcool and its take-over of Vale do Ivai Acucar e Alcool, both leading Brazilian sugar and ethanol companies, have made it the world’s fifth-largest sugar producer and one of its largest sugar refiners.32 Shree Renuka Sugars now has an assured supply of inputs at half the Indian price33 and control of one of Brazil’s largest, most modern, vertically-integrated operations, moving it closer to its objective of building a domestic network of sugar refineries and boosting processed sugar production. Floriculture and bio-diesel – Floriculture and bio-diesel account for three M&As. Tata Chemicals has invested in a one-third stake in JOil, a jatropha seedling company set up by Singapore’s Temasek Life Sciences Laboratory, to secure access to good quality planting material for its biofuels programme. The partnership also gives Tata Chemicals exclusive seedling marketing rights in India and East Africa, at a time when renewable energy is being given the highest policy priority. Karuturi Global and Neha International have both acquired African rose-production firms to emerge as leading global rose and flower exporters. Both were set up in the mid-1990s, as ‘export-oriented’ floriculture units, and both began to grow roses in Ethiopia for export to OECD economies. Karuturi’s 2007 acquisition of Kenya’s Sher Agency made it the world’s largest cut-rose producer, as also the only Indian firm to be listed by UNCTAD’s World Investment Report 2009. In 2008, Neha International bought Mauritius-based Globeagro Holdings, acquiring Alliance Flowers, Holetta Roses, and Oromia Wonders, and become a leading Ethiopian rose exporter to Japan. These two companies are also amongst the pioneers of India’s rapidly-expanding agricultural investments in Africa. Seeing the potential for a wider range of agricultural produce, Karuturi Global leased 300,000 hectares of land in Ethiopia, on which it now cultivates wheat, maize, palm oil, and rice, largely for export. Neha International has followed, relocating all strategic operations from India to Africa.
India’s expanding overseas investments in agriculture Since 2009/2010, a range of Indian agro-product firms have begun to invest in large-scale cultivation (mainly maize, pulses, soyabean, wheat, rice, but also some biofuels) in Africa. They are actively encouraged by African governments seeking to foster investment and economic activity in impoverished rural areas. India is seen as a preferred partner, given its similar agricultural conditions and long-standing ‘South-South’ connections with Africa. India’s largest edible oil firms, such as Ruchi Soya, KS Oils, and Godrej Agrovet, are the most visible of this group of globalisers. They are being driven largely by domestic oilseed shortages that make India, the world’s third-largest edible oil consumer, its largest edible oil importer as well. 34 India’s edible oil companies are vulnerable to global price shifts, but corporate landownership restrictions constrain them in reducing their dependence on imports by boosting domestic production. They have thus begun to invest in growing oil palm and soya bean overseas, since palm oil and soya bean oil account for over a half of India’s edible oil consumption. The expense of mature plantations in Malaysia and Indonesia make

Premila Nazareth Satyanand
39
greenfield African plantations the most attractive. For the same reason, Indian edible oil and agro-product firms have begun to invest in Latin America, with bilateral agricultural cooperation adding further momentum. Also a key driver is that India’s leading edible oil and agro-product firms are seeking to grow from domestic players into branded, globally-significant firms.35
4. Observations
From this examination, four sets of compulsions – often overlapping – appear to be at play in encouraging India’s agriculture and food firms to go global. These are: a. Access to state-of –the-art technology United Phosphorus, Jain Irrigation Systems, Advanta, Punjab
Crop Chemicals and Crop Protection, ITC, Tata Global Beverages’ health drink and Tata Chemicals’ JOil acquisitions have all been driven primarily by the desire to obtain the world’s best technology so as to evolve into dominant players in their segment.
b. Building international market share and credibility The compulsion to build international market
share and credibility appears to be the strongest with Tata Tea, the Apeejay Surrendra Group, and the United Breweries Group (including United Spirits). Leading domestic players in their segment, they all found it challenging to boost global market share because of historical Western perceptions about the poor quality of Indian products. Market share and distribution, rather than credibility, was the primary driver for the LT Overseas, Karuturi Global, Neha International, the Global Green Company, Britannia Industries, Café Coffee Day, ADF and Jain Irrigation System’s Sleaford Quality Foods takeovers.
c. Access to raw materials All the fertiliser firms and all the agricultural production (tea, floriculture,
sugar and edible oil) firms are driven by the search for raw materials. The primary compulsion has been India’s regulatory restrictions on large-scale corporate land control/ use. Karuturi Global’s current Indian landholding, for instance, is 2,730 acres, 36 as opposed to its 300,000 hectares in Ethiopia alone.
d. Access to interesting new products Firms want to bring novel offerings to existing consumers, to
boost interest and market share. This motivation appears the strongest for the Siva Group, Britannia Industries, Amalgamated Bean Coffee Trading Company, Global Green, Champagne Indage, and United Breweries. Products from newly-acquired international portfolios are being offered to Indian consumers/farmers, and Indian products to overseas ones. Cross-fertilisation is becoming increasingly profitable due to the growing internationalisation of food tastes globally.
5. Conclusions
India’s immense domestic market – of 1.21 billion people – will remain key priority for Indian globalisers in agriculture and food, possibly more than in any other sector. The size and rapid growth of India’s
India’s Agriculture and Food Multinationals: A First Look
40
market is enabling some of India’s top firms to “become global out of India,”37 that is, attain global leadership by winning hundreds of millions of customers in India. However, India’s increasingly open agricultural inputs and processed food sectors is forcing them to compete with the world’s top players on home turf, compelling them to ensure world-class offerings. This would account for the M&A concentration in crop protection, seeds fertilisers, and irrigation equipment segments (agricultural inputs) and tea, food and beverages, all of which segments are completely open to FDI.
There is little OFDI in the agricultural production and retail verticals, where India prohibits FDI and only recently permitted Indian corporate involvement. (This contrasts with international patterns of agriculture and food FDI which concentrate in these verticals). For this reason, Indian agricultural production and retail firms are not subject to international competition, and so have not developed the necessary momentum to be globally competitive. International experience is now beginning to be developed, but, in a foreign petri dish – that is, India’s large land-leases in Africa, Latin America and, to some extent, South East Asia. In this context, it will be interesting to see whether India’s agricultural production firms become globally-competitive over the next decade, given the variety of support and concessions they are receiving from both host38 and home governments. 39 Since commodity prices are poised to remain high for some years, 40 India’s food production firms are likely to step up overseas investments to boost production, as also to extend their reach within an array of profitable international markets. Questions for further research India’s nascent experience with OFDI in agriculture and food presents variety of significant issues for research. Among these are:
1) A listing of all major Indian agro-product, agri-business, and food and beverage firms with foreign direct investments.
2) An analysis of the varying drivers compelling the globalisation of these firms. 3) An examination of the developmental impact, if any, of Indian agricultural OFDI on the domestic
agricultural sector? In particular: a. Is there a differential developmental impact across individual agriculture, food and
beverage verticals? b. Is there a differential impact by mode of entry: that is, acquisition versus greenfield versus
non-equity arrangements? 4) An analysis of the policy implications of the rise in Indian OFDI in this sector for Indian
agriculture as a whole? That is, should India boost domestic food availability by encouraging its agriculture and food firms to globalise via bilateral agricultural partnerships, or should it focus more squarely on reforming Indian agriculture to attract more private sector investment?
5) A study of how India’s globalisation path in this sector compares with that of other major Emerging Market agricultural producers, including China and Brazil.
Premila Nazareth Satyanand
41
End Notes
1 Satyanand, Premila Nazareth and Pramila Raghavendran (2010). Outward FDI from India and its Policy Context. Columbia FDI Profiles, 22 September 2010. Vale Columbia Centre on Sustainable International Investment, New York, USA. 2 UNCTAD (2009).World Investment Report 2009: Transnational Corporations and Agricultural Production. Geneva, Switerland, 2009: 118, Figure III.13. 3 The report lists i) the world’s top 25 agriculture-based and plantation TNCs (Karuturi Global ranks twenty-third), ii) the world’s top 25 TNC suppliers of agriculture; iii) the world’s top 50 food and beverage TNCs, iv) the world’s top 25 food retail TNCs, and v) the world’s 25 largest privately owned agri-food TNCs. Rankings in the first four categories are based on foreign assets (2007). Rankings in the fifth category are based on foreign sales (2006). 4 KPMG and ASSOCHAM (2009). Food processing and agribusiness. New Delhi, India 5 India processes just 2.2% of its fruits and vegetables, as against the United States’ 65%, the Philippines’ 78% and China’s 23%. It processes just 26%, 6% and 20% of its marine, poultry and buffalo meat output, as against 60 to 70% in developed countries. Within India, fruit and vegetable processing (2.2%) is much lower than milk (35%) and marine product (26%) processing. 6 All data in this paragraph is from the Centre for Monitoring Indian Economy, an independent economic think-tank, which has India’s largest and most comprehensive database on the Indian economy and corporate sector. Much of its corporate data is drawn from company annual reports. 7 Both sets of figures are for FY 2010. 8 Centre for Monitoring Indian Economy. 9 Balance of Payments Statistics, Reserve Bank of India. 10 Grant Thornton India, a member of Grant Thornton International, is a leading Indian accounting and consulting firm. Among other things, it studies Indian M&A and private equity deals, analysing key trends in cross-border transactions. It publishes an annual listing and analysis of all M&A and PE deals that year, known as the Grant Thornton Dealtracker Annual. 11 Strictly speaking, there are 68 such deals. But since two of them, Gateway Distriparks’ 2006 purchase of Snowman Frozen Foods and Mirah Group’s 2010 takeover of Mad Over Donuts, involve the takeover of purely Indian operations, they are omitted from this analysis. 12 Company website: www.unitedspirits.in/ 13 Company website: www.indagegroup.com 14 According to press reports these transactions appear to have run into financial difficulties. 15 According to Datamonitor, an industry research firm, India’s alcoholic beverages market is likely to exceed $39 billion by 2014, driven by growing disposable incomes and social acceptance of alcohol consumption. Datamonitor finds that India’s alcoholic beverages market grew at a compound annual growth rate of 12% between 2004 and 2009, with the industry turnover touching $21.7 billion in 2009. India is a particularly attractive market, since alcohol consumption has now reached a plateau, and is even declining, in traditional Western markets. 16 Tata Global Beverages sold this stake at a huge profit to Coca Cola, during the latter’s takeover of Energy Brands in May 2007. 17 Tata Global Beverages is also collaborating with PepsiCo to develop healthy, non-carbonated beverages. 18 United Phosphorus’ first acquisitions were in the mid-1990s, and included two European firms (Agrochemicals and Agrodan) and one United States firm. These acquisitions were designed to build its agro-chemical formulation and manufacturing capacity. 19 Economic Times.United Phosphorus: Low Stock Valuation Offers Great Opportunity, 14 March 2011 20 United Phosphorus website: www.uplonline.com/UPLPressrelease.pdf 21 For example, India’s entire potash requirement is met through imports, which have tripled from 2.3 million tonnes to 6.4 million tonnes between 2003 and 2011. 22 These controls are intended to keep prices low for India’s millions of poor farmers. 23 It has also tied up with Legend International Holding in Australia, Industries Chimiques du Senegal, Jordan’s Phosphates Mine Company, and with the Oman Oil company to produce granulated urea and ammonia. 24 These were Chapin Watermatics, specialising in drip tape for subsoil applications like sugarcane; Aquarius Brands, which designs and produces micro-irrigation systems for agriculture, landscape and nursery applications; and Point Source Irrigation, which manufactures and distributes micro-irrigation products. 25 Its most recent purchase was Thomas Machines, a Swiss firm producing plastic extrusion equipment. 26 India accounted for 65% of the company’s 2010 revenue, with the remaining 35% split evenly between Europe, North America and the rest of the world.

India’s Agriculture and Food Multinationals: A First Look
42
27 50% of India’s arable land is still rain-fed, despite sixty years of investment in a national network of irrigation canals. Not surprisingly, India is now the world’s fastest-growing micro-irrigation market, as its farmers and policy-makers actively search for more water-efficient methods to increase agricultural yields. 28 Along with Typhoo, the Apeejay Surrendra Group also acquired other Premier Foods brands, including London Fruit and Herb, Health and Heather, Melroses and Ridgeways. 29 Company website: www.mcleodrusselindia.com 30 Company website: www.jayshreetea.com 31 The first acquisition transformed Jain Irrigation into India’s leading manufacturer of dehydrated onions, the ingredient most-used in processed foods globally. The second brought it privileged access to global clients, to whom it can now also sell fruit pulp and concentrate from its long-standing Indian fruit processing business. 32 Company website: www.renukasugars.com 33 Since Brazil is the world’s largest sugar producer/ exporter, Brazilian sugar cane is available for Rs1,000 per tonne, in contrast to India’s Rs1,800 - 2,300 per tonne. 34 India’s oilseed production significantly lags its burgeoning edible oil demand, and imports stand at a half its current annual consumption of 16.6 million tonnes. 35 KS Oils says on its website that it wants to be “a leading agri-commodity player with interests in palm plantations, oil mills, agri-commodity trading, export and import of edible oils – and other value-added areas, such as logistics, port facilities and ocean carriers.” 36 Business Standard interview with Sai Ramakrishna Karuturi, Managing Director, Karuturi Global. www.business-standard.com/india/news/qa-sai-ramakrishna-karuturi-md-karuturi-global/407379/ Of its existing 130 acres, 24 acres is self –owned and the other 96 acres is contract-farmed. It has also just been granted use to another 2,600 acres. 37 Author’s interview with Ravi Nedungadi, Chief Financial Officer of the United Breweries Group in September 2008. 38 Ethiopia has considerably reduced its land rents to attract foreign investment in agriculture, particularly since much of this land has been war-torn for years. 39 The National Bank for Agriculture and Rural Development is in the process of instituting a fund to finance Indian entrepreneurs establishing farm operations abroad. This is a marked departure from the Indian Government’s traditional ‘hands off’ approach to Indian OFDI in other sectors, where it has provided no special support to globalizing firms. 40 International Monetary Fund (2011), World Economic Outlook, Washington D.C., USA References UNCTAD (2009), World Investment Report: Transnational Corporations, Agricultural Production and Development,
Geneva, Switzerland.
Grant Thornton Deal Tracker, Annual Issues 2005, 2006, 2007, 2008, 2009, 2010
Boston Consulting Group (2008), The 2008 BCG 100 New Global Challengers: How Top Companies from Rapidly Developing Economies Are Changing the World, Boston, USA.
Boston Consulting Group (2009), The 2009 BCG 100 New Global Challengers: How Companies from Rapidly-Developing Economies are Contending for Global Leadership, Boston, USA.
Boston Consulting Group (2011), 2011 BCG Global Challengers: Companies on the Move - Rising Stars from Rapidly Developing Economies Are Reshaping Global Industries, Boston, USA.
Newspaper articles
Africanews.com (2010), ‘India eyes Africa palm plantations’, September 26 Business Standard (2010), ‘ADF Foods completes buyout of Elena's Food Specialties’, November 9 Business Standard (2010), ‘Iffco buys stakes in Canadian firms’, February 11 Business Standard (2010), ‘Now, agri commodity firms diversify sourcing, eye assets abroad’, March 8 Business Standard (2010), ‘Siva Group buys 50% stake in premium bottled water maker Isklar’, March 10

Premila Nazareth Satyanand
43
Business Standard (2010), Tata Global Beverages acquires minority stake in US firm Activate, October 27 Commodity Online (2010), ‘NABARD likely to fund foreign farm acquisitions’, November 27 Economic Times (2007), ‘LT Overseas acquires US rice firm Kusha’, December 24 Economic Times (2010), ‘Indian companies buy land abroad for agricultural products’, January 2 Economic Times (2010), ‘Indian companies get into commercial farming in Africa’, June 13 Financial Express (2009), ‘Indian edible oil FMCG major K S Oils to drive global expansion from Singapore’, April 21 Financial Express (2010), ‘Argentinian farmers to grow pulses to meet India's demand’, September 16 Financial Express (2010), ‘India, Argentina to take up agri-exports issues’, August 2 Financial Express (2010), ‘Pawar’s LatAm visit to boost agri ties’, August 27 Financial Express (2011), ‘A new crop of farmers’, 15 January Financial Express (2011), ‘Ethiopia invites Indians for pulse farming’, February 2 Financial Express (2011), ‘Ethiopia seeks investment from India’, January 30 Gambela Today (2009), ‘Ethiopian Farms Lure Investor Funds as Workers Live in Poverty’, December 30 Gambela Today (2010), ‘Fear expressed over India’s massive land grabs in Gambela’, August 29 Ground Reality (2009), ‘Food pirates: Indian firms buying farm land in Africa’, June 26 Hindu Business Line (2007), ‘Jain Irrigation gets new product lines thru acquisitions’, 31 May Hindu Business Line (2009), ‘Britannia brings W. Asian arms under its fold’, September 1 Hindu Business Line (2009), ‘Iffco to set up phosphoric acid unit in Jordan’, October 7 Hindu Business Line (2010), ‘Coffee Day buys Czech chain’, June 2 Hindu Business Line (2010), ‘Jain Irrigation buys UK Co Sleaford Quality Food’, November 4 Hindu Business Line (2010), ‘Nabard may soon fund Indians setting up farms abroad’, 27 November Hindu Business Line (2011), ‘India has small share of world’s vegetable export: Sharma’, March 7 Hindu Business Line (2011), ‘India-Africa partnership to fight dryland poverty’, March 25 Hindu Business Line (2011), ‘Tata Chem beats raw material, policy risks with African foray’, April 12 Hindu Business Line (2011), ‘Tata Chem joins Singapore firm to set up fertiliser unit in Gabon’, April 12 India Business Blog (2010), ‘Indian firms entering the South American agriculture sector in a big way!’, September 13 India Today (2009), ‘The 2000 Tata Tea-Tetley merger: The cup that cheered’, December 28 Microfinance Africa (2010), ‘African Agriculture: An Abiding Investment Venue for India’, July 19 Mint (2010), Shree Renuka’s Brazilian acquisition insulates it from India’s sugar cycle, February 23 MSN.com (2011), ‘Ruchi Grp earmarks USD 150-mn for expansion over three-years’, March 11 Outlook Money (2009), ‘Keeping track’, December 1 Reuters Africa (2010), ‘India Ruchi eyes Africa plantations, export jump’, September 25 Reuters India (2009), ‘KS Oils to invest 3.8 bln rupees in Indonesia’, October 7 The Economist, Crop circles, 11 March 2010 Annexure I: Indian Food and Beverage MNCs (ranked by net sales)
I: FIRMS AMONG INDIA’s ‘TOP 1000 BY NET SALES’ (Publicly-listed firms)
Company BS1000 Rank
Net Sales* (FY 2010, US$mn)
Total Assets*
(US$mn)
Foreign Assets!
(US$mn) Sector
I T C 32 4,252 5,329 10 Tobacco/processed foodsRuchi Soya 39 3,174 1,775 0.004 Edible oil, soya productsEID Parry 62 1,679 1,404 10 Sugar and confectionary United Spirits 79 1,414 2,548 171 Alcohol Tata Global Beverages 87 1,285 1,591 323 Tea and wellness drinks
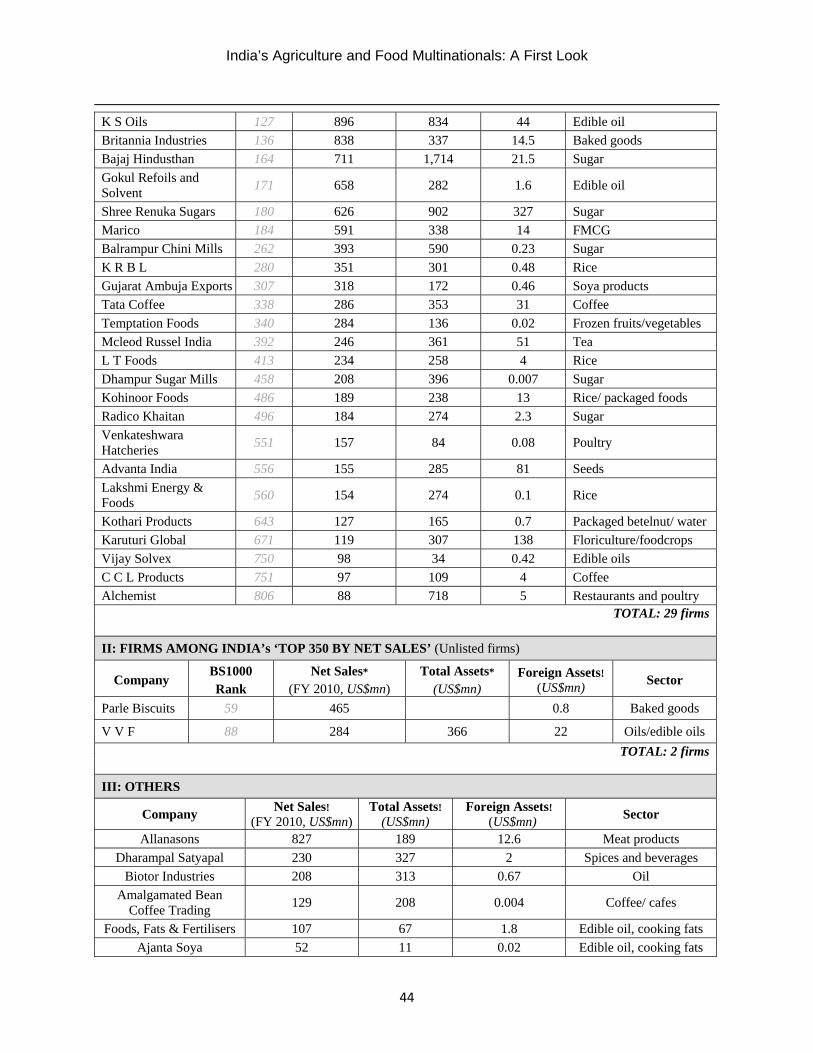
India’s Agriculture and Food Multinationals: A First Look
44
K S Oils 127 896 834 44 Edible oil Britannia Industries 136 838 337 14.5 Baked goods Bajaj Hindusthan 164 711 1,714 21.5 Sugar Gokul Refoils and Solvent 171 658 282 1.6 Edible oil
Shree Renuka Sugars 180 626 902 327 Sugar Marico 184 591 338 14 FMCG Balrampur Chini Mills 262 393 590 0.23 Sugar K R B L 280 351 301 0.48 Rice Gujarat Ambuja Exports 307 318 172 0.46 Soya products Tata Coffee 338 286 353 31 Coffee Temptation Foods 340 284 136 0.02 Frozen fruits/vegetables Mcleod Russel India 392 246 361 51 Tea L T Foods 413 234 258 4 Rice Dhampur Sugar Mills 458 208 396 0.007 Sugar Kohinoor Foods 486 189 238 13 Rice/ packaged foods Radico Khaitan 496 184 274 2.3 Sugar Venkateshwara Hatcheries 551 157 84 0.08 Poultry
Advanta India 556 155 285 81 Seeds Lakshmi Energy & Foods 560 154 274 0.1 Rice
Kothari Products 643 127 165 0.7 Packaged betelnut/ waterKaruturi Global 671 119 307 138 Floriculture/foodcrops Vijay Solvex 750 98 34 0.42 Edible oils C C L Products 751 97 109 4 Coffee Alchemist 806 88 718 5 Restaurants and poultry
TOTAL: 29 firms
II: FIRMS AMONG INDIA’s ‘TOP 350 BY NET SALES’ (Unlisted firms)
Company BS1000 Rank
Net Sales* (FY 2010, US$mn)
Total Assets* (US$mn)
Foreign Assets! (US$mn) Sector
Parle Biscuits 59 465 0.8 Baked goods
V V F 88 284 366 22 Oils/edible oilsTOTAL: 2 firms
III: OTHERS
Company Net Sales! (FY 2010, US$mn)
Total Assets!(US$mn)
Foreign Assets! (US$mn)
Sector
Allanasons 827 189 12.6 Meat products Dharampal Satyapal 230 327 2 Spices and beverages
Biotor Industries 208 313 0.67 Oil Amalgamated Bean
Coffee Trading 129 208 0.004 Coffee/ cafes
Foods, Fats & Fertilisers 107 67 1.8 Edible oil, cooking fats Ajanta Soya 52 11 0.02 Edible oil, cooking fats
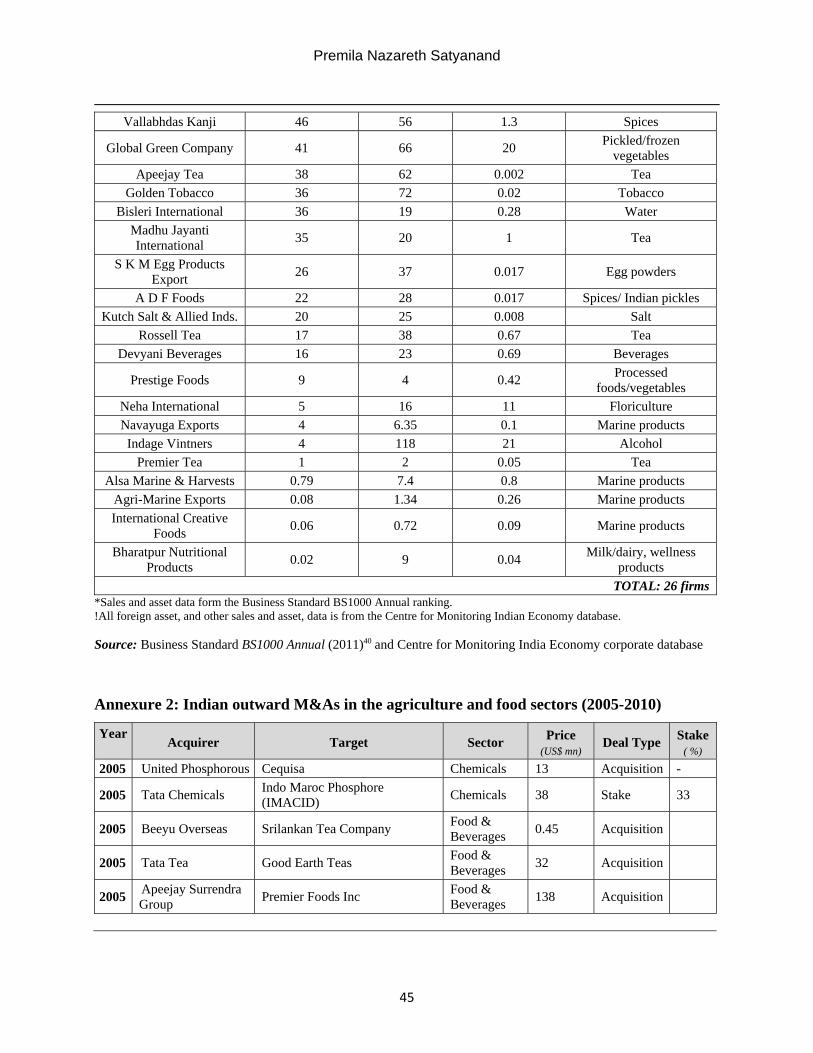
Premila Nazareth Satyanand
45
Vallabhdas Kanji 46 56 1.3 Spices
Global Green Company 41 66 20 Pickled/frozen vegetables
Apeejay Tea 38 62 0.002 Tea Golden Tobacco 36 72 0.02 Tobacco
Bisleri International 36 19 0.28 Water Madhu Jayanti International 35 20 1 Tea
S K M Egg Products Export 26 37 0.017 Egg powders
A D F Foods 22 28 0.017 Spices/ Indian pickles Kutch Salt & Allied Inds. 20 25 0.008 Salt
Rossell Tea 17 38 0.67 Tea Devyani Beverages 16 23 0.69 Beverages
Prestige Foods 9 4 0.42 Processed foods/vegetables
Neha International 5 16 11 Floriculture Navayuga Exports 4 6.35 0.1 Marine products Indage Vintners 4 118 21 Alcohol
Premier Tea 1 2 0.05 Tea Alsa Marine & Harvests 0.79 7.4 0.8 Marine products
Agri-Marine Exports 0.08 1.34 0.26 Marine products International Creative
Foods 0.06 0.72 0.09 Marine products
Bharatpur Nutritional Products 0.02 9 0.04 Milk/dairy, wellness
products TOTAL: 26 firms
*Sales and asset data form the Business Standard BS1000 Annual ranking. !All foreign asset, and other sales and asset, data is from the Centre for Monitoring Indian Economy database. Source: Business Standard BS1000 Annual (2011)40 and Centre for Monitoring India Economy corporate database Annexure 2: Indian outward M&As in the agriculture and food sectors (2005-2010)
Year
Acquirer Target Sector Price (US$ mn)
Deal Type Stake( %)
2005 United Phosphorous Cequisa Chemicals 13 Acquisition -
2005 Tata Chemicals Indo Maroc Phosphore (IMACID) Chemicals 38 Stake 33
2005 Beeyu Overseas Srilankan Tea Company Food & Beverages 0.45 Acquisition
2005 Tata Tea Good Earth Teas Food & Beverages 32 Acquisition
2005 Apeejay Surrendra Group Premier Foods Inc Food &
Beverages 138 Acquisition

India’s Agriculture and Food Multinationals: A First Look
46
Year Acquirer Target Sector Price (US$ mn)
Deal Type Stake( %)
2006 Jain Irrigation Systems Eurodrip S.A Agro
products 4.36 Minority stake 7.5
2006 Jain Irrigation Systems Cascade Specialties Inc Agro
Products N.A. Majority Stake N.A.
2006 United Phosphorus Propanil' biz of Dow AgroSciences
Agro Products 24.86 Acquisition
2006 UB Group Bouvet-Ladubay Breweries & Distilleries 15.00 Acquisition
2006 United Phosphorus Advanta Netherlands Holdings Chemicals & Plastics 124.44 Acquisition
2006 United Phosphorus Bayer CropScience crop protection products
Chemicals & Plastics 57.56 Acquisition
2006 United Phosphorus (UPL)
DuPont Company's bensulfuron-methyl business (ex-Asia)
Chemicals & Plastics 15.00 Acquisition
2006 United Phosphorus Cerexagri, unit of Arkema Chemicals & Plastics 142.89
2006
Punjab Chemicals & Crop Protection (along with SD Agchem - Europe NV)
Sintesis Quimica Chemicals & Plastics 10.00 Acquisition
2006 Gateway Distriparks
Snowman Frozen Foods Limited FMCG 10.69 Majority
Stake
2006 Tata Tea Limited JEMCA Food & Beverages N.A. Acquisition
2006 Tata Coffee Limited Eight O'Clock Coffee Company Food &
Beverages 225.56 Acquisition
2006 Tata Tea Limited Energy Brands Inc. Food & Beverages 677.00 Significant
Stake
2006 The Global Green Company Intergarden Group Food &
Beverages N.A. Acquisition
2006 The Tetley Group (Tata Tea subsidiary)
Joekels Tea Packers Food & Beverages N.A. Significant
stake 33
2006 Britannia Industries Limited
Two bakery businesses of a Middle East-based group
Food & Beverages N.A. Strategic
stake N.A
2006 Jain Irrigation Systems Chapin Watermatics Irrigation 6.00 Acquisition
Year Acquirer Target Sector Price (US$ mn) Deal Type Stake
( %)
2007
Advanta India (Through its subsidiary Pacific Seeds Australia)
LongReach Plant Breeders Agriculture & agro-products
14.01 Controlling stake

Premila Nazareth Satyanand
47
2007
ITC Limited (through its subsidiary, Russell Credit Limited)
Technico Pty Limited Agriculture & agro-products
N.A. Acquisition
2007 Karuturi Global Sher Agencies Agriculture & agro-products
69.09 Acquisition
2007 Neha International Limited Globeagro Holdings
Agriculture & agro-products
9.61 Acquisition
2007 United Spirits Whyte & Mackay Breweries & Distilleries 1,112.99 Acquisition
2007
United Spirits (through its Cyprus-based wholly owned subsidiary Zelinka)
Liquidity Inc Breweries & Distilleries 3.00 Acquisition
2007 LT Overseas Kusha Inc Food & Beverages 20.00 Acquisition
2007 Jain Irrigation Systems Aquarius Brands Inc Irrigation 21.50 Acquisition
2007 Jain Irrigation Systems NaanDan Irrigation Systems Irrigation 50.00 Strategic
Stake
2007 Jain Irrigation Systems NaanDan Irrigation Systems Irrigation 17.50 Majority
Stake 50
2007 United Phosphorus DuPont's Super Tin and Vendex business*
Plastic & Chemicals N.A. Acquisition
2007 Punjab Chemicals & Crop Protection Source Dynamic Plastic &
Chemicals N.A. Strategic Stake 30
2007 Punjab Chemicals & Crop Protection Pegevo Beheer BV Plastic &
Chemicals 54.58 Acquisition
*These are both fungicides. Super Tin is triphenyltin hydroxide contact fungicide and Vendex is fenbutatin-oxide miticide
Year Acquirer Target Sector Price ( US$ mn)
Deal Type Stake(%)
2008 United Phosphorus Evofarms Group of Companies Agriculture & agro-products
N.A. Acquisition
2008 Advanta India Garrison & Townsend Agriculture & agro-products
10.50 Acquisition
2008 Advanta India Limagrain sunflower seed business
Agriculture & agro-products
N.A. Acquisition
2008 Jain Irrigation Systems Thomas Machines
Agriculture & agro-products
N.A. Majority Stake 69.75
2008 Tata Chemicals JOil (Singapore) Agriculture & agro-products
16.67 Strategic Stake 35

India’s Agriculture and Food Multinationals: A First Look
48
2008 Champagne Indage Darlington Wines Ltd Breweries & Distilleries N.A. Acquisition
2008 Champagne Indage VineCrest Breweries & Distilleries N.A. Acquisition
2008 Champagne Indage Loxton Winery Breweries & Distilleries 56.25 Acquisition
2008 Global Green Company
Puszta Konzerv Kft
Food & Beverages N.A. Acquisition
2008 McLeod Russel (thru its subsidiary Borelli Tea)
Phu Ben Tea Co Ltd Food & Beverages 2.00 Acquisition
Year Acquirer Target Sector Price ( US$ mn)
Deal Type Stake(%)
2009 Shree Renuka Sugars
Vale do Ivai SA Acucar e Alcool
Agriculture & agro-products
82.0 Acquisition
2009 McLeod Russel (thru its subsidiary Borelli Tea)
Rwenzori Tea Investments Agriculture & agro-products
30 Acquisition
2009 McLeod Russel (thru its subsidiary Borelli Tea)
Olyana Holdings Agriculture & agro-products
2.75 Majority stake 75
2009 Britannia Industries Al Sallan Food Industries Food & Beverages N.A Raising stake
to 100% 34.54
2009 Britannia Industries Strategic Food International Food & Beverages N.A. Raising stake
to 100% 30
Year Acquirer Target Sector Price ( US$ mn)
Deal Type Stake(%)
2010 Neha International Ltd – Globeagro Holdings
Oromia Wonders Agriculture & agro-products
9.61 Raising stake to 99.99%
49.99
2010 Zuari Industries Ltd Globex Agriculture & agro-products
N.A. Acquisition
2010 Indian Farmers’ Fertilizer Cooperative Ltd
Americas Petrogas Inc Agriculture & agro-products
N.A. Strategic stake 10
2010 Indian Farmers’ Fertilizer Cooperative Ltd
GrowMax Agri Corp Agriculture & agro-products
N.A. Strategic stake 20
2010 Advanta India Crosbyton Seed Company Agriculture & agro-products
N.A. Acquisition
2010 Shree Renuka Sugars Equipav SA Azucar e Alcool
Agriculture & agro-products
244.89 Majority stake 50.34
2010 Jayshree Tea and Industries Ltd Gisakura Tea Co Ltd Food &
Beverages NA Majority 60

Premila Nazareth Satyanand
49
2010 Jayshree Tea and Industries Ltd Mata Tea Company Ltd Food &
Beverages NA Majority 60
2010 Jayshree Tea and Industries Ltd Kijura Tea Company Food &
Beverages 2.45 Acquisition
2010 Mirah Group Mad over Donuts-Pragati Ventures
Food & Beverages N.A Strategic
stake 33
2010 Amalgated Bean Coffee Trading Company
Café Emporia Food & Beverages 3.19 Acquisition
2010 Siva Group (thru its subsidiary Lotus Venture)
Isklar Food & Beverages 22 Majority 50
2010 Jain Irrigation Sleaford Quality Foods Ltd Food & Beverages Unknown 80
2010 Tata Chemicals British Salt Ltd Food & Beverages 143.19 Acquisition
2010 ADF Foods Ltd Elena’s Food Specialities Food & Beverages Unknown Acquisition
2010 Tata Global Beverages Activate Food &
Beverages 6 Minority stake N.A.
2010 Tata Global Beverages The Rising Beverage Company Food &
Beverages Unknown Minority stake N.A.
2010 United Phosphorus DuPont’s non-mixture mancozeb fungicide Chemicals N.A. Acquisition
Source: Grant Thornton Deal Tracker Annuals: 2005, 2006, 2007, 2008, 2009, 2010
About the Author
Premila Nazareth Satyanand writes independently on foreign direct investment issues. She has worked with the United Nations Centre on Transnational Corporations, New York, as also in the Economist Intelligence Unit, New Delhi, facilitating the Government-MNC dialogue on FDI liberalisation. She has also advised foreign investors on India strategy. She has a keen interest in grassroots development issues, having lived and worked in a Himalayan village for many years. She has a B.A. in History from St. Stephen's College, New Delhi, and an M.A. in International Relations from Columbia University, New York.
Contact Information Premila Nazareth satyanand, S-349, Panchshila Park, New Delhi – 110017, Tel. 98118 52889. Email: [email protected].
Transnational Corporations Review Volume 3, Number 2 June 2011 www.tnc-online.net, [email protected], DOI:10.5148/tncr.2011.1114 50-64
50
Technology Sourcing and Outward FDI: Comparison of Chemicals and IT Industries in India
Savita Bhat1 and K. Narayanan2
Abstract: The objective of the paper is to analyze the determinants of outward FDI by firms in a developing country like India. In particular, the study investigates the role of technology sourcing in determining outward FDI, in the presence of other firm specific factors. Further, it undertakes a comparative analysis of the factors influencing outward FDI of firms for two important industries in India, namely, chemicals and information technology (IT). The analysis confirms that technology sourcing, in particular, in-house R&D is important for the decision of the firm to choose outward FDI. In the chemical industry even import of capital goods, designs, drawings and blueprints seem to be positively influencing outward investments. Size of the firm, global network linkages, skill and type of product also emerge to be important factors in determining outward FDI in both the industries. Keywords: Outward FDI, TWMNE, chemicals, information technology, India 1. Introduction Over the last fifty years, the phenomenon of internationalization of firms has captured the interest of researchers across the globe. From the point of view of developed countries, there are numerous theories and empirical studies on international trade, and existence and growth of multinational enterprises (MNEs). However, from the developing country perspective, the literature on internationalization is dominated by studies on export competitiveness of the developing country firms3 and effect of inward foreign direct investments (FDI)4 on these economies. Studies on outward FDI from developing countries are scarce.5 Some of these studies on trade and foreign direct investments explicitly acknowledge the importance of technology or innovation as a factor that can determine the direction of trade and FDI. Schumpeter (1943) was one of the first few economists to recognize that innovation of any kind whether in commodity, technology, source of supply, or organization can give definite cost and quality advantage to any firm in a competitive market. Even the strategic management literature acknowledges that technology and capabilities are important in determining competitiveness of firms and industries (Prahalad and Hamel, 1997). The eclectic theory or ownership-location-internalization (OLI) framework proposed by Dunning (1993, 2000) is a general theory of the MNEs that has been widely used as an analytical
1 Assistant Professor, Madras School of Economics, Chennai, India- 600025. Email: [email protected] 2 Professor, Department of Humanities and Social Sciences, Indian Institute of Technology Bombay, Mumbai, India- 400076. Email: [email protected] 3 Some studies on India include Kumar and Siddharthan (1994), Siddharthan and Nollen (2004), and Narayanan (2006, 2008). 4 See Kumar (1994) and Siddharthan and Rajan (2002) for details. 5 Kumar (1982), Lall (1982), and Mathews (2006) have looked into the emergence of third world multinationals in general and Pradhan (2004), Kumar (2007), Siddharthan and Narayanan (2009) and Narayanan and Bhat (2011) have specifically studied MNEs of Indian origin.
Technology Sourcing and Outward FDI: Comparison of Chemicals and IT Industries in India
51
framework to explain the presence and activities of MNEs. The framework suggests that MNEs would exist and grow if they possess ownership, location, and internalization advantages when compared to others. Here, the ownership advantages consist of the tangible and intangible assets of the firm, which also includes technology. The location advantages consist of production factors such as transportation, infrastructure, and human and natural resources that are available in the host country, and which can be effectively exploited by the firm. The internalization advantages are said to be present when the firm has a competitive advantage in producing internally rather than selling or licensing technologies to others. Dunning (1993) observes that with little modifications to the above framework one can explain the existence and activities of the MNEs from the third world economies (TWMNEs). As noted earlier, in recent years, attempts have been made to understand global competitiveness of the firms from developing countries like India and China. This paper too analyzes the determinants of global competitiveness, in terms of outward FDI, of firms from India. Specifically, it tries to understand the role of technology sourcing in facilitating outward FDI. After deregulation and subsequent liberalization, several industries in India, including chemicals and IT, have been thrown open to market forces. The firms are now facing competition from domestic as well as foreign firms. During the past one and half decades, both these industries have been witnessing various activities including adoption of differential technological strategies (Narayanan and Bhat, 2009a, 2009b). Furthermore, these two industries are also important from the point of view of development of Indian economy, as they are the backbone for several other industries in India. Hence, using the data from these two important industries, namely, chemicals (excluding pharmaceuticals and fertilizers) and information technology (IT), the study would also examine whether there are any inter-industry differences in the determinants of outward FDI in India. Further, this study uses Heckman two-step econometric technique that analyzes the determinants of level of outward FDI jointly with the determinants of decision to go for outward FDI. Section 2 gives a brief overview of the chemicals and IT industries in India. Section 3 explores the potential determinants of outward FDI. Section 4 briefly describes the sample and briefly explains the econometric technique used. Section 5 discusses the findings of the statistical analysis. Finally, section 6 gives the concluding remarks. 2. Brief overview of chemicals and IT industries in India The chemical industry is one of the oldest and highly diversified industries in the world as well as in India. Today, chemical industry plays a very important role in India’s economy. The industry is the 6th largest in the world and 3rd largest in Asia.6 During 2009-10, the production of some of the major chemicals like alkali chemicals, inorganic chemicals, organic chemicals, dyes & dyestuffs was around 7442 thousand metric tones. The chemical industry provides raw materials for many other industries like textiles, paper, leather, plastics etc. The products in this industry range from basic chemicals and its products to petrochemicals, paints and varnishes, gases, food additives, pigments, polymer additives, anti-oxidants etc.
6 Annual Report 2010-11, Ministry of Chemicals and Fertilizers, Government of India.
Savita Bhat and K. Narayanan
52
Over the last decade the Indian chemical industry has seen a shift from basic chemicals sub-sector to innovative sub-sectors such as specialty chemicals, fine chemicals, and pharmaceuticals. The dyestuff sector of the chemical industry has recently emerged as a major foreign exchange earner particularly through exports of reactive, acid, vat and direct dyes. Indian chemical industry is undergoing a phase of major restructuring and consolidation with emphasis on product innovation, brand building and environment friendliness. As compared to the Basic Chemicals industry, the IT industry is relatively new to India. The initiation of IT industry in India dates back to early 1960s. In this period, IBM (International Business Machines) and ICL (International Computers Limited) were the two main players in India, of which IBM alone accounted for 70 percent of the sales. However, today, there are several small and medium firms operating in this industry alongside industry leaders like Tata Consultancy Services, Infosys Technologies etc. During 2009-10, the production of IT and related products was estimated to be around Rs. 4,11,220 crores and the exports was estimated to be worth Rs. 2,66,330 crores.7 Due to favorable government policies many of the IT industry firms have been using the export mode to internationalize. Although, in India, evidence for overseas investment mode of internationalization could be found during 1960s, it is only after the onset of economic reforms process of 1990s that this mode has gained significance (Kumar, 2007). Thus, one can now notice many of the Indian chemicals and IT firms acquiring companies overseas or setting up subsidiaries and joint ventures abroad. For example, in 2005, Jubilant Organosys Ltd. acquired US based Trinity Laboratories, Inc, and its wholly owned subsidiary Trigen Laboratories, Inc. In IT industry, Aftek Ltd., a firm offering products and services in the area of embedded systems, mobile and wireless, and Web, acquired Arexera (a Switzerland based conglomerate) in 2005 to get into European market. Similarly, MosChip Semiconductor Technology Limited (MosChip India), a fabless semiconductor company, designs the product and the Application Specific Integrated Circuits (ASICs) either alone or jointly with its subsidiary in USA. 3. Potential determinants of outward FDI Review of literature reveals that various firm structure and conduct variables can influence outward FDI at the level of the firm. In the context of Indian industries, commonly introduced determinants include measures of technological sourcing, size of the firm, skill, age of firm and product differentiation (Pradhan, 2004; Kumar, 2007; Narayanan and Bhat, 2011). 3.1 Technology sourcing Regardless of the mode chosen for internationalization, the extent of internationalization would depend on the ownership specific assets that the firm possesses. Technology can be one such asset that can give definite competitive advantage to the firm over rivals (Dunning 1993, 2000). In the case of developing countries, technological capabilities acquired through different technological strategies is considered to be an important factor in determining competitiveness at national as well as firm level (Siddharthan and Rajan, 2002). 7 Annual Report 2009-10, Department of Information Technology, Ministry of Communications and Information Technology, Government of India.
Technology Sourcing and Outward FDI: Comparison of Chemicals and IT Industries in India
53
One of the ways of acquiring technological capabilities is through in-house R&D efforts. By means of in-house R&D efforts (RDI), firms can become proprietary owner of both product and process innovations (Pugel, 1981). In India, however, R&D expenditure as a percentage of GDP in the year 2000 was only around 0.9 percent compared to 2.7 percent for US (WTO, 2006). Nevertheless, the firms that do invest on R&D are more likely to be able to generate products and services that are unique and/or of high quality, and which have demand even in the international markets. Empirical evidences also suggest a favorable effect of in-house R&D on outward FDI. In the context of Indian manufacturing industry, both Pradhan (2004) and Kumar (2007) find R&D to have favorable effect on outward investments. In the case of IT industry too, Narayanan and Bhat (2011) obtain statistically significant positive effect of R&D intensity on the decision of the firm to invest abroad on offices, subsidiaries, and development centers. It is generally argued that firms in developed countries invest on innovative activities to achieve paradigm shifts whereas the firms in the developing countries import technology and engage in adaptive R&D or trajectory shifts (Siddharthan and Rajan, 2002). Import of capital goods and import of raw materials would bring with them latest technology embodied within the plants, machinery and equipments. Import of designs, drawings, blueprints, and patents against royalty payments also brings with them latest technological know-how in disembodied form. Often foreign equity participation has been considered as a mode of intra-firm transfer of superior technological and managerial knowledge. The developing country firms can become MNEs by taking advantage of low technology-transfer and managerial costs in their home countries (Lall, 1982). However, foreign technology imports often involve various clauses that limit the use and absorption of the imported technology (Pradhan, 2004). Hence, both Pradhan (2004) and Kumar (2007) agree that imported technology may not always be a source of generating ownership specific advantages, which is important for outward FDI. Tolentino (1993) carried out an analysis of the TWMNEs. In particular, the author looked at the role of technology in the growth of TWMNEs. It was argued that even if some of the Asian newly industrializing countries had developed their own national innovative capabilities, the main thrust for the growth of outward FDI from developing countries during the countries’ technology catch-up phase has been their policy of importing technologies and exploiting them. The foreign technology imports encourage accumulation of indigenous technological capacity in the TWMNEs, which in turn drives their growth. The empirical evidence is mixed regarding the effect of technology imports on outward FDI. While Pradhan (2004) finds the effect of foreign technology imports to be not statistically significant for Indian manufacturing industries, Kumar (2007) finds capital goods imports to have a negative effect on probability of outward investments for Indian manufacturing firms. In contrast, for IT industry, there is some evidence that import of technology, whether in embodied or disembodied form, has a favorable effect on the decision of the firm to invest overseas on offices, subsidiaries, and development centers (Narayanan and Bhat, 2011). However, foreign presence in equity of Indian IT firms did not have a statistically significant effect on the decision. 3.2 Other variables
Savita Bhat and K. Narayanan
54
Since overseas investments involve a high degree of risk and uncertainty, only the large firms with a high amount of resources may be willing to invest overseas. Large size also gives the firm advantages with respect to brand loyalties and price-setting power (Krugman, 1979) apart from financial strength and easy access to market information (Pradhan, 2004; Kumar, 2007). Studies in the context of developed countries have found size of the firm to be highly relevant in determining FDI, once industry specific factors are taken into account (Horst, 1972; Grubaugh, 1987). Even in the case of developing countries, empirical evidences do find size of the firm to be important factor in determining overseas investment (Pradhan, 2004; Kumar, 2007; Narayanan and Bhat, 2011). Age of the firm can denote the accumulated knowledge of the firm over its years of operation. Firms with longer span of operation in any industry are likely to have acquired higher amount of tacit assets including managerial skills and reputation (Kumar, 2007). In the case of international new ventures, firms may learn and recognize new opportunities for investments as they continue their operations (Zahra, 2005). Empirical evidences do support the idea that age is an important factor in explaining outward FDI of Indian manufacturing firms (Pradhan, 2004; Kumar, 2007). However, for IT industry in India age of the firm was not statistically significant in determining decision of the firm to invest overseas. Presence of high skilled employees in the firm can also endow the firm with ownership specific advantages. The technical, marketing and managerial skills would help in product diversification, efficient allocation of resources, and efficient production of goods and services (Lall, 1982). Caves (1974) and Pugel (1981) noted that American firms expanded overseas due to abundance of entrepreneurial skills in the firms. In general, a firm spending higher amounts on labor might be either employing better skilled labor or more number of semi-skilled labors. In both the cases the skills of the labor can be utilized for overseas operations. In the case of India, both Pradhan (2004), and Narayanan and Bhat (2011) find evidence that skill factor may have a positive effect on outward FDI of firms. Extensive market promotion of a product may help a firm in creating a niche market for the product. These intangible goodwill assets may give ownership specific advantages to the firms (Pugel, 1981). It is generally believed that TWMNEs do not have strong product differentiation advantages (Pradhan, 2004). Nevertheless, firms that are able to differentiate their product and build brands may enjoy relatively high premium especially in knowledge-intensive industries (Kumar, 2007). Pradhan (2004) did not find the variable representing product differentiation to be statistically significant. However, Pugel (1981) for US manufacturing industry and Kumar (2007) for Indian manufacturing industry do find product differentiation to have a favorable effect on the probability of outward investments by Indian manufacturing firms. Another variable that can be important in determining overseas investments by the firms is capital productivity. In general there is an agreement that there are differences in productivity, including capital productivity, between developing countries like India and developed countries, where the former have lower productivity than the latter (Hsieh and Klenow, 2009). These lower levels of productivity in developing countries have also been attributed to bad managerial practices and decision making (Bloom et. al., 2010). Hence, a firm that is having high capital productivity may be considered to be good at decision making and utilization of resources, especially capital. Hence a firm India with higher capital productivity is likely to have competitive advantage over other inefficient firms from India while setting up

Technology Sourcing and Outward FDI: Comparison of Chemicals and IT Industries in India
55
manufacturing units overseas. At the same time, small value on capital productivity or large value on capital intensity (inverse of capital productivity) may indicate that the firms are trying to build up capacities or are in general on an expansion spree. Pugel (1981) did find capital requirement to positively determine outward FDI for the US manufacturing industries. Recently, firms from developing countries have been seen to be employing catch-up strategies to compete. In this strategy the firms rapidly internationalize by efficiently using their multiple global connections (Mathews, 2006). In the case of IT sector in India, most of the Indian software firms carry out work onsite rather than offsite for their overseas clients. In such cases, firms that have development centers and subsidiaries abroad would be in a better position to gain confidence of their prospective foreign clients. Even in the case of chemical industry the firms that have global network linkages may be able to successfully establish an overseas subsidiary or acquire a company abroad. Firms often take the help of outside agents or outside firms to execute parts of their production process. If a firm were aware of its strengths then by outsourcing mundane tasks and by engaging all its resources on its core-competencies the firm would be able to sustain its competitiveness. The resources that are freed up on account of outsourcing may be directed towards overseas investments. The affiliation of the firm to business houses, government (commercial enterprises), or foreign firms can give extra advantages the firms in terms of access to various resources important for successful overseas ventures. Firms affiliated to business houses can make use of brand names and contacts from their other businesses. Similarly, the foreign firms would also have brand names and contacts outside India. Even the government owned commercial enterprises could avail of the resources and power of the government to establish subsidiaries and offices abroad. Hence, affiliated firms are more likely to take the risk to invest overseas than unaffiliated ones. Different products and services may have different demand curves depending on their possible applications in other industries and their importance to the end users. Even in the international markets the demand for the products are likely to be different. Government policies may also influence the overall industrial structure and development. For example, the government of India has been giving various incentives to the software and services sector to internationalize. Hence, the hardware firms might in general be at a disadvantage when compared to software and services firms in terms of overall international competitiveness. Although, product types may be more relevant for export mode of internationalization, it may also influence overseas investment decisions if the firm makes such decision based on the proximity to the raw materials (in chemical industry) and clients (in IT industry). Location of the firm in the home country may also influence the firms’ decision to internationalize. Co-location of firms can result in sharing of information and hence, improve information about foreign markets. As Indian economy opened up, IT clusters were set up in various parts in India. Thus, peer pressures, when in a clustered location may force firms internationalize. However, the levels of overseas investments are likely to depend more on the available resources and capabilities of the firms. Internationalization is a risky activity requiring a lot of investments. One of the ways of raising capital is through securities markets. Although the securities market can be quite volatile, nevertheless, the firms

Savita Bhat and K. Narayanan
56
that are risk-taking may find it to be a good source of quick funds. At the same time, not all firms would choose the risky stock market since they have other alternatives for raising funds (such as loans from banks and personal assets). Nevertheless, the firms that do get listed on the stock market can be considered to be having higher risk taking abilities. Hence, one may find relatively higher proportions of the listed firms to internationalize as compared to the non-listed ones. However, once listed, the levels of overseas investments by the firms may depend on the stock market dynamics and other firm specific factors. 4. Sample and econometric specification The data source for the samples used in the industry is Prowess database provided by Centre for Monitoring Indian Economy (CMIE). The database claims to have information on over 25,000 listed and other firms from both private and public sectors. The companies covered in the database account for 75 per cent of all the corporate taxes and over 95 percent of excise duty collected by the Government of India. The database contains financial information on 1500 data fields and ratios like year of incorporation, sales, in-house R&D, imports of technology etc. for the firms. The chemical industry and IT industry samples used in the present analysis has been extracted based on the NIC-98 classification codes available in Prowess.8 For the purpose of this study, some of the NIC-98 classification codes (at five digit level) have been clubbed together to define the product type of the firm. The time period is for seven years, from 2001 to 2007. Both the samples are unbalanced with chemicals having 1549 observations and the IT having 2771 observations. While in the chemicals industry there are only 78 observations that have invested overseas, in the IT industry there are 799 such observations. The earlier empirical studies on outward FDI by Indian firms have either used some form of qualitative variable technique (logit in Kumar, 2007 and probit in Narayanan and Bhat, 2011) or tobit censored regression technique (Pradhan, 2004) for estimation. In this study, we do have information on the amount that a firm is investing on its group companies overseas in a given year. Hence, logit and probit techniques would not be appropriate, as they would uniformly consider a value of 1 for all the observations where there is non-zero value on outward FDI. The tobit model would also not be appropriate in the present context as it presumes that the factors affecting the decision to invest overseas are the same as those affecting the level of overseas investment and also that the effects (either positive or negative or insignificant) of these factors are same on the decision and level variables. However, this may not be true in reality. Hence, for this study we use the Heckman two-step sample selection model that takes into account the possibility of self-selection by the firms to invest overseas in a given year. Additionally the model gives scope to have differing effects of the factors on the decision and the level variables.9 Hence the estimated model may be represented as:
OIGC = Xβ + u (i) Doigc* = Zγ – ε (ii)
8 Information on NIC-98 classification code is also available on the website of Ministry of Statistics and Programme Implementation, Government of India, http://www.mospi.gov.in/ 9 See Maddala (1983) for details on limited dependent variable and qualitative variable estimation techniques

Technology Sourcing and Outward FDI: Comparison of Chemicals and IT Industries in India
57
where OIGC is the level of overseas investment, X and Z are vectors of exogenous variables, β and γ are vectors of coefficients on X and Z, respectively, and u and εare stochastic error terms. Equation (ii) represents the selectivity criterion with Doigc*) as the dependent variable that is not observed. Instead Doigc* has a dichotomous realization D that is related to D* as follows:
D = 1 iff Doigc* > 0 = 0 otherwis (iii)
The dependent variable OIGC conditional on X and Z has a well-defined marginal distribution, however, OIGC is not observed unless Doigc* > 0. Thus the observed distribution of OIGC is truncated. The definitions of the regressand and regressors used the econometric models are given in Table 1. Studies dealing with selection models suggest that in order for the model to be identified it is important to identify at least one factor that affects the decision variable but not the intensity variable (Maddala, 1983, p. 229). The variables Dloc and Dlist are chosen to be the instrument variables in this study, which are introduced only in the selection equation and are expected to have a positive effect on the decision of firms to invest overseas. We expect all other variables to have a favorable effect on both decision to invest overseas and the levels of overseas investment, as they are likely to endow the firms with ownership specific advantages and so can have favorable effect on the firms desiring to invest overseas.
Table 1. Variables and their definitions†
Definitions Sl. Variable Symbol Basic chemical industry Information technology industry
1. Research and Development RDI (Research and Development Expenses/Sales) *100
(Research and Development Expenses/Income) *100
2. Import of Capital Goods MKI (Import of Capital Goods/Sales) *100
(Import of Capital Goods/Income) *100
3. Import of Raw Materials MRI (Import of Raw Materials/Sales) *100
(Import of Raw Materials/Income) *100
4. Import of Technology against Royalty and Technical Fee Payments
MRTI (Forex spending on Royalty and Technical Know-how/Sales) *100
(Forex spending on Royalty and Technical Know-how/Income) *100
5. Degree of Foreign Participation in the Equity
FE Percentage of Foreign Promoters holding in the Total Equity
Percentage of Foreign Promoters holding in the Total Equity
6. Decision to choose outward FDI
Doigc
Doigc = 1 if the firm has invested overseas in group companies during the year Doigc = 0 otherwise
Doigc = 1 if the firm has invested overseas in group companies during the year Doigc = 0 otherwise
7. Level of outward FDI OIGC (Overseas investments in group companies/Total Assets) *100
(Overseas investments in group companies/Total Assets) *100
8. Size of the Firm SIZE Logarithm of Sales in Lakhs of Rupees
Logarithm of Income in Lakhs of Rupees
9. Age of the Firm AGE Difference between Year under consideration and the Year of Incorporation of the firm
Difference between Year under consideration and the Year of Incorporation of the firm
10. Skill Intensity SKILL (Expenditure on Compensation to (Expenditure on Compensation to
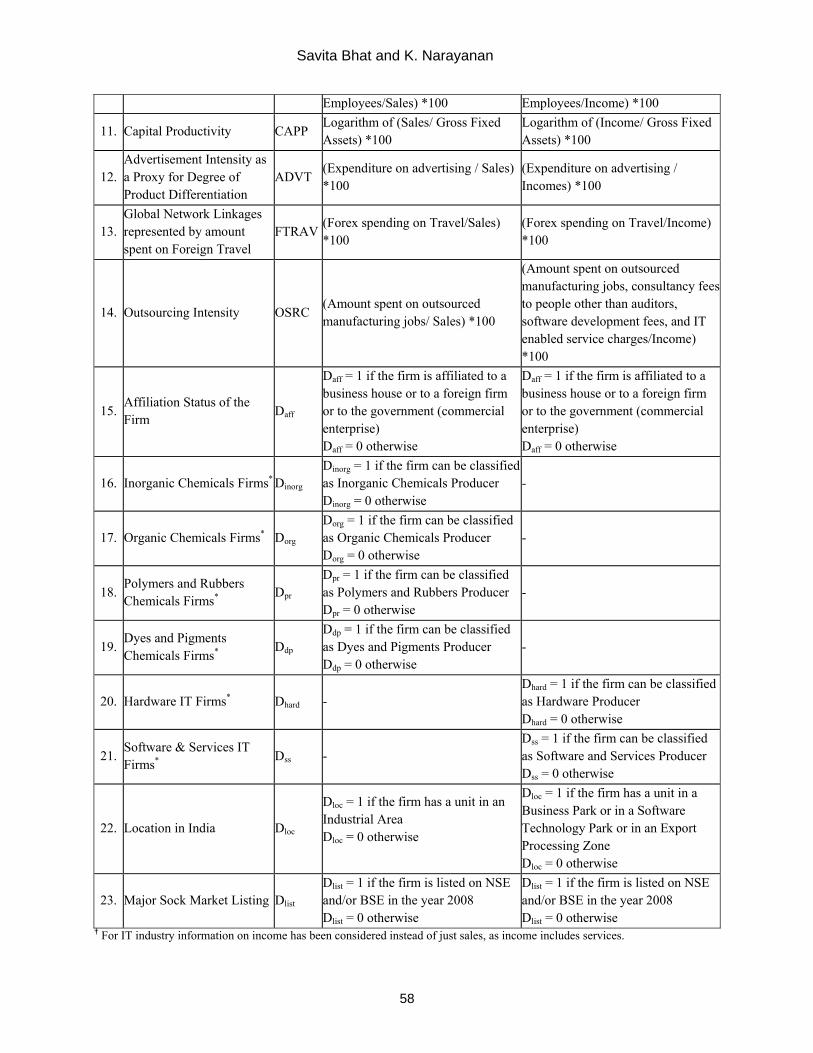
Savita Bhat and K. Narayanan
58
Employees/Sales) *100 Employees/Income) *100
11. Capital Productivity CAPP Logarithm of (Sales/ Gross Fixed Assets) *100
Logarithm of (Income/ Gross Fixed Assets) *100
12. Advertisement Intensity as a Proxy for Degree of Product Differentiation
ADVT (Expenditure on advertising / Sales) *100
(Expenditure on advertising / Incomes) *100
13. Global Network Linkages represented by amount spent on Foreign Travel
FTRAV (Forex spending on Travel/Sales) *100
(Forex spending on Travel/Income) *100
14. Outsourcing Intensity OSRC (Amount spent on outsourced manufacturing jobs/ Sales) *100
(Amount spent on outsourced manufacturing jobs, consultancy fees to people other than auditors, software development fees, and IT enabled service charges/Income) *100
15. Affiliation Status of the Firm
Daff
Daff = 1 if the firm is affiliated to a business house or to a foreign firm or to the government (commercial enterprise) Daff = 0 otherwise
Daff = 1 if the firm is affiliated to a business house or to a foreign firm or to the government (commercial enterprise) Daff = 0 otherwise
16. Inorganic Chemicals Firms* Dinorg Dinorg = 1 if the firm can be classified as Inorganic Chemicals Producer Dinorg = 0 otherwise
-
17. Organic Chemicals Firms* Dorg Dorg = 1 if the firm can be classified as Organic Chemicals Producer Dorg = 0 otherwise
-
18. Polymers and Rubbers Chemicals Firms*
Dpr Dpr = 1 if the firm can be classified as Polymers and Rubbers ProducerDpr = 0 otherwise
-
19. Dyes and Pigments Chemicals Firms*
Ddp Ddp = 1 if the firm can be classified as Dyes and Pigments Producer Ddp = 0 otherwise
-
20. Hardware IT Firms* Dhard - Dhard = 1 if the firm can be classified as Hardware Producer Dhard = 0 otherwise
21. Software & Services IT Firms*
Dss - Dss = 1 if the firm can be classified as Software and Services Producer Dss = 0 otherwise
22. Location in India Dloc
Dloc = 1 if the firm has a unit in an Industrial Area Dloc = 0 otherwise
Dloc = 1 if the firm has a unit in a Business Park or in a Software Technology Park or in an Export Processing Zone Dloc = 0 otherwise
23. Major Sock Market Listing Dlist
Dlist = 1 if the firm is listed on NSE and/or BSE in the year 2008 Dlist = 0 otherwise
Dlist = 1 if the firm is listed on NSE and/or BSE in the year 2008 Dlist = 0 otherwise
† For IT industry information on income has been considered instead of just sales, as income includes services.
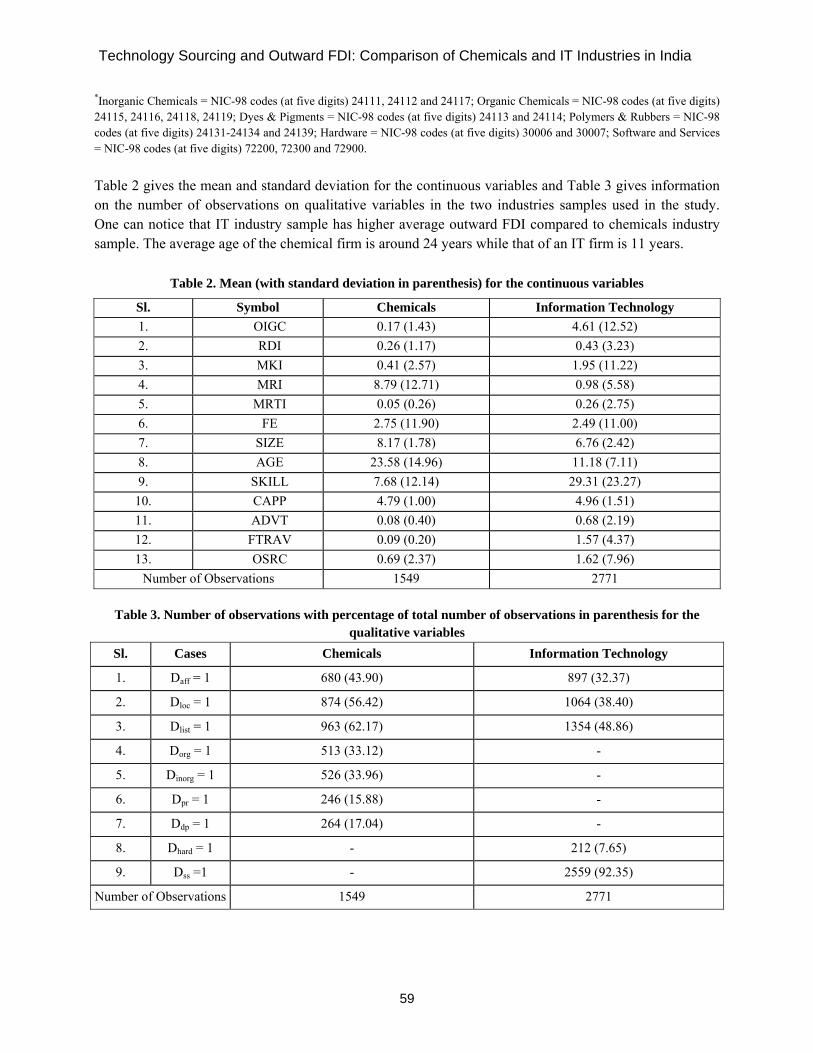
Technology Sourcing and Outward FDI: Comparison of Chemicals and IT Industries in India
59
*Inorganic Chemicals = NIC-98 codes (at five digits) 24111, 24112 and 24117; Organic Chemicals = NIC-98 codes (at five digits) 24115, 24116, 24118, 24119; Dyes & Pigments = NIC-98 codes (at five digits) 24113 and 24114; Polymers & Rubbers = NIC-98 codes (at five digits) 24131-24134 and 24139; Hardware = NIC-98 codes (at five digits) 30006 and 30007; Software and Services = NIC-98 codes (at five digits) 72200, 72300 and 72900. Table 2 gives the mean and standard deviation for the continuous variables and Table 3 gives information on the number of observations on qualitative variables in the two industries samples used in the study. One can notice that IT industry sample has higher average outward FDI compared to chemicals industry sample. The average age of the chemical firm is around 24 years while that of an IT firm is 11 years.
Table 2. Mean (with standard deviation in parenthesis) for the continuous variables
Sl. Symbol Chemicals Information Technology 1. OIGC 0.17 (1.43) 4.61 (12.52) 2. RDI 0.26 (1.17) 0.43 (3.23) 3. MKI 0.41 (2.57) 1.95 (11.22) 4. MRI 8.79 (12.71) 0.98 (5.58) 5. MRTI 0.05 (0.26) 0.26 (2.75) 6. FE 2.75 (11.90) 2.49 (11.00) 7. SIZE 8.17 (1.78) 6.76 (2.42) 8. AGE 23.58 (14.96) 11.18 (7.11) 9. SKILL 7.68 (12.14) 29.31 (23.27)
10. CAPP 4.79 (1.00) 4.96 (1.51) 11. ADVT 0.08 (0.40) 0.68 (2.19) 12. FTRAV 0.09 (0.20) 1.57 (4.37) 13. OSRC 0.69 (2.37) 1.62 (7.96)
Number of Observations 1549 2771
Table 3. Number of observations with percentage of total number of observations in parenthesis for the qualitative variables
Sl. Cases Chemicals Information Technology
1. Daff = 1 680 (43.90) 897 (32.37)
2. Dloc = 1 874 (56.42) 1064 (38.40)
3. Dlist = 1 963 (62.17) 1354 (48.86)
4. Dorg = 1 513 (33.12) -
5. Dinorg = 1 526 (33.96) -
6. Dpr = 1 246 (15.88) -
7. Ddp = 1 264 (17.04) -
8. Dhard = 1 - 212 (7.65)
9. Dss =1 - 2559 (92.35)
Number of Observations 1549 2771
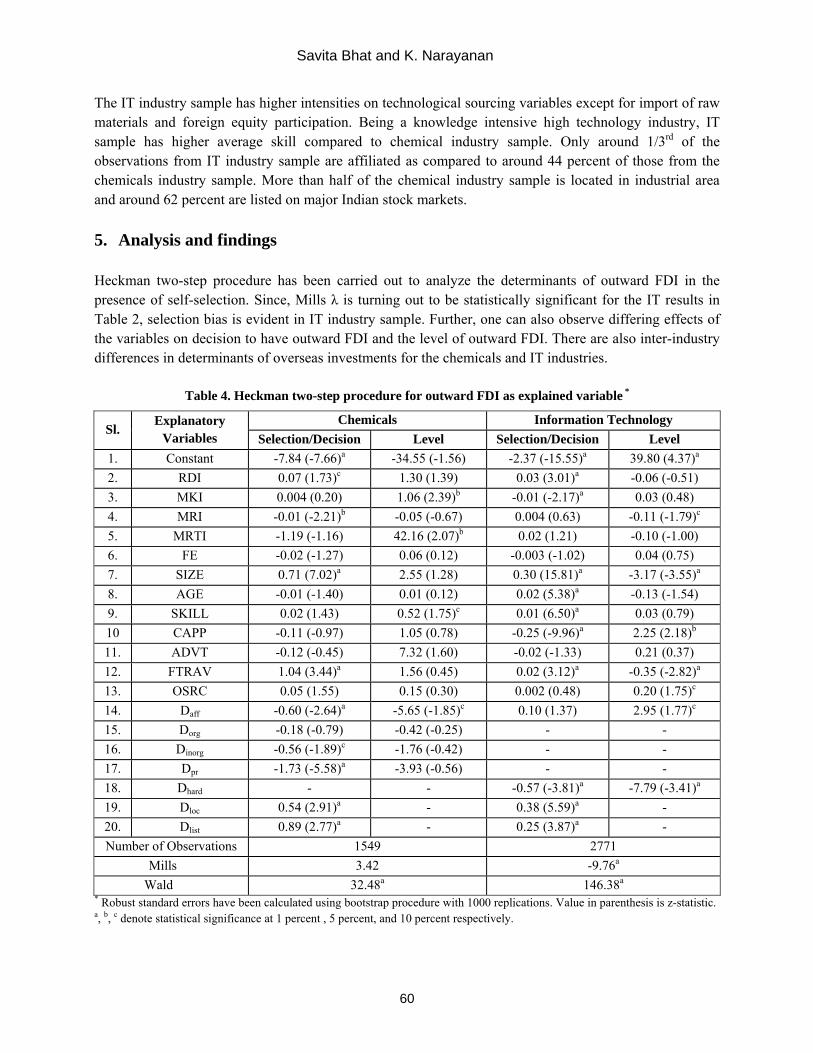
Savita Bhat and K. Narayanan
60
The IT industry sample has higher intensities on technological sourcing variables except for import of raw materials and foreign equity participation. Being a knowledge intensive high technology industry, IT sample has higher average skill compared to chemical industry sample. Only around 1/3rd of the observations from IT industry sample are affiliated as compared to around 44 percent of those from the chemicals industry sample. More than half of the chemical industry sample is located in industrial area and around 62 percent are listed on major Indian stock markets. 5. Analysis and findings Heckman two-step procedure has been carried out to analyze the determinants of outward FDI in the presence of self-selection. Since, Mills λ is turning out to be statistically significant for the IT results in Table 2, selection bias is evident in IT industry sample. Further, one can also observe differing effects of the variables on decision to have outward FDI and the level of outward FDI. There are also inter-industry differences in determinants of overseas investments for the chemicals and IT industries.
Table 4. Heckman two-step procedure for outward FDI as explained variable *
Sl. Explanatory
Variables Chemicals Information Technology
Selection/Decision Level Selection/Decision Level 1. Constant -7.84 (-7.66)a -34.55 (-1.56) -2.37 (-15.55)a 39.80 (4.37)a
2. RDI 0.07 (1.73)c 1.30 (1.39) 0.03 (3.01)a -0.06 (-0.51) 3. MKI 0.004 (0.20) 1.06 (2.39)b -0.01 (-2.17)a 0.03 (0.48) 4. MRI -0.01 (-2.21)b -0.05 (-0.67) 0.004 (0.63) -0.11 (-1.79)c
5. MRTI -1.19 (-1.16) 42.16 (2.07)b 0.02 (1.21) -0.10 (-1.00) 6. FE -0.02 (-1.27) 0.06 (0.12) -0.003 (-1.02) 0.04 (0.75) 7. SIZE 0.71 (7.02)a 2.55 (1.28) 0.30 (15.81)a -3.17 (-3.55)a
8. AGE -0.01 (-1.40) 0.01 (0.12) 0.02 (5.38)a -0.13 (-1.54) 9. SKILL 0.02 (1.43) 0.52 (1.75)c 0.01 (6.50)a 0.03 (0.79)10 CAPP -0.11 (-0.97) 1.05 (0.78) -0.25 (-9.96)a 2.25 (2.18)b
11. ADVT -0.12 (-0.45) 7.32 (1.60) -0.02 (-1.33) 0.21 (0.37) 12. FTRAV 1.04 (3.44)a 1.56 (0.45) 0.02 (3.12)a -0.35 (-2.82)a
13. OSRC 0.05 (1.55) 0.15 (0.30) 0.002 (0.48) 0.20 (1.75)c
14. Daff -0.60 (-2.64)a -5.65 (-1.85)c 0.10 (1.37) 2.95 (1.77)c
15. Dorg -0.18 (-0.79) -0.42 (-0.25) - - 16. Dinorg -0.56 (-1.89)c -1.76 (-0.42) - - 17. Dpr -1.73 (-5.58)a -3.93 (-0.56) - - 18. Dhard - - -0.57 (-3.81)a -7.79 (-3.41)a
19. Dloc 0.54 (2.91)a - 0.38 (5.59)a - 20. Dlist 0.89 (2.77)a - 0.25 (3.87)a - Number of Observations 1549 2771
Mills 3.42 -9.76a
Wald 32.48a 146.38a
* Robust standard errors have been calculated using bootstrap procedure with 1000 replications. Value in parenthesis is z-statistic. a, b, c denote statistical significance at 1 percent , 5 percent, and 10 percent respectively.
Technology Sourcing and Outward FDI: Comparison of Chemicals and IT Industries in India
61
Overall, there is evidence that technology sourcing is important for outward FDI for the two industries. In line with the findings of earlier studies, in-house R&D is having a favorable effect on the decision to invest overseas in both the industries. However, the effect of in-house R&D on levels is not statistically significant. In chemicals industry, import of embodied technology in the form of capital goods and import of disembodied technology in the form of designs, drawings and blueprints against royalty and technical fees seem to be boosting the confidence of the firms to invest higher amounts on overseas group companies. However, imported technology embodied in raw materials does not have a favorable effect on outward FDI. It is possible that the imported raw materials are used to make higher quality products either for the export market or for the domestic market. Similar to the findings in other studies, size of the firm seems to be an important factor in influencing decision to invest overseas. Larger the size of the firm more it is likely to invest overseas in a given year. However, in the IT industry the smaller firms seem to be investing relatively higher amounts on overseas group companies. In both the industry skill is an important determinant of outward FDI. While skill has a positive effect on the decision to invest overseas for the IT firms, it has a favorable effect on the amount that a chemical firm invests on overseas group companies. However, capital productivity is relevant only for the IT industry. In fact, the firms that have better capital productivity do not seem to be inclined to invest overseas on group companies. Maybe they opt for export market, as they are able to use their capital resources very well. However, after taking into account this self-selection bias, capital productivity is important in determining the levels of outward FDI. Unlike the findings of Kumar (2007), in this study we do find that in the high technology IT industry experience of the firm plays a positive role in motivating the firms to invest overseas in a given year. This result is most probably due to the fact that the sample contains many software and services firms (which were not considered in Kumar, 2007) that generally start off with exports due to favorable policy environment and after gaining some experience become confident enough to invest on overseas ventures. Global network linkages formed by the firms through spending on foreign travels do seem to be giving confidence to the firms in both the industry to invest overseas. However, in the IT industry higher expenditure on foreign travel doesn’t seem to be favoring higher overseas investment levels. There is some evidence that the IT firms that outsource more parts of their production processes to concentrate on their core competencies invest higher proportions on overseas group companies. For the chemicals industry, affiliation to business houses, foreign firms and government does not seem to be favorable for outward FDI mode of internationalization. In contrast, for the IT firms the affiliated firms do have higher levels of outward investments. The resources and contacts of the parent firms in the case of affiliated observations seem to drive the firms to invest more and more on foreign subsidiaries. As hypothesized there is evidence that firms operating in different product lines may behave differently with regards to outward FDI. In the chemicals industry dyes and pigments group and in the IT industry the software and services group are more likely to invest overseas on group companies in a given year. They also tend to invest higher proportions on overseas subsidiaries as compared to hardware firms. As
Savita Bhat and K. Narayanan
62
postulated even the location of the firm and stock market listing matters for the decision of the firm to go for overseas investments. While locating in an industrial park or other clusters might be beneficial in getting more accurate information on favorable locations for overseas investments, stock market listing may provide quick initial finance to the firms for outward FDI. 6. Concluding remarks This study analyzed the determinants of outward FDI by specifically considering the samples drawn from two important industries in India, namely, chemicals and information technology. Heckman two-step technique was used for estimation. The results of the estimation confirm that technological sourcing is important in determining the outward FDI of the firms in India. Specifically, in-house R&D efforts of the firms tend to improve the possibility of the firms to go for outward FDI. Interestingly, for the chemicals industry, higher investments on imported technology in the form of capital goods, designs, drawings and blueprints also gives the firms confidence to invest more and more on overseas group companies. It is quite possible that the outward FDI in chemicals go to other developing and less developed countries and hence, even imported technology gives the ownership specific advantages to the Indian chemicals firms. Other firm specific characteristics like size of the firm, skill and global network linkages also favorably affect the probability of outward FDI by the firms. The firms desiring to invest overseas can form networks with other firms that have already invested abroad. This could help in identifying the appropriate locations where outward FDI could be directed. Experience of the firm and higher capital productivity seems to be relevant for higher proportion of overseas investments by the software and services dominated IT industry. The software and services firm that are efficient might be given some tax benefits for their overseas ventures, provided they share their knowledge and experiences (may be as a joint venture partner) with other young firms, so that they could also become efficient producers. Product type, location and stock market listing status are also relevant in determining the decision of the firm to choose outward FDI in a given year. It is quite important to know the global trends in terms of the technologies, products and services in order for the firms to successfully internationalize, whether through exports or through overseas investments. Hence, there is a need to have an active forum where the firms could pool their knowledge, especially with regards to future technologies and markets. The forum could also facilitate joint efforts by the firms and other research institutions on new technologies so as to avoid duplication of efforts and to share the risks involved in producing latest technology based products. References Bloom, N., Mahajan, A., McKenzie, D. & Roberts, J. (2010), Why do firms in developing country have low
productivity? American Economic Review: Papers & Proceedings, 100(2): 619-623. Caves, R.E. (1974). Causes of direct investment: foreign firms’ shares in Canadian and United Kingdom
manufacturing industries. The Review of Economics and Statistics, 56(3): 279-293. Dunning, J.H. (Ed.) (1993). United Nations Library on Transnational Corporations Vol. 1: The Theory of
Transnational Corporations. Routledge, New York. Dunning, J.H. (2000). The eclectic paradigm as an envelope for economic and business theories of MNE activity.
International Business Review, 9(2): 163-190.
Technology Sourcing and Outward FDI: Comparison of Chemicals and IT Industries in India
63
Grubaugh, S.G. (1987). Determinants of direct foreign investment. The Review of Economics and Statistics, 69(1): 149-152.
Horst, T. (1972). Firm and industry developments of the decision to invest abroad: an empirical study. A Review of Economics and Statistics, 54(3): 258-266.
Hsieh, C. & Klenow, P.J. (2009), Misallocation and manufacturing TFP in China and India. The Quarterly Journal of Economics, 124(4): 1403-1448.
Krugman, P. (1979). A Model of Innovation, Technology Transfer and the World Distribution of Income. Journal of Political Economy, 87: 253-266.
Kumar, K. (1982). Third world multinationals: a growing force in international relations. International Studies Quarterly, 26(3): 397-424.
Kumar, N. (1994). Multinational Enterprises and Industrial Organization: The Case of India, Sage Publications, New Delhi.
Kumar, N. (2007). Emerging TNCs: trends, patterns and determinants of outward FDI by Indian enterprises. Transnational Corporations, 16(1): 1-26.
Kumar, N. & Siddharthan, N.S. (1994). Technology, Firm Size and Export Behaviour in Developing Countries: The Case of Indian Enterprises. The Journal of Development Studies, 31(2): 289-309.
Lall, S. (1982). The emergence of third world multinationals: Indian joint ventures overseas. World Development, 10(2): 127-146.
Maddala, G.S. (1983). Limited Dependent and Qualitative Variables in Econometrics. Cambridge University Press, Cambridge.
Mathews, J.A. (2006). Dragon multinationals: new players in 21st century globalisation. Asia Pacific Journal of Management, 23(1): 5-27.
Narayanan, K. (2006). Technology acquisition and export competitiveness: evidence from Indian automobile industry. In Tendulkar, S.D., Mitra, A., Narayanan, K. & Das, D.K. (Eds.), India: Industrialization in a Reforming Economy, Academic Foundation, New Delhi: 439-470
Narayanan, K. (2008). Technology acquisition and competitiveness: evidence from Indian IT industry. In Hashim, S.R. & Siddharthan, N.S. (Eds.) High Tech Industries, Employment, and Global Competitiveness, Routledge, New Delhi: 70-96.
Narayanan, K. & Bhat, S. (2009a). Technology sourcing and its determinants: A study of Basic Chemical industry in India. Technovation, 29(8): 562-573.
Narayanan, K. & Bhat, S. (2009b). Technological efforts and internationalization of IT firms in India. The Indian Journal of Industrial Relations, Special Issue on ‘The Global Indian Firm’, 45(1): 62-83.
Narayanan, K. & Bhat S. (2011). Technology sourcing and outward FDI: A study of IT industry in India. Technovation, 31(4): 177-184.
Pradhan, J.P. (2004). The determinants of outward foreign direct investment: a firm level analysis of Indian manufacturing. Oxford Development Studies, 32(4): 619-639.
Prahalad, C.K. & Hamel G. (1997). The core competence of corporation. In Foss, N.J. (Ed.) Resources, Firms, and Strategies: A Reader in the Resource-Based Perspective, Oxford University Press, Oxford: 235-256.
Pugel, T.A. (1981). The determinants of foreign direct investment: an analysis of US manufacturing industries. Managerial and Decision Economics, 2(4), Multinational Business: 220-228.
Schumpeter, J.A. (1943). Capitalism, socialism and democracy, George Allen & Unwin (Publishers) Ltd., London. Siddharthan, N.S. & Narayanan, K. (Eds.) (2009). Indian and Chinese Enterprises: Global Trade, Technology and
Investment Regimes, Routledge, New Delhi. Siddharthan, N.S., & Nollen, S. (2004). MNE affiliation, firm size and exports revisited: a study of information
technology firms in India. The Journal of Development Studies, 40(6): 146 – 168. Siddharthan, N.S., & Rajan, Y.S. (2002). Global Business, Technology and Knowledge Sharing: Lessons for
Developing Country Enterprises, MacMillan, New Delhi. Tolentino, P.E. (1993). Technological Innovation and Third World Multinationals. Routledge, London.
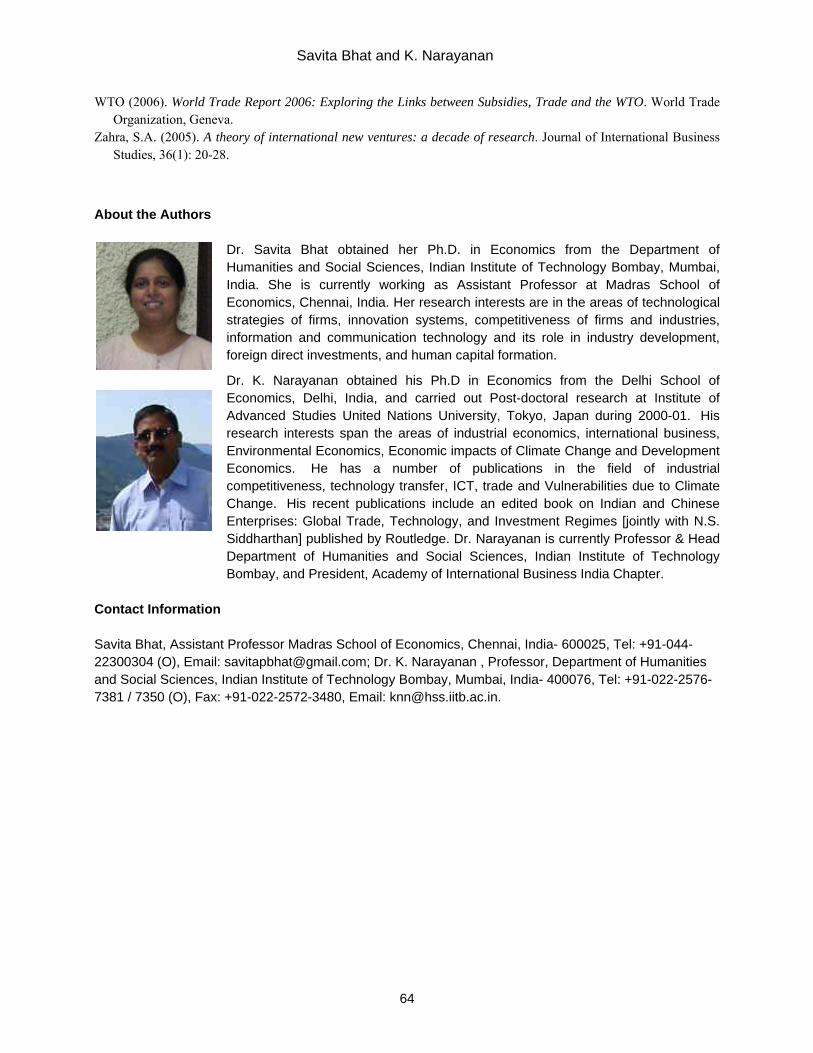
Savita Bhat and K. Narayanan
64
WTO (2006). World Trade Report 2006: Exploring the Links between Subsidies, Trade and the WTO. World Trade Organization, Geneva.
Zahra, S.A. (2005). A theory of international new ventures: a decade of research. Journal of International Business Studies, 36(1): 20-28.
About the Authors
Dr. Savita Bhat obtained her Ph.D. in Economics from the Department of Humanities and Social Sciences, Indian Institute of Technology Bombay, Mumbai, India. She is currently working as Assistant Professor at Madras School of Economics, Chennai, India. Her research interests are in the areas of technological strategies of firms, innovation systems, competitiveness of firms and industries, information and communication technology and its role in industry development, foreign direct investments, and human capital formation.
Dr. K. Narayanan obtained his Ph.D in Economics from the Delhi School of Economics, Delhi, India, and carried out Post-doctoral research at Institute of Advanced Studies United Nations University, Tokyo, Japan during 2000-01. His research interests span the areas of industrial economics, international business, Environmental Economics, Economic impacts of Climate Change and Development Economics. He has a number of publications in the field of industrial competitiveness, technology transfer, ICT, trade and Vulnerabilities due to Climate Change. His recent publications include an edited book on Indian and Chinese Enterprises: Global Trade, Technology, and Investment Regimes [jointly with N.S. Siddharthan] published by Routledge. Dr. Narayanan is currently Professor & Head Department of Humanities and Social Sciences, Indian Institute of Technology Bombay, and President, Academy of International Business India Chapter.
Contact Information Savita Bhat, Assistant Professor Madras School of Economics, Chennai, India- 600025, Tel: +91-044-22300304 (O), Email: [email protected]; Dr. K. Narayanan , Professor, Department of Humanities and Social Sciences, Indian Institute of Technology Bombay, Mumbai, India- 400076, Tel: +91-022-2576-7381 / 7350 (O), Fax: +91-022-2572-3480, Email: [email protected].
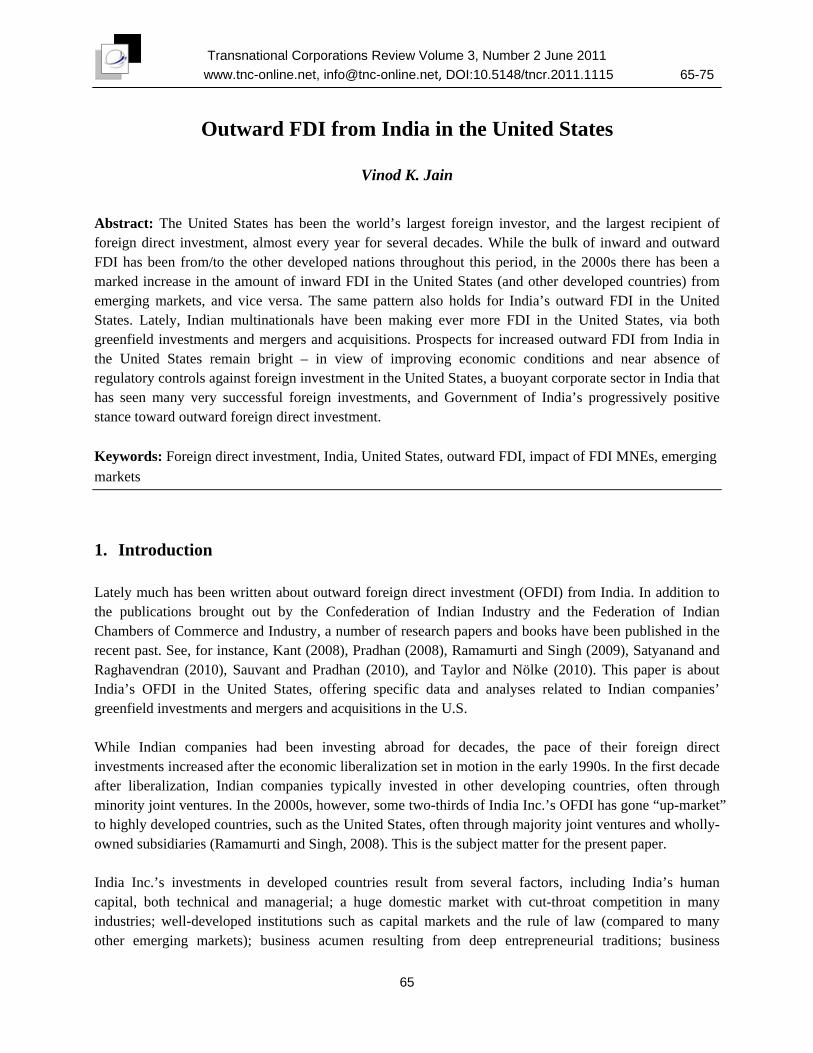
Transnational Corporations Review Volume 3, Number 2 June 2011 www.tnc-online.net, [email protected], DOI:10.5148/tncr.2011.1115 65-75
65
Outward FDI from India in the United States
Vinod K. Jain
Abstract: The United States has been the world’s largest foreign investor, and the largest recipient of foreign direct investment, almost every year for several decades. While the bulk of inward and outward FDI has been from/to the other developed nations throughout this period, in the 2000s there has been a marked increase in the amount of inward FDI in the United States (and other developed countries) from emerging markets, and vice versa. The same pattern also holds for India’s outward FDI in the United States. Lately, Indian multinationals have been making ever more FDI in the United States, via both greenfield investments and mergers and acquisitions. Prospects for increased outward FDI from India in the United States remain bright – in view of improving economic conditions and near absence of regulatory controls against foreign investment in the United States, a buoyant corporate sector in India that has seen many very successful foreign investments, and Government of India’s progressively positive stance toward outward foreign direct investment. Keywords: Foreign direct investment, India, United States, outward FDI, impact of FDI MNEs, emerging markets
1. Introduction Lately much has been written about outward foreign direct investment (OFDI) from India. In addition to the publications brought out by the Confederation of Indian Industry and the Federation of Indian Chambers of Commerce and Industry, a number of research papers and books have been published in the recent past. See, for instance, Kant (2008), Pradhan (2008), Ramamurti and Singh (2009), Satyanand and Raghavendran (2010), Sauvant and Pradhan (2010), and Taylor and Nölke (2010). This paper is about India’s OFDI in the United States, offering specific data and analyses related to Indian companies’ greenfield investments and mergers and acquisitions in the U.S. While Indian companies had been investing abroad for decades, the pace of their foreign direct investments increased after the economic liberalization set in motion in the early 1990s. In the first decade after liberalization, Indian companies typically invested in other developing countries, often through minority joint ventures. In the 2000s, however, some two-thirds of India Inc.’s OFDI has gone “up-market” to highly developed countries, such as the United States, often through majority joint ventures and wholly-owned subsidiaries (Ramamurti and Singh, 2008). This is the subject matter for the present paper. India Inc.’s investments in developed countries result from several factors, including India’s human capital, both technical and managerial; a huge domestic market with cut-throat competition in many industries; well-developed institutions such as capital markets and the rule of law (compared to many other emerging markets); business acumen resulting from deep entrepreneurial traditions; business

Outward FDI from India in the United States
66
sophistication and financial market sophistication1; Indian companies’ ability to arbitrage their low cost advantage; their production efficiency; and a long exposure to Western and Japanese multinationals and management practices. Indian companies’ acquisitions in the United States were also motivated by their desire to acquire technology (Pradhan, 2008) and marquee brands, and facilitated by the low valuations, bankruptcy auctions, and distress sales of American companies in the last 2-3 years. According to IMaCS VIRTUS Global Partners, more than half of Indian companies’ acquisitions in the United States in recent years were because of such reasons.2 According to Khanna and Palepu (2006), the weak institutional framework in India forced many companies to innovate and find ways to circumvent the institutional voids. They were then able to leverage in foreign markets the capabilities they had built up to cope with the institutional voids in India.3 All of this is, to a large extent, a reversal of roles. Traditionally, it was the multinationals from developed countries that made foreign direct investments (FDI) in developing countries, though the bulk of FDI from developed countries went into other developed countries. Now, in the 2000s, we are seeing an increasing amount of FDI from developing countries into developed countries. The UNCTAD’s 2009 World Investment Report focused on the rise of FDI by transnational corporations (TNCs) from developing and transition economies. According to the report, “New sources of FDI are emerging among developing and transition economies. This phenomenon has been particularly marked in the past ten years, and a growing number of TNCs from these economies are emerging as major regional – or sometimes even global – players. The new links these TNCs are forging with the rest of the world will have far-reaching repercussions in shaping the global economic landscape of the coming decades.”4 Foreign companies have always played a pivotal role in business and in life in America. According to the latest available survey from the U.S. Department of Commerce, U.S. affiliates of foreign-owned companies employed more than five million American workers in 2006. “That is 4.6 percent of the private workforce, up from 3.4 percent twenty years ago… Two million workers are employed by manufacturing affiliates – more than one in eight U.S. factory workers” (Griswold, 2009). American affiliates of foreign-owned enterprises tend to be more innovative than domestic companies, and in 2006, they spent $34 billion on R&D, accounting for 14 percent of all R&D performed by U.S.
* Vinod K. Jain is professor of strategy and international business at the Robert H. Smith School of Business, University of Maryland, and president & CEO of the India-US World Affairs Institute, Inc., an independent, non-profit educational and research institute in Washington, D.C. He has been interested in FDI into the United States since his doctoral dissertation on the same theme in 1994, “Evolution of International Investment Strategy: The Case of Foreign MNEs in the United States” (University of Maryland). 1 For business and financial market sophistication, India ranks very high among all countries, not just among developing countries, in World Economic Forum’s 2009-2010 Global Competitiveness Index. 2 IMaCS VIRTUS Global Partners, “US-Bound Acquisitions by Indian Companies”, January 2010. 3 For a detailed discussion of country-specific and firm-specific advantages of companies from developing countries, see Ramamurti (2009). 4 http://www.unctad.org/Templates/WebFlyer.asp?intItemID=3968&lang=1
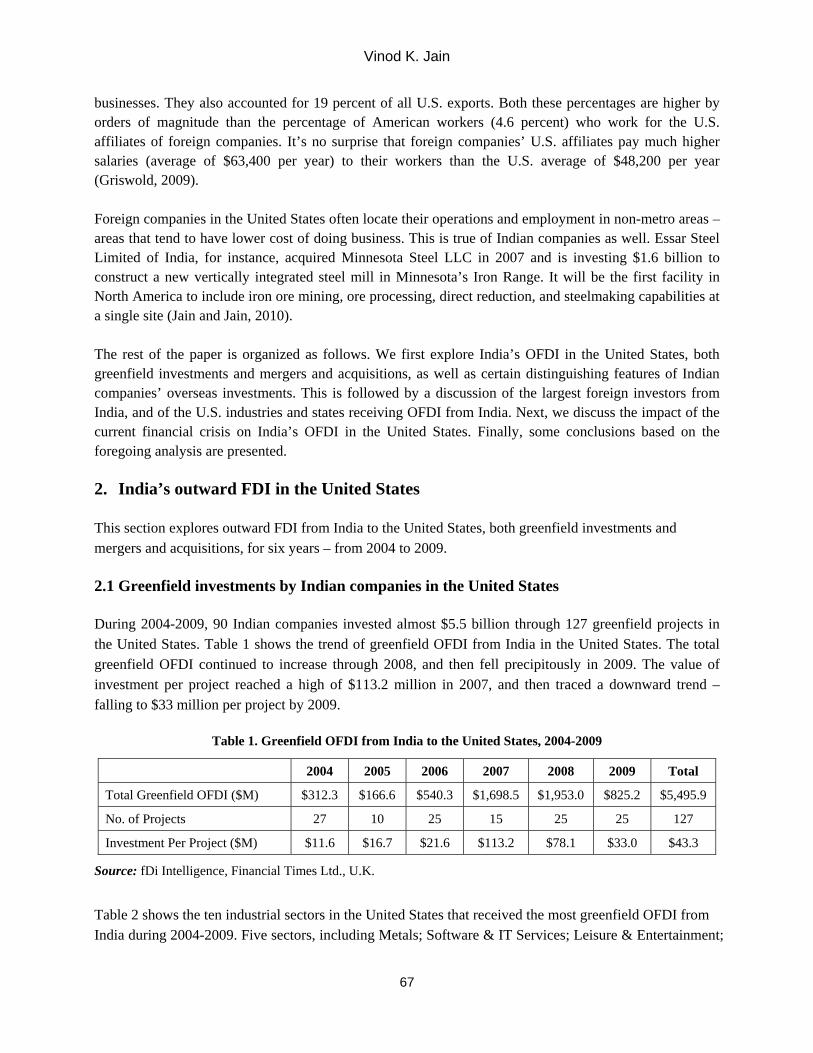
Vinod K. Jain
67
businesses. They also accounted for 19 percent of all U.S. exports. Both these percentages are higher by orders of magnitude than the percentage of American workers (4.6 percent) who work for the U.S. affiliates of foreign companies. It’s no surprise that foreign companies’ U.S. affiliates pay much higher salaries (average of $63,400 per year) to their workers than the U.S. average of $48,200 per year (Griswold, 2009). Foreign companies in the United States often locate their operations and employment in non-metro areas – areas that tend to have lower cost of doing business. This is true of Indian companies as well. Essar Steel Limited of India, for instance, acquired Minnesota Steel LLC in 2007 and is investing $1.6 billion to construct a new vertically integrated steel mill in Minnesota’s Iron Range. It will be the first facility in North America to include iron ore mining, ore processing, direct reduction, and steelmaking capabilities at a single site (Jain and Jain, 2010). The rest of the paper is organized as follows. We first explore India’s OFDI in the United States, both greenfield investments and mergers and acquisitions, as well as certain distinguishing features of Indian companies’ overseas investments. This is followed by a discussion of the largest foreign investors from India, and of the U.S. industries and states receiving OFDI from India. Next, we discuss the impact of the current financial crisis on India’s OFDI in the United States. Finally, some conclusions based on the foregoing analysis are presented. 2. India’s outward FDI in the United States This section explores outward FDI from India to the United States, both greenfield investments and mergers and acquisitions, for six years – from 2004 to 2009. 2.1 Greenfield investments by Indian companies in the United States During 2004-2009, 90 Indian companies invested almost $5.5 billion through 127 greenfield projects in the United States. Table 1 shows the trend of greenfield OFDI from India in the United States. The total greenfield OFDI continued to increase through 2008, and then fell precipitously in 2009. The value of investment per project reached a high of $113.2 million in 2007, and then traced a downward trend – falling to $33 million per project by 2009.
Table 1. Greenfield OFDI from India to the United States, 2004-2009
2004 2005 2006 2007 2008 2009 Total
Total Greenfield OFDI ($M) $312.3 $166.6 $540.3 $1,698.5 $1,953.0 $825.2 $5,495.9
No. of Projects 27 10 25 15 25 25 127
Investment Per Project ($M) $11.6 $16.7 $21.6 $113.2 $78.1 $33.0 $43.3
Source: fDi Intelligence, Financial Times Ltd., U.K.
Table 2 shows the ten industrial sectors in the United States that received the most greenfield OFDI from India during 2004-2009. Five sectors, including Metals; Software & IT Services; Leisure & Entertainment;

Outward FDI from India in the United States
68
Industrial Machinery, Equipment & Tools; and Financial Services, accounted for almost 80 percent of the total greenfield OFDI. The Metals sector received almost half of all OFDI, with Software & IT Services being a distant second.
Table 2. Distribution of greenfield OFDI from India in the United States by Sector, 2004-2009
Sector Total greenfield IFDI (US$M)
Metals $2,621.3
Software & IT services $816.0
Leisure & entertainment $321.5
Industrial machinery, equipment & tools $309.1
Financial services $279.3
Communications $226.8
Plastics $151.1
Pharmaceuticals $95.9
Textiles $89.5
Chemicals $85.8
Grand total (Incl. All Sectors) $5,495.9
Source: fDi Intelligence, Financial Times Ltd., U.K. Table 3 displays the ten U.S. States that received the largest greenfield OFDI from India. Five states (Minnesota, Virginia, Texas, New Jersey, and Ohio) accounted for over half of all greenfield investment from India. Investment per project ranged from $12.3 million in California to $1.6 billion in Minnesota. 2.2 Mergers and acquisitions by Indian companies in the United States The trend of OFDI from India by means of M&As for the period 2004-2009 is shown in Table 4. The total value of M&As continued to increase through 2007, reaching almost $11 billion for the year, and then fell sharply. The number of acquisitions and the deal value per acquisition also fell – from $140.9 million per acquisition in 2007 (for 77 acquisitions) to $23.5 million per acquisition in 2009 (for 16 acquisitions). Table 5 highlights the major U.S. sectors that received OFDI from India via M&As during 2004-2009. More than 80 percent of the $21 billion in M&A deal value was in five sectors, Manufacturing; IT and IT-enabled Services (ITeS); Biotechnology, Chemicals, and Pharmaceuticals; Automotive; and Telecom. It’s noteworthy that manufacturing attracted the most investments by Indian companies, over twice as much as IT and ITeS for which they are well known. Of course, several other sectors such as biotechnology/ chemicals/pharmaceuticals and automotive, which also received large investments, are also manufacturing industries.

Vinod K. Jain
69
Table 3. The Ten States that Received the Most Greenfield OFDI from India, 2004-2009
State Rank
Recipient State
Total Amount of Greenfield FDI ($M)
Number of Projects
Investment Per Project ($M)
1 Minnesota $1,600.0 1 $1,600.0
2 Virginia $326.2 6 $54.4
3 Texas $307.5 14 $22.0
4 New Jersey $302.6 11 $27.5
5 Ohio $283.8 4 $71.0
6 Illinois $243.8 6 $40.6
7 California $234.6 19 $12.3
8 Arkansas $180.0 2 $90.0
9 New York $174.9 13 $13.5
10 Maryland $101.0 2 $50.5
Total (All States) $5,495.9 127 $43.3
Source: fDi Intelligence, Financial Times Ltd., U.K.
Table 4. M&A Deals by Indian firms in the United States, 2004-2009
2004 2005 2006 2007 2008 2009 Total
Total OFDI through M&A ($M) $755 $766 $2,328 $10,846 $5,934 $376 $21,005
No. of Acquisitions 25 33 50 77 66 16 267
Investment Per Acquisition ($M) $30.2 $23.2 $46.6 $140.9 $89.9 $23.5 $78.7
Sources: Various sources including FICCI publications produced jointly with Ernst & Young, Prof. Jaya Prakash Pradhan of the Sardar Patel Institute of Economic & Social Research, Virtus Global Partners, and Thompson’s SDC Database
Table 5. Distribution of onward M&A deals by Indian firms in the United States, by sector, 2004-2009
Sector Total M&A Value ($M)
Manufacturing $7,632.2
IT & IT Enabled Services (ITeS) $3,785.1
Biotech, Chemicals & Pharmaceuticals $2,699.0
Automotive $2,317.4
Telecom $1,093.5
Food & Beverage $900.0
Oil & Gas $453.0
Financial Services $357.0
Textiles $297.5
Outward FDI from India in the United States
70
Hotels $278.0
Grand Total (Incl. All Sectors) $21,004.6
Sources: Various sources (see” sources” under Table 4)
Table 6 shows the ten U.S. states where Indian companies made the largest acquisitions. In terms of the value of OFDI, 75 percent of these M&As were in five states, Georgia, New Jersey, Michigan, California, and Texas. However, in terms of the number of investments, the top five recipient states were California, New Jersey, New York, Illinois, and Michigan (which tied with Texas for the fifth place). Manufacturing investments tend to be larger than investments in service businesses, a trend clearly seen in the deal value per acquisition. The deal value per acquisition was highest in the States with greater manufacturing activity (Georgia, Michigan, Texas, and Louisiana) than in States where services tend to be more prominent in state economies (California, New Jersey, New York, and Maryland).
Table 6. The top 10 U.S. States for M&As by Indian companies, 2004-2009
State rank
State Total deal value of acquisitions ($M)
Number of acquisitions
Deal value per acquisition ($M)
1 Georgia $6,283.5 9 $698.2
2 New Jersey $2,874.8 33 $87.1
3 Michigan $2,581.1 13 $198.6
4 California $2,375.0 55 $43.2
5 Texas $1,539.9 13 $118.5
6 Louisiana $650.3 3 $216.8
7 New York $641.3 23 $27.9
8 Maryland $563.9 8 $70.5
9 Illinois $486.5 17 $28.6
10 Connecticut $353.0 4 $88.3
Total (Incl. All states) $21,004.6 267 $78.7
Sources: Various sources (see” sources” under table 4)
2.3 Some distinguishing features of India’s OFDI in the United States According to Taylor and Nölke (2010), there are certain distinguishing features of Indian firms’ outward FDI, which seem to be borne out by this study also. Indian multinational enterprises (MNEs) have a distinct preference for M&As over greenfield investments for their foreign-market entry mode. Second, more and more Indian MNEs are making acquisitions in the Triad.5 “Between 2005 and 2007, Indian
5 The term, TRIAD, was popularized by Kenichi Ohmae in the mid-late 1980s to represent the three most developed regions of the world at the time, namely, the United States, Western Europe, and Japan.
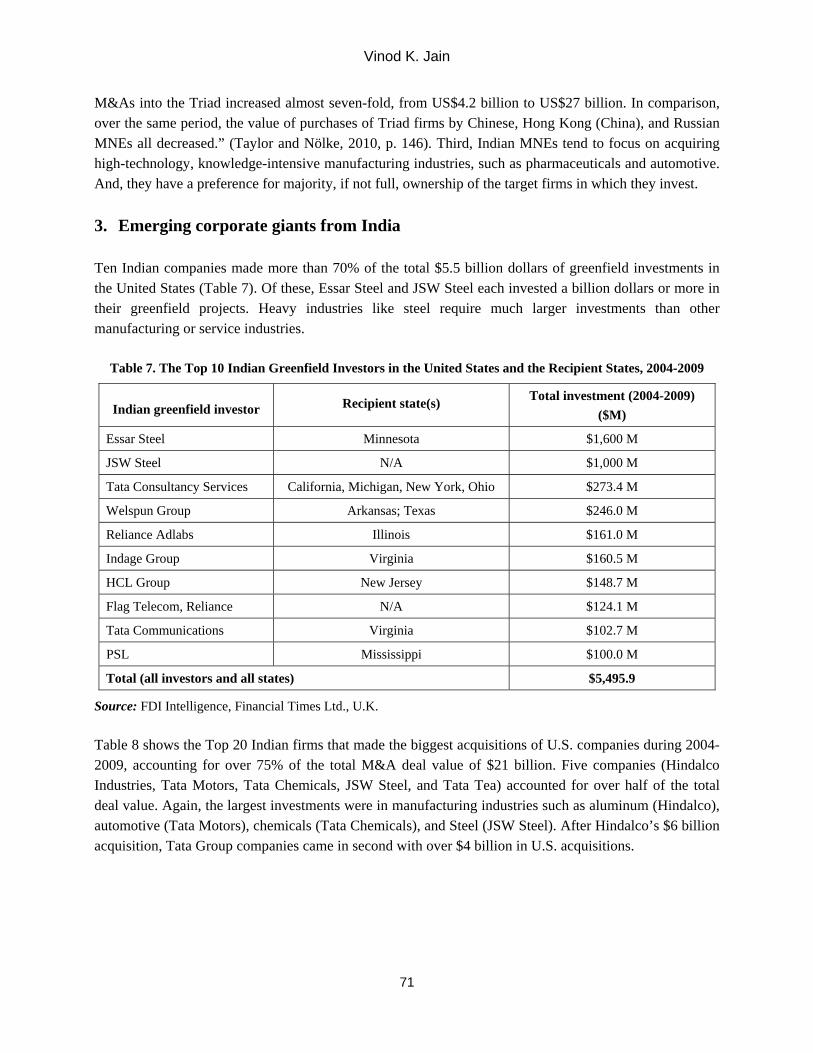
Vinod K. Jain
71
M&As into the Triad increased almost seven-fold, from US$4.2 billion to US$27 billion. In comparison, over the same period, the value of purchases of Triad firms by Chinese, Hong Kong (China), and Russian MNEs all decreased.” (Taylor and Nölke, 2010, p. 146). Third, Indian MNEs tend to focus on acquiring high-technology, knowledge-intensive manufacturing industries, such as pharmaceuticals and automotive. And, they have a preference for majority, if not full, ownership of the target firms in which they invest. 3. Emerging corporate giants from India Ten Indian companies made more than 70% of the total $5.5 billion dollars of greenfield investments in the United States (Table 7). Of these, Essar Steel and JSW Steel each invested a billion dollars or more in their greenfield projects. Heavy industries like steel require much larger investments than other manufacturing or service industries.
Table 7. The Top 10 Indian Greenfield Investors in the United States and the Recipient States, 2004-2009
Indian greenfield investor Recipient state(s) Total investment (2004-2009) ($M)
Essar Steel Minnesota $1,600 M
JSW Steel N/A $1,000 M
Tata Consultancy Services California, Michigan, New York, Ohio $273.4 M
Welspun Group Arkansas; Texas $246.0 M
Reliance Adlabs Illinois $161.0 M
Indage Group Virginia $160.5 M
HCL Group New Jersey $148.7 M
Flag Telecom, Reliance N/A $124.1 M
Tata Communications Virginia $102.7 M
PSL Mississippi $100.0 M
Total (all investors and all states) $5,495.9
Source: FDI Intelligence, Financial Times Ltd., U.K. Table 8 shows the Top 20 Indian firms that made the biggest acquisitions of U.S. companies during 2004-2009, accounting for over 75% of the total M&A deal value of $21 billion. Five companies (Hindalco Industries, Tata Motors, Tata Chemicals, JSW Steel, and Tata Tea) accounted for over half of the total deal value. Again, the largest investments were in manufacturing industries such as aluminum (Hindalco), automotive (Tata Motors), chemicals (Tata Chemicals), and Steel (JSW Steel). After Hindalco’s $6 billion acquisition, Tata Group companies came in second with over $4 billion in U.S. acquisitions.
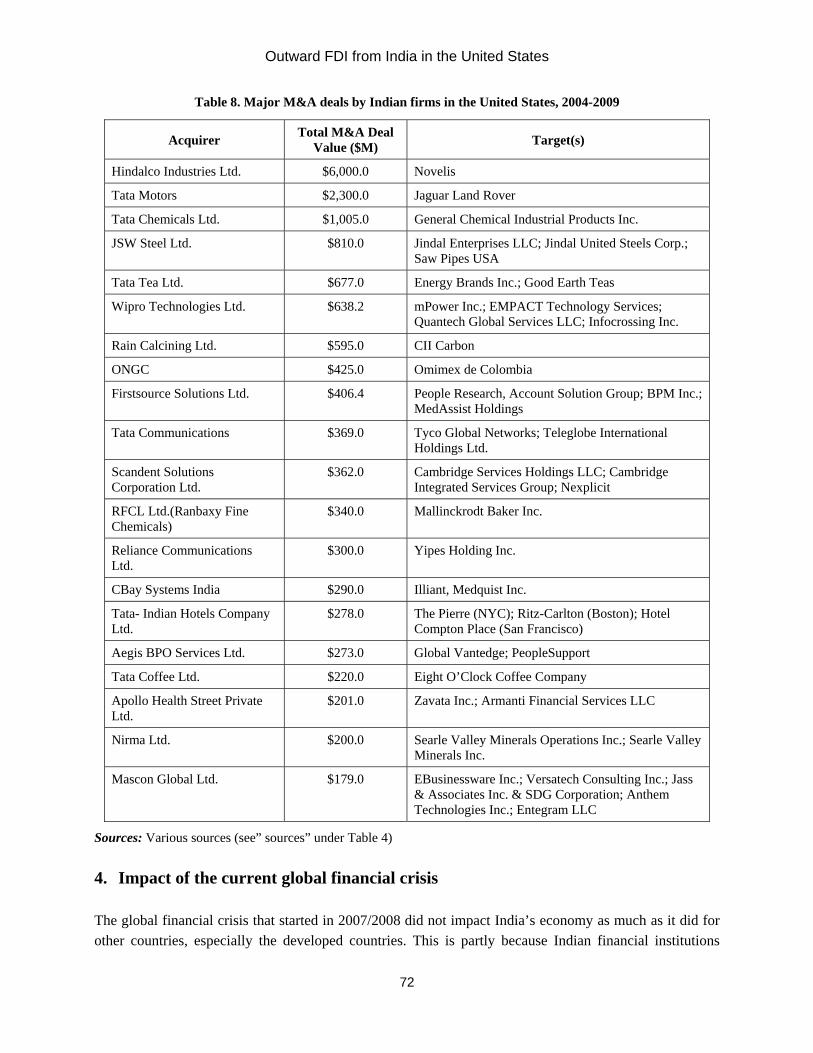
Outward FDI from India in the United States
72
Table 8. Major M&A deals by Indian firms in the United States, 2004-2009
Acquirer Total M&A Deal Value ($M) Target(s)
Hindalco Industries Ltd. $6,000.0 Novelis
Tata Motors $2,300.0 Jaguar Land Rover
Tata Chemicals Ltd. $1,005.0 General Chemical Industrial Products Inc.
JSW Steel Ltd. $810.0 Jindal Enterprises LLC; Jindal United Steels Corp.; Saw Pipes USA
Tata Tea Ltd. $677.0 Energy Brands Inc.; Good Earth Teas
Wipro Technologies Ltd. $638.2 mPower Inc.; EMPACT Technology Services; Quantech Global Services LLC; Infocrossing Inc.
Rain Calcining Ltd. $595.0 CII Carbon
ONGC $425.0 Omimex de Colombia
Firstsource Solutions Ltd. $406.4 People Research, Account Solution Group; BPM Inc.; MedAssist Holdings
Tata Communications $369.0 Tyco Global Networks; Teleglobe International Holdings Ltd.
Scandent Solutions Corporation Ltd.
$362.0 Cambridge Services Holdings LLC; Cambridge Integrated Services Group; Nexplicit
RFCL Ltd.(Ranbaxy Fine Chemicals)
$340.0 Mallinckrodt Baker Inc.
Reliance Communications Ltd.
$300.0 Yipes Holding Inc.
CBay Systems India $290.0 Illiant, Medquist Inc.
Tata- Indian Hotels Company Ltd.
$278.0 The Pierre (NYC); Ritz-Carlton (Boston); Hotel Compton Place (San Francisco)
Aegis BPO Services Ltd. $273.0 Global Vantedge; PeopleSupport
Tata Coffee Ltd. $220.0 Eight O’Clock Coffee Company
Apollo Health Street Private Ltd.
$201.0 Zavata Inc.; Armanti Financial Services LLC
Nirma Ltd. $200.0 Searle Valley Minerals Operations Inc.; Searle Valley Minerals Inc.
Mascon Global Ltd. $179.0 EBusinessware Inc.; Versatech Consulting Inc.; Jass & Associates Inc. & SDG Corporation; Anthem Technologies Inc.; Entegram LLC
Sources: Various sources (see” sources” under Table 4) 4. Impact of the current global financial crisis The global financial crisis that started in 2007/2008 did not impact India’s economy as much as it did for other countries, especially the developed countries. This is partly because Indian financial institutions

Vinod K. Jain
73
were not heavily invested in the real estate bubble, India is less dependent on exports, India does not have a sovereign wealth fund which could be used for OFDI, and many emerging market MNEs are used to dealing with such crises as a matter of course. However, the global financial crisis did have a significant impact on OFDI from India in the United States. This is largely because the bulk of overseas acquisitions by India’s major MNEs during 2005-2008 were financed through debt (Taylor and Nölke, 2010). This made it increasingly difficult for Indian MNEs to raise debt in international markets, which likely continued through 2009. India Inc.’s greenfield investments in the United States continued to increase through 2008, reaching almost $2 billion, but fell to $825 million in 2009 (Table 1). One possible reason why the global recession did not impact greenfield OFDI immediately is that setting up a greenfield project takes much longer than making an acquisition, and the investments that took place in 2008 were likely initiated well before the onset of the recession. As for OFDI through mergers and acquisitions, Table 4 shows the trend of year-to-year deal values during 2004-2009. The total deal value of acquisitions continued to increase annually through 2007, after which there was a sharp decline (year-to-year decline of 47 percent in 2008 and 94 percent in 2009). After reaching a high of $140.9 million, the average deal value per acquisition declined by 36 percent from 2007 to 2008 and by 74 percent from 2008 to 2009. 5. Conclusions The United States has been the world’s largest recipient of FDI for much of the post-War period. The reasons for that are not hard to find. The U.S. offers foreign investors a stable and welcoming business environment, a transparent and effective legal system, highly developed infrastructure, and access to a huge and sophisticated market for all kinds of goods and services. The policies of different administrations have been pro-IFDI, supplemented by often aggressive pursuit of IFDI by many state and local jurisdictions. The U.S. is therefore likely to remain an attractive FDI destination for foreign multinationals for the foreseeable future. From the FDI recipient’s perspective, the United States welcomes and encourages inward foreign direct investment (IFDI). However, unlike most other countries, there are few regulatory controls against IFDI in the United States. There is a general lack of exchange controls, government regulations, or licensing requirements for foreign enterprises’ investments or acquisitions in the United States. Foreign-owned enterprises typically also have equal access to federal and state investment incentives and benefits.6 This, along with other factors such as market size and sophistication, explains why the United States has traditionally been the largest FDI recipient in the world, year after year.
6 Baker & McKenzie, A Legal Guide to Acquisitions and Doing Business in the United States. Law Firms. Paper 38. http://digitalcommons.ilr.cornell.edu/lawfirms/38

Outward FDI from India in the United States
74
India’s emerging multinationals, now with many initial successes behind them, are likely to continue to favor investing in highly developed markets such as the United States. This will be aided by Government of India’s progressively relaxed foreign exchange controls for outward FDI by Indian companies. For instance, Indian companies are now allowed to invest up to four times their adjusted net worth in foreign companies without prior government approval. They can borrow abroad to finance OFDI and even float special purpose vehicles to finance OFDI.7 The overall U.S. business environment, the opportunity to acquire valuable assets, and supplemented by incentives for inward FDI offered by state and local jurisdictions, will likely keep Indian firms investing in the United States for years. References Griswold, David (2009). Mad About Trade: Why Mainstreet America Should Embrace Globalization. (Washington,
D.C.: Cato Institute). Jain, Vinod K. & Kamlesh Jain (2010). How America Benefits from Economic Engagement with India. (Silver
Spring, MD: India-US World Affairs Institute, Inc.). Kant, Ravi (2008). “The Rise of TNCs from Emerging Markets: Challenges Faced by Firms from India”, in Karl P.
Sauvant, ed., The Rise of Transnational Corporations from Emerging Markets: Threat or Opportunity? (Northampton, MA: Edward Elgar Publishing), pp. 23-31.
Khanna, Tarun and Krishna Palepu (2006). “Emerging Giants: Building World-Class Companies in Developing Countries”, Harvard Business Review, October.
Pradhan, Jaya Prakash (2008). Indian Multinationals in the World Economy: Implications for Development. (New Delhi: Bookwell).
Ramamurti, Ravi & Jitendra V. Singh (2008). “Indian Multinationals: Generic Internationalization Strategies.” In Ravi Ramamurti and Jitendra V. Singh, eds., Emerging Multinationals from Emerging Markets (Cambridge, UK: Cambridge University Press), pp. 110-166.
Satyanand, Premila N. & Pramila Raghavendran (2010). “Outward FDI from India and its policy context”, Columbia FDI Profiles, September 22.
Sauvant, Karl P. & Jaya P. Pradhan, with Ayesha Chatterjee and Brian Harley (eds.) (2010), The Rise of Indian Multinationals: Perspectives on Indian Outward Foreign Direct Investment (New York: Palgrave Macmillan).
Taylor, Heather and Andreas Nölke (2010). “Global Players from India: A Political Economy Perspective”, in Karl P. Sauvant and Geraldine McAllister, eds., Foreign Direct Investment from Emerging Markets: The Challenges Ahead (New York: Palgrave Macmillan), pp. 145-171.
7 For a detailed discussion of India’s evolving policies with respect to OFDI, see: Satyanand, Premila N. & Pramila Raghavendran, “Outward FDI from India and its policy context,” Columbia FDI Profiles, September 22, 2010.

Vinod K. Jain
75
About the Author
Vinod K. Jain, Ph.D., is professor and founder & former director of the Center for International Business Education and Research at the Robert H. Smith School of Business, University of Maryland. He has been interested in FDI into the United States ever since his doctoral dissertation on the same theme at the University of Maryland in 1994. He is also an affiliate professor in the Latin American Studies Center, University of Maryland. Most recently, he served as a visiting professor at the Polish-American Management Center, University of Lodz, Poland and a Fulbright professor at the Indian Institute of Management, Bangalore. He is the president and
CEO of the India-US World Affairs Institute, Inc., a Washington D.C.-based non-profit organization, and serves on the Maryland/Washington D.C. District Export Council.
Contact Information Vinod K. Jain, Robert H. Smith School of Business, University of Maryland, College Park, MD 20742 Email: [email protected], Tel: 301-651-2818

Transnational Corporations Review Volume 3, Number 2 June 2011 www.tnc-online.net, [email protected], DOI:10.5148/tncr.2011.1116 76-86
76
Economic Liberalisation and Financing Pattern of Indian Acquiring Firms Abroad
P. L. Beena1
Abstract: Recent policy shift related to trade liberalisation and deregulation of foreign investment policy at the global level has, probably, been the main determinant in the emergence of new patterns such as internationalisation of the production process. The study argues that it is not because the Indian acquiring firms were flush with a surplus of funds that they went in for acquisitions overseas. Instead, they have made use of new financial innovative products such as Foreign Currency Convertible Bonds, Foreign Currency Exchangeable Bonds, Special Purpose Vehicles, Private equity, and Venture capital in order to acquire large-sized firms abroad. The effective tax rate paid by these acquiring firms has significantly declined while these firms were excelling in terms of profitability. The average foreign exchange spending by these firms is much higher than the average foreign exchange earnings these are quite disturbing if we consider the interest of the country. Regulation by the state through measures of corporate governance is important in order to create conditions for growth and development in the domestic economy. Keywords: FDI & M&As; capital and ownership structure; corporate governance JEL Classification: G3, G32, G34 and G37 1. Introduction
Although India has a long history of outward FDI, the volume was quite insignificant till 2000 but it has significantly grown from the level of US$ 0.3 billion to US$ 14.9 billion during 1999-2000 to 2009-2010 (UNCTAD, 2010). In the year 2009, FDI outflows accounts for almost 4 per cent of India’s capital formation while FDI inflows accounts for almost 9 per cent of India’s capital formation. It is also important to note that the growth of overseas acquisitions by Indian firms has accelerated since early 2000s and this new trend has attracted scholarly attention (UNCTAD 2004; Nagaraj 2006; Gopinath 2007; Nayyar 2007; Pradhan 2007). Against this background, an attempt has been made in this paper to analyse the financing pattern of Indian acquiring firms during 1990-2009. The paper is divided into four sections: The first section deals with the theoretical underpinnings and contextualises the study. The second section traces trends in the FDI outflows and CBM&As since 2000. The third section analyses the pattern of resource mobilisation of the Indian acquiring firms abroad. The fourth section tries to understand the financing pattern of acquisitions based on five case studies. The major findings are drawn in the final section.
1 The author is an Assistant Professor at the Centre for Development Studies, Trivandrum, India and is presently affiliated to the Institute for Studies in Industrial Development, New Delhi. This is a revised version of the paper presented in the Annual Conference for Development and Change, 2010 held at Witwatersrand University, Johannesburg. I have benefited from interaction with Surajit Mazumdar, Chalapati Rao, Meena Chacko and C P Chandrasekhar. This paper was also enriched through the valuable comments from anonymous referee. However, I take responsibility for any error or omission.
Economic Liberalisation and Financing Pattern of Indian Acquiring Firms Abroad
77
2. Theoretical and empirical literature survey
Established theories of international investment suggest that the competitive advantage in the form of ownership, location and internationalisation allows firms to acquire monopolistic and oligopolistic power in the market and expand their businesses internationally through investments, mergers and acquisitions (Singh and Jain 2009:3). It is argued in the literature that ‘emerging economy multinationals’ use the existing ownership advantage to pursue the acquisition of complementary resources and capabilities required to develop potential competitive advantage for survival in more competitive environments. Acquisition of existing foreign firms allows the acquirer to obtain resources such as patent – protected technology, superior managerial and marketing skills, and special government regulation that creates a barrier to entry for other firms (Errunza & Senbet 1981 as cited in Wang & Agyenim 2007:2). Most of the studiesi on Indian overseas acquisitions conform to the argument that the multinational enterprises of developing countries internationalise businesses mainly to acquire intangible assets and resources which they do not possess. UNCTAD (2004) argued that the motives for Indian firms going for acquisitions abroad could have been to gain access to global market networks and technology to move up their production value chain and secure international brand names. There is also a viewpoint which is increasingly popular especially in the media discussions today that Indian acquisition overseas is a laudable question of national pride and an indication that the Indian firms have acquired capability to compete in the international markets. A recent study by Athukorala (2009) highlights the developmental implications of outward FDI vis-a-vis domestic investment in India. However, no attempt has been made so far to understand the financing source of these acquiring firms. This study intends to fill this gap to some extent, based on a small sample. Policy reforms and FDI outflows The foreign investment abroad by Indian firms, began significantly after the liberalisation of investment policies with the introduction of Foreign Exchange Management Act (FEMA) in June 2000. In March 2003, the automatic route was liberalised significantly to enable Indian parties to fund to the extent of 100 per cent of their net worth. This limit was further increased to 200 per cent of their net worth in 2005 and to 300 per cent in June 2007. This has further enhanced to 400 per cent of the net worth in September 2007. The limit for portfolio investment by listed Indian companies in the equity of listed foreign companies was raised from 35 per cent to 50 per cent of the net worth of the investing company in September 2007 (RBI Bulletin 2009:142). Funding a large acquisition through local borrowings was difficult till mid-2000s as the local bond market was not deep enough. In April 2003, banks were permitted to extend credit only up to 10 per cent of their unimpaired capital funds, subject to certain terms and conditions. In November 2006, the limit was extended to 20 per cent. However, this facility was available only to those firms where the company is a wholly owned subsidiary or Indian companies having holding of more than 51 per cent abroad. Since June 2005, Indian banks were allowed to extend financial assistance to Indian companies for acquisition of equity in overseas firms. Companies were also allowed to raise resources by an overseas SPV or joint ventures of an Indian company. RBI has also raised ceilings on Foreign currency borrowings of an Indian company from $500 million to $750 million in October 2006. As a result of these policy changes, the ratio of Indian FDI outflows to Indian FDI inflows has increased (see Figure 1).

Accordingdiscussed abroad du 3. GroIn terms odeclined t2001 was table 1). I2007 (seeestimated
Source: Base
g to RBI statiin the beginn
uring 2000 to 2
wth of Indof number, it to 482 during
US$ 0.33 biIt should alsoe figure 2). Vby RBI (see
Source:
Fi
050100150200250300
ed on Author’s Figure 1. Tr
istics, majoritning of this pa2010.
dian oversehas increased
g 2010 (see coillion and thao be noted thaValue of acqcolumn 3&4
: Based on colu
igure 2. Numb
2001 2002
P.
calculation, Wrends in the sh
ty of these FDaper, we do f
as acquisitd from 44 durolumn 1 in ta
at value has inat the numbequisition in min Table 1).
umn 2 &3 in ta
ber and value
2003 2004 20
No of Deals
Value of Acq
. L. Beena
78
World Investmehare of FDI ou
DI outflows tfind an increa
tions ring 2001 to aable 1). The ancreased to U
er of acquisitimany years i
able 1
of deals in In
005 2006 200
for which valu
quisition (US$
ent Report, UNutflows to FDI
took place inasing trend in
a peak level oannounced vaUS$58.8 billioions have reais much high
ndian acquisiti
7 2008 2009
ue is available
Million)
NCTAD, VariouI inflows
n the form of the purchase
of 590 in 200alue involved on in 2010 (s
ached to its hher than the
ions abroad
0100002000030000400005000060000
2010
us Issues.
equity. As ws of firms or
07 and then slin 22 deals d
see column 2ighest level dtotal FDI ou
000000
we had assets
lightly during &3 in during utflow

Economic Liberalisation and Financing Pattern of Indian Acquiring Firms Abroad
79
Table 1. Pattern of Indian acquisitions abroad
Year
Num
ber of deals
No of D
eals for w
hich value is available
Value of
Acquisitions
(US$ m
illion)
FDI O
utflow
Estimated by
RB
I (U
S$ million)
Share of Value
of Acquisition
to FDI O
utflow
(%)
No of
Purchases by W
IR
Value of
Acquisition by
WIR
(U
S$ Million)
FDI O
utflow
Estimated by
WIR
(U
S$ million)
Share of Value
of Acquisition
to FDI O
utflow
1 2 3 4 5 6 7 8 9 2001 45 22 338.58 829 40.84 NA 2195 757 290.0 2002 29 24 818.72 1490 54.95 NA 270 431 62.6 2003 57 36 680.6 1892 35.97 57 1362 1325 102.8 2004 130 68 1598.86 2076 77.02 64 863 2024 42.6 2005 284 147 10055 2309 435.47 91 2649 1634 162.1 2006 444 219 14427 6083 237.17 134 6715 14344 46.8 2007 590 287 55141 15810 348.77 171 29076 17281 168.3 2008 567 274 25582 21312 120.04 161 11662 17685 65.9 2009 413 179 18049 18597 97.05 NA 5573 14897 37.4 2010 482 209 58841 12691 463.64 NA NA NA NC
Source: Table 140, Handbook of Statistics of Indian Economy (2010); M& A Data Base, CMIE; Venture Intelligence; World Investment Report, UNCTAD. Note: Data related to the number and value of acquisitions for the period 2001 to 2003 is collected from M&A data base, CMIE. Similar data for the remaining years is collected from Venture Intelligence data base. This is also true according to the data published by World Investment Report for some years. For instance, the share of value of net purchasesii of assets by Indian firms to the total FDI outflows is more than 100 per cent in many years and this call for an explanation (see column 9 in Table 1 and figure in Appendix 1).
An attempt has been made in the following section to identify the financing source of Indian acquiring firms abroad. For this, we have constructed our data-base on Indian acquisitions abroad based on various sources such as M&A data-base of CMIE, Pradhan (2007) and Nayyar (2007). From our sample, it is observed that the intensity of Indian acquisitions abroad is more in those industries which have experienced relatively large number of mergers and acquisitions within India (Beena 2011:33). However, we had to restrict our analysis to a small sample of 38 firms as the detailed information relating to the rest of the acquiring firms could not be obtained. It is evident that the investment abroad by our sample firms has increased from the level of Rs 4.8 billion in 2000 to Rs 165.17 billion in 2007 and further increased to Rs 1108.24 billion in 2010 (see figure 3). The total amount involved in 26 out of 38 deals is 998.38 billion at the time of acquisitions. Disturbingly, the value of acquisition is 26 times higher than the investment abroad recorded in these firms’ own balance sheet during the respective years of acquisition which coincides with the trends observed in column 5&9 in Table 1. From this we could argue that these firms have been raising financial resources from abroad. Similarly, only 17 per cent of the total value of acquisition has been recorded as Profit after Tax at the time of acquisition. Further, only 71 per cent of the value of acquisition has been recorded as net worth of these acquiring firms at the time of
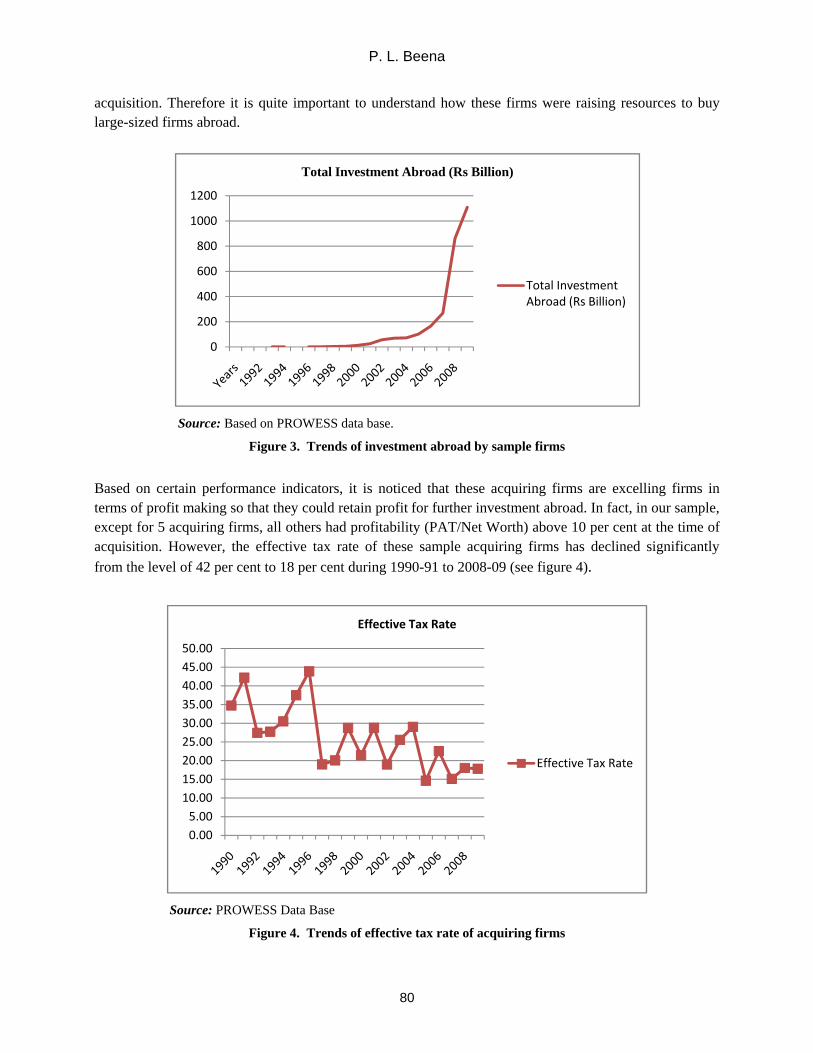
P. L. Beena
80
acquisition. Therefore it is quite important to understand how these firms were raising resources to buy large-sized firms abroad.
Source: Based on PROWESS data base.
Figure 3. Trends of investment abroad by sample firms
Based on certain performance indicators, it is noticed that these acquiring firms are excelling firms in terms of profit making so that they could retain profit for further investment abroad. In fact, in our sample, except for 5 acquiring firms, all others had profitability (PAT/Net Worth) above 10 per cent at the time of acquisition. However, the effective tax rate of these sample acquiring firms has declined significantly from the level of 42 per cent to 18 per cent during 1990-91 to 2008-09 (see figure 4).
Source: PROWESS Data Base
Figure 4. Trends of effective tax rate of acquiring firms
0
200
400
600
800
1000
1200
Total Investment Abroad (Rs Billion)
Total Investment Abroad (Rs Billion)
0.005.00
10.0015.0020.0025.0030.0035.0040.0045.0050.00
Effective Tax Rate
Effective Tax Rate

Economic Liberalisation and Financing Pattern of Indian Acquiring Firms Abroad
81
Average debt-equity ratio of our sample of 38 acquiring firms at the time of acquisition was 0.95 per cent. The debt-equity ratio of 29 acquiring firms among them was below the average level. This ratio for 17 out of 38 has increased in the year immediately after the merger while the rest of the cases have shown a declining trend in the following year after the merger. The study observed that the foreign exchange spending by these firms is 17 times higher than their foreign exchange earnings during 1990 to 2010 (Beena 2011b). This is disturbing if we consider the interest of the country. 4. Financing pattern of Indian acquiring firms From Table 2, it is quite clear that these acquiring firms generally mobilised a major share through external sources which coincides with the trends in the Indian corporate sector (see Beena 2011a for more details). Borrowings were the major source of external financing although these acquiring firms were able to raise relatively large share of resources through capital market as compared to the manufacturing sector as a whole (see table 2 & appendix 2). There is an increasing trend towards foreign borrowings, apparently, taking advantage of policy changes. Current liabilities & other provisions were the major sources of external financing during the third phase where there was a dip in the funds raised from borrowings and capital market. Retained profit did contribute significantly for the internal financing throughout our study period. Significant amount (around 50 per cent) of these resources have been used for Gross Fixed Assets (GFA) throughout our study period.
Table 2. Sources of finance of Indian acquiring firms abroad (percentage share to total)
1991 to 1994 1995 to 2000 2001-2005 2006-2009
Retained Profits 15.83 23.28 26.49 28.61 Depreciation 15.76 20.98 19.55 11.04 Internal Financing 31.60 44.26 46.05 39.65 External sources 68.40 55.74 53.95 60.35 Fresh Capital Raised 16.76 19.67 8.12 15.23 Share Premium 13.95 15.79 9.367 12.88 Borrowings 35.55 24.35 18.73 33.01 Foreign Borrowings 0.58 9.81 -5.023 7.12 Current Liabilities and Provisions 16.09 11.71 27.11 12.11 Sundry Creditors 12.30 9.09 14.46 8.84 Share of GFA to Total Uses of Funds 54.06 61.01 45.47 54.31
Source: PROWESS Data Base. Source: Note: Internal sources = Retained profits + depreciation; External sources = Funds raised from the capital market + Borrowings + Current liabilities and provisions. GFA refers to gross fixed assets.
Current liabilities & other provisions were the major sources of external financing during the third phase where there was a dip in the funds raised from borrowings and capital market. The following sub-section has made an attempt to understand the resource mobilisation of acquiring firms based on case studies. We
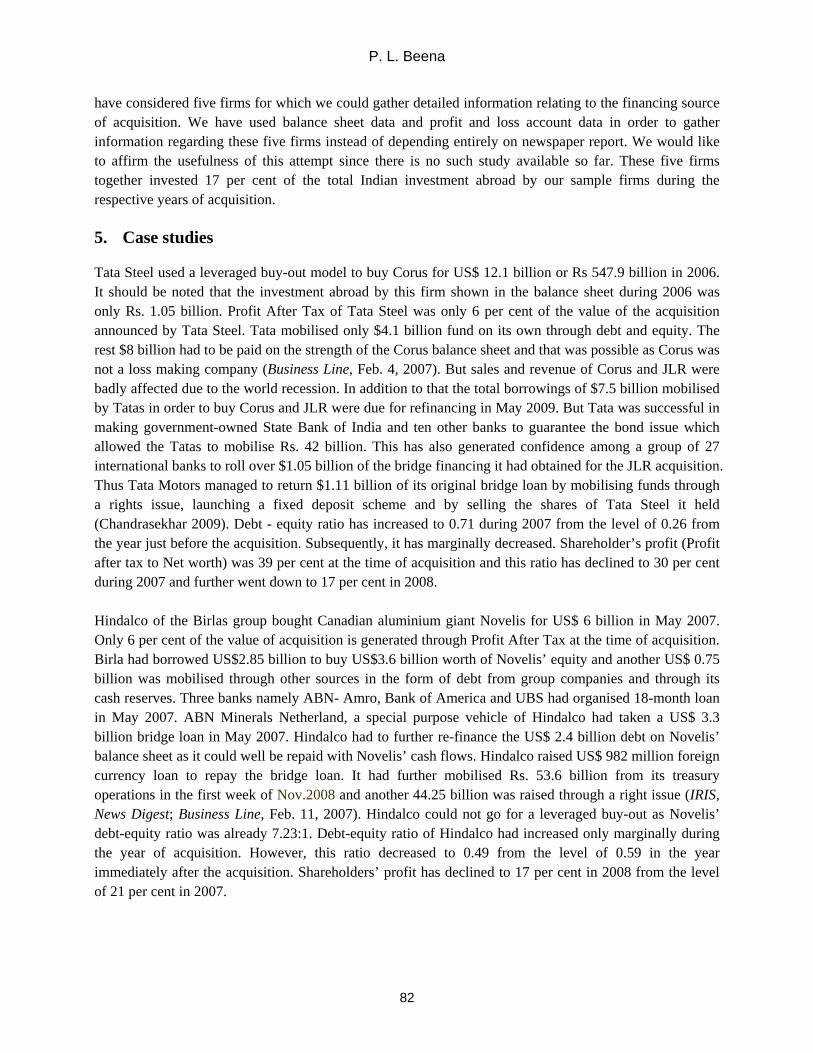
P. L. Beena
82
have considered five firms for which we could gather detailed information relating to the financing source of acquisition. We have used balance sheet data and profit and loss account data in order to gather information regarding these five firms instead of depending entirely on newspaper report. We would like to affirm the usefulness of this attempt since there is no such study available so far. These five firms together invested 17 per cent of the total Indian investment abroad by our sample firms during the respective years of acquisition. 5. Case studies Tata Steel used a leveraged buy-out model to buy Corus for US$ 12.1 billion or Rs 547.9 billion in 2006. It should be noted that the investment abroad by this firm shown in the balance sheet during 2006 was only Rs. 1.05 billion. Profit After Tax of Tata Steel was only 6 per cent of the value of the acquisition announced by Tata Steel. Tata mobilised only $4.1 billion fund on its own through debt and equity. The rest $8 billion had to be paid on the strength of the Corus balance sheet and that was possible as Corus was not a loss making company (Business Line, Feb. 4, 2007). But sales and revenue of Corus and JLR were badly affected due to the world recession. In addition to that the total borrowings of $7.5 billion mobilised by Tatas in order to buy Corus and JLR were due for refinancing in May 2009. But Tata was successful in making government-owned State Bank of India and ten other banks to guarantee the bond issue which allowed the Tatas to mobilise Rs. 42 billion. This has also generated confidence among a group of 27 international banks to roll over $1.05 billion of the bridge financing it had obtained for the JLR acquisition. Thus Tata Motors managed to return $1.11 billion of its original bridge loan by mobilising funds through a rights issue, launching a fixed deposit scheme and by selling the shares of Tata Steel it held (Chandrasekhar 2009). Debt - equity ratio has increased to 0.71 during 2007 from the level of 0.26 from the year just before the acquisition. Subsequently, it has marginally decreased. Shareholder’s profit (Profit after tax to Net worth) was 39 per cent at the time of acquisition and this ratio has declined to 30 per cent during 2007 and further went down to 17 per cent in 2008. Hindalco of the Birlas group bought Canadian aluminium giant Novelis for US$ 6 billion in May 2007. Only 6 per cent of the value of acquisition is generated through Profit After Tax at the time of acquisition. Birla had borrowed US$2.85 billion to buy US$3.6 billion worth of Novelis’ equity and another US$ 0.75 billion was mobilised through other sources in the form of debt from group companies and through its cash reserves. Three banks namely ABN- Amro, Bank of America and UBS had organised 18-month loan in May 2007. ABN Minerals Netherland, a special purpose vehicle of Hindalco had taken a US$ 3.3 billion bridge loan in May 2007. Hindalco had to further re-finance the US$ 2.4 billion debt on Novelis’ balance sheet as it could well be repaid with Novelis’ cash flows. Hindalco raised US$ 982 million foreign currency loan to repay the bridge loan. It had further mobilised Rs. 53.6 billion from its treasury operations in the first week of Nov.2008 and another 44.25 billion was raised through a right issue (IRIS, News Digest; Business Line, Feb. 11, 2007). Hindalco could not go for a leveraged buy-out as Novelis’ debt-equity ratio was already 7.23:1. Debt-equity ratio of Hindalco had increased only marginally during the year of acquisition. However, this ratio decreased to 0.49 from the level of 0.59 in the year immediately after the acquisition. Shareholders’ profit has declined to 17 per cent in 2008 from the level of 21 per cent in 2007.
Economic Liberalisation and Financing Pattern of Indian Acquiring Firms Abroad
83
Videocon and Ripplewood signed an agreement to buy Daewoo’s electronics business in a creditors’ sale in 2005. Videocon would own just over 50% in a Special Purpose Vehicle that is being set up to make the acquisition while Ripplewood would own the rest. It was also expected to raise funds from the Daewoos’ creditors who opted to continue as lenders to the company after the takeover and from acquiring firms’ own funds. The money to pay for Daewoo purchase was $720 million. Videocon paid only $50 million in equity for the purchase and the rest was the foreign currency loans while Videocon paid 100% equity to buy Thomson’s colour picture tubes business. The debt-equity ratio of this firm declined immediately in the year after merger from the level of 1.42 to 0.88. But this firm had a lower debt-equity ratio in the year just before the acquisition. In the case of this firm, Shareholders’ profit has increased from the level of 8 per cent to 9 per cent in the year after merger. Dr Reddy Laboratories’ acquisition of Betapharm in 2006 was for 480 million Euros. Dr. Reddy signed an agreement with 3i, the private equity house that controls Betapharm. It was expected to be financed by internal cash reserves and committed credit facilities. 3i, UK-based group bought Betapharm for 300 million Euros in 2005. Betapharm was the fourth largest German drug firm having a market share of 3.5 per cent (Business Line, 17 2006). Dr Reddy’s consolidated group debt was brought to $700 million when the Betapharm deal was closed. The company therefore launched ADR in early January 2006 which helped them wipe out their debt. But the higher financing affected the profit and loss account of Betapharm (Financial Express, Feb. 3, 2006). Debt-equity ratio slightly increased in this case. Shareholders’ profit has increased significantly from 9.3 per cent to 27 per cent in the year following the merger and declined to 10 per cent subsequently. Ranbaxy Laboratories Ltd. bought Terapia S.A. based in Romania in 2006 for Rs. 15 billion. The acquisition was funded from the proceeds of Foreign Currency Convertible Bonds (FCCBs) issued by the company during the year of acquisition. FCCB is a mix of debt and equity. It acts like a bond by paying coupon and principal payments. The investors receive the safety of guaranteed payments on the bond and are also able to take advantage of any large price appreciation in the company’s stock. This combination was expected to make Ranbaxy the No.1 generic firm in the Romanian market (Rao, 2007). Debt- equity ratio decreased consistently after acquisition as compared to the period before acquisition. Shareholders’ profit increased from 9 per cent to 17 per cent within a year after acquisition and it further increased to 24 per cent in 2008. Thus our case study reveals that each firm has generated funds by adopting different form of financial innovative products such as ADR/GDR, Foreign Currency Convertible Bonds, Foreign Currency Exchangeable Bonds, Special Purpose Vehicles, Private equity, and Venture capital in order to buy large sized firms abroad. A comprehensive sample could have revealed some patterns in this process. However, this can be done only through another major project. 6. Conclusion Although the acquiring firms have been quite successful in raising resources internally, they were depending largely on external sources. Borrowings were the major source of external financing. These firms have also made use of foreign borrowings and issues of bonds in order to acquire large sized firms abroad. The study further argues that it is not because they were flush with a surplus of funds that they

went in foADR/GDRPurpose Vrate paid bfirms werspending bconsider tconsequenthis papercreate con Appendix
Appendix
Retained
Deprecia
Interna
Externa
A) Fund
Fresh ca
Share pr
B) Borro
Institutio
C) Curre Source: CMNote: Intern+ Current Li
or acquisitionR, Foreign C
Vehicles and by these acqure excelling by these firmthe interest nces of these r. Regulation nditions for gr
x 1: Trends in
Source: B
x 2: Sources o
d profits
ation
l financing
al sources
ds raised from c
apital raised
remium
owings
onal borrowin
ent liabilities a
MIE, Corporate Snal sources = Reiabilities and Pro
ns overseas. ICurrency CoPrivate equityuiring firms hin terms of
ms is much hiof the countacquisitions fby the state
rowth and dev
n FDI outflo
ased on Author’
of finance of
capital market
ngs
and provisions
Sector Various Istained Profits + ovisions.
P.
Instead, they onvertible Boy firms in ordhas significanprofitability. gher than fortry. It is extfrom the deve
e through mevelopment in
ws/inflows th
’s calculation, W
f Indian man
1991 to 1
1
2
7
2
1
2
ssues. NA- Not Depreciation; E
. L. Beena
84
have made uonds, Foreigder to acquirently declined
Finally, the reign exchangtremely impoelopment persasures of corthe domestic
hrough CBM
World Investment
nufacturing s
1994 199
9.26
16.86
26.12
73.88
24.68
6.38
11.14
26.96
8.28
22.2
Available External sources
use of funds n Currency e large-sized during the listudy obser
ge earnings. Tortant to studspective althorporate gover economy.
M&As
t Report, UNCT
ector (percen
95 to 2000
9.24
20.62
30.16
69.84
16.9
4.88
6.48
26.44
6.9
26.54
= Funds raised
generated thrExchangeablfirms abroadiberalisation rved that the These are quidy the econoough this is brnance is imp
AD, Various Iss
ntage share t
2001-2005
36.5
21.30
57.8
38.6
-0.5
1.5
1.5
15.4
-5.7
28.2
from the Capita
rough Borrowle Bonds, S
d. The effectivperiod while foreign exc
ite disturbingomic motiveeyond the scoportant in ord
sues.
to total)
2006-2009
25.33
12.78
37.68
62.5
NA
10.3
9.05
28.45
NA
21.8
al Market + Borr
wings, pecial ve tax these
hange if we
es and ope of der to
3
8
8
5
A
3
5
5
A
8
rowings

Economic Liberalisation and Financing Pattern of Indian Acquiring Firms Abroad
85
References
Athukorala, Prema-chandra. (2009) Outward Foreign Direct Investment from India, Asian Development Review, Vol 26, No.2; 125-153, 2009.
Beena P. L (2011a) Economic Liberalisation and Financing Pattern: With a Focus on Acquiring Firms, CDS Working paper, No.440, January, 2011.
Beena P. L (2011 b) FDI Outflows and Overseas Acquisitions: Evidence from India, Paper presented at the Institute for Studies in Industrial Development, March 11, 2011.
CMIE (Centre for Monitoring Indian Economy), Corporate Sector, Economic Intelligence Service, Various Issues. Chandrasekhar C P (2009) Continuity or Change? Finance Capital in Developing Countries: A Decade after the
Asian Crisis in Ghosh Jayati and Chandrasekhar C P (ed), After Crisis: Adjustment, Recovery and Fragility in East Asia, Tulika Books, New Delhi, 2009.
Chandrasekhar C P (2009), “Tata Rides the Recession”, Macroscan, 17th June, 2009. Government of India (GOI) (2006), Receipts Budget, 2008-09, Annex-12, http://indiabudget.nic.in, 2006. Gopinath, Syamala (2007), Overseas Investments by Indian Companies - Evolution of Policy and Trends. RBI
Bulletin, February, Vol LXI, No.2, Mumbai, 2007. Nagaraj R (2006), Indian Investment Abroad: What Explains the Boom? Economic and Political Weekly, Vol XLI,
No 46, pp 4716-18, 2006. Nayyar, D (2007), The Internationalisation of Firms from India: Investments, Mergers and Acquisitions. SLPTMD
WP No. 004, Department of International Development, QEH, University of Oxford, 2007. Pradhan, Jaya Prakash (2007), Trends and Patterns of Overseas Acquisitions by Indian Multinationals, Working
Paper No:2007/10, October, ISID, New Delhi, 2007. Rao, KVSS Narayana (2007) Handbook of Mergers and Acquisitions, National Institute of Industrial Engineering,
Mumbai, 2007. RBI (2009), Indian Investment Abroad in Joint Ventures and Wholly Owned subsidiaries, Monthly Bulletin, January,
2009. Singh Lakhwinder and Jain Varinder (2009), Emerging Pattern of India’s Outward Foreign Direct Investment under
influence of State Policy: A Macro View, MPRA Paper No.13439, 10 February, 2009, (http://mpra.ub.uni-muenchen.de/13458/).
UNCTAD (2004) India's outward FDI: a giant awakening? UNCTAD/DITE/IIAB/2004/1, 20 October 2004. World Investment Report (Various Issues), UNCTAD, New York.
Wang Qian and Agyenim Boateng (2007), Cross-Border M&As by Chinese Firms: An Analysis of Strategic Motivation and Performance, International Management Review, Vol 3, No.4, 19-29, 2007.
i Outward FDI has been considered as an effective channel through which local firms can improve their competitiveness by accessing global technological know-how and building trade support networks (GoI, 2009).
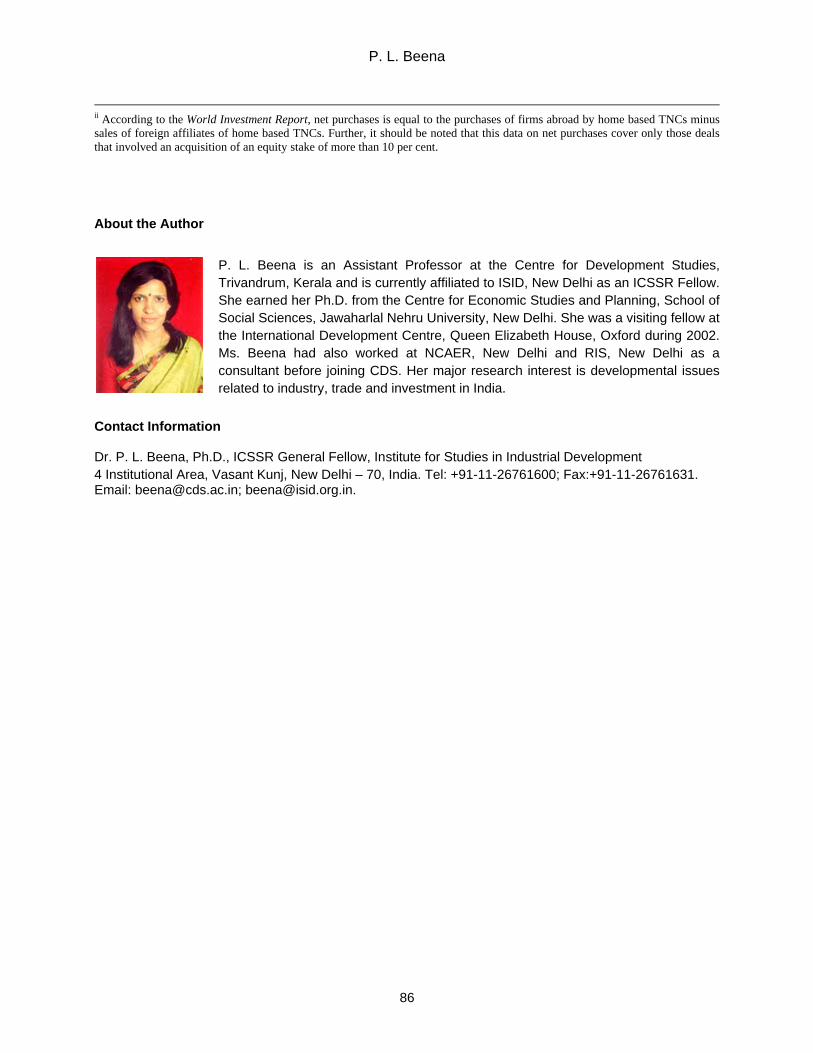
P. L. Beena
86
ii According to the World Investment Report, net purchases is equal to the purchases of firms abroad by home based TNCs minus sales of foreign affiliates of home based TNCs. Further, it should be noted that this data on net purchases cover only those deals that involved an acquisition of an equity stake of more than 10 per cent.
About the Author
P. L. Beena is an Assistant Professor at the Centre for Development Studies, Trivandrum, Kerala and is currently affiliated to ISID, New Delhi as an ICSSR Fellow. She earned her Ph.D. from the Centre for Economic Studies and Planning, School of Social Sciences, Jawaharlal Nehru University, New Delhi. She was a visiting fellow at the International Development Centre, Queen Elizabeth House, Oxford during 2002. Ms. Beena had also worked at NCAER, New Delhi and RIS, New Delhi as a consultant before joining CDS. Her major research interest is developmental issues related to industry, trade and investment in India.
Contact Information Dr. P. L. Beena, Ph.D., ICSSR General Fellow, Institute for Studies in Industrial Development 4 Institutional Area, Vasant Kunj, New Delhi – 70, India. Tel: +91-11-26761600; Fax:+91-11-26761631. Email: [email protected]; [email protected].

Transnational Corporations Review www.tnc-online.net [email protected]
ISSUES IN FDI AND INTERNATIONALIZATION

Transnational Corporations Review Volume 3, Number 2 June 2011 www.tnc-online.net, [email protected], DOI:10.5148/tncr.2011.1117 87-103
87
Foreign Equity and Technological Capabilities: A Comparison of Joint-venture and National Automotive Suppliers in India
Rajah Rasiah1
Abstract: Using the evolutionary framework, this paper examines differences in technological capabilities between joint-ventures with over 10% foreign equity and fully national owned suppliers located in the greater Delhi region. In a country where automotive manufacturing emerged from the relocation of foreign capital and with only 3 automobile assemblers supplying essentially the domestic market until 1991, India has experienced tremendous upward movement in firm-level technological capabilities to generate rapid growth in automotive exports to record a positive trade balance by 2000. Against the background of rapid expansion, this paper uses a sample of 84 tiers one and two suppliers to compare technological capabilities between joint-ventures with foreign equity and wholly national owned suppliers. The results show considerable participation of both joint-venture and national firms in cutting edge technological capabilities. The two tailed ‘t’ tests, and the knowledge intensity exercises show joint-ventures enjoying higher overall technological capabilities, training expense in payroll, process technology expenditure in sales and R&D expenditure in sales than national firms. The Tobit regressions show that once export-intensity and firm size is accounted for, joint-ventures enjoy a statistically significant higher technological capability with its superior process technology over national firms. Overall, the evidence shows that foreign equity is still important in the technological operations of automotive suppliers in India. Keywords: Foreign equity, technological capability, automotive, India, JEL Classifications: L62, O14, O19, O33, O38 1. Introduction Automobile assembly first took place in 1898 in India in Mumbai during British colonial rule. However, when national efforts to support automobile assembly started in India under import-substitution policies, little was expected of the industry as the Hindustan Motors and Premier Automobile Limited produced two highly fuel inefficient cars in the Ambassador and the Padmini (Kathuria, 1996; Singh, 2007; Nizamuddin, 2008: 346). The Ambassador accounted for 71% while the Padmini 26% of the market share in 1970 (D’Costa, 1995: 488). India attracted Suzuki Motor Company, which started producing cars under the name of Maruti Suzuki Company in 1983 (Chatterjee, 1990: 38). Despite the progress achieved, until 1991 Indian automobile manufacturers were not only operating with fairly low scale denominations but were also heavily protected. The focus of government policy on technological acquisition since 1983 played an important role in driving technological catch up in the joint-venture company of Maruti Suzuki Motors. Market reforms, particularly those associated with the liberalization of ownership conditions attracted several foreign assemblers since 1991. Except for cars, the Indian government abolished the compulsory industrial licensing requirement and allowed 51% foreign equity in July 1991 (Pradhan and Singh, 2009: 158). The Auto Policy of 2002 liberalized completely ownership conditions on foreign equity allowing
1 I am grateful to Ashish Kumar who coordinated the data collection from automotive firms located in the greater Delhi region, India in 2005.

Foreign Equity and Technological Capabilities
88
foreign manufacturers complete ownership of vehicle and component production and in the process scrapping the trade balancing and localization requirements that was imposed in 1997. Pradhan and Singh (2009: 159-171) also noted significant efforts to deepen automotive technology in India through government projects on R&D promotion and initiatives of Indian manufacturers to access foreign design and markets through the acquisition of foreign firms. The number of manufacturers expanded from 2 in 1950 to 3 in 1983 to 17 in 2008 (Nizamuddin, 2008: 348). With the Indian GDP growing rapidly since the mid-1990s the expansion in effective demand has even attracted the American firms of General Motors and Ford, the Japanese firms of Toyota and Honda, and the Korean firm of Hyundai. Locating in major industrial zones, these large automobile firms have opened up strong growth in demand for components and completely knocked down parts. Until 1991, India not only lost money out of the royalty payments to the brand and technology suppliers, the protection enjoyed by the assemblers kept prices high so much so that it was not affordable to most Indians. The picture began to change from the 1990s as the opening up of the Indian market attracted competition unleashing in the process the stimulus for the relocation of several assemblers from abroad, and the advancement of technology in national car companies began to stimulate automotive output and exports from India. As a consequence, exports of automotives from India rose from US$22 million in 1990 to US$369 million in 2000 and US$4.7 billion in 2009 (WTO, 2010: Table 11.60). Car production in India rose from 4,000 vehicles in 1950 to cross 14 million vehicles at the end of March 2010 (Tiwari, Ranawat and Herstatt, 2010: 1). Despite the liberalization initiatives the domestic environment was becoming increasingly attractive for production at the host site as high protection restricted imports of completely built up (CBU) units to US$267.37 million when compared to US$38 billion worth of production within India in 2005-2006 (Tiwari, Ranawat and Herstatt, 2010: 8). By 2008 there were 17 foreign joint-ventures in India assembling several brands. The expansion of automotive assembly generated enormous demand for domestic production of components and parts, which saw the expansion and agglomeration of suppliers in a number of locations in India. Consistent with the findings of Kim (2003) in Korea where the national car firm of Hyundai advanced to the technology frontier of car making compared to the joint-venture of Daewoo, the national firms of Tata and Mahindra & Mahindra have been highly successful in the production of the Indica and Nano, and Scorpio respectively (Pradhan and Singh, 2009: 162). While a virtual end to automobile imports took place since 1948 following government efforts to protect the two national firms started in independent India, efforts to support supplier firms became significant only from 1965 when 60-80 components were reserved for national small firms. Domestic firms such as Bajaj and TELCO developed national designing capability during the period when foreign companies were not approved. Whether intentionally or fortuitously, the development of national capabilities under protection enabled its further catch up when foreign firms were allowed back to quicken technological modernization in the period 1983-1990 (see Narayanan, 1989). The Indian automotive industry also benefited from timing as Japanese firms were intensifying the search for foreign markets then (see D’Costa, 1995). Technological advance in this period saw the proliferation of fuel efficient technology that used considerable substitutes from aluminium, plastics and synthetic fibres. The 1983-90 period also saw the starting of automotive exports from India through government promotion, though, a significant jump only took place after the start of the liberalization period since 1991. The existing literature has captured some of the strategies both at the national government level (e.g. Nizamuddin, 2008; Pradhan and Singh, 2009; Tiwari, Ranawat and Herstatt, 2010), and at the firm level (e.g. Narayana, 1998) that was instrumental in the technological catch up experience of
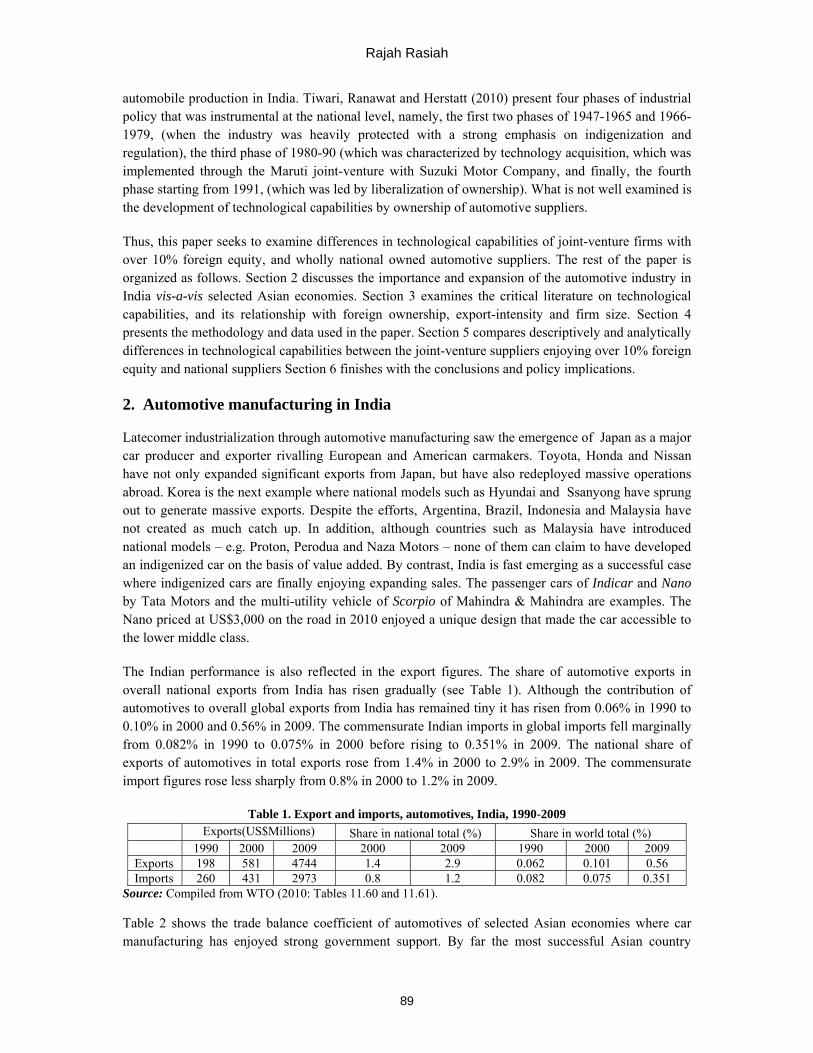
Rajah Rasiah
89
automobile production in India. Tiwari, Ranawat and Herstatt (2010) present four phases of industrial policy that was instrumental at the national level, namely, the first two phases of 1947-1965 and 1966-1979, (when the industry was heavily protected with a strong emphasis on indigenization and regulation), the third phase of 1980-90 (which was characterized by technology acquisition, which was implemented through the Maruti joint-venture with Suzuki Motor Company, and finally, the fourth phase starting from 1991, (which was led by liberalization of ownership). What is not well examined is the development of technological capabilities by ownership of automotive suppliers. Thus, this paper seeks to examine differences in technological capabilities of joint-venture firms with over 10% foreign equity, and wholly national owned automotive suppliers. The rest of the paper is organized as follows. Section 2 discusses the importance and expansion of the automotive industry in India vis-a-vis selected Asian economies. Section 3 examines the critical literature on technological capabilities, and its relationship with foreign ownership, export-intensity and firm size. Section 4 presents the methodology and data used in the paper. Section 5 compares descriptively and analytically differences in technological capabilities between the joint-venture suppliers enjoying over 10% foreign equity and national suppliers Section 6 finishes with the conclusions and policy implications. 2. Automotive manufacturing in India Latecomer industrialization through automotive manufacturing saw the emergence of Japan as a major car producer and exporter rivalling European and American carmakers. Toyota, Honda and Nissan have not only expanded significant exports from Japan, but have also redeployed massive operations abroad. Korea is the next example where national models such as Hyundai and Ssanyong have sprung out to generate massive exports. Despite the efforts, Argentina, Brazil, Indonesia and Malaysia have not created as much catch up. In addition, although countries such as Malaysia have introduced national models – e.g. Proton, Perodua and Naza Motors – none of them can claim to have developed an indigenized car on the basis of value added. By contrast, India is fast emerging as a successful case where indigenized cars are finally enjoying expanding sales. The passenger cars of Indicar and Nano by Tata Motors and the multi-utility vehicle of Scorpio of Mahindra & Mahindra are examples. The Nano priced at US$3,000 on the road in 2010 enjoyed a unique design that made the car accessible to the lower middle class. The Indian performance is also reflected in the export figures. The share of automotive exports in overall national exports from India has risen gradually (see Table 1). Although the contribution of automotives to overall global exports from India has remained tiny it has risen from 0.06% in 1990 to 0.10% in 2000 and 0.56% in 2009. The commensurate Indian imports in global imports fell marginally from 0.082% in 1990 to 0.075% in 2000 before rising to 0.351% in 2009. The national share of exports of automotives in total exports rose from 1.4% in 2000 to 2.9% in 2009. The commensurate import figures rose less sharply from 0.8% in 2000 to 1.2% in 2009.
Table 1. Export and imports, automotives, India, 1990-2009 Exports(US$Millions) Share in national total (%) Share in world total (%)
1990 2000 2009 2000 2009 1990 2000 2009 Exports 198 581 4744 1.4 2.9 0.062 0.101 0.56 Imports 260 431 2973 0.8 1.2 0.082 0.075 0.351
Source: Compiled from WTO (2010: Tables 11.60 and 11.61). Table 2 shows the trade balance coefficient of automotives of selected Asian economies where car manufacturing has enjoyed strong government support. By far the most successful Asian country

Foreign Equity and Technological Capabilities
90
experiences in car manufacturing are Japan and Korea, both of whom enjoy massive trade balance surpluses. Nevertheless, from a negative coefficient in 1990, India’s coefficient has risen dramatically to a positive coefficient of 0.148 in 2000 and grew further to 0.229 in 2009. In contrast, the coefficients of China, Indonesia and Malaysia have remained negative. Thailand has also made massive strides over the period 1990-2009, turning a massive deficit of -0.921 in 1990 to a slight surplus of 0.074 in 2000 and a significant surplus of 0.407 in 2009.
Table 2. Trade balance, automotives, selected asian countries, 1990-2009
Country 1990 2000 2009 China -0.749 -0.412 -0.217 India -0.135 0.148 0.229 Indonesia -0.985 -0.671 -0.336 Japan 0.801 0.797 0.823 Korea 0.425 0.791 0.746 Malaysia -0.831 -0.713 -0.610 Thailand -0.921 0.074 0.407
Note: Trade Balance measured using the formula: (exports-imports)/(exports+imports). Source: Compiled from WTO (2010: Tables 11.60 and 11.61).
However, whereas India’s more stringent regulatory framework and the larger domestic market has driven technological catch up in national firms, foreign firms still dominate automobile assembly and the first-tier suppliers in Thailand (see Lauridsen, 2009). Indian companies such as Tata Motors, Mahindra & Mahindra and Bajaj Auto have become important players in the domestic market (see Figure 1). Bajaj Auto accounted for 53% and 41% respectively of the 2-wheeler and 3-wheeler market
Source: Tiwari, Ranawat and Herstatt (2010: 11).
Figure 1. Final automotive market, India, 2008-2009
Hero Honda Motors
28%
Bajaj Auto53%
TVS Motor9%
Honda 6%
Others 4%
2-wheeler market
Maruti Suzuki
47%
Tata Motors
15%
Hyundai Motor
16%
Mahindra & Mahindra
7%
GM 4% Others
12%
Passenger vehicles market
Bajaj Auto41%
Piaggio vehicles
44%
Mahindra & Mahindra
8%
Others7%
3-wheeler market
Tata Motors 62%
Ashok Leyland
26%
SwarajMazda
2%
EicherMotors
7%
Others3%
Commercial vehicles market
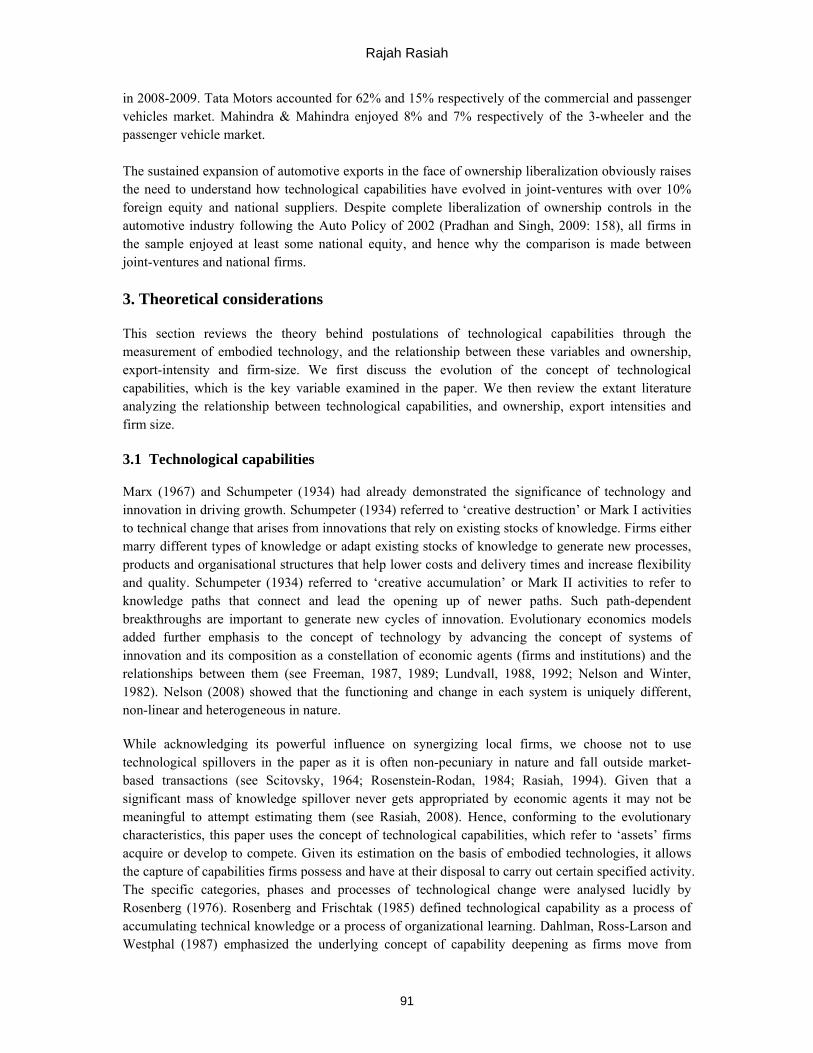
Rajah Rasiah
91
in 2008-2009. Tata Motors accounted for 62% and 15% respectively of the commercial and passenger vehicles market. Mahindra & Mahindra enjoyed 8% and 7% respectively of the 3-wheeler and the passenger vehicle market. The sustained expansion of automotive exports in the face of ownership liberalization obviously raises the need to understand how technological capabilities have evolved in joint-ventures with over 10% foreign equity and national suppliers. Despite complete liberalization of ownership controls in the automotive industry following the Auto Policy of 2002 (Pradhan and Singh, 2009: 158), all firms in the sample enjoyed at least some national equity, and hence why the comparison is made between joint-ventures and national firms. 3. Theoretical considerations This section reviews the theory behind postulations of technological capabilities through the measurement of embodied technology, and the relationship between these variables and ownership, export-intensity and firm-size. We first discuss the evolution of the concept of technological capabilities, which is the key variable examined in the paper. We then review the extant literature analyzing the relationship between technological capabilities, and ownership, export intensities and firm size. 3.1 Technological capabilities Marx (1967) and Schumpeter (1934) had already demonstrated the significance of technology and innovation in driving growth. Schumpeter (1934) referred to ‘creative destruction’ or Mark I activities to technical change that arises from innovations that rely on existing stocks of knowledge. Firms either marry different types of knowledge or adapt existing stocks of knowledge to generate new processes, products and organisational structures that help lower costs and delivery times and increase flexibility and quality. Schumpeter (1934) referred to ‘creative accumulation’ or Mark II activities to refer to knowledge paths that connect and lead the opening up of newer paths. Such path-dependent breakthroughs are important to generate new cycles of innovation. Evolutionary economics models added further emphasis to the concept of technology by advancing the concept of systems of innovation and its composition as a constellation of economic agents (firms and institutions) and the relationships between them (see Freeman, 1987, 1989; Lundvall, 1988, 1992; Nelson and Winter, 1982). Nelson (2008) showed that the functioning and change in each system is uniquely different, non-linear and heterogeneous in nature. While acknowledging its powerful influence on synergizing local firms, we choose not to use technological spillovers in the paper as it is often non-pecuniary in nature and fall outside market-based transactions (see Scitovsky, 1964; Rosenstein-Rodan, 1984; Rasiah, 1994). Given that a significant mass of knowledge spillover never gets appropriated by economic agents it may not be meaningful to attempt estimating them (see Rasiah, 2008). Hence, conforming to the evolutionary characteristics, this paper uses the concept of technological capabilities, which refer to ‘assets’ firms acquire or develop to compete. Given its estimation on the basis of embodied technologies, it allows the capture of capabilities firms possess and have at their disposal to carry out certain specified activity. The specific categories, phases and processes of technological change were analysed lucidly by Rosenberg (1976). Rosenberg and Frischtak (1985) defined technological capability as a process of accumulating technical knowledge or a process of organizational learning. Dahlman, Ross-Larson and Westphal (1987) emphasized the underlying concept of capability deepening as firms move from

Foreign Equity and Technological Capabilities
92
technology-using to innovation-driving production capabilities. The sequence of capabilities they developed – running from production capability through investment capability to innovation capability – became the basis of the taxonomies of technological capabilities developed by Bell (1986) and Lall (1992). Bell (1986) grouped technology flows into three categories. Flow A consisted of capital goods and technological, engineering and management services. Flow B consisted of the skills and know-how to operate and maintain the newly established production technology. Flow C consisted of the knowledge and expertise to implement technical change, or the ‘know-why’. In this framework, flow A led to an improvement in production capability, flow B contributed to technological capability at the basic and routine levels, and flow C enabled the firm to generate dynamic technical and organizational change. Lall (1992) outlined a functional categorization of technological capabilities based on the task facing a manufacturing firm. He divided the capabilities associated with the tasks into two groups: investment capabilities and production capabilities. These were further subdivided into three levels of capabilities: a basic level consisting of simple and experience-based capabilities; an intermediate level consisting of adaptive and duplicative but research-based capabilities; and an advanced level consisting of innovative and risky but also research-based capabilities. Wei (1995) integrated Lall’s functional categories with Bell’s technology flow classification. He concluded, first, that not all technology flows generate technological capability, and second, that linkages with local supplier and other groups in a local economy are critical for enhancing capability. Rasiah (2004, 2009a) drew on these contributions to focus on technological capabilities only, establishing in the process a typology of capabilities based on the depth and trajectory of knowledge among firms (see below). This framework allowed the measurement of three different types of technological capability: human resources, process technology and product technology so as to facilitate the estimation of the overall technological capability (TC) of a firm, which is also important to examine the influence of export, ownership and firm-size on technology. 3.2 Ownership and technological capabilities Given the removal of foreign ownership regulations in India in the liberalization phase, this paper offers an opportunity to test Dunning’s (1971, 1974) ownership, location and internalization (OLI) hypothesis on the impact of foreign firms’ relocation decisions. Where host-site conditions are favourable foreign multinationals may transfer superior tangible and intangible assets from their parent plants thereby showing higher technology intensity (TI) levels than local firms. Where competition is intense even when final sales are targeted mainly to the domestic market, foreign firms may actually support technological capability building in supplier firms to compete effectively by drawing on the benefits of supply chain management (Porter, 1996). Foreign-ownership dominated large firms may not show statistically significant higher technology means than local firms if the strategies and motives of these firms have been influenced by locational conditions that do not encourage strong technological widening and deepening (Cantwell and Mudambi, 2005). Because joint-ventures with over 10% foreign equity among automotive component and parts suppliers in India enjoy access to human capital and are facing rising competition from increasing numbers of manufacturers, they are expected to deploy cutting edge technologies to support the operations of automobile assemblers (Rasiah, 2011).

Rajah Rasiah
93
Nevertheless, the empirical evidence in the 1960s and 1970s tended to support the view that MNCs only relocated standardized product technologies, and whenever R&D was carried out at these sites they were confined to minor modifications to equipment and processes (see Hughes and You, 1969; Lall, 1979; Rasiah, 1992). It was not until the emergence of strong evidence of off-shoring by MNCs in developing economies that serious doubts emerged about the product cycle argument of Vernon (see Dunning, 1994; Cantwell, 1995; Prasada, 2000; Hobday, 1996; Rasiah, 1996, 2004; UNCTAD, 2005; Ernst, 2006).
Motives for relocation to a large extent helped explain MNC initiatives to relocate R&D activities to host-sites economies (see Narula and Dunning, 2000; Cantwell and Mudambi, 2005). Dunning (1994) had already opened the way for a better understanding of spillovers at host-sites by addressing the motives for relocation. These developments nevertheless are consistent with Hymer’s (1960) efforts to relate relocation decisions to the host-site’s relative advantages over home sites and the expansion into multinational operations consequently increasing concentration levels in specific product markets. Indeed, host-site’s benefits relative to other sites that explain R&D off-shoring today. 3.3 Exports and technological capabilities Purely on the basis of scale and competitive pressure, exporting will generate a positive impact on firm-level technological capabilities (see Smith, 1776; Hirschman, 1958, 1970). However, the relative importance of export-intensities by ownership may differ. If globally competitive multinationals are involved, their superior experience and tacit relationships in global markets will generally make joint-venture firms enjoying foreign equity more export-intensive than local firms. Helleiner (1973) had argued that the decentralization of production into different stages actually helped raise not only investment and employment but also exports from hosts-sites in developing economies. However, this premise may not hold if the relocation of multinational firms was targeted to supply protected domestic markets as is very much the case with automotives in India until 1991. Given that foreign equity in automotive component and parts manufacturing is mainly targeted at supplying automobile assemblers, export-intensities may be low in India (see Rasiah, 2011). Both foreign and local firms have also been known in some cases to participate in R&D activities when protection rents are available, and hence, one it is possible to have an inverse statistical relationship between R&D and export-intensity (see Rasiah and Kumar, 2007). Nevertheless, even inward-oriented suppliers may be able to utilize the scale and competitive pressure from export markets to drive technological capabilities, especially in human resource and process technology capabilities. 3.4 Firm size and technological capabilities Industrial organization economists argue that minimum scale efficiencies vary with industries as the long run average cost curves of firms is determined by the scale involved (Pratten, 1971; Scherer, 1980). Firms are expected to expand production so long as marginal revenue is greater or equal to the marginal cost. Hence, there is a tendency for industrial organisation economists to support large size especially when involving heavy industries such as automobiles and steel. However, SMEs are efficient at producing automotive components and parts specializing on the basis of scope. However, industrial district (see Wilkinson and You, 1994; Marshall, 1890; Piore and Sabel, 1984; Rasiah, 1994; Sengenberger and Pyke, 1992) exponents argue that SMEs are better allocators and coordinators of resources and production owing to their SMEs size flexibility and agility to enter and

Foreign Equity and Technological Capabilities
94
exit markets. Unlike the impersonal large firm, SMEs are considered to provide greater room for horizontal relationships that support trust and social capital. Audretsch (2002, 2003) and Acs and Audretsch (1988) produced evidence from the United States to argue that SMEs participate more in R&D activities than large firms. Unlike the dynamic methodology used to capture relationships by industrial district exponents, Audretsch (2002), Acs and Audresch (1988) and Rasiah (1994, 1995) used statistical evidence to argue over the allocative and flexibility advantages of small firms. Given the strength of the arguments above it is worth exploring this debate using empirical evidence from a region endowed with strong regulatory support to drive technological catch up in automotive firms. Overall, given the specificity of the automotive component and parts industry, India’s large domestic market and changes in government policy, it is not appropriate to establish ex ante a set of clear hypothesis in a deductive manner to compare technological capabilities between joint-ventures enjoying over 10% foreign equity and national firms. Hence, we allow the ensuing statistical evidence to produce the conclusions on these differences. 4. Methodology and data This section discusses the methodological instruments used to estimate and examine technological capabilities, the data used, and the equations specified to test statistical significance of the differences between joint-venture and national firms taking account of export-intensity and size . Table 3 shows the formulation of the capability variables used to estimate overall TC. Table 4 differentiates the technological capability variables by taxonomy and trajectory.2 The differentiation by depth is based on the sophistication of the lead supplier firms, which was established from interviews with five first-tier suppliers. The sample is confined to tier one and two suppliers only to ensure that the comparison between national firms and the joint-ventures enjoying over 10% foreign equity were undertaken meaningfully. Given the expansion of especially vocational skilled training, diplomas and engineering degrees among the large population to stimulate rapid growth in automotive manufacturing and exports from India since the 1990s, fairly high levels of technological capabilities can be expected from the sample.
Table 3. Variables, proxies and measurement formulas, automotive firms
Variable Proxies Specification HR Training expenditure in payroll, HR practices
and skill-intensity Normalized using formula: (xi-xmin)/(xmax-xmin)
Process Technology Age of machinery and equipment, inventory and quality control systems, expenditure on inventory and quality control systems, process patent
Normalized using formula: (xi-xmin)/(xmax-xmin)
Product Technology R&D expenditure in sales and R&D personnel in workforce
Normalized using formula: (xi-xmin)/(xmax-xmin)
Source: Formulated by author
2 The formulation of technological capabilities and knowledge level shown in Table 4 draws on the arguments advanced by Dosi (1982) and Pavitt (1984).
Rajah Rasiah
95
Table 4. Taxonomy and trajectory of automotive firms
Knowledge depth HR Process Product Simple activities
(1) On the job and in-house training
Dated machinery with simple inventory control techniques
Assembly or processing of component, CKD and CBU using foreign technology
Minor improvements (2)
In-house training and performance rewards
Advanced machinery, layouts and problem solving
Precision engineering
Major improvements
(3)
Extensive focus on training and retraining; staff with training responsibility
Cutting edge inventory control techniques, SPC, TQM, TPM
Cutting edge quality control systems (QCC and TQC) with original equipment manufacturing (OEM) capability
Engineering (4) Hiring engineers for adaptation activities; Separate training department
Process adaptation: layouts, equipment and techniques
Product adaptation
Early R&D (5) Hiring engineers for product development activities; Separate specialized training activities
Process development: layouts, machinery and equipment, materials and processes
Product development capability. Original design manufacturing (ODM)
Mature R&D (6) Hiring specialized R&D scientists and engineers wholly engaged in new product research
Process R&D to devise new layouts, machinery and equipment prototypes, materials and processes
New product development capability, original brand manufacturing (OBM)
Source: Developed from Lall (1992), Rasiah (1994, 2007) The data used in this paper is drawn from a survey coordinated by the author in 2005-2006. The original data gathered included responses for 2002 and 2005, but the earlier data was dropped from this paper because 24 firms either did not reply to important questions or were not in operation then. The national consultant who collected the data used a sampling frame supplied by state authorities taking account of size and ownership. The data obtained is shown in Table 5. Unless otherwise stated all information presented are for the year 2005.
Table 5. Breakdown of sampled data, automotive firms, India, 2005
CKD Component Total Mailed 60 60 120 Responses 39 45 84 Interviewed+ 5 6 9 Note: CKD – completely knocked down. Source: * - UNU-MERIT (2005-2006)
4.1 Technological capabilities
Three capability variables were used to estimate overall TC, viz., human resource, process technology and R&D. Firm-level technologies include human resource practices, machinery and equipment, inventory and quality control systems and R&D expenditure and personnel. Because there are no a prior reasons to attach greater significance to any of the proxies used, the normalization procedure used is not weighted. The following technological intensities are specified: Human resource Human resource (HR) capability was estimated as follows:

Foreign Equity and Technological Capabilities
96
HRi=1/3[TEi, CHRPi, SIi] TE, CHRP and SI refer to training expense as a share of payroll, cutting edge HR practices (estimation formula: a score of one was added to anyone of the cutting practices of small group activities, team-working, quality control circles, stock sharing and performance-based rewards and promotions and divided by 4 for the number of proxies used), and skill-intensity (estimation formula: professionals, technicians, machinists and skilled workers divided by total workforce) of firm i (see Table 3). Because the proxies were evenly weighted HR was divided by 3 to take account of the three proxies used. Process technology Process technology (PT) capability was estimated as follows: PTi = 1/3[PTEi, IQCSi, K/Li] PTE, IQCS and K/L refer to process technology expenditure in sales, cutting edge inventory and quality control systems (estimation formula: a score of one was added to anyone of the cutting edge practices of just in time, quality standards (QS) or ISO 9000 series, statistical process control, total quality management, defect tolerance rate by parts per million and total preventive maintenance), and capital intensity (fixed capital divided by workforce) of firm i respectively (see Table 3). Because the proxies were evenly weighted PTE was divided by 3 to take account of the number of proxies used. R&D capability R&D (RD) intensity was measured as follows: RDi = 1/2[RDexpi, RDempi] Where RDexp and RDemp refer to R&D expenditure in sales and R&D personnel in workforce respectively of firm i (see Table 3). Because the proxies were evenly weighted, RD was divided by 2. TC was estimated as: TC = HR+PT+RD Where HR, PT and RD refer to human resource, process technology and R&D capabilities respectively, of firm i in 2005. Training expense in payroll (TE), process technology expenditure in sales (PTE) and R&D expenditure in sales (RDE) were used to represent HR, PT and RD capabilities in the component regressions. In addition, the HR variable of CHRP was also examined separately as a technological capability variable. Because the firms surveyed are from the same location (Delhi) the variance in systemic support facing the firms in each of the countries is not expected to be high, and hence, no attempt was made to estimate the influence of institutional support effects on the firm-level regressions.
4.2 Other variables
The explanatory variable of joint-venture with over 10% foreign equity and national firms, and the control variables of export intensity and firm size are defined here. Export-intensity

Rajah Rasiah
97
Export-intensity is measured as: Export intensity = Xi/Yi. Where X and Y refer to export and gross output respectively of firm i in 2005. Ownership Two categories of ownership are important here. The first refers to the percentage share of foreign equity (FO) in the suppliers, and it is measured as follows: FOi = [Foreign equity/total equity]X100%. The second category differentiates firms with foreign equity (FO1) exceeding 10% from other firms for the knowledge intensity comparisons. FO1 was estimated as follows: FO1=1 when foreign equity in the supplier firm exceeded 10%; FO1=0 otherwise Firm size Firm Size (S) was measured as follows: Si = the logarithm of the actual employment. Where S refers to size of firm i in 2005. The control variable of age was tested and dropped because of problems of multi-correlinearity with size (see Appendix 1). 4.3 Statistical exercises The paper uses the descriptive comparisons of technological capabilities, and export intensities and firm size using first the standard one-tail univariate tests, the Levene’s two-tail t-tests and knowledge intensity. The following equations are then estimated to examine statistical differences between the joint-venture firms with over 10% foreign equity and national firms taking account of export-intensity and firm-size. Age was dropped because of multi-collinearity problems with size. Tobit: TI= α + β1FO + β2X/Y+ β3S + µ (1) Tobit: TE = α + β1FO + β2X/Y+ β3S + µ (2) Tobit: CHRP = α + β1FO + β2X/Y+ β3S + µ (3) Tobit: PTE = α + β1FO + β2X/Y+ β3S + µ (4) Tobit: RDE = α + β1FO + β2X/Y+ β3S + µ (5) Because the variables of TC, TE, CHRP, PTE and RDE are censored on both the left and right with a minimum value of 0 and a maximum value of 1 Tobit regressions were preferred over OLS regressions (see Greene, 1981). 5. Statistical results This section analyzes the technological capabilities enjoyed by automotive firms in India. The mean score of technological capabilities of automotive firms in India produce different results because of the significantly higher human capital endowments and strong networking between firms and institutions in India. In this section we undertake both descriptive and analytical tests.

Foreign Equity and Technological Capabilities
98
5.1 Descriptive analysis The univariate tests show a highly significant set of results of all the variables (see Table 7). The cutting edge human resource practices (CHRP) enjoyed a maximum score of 1 (firms enjoying all the 4 practices) and a minimum score of 0 (firms enjoying none of the cutting edge practices). The mean score of 0.51 shows that most firms enjoyed at least 2 of the 4 practices. All suppliers in the sample invested money on training, and TE as a share of payroll varied from 1.4% and 8.0% with a mean of 4.6%. The minimum, maximum and mean PTE in 2005 were 0.0%, 11.0% and 5.0% respectively. The minimum, maximum and mean RD were 0.4%, 1.9% and 1.3% respectively demonstrating that all firms participated in R&D activities. The overall TC varied between 0.4 and 2.3 with a mean of 1.7. FO varied between 0.0% and 97.0% with a mean of 14.6%. The much lower mean compared to the high 97% foreign ownership is reflected by most joint-ventures showing low foreign capital ownership. Despite the full liberalization of ownership in 2002all the firms with foreign equity in the sample were joint-ventures. Interviews with 5 of the firms show that much of increase in foreign ownership among suppliers took place after the turn of the millennium. A significant part of the foreign equity is held by foreign assemblers that relocated operations in India following the liberalization phase since 2002 1990s. Export-intensities remained low recording a minimum of o.o% and a maximum og 44.0% and a mean of 6.3%.
Table 7. Univariate test, automotive suppliers, india, 2005
N Minimum Maximum Mean df t STD
CHRP 84 0.00 1.00 0.51 83 90.86*** 0.19
TE(%) 84 1.40 8.00 4.61 83 23.7*** 1.78
PTE(%) 84 0.00 11.00 4.99 83 22.37*** 2.04
RDE (%) 84 0.40 1.9.00 1.28 83 30.10*** 0.39
TI 84 0.43 2.34 1.66 83 40.00*** 0.38
FO (%) 84 0.00 97.00 14.61 83 6.14*** 21.82
XY (%) 84 0.00 44.00 6.26 83 6.37*** 9.01 Note: *** - significant at the 1% level. Source: Computed from UNU-MERIT survey (2005-2006) The results of the Levene’s two-tailed t tests show highly significant differences between the joint-ventures enjoying over 10% foreign equity and national suppliers involving all the technological variables (see Table 8). Only XY was not statistically significant. Where the F-statistics was significant we assumed equal variances, and otherwise where it was not significant. Although the mean of CHRP of firms with foreign equity was only slightly higher than that of national firms, it was statistically significant to show that more frontier practices are used in foreign than in local firms. Similar results were obtained for TE, PTE, RDE and TI where joint ventures with foreign equity of over 10% enjoyed a higher mean than national firms, and all the differences were statistically significant. Interviews show that foreign assemblers have taken advantage of strong engineering and technical skills of the labour force of supplier firms to influence them to maintain state of the art technological capabilities. Although joint-venture firms enjoyed a higher export-intensity mean than national firms, the results were not statistically significant suggesting that there was no obvious difference in export-intensity between joint-ventures with over 10% foreign equity and national firms. The lack of significance could also be a consequence of the domestic market being the prime target of automobile firms in India.

Rajah Rasiah
99
Table 8. Technological capabilities and export-intensity, automotive firms, India, 2005
FO N Mean F-stat(equal var) df Two-tailed t-stat STD
TE(%) 0 48 4.265 1.217 82 -2.076** 1.7341 36 5.067 75 1.765
CHRP 0 48 3.400 0.312 82 -1.982** 0.345 1 36 3.550 76 0.341
PTE(%) 0 48 4.600 0.102 82 -2.049** 2.005 1 36 5.500 76 2.005
RDE(%) 0 48 1.178 8.236*** 82 -2.833*** 0.4301 36 1.411 81 0.280
TI 0 48 1.520 8.980*** 82 -4.365*** 0.419 1 36 1.852 63 0.208
XY(%) 0 48 5.510 1.757 82 -0.846 7.837 1 36 7.260 73 10.396
Note: *** and ** - significant at 1% and 5% level respectively. Source: Computed from UNU-MERIT (2005-2006) survey. Knowledge intensity Using the benchmark criteria of the most knowledge intensive to the least knowledge intensive capabilities by HR, PT and RD using the dimensions presented in Table 4, the sampled firms responses enabled the tabulation by ownership shown in Table 9. Both national and joint-venture firms enjoyed at least level 1 and 2 of HR, PT and RD practices. However, whereas all joint-venture firms also enjoyed levels 3 and 4 capabilities, 1 and 11 national firm did not have level 3 and 4 respectively of HR and PT capabilities. In addition, 13 and 17 national firms also did not have levels 3 and 4 respectively of RD capability. Interviews show that foreign assemblers either acquired shares in national firms or attracted their suppliers from abroad to drive a minimum technological capability of knowledge intensity level of four.3 It is interesting that tiers 1 and 2 firms in the sample with over 10% foreign equity enjoyed at least the technological capability of adapting processes, layouts and products. Fewer firms were engaged in knowledge intensity levels of 5 and 6. In level 5 HR practices and PT, the breakdown by national and joint-venture firms was 38% (18) against 58% (21) respectively. The breakdown for level 5 RD practices was 15%(7) and 33%(12) respectively. In level 6 HR practices and PT, the breakdown by national and joint-venture firms was 23%(11) against 42% (15) respectively. The breakdown for level 6 RD practices was 10%(5) and 25%(9) respectively. Given that level 6 knowledge intensity refers to the most technologically capable firms in the world, the tier 1 and 2 supplier base in India can be considered to be sophisticated. Also, the results also show that joint-venture firms have an edge over national suppliers in their technological depth. The tough conditions for establishing operations since the 1980s may explain this.
Table 9. Technological depth of automotive firms, India, 2005
KI HR PT RD FO=0 FO=1 FO=0 FO=1 FO=0 FO=1 1 48(100) 36(100) 48(100) 48(100) 48(100) 36(100) 2 48(100) 36(100) 48(100) 48(100) 48(100) 36(100) 3 47(98) 36(100) 47(94) 36(100) 45(90) 36(100) 4 37(77) 36(100) 37(84) 36(100) 41(82) 34(100) 5 18(38) 21(58) 18(38) 21(58) 7(15) 12(33) 6 11(23) 15(42) 11(23) 15(42) 5(10) 9(25)
3 Interview conducted by the author on April 21 2007 in Delhi.
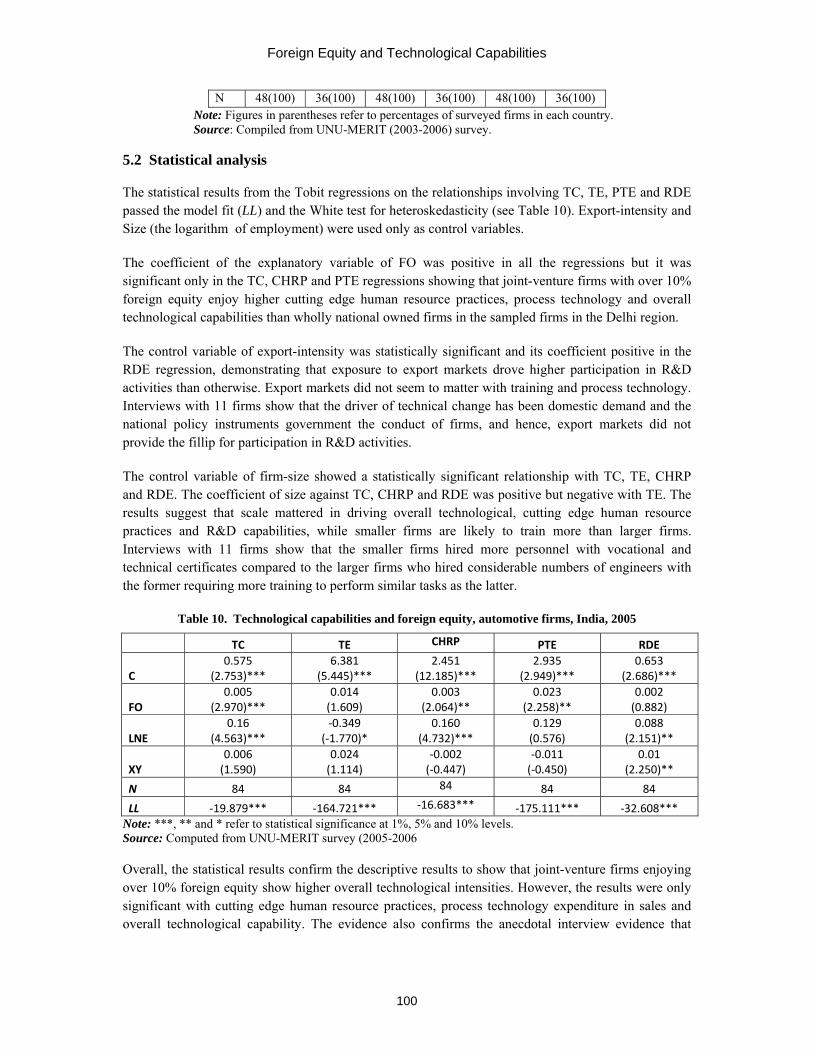
Foreign Equity and Technological Capabilities
100
N 48(100) 36(100) 48(100) 36(100) 48(100) 36(100) Note: Figures in parentheses refer to percentages of surveyed firms in each country. Source: Compiled from UNU-MERIT (2003-2006) survey.
5.2 Statistical analysis The statistical results from the Tobit regressions on the relationships involving TC, TE, PTE and RDE passed the model fit (LL) and the White test for heteroskedasticity (see Table 10). Export-intensity and Size (the logarithm of employment) were used only as control variables. The coefficient of the explanatory variable of FO was positive in all the regressions but it was significant only in the TC, CHRP and PTE regressions showing that joint-venture firms with over 10% foreign equity enjoy higher cutting edge human resource practices, process technology and overall technological capabilities than wholly national owned firms in the sampled firms in the Delhi region. The control variable of export-intensity was statistically significant and its coefficient positive in the RDE regression, demonstrating that exposure to export markets drove higher participation in R&D activities than otherwise. Export markets did not seem to matter with training and process technology. Interviews with 11 firms show that the driver of technical change has been domestic demand and the national policy instruments government the conduct of firms, and hence, export markets did not provide the fillip for participation in R&D activities. The control variable of firm-size showed a statistically significant relationship with TC, TE, CHRP and RDE. The coefficient of size against TC, CHRP and RDE was positive but negative with TE. The results suggest that scale mattered in driving overall technological, cutting edge human resource practices and R&D capabilities, while smaller firms are likely to train more than larger firms. Interviews with 11 firms show that the smaller firms hired more personnel with vocational and technical certificates compared to the larger firms who hired considerable numbers of engineers with the former requiring more training to perform similar tasks as the latter.
Table 10. Technological capabilities and foreign equity, automotive firms, India, 2005
TC TE CHRP PTE RDE
C 0.575
(2.753)*** 6.381
(5.445)*** 2.451
(12.185)*** 2.935
(2.949)*** 0.653
(2.686)***
FO 0.005
(2.970)*** 0.014(1.609)
0.003(2.064)**
0.023(2.258)**
0.002(0.882)
LNE 0.16
(4.563)*** ‐0.349
(‐1.770)* 0.160
(4.732)*** 0.129(0.576)
0.088(2.151)**
XY 0.006 (1.590)
0.024(1.114)
‐0.002(‐0.447)
‐0.011(‐0.450)
0.01(2.250)**
N 84 84 84 84 84
LL ‐19.879*** ‐164.721*** ‐16.683*** ‐175.111*** ‐32.608*** Note: ***, ** and * refer to statistical significance at 1%, 5% and 10% levels. Source: Computed from UNU-MERIT survey (2005-2006 Overall, the statistical results confirm the descriptive results to show that joint-venture firms enjoying over 10% foreign equity show higher overall technological intensities. However, the results were only significant with cutting edge human resource practices, process technology expenditure in sales and overall technological capability. The evidence also confirms the anecdotal interview evidence that

Rajah Rasiah
101
foreign automobile assemblers have taken equity in strategic first and second tier national firms or attracted their first-tier suppliers with the aim of enjoying cutting edge innovative support. 6. Conclusions and implications The evidence shows that the first and second tier automotive suppliers in the greater Delhi region enjoyed significant levels of technological capabilities in 2005. The strong supply of human capital and competition among the automobile assemblers serving primarily the domestic market seem to have driven up technological capabilities of component and parts suppliers. Joint-ventures with over 10% foreign equity generally enjoyed higher technological capabilities than national suppliers. Joint-venture firms with over 10% foreign equity have either taken equity in national firms or attracted their global suppliers to ensure that their get state of the art components and parts. Despite the tardy and lengthy implementation of the first three phases, it appears that domestic capabilities did evolve behind high protection to drive technological upgrading in the suppliers of components and parts since the 1980s but particularly after 1991. The large domestic market, stringent technological conditions and adequate supply of human capital ensured that foreign firms participated in R&D activities. Joint-ventures with over 10% foreign equity enjoyed a statistically significant higher mean than national firms in cutting edge human resource practices, process technology expenditure in sales and overall technological capabilities once controlled for export-intensity and firm size. Foreign equity seems to matter in these three capabilities largely because of the access foreign firms enjoy from their parent plants and networking in global markets. The positive results of joint ventures with foreign equity in showing high levels of technological capabilities supports the motives theory of Dunning and Narula (2000), Narula and Dunning (2010) and Cantwell and Mudambi (2005) on multinationals decisions to offshore high technology activities. The results also show that national suppliers have responded positively to enjoy strong technological capabilities, through both spillover from the foreign and national assemblers, and through in-house development efforts. The abundant supply of quality technical and engineering graduates has helped overcome the poor basic infrastructure facing firms in India. Despite still being strongly inward-oriented, the rapid expansion in exports and growing surplus in trade balance suggests that the agglomeration of joint-venture firms with foreign equity and national firms will help sustain technological catch up in the automotive industry in India. References Abramowitz, M. 1956. Resource and Output Trends in the United States since 1870. American Economic Review,
46: 5-23. Bernat G. (2008) “The Automotive Cluster in Greater Buenos Aires”, background paper prepared for the World
Industrial Report, United Nations Industrial Development Organization, Vienna. Breschi, S., Malerba, F. & Orsenigo, L. 2000. Technological regimes and schumpeterian patterns of innovation. Economic Journal, 110(463): 388–410. Cantwell J. 1995. The Globalisation of Technology: What Remains of the Product Cycle Model? Cambridge
Journal of Economics, 19(1): 155-74.

Foreign Equity and Technological Capabilities
102
Cantwell, J. & Mudambi, R. 2005. MNE competence-creating subsidiary mandates. Strategic Management Journal, 26(12): 1109–1129
D’Costa, A. (1995) “The Restructuring of the Indian Automobile Industry: Indian State and Japanese capital”, World Development, 23(3): 485-502.
Dosi, G. 1982. Technological Paradigms and Technological Trajectories. Research Policy, 11(3): 147-162. Dunning, J. 1974. Economic Analysis and the Multinational Enterprise. London: Allen & Unwin. Dunning J. 1981. International Production and the Multinational Enterprise. London: Allen & Unwin. Dunning, J. 1994. Re-evaluating the benefits of foreign direct investment. Research Policy, 23: 9-22 Dunning, J. And Narula, R. 2000. “Industrial Development, Globalization and Multinational Enterprises: New
Realities for Developing Countries”, Oxford Development Studies, 28(2): 141-167. Ernst, D. 2006. Innovation offshoring: Asia’s emerging role in global innovation networks, East-West Center
Special Report 10, East-West Center, Hawaii. Ernst, D., Ganiatsos, T., & Mytelka, L. (eds) 1998. Technological Capabilities and Export Success: Lessons
from East Asia. London: Routledge. Freeman, C. 1989. New Technology and Catching-Up. European Journal of Development Research, 1(1): 85-99. Friedmann, J. 1972. A General Theory of Polarized Development. In N.M. Hansen (Ed.), Growth Centres in
Regional Economic Development. New York: Free Press. Helleiner, G.K. (1973) “Manufactured Exports from Less-Developed Countries and Multinational Firms”,
Economic Journal, 83(329): 21-47. Hirschman A. 1958. The Strategy of Economic Development. New Haven: Yale University Press. Hirschman A. 1970. Exit, Voice and Loyalty: Responses to Decline in Firms, Organizations and State.
Cambridge: Harvard University Press. Hobday, M. 1995. Innovation in East Asia. Cheltenham: Edward Elgar. Kathuria, S. (1996) Competing through Technology and Manufacturing: A Study of Indian Commercial Vehicles
Industry, Delhi: Oxford University Press. Katz J. 2006. Structural Change and Domestic Technological Capabilities. Cepal Review, 89: 55-68 Lall, S. 1992. Technological Capabilities and Industrialisation. World Development, 20(2): 165-86. Lall, S. 2001.Competitiveness, Technology and Skills. Cheltenham: Edward Elgar. Lundvall, B.A. 1988. Innovation as an Interactive Process: From User-producer interaction to the National
System of Innovation. In G. Dosi, C. Freeman, G. Silverberg & L. Soete (eds), Technical Change and Economic Geography. London: Frances Pinter.
Lundvall, B.A. 1992. National Systems of Innovation: Towards a Theory of Innovation and Interactive Learning. London: Frances Pinter.
Marshall A. 1890. The Principles of Economics. London: Macmillan. Myrdal, G. 1957. Economic Theory and Under-Developed Regions. New York: Methuen. Narayana, K. (1998) “Technology acquisition, de-regulation and competitiveness: a study of the Indian
Automobile Industry”, Research Policy, 27(): 215-228. Narula, R. And Dunning, J. 2010. “Multinational Enterprises, Development and Globalization: Some
Clarifications and a Research Agenda”, Oxford Development Studies, 38(3): 262-287. Nelson, R.R. & Winter, S.G. 1982. An Evolutionary Theory of Economic Change. Cambridge: Harvard
University Press. Nelson, R. 2008. "What enables rapid economic progress: What are the needed institutions," Research Policy,
37(1): 1-11. Pavitt, K. 1984. Sectoral Patterns of Technical Change: Towards a Taxonomy and a Theory. Research Policy,
13(6): 343-73. Porter, M.E. (1996) “What is Strategy?”, Harvard Business Review, 74(6): 61-78. Pradhan, J.P. and Singh, N. (2009) “Outward FDI and Knowledge Flows: A Study of the Indian Automotive
Sector”, International Journal of Institutions and Economies, 1(1): 156-187. Pratten, C. 1971. Economies of Scale in Manufacturing Industry. Cambridge: Cambridge University Press. Rasiah, R. 1994. Flexible Production Systems and Local Machine Tool Subcontracting: Electronics
Transnationals in Malaysia, Cambridge Journal of Economics, 18(3): 279-298. Rasiah, R. (1995) Foreign Capital and Industrialization in Malaysia, Basingstoke: Macmillan.

Rajah Rasiah
103
Rasiah, R. 2002. Systemic Coordination and the Knowledge Economy: Human Capital Development in MNC-driven Electronics Clusters in Malaysia. Transnational Corporations, 11(3): 89-130.
Rasiah, R. 2006. Technological capabilities and economic performance: a study of foreign and local manufacturing firms in South Africa. International Journal of Technology Management, 36(1–3): 166–189. Rasiah, R. 2007. The systemic quad: technological capabilities of computer and component firms in Penang and
Johor, Malaysia. International Journal of Technological Learning, Innovation and Development, 1(2): 179-203.
Singh, N. (2007) “Automotive Industry”, Kumar, N. And Joseph, K.J. (eds), International Competitiveness and Knowledge-based Industries in India, Delhi: Oxford University Press.
Smith, A. 1776. The Wealth of the Nations, (London, Strahan and Cadell). Tiwari, R., Ranawat, M. and Herstatt, C. (2010) “Benevolent Benefactor on Insentive Regulatory?: Tracing the
Role of Government Policies in the Development of India’s Automobile Industry, working paper, forthcoming, East-West Center, Honolulu.
UNICEF (2008) Basic Indicators, downloaded from http://www.unicef.org/infobycountry on April 25, 2011. UNU-MERIT. (2003-2004). Survey data on Malaysian industrial firms. Sponsored by the Maastricht Educational
and Social Research Institute of Technology (MERIT), United Nations University, Maastricht. Wilkinson, F. and You, J.I. 1992. Competition and cooperation: towards an understanding of the industrial district. Working Paper No. 88, Small Business Research Center. Cambridge University. WTO. 2007. International Trade Statistics. Geneva: World Trade Organization. Young, A. 1928. Increasing Returns and Economic Progress. Economic Journal, 38(152): 527-542. About the Author
Rajah Rasiah is the holder of the Khazanah Nasional Chair of Regulatory Studies and is also Professor of Technology and Innovation Policy at University of Malaya. He is also a Professorial Fellow at the Maastricht Economic and social Research and training centre on Innovation and Technology (MERIT), United Nations University. He obtained his doctorate in Economics from Cambridge University in 1992 and his research specialization includes science and technology policy, firm-level learning and innovation, healthcare services, foreign investment, cluster mapping and designing technology roadmaps. Among his recent books include
The New Political Economy of Southeast Asia, 2010, Cheltenham: Edward Elgar (Edited with Johannes Dragbaek Schmidt) and Innovation and Learning in Industrializing East Asia, London: Routledge, 2011 (Edited with Thiruchelvam Kanagasundram and Keun Lee), and Malaysian Economy: Unfolding Growth and Social Change, Kuala Lumpur: Oxford University Press, 2011 (edited). He has also undertaken consultancies for UNCTAD, World Bank, UNIDO, UNDP, Harvard Institute of International Development, ILO, Asian Development Bank, UNESCAP, Japan External Trade Relations Organization, Friedrich Ebert Stiftung and Stanford Research International (SRI). Contact Information Dr Rajah Rasiah, Faculty of Economics and Administration, University of Malaya, 50603, Kuala Lumpur, Malaysia, Tel:+60379673606, Fax:+60379673719, Email: [email protected].

Transnational Corporations Review Volume 3, Number 2 June 2011
www.tnc-online.net, [email protected], DOI:10.5148/tncr.2011.1118 104-116
104
Change of Subsidiary Mandates in Emerging Markets: The Case of Danish MNCs in India
Michael W. Hansen1, Bent Petersen and Peter Wad
Abstract: In recent years, the activities of Danish MNCs in India have expanded dramatically. Previously dormant subsidiaries have been transformed into integral components in the global strategies of Danish MNCs, either as crucial cash cows catering to the rapidly growing Indian markets, or as platforms for sourcing of increasingly advanced value chain activities. This paper aims to provide an understanding of the relationship between changes in the Indian business environment and mandate trajectories of Danish subsidiaries in India. A review of the literature on subsidiary mandates reveals that it largely fails to conceptualize how the specificities of emerging market business environments affect subsidiary mandate evolution. The paper develops a theoretical model for business environment change influence on subsidiary mandates, and demonstrates how the model can capture much of recent years dramatic mandate change of Danish subsidiaries in India.
Keywords: Subsidiary mandate, Danish MNCs, emerging markets, institutional context, India
1. Introduction
Growing shares of value adding activities take place in emerging markets and increasingly, the survival and growth of MNCs are contingent on their success in these markets (Cavusgil et al, 2002; Khanna and Palepu, 2010). Consequently, we see how subsidiaries in emerging markets have gained new significance and importance in the overall strategies of their parent companies. In some instances, they have become important portfolio investments for their owners, earning revenues that far exceed prior expectations. In other instances, they have become core units for sourcing of key components and services for the global operations of the company. Also the opposite occurs: grand schemes for subsidiary development are jeopardized by disappointing market and institutional developments or overly optimistic expectations to the skills and capabilities of the local resource base.
In spite of the fact that MNCs commit ever growing resources and strategic importance to emerging markets, the literature on subsidiary mandates (for reviews, see e.g. Tavares and Young, 2006; Paterson and Brock, 2002; Birkinshaw and Hood, 1998) says little about how emerging market specificities influence subsidiary mandate evolution. Instead, the literature focuses mainly on internal firm drivers of mandate change, e.g. changes in HQ strategies or changes in subsidiary capabilities, or combinations of those. To the extent that the local business environment is included in the analysis, it is treated as a background factor rather than as a dynamic factor.
1 Corresponding author: Associate Professor, Copenhagen Business School. Address: Porcelænshaven 18b, 2000 Frb.C. email [email protected]. Tel: 4538153146.

Change of Subsidiary Mandates in Emerging Markets: The Case of Danish MNCs in India
105
In this paper, we apply an emerging market perspective on subsidiary mandate evolution. We submit that subsidiary mandate trajectories in emerging markets may be radically different from those of ‘normal’ markets due to the volatility and rapid changes of the business environment. Thus, the bargaining between subsidiaries and parents about strategy, mandate and resource allocation may change fundamentally as markets grow, as institutions change, and as factor conditions improve, leading to stronger and/or different subsidiary mandates.
There is no better place to begin an analysis of the influence of emerging market contexts on subsidiary mandate than in India. Besides astonishing growth rates of 8 – 9 per cent in recent years, this country is rapidly developing its human and technological skills base, making it a potential centre, not only for component and service production, but also for innovation and product development activities. Since the early 1990s, the Indian economy has changed from an inward oriented and protected economy dominated by large conglomerates and with a huge SME sector protected by widespread reservations, to a less protected and more open economy, with growing trade and investment relations with the outside world. Simultaneously, India has liberalized and removed many of the bureaucratic procedures – occasionally called the “License Rai” – that used to strangle business activity in India. In the following we will explore, how such changes in the Indian business environment have affected the mandates of Danish subsidiaries in India.
2. The literature on subsidiary mandates
In the past few decades, the literature on mandates of MNC subsidiaries has evolved as a distinct field of IB research (Paterson and Brock, 2002). We identify three main streams of research within this field: the HQ oriented literature, the subsidiary autonomy literature, and the subsidiary mandate change literature: The early literature focused on the HQ-subsidiary dyad as a relationship between a dominant HQ and a dependent subsidiary. By the 1980s, this hierarchical view was challenged by research that identified a greater plurality of subsidiary roles. This subsidiary autonomy literature was inspired by the IB literature’s growing recognition of MNCs as heterarchical organizations (Hedlund, 1986). The subsidiary autonomy literature emphasized that subsidiaries can develop and leverage distinct capabilities and thereby independently alter their role and mandates within the MNC organization (Tavares and Young, 2006). More recently, the subsidiary mandate change literature examined what happens to mandates subsequently to entry. This literature emphasized a host of factors affecting subsidiary change, e.g. factors related to the entrepreneurial drive of local managers, factors related to the parents’ strategies and capabilities, and factors related to the local business environment (see e.g. Cantwell and Mudambi, 2005; Paterson and Brock, 2002).
Concerning the role of the local business environment, Birkinshaw and Hood (1998b) define business environment determinants as local constraints and opportunities that influence subsidiary roles. Numerous studies examine how the host country environment shapes mandates of subsidiaries (see e.g. Bevan et al, 2004; Luo, 2003), however the influence of change in the local business environment is not widely studied (Birkinshaw and Hood, 1998b). This lack of attention to dynamics of the business environment may have to do with the fact that much of the research deals with subsidiaries in western markets, where institutional and market change tends to be modest and mostly similar to that of the MNC’s home country. But we will argue that when the analysis of subsidiary evolution is moved into emerging markets, it no longer makes sense to ignore the role of context change as the context here changes very rapidly with
Michael W. Hansen , Bent Petersen and Peter Wad
106
potentially profound implications for subsidiary mandates. Luo (2003) identifies three change aspects of emerging market business environments that may affect parent-subsidiary relations, namely rapid market growth, rapid changes in institutional conditions, and rapid structural change in local industry:
Concerning market development, emerging markets are characterized by high growth (GDP growth in excess of 5 per cent), un-segmented markets, and low consumer brand loyalty (Arnold and Quelch, 1998; Dawar et al, 2001). From a MNC perspective, these characteristics offer opportunities as well as challenges. Strong market performance due to local market growth implies more attention from the parent company and more leverage for the subsidiary. The relative volatility of demand structures and the lack of segmentation of markets require that subsidiaries are assigned a high level of autonomy in formulating and implementing marketing and sales strategies (Meyer and Estrin, 2001; Peng, 2000; Luo, 2003).
Concerning institutional change the institutional strategy literature (see e.g. Peng, 2002; Wright et al, 2005; Peng et al, 2008; Kostova et al, 2008; Khanna and Palepu, 2010) has recently emphasized the importance of institutional factors for firm strategy in emerging markets. Thus, institutions frequently change and often in unpredictable ways, with huge implications for firm strategy (Peng, 2003). Institutional uncertainty may cause MNCs to allow their local subsidiaries greater discretion to deal with uncertainty (Luo, 2003); it may deter HQ from investing in subsidiaries; and it may increase the coordination and transaction costs of dealing with the local subsidiaries and integrating them into the overall global MNC strategy (Luo, 2003). Conversely, improvements of institutions such as less government intervention, reduced policy uncertainty, and increased coverage and effectiveness of the legal environment may facilitate enhanced subsidiary mandates (Peng and Zhou, 2005).
Finally, structural shifts in local industry may alter the parent-subsidiary relation profoundly. As developing country industries move from simple factor based advantages (unskilled labour and natural resources) to more differentiated advantages (e.g. skilled labour and improved infrastructures), the mandates of subsidiaries may change. We may see an evolution in subsidiary mandate from low commitment to high commitment; from resource seeking - via market seeking - to efficiency and, eventually, asset seeking (Dunning and Narula, 2004); from competence exploitation to competence creation (Cantwell and Mudambi 2005); and from low linkage to deep linkage intensity with local industry (Scott-Kennel and Endevick, 2006).
Based on the above literature review, we propose a model for analyzing how emerging market business environment change may impact subsidiary mandate evolution. In line with the view that subsidiaries are not just passive receivers of mandates defined by HQ, we will argue that subsidiary mandates are shaped in a sequence of negotiation and deliberations involving both HQ and subsidiaries (Paterson and Brock, 2002). The balance of the bargaining relationship is, as argued by the mandate literature, shaped partly by factors related to HQ (internal competition for resources, level of centralization of decision making or ‘ethnocentrism’ of managers), partly by factors related to the subsidiary (local management ‘intra-preneurship’ and capabilities), and partly by factors related to the local context (institutions, markets, structural factors) (Cantwell and Mudambi, 2005; Paterson and Brock, 2002). The resulting model is illustrated in Figure 1 which will be used to structure the following analysis of Danish subsidiaries in India. In the conclusion, we will assess and adjust this model in light of the empirical study of Danish MNCs in India.

Change of Subsidiary Mandates in Emerging Markets: The Case of Danish MNCs in India
107
3. Methodology
The study of Danish MNCs in India was conducted in 2008. In total there were 95 Danish subsidiaries in India at the end of 2008. Of those, we interviewed 13 on location and an additional 26 subsidiaries responded to a questionnaire. Thus, in all 39 subsidiaries or 41 per cent of all took part in the study. The subsidiary development from the early entry into India to the situation in 2008 was examined retrospectively through the interviews and questionnaire. Moreover, seven of the subsidiaries studied in 2008 had previously been interviewed in a similar study of Danish subsidiaries in 2001 (see Hansen, 2006). This allowed for characterising mandates of these companies at two points in their evolution, thereby providing a reliability check on the restrospective mandate narratives of 2008.
4. Mandate evolution of Danish subsidiaries in India
In 2001, there were 60 Danish subsidiaries in India with on average 172 employees. Around 1/3 of the subsidiaries were joint ventures (Hansen, 2006). Returning to India in 2008, we found 95 Danish subsidiaries with on average 305 employees. Joint ventures were almost phased out.
In 2001, the investors were overwhelmingly market seekers following their big customers into India. These were firms that sold high quality niche products in BtB markets, typically to other MNCs. They catered mainly to top-end markets and had only to a limited extent invested in building a local supply base in India that would allow them reduce cost to compete in lower-end segments of the Indian market. The main industry was metals and machinery, mainly providers of equipment and machinery such as flow control systems, pumps, equipment for large-scale mineral processing, machinery for the car industry, etc. A related type of companies was involved in engineering, e.g. planning and projecting chemical and mineral processing plants or infrastructure projects. Very little sourcing of manufacturing and service
kkjkj
Subsidiary factors
Subsidiarymandate change
Dynamic business environment
HQ factors
HQ‐subsidiarybargaining
Local context factors and mandate change (version 1)
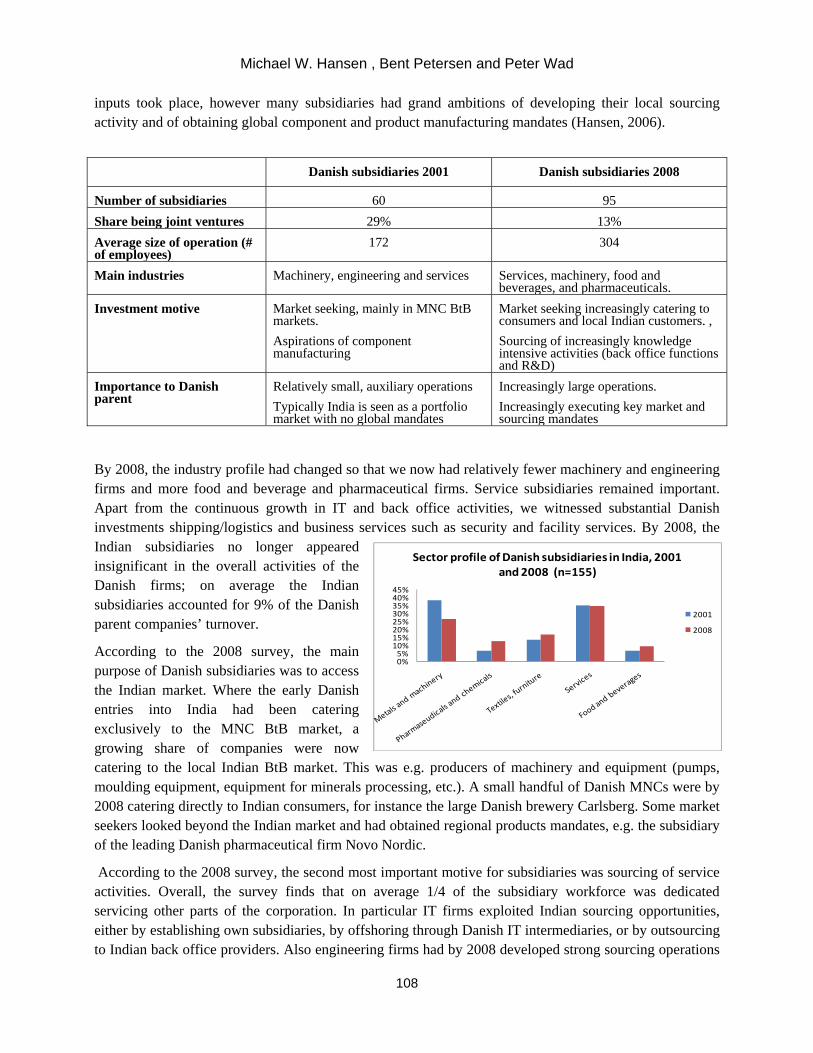
Michael W. Hansen , Bent Petersen and Peter Wad
108
inputs took place, however many subsidiaries had grand ambitions of developing their local sourcing activity and of obtaining global component and product manufacturing mandates (Hansen, 2006).
Danish subsidiaries 2001 Danish subsidiaries 2008
Number of subsidiaries 60 95 Share being joint ventures 29% 13% Average size of operation (# of employees)
172 304
Main industries Machinery, engineering and services Services, machinery, food and beverages, and pharmaceuticals.
Investment motive Market seeking, mainly in MNC BtB markets. Aspirations of component manufacturing
Market seeking increasingly catering to consumers and local Indian customers. , Sourcing of increasingly knowledge intensive activities (back office functions and R&D)
Importance to Danish parent
Relatively small, auxiliary operations Typically India is seen as a portfolio market with no global mandates
Increasingly large operations. Increasingly executing key market and sourcing mandates
By 2008, the industry profile had changed so that we now had relatively fewer machinery and engineering firms and more food and beverage and pharmaceutical firms. Service subsidiaries remained important. Apart from the continuous growth in IT and back office activities, we witnessed substantial Danish investments shipping/logistics and business services such as security and facility services. By 2008, the Indian subsidiaries no longer appeared insignificant in the overall activities of the Danish firms; on average the Indian subsidiaries accounted for 9% of the Danish parent companies’ turnover.
According to the 2008 survey, the main purpose of Danish subsidiaries was to access the Indian market. Where the early Danish entries into India had been catering exclusively to the MNC BtB market, a growing share of companies were now catering to the local Indian BtB market. This was e.g. producers of machinery and equipment (pumps, moulding equipment, equipment for minerals processing, etc.). A small handful of Danish MNCs were by 2008 catering directly to Indian consumers, for instance the large Danish brewery Carlsberg. Some market seekers looked beyond the Indian market and had obtained regional products mandates, e.g. the subsidiary of the leading Danish pharmaceutical firm Novo Nordic.
According to the 2008 survey, the second most important motive for subsidiaries was sourcing of service activities. Overall, the survey finds that on average 1/4 of the subsidiary workforce was dedicated servicing other parts of the corporation. In particular IT firms exploited Indian sourcing opportunities, either by establishing own subsidiaries, by offshoring through Danish IT intermediaries, or by outsourcing to Indian back office providers. Also engineering firms had by 2008 developed strong sourcing operations
0%5%10%15%20%25%30%35%40%45%
Sector profile of Danish subsidiaries in India, 2001 and 2008 (n=155)
2001
2008
Change of Subsidiary Mandates in Emerging Markets: The Case of Danish MNCs in India
109
in India, the best example being the minerals processing plant projecting company FLS that had built a 3000 employees engineering operation in Chennai. Interestingly, very few examples of subsidiaries engaged in manufacturing of components for export were identified.
Surprisingly, we find that conducting R&D services for the global operation is the third most important motive of Danish subsidiaries. This reflects that several Danish biochemical companies as well as machinery producers and engineering firms are in the process of developing global R&D activities in India. This sourcing seems mainly to exploit a well-educated pool of knowledge workers for handling rather standardised or simple functions of the R&D value chain. But there is also evidence that some companies are moving into higher-end R&D activities and are becoming integrated into the global R&D function.
Overall, the impression is that Danish subsidiaries in India have evolved from being small auxiliary operations with relatively low standing in the global strategy of their parents, to becoming large and significant operations seeking to benefit from the dramatic growth in market demand and improved supply conditions for especially services.
In terms of the future, subsidiaries were asked which India oriented and export oriented value chain activities they expect to expand in the coming years. We found that Danish subsidiaries expect to expand their focus on downstream activities in India, in particular after-sale-services and marketing. They also expect R&D activities aimed at the Indian market to be expanded, e.g. R&D activities that adapt or modify a product or a technology to fit Indian infrastructure, preferences and regulations. Concerning export oriented activities, we see that subsidiaries expect R&D and back office activities to expand in the coming years. Interestingly, Danish subsidiaries also expect export of after sales services from India to
0 1 2 3 4 5 6
Servicing the Indian market
Providing services for global operation of Danish parent
Conducting R&D and/or design for global operation of the Danish parent
Providing components for global operation of Danish parent
Servicing regional markets (Asia, Middle East, Africa)
Providing components for firms abroad other than the Danish parent
Average score (7 = very important, 1= not important)
Main purpose of subsidairy activity (n=26)
0 1 2 3 4 5 6 7
For export : Marketing
For export : Logistics
For export : Production of components
For export : Production of entire production lines
For export : After sale services
For Indian market : Production of components
For Indian market : Production of entire production lines
For Indian market : Back office services (IT, call center, …
For export : Back office services (IT, call center, etc.)
For Indian market : Logistics
For export : R&D
For Indian market : Marketing
For Indian market : R&D
For Indian market : After sale services
Average score (1= Strong decline, 4 = About the same, 7= Strong increase)
Activities expected to be expanded in next 2‐3 years (n=26)
Michael W. Hansen , Bent Petersen and Peter Wad
110
expand. This is again a reflection of the service strength of the Indian economy. Notably, the Danish subsidiaries have no strong expectations of expanding exports of components; it seems that the Danish subsidiaries see little future in India as a manufacturing platform.
5. How dynamics of the business environment may change mandates
The main factor behind mandate change in India appears to be Indian economic growth. The average annual GDP growth has been 5-8 percent during the 2000s, the Indian economy is now the 4th largest in PPP terms; private demand has surged; and while average income is still low, the rising Indian middle class form 300 million consumers with considerable and growing purchasing power. The strong Indian market performance has had profound implications for Danish subsidiaries and appears to have significantly strengthened their bargaining position vis-à-vis HQ. When you, as reported by a large food ingredient company, can produce a 35%-50% annual growth in the Indian market, you immediately catches the attention of top management when negotiating for resources and tasks. The strong market performance has also had implications for the evolution toward global sourcing mandates. Thus, it appears that several Danish subsidiaries within metals and machinery have been taken by surprise by the rapid market development in India and have become consumed by the task of meeting the local market demand, thus abandoning previous ambitions of component sourcing in India.
Also the improved capacity and quality of Indian supply industries appear to be a strong driver of enhanced mandates of Danish MNCs. Thus, we have seen the emergence of a highly competent Indian supply industry within component manufacturing in the metals and machinery and pharmaceutical industries. Within services, the fusion of IT services, software and back office functions has propelled India to become a world leader in off-shoring of BPO activities. As a result of the emergence of competent Indian supply industries within manufacturing and services, the case for sourcing has become much stronger. In IT, we find several subsidiaries employing externalised business (outsourcing) modes, e.g. non-equity linkages (contracts, long term collaboration). And being able to draw on the vast pool of qualified and skilled knowledge workers in India, Danish MNCs in advanced services have been able to scale up their global operations in a very rapid sequence. For instance, the Danish engineering companies in India have been able to expand globally based on their Indian subsidiaries, due to the combined facilities of high tech manpower resources and the digitisation of engineering (and knowledge) activities.
The story within manufacturing sourcing is somewhat different. We have indeed seen Danish market seeking subsidiaries within metals and machinery develop sizable Indian sourcing operations, e.g. the wind turbine producer Vestas or the cement plant producer FLS. In these companies, local sourcing takes place in order to keep down cost in an increasingly competitive market and reduce delivery time. However we have not seen these manufacturing subsidiaries embark on component production for the global operation of the company. In fact, the only global sourcing mandates assigned to Indian manufacturing subsidiaries has been related to providing services such as back office functions, engineering or R&D for the global operation of the company.
The improved attractiveness of the Indian supply base especially within services is however not without problems. India has been so successful in services that bottlenecks have started emerging. Thus, Danish firms experience growing challenges in terms of high attrition rates (25-30% not uncommon); rapid increasing remuneration; poaching of employees by Indian and foreign firms; and rising expectations by Indian employees for more than just routine type of assignments. Consequently, retaining Indian
Change of Subsidiary Mandates in Emerging Markets: The Case of Danish MNCs in India
111
knowledge workers has been an extremely important task at central and local levels. Danish subsidiaries in India have been forced to strengthen their HR functions to upgrade skills, improve routines and procedures and team work, and socialise foreign employees into the corporate culture of the Danish MNCs.
While the particularities of the Indian institutional context previously may have benefitted Indian firms at the expense of foreign firms (Khanna and Palebu, 2004), the balance has recently shifted in favour of the MNCs. First, the formal entry barriers have been dramatically reduced. Many of the reservations of industries and sectors have been removed. Automatic approval of FDI has been introduced in most sectors. Special Economic Zones offering duty and tax exemptions have been established around the country. One particularly important institutional change, seen from a Danish perspective, has been the removal of requirements of local ownership in most industries and sectors. This reform has essentially freed Danish
investors from the joint venture straight jacket that previously caused many Danish business failures in India (Hansen, 2006). A second legal issue often argued to affect mandate evolution is IPR protection. For instance, lack of IPR protection may seriously inhibit evolution toward competence creating mandates. However, the survey produce little evidence that lack of IPR protection is a major factor hampering subsidiary evolution in Danish subsidiaries. That Danish subsidiaries are less concerned with IPR issues in India is also supported by the observation that expansion of R&D activities was one of the main expected future activities of Danish subsidiaries. This finding could be related to the fact that India, contrary to e.g. China, historically has had a relatively effective formal IPR protection. A third institutional factor that has affected the mandate evolution in India is the continuous reduction in tariffs which since the early 2000s have come down from an overall level of 30% - well above the rest of Asia – to a level of around 15% - equivalent of the rest of Asia. This has implied that the competitiveness of Indian subsidiaries has improved. Moreover, greater competition in the Indian market due to falling tariffs has exerted growing pressure on the subsidiaries to reduce costs through local sourcing.
0 1 2 3 4 5 6 7
Indian market growth
Production costs in India
Access to qualified labour in India
Quality performance of Indian industry
Capabilities of Indian suppliers
Ability to ship products in and out of India
Competitiveness of Indian industry vis‐à‐vis China
Danish HQ’s perception of India as a market and/or global …
Protection of intellectual property rights
Indian tariffs and taxes
Local infrastructure (roads, railways, power supplies) in India
Indian legislation and regulation
Average score: 0=Highly disfavoring 7=highly favoring
Local context factors favoring or hampering evolution of subsidiary mandates (n=26)

Michael W. Hansen , Bent Petersen and Peter Wad
112
In spite of the reforms, institutional factors remain a serious impediment to expansion of subsidiary mandates according to the Danish respondents. While the regulation specifically discriminating against MNCs has been largely rolled back, India is only ranking 120th in the World Bank’s Doing Business index, well behind China which ranks 83rd. According to a Danish manager, India is still in the ‘dark ages’ in terms of regulation as Indian regulations remains highly out of sync with the rest of the world and when regulations are changed, it is often in arbitrary and unpredictable ways. The Danish subsidiaries also report that the physical infrastructure remains a major obstacle and impediment to efficiently explore comparative and competitive local advantages of India.
Summing up, we find clear evidence that Indian market growth, institutional change and improvements in the Indian industry structure have had strong impacts on the evolution of subsidiary mandates of Danish MNCs. Through our interviews with Danish managers in India, we also identified a number of factors that moderate the relationship between change in context and mandate change: One such factor is Danish manager’s perceptions of India. Many Danish MNCs have negative experiences with the Indian market from the 1990s, where the initial optimism after liberalization was seriously damped by unfulfilled growth promises, regulatory unpredictability, and conflicts with joint venture partners. These negative experiences have created perceptions of India among Danish parent companies that it has proven very
Indian context drivers of mandate change in Danish subsidiaries in India Local context changes Change in subsidiary mandate Type of firm
Market growth
• High growth rates
• Relatively unsegmented markets
• Moves market seekers from inferior to key portfolios
• Improves the bargaining position of subsidiary
• Improves economic viability of sourcing mandates
• But also diverts attention away from mandate evolution toward sourcing
• Machinery producers in btb markets
• Service providers e.g. shipping, security and cleaning
• Food and beverages
Structural change in industry
• Improved supplier industry,
especially in services • Growing competition from
Indian firms
• Market seekers moving from assembly of imports to assembly of locally sourced products
• Wind turbines, pumps, • Agricultural
equipment
• From sourcing for local market to sourcing for global operation, mainly of services
• Machinery • Engineering
• From procurement to sourcing for global operation
• Textiles and electronics
• From simple market or resource seeker to strategic asset seeker.
• Pharmaceuticals, • IT/ software
Institutional changes
• Removal of regulations and
restrictions directly affecting MNCs
• But high levels of regulatory and institutional uncertainty
• As joint ventures no longer are required, the strategic space for subsidiaries is widened
• Most companies
• As institutional and infrastructural factors are particularly invasive in manufacturing industries, services is the preferred sourcing mandate
• Engineering • Machinery

Change of Subsidiary Mandates in Emerging Markets: The Case of Danish MNCs in India
113
difficult to change. Thus, several of the Indian managers of Danish subsidiaries appeared rather frustrated that the Danish parents did not pick up the opportunities of the Indian market. In this regard, it appears that the ability to change Danish parents’ perceptions of Indian market opportunities to a large extent depends on firm internal network of the subsidiary manager. Supportive of this assertion, we found that those subsidiaries with the strongest integration in the global operation of their parents also had Danish managers.
A second moderating variable identified through our study is that even if India is becoming more important to the Danish parent companies, this does not necessarily translate into enhanced subsidiary mandates. Thus, it is fruitful to distinguish between subsidiary mandate and country mandate. The MNC may have plans for exploiting opportunities of the host country that not necessarily involves the subsidiary in question, but may be exploited through development of other subsidiaries and contract manufacturers in the country. The most striking example of this is found in the sourcing
of R&D activities to India, where in several cases the new R&D activity was separated from the existing Indian operation in a separate R&D subsidiary.
6. Conclusion
Our study aimed to understand, how rapid and profound changes in an emerging market environment affect subsidiary mandate evolution. The study was explorative in the sense that we tried to develop a model that can be employed to analyze the relation between environment change and mandate evolution in an emerging market context, based on a review of the extant literature and empirical evidence from Danish subsidiaries in India.
We found that the mandates of Danish subsidiaries had undergone significant changes during the observed time span 2001-2008. The Danish MNCs seemed to be in a process of scaling up their activities in India and by 2008, their subsidiaries often accounted for sizable shares of their parents’ turnover and workforce. Although Danish MNCs predominantly were market seekers and client followers, they had rapidly expanded the scope and scale of their activities as the Indian market took off in the early 2000s; This to an extent that Indian market growth claimed all available subsidiary resources and stalled or postponed efficiency-oriented mandate evolution. Nevertheless, many subsidiaries had significantly upgraded their sourcing capabilities, however almost exclusively within services. Cheap and high quality Indian technicians and engineers had evidently become a major asset for Danish subsidiaries.
The main objective of the paper was to trace subsidiary evolution back to recent years’ dramatic changes of the Indian business environment. We argued that the high Indian growth rates, the emergence of large consumer markets, and the drastic improvements in the capabilities and competitiveness of the Indian industry, provided the background on which the Danish subsidiaries developed their mandates. But we also found that especially Indian institutions and infrastructure often inhibited mandate expansion in India, especially within manufacturing industries. A main reason why the ambitions of component sourcing in India have not been realized is thus lack of infrastructure development and uncertainty regarding legislation. In other words, where market growth and structural change in Indian industry appears to have greatly facilitated the expansion of mandates of Danish subsidiaries, institutional and infrastructural factors have drawn in the opposite direction and remain a serious challenge to the further development of Danish subsidiaries in India. The exception is services, which appear less prone to institutional and

Michael W. Hansen , Bent Petersen and Peter Wad
114
infrastructural deficiencies and consequently such activities have seen significant expansion, not only among subsidiaries in service industries, but also among subsidiaries in manufacturing industries.
Our empirical studies revealed variables moderating the relationship between environmental change and subsidiary mandate. First, it appeared that Danish perceptions of the Indian label created a time-lag in subsidiary development. Second, we found that the opportunities of the host country context not necessarily is exploited through expansion of the subsidiary, but may lead to establishment of new subsidiaries with specific global mandates.
Hence we conclude with an elaborated model for context driven mandate change in emerging markets that essentially suggests that mandate change is a function of environment mediated change in the bargaining relationship between parents and subsidiaries. Changes in the environment are measured on three dimensions, namely rapid growth, structural change in industry and institutional change. Moreover, the model suggests that environmental change not necessarily leads to subsidiary change, but that new opportunities may be exploited through setting up new business enterprises rather than expanding existing subsidiaries.
kkjkj
Subsidiary factors(performance, capability, scale)
Subsidiarymandate change
Country mandate change
Dynamic business environment of emerging market
HQ factors• Corporate strategy• Perceived capability of subsidiary• Managerial attention• Cognitive limitations• Cultural bias• Idiosyncracies
Inform
ation
Perceptions
Structuralchanges
HQ‐Subsidiarybargaining
HQ‐Hostcountry
bargaining
Local context factors and mandate change (version 2)

Change of Subsidiary Mandates in Emerging Markets: The Case of Danish MNCs in India
115
References Arnold, D. and J. Quelch 1998, “New Strategies in Emerging Markets”, Sloan Management Review, Fall, pp. 7-20. Bevan, A., Estrin, S. and Meyer, K. (2004) Foreign investment location and institutional development in transition
economies, International Business Review, Vol. 13, pp. 43-64. Birkinshaw, J. (1998), “Corporate entrepreneurship in network organizations: how subsidiary initiative drives
internal market efficiency”, European Management Journal, Vol. 16 No. , pp. 355-364. Birkinshaw, J. and Hood, N. (1998), Multinational corporate evolution and subsidiary development, New York:
Macmillan Press. Birkinshaw, J. and Hood, N. (1998b) “Multinational Subsidiary Evolution: Capability and Charter Change in
Foreign-Owned Subsidiary Companies”, Academy of Management Review, Vol. 23, No. 4, pp. 773-795. Cavusgil, S., P.Ghaury, and M. Agarwal (2002), Doing Business in Emerging Markets, London: Sage. Cantwell, J. and Mudambi, R. (2005) “MNE Competence-Creating Subsidiary Mandates”, Strategic Management
Journal, Vol. 26 No. 12, pp. 1109-1128. Dawar, Niraj and Amitava Chattopadhay (2003), Rethinking Marketing Programs for Emerging Markets, Long
Range Planning 35 (457-474). Dunning, J. and Narula, R. (2004), “Industrial Development, Globalization and Multinational Enterprises: New
Realities for Developing Countries,” in J. H. Dunning and R. Narula (eds), Multinational and Industrial Competitiveness. Cheltenham, UK: Edward Elgar, 38–77.
Hedlund, G. (1986), “The hypermodern MNC – a heterachy”, Human Resource Management, Vol. 25 No. 1, pp.9-35. Khanna, T. & Palepu, K.G (2010). Winning in Emerging Markets – A Road Map for Strategy and Execution. Boston,
MA: Harvard Business School Press. Khanna, T. and Palepu, K.G., (2004) Globalization and Convergence in Corporate Governance: Evidence from
Infosys and the Indian Software Industry, Journal of International Business Studies, Vol. 35 No. 5, pp. 484-507). Kostova, T., Roth, K. and Dacin, T. (2008), Theorizing on MNCs: A promise for institutional theory. Academy of
Management Review. Luo, Y. (2003), Market-seeking MNEs in an emerging market: How parent-subsidiary links shape overseas success,
Journal of International Business Studies 34, 290-309. Paterson, S. L. and Brock, D. M. (2002), “The development of subsidiary-management research: review and
theoretical analysis”, International Business Review, Vol. 11 No. 2, pp. 139-163. Peng, M.W. (2000), Business Strategies in Transition Economies, Sage: Thousand Oaks, CA. Peng, M. (2002) “Towards an Institution-Based View of Business Strategy”, Asia Pacific Journal of Management,
Vol.19 No.2/3, pp. 251–267. Peng, M. (2003), Institutional Transitions and Strategic Choices, The Academy of Management Review, Vol. 28, No.
2, pp. 275-296. Peng, M. W. & Zhou, J. Q. (2005) How Network Strategies and Institutional Transitions Evolve in Asia, Asia Pacific
Journal of Management, Vol. 22, pp. 321-336. Peng, M. W. et.al. (2008) “An institution-based view of international business strategy: a focus on emerging
economies”, Journal of International Business Studies, pp. 1-17. Scott-Kennel, J. and P. Enderwick (2005), “FDI and interfirm linkages: exploring the black box of the IDP” in
Transnational Corporations, Vol 14, no 1, 2005 pp. 105-130 Tavares, A. T. and Young, S. (2006) “Sourcing Patterns of Foreign-owned Multinational Subsidiaries in Europe”,
Regional Studies, Vol. 40 No. 6, pp. 583-599. Wright, M. et.al. (2005), “Guest Editors’ Introduction. Strategy Research in Emerging Economies: Challenging the
Conventional Wisdom”, Journal of Management Studies, Vol. 42 No. 1, pp. 1-33.

Michael W. Hansen , Bent Petersen and Peter Wad
116
About the Authors
Michael Wendelboe Hansen is Associate Professor in International Business at the Center for Business and Development Studies, Copenhagen Business School. He is represented in various boards working with business and development related issues and has been a consultant for private sector development organizations. His main research interest is related to MNC strategy and organization in developing countries, in particular India, and he has done extensive research on the linkage strategies of MNCs in developing countries.
Peter Wad is Associate Professor at the Centre for Business and Development Studies at Copenhagen Business School. His research has focused on globalization, competitiveness and local firms in developing countries and been published in numerous international journals. He has recently been a consultant to the International Labour Office (ILO) and the United Nations Industrial Development Organization (UNIDO) regarding the global financial crisis and its impact on automobile industries in developing countries.
Bent Petersen is professor of international business at CBS. He has published widely in leading journals about internationalization of emerging economy firms, global value chains, and dynamics of global sourcing. Bent Petersen has been visiting scholar in France (HEC), Australia (University of Queensland) and Sweden (University of Gothenburg) and has done field research in other countries (e.g. South Korea, India, Vietnam, and China) as well.
Contact Information Corresponding author: Michael W. Hansen, Associate Professor, Copenhagen Business School. Address: Porcelænshaven 18b, 2000 Frb.C. Tel: 4538153146. Email [email protected].
Transnational Corporations Review Volume 3, Number 2 June 2011
www.tnc-online.net, [email protected], DOI:10.5148/tncr.2011.1119 117-127
117
Internationalization of India’s Information Technology Sector and Its Implications on Market Structure
Vinoj Abraham
Abstract: Internationalizing firms, both of Indian origin and foreign origin seems to be the harbingers of the new growth trajectory of Indian IT sector. However, a large number of domestic firms, not able to internationalize seem to have been marginalized. In an attempt to understand this phenomenon, this paper explores the change in the structure and composition of the IT industry in India. Further, it draws upon the implications of such structural shifts on the market structure of the IT sector. Keywords: India, Information Technology Sector, Market Structure, Internationalization.
1. Introduction
The emergence of Information Technology as an Industry was greeted with great optimism by the developing world in the early nineties. The developing world saw many advantages in enabling the growth of the Information Technology (IT) as an Industry. The sector rendered promises of catch-up on the basis of its characteristic features such as minimal sunk-capital requirement for start-ups, while the returns to investment would be on the average higher than the manufacturing sector or some of the traditional service sectors. Moreover, the technology, leveraging on network externalities, was expected to encourage the presence of large number of such small sized IT firms, thus provide a fillip to the small scale industrial segments, low level capital based entrepreneurship and enhanced employment opportunities, especially for the young educated youth. The IT industry thus gave promises of leap-frogging possibilities for the developing world to catch up with the developed world.
The promise seems to be partially realized as well in terms of overall economic growth in case of India, the country which benefited the most from the emergence of this sector. The economic growth of India has been hovering around 6 to 8 percent during the last two decades and the most vibrant sectors in the economy had been Information technology sector and the telecommunication sector. The growth in the IT sector has been propelled almost entirely through exports1. The initial phase of export led growth of the industry was marked by the involvement of the sector at the low end of a global production chain2. This phase of the growth of the industry saw many foreign firms entering into joint venture with Indian firms, or foreign firms establishing their own subsidiaries in India. However as the capabilities of the local firms expanded and started moving up the value chain, the local firms themselves started internationalizing3 for 1 The share of exports in total sales from the sector has been consistently around 90 percent since the inception of the industry. There seems to be no visible shift in this export led growth pattern even after more than three decades of the vibrant growth of this sector. 2 The global production chain and the presence of Indian IT in the global chain is detailed out in Heeks (1996). It shows the predominant presence of Indian IT industry at production segments of software like coding and testing, onsite customized work etc. 3 The term ‘internationalization’ is used to connote the presence of the firm, through mergers, acquisitions or through own subsidiaries in a country that does not have its head quarters.

Internationalization of India’s Information Technology Sector and Its Implications on Market Structure
118
enhancing their export performance through various means such as mergers and acquisitions or establishing their own subsidiaries. Internationalization, which began on the compulsions of export led growth, has now moved into innovation led growth. Internationalizing firms, both of Indian origin and foreign origin seems to be the harbingers of this new growth trajectory. However, a large number of domestic firms who still rely on exports, but not able to internationalize seem to have been marginalized from the growth technological moving up, virtually being relegated to worse positions in the value chain. This has welfare implications that may affect a large number of firms, entrepreneurs and their employees. In an attempt to understand this phenomenon, this paper explores the change in the structure and composition of the IT industry in India with a focus on internationalization. Further, it draws upon the implications of such structural shifts on the developmental agenda for which IT sector was ushered into the Indian economy. Conceptually Internationalization of a sector represents the entry of the firms in the industry into investment that is international in nature. This implies that internationalization of a sector would entail the presence of two types of firms. One, foreign firms that are investing in the Indian IT sector, and two the presence of Indian firms that are investing in foreign firms, or establishing fully owned plants in foreign countries. To analyze the ownership structure and its implications the firms are divided into foreign MNCs, Indian MNCs and domestic firms. The CMIE-Prowess database of Indian firms collected from their balance sheets is used for the analysis. While the firm coverage of Prowess is not complete, the firms covered under CMIE have a cumulative share of nearly 90 percent of the reported IT sales. Foreign MNCs are defined as firms that either report themselves as foreign firms or have a share of more than 10 percent of foreign equity ownership, which is the convention to identify as MNC4. Indian MNCs are defined as those firms who have subsidiaries or have joint ownership of entities in other countries. Domestic firms are those firms that have less than 10 percent foreign equity and have identified themselves as private Indian firms. The number of firms in each year varies widely, with only 7 firms in the initial year, 1990 and increases to 520 firms in 2009. The paper is divided into five sections. Section 2 provides the trends and patterns in Internationalisation of IT industry. Section 3 explores the institutional basis for the internationalization. The next section discussed the implications of internationalization followed by conclusions in the last section.
2. The IT industry: trends and patterns in internationalization The Indian IT software and service sector had been growing at a robust rate of nearly 37percent per annum during the period 1990-91 to 2008-09 from $0.22 billion in 1990-91 to $ 58.7 billion in 2008-09 accounting for about 3.7 per cent of the GDP (NASSCOM 2010). The export of software and IT enabled service exports during the last two decades has been growing at over 50 per cent per annum up to late 1990s and 38 per cent since 1997-98 and above 25 percent in the 2000s. The exports of IT now accounted for the single largest item in the export basket of India (Chandrasekhar et al 2006). There is also evidence to show that firms are now deepening in technology (Joseph and Abraham 2005; Parthasarathy and Aoyoma 2006) after a long period of limited research and development and low end production (Parthasarathi and Joseph 2002; D’Costa 2002 and Arora et al. 2000). However, as mentioned above, this 4 Note that the foreign MNCs mentioned here do not have their headquarters in India, hence the reported figures for MNCs in the whole paper are only pertaining to their operations from India.

Vinoj Abraham
119
growth trend is not uniform across ownership types. Now let us turn to the ownership types to understand the changes in the ownership composition of this growth. Sales : The share of total sales is overwhelmingly dominated by Indian MNCs. On the average their share in sales was nearly 73 percent of the total sales (Table 1). This is followed by domestic firms, whose share was 16 percent and the foreign firms share was only 12 percent during the period 1990 to 2009. If we include all MNCs together then 85 percent of the industry sales were owned by MNCs during this period. However, through the period 1990 to 2009 the trends were not uniform. During the period 1990-1995 there was in fact a rise in the presence of sales from domestic firms upto 29 percent in 1995, which however declined later through out till 2009. Yet this early increase in the domestic share was at the expense of foreign MNCs while the share of Indian MNCs remained more or less stable. Meanwhile, the share of foreign MNCs which was declining till 2000 started rising thereafter to reach a peak of 17 percent in 2004 and then started declining. Since 2004 we see a secular decline in the share of both foreign MNCs and domestic firms, and the domination of Indian MNCs in the total share of sales.
Table 1. Share in sales by ownership type Year Foreign MNCs Indian MNCs Domestic firms Total 1990 3.9 77.5 18.5 100.0 1991 17.7 64.0 18.2 100.0 1992 15.9 66.5 17.6 100.0 1993 14.1 65.4 20.5 100.0 1994 13.8 58.7 27.5 100.0 1995 10.0 62.2 27.8 100.0 1996 10.2 64.6 25.2 100.0 1997 10.5 66.6 22.9 100.0 1998 11.8 64.9 23.3 100.0 1999 11.7 67.2 21.1 100.0 2000 8.4 70.6 21.0 100.0 2001 10.5 70.2 19.3 100.0 2002 14.3 68.9 16.8 100.0 2003 18.9 61.3 19.8 100.0 2004 17.0 57.8 25.2 100.0 2005 12.3 66.9 20.8 100.0 2006 14.3 75.1 10.6 100.0 2007 11.5 76.8 11.7 100.0 2008 10.1 76.2 13.7 100.0 2009 8.8 77.4 13.8 100.0 Total 11.8 72.6 15.6 100.0
Source: CMIE-prowess database
Export intensity: As can be seen from the graph below, the higher share of sales by the Indian MNCs and the foreign MNCs has been through the export route (Figure 1). The average export intensity, measured as total exports ratio to sales shows that the for the foreign MNCs it was 0.64, and for Indian MNCs it was 0.60 during the period 1990 to 2009, but for the domestic firms the export intensity was only 0.26. This implies that while the MNCs both Indian and foreign, depended on exports as their primary market, for the domestic firms, exports was their secondary market while it was the domestic market that was primary to them.
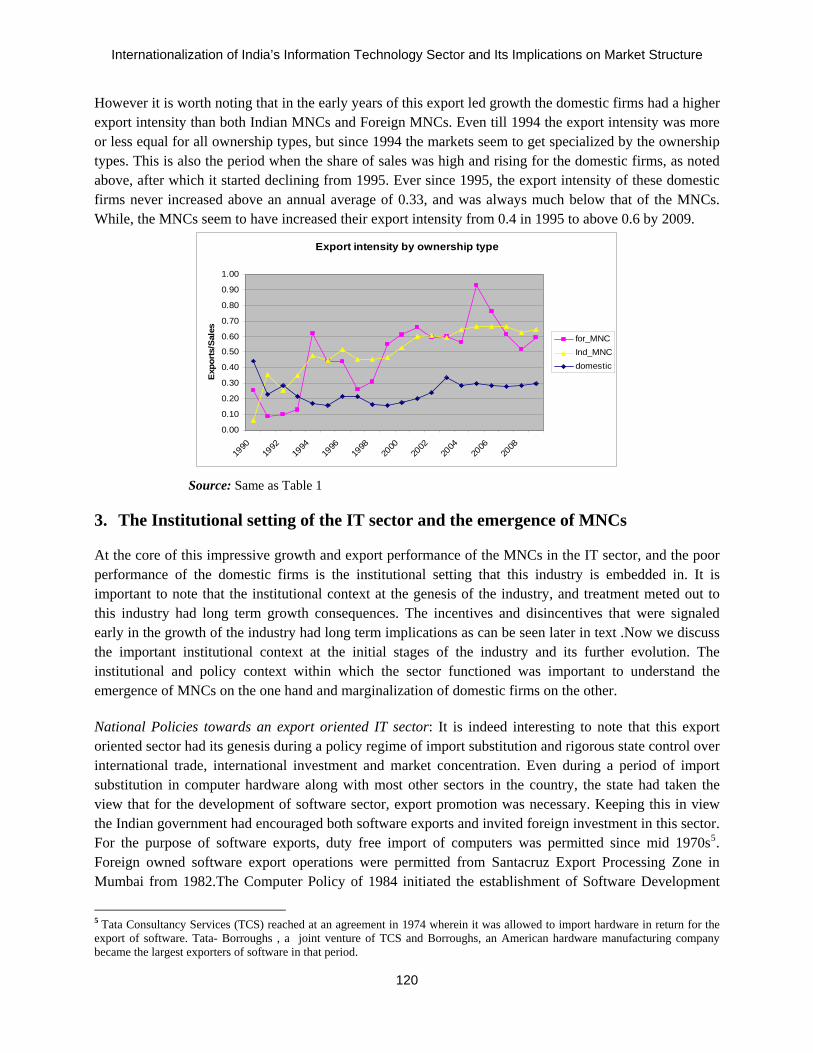
Internationalization of India’s Information Technology Sector and Its Implications on Market Structure
120
However it is worth noting that in the early years of this export led growth the domestic firms had a higher export intensity than both Indian MNCs and Foreign MNCs. Even till 1994 the export intensity was more or less equal for all ownership types, but since 1994 the markets seem to get specialized by the ownership types. This is also the period when the share of sales was high and rising for the domestic firms, as noted above, after which it started declining from 1995. Ever since 1995, the export intensity of these domestic firms never increased above an annual average of 0.33, and was always much below that of the MNCs. While, the MNCs seem to have increased their export intensity from 0.4 in 1995 to above 0.6 by 2009.
Source: Same as Table 1
3. The Institutional setting of the IT sector and the emergence of MNCs At the core of this impressive growth and export performance of the MNCs in the IT sector, and the poor performance of the domestic firms is the institutional setting that this industry is embedded in. It is important to note that the institutional context at the genesis of the industry, and treatment meted out to this industry had long term growth consequences. The incentives and disincentives that were signaled early in the growth of the industry had long term implications as can be seen later in text .Now we discuss the important institutional context at the initial stages of the industry and its further evolution. The institutional and policy context within which the sector functioned was important to understand the emergence of MNCs on the one hand and marginalization of domestic firms on the other. National Policies towards an export oriented IT sector: It is indeed interesting to note that this export oriented sector had its genesis during a policy regime of import substitution and rigorous state control over international trade, international investment and market concentration. Even during a period of import substitution in computer hardware along with most other sectors in the country, the state had taken the view that for the development of software sector, export promotion was necessary. Keeping this in view the Indian government had encouraged both software exports and invited foreign investment in this sector. For the purpose of software exports, duty free import of computers was permitted since mid 1970s5. Foreign owned software export operations were permitted from Santacruz Export Processing Zone in Mumbai from 1982.The Computer Policy of 1984 initiated the establishment of Software Development
5 Tata Consultancy Services (TCS) reached at an agreement in 1974 wherein it was allowed to import hardware in return for the export of software. Tata- Borroughs , a joint venture of TCS and Borroughs, an American hardware manufacturing company became the largest exporters of software in that period.
Export intensity by ownership type
0.00
0.10
0.20
0.30
0.40
0.50
0.60
0.70
0.80
0.90
1.00
1990
1992
1994
1996
1998
2000
2002
2004
2006
2008
Exp
orts
/Sal
es
for_MNCInd_MNCdomestic

Vinoj Abraham
121
Promotion Agency and software export related imports were further liberalized. The 1984 computer policy removed most of the institutional barriers including barriers to entry based on size and ownership through Monopolies and Restrictive Trade Practices (MRTP) Act and Foreign Exchange Regulation ( FERA) Act. Multinational Corporations (MNCs) sought India as a software development source as well as a market for software products. They increased their equity participation in local software producing companies6.
In 1986 the government announced software as a key area of exports (Government of India, 1986). The policy statement included incentives for promoting software exports such as tax holidays, income tax exemptions form software exports, export subsidies, and duty free imports. Technology parks that provided basic infrastructure and helped in taking advantage of agglomeration economies were envisaged through the Software Technology Parks of India (STPI)7. Software Technology Park (STP) scheme was notified 100% Export Oriented Scheme under the EXIM policy by the Ministry of Commerce on March 1994. STPs are allowed duty free imports of capital goods, raw materials, components software, hardware and other related inputs. Some of the STP centers provide incubation infrastructure to Small & Medium Enterprises (SMEs), enabling them to commence operations.
These open economy policies of the state attracted substantial number of foreign firms to India. Moreover, these policies, along with the nature of products and services in the IT sector, led to the rise of Indian MNCs in the sector. A third segment of the Industry, namely, domestic firms, owned and operated by Indians also grew up initially, but was restricted in its growth due to shortage of skilled workers, poor technology acquisition and innovation, whch are discussed below. But equally important was the policy towards domestic use of IT.
National Policies inhibiting the growth of a domestic oriented IT sector: Even when the growth of IT sector was exalted by all, it was expected that this growth would be achieved only through exports and not by increasing the diffusion of IT in the various economic activities of the country. Notice that most concessions and incentives provided to the IT industry was locked up with their export obligations. This gave the incentive for all IT producing units to shift to exports rather than producing for the domestic market. This apart, the domestic market was protected against IT diffusion. ‘Computerisation’ of the economy was vehemently opposed from many quarters in the early years of implementation, especially in government and nationalized banking services. India being a labour abundant country and on account of the generally held belief that computers are labour displacing, the use of computers, especially during the early years, was explicitly discouraged. In 1969 the Ministry of Labour, Employment and Rehabilitation set up a high level committee to advise the Government on computerization. The committee favoured a positive approach and recognised the legitimate use of computers in the fields of education, science, defence and even in some commercial and industrial establishments. But the strict regulatory measures that they prescribed were contrary to their positive approach. It was laid down that all the computerisation proposals had to be scrutinized by two experts, case by case and a justification report furnished.
6 Texas Instruments was the first foreign company to set up its wholly owned software production unit in Bangalore. Citicorp Overseas Limited (COSL) followed suit soon. 7 STPI provide infrastructural and institutional support for software firms involved in software exports by providing data communication infrastructure and services like technology assessment and professional training.

Internationalization of India’s Information Technology Sector and Its Implications on Market Structure
122
In 1979 during the first meeting of the reconstituted electronics commission, the cabinet secretary and the finance member reported the fear regarding computerisation leading to unemployment. As late as in 1984, while the government adopted a liberalised policy towards computer industry, the approach of government towards use of computers had not undergone any major change. To a question raised in the parliament on use of computers in 1984, it was stated that the policy announced in 1978, which was highly restrictive, continued to be the basis for the induction of computer technology in India8. While the then Prime Minister Rajiv Gandhi firmly believed in computers as a tool of productivity enhancement and national development, the government was hesitant to openly declare a policy that promotes the use of computers across different sectors of the economy. More over, trade policy regime governing the IT sector, similar to other sectors, till recently was characterized high tariff barriers and domestic taxes. While tariff exemptions were offered for those firms engaged in exports, such concessions were not available to the domestic users of information technology. Thus viewed, the fear of labour displacement by computers along with high cost of hardware and software would have acted a deterrent to the use and diffusion of IT on the industrial sector. The poor levels of technology and poor skill levels in existing india’s industrial sector also acted as deterrents for IT diffusion. The restricted diffusion of IT in the economy discouraged IT firms from producing for the domestic market. While the international market became lucrative, which the MNCs could capture, the diminutive domestic market was largely unattended space that the domestic firms tried to fill in. Human Capital- Broad Base but Narrow Top: The Indian education system, with a general focus on English and Mathematics education, has been a blessing in disguise for the IT sector. A large number of students are graduated year after year, from the general education stream into the economy. These students remained largely underemployed or unemployed due to the lack of demand for skilled workers in the economy. Testimony to this comes from the fact that unemployment rate in India is highest among the educated youth, especially technically educated9. It was this surplus in the economy that generated the ‘cheap skilled labour’ in the economy that could be tapped well by the newly emerging IT industry, which in itself was not highly skill intensive initially, but required only generic skills. However, with the growth of the IT industry and moving from onsite to offshore production the demand for skills also increased. In response a number of institutional interventions came in place. Specialized Masters level programmes at the IITs and other major institutions was started, Besides the various courses started at the educational institutions, a number of enterprises and other institutions promoted by Department of Electronics have also been providing training in software development. These include NCST and C-DAC (Centre for Development of Advanced Computing) running advanced software engineering courses and CMC Ltd., ETTDC, NIC running routine software application training. Besides these, the government permitted private investment in IT training since the early 1980s. About 80 private companies have been operating some 4,000 training centers by 2000 offering various IT courses
8 Ram Vilas Paswan, ‘Computerization Policy in the Country’, IPAG Journal, Vol. 11, 11, New Delhi, August 1984, p. 742, Lok Sabha Question, No, 4142, answered on 21 March, 1984. 9 The unemployment rate among the educated population, was at 7.8 percent at the higher secondary level and 8.8 percent at graduate and above level for the year 1999-00 (NSSO, 1999-00). If we take the unemployment rate among the technically educated it was 23.7 percent of all technically educated population.

Vinoj Abraham
123
throughout the country through networks of franchises. These privately run centres offer diplomas of various duration, ranging from short-term specialized courses to longer-term basic courses. Some of these private companies expanded their training outside India and by 2004 Indian firms were found offering IT training in 55 countries. Yet, the human capital is narrow in India when it comes to specialised skills. The demand for software personnel especially engineering graduates has grown rapidly since the mid 1990s due to the expansion of the software development activity in India as well as the growing brain drain. In view of this, easing the supply of IT professionals has been one of the challenges faced by the country. In a survey conducted during the late 1990s, 57 per cent of the firms interviewed indicated manpower and skills shortage as the major problem (Arora et al. 2000). Though there is no uniform view on the rate of attrition in the sector it is widely believed that the attrition rate is anywhere between 40 to 60 percent in a year10. Such high attrition rates are closely associated with the practice of ‘poaching’ done by firms. On the other hand firms are also vying each other to retain workers using a variety of strategies11. Studies show that attrition behavior in the software industry is associated with the skill upgradation possibilities in a firm, the returns to work both present and expected; and the position of the worker in the job hierarchy and size of the firm (Abraham, 2007). The same study shows that MNCs are large sized firms which provide higher wages, higher on-the-job learning opportunities, have easier climbing of hierarchies opportunities, while at the same time keeps work fragmented and ties the workers to the firms through conditionality attached non-wage benefits such as stock options that can be realized only after a lock-in period. Thus on the one hand, MNCs are able to attract and retain skilled workers; these workers are not available for the domestic firms who do not have the ability to retain workers against being attracted to MNCs. This again keeps the domestic firms limited in their ability to engage in continuous exports and high end production, thus relegating their position to inferior levels and quality. The Global Production Network (GPN) in IT sector: The sector had found its initial growth prospects arising from participating in the global production network of the IT sector. The demand for Indian software exports to North America came from factors such as shortage of skilled workers in U.S., cheaper labour cost in India and time gap between U.S. and India which makes it possible to have 24 hour working days in the U.S. through networking (Arora et al., 2000). Studies show that the initial participation of IT firms in the GPNs were being predominantly on-site services called ‘body shopping’, which are considered to be of low value added in nature and low paid in income. Later there had been a marked shift towards low end off-shore export (NASSCOM (2004). The spatial division of labour in the global IT industry identified the low value ends of software production to be outsourced to low labour cost economies like India. Technology, Innovation and Innovation Networks: The face of IT sector has changed vastly since the early years of its emergence. Today, the IT sector seems to be moving up the value chain in software production. The services content in the software production has been declining steadily while packages and software products are on the rise from India. Studies show that firms were diversifying into high end of the value chain of software production (Joseph and Abraham, 2004). Further, firms with large size and accumulated
10 See for example “Firms Struggle To Retain Talent As Economy Booms”, Indian Express , 15th feb, 2007 11 IT firms work harder to retain techies, The Hindu Business Line , 25th December, 2003

Internationalization of India’s Information Technology Sector and Its Implications on Market Structure
124
experience tend to move up the value chain. This mobility in the sector was facilitated through technology acquisition and innovation. Technology acquisition came about through three routes, viz; through own research and development. The other route was through import of technology and through mergers and acquisitions. The R&D intensity measured as R&D investment as a ratio of sales shows that on an average the Indian MNCs had a much higher R&D intensity than the foreign MNCs While R&D intensity was the lowest for the domestic firms. For the Indian MNCs the estimated R&D intensity from our sample of firms was 3.5 percent as against the foreign MNC figure of 0.81 percent and the domestic firm at just 0.54 percent. While for intangible technology import, accounted as payments made for copyrights and royalties, has been highest for the foreign MNCs. In our sample the foreign MNCs had an intangible technology import intensity of 0.9 percent, while it was 0.16 for Indian MNCs and for domestic firms it was 0.63 percent. Thus, while Indian MNCs and foreign MNCs seem to be acquiring technology through R&D investment and technology imports respectively, for the domestic firms their dependence on both R&D investment and technology import was limited. Innovation, in the sector, however is not a direct outcome of the technology acquisition or R&D intensity. Studies show that innovation in IT sector comes about through constant learning and competence building. MNCs, by being linked up with various agents of innovation tend to be more innovative. For instance their interaction with renowned knowledge producing institutions such as universities and research centres, their interactions with global clients who have diverse demands, their learning from competitors, all these have pushed the MNCs to gain from these networks towards innovative outcomes. Studies indeed show that one of the main motivations of Indian firm’s overseas acquisitions have been to access international market, firm-specific intangibles like technology and human skills among other aspects ( Pradhan and Abraham, 2005). Thus, it was the institutional context that consisted of a myriad set of factors that encouraged the MNCs to flourish, especially MNCs of Indian origin while these factors also inhibited and discriminated against the small domestic producers who catered essentially to the domestic market. This selective growth pattern has had some deleterious consequence for the sector, which are discussed below. 4. Implications of internationalisation on market structure The effect of internationalization on market structure has been tested by many authors such as Lall ( 1979) who had concluded that the presence of foreign MNCs tended to increase concentration. However, this was in the case of foreign MNCs alone. Yet, it can be argued that even the presence of Indian MNCs in the sector also tends to increase concentration and create a dual type of industrial structure within the economy. Increasing Concentration: One of the important implications of the rise of MNCs in the IT industry had been the increasing monopoly power these firms. The Hirschman Herfindahl Index (HHI) calculated for the industry during the period 1990 to 2009 shows that the HHI level which was very high at 4000 in 1990 , declined to 468 in 2001, implying that the monopoly power the firms declined substantially during the period 1990 to 2001 ( Table 3). However, since 2001 the HHI level has risen from there to reach 942,
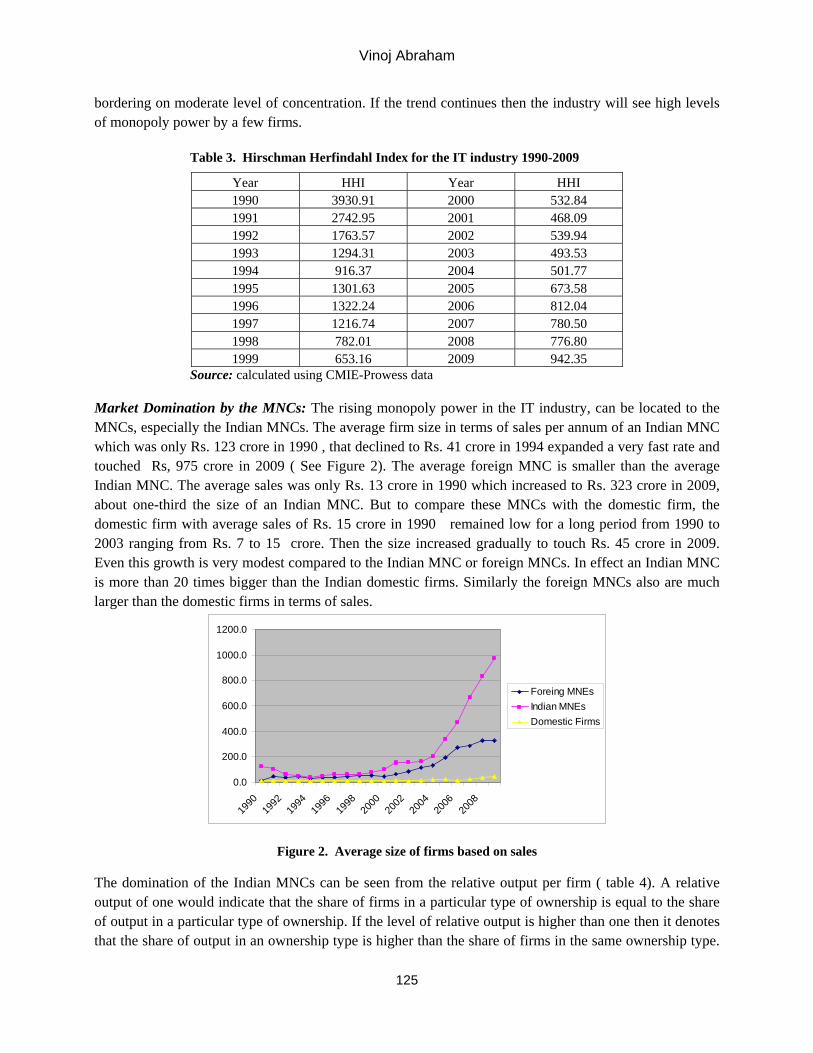
Vinoj Abraham
125
bordering on moderate level of concentration. If the trend continues then the industry will see high levels of monopoly power by a few firms.
Table 3. Hirschman Herfindahl Index for the IT industry 1990-2009
Year HHI Year HHI 1990 3930.91 2000 532.84 1991 2742.95 2001 468.09 1992 1763.57 2002 539.94 1993 1294.31 2003 493.53 1994 916.37 2004 501.77 1995 1301.63 2005 673.58 1996 1322.24 2006 812.04 1997 1216.74 2007 780.50 1998 782.01 2008 776.80 1999 653.16 2009 942.35
Source: calculated using CMIE-Prowess data Market Domination by the MNCs: The rising monopoly power in the IT industry, can be located to the MNCs, especially the Indian MNCs. The average firm size in terms of sales per annum of an Indian MNC which was only Rs. 123 crore in 1990 , that declined to Rs. 41 crore in 1994 expanded a very fast rate and touched Rs, 975 crore in 2009 ( See Figure 2). The average foreign MNC is smaller than the average Indian MNC. The average sales was only Rs. 13 crore in 1990 which increased to Rs. 323 crore in 2009, about one-third the size of an Indian MNC. But to compare these MNCs with the domestic firm, the domestic firm with average sales of Rs. 15 crore in 1990 remained low for a long period from 1990 to 2003 ranging from Rs. 7 to 15 crore. Then the size increased gradually to touch Rs. 45 crore in 2009. Even this growth is very modest compared to the Indian MNC or foreign MNCs. In effect an Indian MNC is more than 20 times bigger than the Indian domestic firms. Similarly the foreign MNCs also are much larger than the domestic firms in terms of sales.
Figure 2. Average size of firms based on sales
The domination of the Indian MNCs can be seen from the relative output per firm ( table 4). A relative output of one would indicate that the share of firms in a particular type of ownership is equal to the share of output in a particular type of ownership. If the level of relative output is higher than one then it denotes that the share of output in an ownership type is higher than the share of firms in the same ownership type.
0.0
200.0
400.0
600.0
800.0
1000.0
1200.0
1990
1992
1994
1996
1998
2000
2002
2004
2006
2008
Foreing MNEsIndian MNEsDomestic Firms
Internationalization of India’s Information Technology Sector and Its Implications on Market Structure
126
As can be seen the foreign MNCs have approximately one as their relative output, while for Indian MNCs which is always higher than foreign the figure increased from 2.7 to 4.01. For the domestic firm the relative output was very low at 0.21 on an average and it has been continuously declining since the peak in 1995.
Table 4. Relative output per firm
Year Foreign MNCs Indian MNCs Domestic Firms 1990 0.28 2.71 0.32 1995 1.83 2.57 0.40 2000 1.28 2.89 0.30 2005 2.09 3.76 0.27 2009 1.33 4.01 0.19 Total 1.71 3.58 0.21
Note: Relative output is measured as share of sales across ownership type / share of firms across ownership type Emergence of a dual industrial structure: The high level of market concentration in the early years of the industry is explainable. There were only very few firms in the industry and in the sample for the above there were only seven firms in 1990 of which 50 percent of the sales accrued to a single firm. The situation soon changed with more firms entering the market and reducing the market concentration considerably. By the late 1990s the industry had become highly competitive, with the presence of a large number of firms. About 68 percent of the firms were domestic firms in 1999, while about 26 percent were Indian MNCs and the presence of foreign MNCs were restricted to about 6 percent (table 5). The share of domestic firms increased to 76 percent in 2005 and continues to have on the average above 75 percent share of the firms, while the share of firms for Indian MNCs declined to 19 percent and foreign firms remained at 6 to 7 percent since mid 1990s.
Table 5. Share of firms according to ownership structure and total firms in sample
Share of Firms Number of firms Year Foreign MNCs Indian MNCs Domestic Firms Total 1990 14.3 28.6 57.1 100 7 1995 5.5 24.2 70.3 100 128 2000 6.5 24.5 69 100 368 2005 5.9 17.8 76.3 100 613 2009 6.6 19.3 74.1 100 513 Total 6.9 20.3 72.8 100 6,392
Source : CMIE-Prowess database This point to the existence and strengthening of a dual industrial structure in the IT sector. The duality would be between MNCs and domestic firms. A large share of firms were domestic firms (74%), who were not export oriented, were small in size and did not command any respectable market share Their growth was also slow. The counter to this case was the Indian MNCs who represented only a small share in the total firms (20%) but were export oriented, and were large firms who were monopolizing the market. 5. Conclusion The emergence of the IT sector in India was hailed by many as a panacea to a wide range of developmental woes India was suffering. In retrospect, the growth of IT sector seems to have partially

Vinoj Abraham
127
supported the acceleration of economic growth in the country. However, there has been a structural change in the sector such that the MNCs, both Indian and Foreign have dominated the industry. Their domination came up due to their export orientation, innovativeness and their global production and innovation networks. While the domestic firms have lost their prior role of being exporters and now have become domestic oriented producers. Through this process of structural change, market concentration within the industry has been increasing. A dual industrial structure is being developed within the IT sector wherein, highly innovative, networked MNCs dominate the export market, while the domestic market is being focused by domestic firms who are poorly networked, and less innovative. This domestic market segment consisting of a large number of small domestic firms does not represent the surging IT sector that is represented in India. To the extent that these small domestic firms are not able to catch up with the large MNCs, the translation of the very high levels of growth of a few MNCs in the industry into development outcomes is questionable.
References Arora, A., Arunachalam V.S., Asundi J. and Ronald F., (2000), The Indian Software Services Industry, Research
Policy, Vol 30 (3), 1267-87 Balakrishnan, P. (2006),” Benign Neglect or Strategic Intent? Contested Lineage of Indian Software Industry,
Economic and Political Weekly, Vol 41 No 36 September 9, Chandrasekhar, C. P. (2006) The Political Economy of IT-Driven Outsourcing in Political Economy & Information
Capitalism in India; Digital Divide, Development Divide & Equity edited by Govindan Parayil, Palgrave Macmillan
D`Costa A. (2002) “Export Growth and Path Dependence: The Locking in of Innovations in the Software Industry”, Science, Technology and Society, Vol 7, No.1
Government of India (1986), “Policy on Computer Software Exports, Software Development and Training”; Department of Electronics, New Delhi.
Heeks, Richard (1996),“India’s Software Industry: State Policy, Liberalisation and Industrial Development”, Sage Publishers, New Delhi.
Joseph K.J.and Vinoj Abraham (2005) “Moving up or Lagging Behind in Technology? Evidence from an Estimated Index of Technological Competence of India’s IT Sector” in (eds) Ashwini Saith and Vijayabhaskar, ITs and Indian Economic Development: Economy, Work, Regulation , Sage Publications,
Lall, S. 1979: Multinational and Market Structure in an open Developing Economy: The Case of Malaysia, Review of World Economies 115(2), 325-350.
NASSCOM (2004) IT Industry Fact Sheet NASSCOM (2010) IT Industry Fact Sheet Parthasarathi, A. and K J Joseph (2002) “Limits to Innovation with Strong Export Orientation: The Experience of
India’s Information Communication Technology Sector”, Science, Technology and Society, Vol 7, No.1 Parthasarathy, Balaji and Aoyama, Y (2006), “From Software Services to R&D services: Local Entrepreneurship in
the Software Industry in Banglaore, India”, Environment and Planning A, 38 No 7, pp 1269-1285 Pradhan, Jaya.Prakash and Vinoj Abraham (2005) ‘Overseas Mergers and Acquisitions by Indian Enterprises:
Patterns and Motivations’, Indian Journal of Economics, Vol. LXXXV, No. 33, pp. 365–386. Acknowledgements My thanks to Dr. Jaya Prakash Pradhan for sharing with me with the list of Indian MNCs in IT. Usual disclaimers apply.
About the Author: Vinoj Abraham, PhD is Assistant Professor at Centre for Development Studies, Trivandrum, India since 2006. His areas of interest are Economics of Technology and Innovation, Development Economics and Labour Economics. Contact Information: Vinoj Abraham, PhD, Assistant Professor, Centre for Development Studies, Prasanth Nagar, Ulloor, Trivandrum, 695011, Tel: 91-9745157018, Email: [email protected], [email protected].

Transnational Corporations Review Volume 3, Number 2 June 2011 www.tnc-online.net, [email protected], DOI:10.5148/tncr.2011.1120 128-147
128
The Role of Networks in the Accelerated Internationalisation of Indian Firms
Sumati Varma
Abstract: This study focuses on the role of networks in the accelerated internationalisation of firms from the Indian IT industry. The emergence of MNEs from the emerging markets which are characterised by low resource munificence and continuous economic liberalisation, as important players in the global economy has been a distinctive development of this century. In the Indian context there has been a surge in outward FDI since 2000, spearheaded by M&A activity from the IT and pharmaceutical sector, motivated by the search for markets, products and strategic assets. Using the case study approach this paper examines the role of business and institutional networks as well as the entrepreneurial characteristics of the top management in the emergence of born global acquirers from the IT sector.
Keywords: India, information technology sector, market structure, internationalization
1. Introduction
The rise of MNEs from emerging economies as important players in the global economy has been a distinctive development of the present century. The appearance of these firms from unique institutional and resource environments (Hoskisson et al 2000; Khanna and Palepu 2006) has been fraught with challenges (Lall 1983; Wells 1983 ; Khanna and Palepu 2006) as many of them have emerged as latecomers (Mathews 2002) from economies with underdeveloped institutions and market intermediaries, overcoming resource disadvantages such as financial capital, advanced technologies and managerial capabilities (Guillen 2000).
MNEs from the emerging markets are characterised by competitive advantages that are based on price differentiation rather than on cutting edge technology or product differentiation (Kumar and McLeod 1981, Lall 1983, Wells 1983). Characterised as being resource munificent, they are therefore motivated by asset exploration for resource and knowledge acquisition as well as capability enhancement ( Bartlett and Ghoshal 1988; Madhok 1997, Luo 2000) in their quest abroad, as against the asset exploitation motives of firms from the developed countries ( Makino et al 2002; Mathews 2002, 2006; Child and Rodrigues 2005). They are also constrained by an institutional environment with lower environmental munificence (La Porta et al 1998, Makino et al 2002) in addition to continuous economic liberalisation and gradual institutional transition (Peng 2003). These institutional components which are not addressed in the conventional FDI literature have a significant bearing on the internationalisation of firms from the emerging markets.
The Born Global firm (Zhang, Tansuhaj and McCullough 2009), Varma (2009, 2010) is visible among the MNEs that have made their presence felt in the emerging economies such as China and India. The period

The Role of Networks in the Accelerated Internationalisation of Indian Firms
129
2000 –07 witnessed an unprecedented boom in outbound FDI activity from India, Pradhan (2007); Nayyar (2008), led by M&A activity in the IT and pharmaceutical sectors motivated by the search for markets, products and greater efficiency (Varma 2009). An interesting facet of this phenomenon was the emergence of born global acquirers from the IT sector (Varma 2010). Born global firms typify the phenomenon of accelerated internationalisation as they bypass the incremental stage model and start operating in the global market from inception and seek to derive ‘significant competitive advantage from the use of resources and sale of outputs in multiple countries’ (Oviatt and McDougall, 1994, 49). The born global acquirer is a specific specie of the born global class, that seek global presence in multiple geographies and are characterised by a string of acquisitions within a few years of incorporation (Varma 2010).
Emerging economies refer to “low-income, rapid growth countries using economic liberalization as their primary engine of growth” (Hoskisson et al 2000). One of the defining features of emerging economies in the last couple of decades has been the policy of economic liberalization favored by their governments (Hoskisson et al 2000; Wright et al 2005). Economic liberalization is a unique and powerful environmental contingency faced by firms in developing economies, which significantly changes the business environment by increasing competition, changing regulations, and creating new business opportunities. The forces of economic liberalization acting on firms from emerging economies are therefore equivalent to significant “institutional transitions” introducing fundamental and comprehensive changes to “the formal and informal rules of the game that affect organizations as players” (Peng 2003) and encourage entrepreneurial behavior driven by a host of factors. There is however, scant literature, on the entrepreneurial initiatives of accelerated internationalization in the emerging economy context. This paper seeks to fill that gap and initiate discussion in that regard. it contributes as a pioneering study in the context of the born global literature as it examines the role of networks as facilitating factors and drivers in the emergence of the born global acquirer from India.
The rest of the paper is organised as follows: section 2 reviews current literature followed by a specification of research methodology in section and development of theoretical constructs in section 4. Section 5 contains the analysis and discussion and section 5 concludes.
2. Literature review
Networks are widely recognized as influential in the internationalization process, and in the specific context of INVs as well. Initial explanations of the network approach to internationalisation (Johanson and Mattson 1988) postulated the international growth of a firm through gradually increasing market knowledge and learning from firms in their network. Although this initial study was based on international marketing networks, the model was subsequently developed to explain the role of parental networks in the internationalisation of firms from India (Elango and Pattnaik 2007). Links to a parental network or business group can act as a substitute for experiental knowledge, as they act as a source of critical knowledge for internationalization ( Banerji and Sambharya 1996; Welch and Welch 1996; Holm et al 1999; Chetty and Eriksson (2002); and connections that member firms can tap in order to exploit opportunities.
Most studies on internationalisation track the influence of networks beginning with initial foreign market entry. For example, Coviello and Munro (1995, 1997) highlight both positive and negative network impacts on the pace and patterns of entry mode and market selection for INVs. The need for network research specific to the INV has been recognized by Arenius (2002), Andersson and Wictor (2003),
Sumati Varma
130
Sharma and Blomstermo (2003) and Autio (2005). These scholars also note that network relationships generate social capital for INVs – a resource that enables entrepreneurial firm mobilization.
Firms from emerging economies have emerged as latecomers in global competition having started as suppliers or distributors to other manufacturers (Vernon-Wortzel and Wortzel 1988, Brouthers et al 2005) and are therefore their strategies and performance are posited to be strongly influenced by networks (Peng, 1997; Lee & Chen, 2003). The Linkage, Leverage, Learning (LLL) framework suggested by (Mathews 2002, 2006) explains how firms leverage prior linkages developed in the global economy through experiential learning and gain a foothold in the interconnected global network. Chen and Chen (1998) employed a strategic linkage theory and network approach to explain how FDI is used as a strategic means for small and weak firms to access resources that investors do not possess. Using three longitudinal cases from China, Peng (1997) observed that in a transition economy such as China, firms adopt a network-based strategy using a process of ‘boundary blurring’ through development of inter-organizational relationships with other firms. This unique strategy of growth has enabled the firms to avoid the tricky issue of ownership transfer of assets while allowing them access to complementary assets in the uncertain period of transition. This hybrid strategy, which is neither market nor hierarchy, was adopted by firms due to constraints on generic expansion or acquisitions imposed by the institutional environment.
As discussed by Arenius (2002), the benefits of increased social capital for the new venture can include better access to resources and international opportunities, and a means by which to overcome the liabilities of newness and foreignness. Evidence of the role of social ties in internationalization has been provided by Ellis (2000), Ellis and Pecotich (2001) and Harris and Wheeler (2005). Social capital is, however, generated by more than social ties, because relationships can also be business- based. For example, Yli-Renko et al. (2002) show that external social capital (in the form of management contacts, involved customers and involved suppliers) positively impacts upon foreign market knowledge and, in turn, the international growth of new ventures. Chetty and Wilson (2003) found that INVs collaborate to access resources and enhance their reputation, and earlier studies from Coviello and Munro (1995, 1997) identify the influence of both social and business ties on the internationalization of start-up technology ventures and concludes that, with time, the INV’s network and resultant growth patterns are characterized by change.
Institutional economics emphaisies the role of home country networks, used by authors such as Yiu et al (2007), in the emerging economy context as an important resource for international venturing. These include business networks which are linkages among parties in a business transaction such as suppliers and buyers which act as sources of information and help a firm overcome the liability of foreignness. Similarly institutional network ties with government officials, banks and financial institutions help a firm gain intelligence about foreign markets and help secure a position of trust.
3. Research methodology
3.1 Research context and method
This paper examines the role of networks as drivers of Born Global firms in the recent phase of outbound FDI from India in 2000 -07. It has chosen the case study method as the research strategy which is suitable for model and grounded theory development along with a focus on complex processes that take a long time to unfold (Yin 1991). As there is practically no theory on the phenomenon of born globals in India,

The Role of Networks in the Accelerated Internationalisation of Indian Firms
131
the paper chose to ground model development on actual case data complemented with a deep review of received theories on internationalization (Eisenhardt 1989).
Following Eisenhardt (1991) and Miles and Huberman ( 1991) the paper focused on case studies of Indian IT firms that had made an international acquisition within 5 years of coming into existence. The sampling frame was defined following Miles and Huberman (1994) setting–event-actor- process parameter setting. Accordingly we focused on Indian IT born global acquirers (setting), on the early and rapid internationalization process (event), on the top management team of these firms (actors) and the process of making an overseas acquisition early in the organisation’s life (process). Consistent with Eisenhardt’s recommendation for a theoretical sampling strategy, we introduced variance along important theoretical dimensions by including both hardware and software firms, with varying areas of specialization. Consistent with established sample selection criteria in born global research all firms were less than 5 years old at the time of international venturing and derived significant competitive advantage from the use of resources and sale of outputs in multiple countries from inception.
3.2 Data sources
The data for this study is based on M&A activity of the Indian IT industry during January 2001 to March 2007. It uses secondary reported firm-level data from studies by consulting firms such as UBS, Accenture and MAPE, as well as ‘Prowess,’ the Centre for Monitoring Indian Economy (CMIE) database. The study also examined published firm-specific information and media coverage (including their websites) to assemble a final data base. Firms included in the study are those that have undertaken a merger or an acquisition between 2001 and 2007, and are incorporated in India. The study excludes acquisition activity by firms that are subsidiaries of foreign firms and have been used as a vehicle of acquisition.
While primary data through a survey or questionnaire may be the ideal method for a study such as this, the problems of low response, subjective bias and a lack of research culture in the emerging economy scenario (Hosskinson et al) preclude their use. The use of data from PROWESS has been increasingly vouched for by researchers such as Khanna and Palepu (2000), Khanna and Rivkin (2005) and Chakar and Vissa (2005).
3.2.1 Sample selection
Between 2000 –2007 there were over 521 overseas acquisitions from India out of which 133 ( 25.5%) were from the IT sector carried out by 47 firms. 12% of total acquisitions in the sample were undertaken by firms which were incorporated less than 5 years before they made their first global acquisitions (Varma 2009). We call these firms the Born Global Acquirers and select some of them for the final sample based on the criteria discussed below.
Speed of internationalization
The first criterion to differentiate BGFs from traditional internationalizes is the speed of internationalization. It can be described by two different time spans, namely:
(a) The time span between founding and the first foreign market entry, and (b) the time span between the first and the following foreign market entries.
Sumati Varma
132
In previous studies, the time span between founding and the first foreign market entry is most commonly used to differentiate BGFs from traditional internationalizers. E.g., Rennie (1993), Knight & Cavusgil (1996) and Kandasaami & Huang (2000) postulate a time span of two to three years from the time of founding. This definition is based on the consideration that it is hardly possible to speak of a global vision when the first internationalization step takes place after more than three years.
The time span between the first and the second foreign market entry is only mentioned by a few authors (Lindqvist, 1991; Autio, Sapienza & Almeida, 2000; McNaughton, 2000; Stray, Bridgewater & Murray, 2001). E.g., Melin (1992) points out that firms in technology-intensive industries show shorter time spans until their next internationalization step than firms in other industries. The study of Stray, Bridgewater & Murray (2001), however, reveals that technology-based firms show different speeds of internationalization. Generally, it is agreed that this time span should be shorter than between founding and first foreign market entry.
Since this paper is focused on a specific category of BGFs – viz. BCAs we designed an alternate criterion for classification:
a. The first acquisition took place within five years of incorporation
b. The firm had a subsequent foreign entry within the next three years
The geographic scope of internationalization
The geographic scope of internationalization of a BGF can be measured by the following criteria: (a) number of countries, (b) number of cultural clusters, and (c) number of geographical regions in which the firm is present. To call a firm global, Kandasaami (1998) demands that it should have activities in at least five countries; Others consider a further distinction between cultural clusters (Hofstede, 2001) and geographical regions to be necessary to clarify the physical and geographical distance of foreign markets from the home market, whereas Lummaa (2002), demands activities in at least two cultural clusters and geographical regions. The corresponding criterion for this paper is that the firm must have a geographical presence in at least three countries.
Foreign sales
Besides the number of foreign markets, the proportion of foreign sales compared to total sales of a firm presents a further criterion of BGFs. The ratio varies between 10% (Kandasaami & Huang 2000) to 25% (Madsen, Rasmussen & Servais 2000) with authors such as Lummaa (2002) revealed in three of four cases even a ratio of 90%. This paper considers a ratio of 10% of foreign sales to be sufficient.
The firms and their relevant features are briefly described below.
3.2.2 Sample description
IBS Software services
IBS, was incorporated in 1997 in response to the global need for a software solutions company in the fast growing travel, tourism and logistics industry. It began global operations in 1998, had a presence in three different geographies by 2001 and made its first overseas acquisition in 2002. Its founder V.K Mathews,

The Role of Networks in the Accelerated Internationalisation of Indian Firms
133
an aeronautical engineer from IIT Kanpur, has varied global experience in the travel industry. It has used a strategic mix of alliances and acquisitions to emerge as a leading international player in the travel space. Some of its notable alliances were with Oracle Corporations, Sun Microsystems and BEA Systems in 2001 and with Cendant Corporation USA in 2004 and important acquisitions were TopAir, Avient Technologies, Discovery Travel Systems and VISaer Inc.
Four soft limited
Four Soft Limited is the world's largest transportation and logistics software products company. Initially promoted as a private limited company, by technocrat Palem Srikanth whose global experience includes both his education at Stanford and prior global work experience in supply chain management, the company came into existence under the government’s EOU/STP scheme and has moved up the technological capability ladder by obtaining various ISO and SEI-CMMI certifications. It has used a variety of modes of international entry and has a global presence in 10 countries.
MphasiS
MphasiS Limited (then, MphasiS BFL Limited) was formed in June 2000 after the merger of the US-based IT consulting company MphasiS Corporation (founded in 1998) and the Indian IT services company BFL Software Limited (founded in 1993). The company was founded by Jerry Rao and Jeroen Tas both former Citibank employees. Starting out as a BPO and application services outsourcer in the BFSI segment, it subsequently moved into telecom and health industries as well.
Its global character was evidenced by an Indian CEO, a Dutch president and more than a dozen subsidiaries in Europe, the US and Asia. It enhanced its technological capability through both domestic and overseas acquisition cum alliances based strategy, making it among the top software exporters of the country within a couple of years of coming into existence. It was acquired by software services firm EDS in 2006, which in turn was acquired by HP in 2008.
Moschip semiconductors
Founded in 1991, Moschip made its first acquisition in 2001. A firm with a geocentric orientation, its chips are designed in India, manufactured in Taiwan and sold through its offices in USA. The firm’s CEO K Ramchandra Reddy is an electronics engineer with a global vision acquired through both his education at Winconsin and work in Silicon Valley USA. A serial entrepreneur, Reddy has several start ups to his credit, besides having the credit for designing the world’s first DSP chip. He also has extensive experience in sub contracting and manufacture of semi conductors. The firm has a global presence in all the continents.
Vmoksha tecchnologies
Vmoksha Technologies is an IT services company headquartered in Bangalore, India as a private limited company. Since its inception in May 2001, Vmoksha has emerged as a key player in the global IT outsourcing space. Vmoksha currently has operations in the US, Europe and the Asia Pacific region (development centers in Bangalore and Singapore). It is the first company in the world to directly go for CMMI Level 5 assessment without being assessed at intermediate levels and the 16th IT company in the world to achieve CMMI Level 5. It is the second company in the world to be assessed for all the four

Sumati Varma
134
disciplines of CMMI – Software Engineering, System Engineering, Supplier Sourcing and Integrated Process and Product Development. The company was included among SMEs from India poised to succeed on account of the strong offshoring model and included among the top 100 outshorers of the world in terms of revenue.i1
4. Theoritical model development
The Born Global firm lies at the crossroads of International New Venture and entrepreneurship literature, with an early acknowledged link (Oviatt and McDougall 1994) and a more explicit ratification in recent years (Autio, 2005; Oviatt & McDougall, 2005; Zahra, 2005; Zahra & George, 2002).
Entrepreneurship research shows that the development of a new organization may be imprinted through ties and knowledge generated pre-founding (Shane, 2000) and the literature on International New Ventures (INV) posits that their early mobilization is facilitated by network relationships. This suggests a need to begin an understanding of networks at the pre-founding stage and not just at the internationalization and pre-internationalization stage, in order to gain an understanding of the dynamic processes, such as networks, associated with INV formation.
The basic purpose of this paper is to examine the role of networks as drivers in the emergence of the born global acquirers profiled in this paper. The theoretical foundations for hypothesis development are based on constructs from the Resource based View (RBV) (Penrose 1959; Barney 1991) and Institutional Theory (Hoskisson et al 2000; Scott, 1995).
Resource-based view
The Resource based view (RBV) of the firm (Penrose 1959; Barney 1991) emphasizes the role of hetrogenous capabilities as drivers of firm strategies. According to Barney (1991) the term “resource” covers “all assets, capabilities, organizational processes, firm attributes, information and knowledge controlled by a firm”. Organisational capability is a system of organizational routines that create firm specific and hard to imitate advantages. A firm’s organizational capability consists of (i) static capabilities to consistently outperform rivals at any given point in time and (ii) dynamic capabilities that enable a firm to improve its performance and outperform its rivals Penrose (1968), Nelson and Winter (1982), Teece (1997). Nelson and Winter (1982) explain that a firm’s capability development depends upon access to technological and organizational knowledge and conditioned by its past learning. These capabilities are heterogeneous, conditioned by local factors and difficult to imitate or replicate. The heterogeneity of firm capability and its stickiness are responsible for the diversity of firm strategy. Knight and Cavusgil (2004) argue that the ability of born global firms to succeed in foreign markets is largely a function of their internal capabilities (e.g., Wu et al. 2007). Evolutionary economics (Nelson and Winter 1980) elaborates on the superior ability of firms to develop particular organizational capabilities. According to this view, the superior ability of certain firms to create new knowledge leads to the development of organizational capabilities (Wu et al. 2007). There is growing evidence that competitive advantage often depends on the firm’s superior deployment of capabilities (Christensen and Overdorf 2000; Day 1994). From the RBV, this advantage may result from development of capabilities over an extended period of time that become embedded in a company and are difficult to trade. Alternatively, it may possess a capability that is
1 www.sharedexpertise.org
The Role of Networks in the Accelerated Internationalisation of Indian Firms
135
idiosyncratic to the firm (Dierickx and Cool 1989) or embedded in a firm’s culture (Barney 1991). Thus, based on the RBV, capabilities are often critical drivers of firm performance (Eisenhardt and Martin 2000; Makadok 2001; Teece et al. 1997).
Capability based resources are especially important for born globals, as they deal with diverse environments across numerous foreign markets (Luo 2000). Possession of such capabilities helps firms to attenuate their liabilities of foreignness and newness (Oviatt and McDougall 1994). The ability to consistently replicate the firm’s capabilities across numerous and varied markets produces value for born globals by supporting, especially, international expansion (Knight and Cavusgil 2004). Based on the above discussion, the RBV seems appropriate as the supporting theory to this study.
The conceptual framework developed above provides the starting point for the development of the basic hypotheses for this paper :
H1a. The appearance of a BGA depends on firm specific capabilities
The RBV of the firm (Grant 1996a; Penrose 1959; Rumelt 1984; Teece and Pisano, 1994; Wernerfelt, 1984) helps to explain, how in the context of an innovative culture, knowledge and resultant capabilities are developed and leveraged by enterprising firms. Differential endowment of resources is an important determinant of organisational capabilities and performance (Barney 1991; Grant 1996a; Teece and Pisano, 1994; Wernerfelt 1984). Foundational resources are particularly important in turbulent business environments, as they become the basis for stable strategy formulation (Grant, 1996a; Prahalad and Hamel, 1990). Knowledge is the most important resource, and the integration of individuals’ specialised knowledge is the essence of organisational capabilities (Conner and Prahalad, 1996; Dierieckx and Cool, 1989, Grant, 1996a; Leonard- Barton, 1992; Nelson and Winter, 1982; Solow 1957). In international business, knowledge provides particular advantages that facilitate foreign market entry and operations (Kogut and Zander 1993). The integration of specialist knowledge hinges on the nature and quality of the firm’s organisational routines, which involve conversion of especially tacit knowledge (Polanyi, 1996) into business activities that create value for customers. Tacit knowledge is embedded in individuals and cannot be expressed explicitly or codified in written form (Nonanka, 1994). We argue that smaller international firms such as born global firms may manifest specific resources that are instrumental to the conception and implementation of activities in international markets. Although these businesses tend to lack substantial financial and human resources, they may leverage a collection of more fundamental intangible resources that facilitate their international success. Peng (2001a) argues that the RBV can allow business to identify specific knowledge and capability as valuable, unique, and hard-to-imitate resources that separate winners from losers in global competition (Dev et al. 2002), allowing smaller firms to differentiate themselves and succeed abroad. The most important knowledge resources are unique, inimitable and immobile and vest in the individual entrepreneur.
H1b. The appearance of the BGA is driven by capabilities vested in the firm’s entrepreneur.
Institutional theory (Hoskisson et al., 2000; Scott, 1995) has been a useful tool for understanding phenomena related to emerging economies. Institutions are conceptualized as ‘the rules of the game in a society’ (North, 1990: p.3; Scott, 1995) and institutional transitions are defined (Peng, 2003, p.276) as the ‘fundamental and comprehensive changes introduced to the formal and informal rules of the game that affect organizations as players’. One of the defining features of emerging economies is the policy of

Sumati Varma
136
economic liberalization favored by their governments (Hoskisson et al., 2000, Wright et al., 2005). Economic liberalization is a unique and powerful environmental contingency faced by firms from these developing economies compared to firms from advanced nations, which have traditionally been more market-oriented. Firms in the countries undergoing economic liberalization face significantly different business environment characterized by increasing competition, changing regulations, increasingly demanding customers, emergence of new business opportunities, etc (Ray, 2003). The forces of economic liberalization acting on the firms from emerging economies are therefore equivalent to significant ‘institutional transitions’ (Peng, 2003) leading to a variety of strategic responses. Economic liberalization measures such as deregulation and privatization in hitherto protected economies such as India has been the source of both opportunities and threats. This may translate into a defensive strategic positioning aimed at protecting their position in the domestic market ( which precludes internationalization) or an assertive strategy aimed at leveraging new strategies through internationalization (Ray and Chitoor 2007).
H2a. Networking ties act as a catalyst for the appearance of a BGA.
In the emerging economy context the institutional dimension in the form of international networking capability is imperative for an understanding of internationalization activities Hitt et al (2002) and Wright et al (2005). It refers to the firm’s ability to obtain resources from the environment through alliance creation and social embeddedness to use in its activities in foreign markets (cf. Granovetter 1985; Gulati 1998). Networking is one of the major strategies pursued by entrepreneurial firms in order to gain access to resources and cope with environmental uncertainty and impediments in their operations (Alvarez and Barney 2001; Steensma et al. 2000).
According to Coviello and Cox (2006), “network” is a metaphor used to represent a set of connected actors. These actors may be either organizations or individuals, and the relationships that tie them together may take many forms such as those between customers, suppliers, service providers, or government agencies. Further, Kelley et al. (2009) described “networks” as containing sets of relationships linking finite numbers of members. They view networks as the avenue through which the diverse and situation-specific knowledge needs of an innovation project can be accessed across the organizational environment. Such networks contribute to the success of firms by helping to identify new market opportunities and contribute to building market knowledge (Chetty and Holm 2000; Coviello and Munro 1995). Based on previous literature, networks in this paper refer to organizational ties with customers, suppliers, service providers, or government agencies.
Concerning social resources, previous studies point out nearly consistently that there is a very close connection between the integration of a company or founders in formal and informal networks and internationalization speed (Linqvist, 1991; Coviello & Munro, 1995; McAuley, 1999; Schmidt-Buchholz, 2001; Mahnke & Venzin, 2003; Johnson, 2004). One reason could be that companies or founders with well developed networks are stimulated to a higher degree by their (potential) customers, suppliers or partners to internationalize (horizontal and vertical bandwagon and follower effect) (Crick & Jones, 2000). Due to scarce resources in the beginning, companies are often dependent on resources of their network partners to expand internationally (Oviatt & McDougall 1995). Besides, companies with a strong network integration can benefit from their experiences and gain relevant market knowledge as well as general knowledge about internationalization sooner than other companies (Reuber & Fischer, 1997). According to the Uppsala model, this has again a positive effect on internationalization speed and the degree of geographic expansion.
The Role of Networks in the Accelerated Internationalisation of Indian Firms
137
Moyi (2003 points to the growing interest in social relationships and its affect on the development of outcomes. Collier (1998) argues that social interaction generates three main externalities. These include knowledge about the behavior of other agents, knowledge about the nonbehavior (such as prices and technologies), and the benefits of collective action. A firm’s relationship capability affects enterprise performance directly since it generates information on technologies and markets (Zhou et al. 2007; Etemad and Lee 2003).
H2b. Integration of the company and its founders in formal and informal networks increases the probability of the appearance of a BGA.
According to the institutional economics perspective, the most significant role of networks in emerging economies is that it substitutes for external markets (Caves, 1989; Khanna and Palepu, 1997). The lack of an adequate legal framework and a stable political structure in emerging economies has resulted in the underdevelopment of strategic factor markets (Barney, 1986), which leads to difficulties in creating the competitive advantages necessary for international expansion. Networks substitute for the undeveloped external markets for product development, financial capital, and entrepreneurial and management know-how in emerging economies (Khanna and Palepu, 1997).
Institutional network ties refer to linkages with various domestic institutions such as government officials and agencies, banks and financial institutions, universities, and trade associations and provide critical advantages for firms in emerging economies. From the resource dependence perspective (Pfeffer and Salancik, 1978), institutional networks are the resources that firms depend on in order to be able to operate in a market.
Since prior government approval is very often necessary for establishing foreign venturesin countries like India and China institutional links are critical for a new venture’s formation. besides getting permission from the government, links with domestic trade associations and professional bodies can provide intelligence on different markets and access to those markets for international operations. Also, owing to the lack of credit history and the liability of foreignness, it is difficult or costly for emerging-market firms to secure financial support in the host countries. On the other hand, the banking systems in most emerging economies are relational in nature, and banks are willing to provide long-term loans. Hence links with domestic financial institutions are another valuable tie that firms need to obtain for successful international venturing.
Access to financial resources particularly loan capital and the possibility of additional partners are important initiating factors in the appearance of BGAs (Lindqvist (1991); Schmidt-Buchholz (2001); Gaba, Pan & Ungson (2002). It is contended that firms with access to financial resources coupled with a geocentric orientation are likely to make an early appearance on the global stage. In the emerging economy context this is linked to institutional changes which make access to capital easier and faster.
H2c. Access to institutional networks increases the probability of appearance of Born Global Acquirers.
Business network ties are linkages among parties in a business transaction such as suppliers and buyers, in formal or informal ways. Business network ties in the home environment helps to increase international venturing due to the advantages arising out of information amd experience of peers who have undertaken international venturing. The prior international experience of the founder or top management team
Sumati Varma
138
especially, brings in the benefits of business networks and has a positive effect on the appearance of BGFs (Lindqvist, 1991; Reuber & Fischer, 1997; Harveston, Kedia & Davis, 2000; Schmidt-Buchholz, 2001; Westhead, Wright & Ucbasaran, 2001; Gaba, Pan & Ungson, 2002; Rhee & Cheng, 2002; Mahnke & Venzin, 2003; Johnson, 2004). Prior experience manifests itself as foreign language competence (Schmidt-Buchholz, 2001), or a distinct international vision or geocentric mentality (Lindqvist, 1991; McKinsey & Co., 1993; Oviatt & McDougall, 1994, 1995; Kandasaami, 1998; Harveston, Kedia & Davis, 2000; Johnson, 2004). Entrepreneurial competencies acquired as a result of previous employment, technological expertise and existing networking links create an awareness of internationalisation opportunities in niche areas Keeble (1998).
H2d. A firm’s access to business networks is positively associated with the appearance of a Born global firm.
An organization has a certain mix of organizational learning capabilities (OLC) and may evolve to certain generic capabilities (Bhatnagar 2006). OLC has been defined as formal and informal processes and structures in place for the acquisition, sharing, and utilizing of knowledge and skills in an organization (Dibella et al. 1996); as capabilities for self-reflecting and planning and environmental scanning to disseminate and share information to act and experiment (Shukla 1995); and as dynamic capabilities that integrate/build/reconfigure competences to address rapidly changing environments (García-Morales et al. 2006). Based on these previous researches, we define international learning capability as a firm’s ability to actively acquire, share, and utilize to its advantage, intelligence to plan and disseminate information in order to address rapidly changing environments on foreign market in this study.
Existing literature indicates that organizational learning forms a key dimension of organizational culture in the organization theory literature (Brown 1998; Moorman 1995). Bertels and Savage (1999) stress the significance of organizational learning in keeping up with market needs. The adaptive firm would foster learning norms that strengthen its ability to expand in foreign markets (Kitchell 1995). Compared with traditional firms, born global firms may be characterized by their ability to overcome learning impediments that hamper the ability to adapt to and grow in new environments (Autio et al. 2000). Also, when the firm seeks to foster entrepreneurship as it expands worldwide, it has to maximize the knowledge flows and learning across its different countries (Zahra et al. 2000, 2001; Ireland et al. 2001). In the context of countries like India the National Innovation System plays a significant role in skill formation and organizational learning through inter-organisational learning networks as well as through the interaction of industry and technical institutes and colleges of higher learning.
H2e. The emergence of the Born Global Acquirer is facilitated by organisational learning which is the result of institutional and policy changes and the emergence of the National Innovation System.
5. Analysis and discussion
This paper has focused on international venturing in the form of a firm’s commitment to create new business in a foreign location – by firms from emerging economies. Based on the understanding that international expansion from emerging economies cannot be adequately explained by traditional frameworks it profiled the role of networks as drivers of accelerated internationalisation. The focus of the study are five firms from the IT industry, christened Born Global Acquirers, who made a series of acquisitions within a few years of coming into existence, helped by a geocentric orientation that helped
The Role of Networks in the Accelerated Internationalisation of Indian Firms
139
them consider the global market as their natural home, driven by personal characteristics of their entrepreneur and facilitated by links to various networks.
The findings of the study highlight the entrepreneurial characteristics of top management as essential drivers of five young firms which have made global acquisitions within a few years of incorporation. The firms profiled here belong to the IT industry which is the most globalised and internationalised sectors of the Indian economy. The industry has rapidly moved up the value chain from bodyshoppers to customised product development (Parthasarthy 2004), Bhatnagar (2006), assisted by government policy which focused on investment in technical education leading to the development of a pool of English speaking trained manpower suitable for low cost programming and software development services.
The story of the IT industry’s outward orientation began with the establishment of linkages through exports. Starting merely as providers of manpower, initially to be expatriated to firms elsewhere, time and cost arbitrage ensured that the IT industry were to become off-shore centres where efficiency mattered. And subsequently it grew vertically toward product development. The firms enriched in cash by providing manpower and in-sourcing found in customer acquisition the sustainability of revenues and profitability; while other players relied on the acquisition of products to move in the hierarchy of capability maturity. The linkages developed by Indian professionals in Silicon Valley in the initial phase of the growth of the industry based on personal networks and valuable reputations established the basis of further development of the industry and the facilitation of acquisitions in later years (Bhatnagar 2006).
Institutional policy as a result of liberalization of the domestic economy including the establishment of software technology parks, the benefits of spatial agglomeration, public private partnerships and government diaspora relationships also facilitated the growth of the industry and its aggressive venturing into global markets. The 1980s witnessed the earliest cautious efforts to liberalize private investment and trade (Sridharan, 1996), leading to the enactment of policies aimed at ensuring India’s inclusion in the global software boom. Using a “flood in flood out” feature which led to the growth of “thousands of small software companies in the country….increasing export as well as local development” (Dataquest, 1987:87) marked the beginning of networks of learning for the industry, which were later enhanced into personal networks of valuable reputations based on quality and productivity and got utilized for aggressive outward venturing.
The acquisition experience of these firms has been the result of innovation springing from internal R&D drawn from its own accumulated knowledge of the IT industry and domain experience gathered elsewhere. The linkages developed by entrepreneurs through prior experience in the IT industry and other domains enabled them to take the decision to acquire, facilitating leapfrogging and spring-boarding behaviour to be able to leverage their resources for acquisition purposes in the global market.
All firms profiled in the study have been led by individuals with prior international experience of both the IT industry and also other domains, using opportunities in prior networks and the tacit knowledge vested in these leaders for rapid internationalization. This is consistent with Keeble et al (1998) that competencies embodied in the founder/entrepreneur often relate to “a new and specialised technological niche which provides the opportunity for internationalisation.” These competencies are derived from previous employment, prior networks and technological expertise which makes them aware of new international opportunities that others remain unaware of.

Sumati Varma
140
As regulations relating to overseas investment were eased in the 1990s in the current phase of liberalisation, it paved the way for all modes of international ventures (Nayyar 2008). Simpler rules and easier access to money, thus created a conducive environment in India for shopping overseas. Post liberalization, many Indian firms became more profitable as a result of an ever-booming economy and could access significantly more capital than in the past. A significant factor explaining acquisition activity therefore was the cash availability in the Indian market since many companies were under leveraged and did not have much debt. This enhanced their borrowing capacity through links to institutional networks which could be deployed for acquisitions.
6. Conclusion
This paper has focused on the role of networks as drivers of a specific kind of BGF – the Born Global Acquirer in the Indian context, as a pioneering study. Born Globals reflect an emerging breed of firms typifying the process of accelerated internationalization in the global economy. Driven by personal characteristics of their entrepreneurs and linkages to business and institutional networks the born-global acquirer as a phenomenon is indicative of the emergence of an international exchange system in which any firm, regardless of age, experience, and tangible resources, can be an active international business participant. In relative terms, Born Globals might be seen to herald a more diverse international business system in which any firm with an entrepreneurial orientation and network linkages can succeed internationally. Future research should aim at deepening our understanding of early adopters of internationalization, which represent a widespread, ongoing trend.
Being a pioneering study, the value of the present research lies in its exploration of hitherto uncharted territory. It has focused on international ventures with a deeper commitment than is normally considered in the literature on Born Globals which has usually studied exporting firms under the categorization considered here.
However, greater research effort is required to test the theoretical constructs developed here on a larger data base including born global firms from other industries and also in a cross-country comparative manner. In course of time as emerging markets mature the effect of these network ties may gradually decline. Further studies with longitudinal data may therefore be called for.
References Andersson, S. and Wictor, I. (2003) ‘innovative internationalization in new firms: born globals – the Swedish case’,
Journal of International Entrepreneurship 1(3): 249–276.
Arenius, P.M. (2002) Creation of Firm-Level Social Capital, Its Exploitation and the Process of Early Internationalization, Helsinki University of Technology: Helsinki.
Autio, A. (2005) ‘Creative tension: the significance of Ben Oviatt’s and Patricia McDougall’s article ‘‘Toward a Theory of International New Ventures’’, Journal of International Business Studies 36(1): 9–19.
Alvarez SA, Barney JB (2001) How entrepreneurial firms can benefit from alliances with large partners. Academy of Management Executive 15(1):139–148
Autio E, Sapienza HJ, Almeida JG (2000) Effects of age at entry, knowledge intensity, and imitability on international growth. Acad Manage J 43:909–924

The Role of Networks in the Accelerated Internationalisation of Indian Firms
141
Banerji, K and Sambharya, R.B (1996) “Vertical Kieretsu and International Market Entry : The case of the Japanese
Automobile Ancillary Industry, Journal of International Business Studies, 27 (1):89 -113.
Barney, J. (1991) Firm resources and sustained competitive advantage. Journal of Management, 17(1): 99-120.
Bartlett, C.A., & Ghoshal, S. (1998). Creation, Adoption and diffusion of Innovations by Subsidiaries of Multinational Corporations” Journal of International Business Studies 19(3): 365-388.
Bertels T, Savage CM (1999) A research agenda for the knowledge era: the tough questions. Knowledge Process Management 6:205–212
Bhatnagar, S (2006) India’s Software Industry, in Vandana Chandra (ed) How Some Countries Got it Right, 95 – 124,World Bank, Washington DC.
Brouthers, E.L., O’Donnell, E. and Hadjimarcou, J. (2005) ‘Generic product strategy for emerging market exports into Triad nation markets: a mimetic isomorphism approach’, Journal of Management Studies 42(1): 225–245.
Brown A (1998) Organizational culture. Financial Times-Pitman, London
Chacar, A., Vissa, B. 2005. Are Emerging Economies Less Efficient? Performance Persistence and the Impact of Business Group Affiliation. Strategic Management Journal 26(10) 933-946.
Chetty S, Holm DB (2000) Internationalization of small to medium-sized manufacturing firms: a network approach. International Business Review 9:77
Chetty, S.K. and Wilson, H.I.M. (2003) ‘Collaborating with competitors to acquire resources’, International Business Review 12(1): 61–81.
Child, J. and S. B. Rodrigues (2005). "The internationalisation of Chinese firms: A case for theoretical extensions." Management and Organisation Review 1(3): 381-410.
Christensen CM, Overdorf M (2000) Fitting the tool to the task. Harvard Business Review 78:75 (cover story)
Chetty, S and Erikkson K (2002) “Mutual commitment and experiental knowledge in mature international business relationships” International Business Review 11(3) :305 -324.
Collier P (1998) Social capital and poverty, social capital initiative, working paper no. 4. World Bank,Washington.
Conner, K and Prahalad CK, 1996 A resource based theory of the firm : Knowledge versus opportunism, Organisation Science 7(5): 477-501.
Coviello N, Cox M (2006) The resource dynamics of international new venture networks. Journal of International Entrepreneurship 4:113–132
Coviello, N.E., & Munro, H.J. (1995) Growing the entrepreneurial firm. European Journal of Marketing, 29(7): 49-61.
Crick, D., & Jones, M.V. (2000) Small high-technology firms and international hightechnology markets. Journal of International Marketing, 8(2): 63-85.
Dataquest (1987) The new Software Policy: Dr Seshagiri clarifies. January, 82 –95.
Dev CS, Erramilli MK, Agarwal S (2002) Brands across borders: determining factors in choosing franchising or management contracts for entering international markets. Cornell Hotel Restaurant Adminstrative Quarterly 43(6):91–104
DiBella AJ, Nevis EC, Gould JM (1996) Understanding organizational learning capability. Journal of Management Studies 33:361–379
Sumati Varma
142
Dierickx I, Cool K (1989) Asset stock accumulation and sustainability of competitive advantage. Management
Science 35:1504–1511
Eisenhardt K.M (1989) Building Theories from Case Studies Research. Academy of Management Review. 14(4): 532-550.
Eisenhardt K.M (1991) better Stories and Better Constructs _ The case for Rigor and Comparitive Logic. Academy of Management Review 16(3): 620-627.
Elango, B and Chinmay Pattnaik (2007) Building Capabilities for international Operations through Networks: a Study of Indian Firms, Journal of International Business Studies, 38, 541-555.
Ellis, P. (2000) ‘Social ties and Foreign market entry’, Journal of International Business Studies 31(3): 443–469.
Ellis, P. and Pecotich, A. (2001) ‘Social factors influencing export initiation in small and medium-sized enterprises’, Journal of Marketing Research 38(1): 119–130.
Etemad H, Lee Y (2003) The knowledge network of international entrepreneurship: theory and evidence. Small Business Economics 20:5
Gaba, V., Pan, Y., & Ungson, G.R. (2002) Timing of entry in international market: An empirical study of U.S. Fortune 500 firms in China. Journal of International Business Studies, 33(1): 39-55.
García-Morales VJ, Llorens-Montes FJ, Verdú-Jover AJ (2006) Antecedents and consequences of organizational innovation and organizational learning in entrepreneurship. International Management Data Systems 106 (1):21–42
Grant RM (1996) Prospering in dynamically-competitive environments: organizational capability as knowledge integration. Organisation Science 7:375–387
Granovetter M (1985) Economic action and social structure: the problem of embeddedness. American Journal of Sociology 91:481–510.
Gulati R (1998) Alliances and networks. Strategic Managemant Journal 19:293–317
Harris, S. and Wheeler, C. (2005) ‘Entrepreneurs’ relationships for internationalization: functions, origins and strategies’, International Business Review 14(2): 187–207.
Harveston, P.D., Kedia, B.L., & Davis, P.S. (2000) Internationalization of born global and gradual globalizing firms: The impact of the manager. Advances in Competitive Research, 8(1): 92-99.
Hofstede, G. (2001). Culture’s consequences. Thousand Oaks-London-New Delhi: Sage Publications.
Holm, D B, Erikkson K, amd Johanson, J (1999) “Creating value through mutual commitment to business network relationships”, Strategic management Journal 20(5):467 -486.
Hoskisson, R., Eden, L., Lau, C-M., Wright, M. 2000. Strategy in emerging economies. Academy of Management Journal, (43),s 249–67.
Ireland RD, Hitt MA, Sexton DL (2001) Integrating entrepreneurship and strategy management actions to create firm wealth. Academy of Management Executive 15(1):49–63
Johanson, J and Mattson L G (1988) “Industrialisation in Industrial Systems: A Network Approach”, in N Hood and J-E Vahnlne (ed) Strategies in Global Competition, Anthony Rowe London, pp 287 -314.
Johnson, J.E. (2004) Factors influencing the early internationalization of high technology start-ups: US and UK evidence. Journal of International Entrepreneurship, 2(1- 2): 139-154.
Kandasaami, S. (1998) Internationalisation of small- and medium-sized born global firms: A conceptual model, Research paper, Graduate School of Management, University of Western Australia, 1998.
The Role of Networks in the Accelerated Internationalisation of Indian Firms
143
Kandasaami, S., & Huang, X. (2000) International marketing strategy of SMEs: A comparison of born-global vs non
born-global firms in Australia, Paper presented at the ICSB Conference, Brisbane, June 2000.
Keeble, D, C Lawson, H Lawton Smith, B Moore and F Wilkinson (1998) Internationalisation Processes, Networking and local embeddedness in technology intensive small firms, Small Business Economics, 11,327 –342.
Kitchell S (1995) Corporate culture, environmental adaptation, and innovation adoption: a qualitative/quantitative approach. Journal of Academy Marketing Science 23:195–206
Khanna, T. and Palepu, K. (1997) ‘Why focused strategies may be wrong for emerging markets’, Harvard Business Review 75(4): 41–51.
Khanna, T., Palepu, K. 2000b. The future of business groups in emerging markets: Long run evidence from Chile, Academy of Management Journal, 433 268–285.
Khanna, T., Rivkin, J. (2001) Estimating the performance effects of business groups in emerging markets, Strategic Management Journal, 22 45–74.
Knight, G.A., & Cavusgil, S.T. (1996). The born global firm: A challenge to traditional internationalization theory. Pp. 11-26 in T.K. Madsen (Eds.), Advances in International Marketing, Vol. 8. Amsterdam: JAI Press.
Knight, G.A., & Cavusgil, S.T. (2004) Innovation, Organisational Capabilities and the Born Global Firm, Journal Of International Business Studies, 35 (2), 124 –141.
Kogut , B and Zander, U (1993) Knowledge of the firm and the evolutionary theory of the multinational corporation, Journal of International Business Studies 24(4): 625 – 645.
Kumar, K. and M. G. McLeod, Eds. (1981). Multinationals from developing countries. Lexington, M.A, Lexington Books.
La Porta R, Lopez-de-Silanes, F Shleifer A, andVishny R (1998) “Law and Finance”, Journal of Political Economy 106 (6) : 1113 -1155.
Lall, S. (1983). The new multinationals: The spread of third world enterprises. Chichester, Wiley.
Leonard-Barton D, 1992 Core capabilities and core rigidities: a pardox in managing new product development, Strategic Management Journal 13: 111 – 126
Lee, Ji-Ren and Chen, Jen-Shyang. 2003. Internationalization, local adaptation, and subsidiary's entrepreneurship: an exploratory study on Taiwanese manufacturing firms in Indonesia and Malaysia. Asia Pacific Journal of Management. 20(1): 51-72.
Lindqvist, M. (1991) Infant multinationals: The internationalization of young, technology based Swedish firms. Dissertation, Stockholm School of Economics, Institute of International Business.
Lummaa, H.J. (2002). Internationalization behavior of Finnish born global companies, Master Thesis, Helsinki University of Technology.
Luo,Y (2000) “Dynamic Capabilities in International Expansion”, Journal of World Business 35(4):355-378.
Madhok, A (1997) ‘Cost, Value and Foreign Market Entry Mode: the transaction and the firm”, Strategic Management Journal 18(1):39-61.
Madsen, T.K., Rasmussen, E., & Servais, P. (2000). Differences and similarities between born globals and other types of exporters. Pp. 247-265 in A. Yaprak & H. Tütek, (Eds.), Globalization, the multinational firm, and emerging economies. Amsterdam et al.: JAI Press.

Sumati Varma
144
Makadok R (2001) Toward a synthesis of the resource-based and dynamic-capability views of rent creation.
Strategic Management Journal 22:387
Mahnke, V., & Venzin, M. (2003) The Internationlization process of digital information good providers. Management International Review, 1(Special Issue): 115-142.
Makino,S, Lau, C.M, and Yeh, R.S (2002) “Asset Exploitation vs Asset seeking: Implications for location choice of foreign Direct Investment from Newly Industrialised Economies”, Journal of international Business Studies, 33(3): 403-421
Mathews, J. A. (2002). "Competitive advantages of the latecomer firm: A resource based account of industrial catch-up strategies." Asia Pacific Journal of Management 19: 467-488.
McAuley, A. (1999) Entrepreneurial instant exporters in the Scottish arts and crafts sector. Journal of International Marketing, 7(4): 67-82.
McKinsey & Co. (1993). Emerging exporters: Australia’s high value-added manufacturing exporters. Melbourne: Australian Manufacturing Council.
McNaughton, R.B. (2000) Determinants of time-span to foreign market entry. Journal of Euromarketing, 9(2): 99-112.
Melin, L. (1992) Internationalization as a strategic process. Strategic Management Journal, 13(8, Special Issue): 99-118.
MilesM.B and Huberman A.M. (1994) Qualitative Data Analysis : An Expanded Sourcebook. Sage: Thousand Oaks, SA.
Moorman C (1995) Organizational market information processes. Cultural antecedents and new product outcomes. Journal of Marketing Research 32:318–336
Moyi ED (2003) Networks, information and small enterprises: new technologies and the ambiguity of empowerment. Information Technology Development 10:221–232
Nayyar D (2008) Internationalisation of Firms from India : Investment, Mergers and Acqusiitions, in Trade and Globalisation, Oxford University Press, New Delhi.
Nelson, R and Winter, S (1982), An Evolutionary theory of Economic change. Harvard University Press, Cambridge Massachusetts.
Nonaka, I. (1991) ‘The knowledge-creating company’, Harvard Business Review 69(6): 96–109.
North, D (1990) Institutions, Institutional change and Economic Performance, Cambridge: Cambridge University Press.
Oviatt, B.M., & McDougall, P.P. (1994) Toward a theory of international new ventures. Journal of International Business Studies, 25(1): 45-64.
Oviatt, B.M., & McDougall, P.P. (1995) Global start-ups: entrepreneurs on a worldwide stage. Academy of Management Executive, 9(2): 30-43.
Oviatt, B.M. and McDougall, P.P. (2005) ‘Defining international entrepreneurship and modelling the speed of internationalization’, Entrepreneurship Theory and Practice 29(5): 537–553.
Parthasarthy, Balaji (2004) India’s Silicon valley or Silicon Valley’s India? Socially Embedding the Computer Software Industry in Bangalore. International Journal of Urban and Regional Research. 28.3, 664-685.

The Role of Networks in the Accelerated Internationalisation of Indian Firms
145
Peng, M.W. 1997. Firm growth in transitional economies: three longitudinal cases from China, 1989-96.
Organization Studies. 18 (3): 385-413.
Peng, M.W. 2003. Institutional transitions and strategic choices. Academy of. Management Review. (28), 275–96.
Penrose, E. (1959). The theory of the growth of the firm. Oxford: Oxford University Press.
Pfeffer, J. and Salancik, G.R. (1978) The External Control of Organizations: A Resource Dependence Perspective, Harper & Row: New York.
Polanyi M, 1966 The Tacit Dimension, Routledge and Kegan Paul : London.
Pradhan J.P (2007) Growth of Indian Multinationals in the World Economy :Implications for Development, ISID WP no 2007/04, Institute for Studies in Industrial Development, New Delhi.
Pradhan J.P (2007b), National Innovation System and the Emergence of Indian Information and Software Technology Multinationals, ISID WP no 2007/09, Institute for Studies in Industrial Development, New Delhi.
Prahalad C.K and Gary Hamel, 1990 The core competence of the corporation, Harvard Business Review 68 (3): 79 -91.
Ray and Chitoor (2007) ‘Internationalisation as a strategic response to Institutional Transition: Evidence form the Indian Pharmaceutical Industry’, WPS 608/2007, IIM Kolkatta.
Ray, S. (2003). Strategic adaptation of firms during economic liberalization: Emerging issues and a research agenda. International Journal of Management, 20(3) 271-281.
Rennie, M.W. (1993) Global competitiveness: Born global. The McKinsey Quarterly, 3: 45-52.
Reuber, A.R., & Fischer, E. (1997) The influence of the management team’s international experience on the internationalization behaviors of SMEs. Journal of International Business Studies, 28(4): 807-825.
Rhee, J.H., & Cheng, J.L.C. (2002) Foreign market uncertainty and incremental international expansion: The moderating effect of firm, industry, and host country factors. Management International Review, 42(4): 419-439.
Scott W.R (1995). Institutions and Organisations, Sage, thousand Oaks.
Schmid, S., & Schmidt-Buchholz, A. (2002). Born globals: What drives rapid and early internationalisation of small and mediumsized firms form the software and internet industry? Pp. 44-63 in J. Larimo (Eds.), Current European research in international business. Vaasa: University of Vaasa.
Shane, S. (2000) ‘Prior knowledge and the discovery of entrepreneurial opportunities’, Organization Science 11(4): 448–469.
Sharma, D.D. and Blomstermo, A. (2003) ‘The internationalization process of born globals: a network view’, International Business Review 12(6): 739–753.
Shukla M (1995) The learning edge: building capabilities for corporate performance. In: Akhilesh KB, Prasad L, Singh P (eds) Evolving performing organizational through people. New Age International, New Delhi
Solow R.M, 1957 Technical change and the aggregate production function, The Review of Economics and Statistics 39 ( February) : 312 – 320.
Stray, S., & Bridgewater, S., & Murray, G. (2001) The internationalization process of small, technology-based firms: Market selection, mode choice and degree of internationalization. Journal of Global Marketing, 25(1): 7-29.
Sridharan, E (1996) The Political Economy of Industrial Promotion: Indian Brazilian and Korean Electronics in a Comparitive Perspective 1969 –1994. Praeger, London.

Sumati Varma
146
Steensma HK, Marino L, Weaver KM, Dickson PH (2000) The influence of national culture on the formation of
technology alliances by entrepreneurial firms. Academy of Management Journal 43:951–973
Teece DJ, Pisano G, Shuen A (1997) Dynamic capabilities and strategic management. Strateg Manage J 18:509–533
Varma, Sumati. (2009). International Venturing by IT Firms: A motive analysis. Journal Of Emerging Knowledge On Emerging Markets, 1(1). http://www.icainstitute.org/ojs/index.php/working_papers/article/view/24/11.
Varma, Sumati (2010) Born Global Acquirers from Indian IT – an Exploratory Case Study, forthcoming in International Journal of Emerging Markets, Emerald Publications.
Vernon-Wortzel, H. and Wortzel, L.H. (1988) ‘Globalizing strategies for multinationals from developing countries’, Columbia Journal of World Business 23(1): 27–35.
Welch, D.E and Welch L.S (1996) “The internationalisation process and Networks: A Strategic Management Perspective”, Journal of International Marketing, 4(3) 11-28.
Wells, L. T. 1983. Third world multinationals: The rise of foreign investment from developing countries. Cambridge, MA: The MIT Press.
Wernerfelt B (1984) A resource-based view of the firm. Strateg Manage J 5:171–180
Westhead, P., Wright, M., & Ucbasaran, D. (2001) The Internationalization of new and small firms: A resource-based view. Journal of Business Venturing, 16(4): 333-358.
Wright, M., Filatotchev, I., Hoskisson, R.E., Peng, M. 2005. Strategy research in emerging economies: Challenging the conventional wisdom. Journal of Management Studies 42(1) 1-33.
Wu F, Sinkovics RR, Cavusgil ST, Roath AS (2007) Overcoming export manufacturers’ dilemma in international expansion. Journal of International Business Studies 38:283–302
Yin (1991) Case Study Method
Yli-Renko, H., Autio, E., & Tomtit, V. (2002). Social capital, knowledge and the international growth of technology-based new firms. International Business Review, 11, 279–304.
Zahra, S.A. (2005) ‘A theory of international new ventures: a decade of research’, Journal of International Business Studies 36(1): 20–28.
Zahra, S. and George, G. (2002) ‘International entrepreneurship: the current status of the field and future research agenda’, in M. Hitt, D. Ireland, D. Sexton and M. Camp (eds.) Strategic Entrepreneurship: Creating an Integrated Mindset, Blackwell: Oxford, pp: 255–288.
Zahra SA, Ireland RD, Hitt MA (2000) International expansion by new venture firms: international diversity, mode of market entry, technological learning and performance. Academy of Management Journal 43:925–950.
Zahra SA, George G, Dharwadkar R (2001) Entrepreneurship in the multinational corporation: the effects of corporate and local contexts. In: Academy of Management Proceedings, pp G1–G6
Zhang Man & Patriya Tansuhaj & James McCullough (2009) International entrepreneurial capability: The measurement and a comparison between born global firms and traditional exporters in China, Journal of International Entrepreneurship 7:292–322.
Zhou L, Wu WP, Luo X (2007) Internationalization and the performance of born-global SMEs: the mediating role of social networks. Journal of International Business Studies 38:673–690

The Role of Networks in the Accelerated Internationalisation of Indian Firms
147
About the Author
Dr. Sumati Varma is an Associate Professor at the Department of Commerce at Delhi University. Her teaching and research interests are in the areas of firm internationalization, born globals, entrepreneurship and globalization and inclusion. She is the author of two books and various papers in reputed national and international journals as well as presentations in conferences. She is a consultant for the pioneering American Studies program in India being launched by the American Centre for various Indian universities, consultant and author for the National Council for Educational Research and Training (NCERT) a nodal agency for curriculum development for Indian schools, and for various e-learning programmes at the Institute for Lifelong Learning, Delhi University.
Contact Information
Dr. Sumati Varma, Associate Professor, Department of Commerce, Sri Aurobindo College (Eve), Delhi University. Mailing Address: X-006 Regency Park 2, DLF Phase 4, Gurgaon – 122002, Tel: 0124-4042306, 981 186 7951, Email: [email protected].

Transnational Corporations Review Volume 3, Number 2 June 2011 www.tnc-online.net, [email protected], DOI:10.5148/tncr.2011.1121 148-163
148
Analysis of Cross-border and Domestic M&A Deals in Technology
Sector in India and China
Arindam Das and Sheeba Kapil
Abstract: This paper contrasts and compares the M&A activities involving Indian and Chinese firms in the technology sector. The empirical analysis covered more than 2400 M&A transactions that involved Indian and Chinese companies (i.e., either the acquirer or target is Indian or Chinese) that have taken place in past 11 years. Chi-Square tests are applied on the deal type to see how the deals vary between cross-border and domestic deals. It is found that the proportions of deal volume in inbound, outbound and domestic space do vary significantly between these two countries. It is also found that deal types of M&A transactions vary for inbound and domestic space but for the outbound deals, the acquirers from both the countries follow similar pattern. The results provide some unexplored insights to the fundamental patterns in the growing volume M&A transactions taking place in these two countries. Keywords: Merger & acquisition (M&A), deal type, cross-border, FDI, semiglobalization 1. Introduction A company has several options to choose from when it comes to growth strategies. While organic growth is often a slow process, M&As and its variations (strategic alliances, joint ventures, franchising etc.) can catapult a company on fast track. The most common motives for M&A are to create synergy, diversification, improved management, market power, gain access to competence and resources as well as tax motives (Mukherjee et al., 2004). M&As have been around for more than 100 years and have experienced waves of popularity. Since the last decade of 19th century until the first decade of 21st century, there have been six distinct merger waves in the US (Lipton, 2006). M&As have also become increasingly international over time which perhaps is attributable to some major economic forces that have come into play in past two decades, such as the European Union’s single market, the globalization of the marketplace, increasing global competition and liberalization of closed economies. Many companies have realized that they need to go global to maintain the competitive edge. Another important point that has had an impact is that barriers to trade and investment have been reduced. M&A activities in sectors like technology sector remained remarkably active through the recent “credit crunch”, depressed stock markets and the economic gloom. According to industry reports on M&A in different sectors, though the global volumes of M&A in technology sector declined by 20% to 570 deal completions in 2008 from the post-bubble peak of 713 in 2007, the overall transaction activity across the year remained high. However, in the telecom space the lack of liquidity resulted in a sharper drop in 2008. The largest deal in 2008 in technology sector consisted of HP acquiring EDS at an approximate value of 8 billion Euros and the largest deal in the telecom sector was Serafina Holdings of UK buying Intelsat, a satellite communications company at 11 billion Euros (PricewaterhouseCoopers, 2009). Such large deals and a significantly high number of deals in these areas deserve analysis of sectoral patterns and trends.

Analysis of Cross-border and Domestic M&A Deals in Technology Sector in India and China
149
With the peak volume of 5.6 trillion USD for 76,494 deals in 2007, the global M&A story is just not about numbers but it has its fair share of challenges. M&As over the decades have seen issues right from carrying out due diligence (strategic, financial and legal) to post-acquisition integration. Cross-border M&As tend to become more complex exercises due to possible lack of familiarity to the operating environment, market, legal framework and culture. Nonetheless, the trends show that cross-border M&As are becoming increasingly visible not only in the developed economies but also in emerging economies. Indian and Chinese markets were slow in cross-border acquisitions in the past but in the past decade there have been many M&A activities involving these markets. While on one side these organizations are acquiring companies outside their home countries, a significant number of TNCs from developed economies are acquiring or buying stakes in companies from these two countries. The total volume and the presence of bi-directional forces in this space necessitate investigation on strategic motives behind these transactions and contrast them to domestic M&As. This analysis specifically investigates deal attributes in M&A transactions that involve Indian and Chinese companies – either as acquirers or as targets, in the technology sector. For the purpose of this study, technology sector is defined as the collection of industry segments with NAICS (North American Industry Classification System) codes of 334 (Computer and Electronic Manufacturing), 51 (Information, which includes IT, Telecom and Media) and 54 (Professional, Scientific and Technical Services). The primary reason for choosing technology sector as the focus area for this study is the high volume of investments that has taken place in this area in these two emerging economies, either as foreign direct investment or as domestic investment. 2. Literature review Significant volume of work on a wide range of perspectives has been carried out on M&A as a strategic option for organizations. While the financial scholars primarily focused on the issue whether acquisitions created wealth or not, strategic management research focused on identification of strategic factors that may explain performance variance between acquisitions. The researchers from process and organizational behavior angle focused on integration process and cultural dynamics (Cartwright and Schoenberg, 2006). In addition, in past two decades a lot of work has also been carried out on the motivation behind and performance of cross—border acquisitions. We restrict our literature review to acquisition strategies, characteristics of cross-border acquisitions and the country-specific studies on India and China. In an early study Hopkins (1987) looked at different acquisition strategies, viz., technology-related strategies, marketing-related strategies, conglomerate strategies, and found that these strategies on a stand-alone basis do not improve long-term market position of the acquiring firms. Though some subsequent studies corroborated his findings, the volume of M&A transactions in the developed economies as well as developing economies continue to rise over the decades. Agami (2001) explored some fundamental questions in cross-border acquisitions like whether the acquiring company had a vision behind buying a target company, strategies and plans to integrate the operations, a case to convince the stakeholders about the synergy and value creation. He developed a framework for merger strategy that can minimize failures. He took a real merger case to illustrate the process. Seth, Song and Pettit (2002) explored alternative reasons for why cross-border acquisitions might create value or destroy value. They found that there was evidence of multiple motives in cross-border acquisitions: synergy, managerialism, and hubris. Norback
Arindam Das and Sheeba Kapil
150
and Persson (2008) showed that cross-border acquisitions and greenfield investment by TNCs into developing countries played an important role for the future profits of these firms. They showed that in markets where entry took places through the acquisition of sufficiently scarce domestic assets, the bidding competition over the domestic target firm was so severe that the TNCs’ profit would be higher if this opportunity did not arise. They also explored the situations when acquisition entry might be more risky than greenfield entry due to market risks. Alliances and other forms of non-equity joint ventures have been an alternative to acquisition for years, especially in the technology sector as they extend innovation capabilities of the firm. Hagedoorn and Duysters (2002) found that high-tech sectors had preferences for alliances whereas low-tech sectors had preferences for M&A. They also found that for core businesses organizations preferred M&A but for non-core activities organizations looked at alliances. Lundan and Hagedoorn (2001) assessed the performance implications of international expansion via alliances and mergers and their relationship to asset-augmenting FDI. They looked at growth of cross-border acquisitions and alliances as modalities of international expansion from OLI paradigm (O-Ownership, L- Location and I-Internalization). They suggested that a progression from domestic mergers to initial foreign production via green-field investment, to be followed by joint ventures and minority investments, and culminating in knowledge-seeking mergers and strategic alliances. This dynamic progression in strategy could be possible by the increasing the convergence of the underlying knowledge-based assets, enabling firms ultimately to undertake cross-border cooperative activity either in the form of mergers, minority ownership or through strategic alliances. FDI policies and other macro-economic factors are expected to play a critical role in inbound transaction decisions. Sethi et al. (2003) used macro-economic and firm strategy factors together to explain the changing trends of US FDI flow, a significant amount of which were getting diverted from Western Europe to emerging economies. Liberalization of Asian economies and improvement in infrastructure had facilitated a shift in US FDI that sought out cost efficiency of these new economies. However, FDI policies alone cannot decide on acquisition/greenfield strategy and companies typically have identified three determinants for FDI entry mode: (a) resources owned by investors, (b) resources specific to host firms and (c) risks derived from international market (Cheng, 2006). He proposed a conceptual framework of brownfield strategy, a compromise between acquisition and greenfield investment. Bertrand and Zitouna (2006) examined the response of domestic and foreign firms with different technology levels at different levels of trade liberalization. They found that trade liberalization affected M&A incentives in a non-linear fashion. If the level of liberalization was low the incentive to merge was for companies with high technology gap. As the level of liberalization increased the incentive increased and thereafter decreased again in a highly liberalized environment. With the value of domestic and cross-border transactions being nearly same in recent years, a question naturally comes if both these transactions are equally value-creating, other factors being equal. Nocke and Yeaple (2006) empirically established that in industries in which the source of firm heterogeneity was due to internationally mobile factors, foreign acquisitions led to substantial improvement in the post-acquisition performance than domestic acquisitions. In addition, in industries in which the source of firm

Analysis of Cross-border and Domestic M&A Deals in Technology Sector in India and China
151
heterogeneity was not internationally mobile, foreign acquisitions led to a less dramatic improvement in post-acquisition performance than domestic acquisitions. Ghemawat (2003) reviewed the economic evidence about the cross-border integration of markets of different types. He looked at the cross-border integration of product markets, and markets for various types of resource or factor - capital, labor, and knowledge. He postulated the phenomenon of “semiglobalization”, which was different from the extremes of total insulation and total cross-border integration because it involved situations in which the barriers to market integration at borders were high, but not high enough to insulate countries completely from each other. Semiglobalization also indicated the critical role that location-specificity and residual barriers played in the context of international business strategy. 2.1 Cross-border M&A studies on Indian market In the Indian context, Kumar (2000) studied cross-border M&A activities in India in the 1990s by foreign TNCs and found that the policy changes during liberalization and absence of anti-trust regulations helped TNCs with cross-border acquisitions: they either acquired domestic companies or increased stakes in joint ventures. He found that about 40% of acquisitions that took place in the 1990s were buy-out attempts by the TNCs, in both vertical and horizontal acquisitions. Kumar and Rajib (2007) in their study of Indian firms found that the acquirer firms had bigger size, higher cash flow, higher PE ratios, higher book value, higher liquid assets and lower debt to total assets ratio in comparison to the target firms, while the target firms had lesser the liquid position. Through a series of Logit regression they identified a set of accounting ratios and market ratios that influenced acquisitions. They also noticed that for acquirer firms that had undergone multiple mergers, the average sales, profits and cash flow for a period of ten years were higher for the merging firms as compared to a control group matched by industry and size. Also, an important factor affecting the firm’s probability in going for multiple mergers was the inability of the incumbent management to generate more sales per unit of assets. Agrawal and Sensarma (2007) arrived at similar findings on acquisition determinant: growth opportunity, concentration and cash flow. Though the liberalization in 1990s welcomed foreign TNCs into India the outward cross-border M&A activities by Indian firms picked up relevant volume much later. Pradhan and Abraham (2005) looked at cross-border acquisitions by Indian firms in the early part of 2000s. They found that the main motivations of Indian firm’s overseas acquisitions were access to international market, firm-specific intangibles like technology and human skills, operational synergies and overcoming constraints from limited home market growth. Further, they found that characteristics of target firms varied across sectors. Interestingly, as the volume of outbound transactions from India grows, we notice that in recent years the Indian media carry out detailed analysis of Indian companies’ outbound M&A activities with nationalistic pride. The India-specific studies do throw some light on acquisition motives, choices and performance measures (both accounting and market performance). We do not find significant work on how macro-economic and environmental factors guide M&A decisions, especially cross-border transactions. We also do not find empirical studies in the areas of valuation and post-acquisition integration.

Arindam Das and Sheeba Kapil
152
2.2 Cross-border M&A studies on Chinese market The studies on China are found to be more interlinked with macro-economic and environmental factors and cover longer-term trends over decades. Peng (2006) identified three waves of FDI in China – in 1980s they were essentially joint ventures, while 1990s saw greenfield WFEOs (Wholly Foreign Owned Enterprises) and 2000s saw more cross-border M&As. Yet, M&As accounted for only 10-15% of FDI as against 60-70% in developed economies – primarily due to the fact that regulations that governed foreign takeover of SOEs (State Owned Enterprises) were strong enough to discourage acquisitions. He found that Chinese SOEs are rife with organizational slack, i.e., underutilized resources and inefficiencies. Also, the accounting practices in SOEs were not reliable and the ethnic Chinese managers from overseas economies might not be the best manager to run the acquired entity. However, China’s 11th 5-year plan (2006) expected that cross-border acquisitions would bring with it advanced technology, stronger management discipline and wider international delivery channels in addition to large equity funds, apart from activating stagnating firms (Nagano and Yuan, 2007). An industry panel study by Zou and Simpson (2008) on inbound cross-border acquisitions in China found that foreign acquisitions had grown in sectors with substantial sales and profits, such as electronic equipment and foreign acquirers had tended to go beyond access to raw materials and had started targeted companies with intangible assets. Boateng et al. (2008) analyzed the motivation and performance of outbound M&A activities by Chinese companies during the period 2000-2004 and found that the primary motivators were faster entry into new markets, promoting diversification and obtaining foreign advanced technology and other resources. They also found that these acquisitions actually created value for the Chinese acquiring firms. However, with the implementation of “Go Global” initiative by Chinese government, the number of outbound deals had increased though the average benefit from them was lower (Gu and Reed, 2010). 2.3 Comparison of M&A transactions between Chinese and Indian markets We find a few studies that compared and contrasted the happenings in these two countries. Many of these studies are linked to FDI inflow and entry choice between greenfield and acquisition. Pradhan (2009) found that outward FDI by China had started early but India caught up by late 1990s. However, there were fundamental differences between them. Chinese outward FDIs were driven by state owned entities and typically consisted of high value transactions. They were determined by political, security and economic intents whereas Indian outward FDIs were driven by private sector firms, with many being comparatively smaller, and market forces played a critical role. Also, Indian outward FDI was geared towards skill and intangible asset acquisition whereas Chinese FDI focused on material resources – a divergent view from the ones found by Boateng et al. (2008). Sweeney (2010) established several key differences between the FDI policies of China and India and categorized them under (a) statutory structure, including legal entities and relevant regulations and (b) approval processes. He argued that these differences explained the dramatic difference in FDI inflows in these two countries. He found that statutory structure in China provided investors with greater predictability of government actions, was transparent and more friendly and tailored to FDI, whereas India’s was more convoluted and antiquated. Similarly, approval process was longer in India, required

Analysis of Cross-border and Domestic M&A Deals in Technology Sector in India and China
153
navigating through various levels of bureaucracies. A case in point could be the Cairn – Vedanta deal where Vedanta group intends to acquire majority stake in Cairn India for approximately 9 billion USD and is still waiting for government nod as of May 2011 even after 9 months of announcement. Kalyanram (2009) found that India’s FDI policy was on generating domestic consumer demand and foster entrepreneurship whereas China’s policy encouraged resource mobilization. He argued that social investments (e.g., education, healthcare) adopted by India were necessary for sustained economic growth though impressive physical infrastructure drew more FDI to China. Technological attractiveness of the target was a factor identified by Zou and Simpson (2008) for inbound M&A by TNCs. Bhaumik et al. (2009) compared Indian and Chinese firms on patenting activities. They found that between 1992 and 2007 both India and China had achieved high level of patenting activities, though most of them were either by foreign owned entities or in joint ownership. However, while 30-35% of Chinese patents were design patents, more than 95% Indian patents were utility patents. In the ICT segment, though both countries increased their patenting activities, China’s volume had surpassed that of India’s. UNCTAD’s (2010) World Investment Report highlight that investment promotion measures in Chinese state has identified high tech industry as one of the sectors for promoting and encouraging FDI. Also, contrary to Sweeney’s (2010) findings this report finds India’s consolidated FDI policy assures to be transparent, predictable, simpler and clearer. A large number of TNCs from countries like India and China are motivated by strategic considerations, rather than by short-term profitability motives and over time many have become truly global players. While China’s “go global” initiative (Gu and Reed, 2010) encourages domestic enterprises to invest globally, India’s liberalization of foreign exchange regimes has acted as catalyst for outward FDI. 3. Problem definition Literature survey and industry data on cross-border acquisitions indicate that volume of cross-border M&A activities across the world continue to increase, barring the duration of economic meltdown (Figure 1) and the past challenges of cross-border transactions are slowly disappearing. While this may be accepted for the developed economies the same may not yet be true for the emerging economies with their complex regulatory frameworks. Additionally, the industry data indicate that the number of cross-border M&A transactions carried out by companies from the emerging economies is also increasing. However, the question remains on whether these transactions, though increasing in volume, face any special challenges because the acquirers come from emerging economies. The case-based analysis by Pradhan and Abraham (2005) identified several challenges that Indian pharmaceutical companies faced in the 1990s while going for acquisition in developed economies, viz., identification of targets, in-house skills to handle acquisitions, investment requirements and operational challenges with work culture and management practices. It is yet to be seen if these challenges have been wiped out over time.
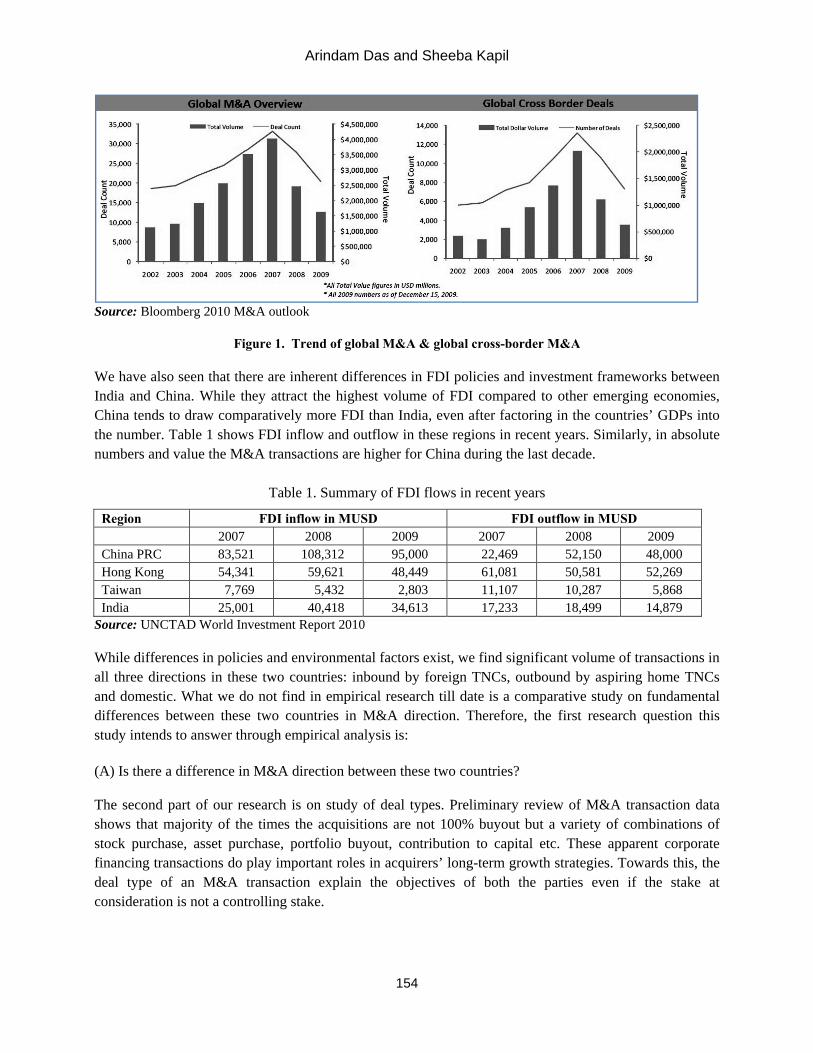
Arindam Das and Sheeba Kapil
154
Source: Bloomberg 2010 M&A outlook
Figure 1. Trend of global M&A & global cross-border M&A We have also seen that there are inherent differences in FDI policies and investment frameworks between India and China. While they attract the highest volume of FDI compared to other emerging economies, China tends to draw comparatively more FDI than India, even after factoring in the countries’ GDPs into the number. Table 1 shows FDI inflow and outflow in these regions in recent years. Similarly, in absolute numbers and value the M&A transactions are higher for China during the last decade.
Table 1. Summary of FDI flows in recent years
Region FDI inflow in MUSD FDI outflow in MUSD 2007 2008 2009 2007 2008 2009 China PRC 83,521 108,312 95,000 22,469 52,150 48,000 Hong Kong 54,341 59,621 48,449 61,081 50,581 52,269 Taiwan 7,769 5,432 2,803 11,107 10,287 5,868 India 25,001 40,418 34,613 17,233 18,499 14,879
Source: UNCTAD World Investment Report 2010
While differences in policies and environmental factors exist, we find significant volume of transactions in all three directions in these two countries: inbound by foreign TNCs, outbound by aspiring home TNCs and domestic. What we do not find in empirical research till date is a comparative study on fundamental differences between these two countries in M&A direction. Therefore, the first research question this study intends to answer through empirical analysis is: (A) Is there a difference in M&A direction between these two countries? The second part of our research is on study of deal types. Preliminary review of M&A transaction data shows that majority of the times the acquisitions are not 100% buyout but a variety of combinations of stock purchase, asset purchase, portfolio buyout, contribution to capital etc. These apparent corporate financing transactions do play important roles in acquirers’ long-term growth strategies. Towards this, the deal type of an M&A transaction explain the objectives of both the parties even if the stake at consideration is not a controlling stake.
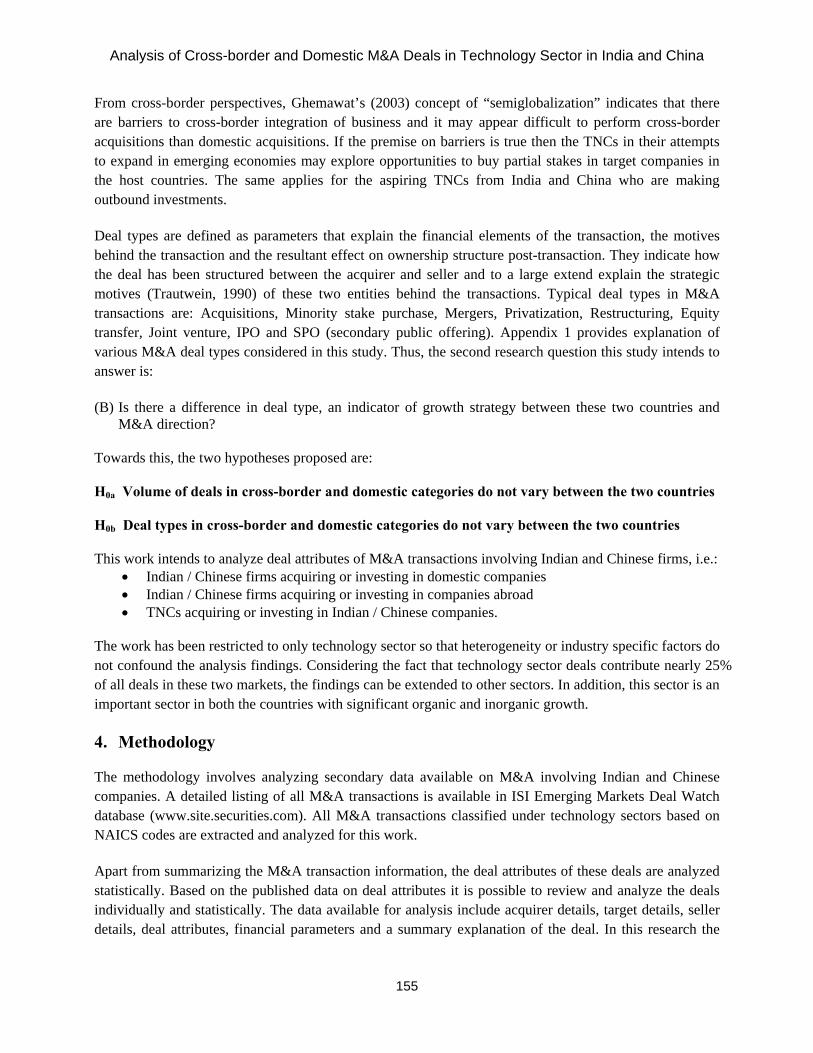
Analysis of Cross-border and Domestic M&A Deals in Technology Sector in India and China
155
From cross-border perspectives, Ghemawat’s (2003) concept of “semiglobalization” indicates that there are barriers to cross-border integration of business and it may appear difficult to perform cross-border acquisitions than domestic acquisitions. If the premise on barriers is true then the TNCs in their attempts to expand in emerging economies may explore opportunities to buy partial stakes in target companies in the host countries. The same applies for the aspiring TNCs from India and China who are making outbound investments. Deal types are defined as parameters that explain the financial elements of the transaction, the motives behind the transaction and the resultant effect on ownership structure post-transaction. They indicate how the deal has been structured between the acquirer and seller and to a large extend explain the strategic motives (Trautwein, 1990) of these two entities behind the transactions. Typical deal types in M&A transactions are: Acquisitions, Minority stake purchase, Mergers, Privatization, Restructuring, Equity transfer, Joint venture, IPO and SPO (secondary public offering). Appendix 1 provides explanation of various M&A deal types considered in this study. Thus, the second research question this study intends to answer is: (B) Is there a difference in deal type, an indicator of growth strategy between these two countries and
M&A direction? Towards this, the two hypotheses proposed are: H0a Volume of deals in cross-border and domestic categories do not vary between the two countries H0b Deal types in cross-border and domestic categories do not vary between the two countries This work intends to analyze deal attributes of M&A transactions involving Indian and Chinese firms, i.e.:
• Indian / Chinese firms acquiring or investing in domestic companies • Indian / Chinese firms acquiring or investing in companies abroad • TNCs acquiring or investing in Indian / Chinese companies.
The work has been restricted to only technology sector so that heterogeneity or industry specific factors do not confound the analysis findings. Considering the fact that technology sector deals contribute nearly 25% of all deals in these two markets, the findings can be extended to other sectors. In addition, this sector is an important sector in both the countries with significant organic and inorganic growth. 4. Methodology The methodology involves analyzing secondary data available on M&A involving Indian and Chinese companies. A detailed listing of all M&A transactions is available in ISI Emerging Markets Deal Watch database (www.site.securities.com). All M&A transactions classified under technology sectors based on NAICS codes are extracted and analyzed for this work. Apart from summarizing the M&A transaction information, the deal attributes of these deals are analyzed statistically. Based on the published data on deal attributes it is possible to review and analyze the deals individually and statistically. The data available for analysis include acquirer details, target details, seller details, deal attributes, financial parameters and a summary explanation of the deal. In this research the

Arindam Das and Sheeba Kapil
156
focus of statistical analysis is restricted to the following variables: M&A Market – India / China, Acquirer and Target countries, and Deal types. Deal attributes of 2428 completed M&A deals involving Indian and Chinese companies in the technology sector for the period January 2001 – February 2011 have been analyzed. The M&A deals in Hong Kong and Taiwan have been included under Greater China. The ECM deals (Equity Capital Market deals) which essentially represent bulk purchase / offloading of shares in stock market (through IPO or block trades) have been excluded from further analysis as these are not always perceived as strategic M&A activity for the acquirer. The extracted data have been first reviewed manually to understand the variables and associated values for each of the deals. Individual review of the deals also helped identify any potential data accuracy issues. The first part of this work analyzes the volume of M&A activities involving Indian and Chinese firms: number of deals that have taken place and M&A direction (country-specific propensity of M&A activities) – for outbound cross-border deals, inbound cross-border deals and domestic deals. The second part of this research has focused on deal types – whether there are significant differences in deal types between cross-border and domestic M&A activities in these two countries. This helps us to understand the variation in strategic intent of M&A activities in these two countries. 4.1 Statistical method for analysis The test that is applied to the data is an extension of the Goodness of Fit Test (Walpole, Myers, Myers, Ye, 2007). The Chi-Square Test of Independence is applied on the data to see if the deal attributes are independent of the type of deals: cross-border and domestic. In this method, expected values are calculated for each deal type and they are compared against the observed value. Based on a sample result set a contingency table of r x c with r choices and c categories are built. The actual observation for each choice-category combination is computed from the sample. The expected observations are obtained based on row total and column total:
Expected frequency = (column total) x (row total) / grand total The decision to accept or reject the null hypothesis that the choices and categories are independent is decided by the quantity
χ2 = ∑ (oi – ei)2 / ei Where χ2 is a value of the random variable whose sampling distribution is approximated very closely by the Chi-squared distribution with v = (r-1)(c-1) degrees of freedom. The symbols oi and ei are observed and expected frequencies of the i-th cell. If χ2 > χ2
α with v degrees of freedom then we reject the null hypothesis at α level of significance. This data analysis and testing the hypothesis has been carried out with SPSS® CrossTabs testing functionality.
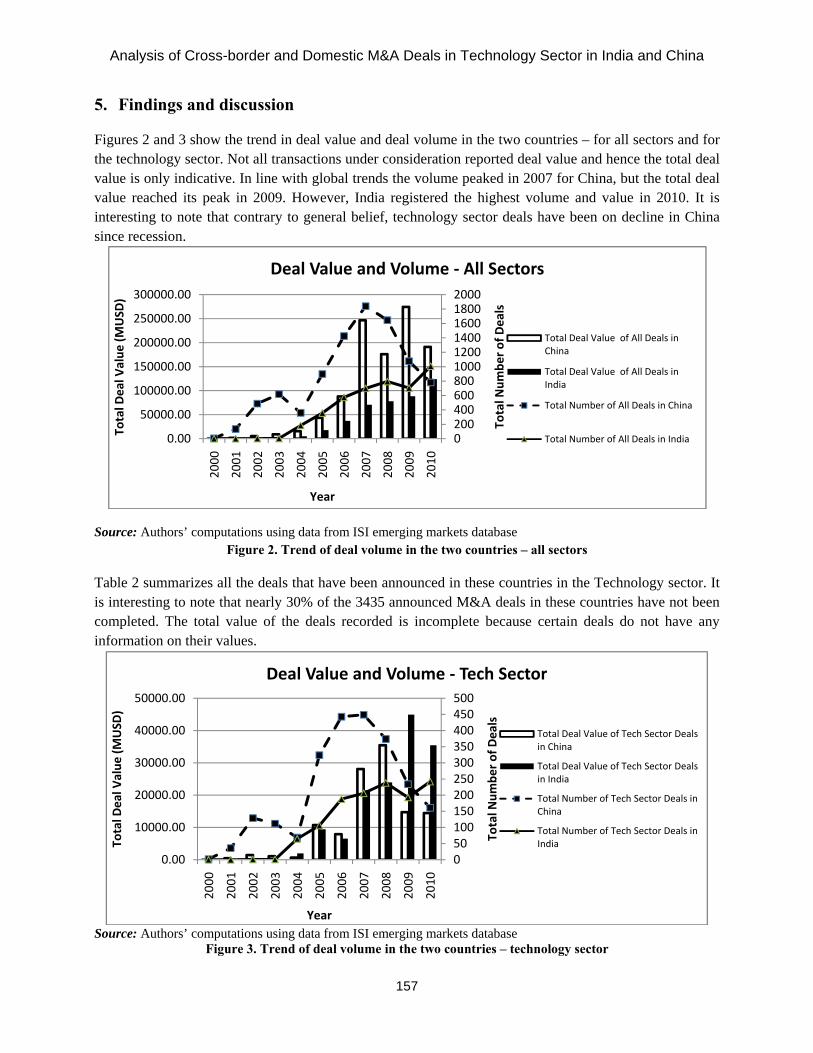
Analysis of Cross-border and Domestic M&A Deals in Technology Sector in India and China
157
5. Findings and discussion Figures 2 and 3 show the trend in deal value and deal volume in the two countries – for all sectors and for the technology sector. Not all transactions under consideration reported deal value and hence the total deal value is only indicative. In line with global trends the volume peaked in 2007 for China, but the total deal value reached its peak in 2009. However, India registered the highest volume and value in 2010. It is interesting to note that contrary to general belief, technology sector deals have been on decline in China since recession.
Source: Authors’ computations using data from ISI emerging markets database
Figure 2. Trend of deal volume in the two countries – all sectors Table 2 summarizes all the deals that have been announced in these countries in the Technology sector. It is interesting to note that nearly 30% of the 3435 announced M&A deals in these countries have not been completed. The total value of the deals recorded is incomplete because certain deals do not have any information on their values.
Source: Authors’ computations using data from ISI emerging markets database
Figure 3. Trend of deal volume in the two countries – technology sector
0200400600800100012001400160018002000
0.00
50000.00
100000.00
150000.00
200000.00
250000.00
300000.00
2000
2001
2002
2003
2004
2005
2006
2007
2008
2009
2010
Total N
umbe
r of D
eals
Total D
eal V
alue
(MUSD
)
Year
Deal Value and Volume ‐ All Sectors
Total Deal Value of All Deals in China
Total Deal Value of All Deals in India
Total Number of All Deals in China
Total Number of All Deals in India
050100150200250300350400450500
0.00
10000.00
20000.00
30000.00
40000.00
50000.00
2000
2001
2002
2003
2004
2005
2006
2007
2008
2009
2010
Total N
umbe
r of D
eals
Total D
eal V
alue
(MUSD
)
Year
Deal Value and Volume ‐ Tech Sector
Total Deal Value of Tech Sector Deals in China
Total Deal Value of Tech Sector Deals in India
Total Number of Tech Sector Deals in China
Total Number of Tech Sector Deals in India
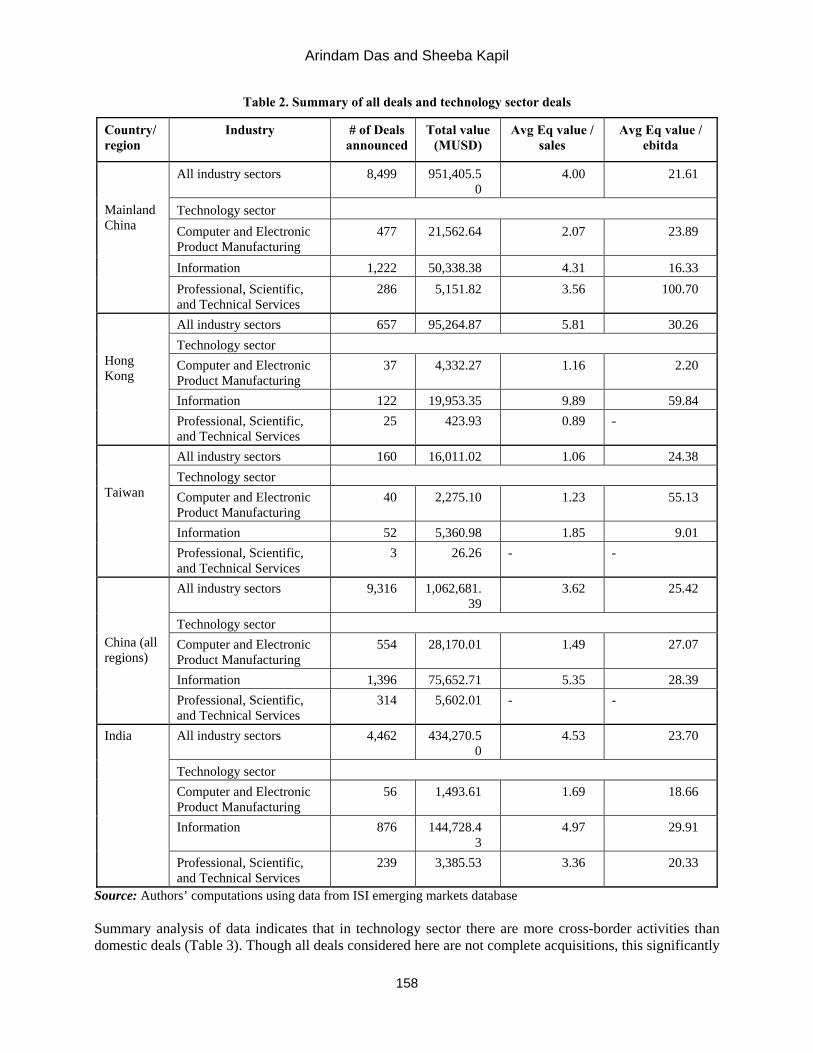
Arindam Das and Sheeba Kapil
158
Table 2. Summary of all deals and technology sector deals
Source: Authors’ computations using data from ISI emerging markets database Summary analysis of data indicates that in technology sector there are more cross-border activities than domestic deals (Table 3). Though all deals considered here are not complete acquisitions, this significantly
Country/region
Industry # of Deals announced
Total value (MUSD)
Avg Eq value / sales
Avg Eq value / ebitda
Mainland China
All industry sectors 8,499 951,405.50
4.00 21.61
Technology sector Computer and Electronic Product Manufacturing
477 21,562.64 2.07 23.89
Information 1,222 50,338.38 4.31 16.33 Professional, Scientific, and Technical Services
286 5,151.82 3.56 100.70
Hong Kong
All industry sectors 657 95,264.87 5.81 30.26 Technology sector Computer and Electronic Product Manufacturing
37 4,332.27 1.16 2.20
Information 122 19,953.35 9.89 59.84 Professional, Scientific, and Technical Services
25 423.93 0.89 -
Taiwan
All industry sectors 160 16,011.02 1.06 24.38 Technology sector Computer and Electronic Product Manufacturing
40 2,275.10 1.23 55.13
Information 52 5,360.98 1.85 9.01 Professional, Scientific, and Technical Services
3 26.26 - -
China (all regions)
All industry sectors 9,316 1,062,681.39
3.62 25.42
Technology sector Computer and Electronic Product Manufacturing
554 28,170.01 1.49 27.07
Information 1,396 75,652.71 5.35 28.39 Professional, Scientific, and Technical Services
314 5,602.01 - -
India All industry sectors 4,462 434,270.50
4.53 23.70
Technology sector Computer and Electronic Product Manufacturing
56 1,493.61 1.69 18.66
Information 876 144,728.43
4.97 29.91
Professional, Scientific, and Technical Services
239 3,385.53 3.36 20.33

Analysis of Cross-border and Domestic M&A Deals in Technology Sector in India and China
159
higher proportion of cross-border activities support the argument for “semiglobalization”, (Ghemawat, 2003) i.e. companies are increasingly buying stakes in companies outside their home countries. In absence of accurate information on deal value, count of deal is taken as a measure for volume of dealsthat take place in these markets. Deals are categorized by dummy variable, M&A Direction: Domestic, In-bound Cross-border and Out-bound Cross-border. SPSS® package has been used to run the Chi-Square Test of Independence to test the first hypothesis. Tables 3 and 4 show the summary and test results.
Table 3. Case processing summary – M&A direction vs. market
Case processing summary
Cases
Valid Missing Total N Percent N Percent N Percent
MandA direction * market 2428 100.0% 0 .0% 2428 100.0%MandA direction * market crosstabulation
Market
Total
China India
MandA direction Domestic Count 848 302 1150 In-bound Count 564 331 895 Out-bound Count 67 316 383
Total Count 1479 949 2428
Table 4. Chi-square test of independence - M&A direction vs. market
Chi-Square Tests Value df Asymp. Sig. (2-sided) Exact Sig. (2-sided)
Pearson Chi-Square 384.396a 2 .000 .000Likelihood Ratio 390.520 2 .000 .000Fisher's Exact Test 389.795 .000N of Valid Cases 2428 a. 0 cells (.0%) have expected count less than 5. The minimum expected count is 149.70.
As the p-value is 0 (Table 4) we reject H0, i.e., there is evidence to conclude that distribution of In-bound, Out-bound and domestic deals in technology sector vary significantly in the two countries. The above results point to the question on the causes behind the significant difference in M&A direction. Though we have seen the differences in policies and process that guide and govern M&A transactions in these two countries, we need further studies to establish causal patterns to the differences. To test the next hypothesis we analyze the deal types in these two countries through another Crosstabs analysis where we use M&A Direction as a layer variable in the Chi-Square test. Tables 4 and 5 show the summary and test results.
Table 5. Case processing summary – M&A direction vs. market vs. deal type
Case Processing Summary
Cases
Valid Missing Total N Percent N Percent N Percent
Deal type * market * manda direction 2428 100.0% 0 .0% 2428 100.0%

Arindam Das and Sheeba Kapil
160
Deal type * market * manda direction crosstabulation
MandA direction Market
Total China India
Domestic Deal Type
Acquisition Count 372 153 525Equity transfer Count 9 0 9Joint Venture Count 7 2 9Minority stake purchase Count 369 132 501Other Count 12 10 22Restructuring within one holding Count 79 5 84
Total Count 848 302 1150
In-bound Deal Type
Acquisition Count 104 142 246Joint Venture Count 8 3 11Minority stake purchase Count 446 179 625Other Count 2 7 9Restructuring within one holding Count 4 0 4
Total Count 564 331 895
Out-bound Deal Type
Acquisition Count 50 272 322Minority stake purchase Count 16 38 54Other Count 1 4 5Restructuring within one holding Count 0 2 2
Total Count 67 316 383
Table 6. Chi-square test of independence - M&A direction vs. market vs. deal type
Chi-square tests MandA direction Value df Asymp. Sig. (2-sided) Exact Sig. (2-sided)
Domestic
Pearson Chi-Square 27.611a 5 .000 .000Likelihood Ratio 35.096 5 .000 .000Fisher's Exact Test 31.808 .000N of Valid Cases 1150
In-bound
Pearson Chi-Square 73.292b 4 .000 .000Likelihood Ratio 73.189 4 .000 .000Fisher's Exact Test 71.028 .000N of Valid Cases 895
Out-bound
Pearson Chi-Square 6.818c 3 .078 .088Likelihood Ratio 6.449 3 .092 .080Fisher's Exact Test 6.412 .083N of Valid Cases 383
a. 2 cells (16.7%) have expected count less than 5. The minimum expected count is 2.36. b. 4 cells (40.0%) have expected count less than 5. The minimum expected count is 1.48. c. 4 cells (50.0%) have expected count less than 5. The minimum expected count is .35.
As the p-value is 0 for Domestic and In-bound categories (Table 6) we can reject H0 for these two groups. However, for the Out-bound category, we fail to reject H0. This essentially means that while domestic and inbound deal types in the two countries are significantly different, the outbound deals from these two countries are not significantly different. The above results explain how deal types vary between countries within different M&A categories. We can surmise that when aspiring home TNCs from these two countries go for outbound transactions they

Analysis of Cross-border and Domestic M&A Deals in Technology Sector in India and China
161
follow similar patterns of acquisition strategy and in majority of the cases that is acquisition of controlling stake. It is to be explored if such strategy is a limitation of options for the aspiring home TNCs. However, when we come to domestic or inbound markets we see variety of acquisition approaches and they vary between these two countries. 6. Conclusions This work is the first step in analyzing M&A deal attributes to explore the potential differences between cross-border and domestic deals involving Indian and Chinese companies. Deal attributes are important transactional parameters that can explain acquisition strategy of a company and has been used in this paper as the core data point for analysis. Contrary to the findings of Hagedoorn and Duysters (2002) that the high-tech sectors tend to opt for alliances over mergers, it is found that companies in technology sector in these two countries are active players in acquisitions and minority stake purchases. However, this behavior needs to be further investigated by comparing the corresponding alliance activities of these companies. The Chi-square tests show that the deal types are not statistically different for outbound deals that probably suggest that both Indian and Chinese acquirers overseas follow similar and traditional approaches to acquisitions. On the contrary, the domestic and inbound groups show significant difference. This can be explained through the fact that the environment, financial structures and expansion objectives are different in these two countries. However, further research is necessary to investigate if this difference is attributable to macroeconomic conditions like FDI and corporate financing environment or only attributable to M&A strategies of these specific entities. Further empirical research can be conducted on the financial parameters of the deal structures (e.g., valuation, deal pricing, payment options etc.), acquirer / target firm characteristics and industry-specific influencers to get deeper understanding of these two active M&A markets. Appendix 1
In data analysis, each M&A transaction has only one deal type assigned to it. The definition and explanation of each deal type is mentioned in the table below.
Deal Type Explanation
Acquisition Transactions involving a controlling stake (not necessarily 100%) or deals resulting in the buyer becoming the largest shareholder AND being able to exercise significant control over the target company
Minority stake purchase
Transactions involving purchase of a non-controlling stake
Merger Involved parties decide to team up and start doing business together and the stakes companies obtain in each other (or cash amounts paid) are roughly equal
Privatization Any deal in which the seller is the state or government authority
Restructuring Shareholdings are reorganized or reassigned within a holding or group of companies
Equity Transfer Transfer of stakes in state-owned enterprises to other state-owned enterprises or municipal authorities where no money is paid (applicable to primarily to China PRC)

Arindam Das and Sheeba Kapil
162
Joint Venture Two companies decide to create a new entity that usually does not own its founders. While this is not a typically form of M&A, in countries like China PRC where the state has overwhelming influence over economic affairs this is seen as masked for of M&A.
Initial Public Offering
Company's first placement of shares on a stock exchange
Secondary Public Offering
Any public placement of the company's shares through the stock exchange that is not its first
References Agami, A.M. (2001), “Cross-Border Mergers Among Multinational Businesses”, Multinational Business Review,
Spring, 2001. Agrawal, M., Sensarma, R. (2007), “Determinants of merger activity: evidence from India”, International Journal of
Financial Services Management, 2(4), 277-288. Bertrand, O., Zitouna, H. (2006), “Trade Liberalization and Industrial Restructuring: The Role of Cross-Border
Mergers and Acquisitions”, Journal of Economics & Management Strategy, 15(2), 479–515. Bhaumik. P.K., Chakrabarti, A.K., Makinen, S. (2009), “Technology Development in China and India: a
Comparative Evaluation”, Journal of Indian Business Research, 1(4), 213-237 Boateng, A., Qian, W., Tianle, Y. (2008), “Cross-Border M&As by Chinese Firms: An Analysis of Strategic Motives
and Performance”, Thunderbird International Business Review, 50 (4). Cartwright, S., Schoenberg, R. (2006), “30 Years of Mergers and Acquisitions Research” Recent Advances and
Future Opportunities”, British Journal of Management, 17 (S1). Cheng, Y-M. (2006), “Determinants of FDI Mode Choice: Acquisition, Brownfield, and Greenfield Entry in Foreign
Markets”, Canadian Journal of Administrative Sciences, 23(3). Ghemawat, P. (2003), “Semiglobalization and International Business Strategy”, Journal of International Business
Studies, 34(2), 138-152. Gu, L., Reed, R.W. (2010), “Chinese Overseas M&A Performance and the Go Global Policy”, Conference
Proceedings of The New Zealand Association of Economists Conference 2010, Available at http://www.nzae.org.nz/conferences/2010/Papers/Session5/Gu__Chinese_Overseas_M_A_Performance.pdf
Hagedoorn, J., Duysters, G. (2002), “External Sources of Innovative Capabilities: The Preference for Strategic Alliances of Mergers and Acquisitions”, Journal of Management Studies, 39(2).
Hopkins, H.D. (1987), “Acquisition Strategy and the Market Position of Acquiring Firms”, Strategic Management Journal, 8, 535-547.
Kalyanaram, G.K. (2009), “India’s Economic Growth and Market Potential: Benchmarked against China”, Journal of Indian Business Research, 1(1), 57-65
Kumar, B.R., Prabina, R. (2007), “An Analytical Study on Multiple Mergers in India”, IIMB Management Review, March 2007, 1-11.
Kumar, N. (2000), “Multinational Enterprises and M&As in India: Patterns and Implications”, Economic and Political Weekly, 35-5.
Lipton, M. (2006), “Merger Waves in the 19th, 20th and 21st Centuries”, The Davies Lecture, Osgoode Hall Law School, York University, Available at: http://osgoode.yorku.ca/media2.nsf/58912001c091cdc8852569300055bbf9/1e37719232517fd0852571ef00701385/$file/merger%20waves_toronto_lipton.pdf.
Lundan, S., Hagedoorn, J. (2001), “Alliances, Acquisitions and Multinational Advantage”, International Journal of the Economics of Business, 8(2), 229-242.
Mukherjee, T.K., Kiymaz, H., Baker, H.K. (2004), “Merger Motives and Target Valuation: A Survey of Evidence from CFOs”, Journal of Applied Finance, Fall/Winter, 2004.

Analysis of Cross-border and Domestic M&A Deals in Technology Sector in India and China
163
Nagano, M., Yuan, Y. (2007), “Cross-Border Acquisitions in a Transition Economy: Recent Experiences of China and India”, Working Paper, Available at SSRN: http://ssrn.com/abstract=1683895
Nocke, V., Yeaple, S. (2007), “Cross-Border Mergers and Acquisitions vs. Greenfield Foreign Direct Investment: The Role of Firm Heterogeneity”, Journal of International Economics, 72, 336–365
Norback, P., Persson, L. (2008), “Globalization and Profitability of Cross-Border Mergers and Acquisitions”, Economic Theory, 35, 241-266.
Pradhan, J.P., Abraham, V., (2005), “Overseas Mergers and Acquisitions by Indian Enterprises: Patterns and Motivations”, Indian Journal of Economics, 33, 365-386.
Pradhan, J.P. (2009), “Emerging Multinationals from India and China: Origin, Impetus and Growth”, Hosei University International Workshop on International Competitiveness, Globalization and Mulinationalization of Firms: A comparison of China and India, Available at: http://ssrn.com/abstract=1515676
PriceWaterhouseCoopers, (2009), M&A Industry Insights, Available at http://www.pwc.com/gx/en/mergers-acquisitions-industry-trends
Peng, M.W. (2006), “Making M&A Fly in China”, Harvard Business Review, March, 2006. Pun, K.F. (2005), “An Empirical Investigation of Strategy Determinants and Choices in Manufacturing Enterprises”,
Journal of Manufacturing Technology Management, 16(3), 282-301. Seth, A., Song, K.P., Pettit, R. (2002), “Value Creation and Destruction in Cross-Border Acquisitions: An Empirical
Analysis of Foreign Acquisitions of U.S. Firms”, Strategic Management Journal, 23, 921-940. Sethi, D, Guisinger, S.E., Phelan, S.E., Berg, D.M. (2003), “Trends in Foreign Direct Investment Flows: A
Theoretical and Empirical Analysis”, Journal of International Business Studies, 34 (4), 315-326. Sweeney, M. (2010), “Foreign Direct Investment in India and China: The Creation of a Balanced Regime in a
Globalized Economy”, Cornell International Law Journal, 207. Trautwein, F. (1990), “Merger Motives and Merger Prescriptions”, Strategic Management Journal, 11, 283-295. UNCTAD (2010), “World Investment Report 2010 – Investing in Low-carbon Economy”, United Nations
Conference on Trade and Development, Available at: http://www.unctad.org Walpole, R.E., Myers, R.H., Myers, S.L., Ye, K. (2007), Probability & Statistics for Engineers & Scientists, Dorling
Kindersley (Pearson Education), New Delhi. Zou, H., Simpson, P. (2008), “Cross-border Mergers and Acquisitions in China: An Industry Panel Study, 1991–
2005”, Asia Pacific Business Review, 14 (4), 491–512. About the Authors
Arindam Das is a research scholar at the Indian Institute of Foreign Trade (IIFT), New Delhi working in the areas of M&A strategy and valuation – particularly in the telecom and technology sectors. Arindam has rich experience in working with large corporations in various roles for nearly two decades. He has published in international journals and presented papers in various conferences. Arindam holds a Master’s degree from Indian Statistical Institute and is a certified PMP. Dr Sheeba Kapil is working as an Associate Professor at the Indian Institute of Foreign Trade (IIFT), New Delhi in the area of Finance. She has more than twelve years of corporate and academic work experience. Dr. Kapil teaches courses on Financial Management, Mergers and Acquisition and Business Valuation. Her areas of interest include Mergers and Acquisitions, Valuation of Intangible Assets. She has authored several books on Corporate Finance and has several international and national papers to her credit. She has also developed cases for classroom teaching which have been published by international case depositories. She is also actively involved in executive training and development programs for various
organizations and institutes. Contact Information: Indian Institute of Foreign Trade, B-21, Qutub Institutional Area, New Delhi – 110016, Tel: + +91-11-26965124, Email: [email protected].
Transnational Corporations Review Volume 3, Number 2 June 2011 www.tnc-online.net, [email protected]
Beyond Hands Visible or Invisible: A Review of George A, Akerlof and Robert J. Shiller, Animal Spirits: How Human Psychology Drives the Economy and Why It Matters for Global Capitalism. Princeton: Princeton University Press, 2009. xiv+230 pages. In close to forty years of my research, advising, and teaching globally, I have read and reviewed many very interesting and paradigm-changing books in economics and management. However, this book is one of a kind! The book is nothing short of a revolution in how we think about economics and the real (global) economy in general. While the standard economic theory, rooted in the Adam Smith classical work, sprung up mainly from two abstract, simplified, and rather static ideas of Rational Expectations (RE) and Efficient Market Hypothesis (EMH), the powerful source of the Akerlof & Shiller story is the living and changing organism of the increasingly global economy; the Authors concentrate on the macroeconomic aspects, especially as they apply to the Great Recession started in 2008. Critical to the analysis is the observation that RE and EMH approaches utterly fail to explain the great majority of the economic phenomena, incl. the current Great Recession in the US and globally; this sweeping assertion is not even controversial in early 2011. The reason it is so is that these standard economic theory approaches completely fail to account for the operation of “animal spirits”, a term dating back to John M. Keynes. Animal spirits are our interpretations of economics and the economy, our mental/psychological forces and constructs, spiritus animalis from the original Latin. They include: (non)confidence (with its Keynesian style multipliers), the issue of fairness in wage determination and other areas, corruption and bad faith phenomena in the society, money illusion that people usually operate under, and stories that are our practical and simplified ways of thinking about the economy and economics. The answers to the eight basic questions in economics crucially depend on the animal spirits: Why do depressions occur? Why do central banks have real powers? Why do we have involuntary unemployment? Why is there a long-run tradeoff between inflation and unemployment? Why is saving so variable? Why do stock markets fluctuate so wildly? Why are the cycles in the housing market so large? And why is there continued minority poverty? Very importantly, the book highlights frames of modern government roles in strategic management of the animal spirits for the benefit of our knowledge and our economy. Even if (as some would claim) animal spirits cannot be modeled yet to produce empirically relevant outcomes (qualitative, quantitative, combined, etc) on the individual level or the aggregate level, it is probably only a question of a relatively short time before we can do so using new frontier research like neuronomics, business ethics, knowledge management, etc, to extend our knowledge. The book is a great and compelling proposal for a new economic thinking, and a very practical one at that. Two years ago I adopted Akerlof & Shiller as the textbook for my MBA and Executive MBA teachings, incl. online teachings. My students (mostly adult professionals) provided lots of un-trivial opinions on how I was able to enthusiastically teach this new economic thinking and practically frame the animal spirits analysis for actionable understanding of the 21st century global economy. The Akerlof & Shiller book is best used as the text for economic principles and/or related graduate level courses. I look forward to the second edition of this book; and an online teaching companion would be very useful for students and teachers alike. Very powerful story, one of a kind indeed! Val Samonis Institute for New Economic Thinking, New York City and SEMI Online, Toronto
Transnational Corporations Review www.tnc-online.net [email protected] (1-3)
- 1 -
CALL FOR SUBMISSIONS
General Information
Transnational Corporations Review (TNCR), published by the Ottawa United Learning Academy (OULA)
and Denfar Transnational Development (Denfar), is a modern media journal dedicated to providing
economic, policy, and business analysis of current issues related to transnational corporations (TNCs),
foreign direct investment (FDI), institutional innovation, and international development. The journal puts
emphasis on China's growing involvement in the global economy. FDI by TNCs is the most dominant and
dynamic element of the world economy in terms of production value; and TNCR fills the urgent need for a
journal on the topic that is available in both English and Chinese. It is the only journal published in the
West that addresses the topic from modern theoretical and practical including knowledge management
perspectives. The journal particularly serves the needs of globally dispersed young professionals and
senior graduate students majoring in Chinese business and international economics.
Journal Title (in English) Transnational Corporations Review
Journal Title (in Chinese) Kuaguo Gongsi
ISSN 1918-6444 (Print), 1925-2099 (Online)
Languages English/Chinese
Special Advisors Dr. Manfred Bienefeld, Dr. Anne Miroux, Dr. Elinor Ostrom,
Dr. Vincent Ostrom, Dr. Someshwar Rao, Dr. Karl Sauvant,
Dr. Yongding Yu, Dr. Yanzhong Zhang
Honorable Editors Dr. Karl Sauvant & Dr. Val Samonis
Managing Editors Hugh Dang
Editors Anvella Deng, Denny Liao
Production Management Gloria Yuan
China Representative Alexander Lau
Publication Period March, June, September, December
Index Information ALPSP-SWETS, AMICUS, EconLit, SSCI/SCI (pending approval)
Publisher Edited by Ottawa United Learning Academy and published by
Denfar Transnational Development, 58 Rideau Heights Dr.
Ottawa, ON K2E 7A6 Canada
Websites www.tnc-online.net, www.tnc-online.org
E-mail (inquiries) [email protected], [email protected]

Call for Submissions
- 2 -
Editorial Policy
TNCR welcomes submission on any aspect(s) of transnational corporations (TNCs), foreign direct
investment (FDI), institutional innovation, or international development. Authors from business,
government and academic sectors are encouraged to submit papers to this unique journal. The Editorial
Board of TNCR is comprised of well-known individuals from academic, enterprise, and policy circles. The
primary role of board members is to ensure that the journal publishes material of consistently high quality
and remains editorially independent. As such, each submission is subject to a double-blind review by
members of the Advisory Board and/or relevant organizations, who are asked either to accept or reject
the submission. To expedite publication, all aspects of the process from submission to correspondence
and editing are done electronically. In order to circulate the work of the authors selected for publication as
widely as possible, TNCR retains the copyright to all documents appearing in TNCR (articles, editorials,
commentaries, etc.). These include, but are not limited to, rights to publication, republication, transmission,
distribution, and other forms of use.
Guidelines for Contributors
Submissions focused on TNCs, FDI, institutional innovation, or international development would be
warmly welcomed. In keeping with the journal’s mandate, submissions dealing with topics related to
China are encouraged. Preference will be given to submissions that focus on clear policy implications.
TNCR publishes special issues on particular topics; individuals with a proposal for the special issue are
encouraged to contact the Managing Editor(s) at [email protected].
Papers submitted for publication should be in both English and Chinese. Submissions should be sent in
Microsoft Word format by e-mail to [email protected] accompanied by a statement that the text (or
parts thereof) has not been published or submitted for publication elsewhere. Papers should not normally
exceed ten pages (3,000 words) in length. All papers should have an abstract not exceeding about 100
words, including key words. Research notes should be between five and eight pages. Book reviews and
other information should be around 1,000 words, with the exception of review essays, which may be
article-length. Footnotes should appear at the bottom of the page to which they refer. An alphabetical list
of references should appear at the end of the manuscript. Appendices, tables, figures and
acknowledgement should appear at the end of the paper on separate pages.
Call for Submissions
- 3 -
Submissions (including references) should be typed within standard margins. Pages should be numbered
consecutively. The first page of the paper should contain: (i) title; (ii) name(s) and institutional affiliation(s)
of the author(s); (iii) mailing address, e-mail address, telephone and facsimile numbers of the author (or
primary author, if more than one); (iv) the author’s or authors’ biographical information with a recent
photograph. Authors should ensure that each submitted paper contains an abstract, an introduction, and
a conclusion highlighting the paper’s policy implications.
TNCR editors work on a voluntary basis. Submissions should include a contribution of US$30 per printed
page to cover the cost of high-level peer reviews, editing and printing. This is payable by authors
themselves and/or their affiliated institutions or granting agencies. For submissions in either English or
Chinese only, an extra charge of US$20 per printed page may be applied to cover the costs of translating
the submission into the second language of the journal. Contributions do not affect editorial decisions.
Instructions for making contributions are given once a submission has been accepted for publication.
Subscribe to the Journal
TNCR welcomes subscriptions. This journal takes an innovative, comprehensive look at a wide range of
issues facing transnational corporations. It is dedicated to providing economic, policy, and business
information as well as analysis of current issues related to transnational corporations, foreign direct
investment, institutional innovation, and social development. The mandate of TNCR is to publish papers
that provide insight into the economic, legal, social and cultural impacts of transnational corporations and
foreign direct investment in an increasingly globalized world. For more information about subscription,
please contact us at [email protected].

ADVERTISE IN TNCR
• Circulation of over 30,000 through a variety of effective, regularly-updated electronic mailing lists
• Over 10,000 printed copies across North America, Europe and China
• Three important audiences: transnational corporations, relevant governments, and young professionals in the field
• Printed and electronic versions in both English and Chinese
A unique journal in both English and Chinese
A platform for TNC Policy, Theory, and Practice
TRANSNATIONAL CORPORATIONS REVIEW www.tnc-online.net [email protected]

Transnational Corporations Review (TNCR)’s China Experts Group meets together in June 2011
The Workshop on Advanced English Writing in Beijing Royal King Hotel in 2011
Dr. Sarah Tong from National Singapore University
talks about advanced English writing Dr. Arthur Cheung from City University of Hong Kong is
invited to speak to the TNCR’s Workshop
Ms. Helen Zhang from Zhejiang University talks about
SSCI/SCI journals in the world Dr. Kin Keung Lai, a Chang Jiang Scholar Chair Professor
a talks to the TNCR’s Workshop
TNCR Officers meet with the colleagues and experts
from Shanghai, China TNCR Officer meets with Dr. Jiyong Chen and
his colleagues in Wuhan University


![Transnational Corporations [Grazia Ietto-Gillies]](https://img.pdfslide.us/doc/110x75/577cc4701a28aba711994e6f/transnational-corporations-grazia-ietto-gillies.jpg)