Embed Size (px)
Citation preview
UNITED NATIONS CONFERENCE ON TRADE AND DEVELOPMENT
The Universe of the Largest Transnational Corporations
UNITED NATIONS New York and Geneva, 2007
ii The Universe of the Largest Transnational Corporations
UNCTAD Current Studies on FDI and Development
Note
UNCTAD serves as the focal point within the United Nations Secretariat for all matters related to foreign direct investment and transnational corporations. With 30 years of experience in these areas, UNCTAD, through its Division on Investment, Technology and Enterprise Development (DITE), promotes understanding of and helps build consensus on matters related to foreign direct investment (FDI), transfer of technology and development. DITE also assists developing countries to attract and benefit from FDI and to build their productive capacities and international competitiveness. The emphasis is on an integrated policy approach to investment, technological capacity-building and enterprise development.
The term “country” as used in this study also refers, as appropriate, to territories or areas; the designations employed and the presentation of the material do not imply the expression of any opinion whatsoever on the part of the Secretariat of the United Nations concerning the legal status of any country, territory, city or area or of its authorities, or concerning the delimitation of its frontiers or boundaries. In addition, the designations of country groups are intended solely for statistical or analytical convenience and do not necessarily express a judgement about the stage of development reached by a particular country or area in the development process. The reference to a company and its activities should not be construed as an endorsement by UNCTAD of the company or its activities.
The boundaries and names shown and designations used on the maps presented in this publication do not imply official endorsement or acceptance by the United Nations.
The following symbols have been used in the tables:
Two dots (..) indicate that data are not available or are not separately reported. Rows in tables have been omitted in those cases where no data are available for any of the elements in the row.
A dash (-) indicates that the item is equal to zero or its value is negligible.
A blank in a table indicates that the item is not applicable, unless otherwise indicated.
A slash (/) between dates representing years, e.g. 1994/95, indicates a financial year.
Use of a dash (–) between dates representing years, e.g. 1994–1995, signifies the full period involved, including the beginning and end years.
Reference to “dollars” ($) means United States dollars, unless otherwise indicated.
Annual rates of growth or change, unless otherwise stated, refer to annual compound rates.
Details and percentages in tables do not necessarily add to totals because of rounding.
The material contained in this study may be freely quoted with appropriate acknowledgement.
UNCTAD/ITE/IIA/2007/2 United Nations Publication
Sales No. E.07.II.D.6 ISBN 978-92-1-112715-7
ISSN 1818-1465
Copyright © United Nations, 2007 All rights reserved
iii
UNCTAD Current Studies on FDI and Development
Acknowledgements
This publication is part of a new series of current studies on FDI and development published by UNCTAD. The series aims to contribute to a better understanding of how transnational corporations (TNCs) and their activities impact on development. The present study quantifies and analyses the past and current trends on the degree of internationalization of the largest TNCs as well as TNCs from developing economies. It aims at stimulating discussion and further research on the subjects addressed.
The study was prepared by J. François Outreville under the overall guidance of Anne Miroux and Hafiz Mirza. Jovan Licina provided research assistance, Katia Vieu provided secretarial assistance and desktop publishing was done by Teresita Ventura.
The text benefited from comments and feedback by Torbjörn Fredriksson, Masataka Fujita, Jeremy Clegg, Kalman Kalotay, Guoyong Liang, Michael Lim, Nicole Moussa, Shin Ohinata and Thomas Pollan.

v
UNCTAD Current Studies on FDI and Development
Contents Page
Acknowledgements ........................................................................................................................iii
Executive summary.......................................................................................................................vii
I. Introduction .......................................................................................................................... 1
II. The universe of the largest TNCs: 2004 snapshot ............................................................. 3 a. The top 100 TNCs............................................................................................................ 3 b. The top 50 TNCs from developing economies ................................................................ 4 c. TNCs from Central Europe, South-East Europe and the Commonwealth of Independent States............................................................................. 5
III. The growing importance of TNCs over the period 1993–2003......................................... 7 a. The top 100 TNCs from 1993 to 2003 ............................................................................. 7 b. The top 50 TNCs from developing economies, 1993-2003............................................. 8 c. Performance indicators..................................................................................................... 9
IV. Measures of size and concentration .................................................................................. 11
V. The transnationality index over the period 1993-2003 ................................................... 13 a. TNI values over the period 1993-2003 .......................................................................... 13 b. Evolution by region and country.................................................................................... 15 c. Shifts across sectors ....................................................................................................... 18
VI. How transnational are TNCs?........................................................................................... 21 a. The geographical extensity dimension........................................................................... 21 b. A graphical approach to transnationality ....................................................................... 22 c. Other perspectives.......................................................................................................... 26
VII. Most favoured Locations by TNCs ................................................................................... 29
VIII. Conclusions ......................................................................................................................... 33
IX. References ........................................................................................................................... 37
X. Annexes ............................................................................................................................... 39
Boxes
1. The largest TNCs in the World Investment Report.................................................................. 3 2. How to measure market concentration of firms? ................................................................... 16 3. How to measure the average TNI? ......................................................................................... 20 4. Selected TNCs from developing economies .......................................................................... 23 5. The motor vehicle industry: Ford and Toyota, two distinct expansion strategies .................. 34 6. A simplified model of location-specific advantages ............................................................. 43
Figures
1. The largest 100 non-financial TNCs, foreign assets, foreign sales and foreign employment, 1990-2003......................................................................................................... 7 2. The top 50 TNCs based in developing economies, foreign assets, foreign sales and foreign employment, 1995-2003 ................................................................ 8 3. The sales-to-assets ratio of the largest TNCs, 1993-2003...................................................... 9 4. The sales-to-employment ratio of the largest TNCs, 1993-2003 ........................................... 9 5. Average TNI, 1993-2003 ..................................................................................................... 13 6. Regional distribution of the affiliates of the largest 100 TNCs............................................ 27
vi The Universe of the Largest Transnational Corporations
UNCTAD Current Studies on FDI and Development
Tables
1. Snapshot of the largest TNCs: assets, sales and employment. 2004 ...................................... 3 2. Performance ratio for a subset of TNCs, 1993 and 2003 ....................................................... 8 3. Ranking the largest TNCs by foreign sales and foreign employment, 2003.......................... 9 4. K-firms concentration ratios, 1992-2003 ............................................................................... 9 5. Herfindhal index and Number Equivalent, 2003.................................................................. 10 6. Top 10 most transnational firms by country of origin, 1993, 1998 and 2003...................... 12 7. Country composition of the world's top 100 TNCs by transnationality index and number of entries, 1993, 1998 and 2003 ............................................................. 13 8. Composition of the top 50 by region and by transnationality index, number of entries and number of countries, 1993, 1998 and 2003 ...................................... 14 9. Industry composition of the top 100 TNCs, 1993, 1998 and 2003 ...................................... 16 10. Industry composition of the top 50 TNCs, 1993, 1998 and 2003 ........................................ 18 11. Rank correlations among the transnationality indices.......................................................... 20 12. The 50 most transnational TNCs, ranked by the surface of the quadrilateral calculated with four measures of transnationality........................................... 22 13. Distribution of the locations of affiliates of the largest TNCs by region, 2003 ................... 25 14. Regional composition of directors on the boards of 42 of the largest 100 TNCs, grouped by home region/country, 2003 ................................................. 26 15. Rank correlations between countries popularity rank, size and good governance..................................................................................................... 29
Box figure
4.1. The TNI value of selected TNCs from developing economies, 1993-2003 .................... 17
Box tables
5.1. Ford Motor and Toyota: data for 2004................................................................................ 24 6.1. Estimation results of the model with Two-Stage Least Squares ......................................... 30
Annex tables
1. Selected indicators of FDI and international production, 1990-2003 .................................. 39 2. The world's top 100 Largest TNCs, ranked by foreign assets, 2003.................................... 40 3. The world's top 100 Largest TNCs, ranked by foreign assets, 2004.................................... 43 4. The top 50 TNCs from developing countries, 2003............................................................. 46 5. The top 50 TNCs from developing countries, 2004............................................................. 48 6. The top 25 TNCs from Central Europe, 2002 ...................................................................... 50 7. The top 10 TNCs from South-East Europe and the CIS, 2003 ............................................ 50 8. Transnationality indices for the World's largest TNCs, 2003 .............................................. 51 9. The most favoured locations for FDI by the top 100 TNCs, 2003....................................... 53
Annex figure
1. Annual average growth rates of total real gross domestic product ...................................... 52
vii
UNCTAD Current Studies on FDI and Development
Executive summary
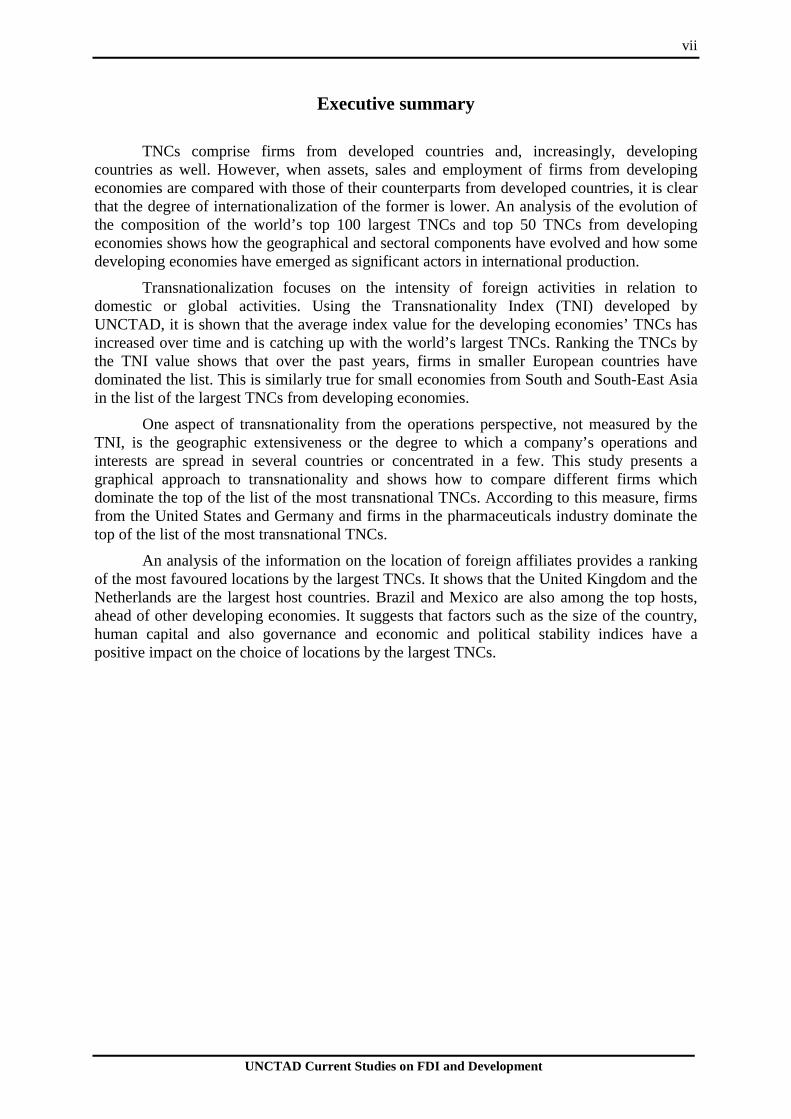
TNCs comprise firms from developed countries and, increasingly, developing countries as well. However, when assets, sales and employment of firms from developing economies are compared with those of their counterparts from developed countries, it is clear that the degree of internationalization of the former is lower. An analysis of the evolution of the composition of the world’s top 100 largest TNCs and top 50 TNCs from developing economies shows how the geographical and sectoral components have evolved and how some developing economies have emerged as significant actors in international production.
Transnationalization focuses on the intensity of foreign activities in relation to domestic or global activities. Using the Transnationality Index (TNI) developed by UNCTAD, it is shown that the average index value for the developing economies’ TNCs has increased over time and is catching up with the world’s largest TNCs. Ranking the TNCs by the TNI value shows that over the past years, firms in smaller European countries have dominated the list. This is similarly true for small economies from South and South-East Asia in the list of the largest TNCs from developing economies.
One aspect of transnationality from the operations perspective, not measured by the TNI, is the geographic extensiveness or the degree to which a company’s operations and interests are spread in several countries or concentrated in a few. This study presents a graphical approach to transnationality and shows how to compare different firms which dominate the top of the list of the most transnational TNCs. According to this measure, firms from the United States and Germany and firms in the pharmaceuticals industry dominate the top of the list of the most transnational TNCs.
An analysis of the information on the location of foreign affiliates provides a ranking of the most favoured locations by the largest TNCs. It shows that the United Kingdom and the Netherlands are the largest host countries. Brazil and Mexico are also among the top hosts, ahead of other developing economies. It suggests that factors such as the size of the country, human capital and also governance and economic and political stability indices have a positive impact on the choice of locations by the largest TNCs.

I. Introduction
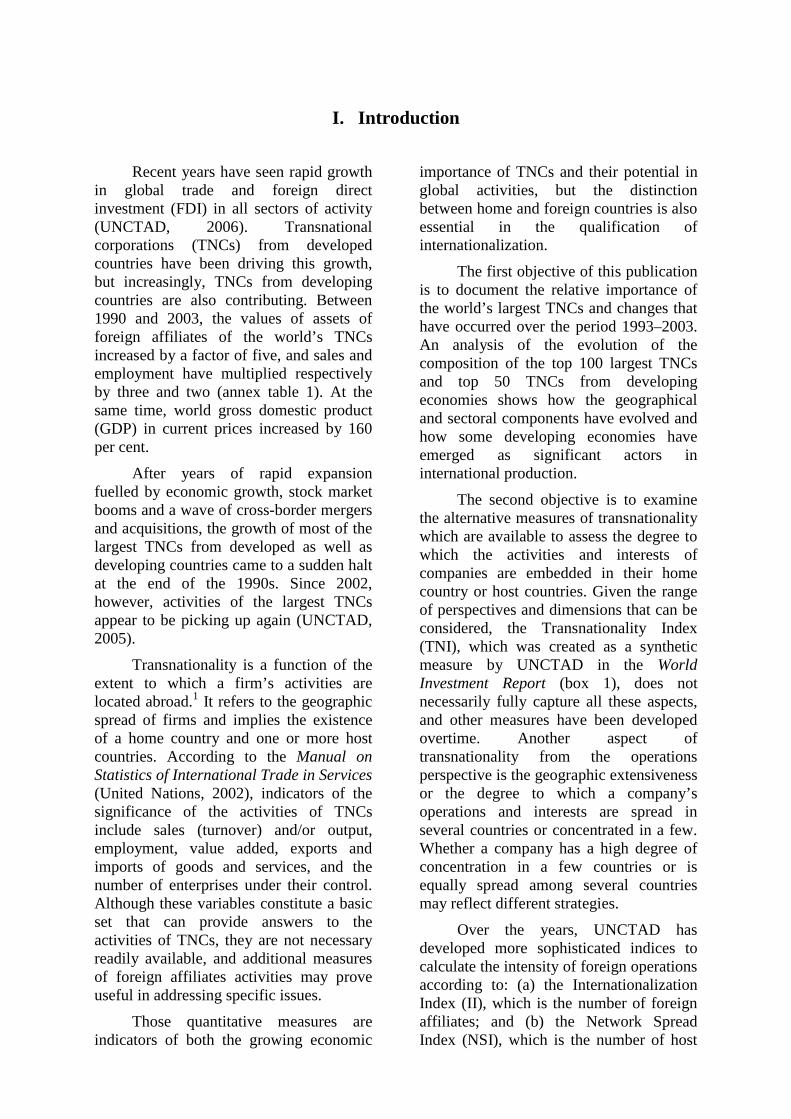
Recent years have seen rapid growth in global trade and foreign direct investment (FDI) in all sectors of activity (UNCTAD, 2006). Transnational corporations (TNCs) from developed countries have been driving this growth, but increasingly, TNCs from developing countries are also contributing. Between 1990 and 2003, the values of assets of foreign affiliates of the world’s TNCs increased by a factor of five, and sales and employment have multiplied respectively by three and two (annex table 1). At the same time, world gross domestic product (GDP) in current prices increased by 160 per cent.
After years of rapid expansion fuelled by economic growth, stock market booms and a wave of cross-border mergers and acquisitions, the growth of most of the largest TNCs from developed as well as developing countries came to a sudden halt at the end of the 1990s. Since 2002, however, activities of the largest TNCs appear to be picking up again (UNCTAD, 2005).
Transnationality is a function of the extent to which a firm’s activities are located abroad.1 It refers to the geographic spread of firms and implies the existence of a home country and one or more host countries. According to the Manual on Statistics of International Trade in Services (United Nations, 2002), indicators of the significance of the activities of TNCs include sales (turnover) and/or output, employment, value added, exports and imports of goods and services, and the number of enterprises under their control. Although these variables constitute a basic set that can provide answers to the activities of TNCs, they are not necessary readily available, and additional measures of foreign affiliates activities may prove useful in addressing specific issues.
Those quantitative measures are indicators of both the growing economic
importance of TNCs and their potential in global activities, but the distinction between home and foreign countries is also essential in the qualification of internationalization.
The first objective of this publication is to document the relative importance of the world’s largest TNCs and changes that have occurred over the period 1993–2003. An analysis of the evolution of the composition of the top 100 largest TNCs and top 50 TNCs from developing economies shows how the geographical and sectoral components have evolved and how some developing economies have emerged as significant actors in international production.
The second objective is to examine the alternative measures of transnationality which are available to assess the degree to which the activities and interests of companies are embedded in their home country or host countries. Given the range of perspectives and dimensions that can be considered, the Transnationality Index (TNI), which was created as a synthetic measure by UNCTAD in the World Investment Report (box 1), does not necessarily fully capture all these aspects, and other measures have been developed overtime. Another aspect of transnationality from the operations perspective is the geographic extensiveness or the degree to which a company’s operations and interests are spread in several countries or concentrated in a few. Whether a company has a high degree of concentration in a few countries or is equally spread among several countries may reflect different strategies.
Over the years, UNCTAD has developed more sophisticated indices to calculate the intensity of foreign operations according to: (a) the Internationalization Index (II), which is the number of foreign affiliates; and (b) the Network Spread Index (NSI), which is the number of host
2 The Universe of the Largest Transnational Corporations
UNCTAD Current Studies on FDI and Development
countries. In this publication, we compare several measures of transnationality and define a new Transnationality Spread Index (TSI), a composite index of the II and NSI. The use of individual indicators to measure corporate internationalization is more or less appropriate and composite indicators are generally more reliable, taking into account several variables combining different aspects of internationalization. A graphical approach to transnationality is suggested in this publication with a four-dimension graph. The surface of the quadrilateral gives a measure of the most transnational firm based on multidimensional aspects.
Finally, an analysis of the information on the location of foreign affiliates suggests that location-specific advantages of host countries – such as the potential size and economic development
of the market, level of education and good governance – are significant factors explaining the spread of activities of TNCs outside their national boundaries. This publication examines some of the factors that influence the choice of whether to establish a foreign affiliate in a particular country.
In the following chapters, this publication analyses the universe of the largest TNCs globally and those from developing countries (chapters 2 and 3), the market concentration of these firms (chapter 4) and the internationalization of their activities (chapter 5). Chapter 6 asks the questions of how transnational are TNCs and proposes a new graphical approach to transnationality. Chapter 7 analyzes the most-preferred locations by the largest TNCs and the last chapter concludes the publication.
Box 1. The largest TNCs in the World Investment Report
A first list of the world’s largest non-financial TNCs based in developed countries was
published in the World Investment Report 1993. It contained 100 firms ranked by foreign assets for 1990 and included data on the activities of these companies, i.e. assets, sales and employment. In the World Investment Report 1994, the list was based on data gathered for 1992 and the same ranking has been published regularly since. Financial firms are not included because of the different economic functions of assets of financial and non-financial firms.
For the first time, in the World Investment Report 1995, an index of transnationality was calculated as the average of foreign assets to total assets, of foreign sales to total sales and of foreign employment to total employment. Also, a first list of the top 50 largest TNCs based in developing countries, ranked by foreign assets in 1993, was published in that report.
Findings in this publication are based on publications of the top TNCs from developed and developing countries in the World Investment Report since 1995. The source of the largest TNCs tables is published in the World Investment Report. It was developed during 1997 and 1998 to originally cover the internationalization strategies of a selection of the world’s largest enterprises. It covers the so-called “largest” TNCs from developed and developing countries and economies in transition.
All table ranking the largest non-financial TNCs by their foreign assets and published in the World Investment Report series are available at www.unctad.org/wir. The last two years are reproduced in annex tables 2 to 7.
Source: UNCTAD.
II. The universe of the largest TNCs: 2004 snapshot
The universe of TNCs is large, diverse and expanding. By the early 1990s, there were an estimated 37,000 TNCs in the world, with 170,000 foreign affiliates. Of these, 33,500 were parent corporations based in developed countries. Today, there are an estimated 77,000 TNCs in the world, with more than 770,000 foreign affiliates. These affiliates generated an estimated $4.5 trillion in value added, employed some 62 million workers and exported goods and services valued at more than $4 trillion (UNCTAD, 2006).
Even those figures probably understate the role of TNCs in the global economy, both because of measurement difficulties, and because firms carry out their transnational activities through a variety of non-equity arrangements – subcontracting, franchising, licensing and the like, as well as through the formation of strategic alliances. These forms of
international expansion occur with little or no FDI, and are therefore only partially captured by FDI data or by firm-level data defined by equity participation.
TNCs comprise firms from developed countries and, increasingly, developing economies as well, reflecting the substantial increase of FDI from these economies over the past decade (UNCTAD, 2006). However, when comparing foreign to total assets, sales and employment ratios of TNCs from developing economies with those of their counterparts from developed countries, it is clear that the degree of internationalization of the former is lower (table 1).
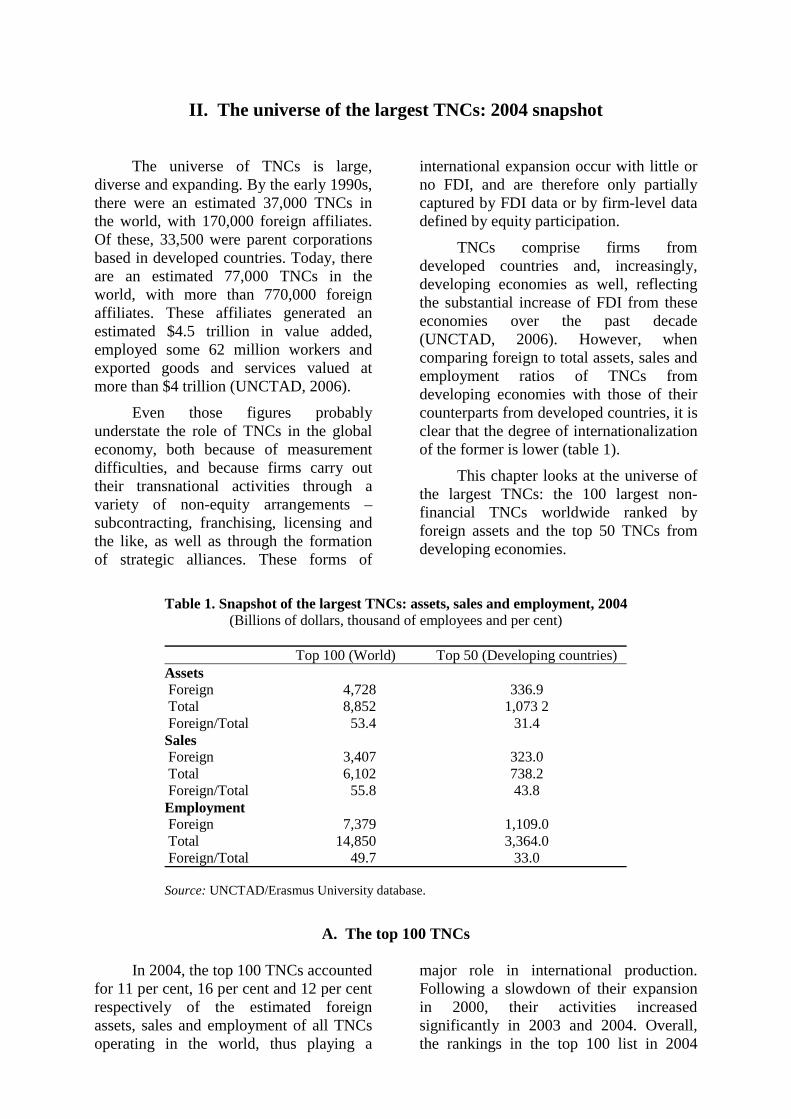
This chapter looks at the universe of the largest TNCs: the 100 largest non-financial TNCs worldwide ranked by foreign assets and the top 50 TNCs from developing economies.
Table 1. Snapshot of the largest TNCs: assets, sales and employment, 2004(Billions of dollars, thousand of employees and per cent)
Top 100 (World) Top 50 (Developing countries) Assets Foreign 4,728 336.9 Total 8,852 1,073 2 Foreign/Total 53.4 31.4 Sales Foreign 3,407 323.0 Total 6,102 738.2 Foreign/Total 55.8 43.8 Employment Foreign 7,379 1,109.0 Total 14,850 3,364.0 Foreign/Total 49.7 33.0 Source: UNCTAD/Erasmus University database.
A. The top 100 TNCs
In 2004, the top 100 TNCs accounted for 11 per cent, 16 per cent and 12 per cent respectively of the estimated foreign assets, sales and employment of all TNCs operating in the world, thus playing a
major role in international production. Following a slowdown of their expansion in 2000, their activities increased significantly in 2003 and 2004. Overall, the rankings in the top 100 list in 2004
4 The Universe of the Largest Transnational Corporations
UNCTAD Current Studies on FDI and Development
have remained relatively stable compared to the past few years. General Electric, Vodafone and Ford Motor headed the list, jointly holding about $877 billion in foreign assets, corresponding to nearly 19 per cent of total foreign assets of the top 100 largest TNCs (UNCTAD, 2006).
Six industries still dominated the list – motor vehicles, pharmaceuticals, telecommunications, utilities, petroleum and electrical/electronic equipment accounted for more than 60 per cent of the activities of the largest TNCs. A large group of new TNCs has emerged in recent years in service industries that are relatively new to FDI – notably telecommunications, electricity, water and postal services – many of which were former State-owned monopolies. In 2004,
these industries accounted for almost 20 per cent of the first 100 entries.
In 2004, 85 per cent of the top 100 TNCs were headquartered in the Triad (European Union, Japan and the United States), with TNCs headquartered in the United States dominating the list with 25 entries. Five countries (the United States, United Kingdom, Japan, France and Germany) accounted for 73 per cent of the top 100 firms, while the EU alone represented 53 per cent of all entries. Five TNCs originating from developing economies (the largest number ever) were also ranked in the top 100 in 2004. It is noteworthy that some large TNCs that had their origin in developing countries are now registered in the European Union.2
B. The top 50 TNCs from developing economies
TNCs from developing economies have kept expanding their activities abroad. In 2004, their foreign assets climbed to $337 billion, from $249 billion in 2003. As in 2003, the five largest TNCs accounted for almost half of the foreign assets of the top 50. With foreign assets of $68 billion, Hutchison Whampoa (Hong Kong, China) continued in the leading position, accounting for as much as 20 per cent of the top 50’s foreign assets. Petronas (Malaysia), Singtel (Singapore), Samsung Electronics (the Republic of Korea), CITIC Group (China) and Cemex (Mexico) occupied the following positions, accounting for another 25 per cent (UNCTAD, 2006).
The regions and countries of origin of the top 50 TNCs have changed little over the years, and their geographic representation still favours South, East and South-East Asia. In 2004, Asia strengthened its dominance in the top 50, with 38 enterprises making the list. The other 12 enterprises came from South
Africa (five), Mexico (four) and Brazil (three). Hong Kong, China (10) and Singapore (seven) were the most important home economies of the top 50 TNCs and Taiwan Province of China, with five companies in the top 50, was in third place.
The top 50 TNCs operate in a wide range of industries. In 2004, the most important was the electrical/electronic equipments and computer industry, with a large number of companies from Asia, and the second most important, the food and beverages industry. Other relatively well-represented industries in the top 50 included petroleum, telecommunications and transportation.
In 2004, the top five companies in the top 50 list were also part of the world’s 100 largest non-financial TNCs. It is likely that in the future an increasing number of TNCs from developing economies will enter the list of the top 100, since outward FDI from these countries is expanding (UNCTAD, 2006). For the time being, though, the large gap between TNCs from
Chapter II 5
UNCTAD Current Studies on FDI and Development
the developed and developing groups remains. For instance, the total foreign assets of the top 50 TNCs from developing economies in 2003 amounted to roughly
the amount of foreign assets of a single firm, General Electric, the world’s largest TNC.
C. TNCs from Central Europe, South-East Europe and
the Commonwealth of Independent States
After the reclassification of the eight European Union-acceding countries from Central Europe as developed countries, the review of the top 25 TNCs from Central and Eastern Europe has been discontinued. This list was published for the first time in the World Investment Report 1999. The largest companies from the Czech Republic, Hungary and Slovenia are small even compared with TNCs from developing
economies, or have disappeared after having merged with European counterparts.
The largest non-financial TNCs from South-East Europe and the Commonwealth of Independent States (CIS) have always been smaller than the listed TNCs from developing countries, with the exception of the largest Russian firm Lukoil, which ranks each year among the top 10 of the largest TNCs from developing countries.

III. The growing importance of TNCs over the period 1993–2003
In the early 1990s, more than 90 per cent of all TNCs were headquartered in the developed world and less than 1 per cent originated from Central and Eastern Europe. Those from developing countries accounted for approximately 8 per cent of all parent corporations, as reported by UNCTAD (1994). Today, parent corporations from developing economies
account for a quarter of all TNCs and five of them are ranked among the 100 largest in the world. This chapter looks at the universe of the largest TNCs over time: the 100 largest non-financial TNCs worldwide ranked by foreign assets and the top 50 non-financial TNCs from developing economies.
A. The top 100 TNCs from 1993 to 2003
The largest 100 TNCs ranked by
foreign assets had about $3.4 trillion in global assets in 1993, of which about $1.3 trillion was held outside their respective home countries. These firms accounted for an estimated one third of the combined outward FDI of their countries of origin. All were headquartered in developed countries and 85 per cent originated from the Triad. In 2003, 85 per cent of the top 100 TNCs were still headquartered in the Triad, but came from 19 countries instead of 12 in 1993.
While a number of new companies from the services sector assumed high rankings on the list over the decade, some companies in the more traditionally
important industries remained in the highest rankings. In the petroleum industry, for instance, Shell and Exxon, which were number one and two respectively in 1993, remained among the top 10 TNCs. Motor companies such as Ford, General Motors and Toyota – ranked seventh, fourth and sixth respectively – also remained among the top 10. Globally, 10 of the top 20 companies in 2003 were already in the top 20 in 1993.
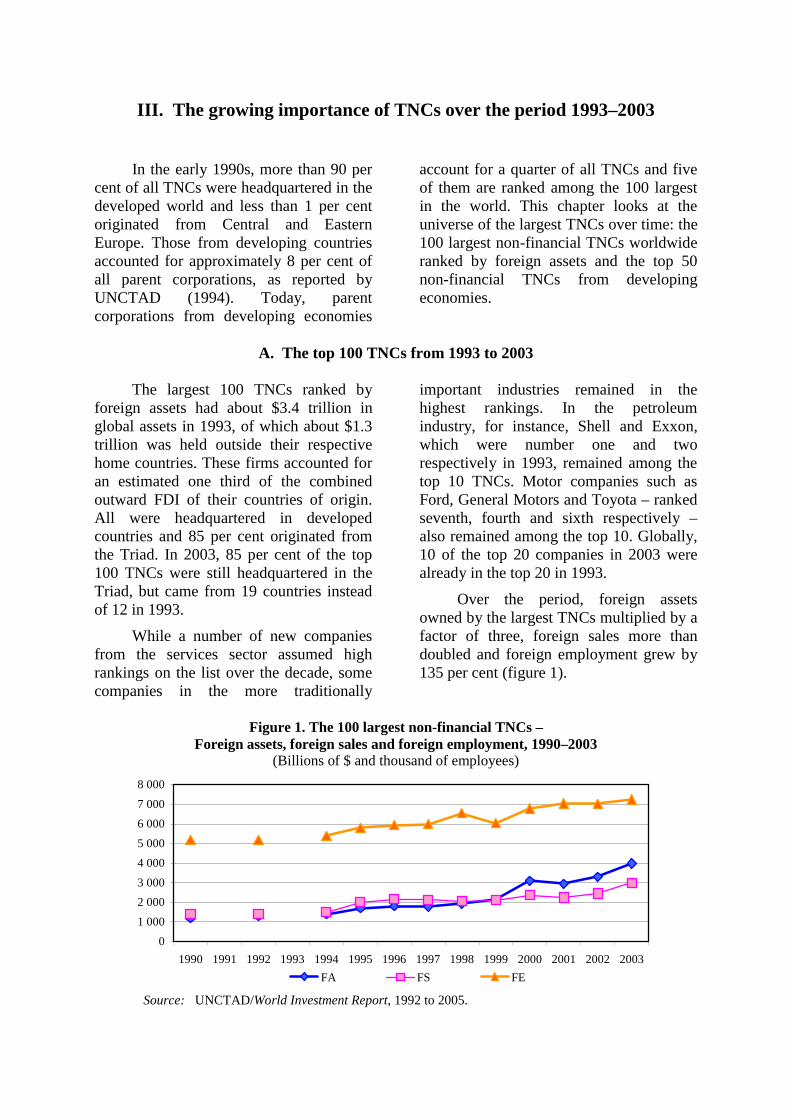
Over the period, foreign assets owned by the largest TNCs multiplied by a factor of three, foreign sales more than doubled and foreign employment grew by 135 per cent (figure 1).
Figure 1. The 100 largest non-financial TNCs –
Foreign assets, foreign sales and foreign employment, 1990–2003 (Billions of $ and thousand of employees)
0
1 000
2 000
3 000
4 000
5 000
6 000
7 000
8 000
1990 1991 1992 1993 1994 1995 1996 1997 1998 1999 2000 2001 2002 2003
FA FS FE
Source: UNCTAD/World Investment Report, 1992 to 2005.
8 The Universe of the Largest Transnational Corporations
UNCTAD Current Studies on FDI and Development
B. The top 50 TNCs from developing economies
The largest 50 TNCs from developing economies had about $293 billion in global assets in 1993, about a tenth of the global assets of the 50 largest TNCs ($2.71 trillion). In 2003, the comparison remained similar and even decreased slightly, to 9 per cent. In terms of the size of total assets and total sales, as well as foreign assets and foreign sales, TNCs from developing countries were significantly smaller than the largest TNCs worldwide. However, the largest company in terms of total assets, Samsung Electronics (Republic of Korea), had total assets equivalent to those of Sony (Japan). The largest developing-country TNC, judging by the size of its foreign assets, was Cemex S.A. (Mexico), followed by Hutchinson Whampoa Ltd. (Hong Kong, China). These two companies were still in the top five of TNCs from developing economies in 2003.
However, in terms of foreign assets, in 1993 none of these TNCs were ranked in the 100 world’s largest. The first two companies from developing countries to make the list (in 1995) were a TNC from the Republic of Korea (Daewoo) and a petroleum company from the Bolivarian Republic of Venezuela (Petroleos de Venezuela). From 1993 to 2003, the largest TNCs from developing economies expanded their activities abroad. In 2003,
four of them were ranked among the world’s largest.
In 1993, 10 TNCs were headquartered in Brazil and nine in the Republic of Korea. Overall, there were 33 TNCs from Asia and 17 from Latin America. Many new companies entered the top 50 during the period, but the number of host countries remained equal to 10 economies. However, during the period 1993–2003, Asia strengthened its dominance in the top 50, with 39 enterprises on the list. As for the world’s largest TNCs, new companies in the telecommunications and utilities industries emerged among the top 50, but companies from the electrical/electronic and computers equipment sectors remained an important component of the list. The food products and the hotel industries, which were together a dominant sector in 1993, were still important elements of activity in 2003.
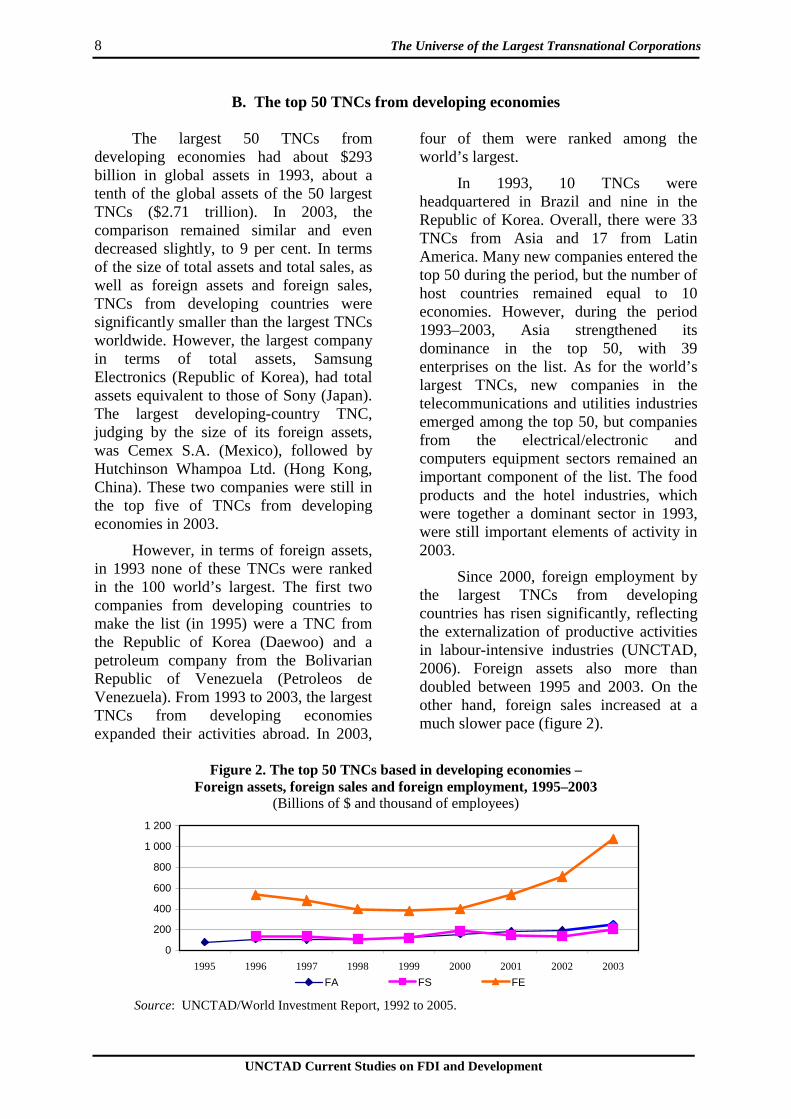
Since 2000, foreign employment by the largest TNCs from developing countries has risen significantly, reflecting the externalization of productive activities in labour-intensive industries (UNCTAD, 2006). Foreign assets also more than doubled between 1995 and 2003. On the other hand, foreign sales increased at a much slower pace (figure 2).
Figure 2. The top 50 TNCs based in developing economies –
Foreign assets, foreign sales and foreign employment, 1995–2003 (Billions of $ and thousand of employees)
0
200
400
600
800
1 000
1 200
1995 1996 1997 1998 1999 2000 2001 2002 2003
FA FS FE
Source: UNCTAD/World Investment Report, 1992 to 2005.
Chapter III 9
UNCTAD Current Studies on FDI and Development
C. Performance indicators
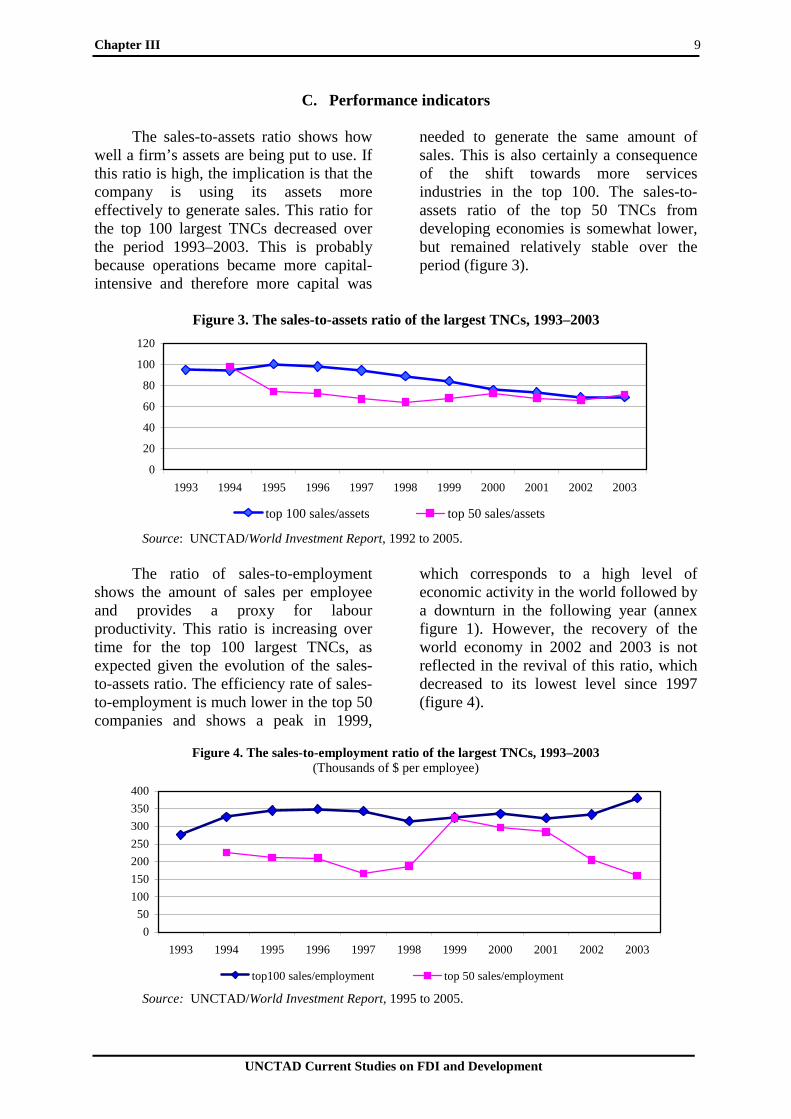
The sales-to-assets ratio shows how well a firm’s assets are being put to use. If this ratio is high, the implication is that the company is using its assets more effectively to generate sales. This ratio for the top 100 largest TNCs decreased over the period 1993–2003. This is probably because operations became more capital-intensive and therefore more capital was
needed to generate the same amount of sales. This is also certainly a consequence of the shift towards more services industries in the top 100. The sales-to-assets ratio of the top 50 TNCs from developing economies is somewhat lower, but remained relatively stable over the period (figure 3).
Figure 3. The sales-to-assets ratio of the largest TNCs, 1993–2003
0
20
40
60
80
100
120
1993 1994 1995 1996 1997 1998 1999 2000 2001 2002 2003
top 100 sales/assets top 50 sales/assets
Source: UNCTAD/World Investment Report, 1992 to 2005.
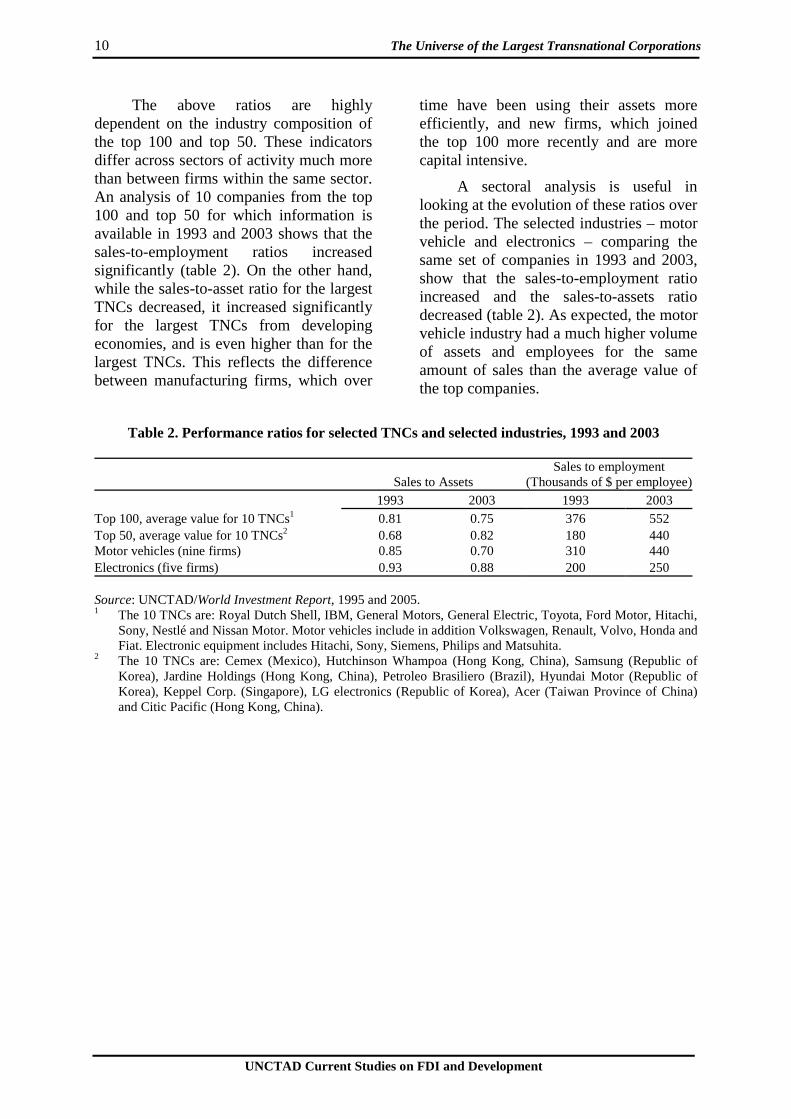
The ratio of sales-to-employment shows the amount of sales per employee and provides a proxy for labour productivity. This ratio is increasing over time for the top 100 largest TNCs, as expected given the evolution of the sales-to-assets ratio. The efficiency rate of sales-to-employment is much lower in the top 50 companies and shows a peak in 1999,
which corresponds to a high level of economic activity in the world followed by a downturn in the following year (annex figure 1). However, the recovery of the world economy in 2002 and 2003 is not reflected in the revival of this ratio, which decreased to its lowest level since 1997 (figure 4).
Figure 4. The sales-to-employment ratio of the largest TNCs, 1993–2003
(Thousands of $ per employee)
0
50
100
150
200
250
300
350
400
1993 1994 1995 1996 1997 1998 1999 2000 2001 2002 2003
top100 sales/employment top 50 sales/employment
Source: UNCTAD/World Investment Report, 1995 to 2005.
10 The Universe of the Largest Transnational Corporations
UNCTAD Current Studies on FDI and Development
The above ratios are highly dependent on the industry composition of the top 100 and top 50. These indicators differ across sectors of activity much more than between firms within the same sector. An analysis of 10 companies from the top 100 and top 50 for which information is available in 1993 and 2003 shows that the sales-to-employment ratios increased significantly (table 2). On the other hand, while the sales-to-asset ratio for the largest TNCs decreased, it increased significantly for the largest TNCs from developing economies, and is even higher than for the largest TNCs. This reflects the difference between manufacturing firms, which over
time have been using their assets more efficiently, and new firms, which joined the top 100 more recently and are more capital intensive.
A sectoral analysis is useful in looking at the evolution of these ratios over the period. The selected industries – motor vehicle and electronics – comparing the same set of companies in 1993 and 2003, show that the sales-to-employment ratio increased and the sales-to-assets ratio decreased (table 2). As expected, the motor vehicle industry had a much higher volume of assets and employees for the same amount of sales than the average value of the top companies.
Table 2. Performance ratios for selected TNCs and selected industries, 1993 and 2003
Sales to Assets Sales to employment
(Thousands of $ per employee) 1993 2003 1993 2003 Top 100, average value for 10 TNCs1 0.81 0.75 376 552 Top 50, average value for 10 TNCs2 0.68 0.82 180 440 Motor vehicles (nine firms) 0.85 0.70 310 440 Electronics (five firms) 0.93 0.88 200 250 Source: UNCTAD/World Investment Report, 1995 and 2005. 1 The 10 TNCs are: Royal Dutch Shell, IBM, General Motors, General Electric, Toyota, Ford Motor, Hitachi,
Sony, Nestlé and Nissan Motor. Motor vehicles include in addition Volkswagen, Renault, Volvo, Honda and Fiat. Electronic equipment includes Hitachi, Sony, Siemens, Philips and Matsuhita.
2 The 10 TNCs are: Cemex (Mexico), Hutchinson Whampoa (Hong Kong, China), Samsung (Republic of Korea), Jardine Holdings (Hong Kong, China), Petroleo Brasiliero (Brazil), Hyundai Motor (Republic of Korea), Keppel Corp. (Singapore), LG electronics (Republic of Korea), Acer (Taiwan Province of China) and Citic Pacific (Hong Kong, China).
UNCTAD Current Studies on FDI and Development
IV. Measures of size and concentration
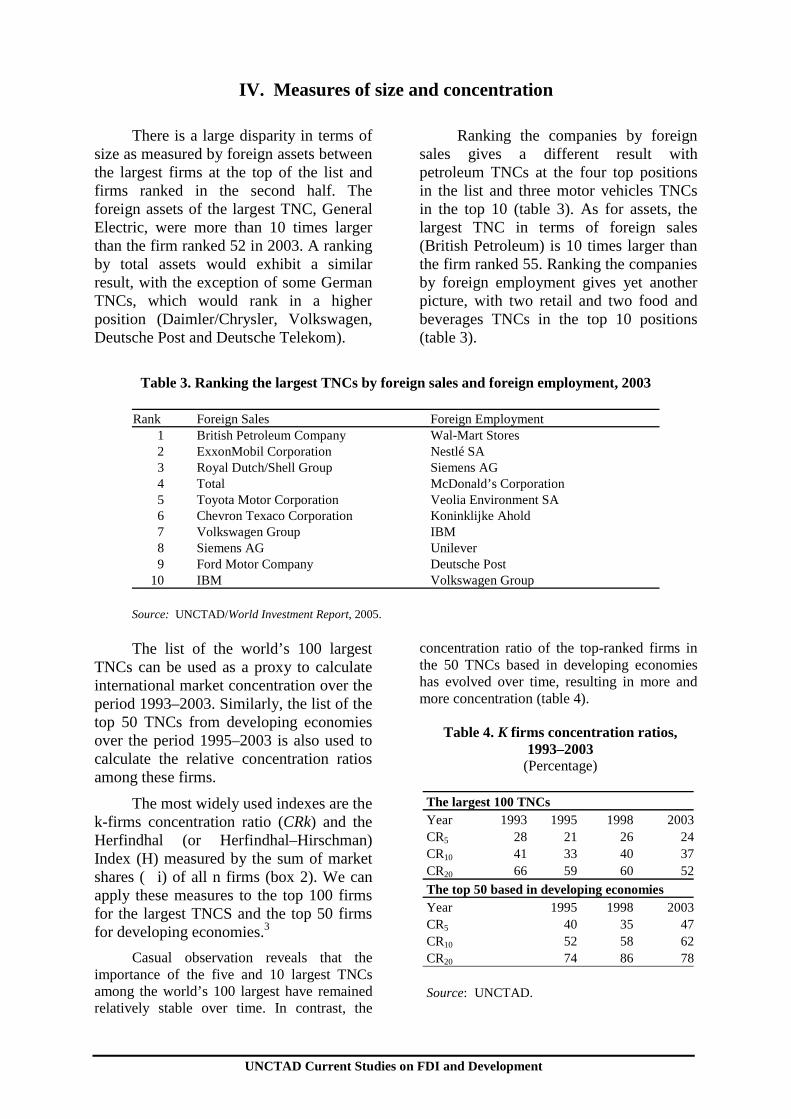
There is a large disparity in terms of size as measured by foreign assets between the largest firms at the top of the list and firms ranked in the second half. The foreign assets of the largest TNC, General Electric, were more than 10 times larger than the firm ranked 52 in 2003. A ranking by total assets would exhibit a similar result, with the exception of some German TNCs, which would rank in a higher position (Daimler/Chrysler, Volkswagen, Deutsche Post and Deutsche Telekom).
Ranking the companies by foreign sales gives a different result with petroleum TNCs at the four top positions in the list and three motor vehicles TNCs in the top 10 (table 3). As for assets, the largest TNC in terms of foreign sales (British Petroleum) is 10 times larger than the firm ranked 55. Ranking the companies by foreign employment gives yet another picture, with two retail and two food and beverages TNCs in the top 10 positions (table 3).
Table 3. Ranking the largest TNCs by foreign sales and foreign employment, 2003
Rank Foreign Sales Foreign Employment
1 British Petroleum Company Wal-Mart Stores 2 ExxonMobil Corporation Nestlé SA 3 Royal Dutch/Shell Group Siemens AG 4 Total McDonald’s Corporation 5 Toyota Motor Corporation Veolia Environment SA 6 Chevron Texaco Corporation Koninklijke Ahold 7 Volkswagen Group IBM 8 Siemens AG Unilever 9 Ford Motor Company Deutsche Post
10 IBM Volkswagen Group
Source: UNCTAD/World Investment Report, 2005.
The list of the world’s 100 largest TNCs can be used as a proxy to calculate international market concentration over the period 1993–2003. Similarly, the list of the top 50 TNCs from developing economies over the period 1995–2003 is also used to calculate the relative concentration ratios among these firms.
The most widely used indexes are the k-firms concentration ratio (CRk) and the Herfindhal (or Herfindhal–Hirschman) Index (H) measured by the sum of market shares (�i) of all n firms (box 2). We can apply these measures to the top 100 firms for the largest TNCS and the top 50 firms for developing economies.3
Casual observation reveals that the importance of the five and 10 largest TNCs among the world’s 100 largest have remained relatively stable over time. In contrast, the
concentration ratio of the top-ranked firms in the 50 TNCs based in developing economies has evolved over time, resulting in more and more concentration (table 4).
Table 4. K firms concentration ratios,
1993–2003 (Percentage)
The largest 100 TNCs Year 1993 1995 1998 2003CR5 28 21 26 24CR10 41 33 40 37CR20 66 59 60 52
The top 50 based in developing economies Year 1995 1998 2003CR5 40 35 47CR10 52 58 62CR20 74 86 78 Source: UNCTAD.
UNCTAD Current Studies on FDI and Development
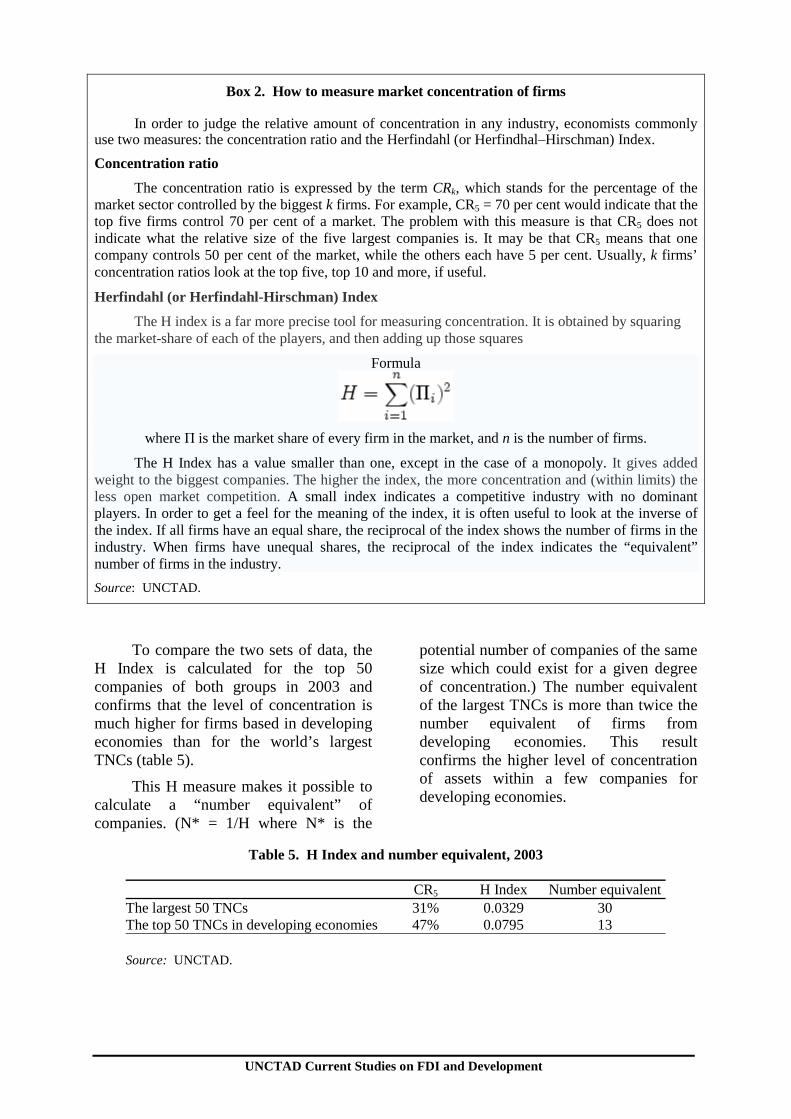
Box 2. How to measure market concentration of firms
In order to judge the relative amount of concentration in any industry, economists commonly use two measures: the concentration ratio and the Herfindahl (or Herfindhal–Hirschman) Index.
Concentration ratio
The concentration ratio is expressed by the term CRk, which stands for the percentage of the market sector controlled by the biggest k firms. For example, CR5 = 70 per cent would indicate that the top five firms control 70 per cent of a market. The problem with this measure is that CR5 does not indicate what the relative size of the five largest companies is. It may be that CR5 means that one company controls 50 per cent of the market, while the others each have 5 per cent. Usually, k firms’ concentration ratios look at the top five, top 10 and more, if useful.
Herfindahl (or Herfindahl-Hirschman) Index
The H index is a far more precise tool for measuring concentration. It is obtained by squaring the market-share of each of the players, and then adding up those squares
Formula
where Π is the market share of every firm in the market, and n is the number of firms.
The H Index has a value smaller than one, except in the case of a monopoly. It gives added weight to the biggest companies. The higher the index, the more concentration and (within limits) the less open market competition. A small index indicates a competitive industry with no dominant players. In order to get a feel for the meaning of the index, it is often useful to look at the inverse of the index. If all firms have an equal share, the reciprocal of the index shows the number of firms in the industry. When firms have unequal shares, the reciprocal of the index indicates the “equivalent” number of firms in the industry.
Source: UNCTAD.
To compare the two sets of data, the H Index is calculated for the top 50 companies of both groups in 2003 and confirms that the level of concentration is much higher for firms based in developing economies than for the world’s largest TNCs (table 5).
This H measure makes it possible to calculate a “number equivalent” of companies. (N* = 1/H where N* is the
potential number of companies of the same size which could exist for a given degree of concentration.) The number equivalent of the largest TNCs is more than twice the number equivalent of firms from developing economies. This result confirms the higher level of concentration of assets within a few companies for developing economies.
Table 5. H Index and number equivalent, 2003
CR5 H Index Number equivalent The largest 50 TNCs 31% 0.0329 30 The top 50 TNCs in developing economies 47% 0.0795 13 Source: UNCTAD.
UNCTAD Current Studies on FDI and Development
V. The Transnationality Index from 1993 to 2003
Transnationalization focuses on the intensity of foreign activities in relation to domestic or global activities. The Transnationality Index (TNI) published by UNCTAD is a composite of three ratios: foreign assets–total assets, foreign sales–total sales and foreign employment–total employment. The conceptual framework underlying this index helps to assess the degree to which the activities and interests of companies are embedded in their home country or host countries.4
A high TNI value may raise questions about a home country’s locational advantages (a small market, for example) or indicate strong international competitiveness on the part of the home country firms. A drawback of this index is that it does not take into account the size of the home country, nor does it distinguish between companies whose activities are concentrated in a few foreign countries and companies whose activities are spread across numerous host countries.
A. TNI values over the period 1993–2003
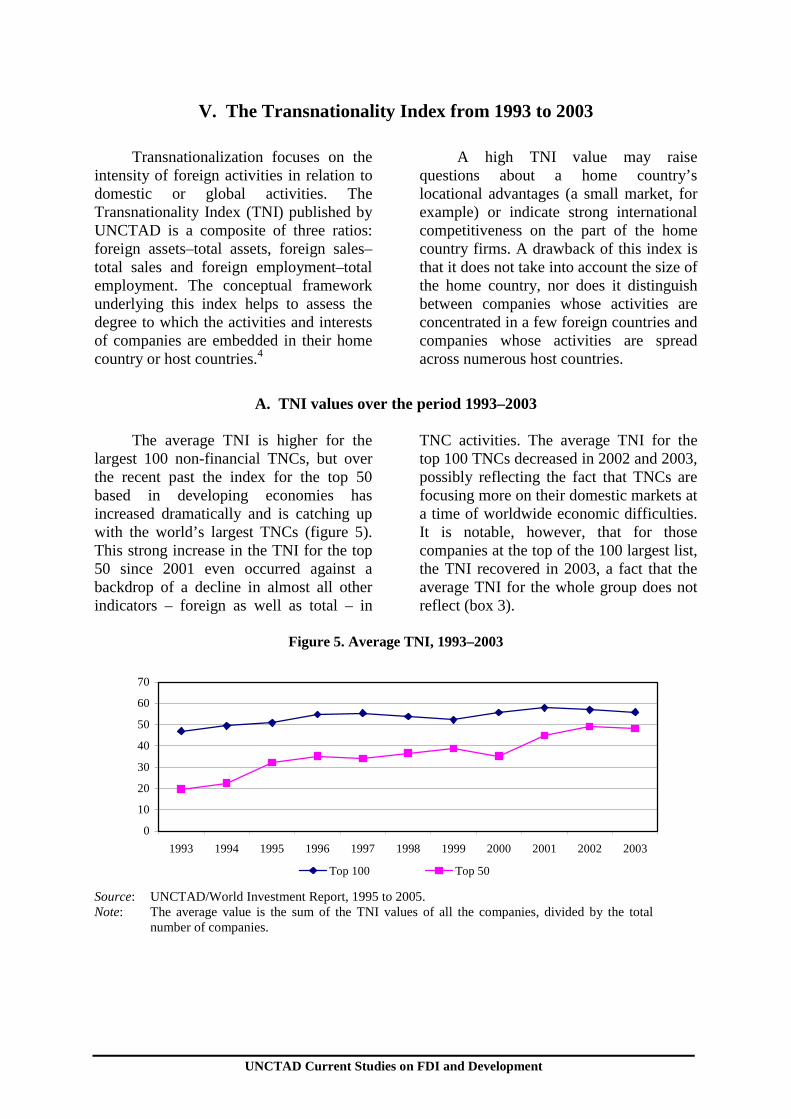
The average TNI is higher for the
largest 100 non-financial TNCs, but over the recent past the index for the top 50 based in developing economies has increased dramatically and is catching up with the world’s largest TNCs (figure 5). This strong increase in the TNI for the top 50 since 2001 even occurred against a backdrop of a decline in almost all other indicators – foreign as well as total – in
TNC activities. The average TNI for the top 100 TNCs decreased in 2002 and 2003, possibly reflecting the fact that TNCs are focusing more on their domestic markets at a time of worldwide economic difficulties. It is notable, however, that for those companies at the top of the 100 largest list, the TNI recovered in 2003, a fact that the average TNI for the whole group does not reflect (box 3).
Figure 5. Average TNI, 1993–2003
0
10
20
30
40
50
60
70
1993 1994 1995 1996 1997 1998 1999 2000 2001 2002 2003
Top 100 Top 50
Source: UNCTAD/World Investment Report, 1995 to 2005. Note: The average value is the sum of the TNI values of all the companies, divided by the total
number of companies.
14 The Universe of the Largest Transnational Corporations
UNCTAD Current Studies on FDI and Development
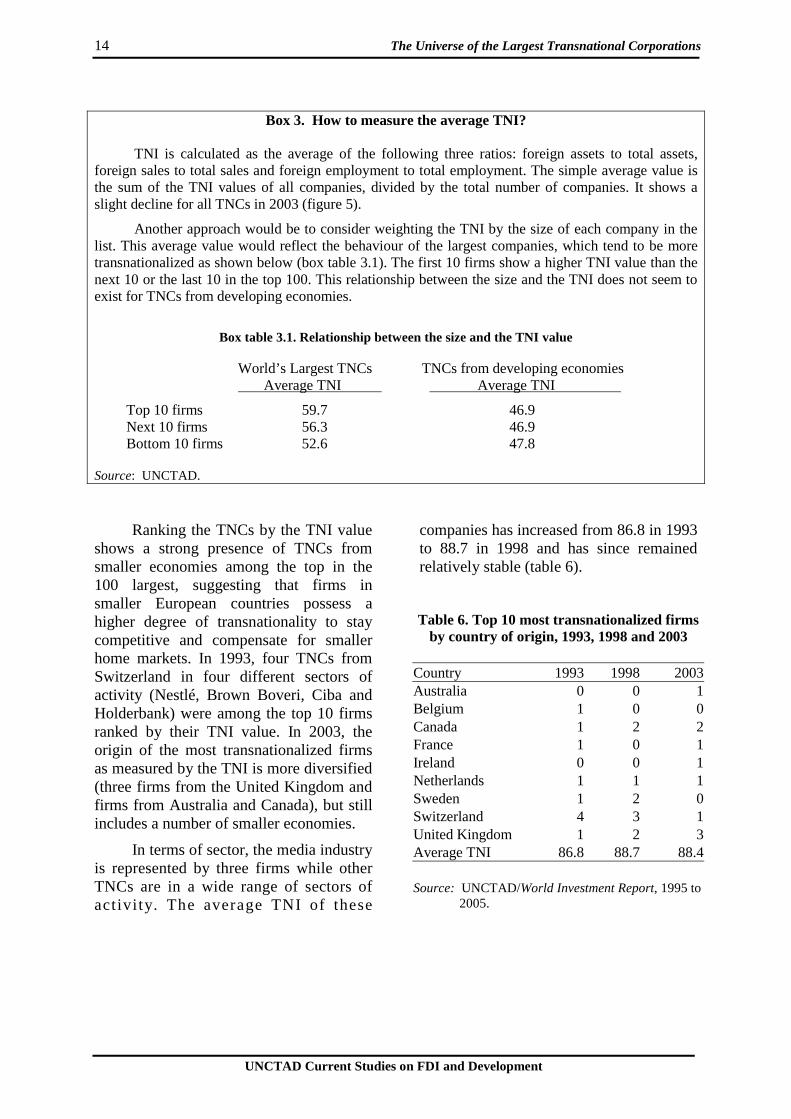
Box 3. How to measure the average TNI?
TNI is calculated as the average of the following three ratios: foreign assets to total assets,
foreign sales to total sales and foreign employment to total employment. The simple average value is the sum of the TNI values of all companies, divided by the total number of companies. It shows a slight decline for all TNCs in 2003 (figure 5).
Another approach would be to consider weighting the TNI by the size of each company in the list. This average value would reflect the behaviour of the largest companies, which tend to be more transnationalized as shown below (box table 3.1). The first 10 firms show a higher TNI value than the next 10 or the last 10 in the top 100. This relationship between the size and the TNI does not seem to exist for TNCs from developing economies.
Box table 3.1. Relationship between the size and the TNI value
World’s Largest TNCs TNCs from developing economies Average TNI Average TNI
Top 10 firms 59.7 46.9 Next 10 firms 56.3 46.9 Bottom 10 firms 52.6 47.8
Source: UNCTAD.
Ranking the TNCs by the TNI value shows a strong presence of TNCs from smaller economies among the top in the 100 largest, suggesting that firms in smaller European countries possess a higher degree of transnationality to stay competitive and compensate for smaller home markets. In 1993, four TNCs from Switzerland in four different sectors of activity (Nestlé, Brown Boveri, Ciba and Holderbank) were among the top 10 firms ranked by their TNI value. In 2003, the origin of the most transnationalized firms as measured by the TNI is more diversified (three firms from the United Kingdom and firms from Australia and Canada), but still includes a number of smaller economies.
In terms of sector, the media industry is represented by three firms while other TNCs are in a wide range of sectors of activity. The average TNI of these
companies has increased from 86.8 in 1993 to 88.7 in 1998 and has since remained relatively stable (table 6).
Table 6. Top 10 most transnationalized firms by country of origin, 1993, 1998 and 2003
Country 1993 1998 2003 Australia 0 0 1 Belgium 1 0 0 Canada 1 2 2 France 1 0 1 Ireland 0 0 1 Netherlands 1 1 1 Sweden 1 2 0 Switzerland 4 3 1 United Kingdom 1 2 3 Average TNI 86.8 88.7 88.4 Source: UNCTAD/World Investment Report, 1995 to
2005.
Chapter V 15
UNCTAD Current Studies on FDI and Development
B. Evolution by region and country
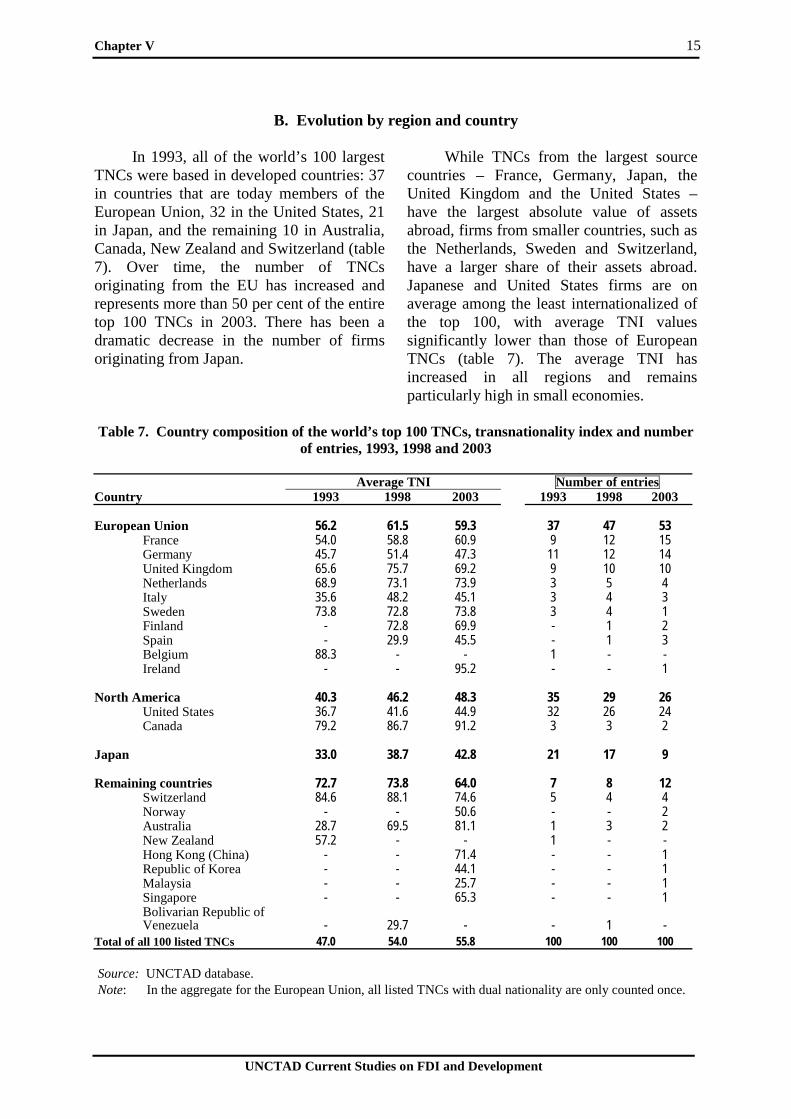
In 1993, all of the world’s 100 largest
TNCs were based in developed countries: 37 in countries that are today members of the European Union, 32 in the United States, 21 in Japan, and the remaining 10 in Australia, Canada, New Zealand and Switzerland (table 7). Over time, the number of TNCs originating from the EU has increased and represents more than 50 per cent of the entire top 100 TNCs in 2003. There has been a dramatic decrease in the number of firms originating from Japan.
While TNCs from the largest source countries – France, Germany, Japan, the United Kingdom and the United States – have the largest absolute value of assets abroad, firms from smaller countries, such as the Netherlands, Sweden and Switzerland, have a larger share of their assets abroad. Japanese and United States firms are on average among the least internationalized of the top 100, with average TNI values significantly lower than those of European TNCs (table 7). The average TNI has increased in all regions and remains particularly high in small economies.
Table 7. Country composition of the world’s top 100 TNCs, transnationality index and number
of entries, 1993, 1998 and 2003
Average TNI Number of entries Country 1993 1998 2003 1993 1998 2003 European Union 56.2 61.5 59.3 37 47 53 France 54.0 58.8 60.9 9 12 15 Germany 45.7 51.4 47.3 11 12 14 United Kingdom 65.6 75.7 69.2 9 10 10 Netherlands 68.9 73.1 73.9 3 5 4 Italy 35.6 48.2 45.1 3 4 3 Sweden 73.8 72.8 73.8 3 4 1 Finland - 72.8 69.9 - 1 2 Spain - 29.9 45.5 - 1 3 Belgium 88.3 - - 1 - - Ireland - - 95.2 - - 1 North America 40.3 46.2 48.3 35 29 26 United States 36.7 41.6 44.9 32 26 24 Canada 79.2 86.7 91.2 3 3 2 Japan 33.0 38.7 42.8 21 17 9 Remaining countries 72.7 73.8 64.0 7 8 12 Switzerland 84.6 88.1 74.6 5 4 4 Norway - - 50.6 - - 2 Australia 28.7 69.5 81.1 1 3 2 New Zealand 57.2 - - 1 - - Hong Kong (China) - - 71.4 - - 1 Republic of Korea - - 44.1 - - 1 Malaysia - - 25.7 - - 1 Singapore - - 65.3 - - 1
Bolivarian Republic of Venezuela - 29.7 - - 1 -
Total of all 100 listed TNCs 47.0 54.0 55.8 100 100 100 Source: UNCTAD database. Note: In the aggregate for the European Union, all listed TNCs with dual nationality are only counted once.
16 The Universe of the Largest Transnational Corporations
UNCTAD Current Studies on FDI and Development
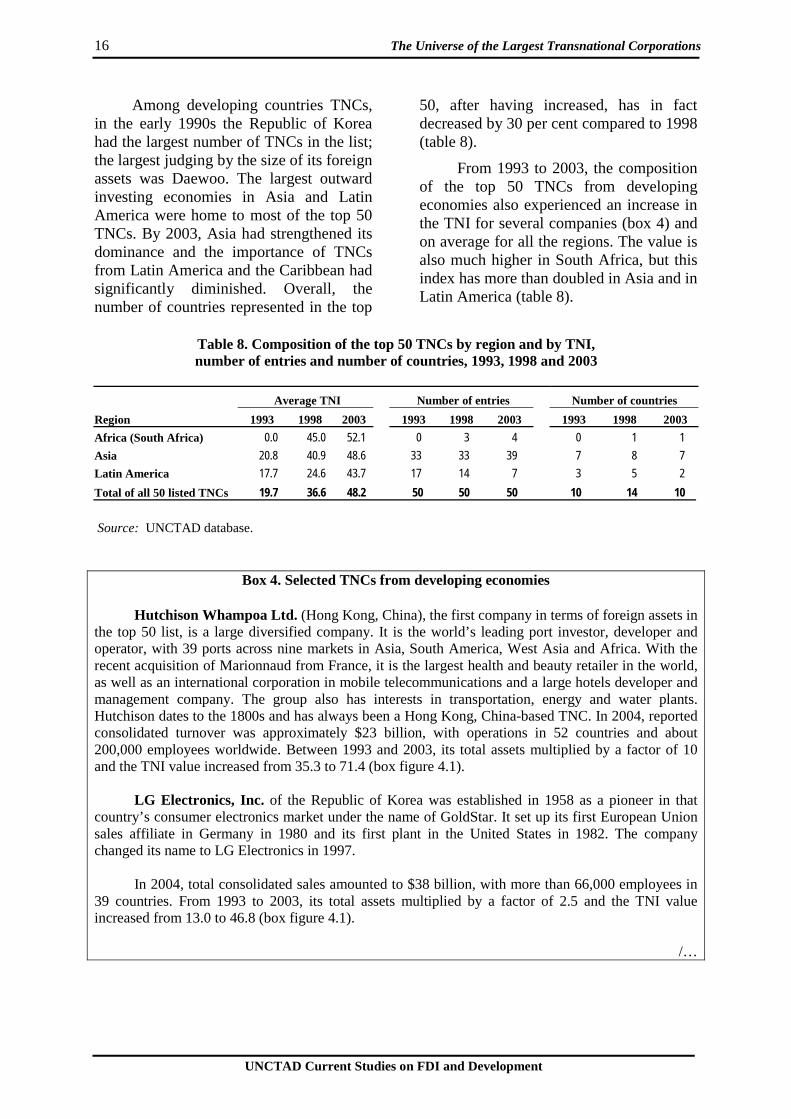
Among developing countries TNCs, in the early 1990s the Republic of Korea had the largest number of TNCs in the list; the largest judging by the size of its foreign assets was Daewoo. The largest outward investing economies in Asia and Latin America were home to most of the top 50 TNCs. By 2003, Asia had strengthened its dominance and the importance of TNCs from Latin America and the Caribbean had significantly diminished. Overall, the number of countries represented in the top
50, after having increased, has in fact decreased by 30 per cent compared to 1998 (table 8).
From 1993 to 2003, the composition of the top 50 TNCs from developing economies also experienced an increase in the TNI for several companies (box 4) and on average for all the regions. The value is also much higher in South Africa, but this index has more than doubled in Asia and in Latin America (table 8).
Table 8. Composition of the top 50 TNCs by region and by TNI, number of entries and number of countries, 1993, 1998 and 2003
Average TNI Number of entries Number of countries
Region 1993 1998 2003 1993 1998 2003 1993 1998 2003
Africa (South Africa) 0.0 45.0 52.1 0 3 4 0 1 1
Asia 20.8 40.9 48.6 33 33 39 7 8 7
Latin America 17.7 24.6 43.7 17 14 7 3 5 2
Total of all 50 listed TNCs 19.7 36.6 48.2 50 50 50 10 14 10
Source: UNCTAD database.
Box 4. Selected TNCs from developing economies
Hutchison Whampoa Ltd. (Hong Kong, China), the first company in terms of foreign assets in
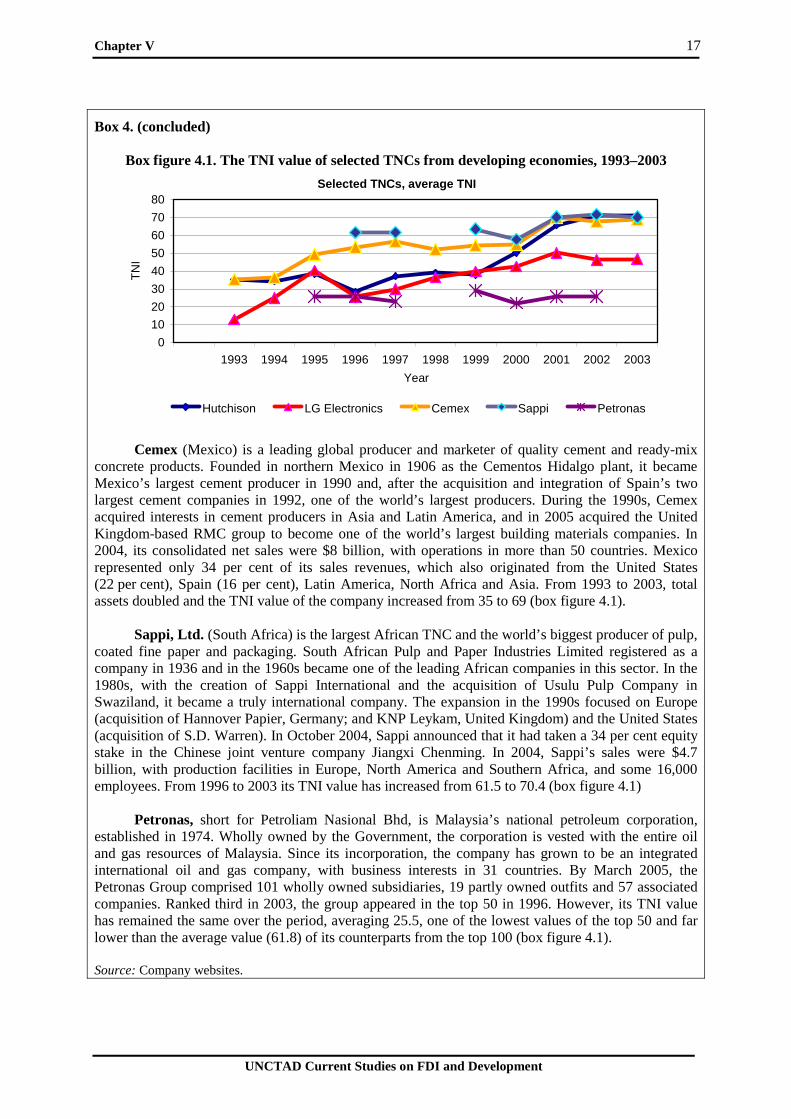
the top 50 list, is a large diversified company. It is the world’s leading port investor, developer and operator, with 39 ports across nine markets in Asia, South America, West Asia and Africa. With the recent acquisition of Marionnaud from France, it is the largest health and beauty retailer in the world, as well as an international corporation in mobile telecommunications and a large hotels developer and management company. The group also has interests in transportation, energy and water plants. Hutchison dates to the 1800s and has always been a Hong Kong, China-based TNC. In 2004, reported consolidated turnover was approximately $23 billion, with operations in 52 countries and about 200,000 employees worldwide. Between 1993 and 2003, its total assets multiplied by a factor of 10 and the TNI value increased from 35.3 to 71.4 (box figure 4.1).
LG Electronics, Inc. of the Republic of Korea was established in 1958 as a pioneer in that
country’s consumer electronics market under the name of GoldStar. It set up its first European Union sales affiliate in Germany in 1980 and its first plant in the United States in 1982. The company changed its name to LG Electronics in 1997.
In 2004, total consolidated sales amounted to $38 billion, with more than 66,000 employees in
39 countries. From 1993 to 2003, its total assets multiplied by a factor of 2.5 and the TNI value increased from 13.0 to 46.8 (box figure 4.1).
/…
Chapter V 17
UNCTAD Current Studies on FDI and Development
Box 4. (concluded)
Box figure 4.1. The TNI value of selected TNCs from developing economies, 1993–2003
Selected TNCs, average TNI
0
10
20
30
40
50
60
70
80
1993 1994 1995 1996 1997 1998 1999 2000 2001 2002 2003
Year
TN
I
Hutchison LG Electronics Cemex Sappi Petronas
Cemex (Mexico) is a leading global producer and marketer of quality cement and ready-mix
concrete products. Founded in northern Mexico in 1906 as the Cementos Hidalgo plant, it became Mexico’s largest cement producer in 1990 and, after the acquisition and integration of Spain’s two largest cement companies in 1992, one of the world’s largest producers. During the 1990s, Cemex acquired interests in cement producers in Asia and Latin America, and in 2005 acquired the United Kingdom-based RMC group to become one of the world’s largest building materials companies. In 2004, its consolidated net sales were $8 billion, with operations in more than 50 countries. Mexico represented only 34 per cent of its sales revenues, which also originated from the United States (22 per cent), Spain (16 per cent), Latin America, North Africa and Asia. From 1993 to 2003, total assets doubled and the TNI value of the company increased from 35 to 69 (box figure 4.1).
Sappi, Ltd. (South Africa) is the largest African TNC and the world’s biggest producer of pulp,
coated fine paper and packaging. South African Pulp and Paper Industries Limited registered as a company in 1936 and in the 1960s became one of the leading African companies in this sector. In the 1980s, with the creation of Sappi International and the acquisition of Usulu Pulp Company in Swaziland, it became a truly international company. The expansion in the 1990s focused on Europe (acquisition of Hannover Papier, Germany; and KNP Leykam, United Kingdom) and the United States (acquisition of S.D. Warren). In October 2004, Sappi announced that it had taken a 34 per cent equity stake in the Chinese joint venture company Jiangxi Chenming. In 2004, Sappi’s sales were $4.7 billion, with production facilities in Europe, North America and Southern Africa, and some 16,000 employees. From 1996 to 2003 its TNI value has increased from 61.5 to 70.4 (box figure 4.1)
Petronas, short for Petroliam Nasional Bhd, is Malaysia’s national petroleum corporation,
established in 1974. Wholly owned by the Government, the corporation is vested with the entire oil and gas resources of Malaysia. Since its incorporation, the company has grown to be an integrated international oil and gas company, with business interests in 31 countries. By March 2005, the Petronas Group comprised 101 wholly owned subsidiaries, 19 partly owned outfits and 57 associated companies. Ranked third in 2003, the group appeared in the top 50 in 1996. However, its TNI value has remained the same over the period, averaging 25.5, one of the lowest values of the top 50 and far lower than the average value (61.8) of its counterparts from the top 100 (box figure 4.1).
Source: Company websites.
18 The Universe of the Largest Transnational Corporations
UNCTAD Current Studies on FDI and Development
C. Shifts across sectors
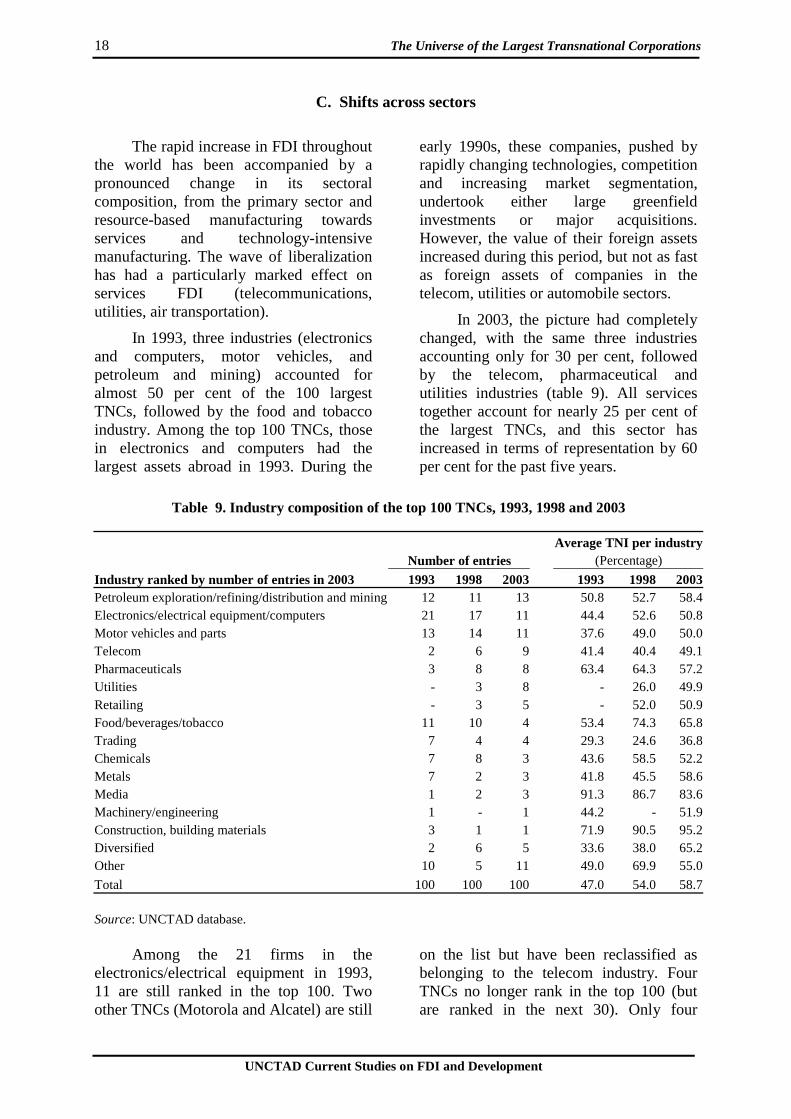
The rapid increase in FDI throughout the world has been accompanied by a pronounced change in its sectoral composition, from the primary sector and resource-based manufacturing towards services and technology-intensive manufacturing. The wave of liberalization has had a particularly marked effect on services FDI (telecommunications, utilities, air transportation).
In 1993, three industries (electronics and computers, motor vehicles, and petroleum and mining) accounted for almost 50 per cent of the 100 largest TNCs, followed by the food and tobacco industry. Among the top 100 TNCs, those in electronics and computers had the largest assets abroad in 1993. During the
early 1990s, these companies, pushed by rapidly changing technologies, competition and increasing market segmentation, undertook either large greenfield investments or major acquisitions. However, the value of their foreign assets increased during this period, but not as fast as foreign assets of companies in the telecom, utilities or automobile sectors.
In 2003, the picture had completely changed, with the same three industries accounting only for 30 per cent, followed by the telecom, pharmaceutical and utilities industries (table 9). All services together account for nearly 25 per cent of the largest TNCs, and this sector has increased in terms of representation by 60 per cent for the past five years.
Table 9. Industry composition of the top 100 TNCs, 1993, 1998 and 2003
Average TNI per industry Number of entries (Percentage)
Industry ranked by number of entries in 2003 1993 1998 2003 1993 1998 2003 Petroleum exploration/refining/distribution and mining 12 11 13 50.8 52.7 58.4 Electronics/electrical equipment/computers 21 17 11 44.4 52.6 50.8 Motor vehicles and parts 13 14 11 37.6 49.0 50.0 Telecom 2 6 9 41.4 40.4 49.1 Pharmaceuticals 3 8 8 63.4 64.3 57.2 Utilities - 3 8 - 26.0 49.9 Retailing - 3 5 - 52.0 50.9 Food/beverages/tobacco 11 10 4 53.4 74.3 65.8 Trading 7 4 4 29.3 24.6 36.8 Chemicals 7 8 3 43.6 58.5 52.2 Metals 7 2 3 41.8 45.5 58.6 Media 1 2 3 91.3 86.7 83.6 Machinery/engineering 1 - 1 44.2 - 51.9 Construction, building materials 3 1 1 71.9 90.5 95.2 Diversified 2 6 5 33.6 38.0 65.2 Other 10 5 11 49.0 69.9 55.0
Total 100 100 100 47.0 54.0 58.7 Source: UNCTAD database.
Among the 21 firms in the electronics/electrical equipment in 1993, 11 are still ranked in the top 100. Two other TNCs (Motorola and Alcatel) are still
on the list but have been reclassified as belonging to the telecom industry. Four TNCs no longer rank in the top 100 (but are ranked in the next 30). Only four
Chapter V 19
UNCTAD Current Studies on FDI and Development
companies have disappeared or do not exist under their original name. Also, in 1993, seven of the top TNCs in electronics and computers were Japanese. In 2003, only three were, with three from the United States and other firms from Germany, the Netherlands and the Republic of Korea.
In the food products and tobacco industries (which had 11 entries in 1993), many firms still existed in 2003, but were too small in terms of foreign assets compared with other TNCs to appear in the top 100. Two of three tobacco firms were still in the top 100 (BAT and Philip Morris, renamed Altria) and one of the largest, Unilever was classified as a diversified company.
Companies in the oil industry – typically prominent among the top 100 TNCs – grew slowly due to falling demand and declining oil prices at least until the early part of this decade, and their ranking generally declined. Traditionally, these companies have held a large share of their assets abroad, in response to the dispersed geographical location of oil deposits and also reflecting the capital intensity of this industry. The average TNI for the industry has also increased significantly over the past 10 years.
The largest automobile manu-facturers from the United States, Japan, Germany, France and Sweden were all ranked among the first half of the largest TNCs in 1993. Today, their importance is even larger, and eight of them are ranked among the top 30. They maintained their ranking and increased the average TNI value of the sector, despite rationalizations and cost-cutting measures that resulted in a certain decrease of assets and employment.
In 1993, among the 10 TNCs in chemicals and pharmaceuticals, seven firms were European and three were based
in the United States. Japanese companies in these industries did not rank among the top 100, despite significant acquisitions made in the United States and Europe. In 2003, the situation was unchanged, with seven firms from Europe and six from the United States. This industry is one of the few to have experienced a decrease in the average TNI value over the recent past due to consolidation of activities in the home market.
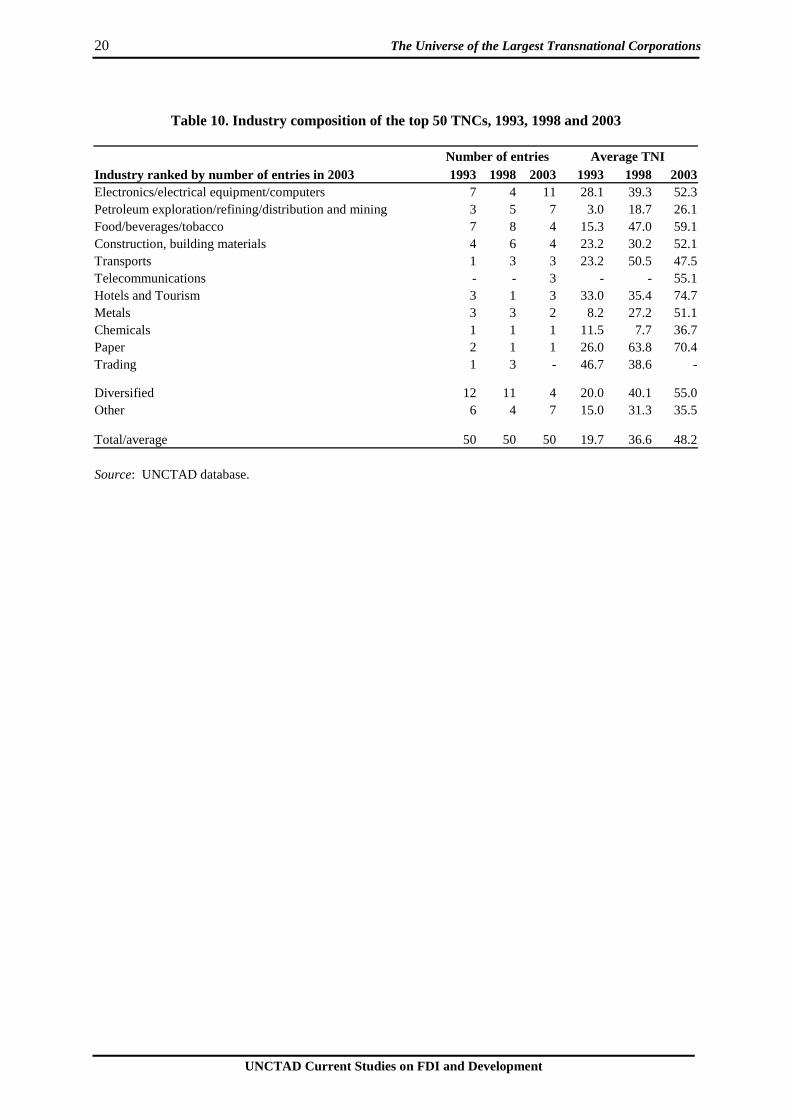
The top 50 TNCs from developing countries span a completely different range of activities. Although the electronics sector remains one of the most important industries, the three most important sectors taken together (electronics, food, beverages and tobacco, and diversified activities) accounted for 50 per cent of all TNCs in 1993 and only 40 per cent in 2003 (table 10). The strength of food, beverages and tobacco was based more on home markets in the early 1990s, led by Brazilian TNCs and to a lesser extent the Philippines. By 2003, the food industry had become more internationalized and firms originated mainly from members of the Association of South-East Asian Nations (ASEAN), specifically Malaysia, Singapore, Thailand and the Philippines. All the TNCs in electronics and computers originated from Asia and mainly from the Republic of Korea and Taiwan Province of China.
Similar to their counterparts from developed countries, most firms and almost all sectors of activity have experienced a significant increase in the average TNI value over the past 10 years or so. Since 1993, in two of the most significant sectors of activity, the average TNI has been multiplied by a factor of almost four for the food and beverages industry, and almost two for the electronics and electrical equipment industry.
20 The Universe of the Largest Transnational Corporations
UNCTAD Current Studies on FDI and Development
Table 10. Industry composition of the top 50 TNCs, 1993, 1998 and 2003
Number of entries Average TNI Industry ranked by number of entries in 2003 1993 1998 2003 1993 1998 2003 Electronics/electrical equipment/computers 7 4 11 28.1 39.3 52.3 Petroleum exploration/refining/distribution and mining 3 5 7 3.0 18.7 26.1 Food/beverages/tobacco 7 8 4 15.3 47.0 59.1 Construction, building materials 4 6 4 23.2 30.2 52.1 Transports 1 3 3 23.2 50.5 47.5 Telecommunications - - 3 - - 55.1 Hotels and Tourism 3 1 3 33.0 35.4 74.7 Metals 3 3 2 8.2 27.2 51.1 Chemicals 1 1 1 11.5 7.7 36.7 Paper 2 1 1 26.0 63.8 70.4 Trading 1 3 - 46.7 38.6 - Diversified 12 11 4 20.0 40.1 55.0 Other 6 4 7 15.0 31.3 35.5 Total/average 50 50 50 19.7 36.6 48.2 Source: UNCTAD database.
UNCTAD Current Studies on FDI and Development
VI. How transnational are TNCs?
The degree of international involvement of a firm can be measured in various ways. Transnationality is a function of the extent to which a firm’s activities are located abroad.
(a) From the operations perspective, key dimensions include the intensity or relative importance of a TNC’s foreign operations, as measured by various variables: the geographical spread of its operations, the mode of foreign operations and the degree of integration of the production process across locations.
(b) From the stakeholders’ perspective, key dimensions include the nationality composition of managers or board members, the nationality composition of shareholders, the international mobility and international experience of managers,
and the composition of the labour force by nationality.
(c) From the perspective of the spatial organization of management, key dimensions include the extent and spread of the location of regional headquarters in host countries, and the legal nationality(ies) of a TNC.
Given the range of perspectives and dimensions that can be considered for each, the degree of transnationality of a TNC cannot be fully captured by a single synthetic measure — it requires a variety of indicators. Some of these can be expressed as indices calculated or estimated on the basis of empirical data; others may consist of empirical data not expressed as indices; and still others may be expressed in qualitative rather than quantitative form.
A. The geographical extensity dimension
One aspect of transnationality from the operations perspective, not included in UNCTAD’s TNI, is the intensity of foreign operations according to the number of foreign affiliates. The “Internationalization Index (II)” – the ratio of the number of foreign to the total number of affiliates – shows that, on average, more than 65 per cent of the affiliates of the top 100 TNCs are located abroad. The information on foreign affiliates by TNCs’ home countries and industries shows that the II, like the TNI, is the highest for the top TNCs from small countries (such as Belgium, Finland, Ireland and Switzerland) and for machinery and equipment, construction and building materials, and chemicals and pharmaceuticals industries (annex tables 2 and 3). The TNI, as well as the II, gives an idea of the degree of embeddedness and interests of a company in the home country versus abroad. The level and pattern of trade can also be affected by the intensity
of foreign operations, i.e. by the share of business activities abroad.
Another aspect of transnationality from the operations perspective is the geographic extensiveness or the degree to which a company’s operations and interests are spread in several countries or concentrated in a few. The relevance of this concept of transnationality has several aspects: the spread of operations into many countries affects the strategic stance of the company; it also affects its ability to develop and spread knowledge and innovation and its strategies towards labour or Governments. The indicators used for this concept are the number of foreign countries in which the TNC has affiliates and the almost identical Network Spread Index (NSI) measured as the ratio of the number of host economies over the number of all potential host economies (number of economies which were in receipt of inward
22 The Universe of the Largest Transnational Corporations
UNCTAD Current Studies on FDI and Development
FDI).5 On average, the top TNCs have affiliates in 39 foreign countries and an NSI of almost 18 percent. Ranking the TNCs by the number of host countries shows that European countries rank high, with 14 companies in the top 20 and an average of 71 host countries (annex table 8).
The II shows that, on average, more than 50 per cent of the affiliates of the top 50 developing country TNCs are located abroad (annex tables 4 and 5). This index is the highest for TNCs from Hong Kong (China), the Republic of Korea and Singapore, and for the electrical/electronic industry. On average, the top 50 TNCs have affiliates in 13 foreign countries, which is much less than in the case of the top 100 TNCs, though the East Asian firms at the top of the list come close to the
average for their counterparts from developed countries (with an average of 36 host economies).
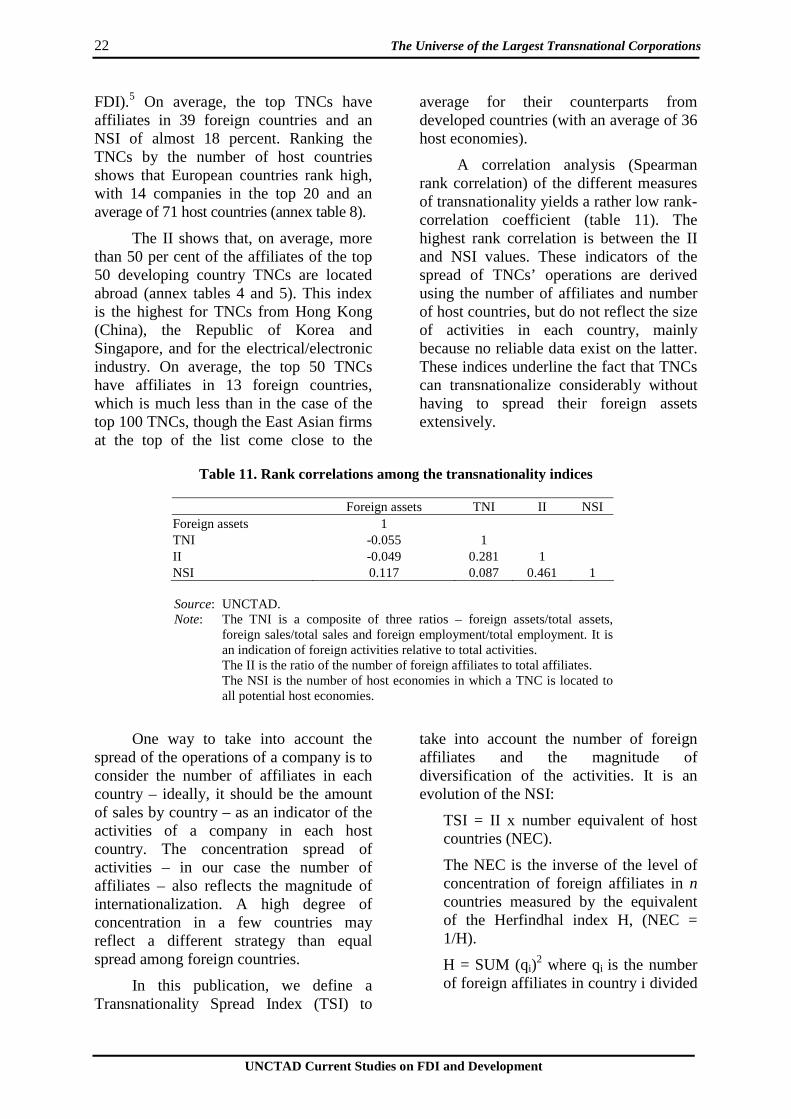
A correlation analysis (Spearman rank correlation) of the different measures of transnationality yields a rather low rank-correlation coefficient (table 11). The highest rank correlation is between the II and NSI values. These indicators of the spread of TNCs’ operations are derived using the number of affiliates and number of host countries, but do not reflect the size of activities in each country, mainly because no reliable data exist on the latter. These indices underline the fact that TNCs can transnationalize considerably without having to spread their foreign assets extensively.
Table 11. Rank correlations among the transnationality indices
Foreign assets TNI II NSI Foreign assets 1 TNI -0.055 1 II -0.049 0.281 1 NSI 0.117 0.087 0.461 1 Source: UNCTAD. Note: The TNI is a composite of three ratios – foreign assets/total assets,
foreign sales/total sales and foreign employment/total employment. It is an indication of foreign activities relative to total activities.
The II is the ratio of the number of foreign affiliates to total affiliates. The NSI is the number of host economies in which a TNC is located to
all potential host economies.
One way to take into account the spread of the operations of a company is to consider the number of affiliates in each country – ideally, it should be the amount of sales by country – as an indicator of the activities of a company in each host country. The concentration spread of activities – in our case the number of affiliates – also reflects the magnitude of internationalization. A high degree of concentration in a few countries may reflect a different strategy than equal spread among foreign countries.
In this publication, we define a Transnationality Spread Index (TSI) to
take into account the number of foreign affiliates and the magnitude of diversification of the activities. It is an evolution of the NSI:
TSI = II x number equivalent of host countries (NEC).
The NEC is the inverse of the level of concentration of foreign affiliates in n countries measured by the equivalent of the Herfindhal index H, (NEC = 1/H).
H = SUM (qi)2 where qi is the number
of foreign affiliates in country i divided
Chapter VI 23
UNCTAD Current Studies on FDI and Development
by the total number of foreign affiliates, i = 1,n.
An analysis of the top 100 TNCs shows that ranking the firms by TSI gives a more diversified group of TNCs (annex table 8). Firms from the United States and Germany dominate the first quartile of the list, with 10 and seven entries respectively. By sector of activity, the pharmaceutical industry dominates the first quartile with
six entries. As expected, the results of ranking TNCs by this TSI index give a completely different picture than ranking of companies by the size of their foreign assets or even the TNI value. Here, the size of the company is not a determinant factor in the transnationality of its operations. The index gives a picture that relies more on the geographic spread of the activities of a company.
B. A graphical approach to transnationality
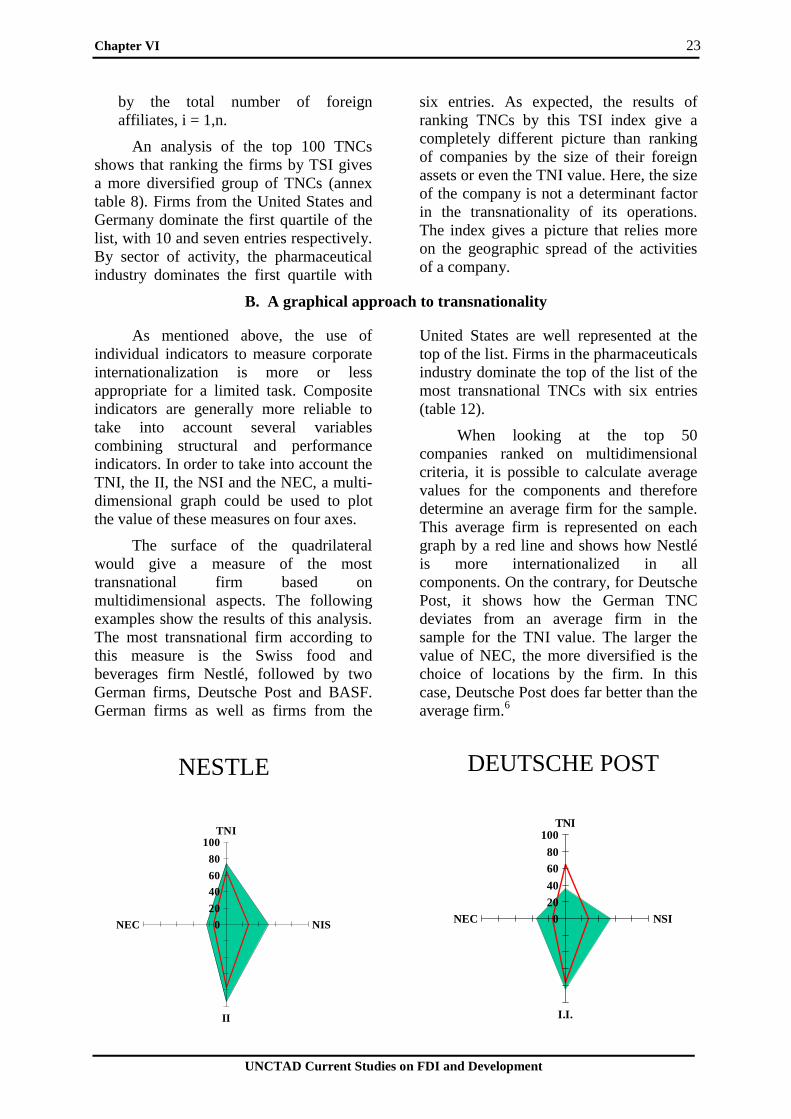
As mentioned above, the use of individual indicators to measure corporate internationalization is more or less appropriate for a limited task. Composite indicators are generally more reliable to take into account several variables combining structural and performance indicators. In order to take into account the TNI, the II, the NSI and the NEC, a multi-dimensional graph could be used to plot the value of these measures on four axes.
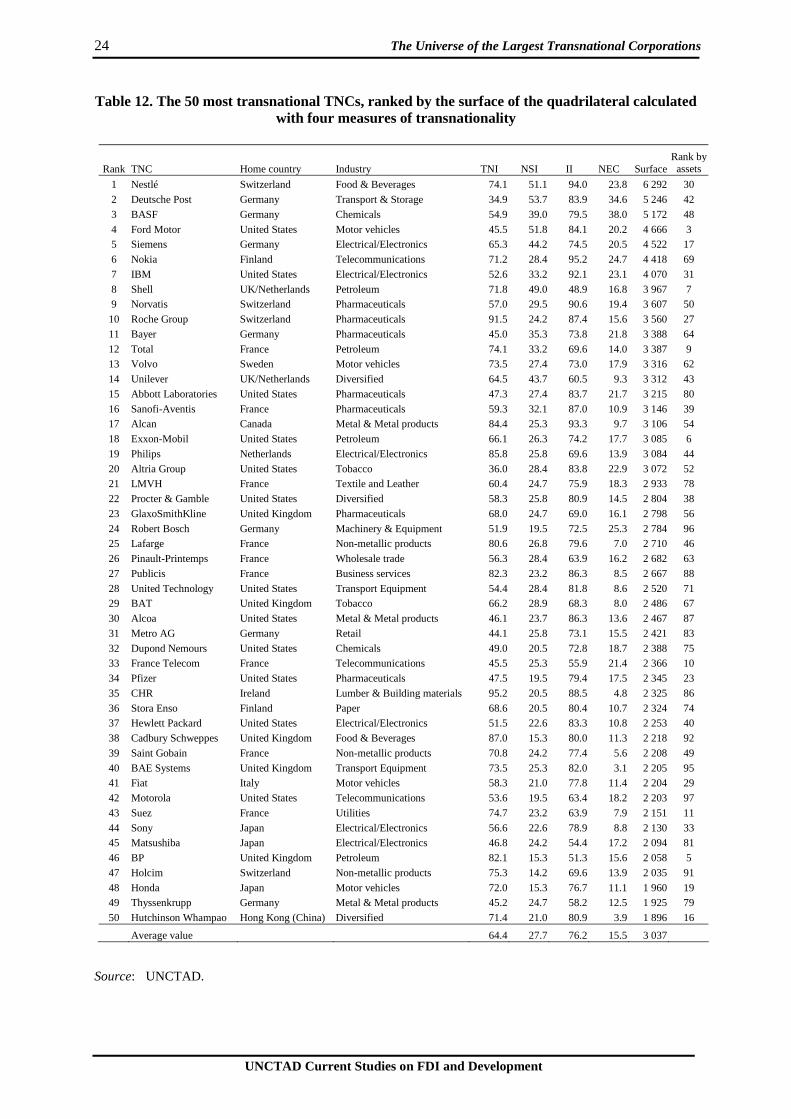
The surface of the quadrilateral would give a measure of the most transnational firm based on multidimensional aspects. The following examples show the results of this analysis. The most transnational firm according to this measure is the Swiss food and beverages firm Nestlé, followed by two German firms, Deutsche Post and BASF. German firms as well as firms from the
United States are well represented at the top of the list. Firms in the pharmaceuticals industry dominate the top of the list of the most transnational TNCs with six entries (table 12).
When looking at the top 50 companies ranked on multidimensional criteria, it is possible to calculate average values for the components and therefore determine an average firm for the sample. This average firm is represented on each graph by a red line and shows how Nestlé is more internationalized in all components. On the contrary, for Deutsche Post, it shows how the German TNC deviates from an average firm in the sample for the TNI value. The larger the value of NEC, the more diversified is the choice of locations by the firm. In this case, Deutsche Post does far better than the average firm.6
NESTLE
0
20
40
60
80
100TNI
NIS
II
NEC
DEUTSCHE POST
020
40
6080
100TNI
NSI
I.I.
NEC
24 The Universe of the Largest Transnational Corporations
UNCTAD Current Studies on FDI and Development
Table 12. The 50 most transnational TNCs, ranked by the surface of the quadrilateral calculated with four measures of transnationality
Rank TNC Home country Industry TNI NSI II NEC Surface Rank by
assets
1 Nestlé Switzerland Food & Beverages 74.1 51.1 94.0 23.8 6 292 30
2 Deutsche Post Germany Transport & Storage 34.9 53.7 83.9 34.6 5 246 42
3 BASF Germany Chemicals 54.9 39.0 79.5 38.0 5 172 48
4 Ford Motor United States Motor vehicles 45.5 51.8 84.1 20.2 4 666 3 5 Siemens Germany Electrical/Electronics 65.3 44.2 74.5 20.5 4 522 17
6 Nokia Finland Telecommunications 71.2 28.4 95.2 24.7 4 418 69
7 IBM United States Electrical/Electronics 52.6 33.2 92.1 23.1 4 070 31
8 Shell UK/Netherlands Petroleum 71.8 49.0 48.9 16.8 3 967 7 9 Norvatis Switzerland Pharmaceuticals 57.0 29.5 90.6 19.4 3 607 50
10 Roche Group Switzerland Pharmaceuticals 91.5 24.2 87.4 15.6 3 560 27
11 Bayer Germany Pharmaceuticals 45.0 35.3 73.8 21.8 3 388 64
12 Total France Petroleum 74.1 33.2 69.6 14.0 3 387 9 13 Volvo Sweden Motor vehicles 73.5 27.4 73.0 17.9 3 316 62
14 Unilever UK/Netherlands Diversified 64.5 43.7 60.5 9.3 3 312 43
15 Abbott Laboratories United States Pharmaceuticals 47.3 27.4 83.7 21.7 3 215 80
16 Sanofi-Aventis France Pharmaceuticals 59.3 32.1 87.0 10.9 3 146 39 17 Alcan Canada Metal & Metal products 84.4 25.3 93.3 9.7 3 106 54
18 Exxon-Mobil United States Petroleum 66.1 26.3 74.2 17.7 3 085 6
19 Philips Netherlands Electrical/Electronics 85.8 25.8 69.6 13.9 3 084 44
20 Altria Group United States Tobacco 36.0 28.4 83.8 22.9 3 072 52 21 LMVH France Textile and Leather 60.4 24.7 75.9 18.3 2 933 78
22 Procter & Gamble United States Diversified 58.3 25.8 80.9 14.5 2 804 38
23 GlaxoSmithKline United Kingdom Pharmaceuticals 68.0 24.7 69.0 16.1 2 798 56
24 Robert Bosch Germany Machinery & Equipment 51.9 19.5 72.5 25.3 2 784 96 25 Lafarge France Non-metallic products 80.6 26.8 79.6 7.0 2 710 46
26 Pinault-Printemps France Wholesale trade 56.3 28.4 63.9 16.2 2 682 63
27 Publicis France Business services 82.3 23.2 86.3 8.5 2 667 88
28 United Technology United States Transport Equipment 54.4 28.4 81.8 8.6 2 520 71 29 BAT United Kingdom Tobacco 66.2 28.9 68.3 8.0 2 486 67
30 Alcoa United States Metal & Metal products 46.1 23.7 86.3 13.6 2 467 87
31 Metro AG Germany Retail 44.1 25.8 73.1 15.5 2 421 83
32 Dupond Nemours United States Chemicals 49.0 20.5 72.8 18.7 2 388 75 33 France Telecom France Telecommunications 45.5 25.3 55.9 21.4 2 366 10
34 Pfizer United States Pharmaceuticals 47.5 19.5 79.4 17.5 2 345 23
35 CHR Ireland Lumber & Building materials 95.2 20.5 88.5 4.8 2 325 86
36 Stora Enso Finland Paper 68.6 20.5 80.4 10.7 2 324 74 37 Hewlett Packard United States Electrical/Electronics 51.5 22.6 83.3 10.8 2 253 40
38 Cadbury Schweppes United Kingdom Food & Beverages 87.0 15.3 80.0 11.3 2 218 92
39 Saint Gobain France Non-metallic products 70.8 24.2 77.4 5.6 2 208 49
40 BAE Systems United Kingdom Transport Equipment 73.5 25.3 82.0 3.1 2 205 95 41 Fiat Italy Motor vehicles 58.3 21.0 77.8 11.4 2 204 29
42 Motorola United States Telecommunications 53.6 19.5 63.4 18.2 2 203 97
43 Suez France Utilities 74.7 23.2 63.9 7.9 2 151 11
44 Sony Japan Electrical/Electronics 56.6 22.6 78.9 8.8 2 130 33 45 Matsushiba Japan Electrical/Electronics 46.8 24.2 54.4 17.2 2 094 81
46 BP United Kingdom Petroleum 82.1 15.3 51.3 15.6 2 058 5
47 Holcim Switzerland Non-metallic products 75.3 14.2 69.6 13.9 2 035 91
48 Honda Japan Motor vehicles 72.0 15.3 76.7 11.1 1 960 19 49 Thyssenkrupp Germany Metal & Metal products 45.2 24.7 58.2 12.5 1 925 79
50 Hutchinson Whampao Hong Kong (China) Diversified 71.4 21.0 80.9 3.9 1 896 16
Average value 64.4 27.7 76.2 15.5 3 037
Source: UNCTAD.
Chapter VI 25
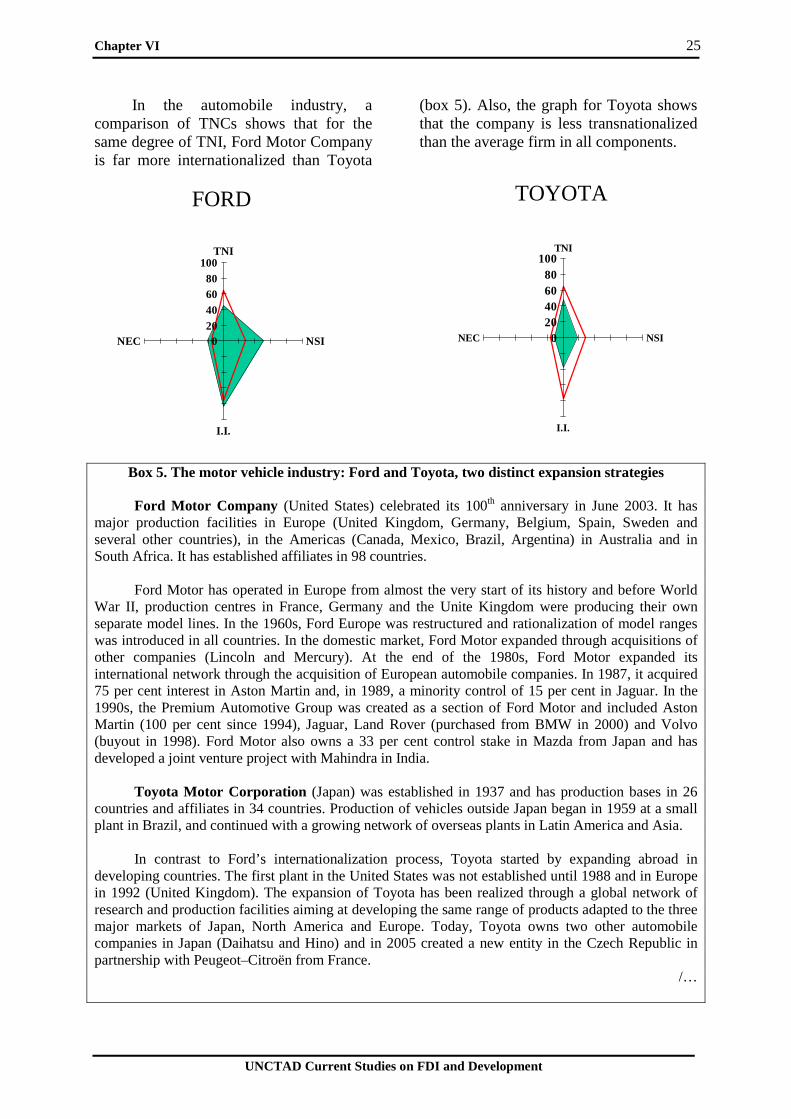
UNCTAD Current Studies on FDI and Development
In the automobile industry, a comparison of TNCs shows that for the same degree of TNI, Ford Motor Company is far more internationalized than Toyota
(box 5). Also, the graph for Toyota shows that the company is less transnationalized than the average firm in all components.
Box 5. The motor vehicle industry: Ford and Toyota, two distinct expansion strategies
Ford Motor Company (United States) celebrated its 100th anniversary in June 2003. It has major production facilities in Europe (United Kingdom, Germany, Belgium, Spain, Sweden and several other countries), in the Americas (Canada, Mexico, Brazil, Argentina) in Australia and in South Africa. It has established affiliates in 98 countries.
Ford Motor has operated in Europe from almost the very start of its history and before World
War II, production centres in France, Germany and the Unite Kingdom were producing their own separate model lines. In the 1960s, Ford Europe was restructured and rationalization of model ranges was introduced in all countries. In the domestic market, Ford Motor expanded through acquisitions of other companies (Lincoln and Mercury). At the end of the 1980s, Ford Motor expanded its international network through the acquisition of European automobile companies. In 1987, it acquired 75 per cent interest in Aston Martin and, in 1989, a minority control of 15 per cent in Jaguar. In the 1990s, the Premium Automotive Group was created as a section of Ford Motor and included Aston Martin (100 per cent since 1994), Jaguar, Land Rover (purchased from BMW in 2000) and Volvo (buyout in 1998). Ford Motor also owns a 33 per cent control stake in Mazda from Japan and has developed a joint venture project with Mahindra in India.
Toyota Motor Corporation (Japan) was established in 1937 and has production bases in 26
countries and affiliates in 34 countries. Production of vehicles outside Japan began in 1959 at a small plant in Brazil, and continued with a growing network of overseas plants in Latin America and Asia.
In contrast to Ford’s internationalization process, Toyota started by expanding abroad in
developing countries. The first plant in the United States was not established until 1988 and in Europe in 1992 (United Kingdom). The expansion of Toyota has been realized through a global network of research and production facilities aiming at developing the same range of products adapted to the three major markets of Japan, North America and Europe. Today, Toyota owns two other automobile companies in Japan (Daihatsu and Hino) and in 2005 created a new entity in the Czech Republic in partnership with Peugeot–Citroën from France.
/…
TOYOTA
020406080
100TNI
NSI
I.I.
NEC
FORD
020406080
100TNI
NSI
I.I.
NEC
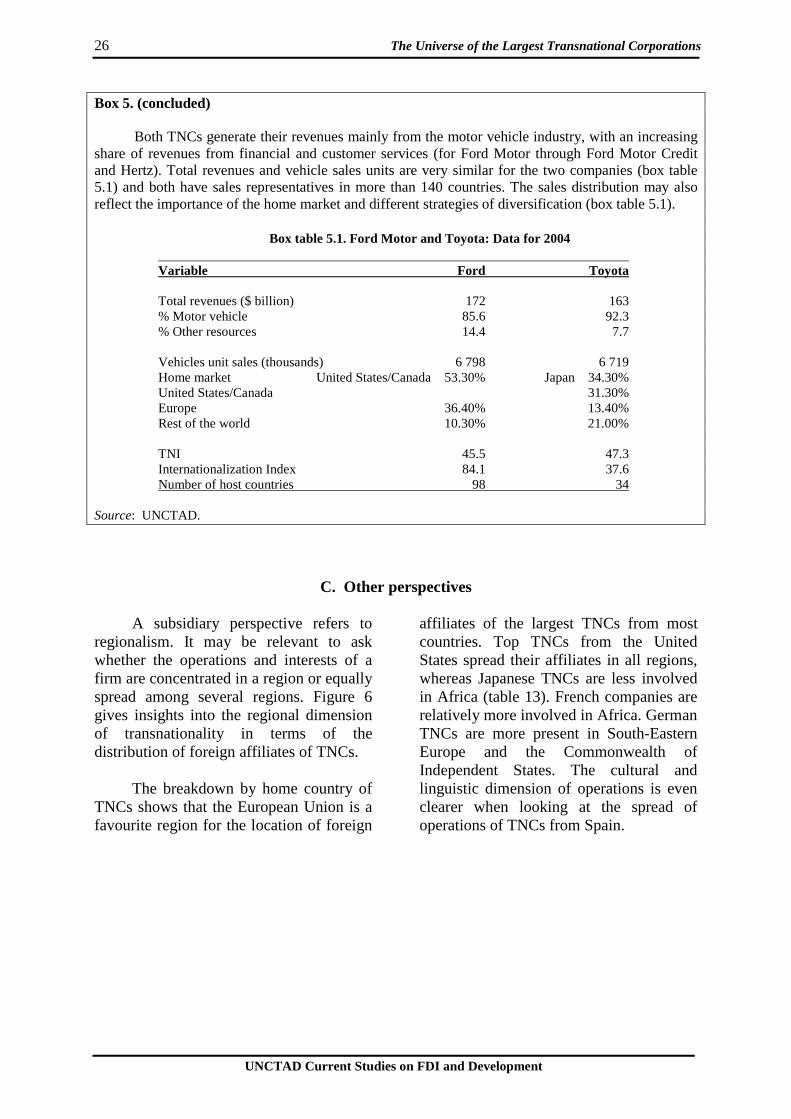
26 The Universe of the Largest Transnational Corporations
UNCTAD Current Studies on FDI and Development
Box 5. (concluded)
Both TNCs generate their revenues mainly from the motor vehicle industry, with an increasing share of revenues from financial and customer services (for Ford Motor through Ford Motor Credit and Hertz). Total revenues and vehicle sales units are very similar for the two companies (box table 5.1) and both have sales representatives in more than 140 countries. The sales distribution may also reflect the importance of the home market and different strategies of diversification (box table 5.1).
Box table 5.1. Ford Motor and Toyota: Data for 2004 Variable Ford Toyota Total revenues ($ billion) 172 163 % Motor vehicle 85.6 92.3 % Other resources 14.4 7.7 Vehicles unit sales (thousands) 6 798 6 719 Home market United States/Canada 53.30% Japan 34.30% United States/Canada 31.30% Europe 36.40% 13.40% Rest of the world 10.30% 21.00% TNI 45.5 47.3 Internationalization Index 84.1 37.6 Number of host countries 98 34 Source: UNCTAD.
C. Other perspectives
A subsidiary perspective refers to regionalism. It may be relevant to ask whether the operations and interests of a firm are concentrated in a region or equally spread among several regions. Figure 6 gives insights into the regional dimension of transnationality in terms of the distribution of foreign affiliates of TNCs.
The breakdown by home country of
TNCs shows that the European Union is a favourite region for the location of foreign
affiliates of the largest TNCs from most countries. Top TNCs from the United States spread their affiliates in all regions, whereas Japanese TNCs are less involved in Africa (table 13). French companies are relatively more involved in Africa. German TNCs are more present in South-Eastern Europe and the Commonwealth of Independent States. The cultural and linguistic dimension of operations is even clearer when looking at the spread of operations of TNCs from Spain.
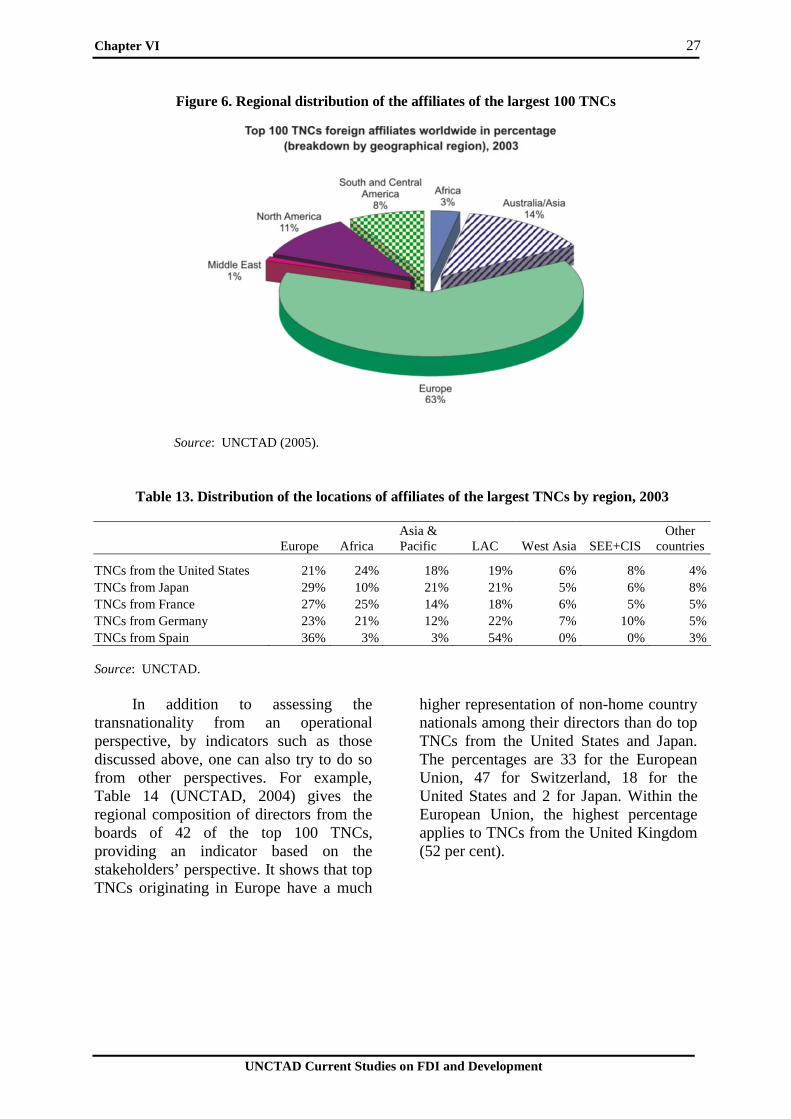
Chapter VI 27
UNCTAD Current Studies on FDI and Development
Figure 6. Regional distribution of the affiliates of the largest 100 TNCs
Source: UNCTAD (2005).
Table 13. Distribution of the locations of affiliates of the largest TNCs by region, 2003
Europe Africa Asia & Pacific LAC West Asia SEE+CIS
Other countries
TNCs from the United States 21% 24% 18% 19% 6% 8% 4% TNCs from Japan 29% 10% 21% 21% 5% 6% 8% TNCs from France 27% 25% 14% 18% 6% 5% 5% TNCs from Germany 23% 21% 12% 22% 7% 10% 5% TNCs from Spain 36% 3% 3% 54% 0% 0% 3% Source: UNCTAD.
In addition to assessing the
transnationality from an operational perspective, by indicators such as those discussed above, one can also try to do so from other perspectives. For example, Table 14 (UNCTAD, 2004) gives the regional composition of directors from the boards of 42 of the top 100 TNCs, providing an indicator based on the stakeholders’ perspective. It shows that top TNCs originating in Europe have a much
higher representation of non-home country nationals among their directors than do top TNCs from the United States and Japan. The percentages are 33 for the European Union, 47 for Switzerland, 18 for the United States and 2 for Japan. Within the European Union, the highest percentage applies to TNCs from the United Kingdom (52 per cent).
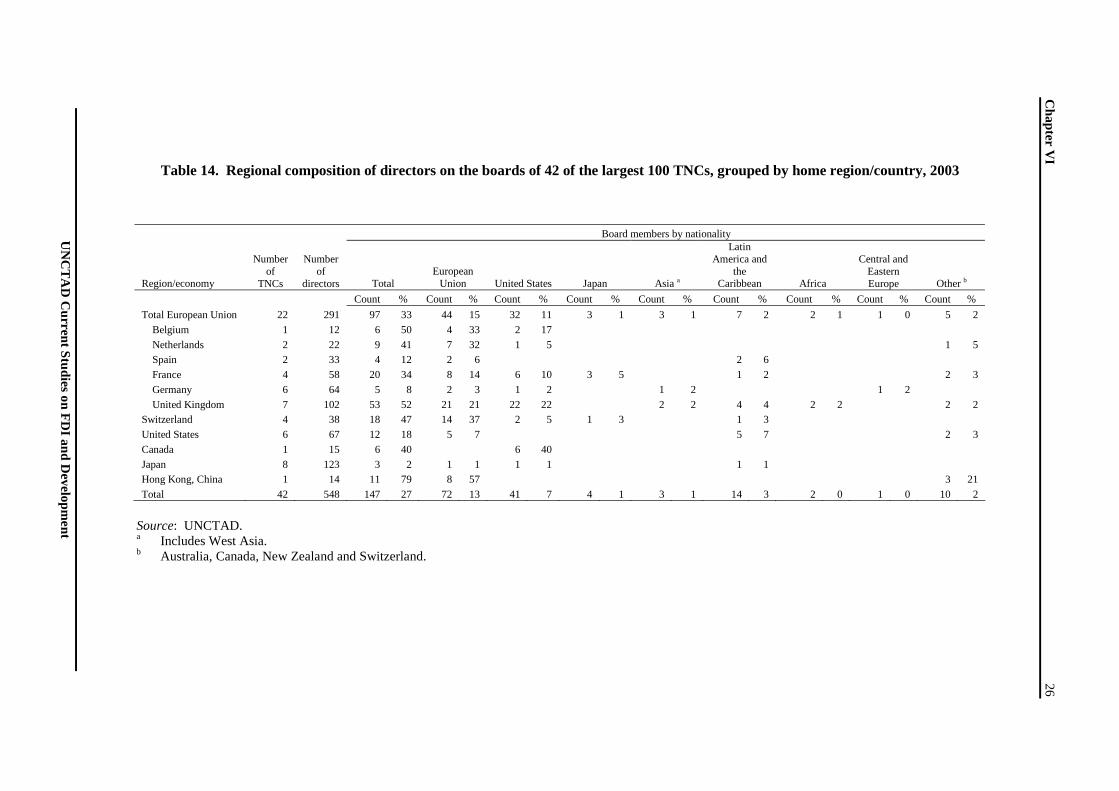
Table 14. Regional composition of directors on the boards of 42 of the largest 100 TNCs, grouped by home region/country, 2003
Board members by nationality
Region/economy
Number of
TNCs
Number of
directors Total European
Union United States Japan Asia a
Latin America and
the Caribbean Africa
Central and Eastern Europe Other b
Count % Count % Count % Count % Count % Count % Count % Count % Count %
Total European Union 22 291 97 33 44 15 32 11 3 1 3 1 7 2 2 1 1 0 5 2
Belgium 1 12 6 50 4 33 2 17
Netherlands 2 22 9 41 7 32 1 5 1 5 Spain 2 33 4 12 2 6 2 6
France 4 58 20 34 8 14 6 10 3 5 1 2 2 3
Germany 6 64 5 8 2 3 1 2 1 2 1 2
United Kingdom 7 102 53 52 21 21 22 22 2 2 4 4 2 2 2 2 Switzerland 4 38 18 47 14 37 2 5 1 3 1 3
United States 6 67 12 18 5 7 5 7 2 3
Canada 1 15 6 40 6 40
Japan 8 123 3 2 1 1 1 1 1 1 Hong Kong, China 1 14 11 79 8 57 3 21
Total 42 548 147 27 72 13 41 7 4 1 3 1 14 3 2 0 1 0 10 2
Source: UNCTAD. a Includes West Asia. b Australia, Canada, New Zealand and Switzerland.
UN
CT
AD
Current Studies on F
DI and D
evelopment
Chapter V
I 26
VII. Most favoured locations by TNCs
As shown in the previous chapter, the number of host countries for foreign affiliates of TNCs can capture the geographic spread of a company’s operations and interests. Geographic and cultural distances have received a great deal of attention in the international business literature and have been identified as a key factor in explaining foreign market attractiveness (Kogut and Singh, 1998).7 Johansson and Vahlne (1977, 1990) argued that TNCs expand first in geographically proximate markets and as experiential learning is built up, firms venture into more distant markets.
The development of the theory of the multinational enterprise has followed two main approaches: location theory, which deals with the reasons underlying the choice of host country for FDI, and industrial organization theory, which is concerned with competition and performance of foreign and domestic firms. In the latter case, firms possess firm-specific advantages, which can be exploited profitably across national borders. In the context of market-seeking investment, internalization advantages and country-specific advantages are both important to the explanation of foreign direct investment and the establishment of foreign subsidiaries (Rugman and Verbeke, 2004).
An analysis of the information on the location of foreign affiliates suggests that the most frequent host country by these 100 largest TNCs is the Netherlands, where 91 of the 100 have at least one affiliate, followed by the United Kingdom with 86. However, there are four Dutch companies, which by definition cannot have foreign affiliates in their own country; and a similar situation applies for instance to 12 British TNCs. To take into account the number of TNCs originating from one location/economy, the Location Intensity is defined as follows: the total number of TNCs having at least one affiliate in the country, divided by 100,
minus the number of TNCs from this country listed in the top 100.
Based on this measure, the United Kingdom is the most favoured location, followed by the Netherlands and the United States (annex table 9). There are eight European countries in the top 10 and Poland is the most favoured location among the new European Union countries.
Among developing countries, Brazil hosts the largest number of the top 100 TNCs (75), followed by Mexico and Hong Kong, China. In the top 10 of the most favoured locations in developing economies, there are five countries from East and South-East Asia, four from Latin America and the Caribbean, and Turkey.
The Inward FDI Performance Index defined by UNCTAD (2004) ranks countries by the FDI they receive relative to their economic size, calculated as the ratio of a country’s share in global FDI inflows to its share in global GDP. A value greater than one indicates the country receives more FDI than others compared to its relative economic size. The index thus captures the influence on FDI of factors other than the market size, assuming that, other things being equal, size measured by GDP is the “baseline” for attracting investments. However, the ranking of 103 countries hosting at least five TNCs’ foreign affiliates when compared with their ranking in terms of FDI performance index (UNCTAD, 2004) is not correlated. The Spearman rank correlation coefficient for the two variables is not significantly different from zero (Rs = 0.0285) mainly because the Performance Index does not take into account other location-specific variables, which may be more relevant in the attractiveness of a country.
The opportunities to locate in developing economies have been based on expectations (e.g. market size potential, rapidly expanding economy) but also with due considerations regarding many challenges (e.g. available working force,
30 The Universe of the Largest Transnational Corporations
UNCTAD Current Studies on FDI and Development
technical risk, cultural environment, country risk assessment).
The economic size of the host economy as measured by its GDP per capita influenced FDI decisions, but labour is another factor important to foreign investors. Thus, a high level of human capital would positively attract foreign firms. The human resources base is generally measured by educational enrolments and literacy rates. The Human Capital Index (HCI) used here is a weighted average of the literacy rate and enrolment ratios (secondary school and tertiary education) calculated by UNCTAD (2005).
Other factors are diverse, ranging from the business climate, the presence of natural resources, infrastructure, skills and technologies. Macroeconomic factors played a crucial role in the past in attracting FDI, but the dynamics of FDI require an analysis beyond such macroeconomic variables and a simple review of the recent studies suggests a much higher correlation between FDI and governance (both from the public and private sectors) than between FDI and macroeconomic variables.8 These studies have examined the consequences of governance and misgovernance for development and how a country risk could have an impact on global investment strategies by TNCs. Simple deductive reasoning would imply that good governance is also a relevant factor explaining the most favoured locations by TNCs to set up foreign affiliates.
Corruption is commonly defined as the abuse of public office for private gain. Governance is a much broader notion, which is defined as the traditions and institutions that determine how authority is exercised in a particular country. This includes (a) the process by which Governments are selected, held accountable, monitored and replaced; (b) the capacity of Governments to manage resources efficiently and formulate,
implement and enforce sound policies and regulations; and (c) the respect of citizens and the State for the institutions that govern economic and social interactions among them (Kaufmann et al., 2000).
A wide variety of cross-country indicators is produced by a range of organizations (government agencies, commercial-risk-rating agencies, international organizations, think tanks and other NGOs) and cover various dimensions of governance. Since all of the variables used to measure governance are highly correlated, only a few variables will be considered in the analysis:
(a) The Euromoney Global Political Risk Map gives a measure of country risk on the basis of political risk, economic performance, debt indicators, credit rating and access to finance and capital markets.9
(b) The Economist Intelligence Unit (EIU) country risk index is calculated using two distinct perspectives: (1) broad risk, i.e. political and
economic; and (2) specific risk, i.e. currency,
banking sector risk and sovereign risk.10
(c) The Corruption Perception Index (CPI), compiled at the University of Passau (Germany), is based on multiple surveys.11
(d) The government effectiveness index published by the World Bank Institute (WBI), combines perception of the quality of public service provision, the quality of bureaucracy, the competence of civil servants, the independence of the civil service from political pressures, and the credibility of the Government’s commitment to policies. It is one of the six indices published by WBI on governance.12
The ranking of the top 50 developing economies in terms of the number of locations for foreign affiliates (annex table 9) is compared with the ranking of the same economies based on several indicators, including the size, human capital endowment, government
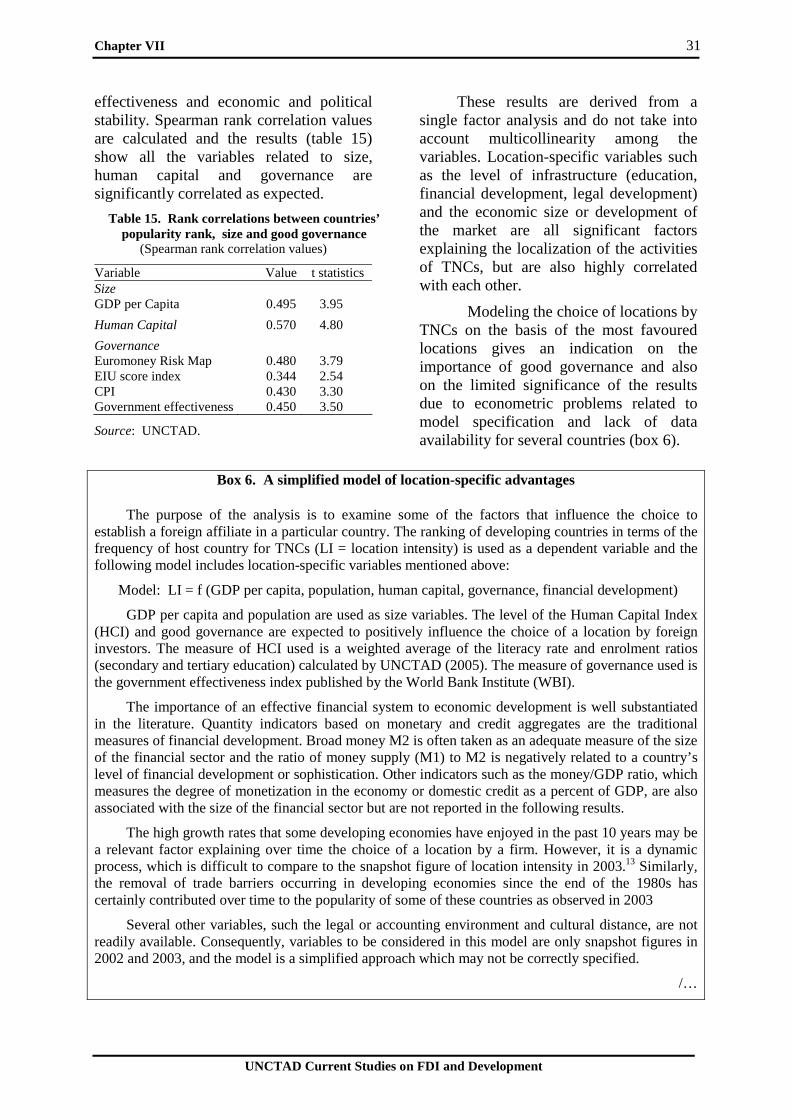
Chapter VII 31
UNCTAD Current Studies on FDI and Development
effectiveness and economic and political stability. Spearman rank correlation values are calculated and the results (table 15) show all the variables related to size, human capital and governance are significantly correlated as expected.
Table 15. Rank correlations between countries’ popularity rank, size and good governance
(Spearman rank correlation values)
Variable Value t statistics Size GDP per Capita 0.495 3.95 Human Capital 0.570 4.80 Governance Euromoney Risk Map 0.480 3.79 EIU score index 0.344 2.54 CPI 0.430 3.30 Government effectiveness 0.450 3.50
Source: UNCTAD.
These results are derived from a single factor analysis and do not take into account multicollinearity among the variables. Location-specific variables such as the level of infrastructure (education, financial development, legal development) and the economic size or development of the market are all significant factors explaining the localization of the activities of TNCs, but are also highly correlated with each other.
Modeling the choice of locations by TNCs on the basis of the most favoured locations gives an indication on the importance of good governance and also on the limited significance of the results due to econometric problems related to model specification and lack of data availability for several countries (box 6).
Box 6. A simplified model of location-specific advantages
The purpose of the analysis is to examine some of the factors that influence the choice to
establish a foreign affiliate in a particular country. The ranking of developing countries in terms of the frequency of host country for TNCs (LI = location intensity) is used as a dependent variable and the following model includes location-specific variables mentioned above:
Model: LI = f (GDP per capita, population, human capital, governance, financial development)
GDP per capita and population are used as size variables. The level of the Human Capital Index (HCI) and good governance are expected to positively influence the choice of a location by foreign investors. The measure of HCI used is a weighted average of the literacy rate and enrolment ratios (secondary and tertiary education) calculated by UNCTAD (2005). The measure of governance used is the government effectiveness index published by the World Bank Institute (WBI).
The importance of an effective financial system to economic development is well substantiated in the literature. Quantity indicators based on monetary and credit aggregates are the traditional measures of financial development. Broad money M2 is often taken as an adequate measure of the size of the financial sector and the ratio of money supply (M1) to M2 is negatively related to a country’s level of financial development or sophistication. Other indicators such as the money/GDP ratio, which measures the degree of monetization in the economy or domestic credit as a percent of GDP, are also associated with the size of the financial sector but are not reported in the following results.
The high growth rates that some developing economies have enjoyed in the past 10 years may be a relevant factor explaining over time the choice of a location by a firm. However, it is a dynamic process, which is difficult to compare to the snapshot figure of location intensity in 2003.13 Similarly, the removal of trade barriers occurring in developing economies since the end of the 1980s has certainly contributed over time to the popularity of some of these countries as observed in 2003
Several other variables, such the legal or accounting environment and cultural distance, are not readily available. Consequently, variables to be considered in this model are only snapshot figures in 2002 and 2003, and the model is a simplified approach which may not be correctly specified.
/…
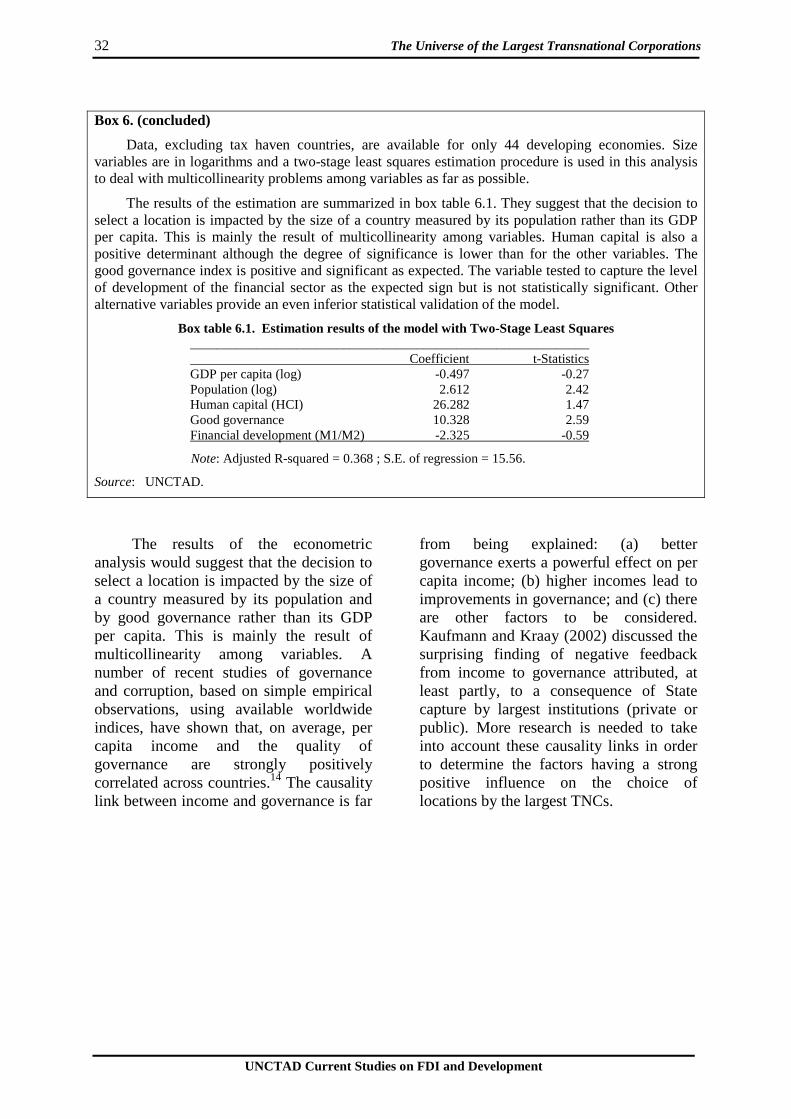
32 The Universe of the Largest Transnational Corporations
UNCTAD Current Studies on FDI and Development
Box 6. (concluded)
Data, excluding tax haven countries, are available for only 44 developing economies. Size variables are in logarithms and a two-stage least squares estimation procedure is used in this analysis to deal with multicollinearity problems among variables as far as possible.
The results of the estimation are summarized in box table 6.1. They suggest that the decision to select a location is impacted by the size of a country measured by its population rather than its GDP per capita. This is mainly the result of multicollinearity among variables. Human capital is also a positive determinant although the degree of significance is lower than for the other variables. The good governance index is positive and significant as expected. The variable tested to capture the level of development of the financial sector as the expected sign but is not statistically significant. Other alternative variables provide an even inferior statistical validation of the model.
Box table 6.1. Estimation results of the model with Two-Stage Least Squares ____________________________________________________________ Coefficient t-Statistics GDP per capita (log) -0.497 -0.27 Population (log) 2.612 2.42 Human capital (HCI) 26.282 1.47 Good governance 10.328 2.59 Financial development (M1/M2) -2.325 -0.59
Note: Adjusted R-squared = 0.368 ; S.E. of regression = 15.56.
Source: UNCTAD.
The results of the econometric analysis would suggest that the decision to select a location is impacted by the size of a country measured by its population and by good governance rather than its GDP per capita. This is mainly the result of multicollinearity among variables. A number of recent studies of governance and corruption, based on simple empirical observations, using available worldwide indices, have shown that, on average, per capita income and the quality of governance are strongly positively correlated across countries.14 The causality link between income and governance is far
from being explained: (a) better governance exerts a powerful effect on per capita income; (b) higher incomes lead to improvements in governance; and (c) there are other factors to be considered. Kaufmann and Kraay (2002) discussed the surprising finding of negative feedback from income to governance attributed, at least partly, to a consequence of State capture by largest institutions (private or public). More research is needed to take into account these causality links in order to determine the factors having a strong positive influence on the choice of locations by the largest TNCs.
VIII. Conclusions
A. The relative importance of the world’s largest TNCs
The universe of TNCs comprises firms from developed countries and increasingly developing countries. During the past 10 years, foreign assets owned by the largest TNCs have tripled and foreign sales have more than doubled. At the same time, in terms of the size of total assets and total sales, as well as foreign assets and foreign sales, TNCs from developing countries remain significantly smaller than the largest TNCs worldwide. However, the internationalization of activities is increasing for TNCs from developing economies and is catching up to the world’s largest firms.
In developing economies, there is a large disparity in terms of size as measured by foreign assets between the largest firms at the top of the list and firms ranked in the second half. The levels of concentration and dominance are much higher for firms based in developing economies than for the world’s largest TNCs.
All sectors of activities are affected by the internationalization of activities and the geographical extensiveness, or the degree to which a company’s operations and interests are spread in several countries, is also increasingly considered an important element in the strategy adopted by TNCs.
B. The degree of transnationality
Transnationalization focuses on the
intensity of foreign activities in relation to domestic or global activities. The Transnationality Index (TNI) published by UNCTAD is a composite of three ratios – foreign assets/total assets, foreign sales/total sales and foreign employment/total employment. The average TNI is higher for the largest TNCs, but over the recent past the index for the top 50 based in developing economies has increased dramatically and is catching up with the world’s largest TNCs.
Similar to their counterparts from developed countries, most firms and almost all sectors of activity have experienced a significant increase in the average TNI value over the past 10 years or so. In the most significant sectors of activity, the average TNI has been multiplied by a factor of almost four since 1993 for the food and beverages industry and almost two for the electronics and electrical equipment industry.
Given the range of perspectives and dimensions that can be considered to assess the degree of transnationality of a TNC, a single synthetic measure cannot fully capture the phenomenon. One aspect of transnationality from the operations perspective, not included in UNCTAD’s TNI, is the geographic extensiveness or the degree to which a company’s operations and interests are spread in several countries or concentrated in a few.
In this publication, we define a Transnationality Spread Index (TSI) to take into account the number of foreign affiliates and the magnitude of diversification of the activities. A graphical approach to transnationality shows for example that German firms as well as firms from the United States are better represented at the top of the list. Sectorally, firms in the pharmaceuticals industry, using this index, dominate the list of the most transnational TNCs.
34 The Universe of the Largest Transnational Corporations
UNCTAD Current Studies on FDI and Development
C. Most favoured locations for foreign affiliates
The ability of TNCs to contribute to international economic integration is a result both of their attributes and of how they respond to the economic and policy environment in which they operate. An analysis of the information on the location of foreign affiliates suggests that the most frequently chosen host countries by the largest TNCs are the United Kingdom and the Netherlands. Brazil and Mexico are the largest developing countries chosen as hosts by these companies.
The extent to which individual countries become part of, and benefit from, the emerging integrated international production system depends upon the interaction of their location-specific advantages with the changing firm-specific advantages that TNCs enjoy in the context of integrating their functional activities on a regional or global basis. Results of
Spearman rank correlations show variables such as the size of the country, human capital and governance indices have positive and significant correlations with the most favoured locations by the largest TNCs.
In the globalizing world economy, developing countries see FDI as a factor that can contribute to their long-term development. The continued need of firms to improve their competitiveness by expanding into new markets, reducing costs, maximizing their profitability and accessing natural resources and strategic assets abroad provides strong incentives for further FDI in developing countries. It is likely that the number of foreign affiliates and of host countries will also increase in the future due to the increasing complexity for organizing international production.
D. The need for more information on the activities of TNCs
The degree of international
involvement of a firm can be measured in various ways. The geographical extensity dimension is an important measure as it may be relevant to ask whether the operations and interests of a firm are concentrated in a region or equally spread among several regions. There are many aspects of TNC activities that involve considerable influence or control over the operations of firms outside the home country, but these are not covered by the current system of FDI statistics and surveys. There is a need to collect and analyze data on TNCs activities in host countries, such as sales, imports and exports, employment, wages and salaries, research and development expenditure and capital intensity, in order to better assess the impact of the activities of the largest TNCs on the world economy, as well as on home and host countries.
UNCTAD convened an expert meeting on capacity-building in the area of FDI statistics in Geneva in December 2005 to discuss key issues on the compilation of FDI statistics and particularly on the activities of direct investment enterprises.15 Data should be reliable, comparable, useful, and should cover a comprehensive set of information on the activities of TNCs, including all the variables that may influence the choice of location in establishing a foreign affiliate. These details are essential for countries to analyse the process of globalization in all its dimensions, including its impact on sustainable economic development and the formulation of development-oriented policies.
Chapter VIII 35
UNCTAD Current Studies on FDI and Development
Notes
1 See G. Ietto-Gillies (2005). 2 Anglo American (merger of Anglo American
Corporation of South Africa and Minorco from Luxembourg) and SAB Miller (merger of South African Breweries and Miller Brewing Company) are two noticeable examples. Mittal Steel, founded and owned by the Indian Mittal family, is registered in the Netherlands and headquartered in the United Kingdom.
3 These results cannot, of course, be compared directly with the usual use of the Herfindahl index to evaluate concentration by industry. The top 100 and 50 represent a number of industries.
4 There are in the literature many indices based on this concept of intensity. See, for example, Dunning (1996), Sullivan (1994) and Ramaswamy et al. (1996).
5 Ietto-Gillies (1998). Sanders and Carpenter (1998) use the number of countries as a percentage of the highest number of countries with subsidiaries in the sample.
6 Of course, a more detailed analysis would also take into account other factors, including the strategies pursued by different companies.
7 Cultural distance is different from geographical distance. Empirical evidence suggests the importance of geography in determining
international economic interactions and in shaping the structure of production across space (Overman et al., 2001). Ghemawat (2001) suggested that four dimensions of distance – namely cultural, administrative, geographic and economic – influence companies considering global expansion.
8 Recent work has been carried out by Galan and Gonzales-Benito (2001), Habib and Zurawicki (2002), Javalgi et al. (2003), La Porta et al. (1999, 2000); Kaufmann, D. and A. Kraay (2002), among others.
9 The methodology is available at www.euromoney.com.
10 See www.eiuresources.com. 11 Information on data and methodology are
available at www.tranparency.org. 12 Available at
www.worldbank.org/wbi/governance. 13 This variable was suggested by Rossi and Volpin
(2004) as a control factor but shows a small and non-significant value.
14 See Kaufmann and Kraay (2002) for a review. 15 The UNCTAD secretariat prepared a note
(UNCTAD/TD/B/COM.2/EM.18/2) on these issues.

References
Dunning JH (1996). The geographical sources
of competitiveness of firms. Some results of a new survey. Transnational Corporations, vol. 5: 1–21.
Galan JI and Gonzales-Benito J (2001). Determinants factors of foreign direct investment: some empirical evidence. European Business Review, vol. 13(5): 269–278.
Ghemawat P (2001). Distance still matters: The hard reality of global expansion. Harvard Business Review, September: 2–11.
Habib M and Zurawicki L (2002). Corruption and foreign direct investment. Journal of International Business Studies, vol. 33(2): 291–307.
Ietto-Gillies G (1998). Different conceptual frameworks for the assessment of the degree of internationalization: An empirical analysis of various indices for the top 100 transnational corporations. Transnational Corporations, No. 1, April: 17–39.
Ietto-Gillies G (2005). Transnational Firms and International Production: Concepts, Theories and Effects. London. Edward Elgar.
Javalgi RG Griffith DA and White DS (2003). An empirical examination of factors influencing the internationalization of services firms. Journal of Services Marketing, vol. 17: 185–201.
Johansson J and Vahlne JE (1977). The internationalization process of the firm: A model of knowledge development and increasing foreign market commitments. Journal of International Business Studies, vol. 8(1): 23–32.
Johansson J and Vahlne JE (1990). The mechanism of internalization. International Marketing Review, vol. 7(4): 1–24.
Kaufmann D, Kraay A and Zoido-Lobaton P (2000). Governance matters: From measurement to action. Finance and Development. vol. 37 (2).
Kaufmann D and Kraay A (2002). Growth without governance. Economia, vol. 3(1). 169–229.
Kogut B and Singh H (1998). The effect of national culture on the choice of entry mode. Journal of International Business Studies, vol. 22(2): 209–224.
La Porta R, Lopez-de-Silanes F, Sheifer A, and Vishny R (1999). The quality of governments. Journal of Law, Economics and Organization, vol. 15(1): 222–279.
La Porta R, Lopez-de-Silanes F, Sheifer A, and Vishny R (2000). Investor protection and corporate governance. Journal of Financial Economics, vol. 58(1): 3–27.
Overman HG, Redding S and Venables AJ (2001). The economic geography of trade production and income: A survey of empirics. Centre for Economic Performance, Discussion Paper no. 2978. Available at http://cep.lse.ac.uk/.
Ramaswamy K, Kroeck KG and Renforth W (1996). Measuring the degree of internationalization: A comment. Journal of International Business Studies, vol. 27(1): 167–177.
Rossi S and Volpin PF (2004). Cross-country determinants of mergers and acquisitions. Journal of Financial Economics, vol. 74: 277–304.
Rugman AM and Verbeke A (2004). A perspective on regional and global strategies of multinational enterprises. Journal of International Business Studies, Vol. 35(1): 3–18.
Sanders WM and Carpenter MA (1998). Internationalization and firm governance: The role of CEO compensation, top team composition, and board structure. Academy of Management Journal, vol. 41(2): 158–178.
Sullivan D (1994). Measuring the degree of internationalization of a firm. Journal of International Business Studies, vol. 25(2): 325–342.
38 The Universe of the Largest Transnational Corporations
UNCTAD Current Studies on FDI and Development
UNCTAD (1994). World Investment Report 1994: Transnational Corporations, Employment and the Workplace (United Nations: Geneva). Sales No. E.94.II.A.14.
UNCTAD (2004). World Investment Report 2004: The Shift Towards Services (United Nations: Geneva). Sales No. E.04.II.D.36.
UNCTAD (2005). World Investment Report 2005: Transnational Corporations and the Internationalization of R&D (United
Nations: Geneva). Sales No. E.05.II.D.10.
UNCTAD (2006). World Investment Report 2006: FDI from Developing and Transition Economies: Implications for Development (United Nations: Geneva). Sales No. E.06.II.D.11.
United Nations (2002). Manual on Statistics of International Trade in Services, Statistical Papers Series M no. 86, Geneva.
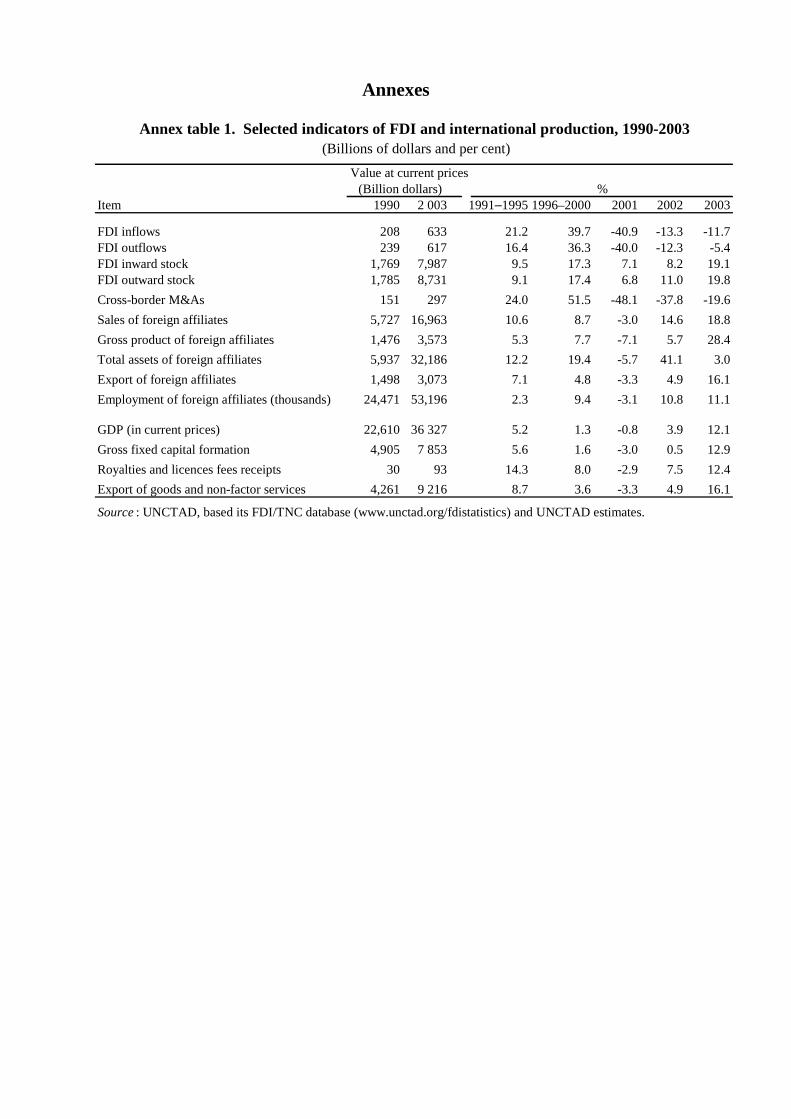
Annexes
1990 2 003 1991–1995 1996–2000 2001 2002 2003
FDI inflows 208 633 21.2 39.7 -40.9 -13.3 -11.7FDI outflows 239 617 16.4 36.3 -40.0 -12.3 -5.4FDI inward stock 1,769 7,987 9.5 17.3 7.1 8.2 19.1FDI outward stock 1,785 8,731 9.1 17.4 6.8 11.0 19.8
Cross-border M&As 151 297 24.0 51.5 -48.1 -37.8 -19.6
Sales of foreign affiliates 5,727 16,963 10.6 8.7 -3.0 14.6 18.8
Gross product of foreign affiliates 1,476 3,573 5.3 7.7 -7.1 5.7 28.4
Total assets of foreign affiliates 5,937 32,186 12.2 19.4 -5.7 41.1 3.0
Export of foreign affiliates 1,498 3,073 7.1 4.8 -3.3 4.9 16.1
Employment of foreign affiliates (thousands) 24,471 53,196 2.3 9.4 -3.1 10.8 11.1
GDP (in current prices) 22,610 36 327 5.2 1.3 -0.8 3.9 12.1
Gross fixed capital formation 4,905 7 853 5.6 1.6 -3.0 0.5 12.9
Royalties and licences fees receipts 30 93 14.3 8.0 -2.9 7.5 12.4
Export of goods and non-factor services 4,261 9 216 8.7 3.6 -3.3 4.9 16.1
Source : UNCTAD, based its FDI/TNC database (www.unctad.org/fdistatistics) and UNCTAD estimates.
%
Annex table 1. Selected indicators of FDI and international production, 1990-2003 (Billions of dollars and per cent)
Item
Value at current prices (Billion dollars)
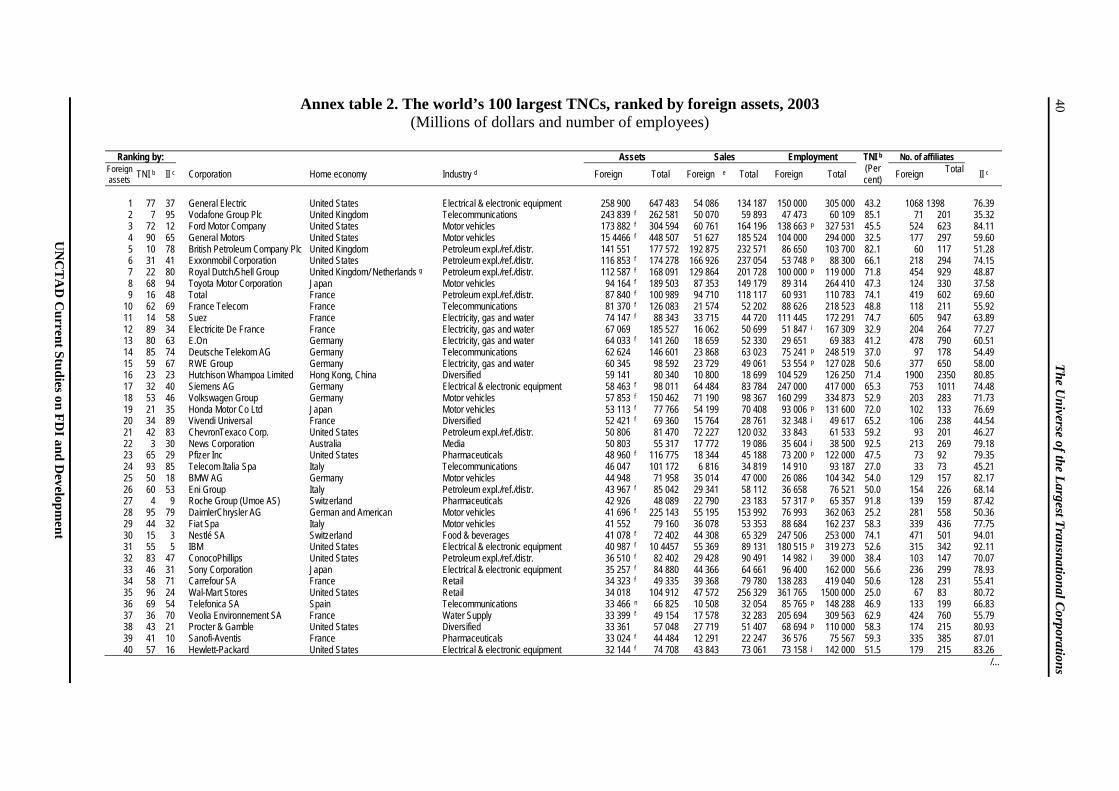
Annex table 2. The world’s 100 largest TNCs, ranked by foreign assets, 2003 (Millions of dollars and number of employees)
Ranking by: Assets Sales Employment No. of affiliates
Foreign assets TNI b II c Corporation Home economy Industry d Foreign Total Foreign e Total Foreign Total
TNI b (Per cent) Foreign Total II c
1 77 37 General Electric United States Electrical & electronic equipment 258 900 647 483 54 086 134 187 150 000 305 000 43.2 1068 1398 76.39 2 7 95 Vodafone Group Plc United Kingdom Telecommunications 243 839 f 262 581 50 070 59 893 47 473 60 109 85.1 71 201 35.32 3 72 12 Ford Motor Company United States Motor vehicles 173 882 f 304 594 60 761 164 196 138 663 p 327 531 45.5 524 623 84.11 4 90 65 General Motors United States Motor vehicles 15 4466 f 448 507 51 627 185 524 104 000 294 000 32.5 177 297 59.60 5 10 78 British Petroleum Company Plc United Kingdom Petroleum expl./ref./distr. 141 551 177 572 192 875 232 571 86 650 103 700 82.1 60 117 51.28 6 31 41 Exxonmobil Corporation United States Petroleum expl./ref./distr. 116 853 f 174 278 166 926 237 054 53 748 p 88 300 66.1 218 294 74.15 7 22 80 Royal Dutch/Shell Group United Kingdom/ Netherlands g Petroleum expl./ref./distr. 112 587 f 168 091 129 864 201 728 100 000 p 119 000 71.8 454 929 48.87 8 68 94 Toyota Motor Corporation Japan Motor vehicles 94 164 f 189 503 87 353 149 179 89 314 264 410 47.3 124 330 37.58 9 16 48 Total France Petroleum expl./ref./distr. 87 840 f 100 989 94 710 118 117 60 931 110 783 74.1 419 602 69.60
10 62 69 France Telecom France Telecommunications 81 370 f 126 083 21 574 52 202 88 626 218 523 48.8 118 211 55.92 11 14 58 Suez France Electricity, gas and water 74 147 f 88 343 33 715 44 720 111 445 172 291 74.7 605 947 63.89 12 89 34 Electricite De France France Electricity, gas and water 67 069 185 527 16 062 50 699 51 847 i 167 309 32.9 204 264 77.27 13 80 63 E.On Germany Electricity, gas and water 64 033 f 141 260 18 659 52 330 29 651 69 383 41.2 478 790 60.51 14 85 74 Deutsche Telekom AG Germany Telecommunications 62 624 146 601 23 868 63 023 75 241 p 248 519 37.0 97 178 54.49 15 59 67 RWE Group Germany Electricity, gas and water 60 345 98 592 23 729 49 061 53 554 p 127 028 50.6 377 650 58.00 16 23 23 Hutchison Whampoa Limited Hong Kong, China Diversified 59 141 80 340 10 800 18 699 104 529 126 250 71.4 1900 2350 80.85 17 32 40 Siemens AG Germany Electrical & electronic equipment 58 463 f 98 011 64 484 83 784 247 000 417 000 65.3 753 1011 74.48 18 53 46 Volkswagen Group Germany Motor vehicles 57 853 f 150 462 71 190 98 367 160 299 334 873 52.9 203 283 71.73 19 21 35 Honda Motor Co Ltd Japan Motor vehicles 53 113 f 77 766 54 199 70 408 93 006 p 131 600 72.0 102 133 76.69 20 34 89 Vivendi Universal France Diversified 52 421 f 69 360 15 764 28 761 32 348 j 49 617 65.2 106 238 44.54 21 42 83 ChevronTexaco Corp. United States Petroleum expl./ref./distr. 50 806 81 470 72 227 120 032 33 843 61 533 59.2 93 201 46.27 22 3 30 News Corporation Australia Media 50 803 55 317 17 772 19 086 35 604 j 38 500 92.5 213 269 79.18 23 65 29 Pfizer Inc United States Pharmaceuticals 48 960 f 116 775 18 344 45 188 73 200 p 122 000 47.5 73 92 79.35 24 93 85 Telecom Italia Spa Italy Telecommunications 46 047 101 172 6 816 34 819 14 910 93 187 27.0 33 73 45.21 25 50 18 BMW AG Germany Motor vehicles 44 948 71 958 35 014 47 000 26 086 104 342 54.0 129 157 82.17 26 60 53 Eni Group Italy Petroleum expl./ref./distr. 43 967 f 85 042 29 341 58 112 36 658 76 521 50.0 154 226 68.14 27 4 9 Roche Group (Umoe AS) Switzerland Pharmaceuticals 42 926 48 089 22 790 23 183 57 317 p 65 357 91.8 139 159 87.42 28 95 79 DaimlerChrysler AG German and American Motor vehicles 41 696 f 225 143 55 195 153 992 76 993 362 063 25.2 281 558 50.36 29 44 32 Fiat Spa Italy Motor vehicles 41 552 79 160 36 078 53 353 88 684 162 237 58.3 339 436 77.75 30 15 3 Nestlé SA Switzerland Food & beverages 41 078 f 72 402 44 308 65 329 247 506 253 000 74.1 471 501 94.01 31 55 5 IBM United States Electrical & electronic equipment 40 987 f 10 4457 55 369 89 131 180 515 p 319 273 52.6 315 342 92.11 32 83 47 ConocoPhillips United States Petroleum expl./ref./distr. 36 510 f 82 402 29 428 90 491 14 982 j 39 000 38.4 103 147 70.07 33 46 31 Sony Corporation Japan Electrical & electronic equipment 35 257 f 84 880 44 366 64 661 96 400 162 000 56.6 236 299 78.93 34 58 71 Carrefour SA France Retail 34 323 f 49 335 39 368 79 780 138 283 419 040 50.6 128 231 55.41 35 96 24 Wal-Mart Stores United States Retail 34 018 104 912 47 572 256 329 361 765 1500 000 25.0 67 83 80.72 36 69 54 Telefonica SA Spain Telecommunications 33 466 n 66 825 10 508 32 054 85 765 p 148 288 46.9 133 199 66.83 37 36 70 Veolia Environnement SA France Water Supply 33 399 f 49 154 17 578 32 283 205 694 309 563 62.9 424 760 55.79 38 43 21 Procter & Gamble United States Diversified 33 361 57 048 27 719 51 407 68 694 p 110 000 58.3 174 215 80.93 39 41 10 Sanofi-Aventis France Pharmaceuticals 33 024 f 44 484 12 291 22 247 36 576 75 567 59.3 335 385 87.01 40 57 16 Hewlett-Packard United States Electrical & electronic equipment 32 144 f 74 708 43 843 73 061 73 158 j 142 000 51.5 179 215 83.26
/…
UN
CT
AD
Current Studies on F
DI and D
evelopment
40
T
he Universe of the L
argest Transnational C
orporations
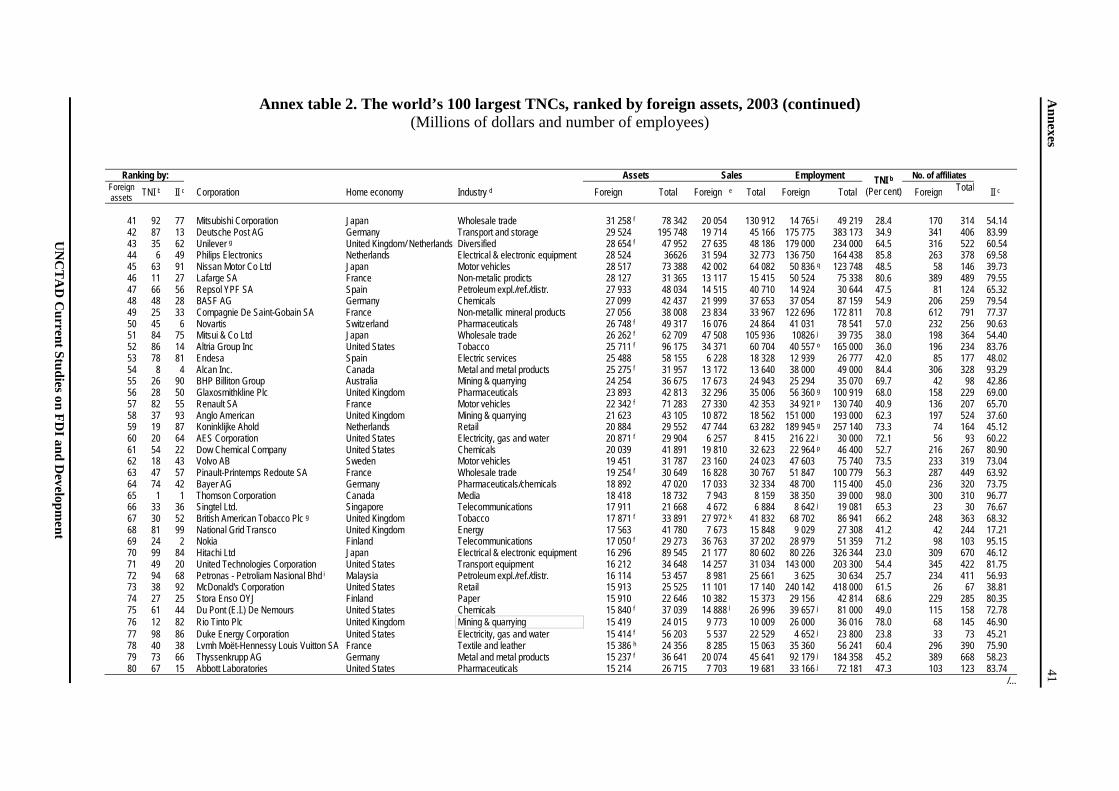
Annex table 2. The world’s 100 largest TNCs, ranked by foreign assets, 2003 (continued) (Millions of dollars and number of employees)
Ranking by: Assets Sales Employment No. of affiliates Foreign assets TNI b II c Corporation Home economy Industry d Foreign Total Foreign e Total Foreign Total
TNI b (Per cent) Foreign Total II c
41 92 77 Mitsubishi Corporation Japan Wholesale trade 31 258 f 78 342 20 054 130 912 14 765 j 49 219 28.4 170 314 54.14 42 87 13 Deutsche Post AG Germany Transport and storage 29 524 195 748 19 714 45 166 175 775 383 173 34.9 341 406 83.99 43 35 62 Unilever g United Kingdom/ Netherlands Diversified 28 654 f 47 952 27 635 48 186 179 000 234 000 64.5 316 522 60.54 44 6 49 Philips Electronics Netherlands Electrical & electronic equipment 28 524 36626 31 594 32 773 136 750 164 438 85.8 263 378 69.58 45 63 91 Nissan Motor Co Ltd Japan Motor vehicles 28 517 73 388 42 002 64 082 50 836 q 123 748 48.5 58 146 39.73 46 11 27 Lafarge SA France Non-metalic prodicts 28 127 31 365 13 117 15 415 50 524 75 338 80.6 389 489 79.55 47 66 56 Repsol YPF SA Spain Petroleum expl./ref./distr. 27 933 48 034 14 515 40 710 14 924 30 644 47.5 81 124 65.32 48 48 28 BASF AG Germany Chemicals 27 099 42 437 21 999 37 653 37 054 87 159 54.9 206 259 79.54 49 25 33 Compagnie De Saint-Gobain SA France Non-metallic mineral products 27 056 38 008 23 834 33 967 122 696 172 811 70.8 612 791 77.37 50 45 6 Novartis Switzerland Pharmaceuticals 26 748 f 49 317 16 076 24 864 41 031 78 541 57.0 232 256 90.63 51 84 75 Mitsui & Co Ltd Japan Wholesale trade 26 262 f 62 709 47 508 105 936 10826 j 39 735 38.0 198 364 54.40 52 86 14 Altria Group Inc United States Tobacco 25 711 f 96 175 34 371 60 704 40 557 o 165 000 36.0 196 234 83.76 53 78 81 Endesa Spain Electric services 25 488 58 155 6 228 18 328 12 939 26 777 42.0 85 177 48.02 54 8 4 Alcan Inc. Canada Metal and metal products 25 275 f 31 957 13 172 13 640 38 000 49 000 84.4 306 328 93.29 55 26 90 BHP Billiton Group Australia Mining & quarrying 24 254 36 675 17 673 24 943 25 294 35 070 69.7 42 98 42.86 56 28 50 Glaxosmithkline Plc United Kingdom Pharmaceuticals 23 893 42 813 32 296 35 006 56 360 g 100 919 68.0 158 229 69.00 57 82 55 Renault SA France Motor vehicles 22 342 f 71 283 27 330 42 353 34 921 p 130 740 40.9 136 207 65.70 58 37 93 Anglo American United Kingdom Mining & quarrying 21 623 43 105 10 872 18 562 151 000 193 000 62.3 197 524 37.60 59 19 87 Koninklijke Ahold Netherlands Retail 20 884 29 552 47 744 63 282 189 945 g 257 140 73.3 74 164 45.12 60 20 64 AES Corporation United States Electricity, gas and water 20 871 f 29 904 6 257 8 415 216 22 j 30 000 72.1 56 93 60.22 61 54 22 Dow Chemical Company United States Chemicals 20 039 41 891 19 810 32 623 22 964 p 46 400 52.7 216 267 80.90 62 18 43 Volvo AB Sweden Motor vehicles 19 451 31 787 23 160 24 023 47 603 75 740 73.5 233 319 73.04 63 47 57 Pinault-Printemps Redoute SA France Wholesale trade 19 254 f 30 649 16 828 30 767 51 847 100 779 56.3 287 449 63.92 64 74 42 Bayer AG Germany Pharmaceuticals/chemicals 18 892 47 020 17 033 32 334 48 700 115 400 45.0 236 320 73.75 65 1 1 Thomson Corporation Canada Media 18 418 18 732 7 943 8 159 38 350 39 000 98.0 300 310 96.77 66 33 36 Singtel Ltd. Singapore Telecommunications 17 911 21 668 4 672 6 884 8 642 j 19 081 65.3 23 30 76.67 67 30 52 British American Tobacco Plc g United Kingdom Tobacco 17 871 f 33 891 27 972 k 41 832 68 702 86 941 66.2 248 363 68.32 68 81 99 National Grid Transco United Kingdom Energy 17 563 41 780 7 673 15 848 9 029 27 308 41.2 42 244 17.21 69 24 2 Nokia Finland Telecommunications 17 050 f 29 273 36 763 37 202 28 979 51 359 71.2 98 103 95.15 70 99 84 Hitachi Ltd Japan Electrical & electronic equipment 16 296 89 545 21 177 80 602 80 226 326 344 23.0 309 670 46.12 71 49 20 United Technologies Corporation United States Transport equipment 16 212 34 648 14 257 31 034 143 000 203 300 54.4 345 422 81.75 72 94 68 Petronas - Petroliam Nasional Bhd i Malaysia Petroleum expl./ref./distr. 16 114 53 457 8 981 25 661 3 625 30 634 25.7 234 411 56.93 73 38 92 McDonald's Corporation United States Retail 15 913 25 525 11 101 17 140 240 142 418 000 61.5 26 67 38.81 74 27 25 Stora Enso OYJ Finland Paper 15 910 22 646 10 382 15 373 29 156 42 814 68.6 229 285 80.35 75 61 44 Du Pont (E.I.) De Nemours United States Chemicals 15 840 f 37 039 14 888 l 26 996 39 657 j 81 000 49.0 115 158 72.78 76 12 82 Rio Tinto Plc United Kingdom Mining & quarrying 15 419 24 015 9 773 10 009 26 000 36 016 78.0 68 145 46.90 77 98 86 Duke Energy Corporation United States Electricity, gas and water 15 414 f 56 203 5 537 22 529 4 652 j 23 800 23.8 33 73 45.21 78 40 38 Lvmh Moët-Hennessy Louis Vuitton SA France Textile and leather 15 386 h 24 356 8 285 15 063 35 360 56 241 60.4 296 390 75.90 79 73 66 Thyssenkrupp AG Germany Metal and metal products 15 237 f 36 641 20 074 45 641 92 179 j 184 358 45.2 389 668 58.23 80 67 15 Abbott Laboratories United States Pharmaceuticals 15 214 26 715 7 703 19 681 33 166 j 72 181 47.3 103 123 83.74
/…
UN
CT
AD
Current Studies on F
DI and D
evelopment
Annexes
41
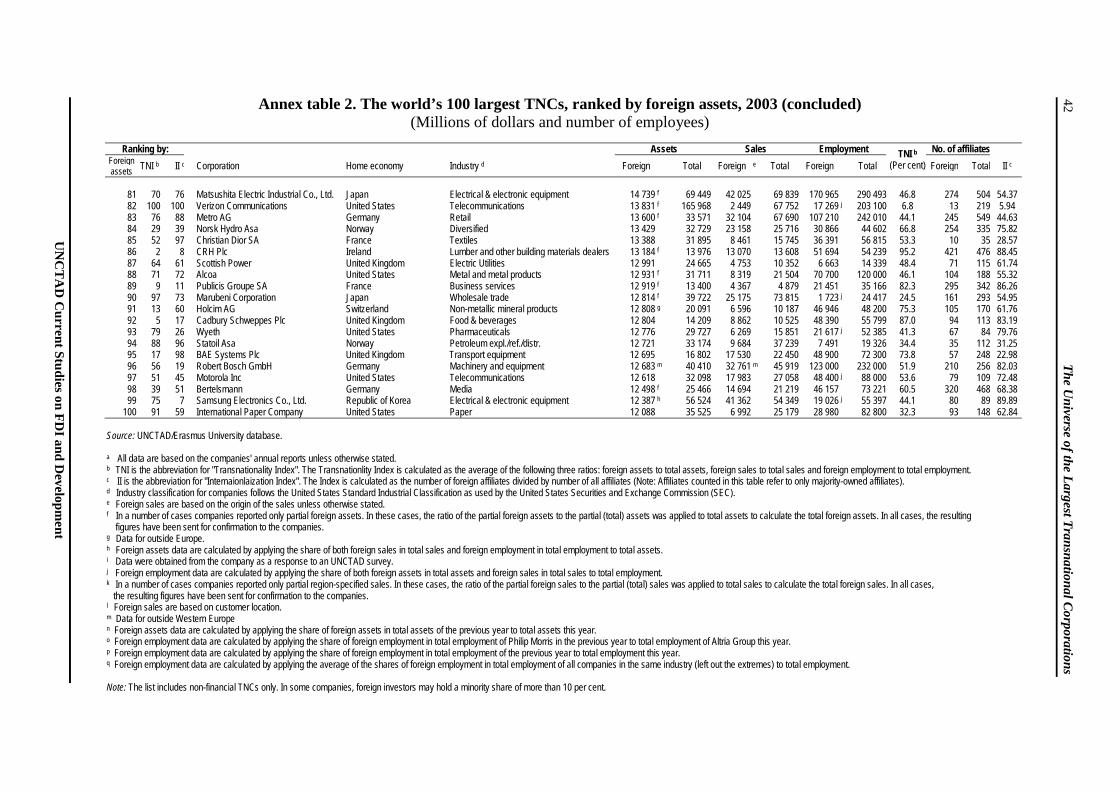
Annex table 2. The world’s 100 largest TNCs, ranked by foreign assets, 2003 (concluded) (Millions of dollars and number of employees)
Ranking by: Assets Sales Employment No. of affiliates
Foreign assets TNI b II c Corporation Home economy Industry d Foreign Total Foreign e Total Foreign Total
TNI b (Per cent) Foreign Total II c
81 70 76 Matsushita Electric Industrial Co., Ltd. Japan Electrical & electronic equipment 14 739 f 69 449 42 025 69 839 170 965 290 493 46.8 274 504 54.37 82 100 100 Verizon Communications United States Telecommunications 13 831 f 165 968 2 449 67 752 17 269 j 203 100 6.8 13 219 5.94 83 76 88 Metro AG Germany Retail 13 600 f 33 571 32 104 67 690 107 210 242 010 44.1 245 549 44.63 84 29 39 Norsk Hydro Asa Norway Diversified 13 429 32 729 23 158 25 716 30 866 44 602 66.8 254 335 75.82 85 52 97 Christian Dior SA France Textiles 13 388 31 895 8 461 15 745 36 391 56 815 53.3 10 35 28.57 86 2 8 CRH Plc Ireland Lumber and other building materials dealers 13 184 f 13 976 13 070 13 608 51 694 54 239 95.2 421 476 88.45 87 64 61 Scottish Power United Kingdom Electric Utilities 12 991 24 665 4 753 10 352 6 663 14 339 48.4 71 115 61.74 88 71 72 Alcoa United States Metal and metal products 12 931 f 31 711 8 319 21 504 70 700 120 000 46.1 104 188 55.32 89 9 11 Publicis Groupe SA France Business services 12 919 f 13 400 4 367 4 879 21 451 35 166 82.3 295 342 86.26 90 97 73 Marubeni Corporation Japan Wholesale trade 12 814 f 39 722 25 175 73 815 1 723 j 24 417 24.5 161 293 54.95 91 13 60 Holcim AG Switzerland Non-metallic mineral products 12 808 g 20 091 6 596 10 187 46 946 48 200 75.3 105 170 61.76 92 5 17 Cadbury Schweppes Plc United Kingdom Food & beverages 12 804 14 209 8 862 10 525 48 390 55 799 87.0 94 113 83.19 93 79 26 Wyeth United States Pharmaceuticals 12 776 29 727 6 269 15 851 21 617 j 52 385 41.3 67 84 79.76 94 88 96 Statoil Asa Norway Petroleum expl./ref./distr. 12 721 33 174 9 684 37 239 7 491 19 326 34.4 35 112 31.25 95 17 98 BAE Systems Plc United Kingdom Transport equipment 12 695 16 802 17 530 22 450 48 900 72 300 73.8 57 248 22.98 96 56 19 Robert Bosch GmbH Germany Machinery and equipment 12 683 m 40 410 32 761 m 45 919 123 000 232 000 51.9 210 256 82.03 97 51 45 Motorola Inc United States Telecommunications 12 618 32 098 17 983 27 058 48 400 j 88 000 53.6 79 109 72.48 98 39 51 Bertelsmann Germany Media 12 498 f 25 466 14 694 21 219 46 157 73 221 60.5 320 468 68.38 99 75 7 Samsung Electronics Co., Ltd. Republic of Korea Electrical & electronic equipment 12 387 h 56 524 41 362 54 349 19 026 j 55 397 44.1 80 89 89.89
100 91 59 International Paper Company United States Paper 12 088 35 525 6 992 25 179 28 980 82 800 32.3 93 148 62.84
Source: UNCTAD/Erasmus University database. a All data are based on the companies' annual reports unless otherwise stated. b TNI is the abbreviation for "Transnationality Index". The Transnationlity Index is calculated as the average of the following three ratios: foreign assets to total assets, foreign sales to total sales and foreign employment to total employment. c II is the abbreviation for "Internaionlaization Index". The Index is calculated as the number of foreign affiliates divided by number of all affiliates (Note: Affiliates counted in this table refer to only majority-owned affiliates). d Industry classification for companies follows the United States Standard Industrial Classification as used by the United States Securities and Exchange Commission (SEC). e Foreign sales are based on the origin of the sales unless otherwise stated. f In a number of cases companies reported only partial foreign assets. In these cases, the ratio of the partial foreign assets to the partial (total) assets was applied to total assets to calculate the total foreign assets. In all cases, the resulting figures have been sent for confirmation to the companies. g Data for outside Europe. h Foreign assets data are calculated by applying the share of both foreign sales in total sales and foreign employment in total employment to total assets. i Data were obtained from the company as a response to an UNCTAD survey. j Foreign employment data are calculated by applying the share of both foreign assets in total assets and foreign sales in total sales to total employment. k In a number of cases companies reported only partial region-specified sales. In these cases, the ratio of the partial foreign sales to the partial (total) sales was applied to total sales to calculate the total foreign sales. In all cases, the resulting figures have been sent for confirmation to the companies. l Foreign sales are based on customer location. m Data for outside Western Europe n Foreign assets data are calculated by applying the share of foreign assets in total assets of the previous year to total assets this year. o Foreign employment data are calculated by applying the share of foreign employment in total employment of Philip Morris in the previous year to total employment of Altria Group this year. p Foreign employment data are calculated by applying the share of foreign employment in total employment of the previous year to total employment this year. q Foreign employment data are calculated by applying the average of the shares of foreign employment in total employment of all companies in the same industry (left out the extremes) to total employment. Note: The list includes non-financial TNCs only. In some companies, foreign investors may hold a minority share of more than 10 per cent.
42
T
he Universe of the L
argest Transnational C
orporations
UN
CT
AD
Current Studies on F
DI and D
evelopment
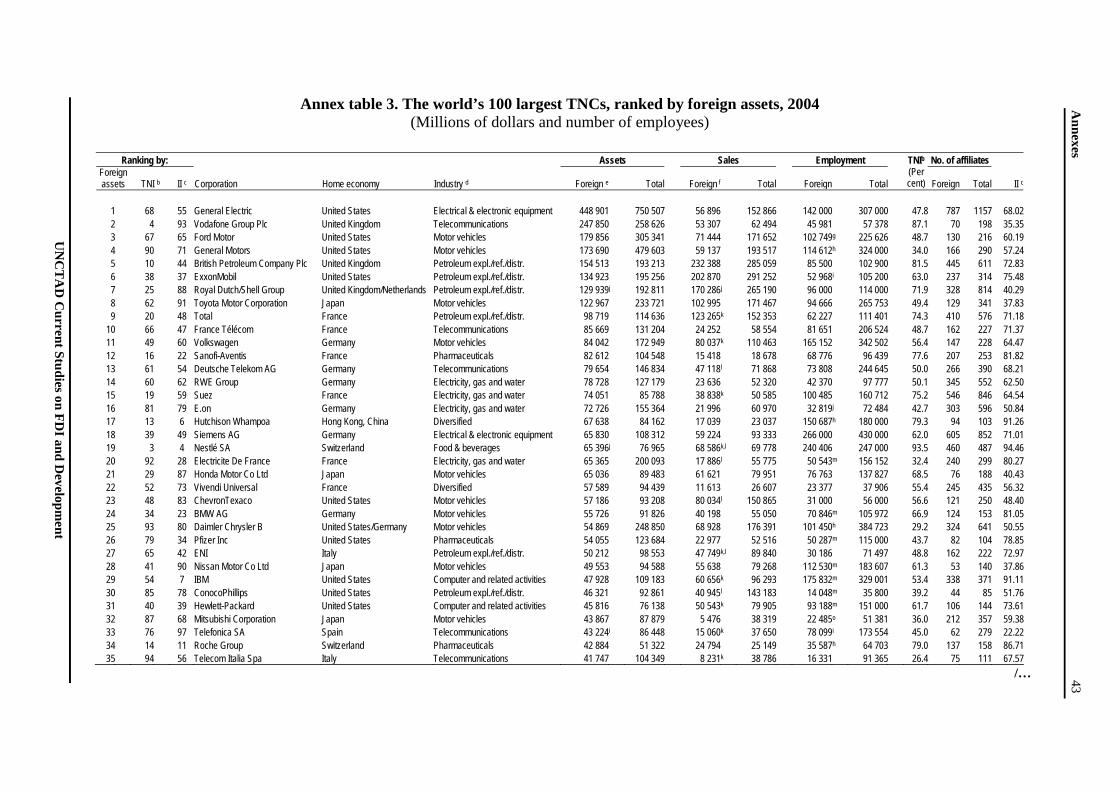
Annex table 3. The world’s 100 largest TNCs, ranked by foreign assets, 2004 (Millions of dollars and number of employees)
Ranking by: Assets Sales Employment No. of affiliates
Foreign assets TNI b II c Corporation Home economy Industry d Foreign e Total Foreign f Total Foreign Total
TNIb (Per cent) Foreign Total II c
1 68 55 General Electric United States Electrical & electronic equipment 448 901 750 507 56 896 152 866 142 000 307 000 47.8 787 1157 68.022 4 93 Vodafone Group Plc United Kingdom Telecommunications 247 850 258 626 53 307 62 494 45 981 57 378 87.1 70 198 35.353 67 65 Ford Motor United States Motor vehicles 179 856 305 341 71 444 171 652 102 749g 225 626 48.7 130 216 60.194 90 71 General Motors United States Motor vehicles 173 690 479 603 59 137 193 517 114 612h 324 000 34.0 166 290 57.245 10 44 British Petroleum Company Plc United Kingdom Petroleum expl./ref./distr. 154 513 193 213 232 388 285 059 85 500 102 900 81.5 445 611 72.836 38 37 ExxonMobil United States Petroleum expl./ref./distr. 134 923 195 256 202 870 291 252 52 968i 105 200 63.0 237 314 75.487 25 88 Royal Dutch/Shell Group United Kingdom/Netherlands Petroleum expl./ref./distr. 129 939j 192 811 170 286j 265 190 96 000 114 000 71.9 328 814 40.298 62 91 Toyota Motor Corporation Japan Motor vehicles 122 967 233 721 102 995 171 467 94 666 265 753 49.4 129 341 37.839 20 48 Total France Petroleum expl./ref./distr. 98 719 114 636 123 265k 152 353 62 227 111 401 74.3 410 576 71.18
10 66 47 France Télécom France Telecommunications 85 669 131 204 24 252 58 554 81 651 206 524 48.7 162 227 71.3711 49 60 Volkswagen Germany Motor vehicles 84 042 172 949 80 037k 110 463 165 152 342 502 56.4 147 228 64.4712 16 22 Sanofi-Aventis France Pharmaceuticals 82 612 104 548 15 418 18 678 68 776 96 439 77.6 207 253 81.8213 61 54 Deutsche Telekom AG Germany Telecommunications 79 654 146 834 47 118l 71 868 73 808 244 645 50.0 266 390 68.2114 60 62 RWE Group Germany Electricity, gas and water 78 728 127 179 23 636 52 320 42 370 97 777 50.1 345 552 62.5015 19 59 Suez France Electricity, gas and water 74 051 85 788 38 838k 50 585 100 485 160 712 75.2 546 846 64.5416 81 79 E.on Germany Electricity, gas and water 72 726 155 364 21 996 60 970 32 819j 72 484 42.7 303 596 50.8417 13 6 Hutchison Whampoa Hong Kong, China Diversified 67 638 84 162 17 039 23 037 150 687h 180 000 79.3 94 103 91.2618 39 49 Siemens AG Germany Electrical & electronic equipment 65 830 108 312 59 224 93 333 266 000 430 000 62.0 605 852 71.0119 3 4 Nestlé SA Switzerland Food & beverages 65 396j 76 965 68 586k,l 69 778 240 406 247 000 93.5 460 487 94.4620 92 28 Electricite De France France Electricity, gas and water 65 365 200 093 17 886l 55 775 50 543m 156 152 32.4 240 299 80.2721 29 87 Honda Motor Co Ltd Japan Motor vehicles 65 036 89 483 61 621 79 951 76 763 137 827 68.5 76 188 40.4322 52 73 Vivendi Universal France Diversified 57 589 94 439 11 613 26 607 23 377 37 906 55.4 245 435 56.3223 48 83 ChevronTexaco United States Motor vehicles 57 186 93 208 80 034l 150 865 31 000 56 000 56.6 121 250 48.4024 34 23 BMW AG Germany Motor vehicles 55 726 91 826 40 198 55 050 70 846m 105 972 66.9 124 153 81.0525 93 80 Daimler Chrysler B United States/Germany Motor vehicles 54 869 248 850 68 928 176 391 101 450h 384 723 29.2 324 641 50.5526 79 34 Pfizer Inc United States Pharmaceuticals 54 055 123 684 22 977 52 516 50 287m 115 000 43.7 82 104 78.8527 65 42 ENI Italy Petroleum expl./ref./distr. 50 212 98 553 47 749k,l 89 840 30 186 71 497 48.8 162 222 72.9728 41 90 Nissan Motor Co Ltd Japan Motor vehicles 49 553 94 588 55 638 79 268 112 530m 183 607 61.3 53 140 37.8629 54 7 IBM United States Computer and related activities 47 928 109 183 60 656k 96 293 175 832m 329 001 53.4 338 371 91.1130 85 78 ConocoPhillips United States Petroleum expl./ref./distr. 46 321 92 861 40 945l 143 183 14 048m 35 800 39.2 44 85 51.7631 40 39 Hewlett-Packard United States Computer and related activities 45 816 76 138 50 543k 79 905 93 188m 151 000 61.7 106 144 73.6132 87 68 Mitsubishi Corporation Japan Motor vehicles 43 867 87 879 5 476 38 319 22 485o 51 381 36.0 212 357 59.3833 76 97 Telefonica SA Spain Telecommunications 43 224i 86 448 15 060k 37 650 78 099i 173 554 45.0 62 279 22.2234 14 11 Roche Group Switzerland Pharmaceuticals 42 884 51 322 24 794 25 149 35 587h 64 703 79.0 137 158 86.7135 94 56 Telecom Italia Spa Italy Telecommunications 41 747 104 349 8 231k 38 786 16 331 91 365 26.4 75 111 67.57
/…
UN
CT
AD
Current Studies on F
DI and D
evelopment
Annexes
43
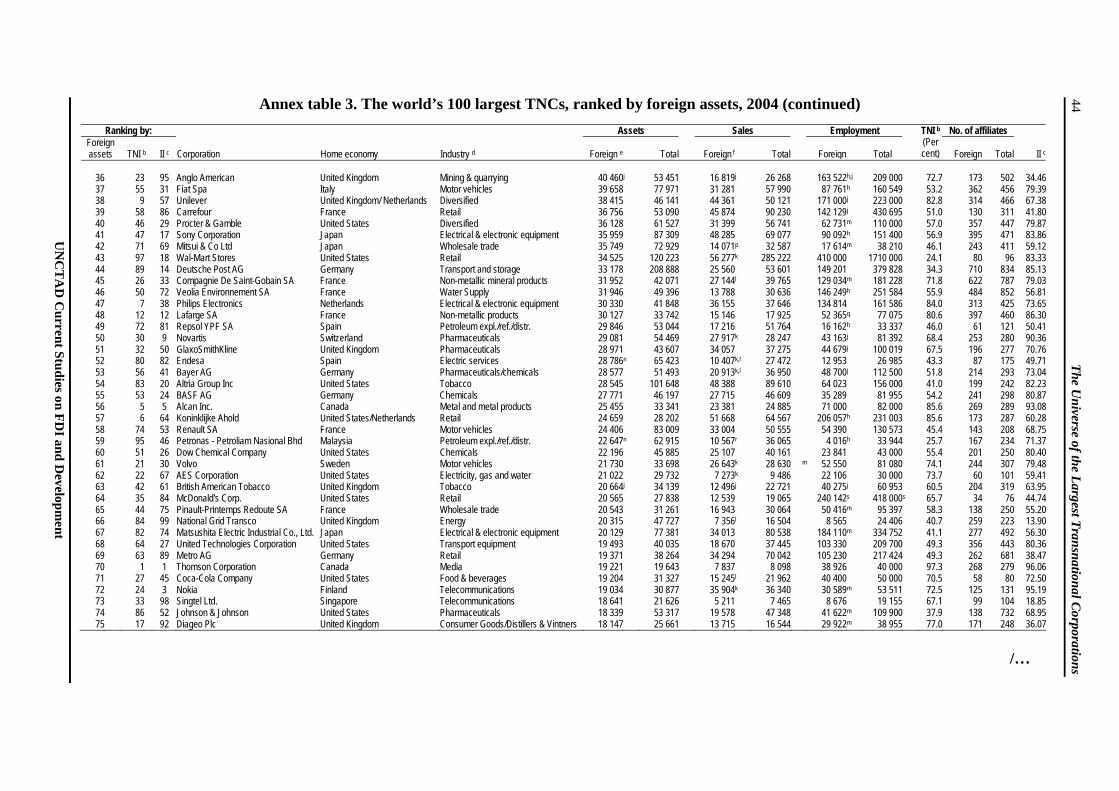
Annex table 3. The world’s 100 largest TNCs, ranked by foreign assets, 2004 (continued)
Ranking by: Assets Sales Employment No. of affiliates Foreign assets TNI b II c Corporation Home economy Industry d Foreign e Total Foreign f Total Foreign Total
TNI b (Per cent) Foreign Total II c
36 23 95 Anglo American United Kingdom Mining & quarrying 40 460j 53 451 16 819j 26 268 163 522h,j 209 000 72.7 173 502 34.4637 55 31 Fiat Spa Italy Motor vehicles 39 658 77 971 31 281 57 990 87 761h 160 549 53.2 362 456 79.3938 9 57 Unilever United Kingdom/ Netherlands Diversified 38 415 46 141 44 361 50 121 171 000j 223 000 82.8 314 466 67.3839 58 86 Carrefour France Retail 36 756 53 090 45 874 90 230 142 129j 430 695 51.0 130 311 41.8040 46 29 Procter & Gamble United States Diversified 36 128 61 527 31 399 56 741 62 731m 110 000 57.0 357 447 79.8741 47 17 Sony Corporation Japan Electrical & electronic equipment 35 959 87 309 48 285 69 077 90 092h 151 400 56.9 395 471 83.8642 71 69 Mitsui & Co Ltd Japan Wholesale trade 35 749 72 929 14 071p 32 587 17 614m 38 210 46.1 243 411 59.1243 97 18 Wal-Mart Stores United States Retail 34 525 120 223 56 277k 285 222 410 000 1710 000 24.1 80 96 83.3344 89 14 Deutsche Post AG Germany Transport and storage 33 178 208 888 25 560 53 601 149 201 379 828 34.3 710 834 85.1345 26 33 Compagnie De Saint-Gobain SA France Non-metallic mineral products 31 952 42 071 27 144l 39 765 129 034m 181 228 71.8 622 787 79.0346 50 72 Veolia Environnement SA France Water Supply 31 946 49 396 13 788 30 636 146 249h 251 584 55.9 484 852 56.8147 7 38 Philips Electronics Netherlands Electrical & electronic equipment 30 330 41 848 36 155 37 646 134 814 161 586 84.0 313 425 73.6548 12 12 Lafarge SA France Non-metallic products 30 127 33 742 15 146 17 925 52 365q 77 075 80.6 397 460 86.3049 72 81 Repsol YPF SA Spain Petroleum expl./ref./distr. 29 846 53 044 17 216 51 764 16 162h 33 337 46.0 61 121 50.4150 30 9 Novartis Switzerland Pharmaceuticals 29 081 54 469 27 917k 28 247 43 163j 81 392 68.4 253 280 90.3651 32 50 GlaxoSmithKline United Kingdom Pharmaceuticals 28 971 43 607 34 057 37 275 44 679j 100 019 67.5 196 277 70.7652 80 82 Endesa Spain Electric services 28 786n 65 423 10 407k,l 27 472 12 953 26 985 43.3 87 175 49.7153 56 41 Bayer AG Germany Pharmaceuticals/chemicals 28 577 51 493 20 913k,l 36 950 48 700j 112 500 51.8 214 293 73.0454 83 20 Altria Group Inc United States Tobacco 28 545 101 648 48 388 89 610 64 023 156 000 41.0 199 242 82.2355 53 24 BASF AG Germany Chemicals 27 771 46 197 27 715 46 609 35 289 81 955 54.2 241 298 80.8756 5 5 Alcan Inc. Canada Metal and metal products 25 455 33 341 23 381 24 885 71 000 82 000 85.6 269 289 93.0857 6 64 Koninklijke Ahold United States/Netherlands Retail 24 659 28 202 51 668 64 567 206 057h 231 003 85.6 173 287 60.2858 74 53 Renault SA France Motor vehicles 24 406 83 009 33 004 50 555 54 390 130 573 45.4 143 208 68.7559 95 46 Petronas - Petroliam Nasional Bhd Malaysia Petroleum expl./ref./distr. 22 647n 62 915 10 567r 36 065 4 016h 33 944 25.7 167 234 71.3760 51 26 Dow Chemical Company United States Chemicals 22 196 45 885 25 107 40 161 23 841 43 000 55.4 201 250 80.4061 21 30 Volvo Sweden Motor vehicles 21 730 33 698 26 643k 28 630 m 52 550 81 080 74.1 244 307 79.4862 22 67 AES Corporation United States Electricity, gas and water 21 022 29 732 7 273k 9 486 22 106 30 000 73.7 60 101 59.4163 42 61 British American Tobacco United Kingdom Tobacco 20 664j 34 139 12 496j 22 721 40 275j 60 953 60.5 204 319 63.9564 35 84 McDonald's Corp. United States Retail 20 565 27 838 12 539 19 065 240 142s 418 000s 65.7 34 76 44.7465 44 75 Pinault-Printemps Redoute SA France Wholesale trade 20 543 31 261 16 943 30 064 50 416m 95 397 58.3 138 250 55.2066 84 99 National Grid Transco United Kingdom Energy 20 315 47 727 7 356l 16 504 8 565 24 406 40.7 259 223 13.9067 82 74 Matsushita Electric Industrial Co., Ltd. Japan Electrical & electronic equipment 20 129 77 381 34 013 80 538 184 110m 334 752 41.1 277 492 56.3068 64 27 United Technologies Corporation United States Transport equipment 19 493 40 035 18 670 37 445 103 330 209 700 49.3 356 443 80.3669 63 89 Metro AG Germany Retail 19 371 38 264 34 294 70 042 105 230 217 424 49.3 262 681 38.4770 1 1 Thomson Corporation Canada Media 19 221 19 643 7 837 8 098 38 926 40 000 97.3 268 279 96.0671 27 45 Coca-Cola Company United States Food & beverages 19 204 31 327 15 245l 21 962 40 400 50 000 70.5 58 80 72.5072 24 3 Nokia Finland Telecommunications 19 034 30 877 35 904k 36 340 30 589m 53 511 72.5 125 131 95.1973 33 98 Singtel Ltd. Singapore Telecommunications 18 641 21 626 5 211 7 465 8 676 19 155 67.1 99 104 18.8574 86 52 Johnson & Johnson United States Pharmaceuticals 18 339 53 317 19 578 47 348 41 622m 109 900 37.9 138 732 68.9575 17 92 Diageo Plc United Kingdom Consumer Goods/Distillers & Vintners 18 147 25 661 13 715 16 544 29 922m 38 955 77.0 171 248 36.07
/…
UN
CT
AD
Current Studies on F
DI and D
evelopment
44
T
he Universe of the L
argest Transnational C
orporations
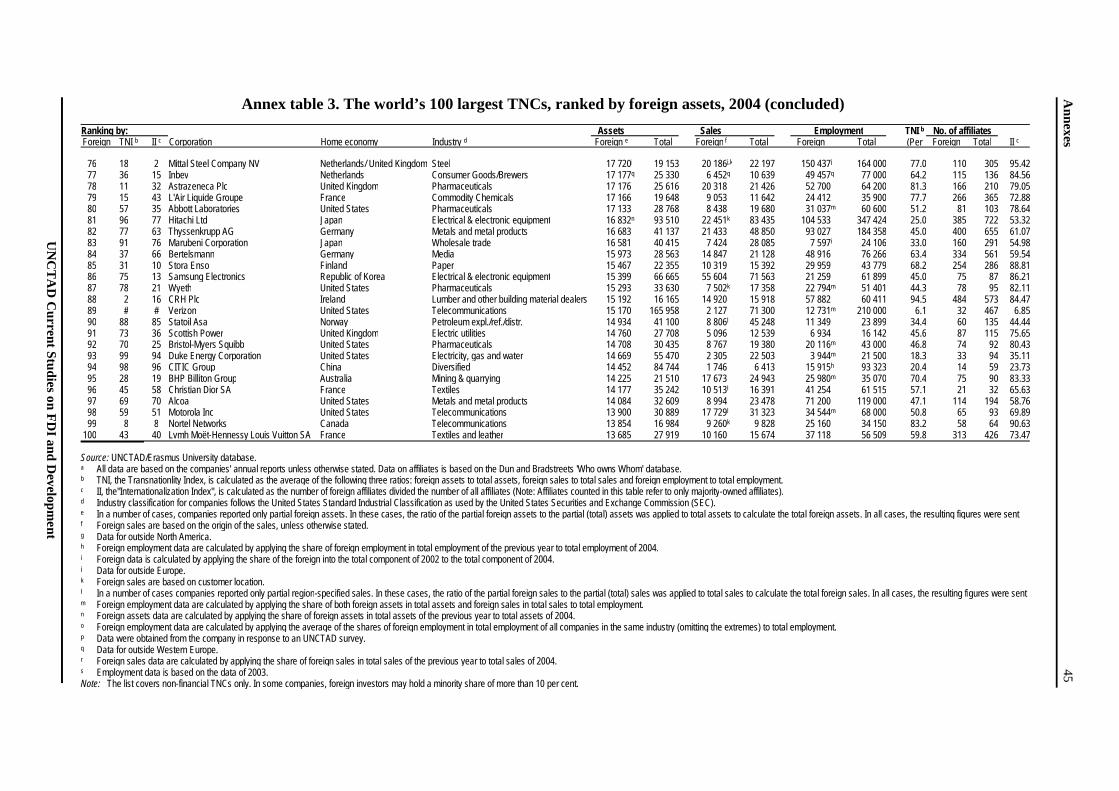
Annex table 3. The world’s 100 largest TNCs, ranked by foreign assets, 2004 (concluded)
Ranking by: Assets Sales Employment No. of affiliates Foreign TNI b II c Corporation Home economy Industry d Foreign e Total Foreign f Total Foreign Total
TNI b (Per Foreign Total II c
76 18 2 Mittal Steel Company NV Netherlands/ United Kingdom Steel 17 720j 19 153 20 186j,k 22 197 150 437j 164 000 77.0 110 305 95.4277 36 15 Inbev Netherlands Consumer Goods/Brewers 17 177q 25 330 6 452q 10 639 49 457q 77 000 64.2 115 136 84.5678 11 32 Astrazeneca Plc United Kingdom Pharmaceuticals 17 176 25 616 20 318 21 426 52 700 64 200 81.3 166 210 79.0579 15 43 L'Air Liquide Groupe France Commodity Chemicals 17 166 19 648 9 053 11 642 24 412 35 900 77.7 266 365 72.8880 57 35 Abbott Laboratories United States Pharmaceuticals 17 133 28 768 8 438 19 680 31 037m 60 600 51.2 81 103 78.6481 96 77 Hitachi Ltd Japan Electrical & electronic equipment 16 832n 93 510 22 451k 83 435 104 533 347 424 25.0 385 722 53.3282 77 63 Thyssenkrupp AG Germany Metals and metal products 16 683 41 137 21 433 48 850 93 027 184 358 45.0 400 655 61.0783 91 76 Marubeni Corporation Japan Wholesale trade 16 581 40 415 7 424 28 085 7 597i 24 106 33.0 160 291 54.9884 37 66 Bertelsmann Germany Media 15 973 28 563 14 847 21 128 48 916 76 266 63.4 334 561 59.5485 31 10 Stora Enso Finland Paper 15 467 22 355 10 319 15 392 29 959 43 779 68.2 254 286 88.8186 75 13 Samsung Electronics Republic of Korea Electrical & electronic equipment 15 399 66 665 55 604 71 563 21 259 61 899 45.0 75 87 86.2187 78 21 Wyeth United States Pharmaceuticals 15 293 33 630 7 502k 17 358 22 794m 51 401 44.3 78 95 82.1188 2 16 CRH Plc Ireland Lumber and other building material dealers 15 192 16 165 14 920 15 918 57 882 60 411 94.5 484 573 84.4789 # # Verizon United States Telecommunications 15 170 165 958 2 127 71 300 12 731m 210 000 6.1 32 467 6.8590 88 85 Statoil Asa Norway Petroleum expl./ref./distr. 14 934 41 100 8 806l 45 248 11 349 23 899 34.4 60 135 44.4491 73 36 Scottish Power United Kingdom Electric utilities 14 760 27 708 5 096 12 539 6 934 16 142 45.6 87 115 75.6592 70 25 Bristol-Myers Squibb United States Pharmaceuticals 14 708 30 435 8 767 19 380 20 116m 43 000 46.8 74 92 80.4393 99 94 Duke Energy Corporation United States Electricity, gas and water 14 669 55 470 2 305 22 503 3 944m 21 500 18.3 33 94 35.1194 98 96 CITIC Group China Diversified 14 452 84 744 1 746 6 413 15 915h 93 323 20.4 14 59 23.7395 28 19 BHP Billiton Group Australia Mining & quarrying 14 225 21 510 17 673 24 943 25 980m 35 070 70.4 75 90 83.3396 45 58 Christian Dior SA France Textiles 14 177 35 242 10 513l 16 391 41 254 61 515 57.1 21 32 65.6397 69 70 Alcoa United States Metals and metal products 14 084 32 609 8 994 23 478 71 200 119 000 47.1 114 194 58.7698 59 51 Motorola Inc United States Telecommunications 13 900 30 889 17 729l 31 323 34 544m 68 000 50.8 65 93 69.8999 8 8 Nortel Networks Canada Telecommunications 13 854 16 984 9 260k 9 828 25 160 34 150 83.2 58 64 90.63
100 43 40 Lvmh Moët-Hennessy Louis Vuitton SA France Textiles and leather 13 685 27 919 10 160 15 674 37 118 56 509 59.8 313 426 73.47
Source: UNCTAD/Erasmus University database. a All data are based on the companies' annual reports unless otherwise stated. Data on affiliates is based on the Dun and Bradstreets 'Who owns Whom' database. b TNI, the Transnationlity Index, is calculated as the average of the following three ratios: foreign assets to total assets, foreign sales to total sales and foreign employment to total employment. c II, the"Internationalization Index", is calculated as the number of foreign affiliates divided the number of all affiliates (Note: Affiliates counted in this table refer to only majority-owned affiliates). d Industry classification for companies follows the United States Standard Industrial Classification as used by the United States Securities and Exchange Commission (SEC). e In a number of cases, companies reported only partial foreign assets. In these cases, the ratio of the partial foreign assets to the partial (total) assets was applied to total assets to calculate the total foreign assets. In all cases, the resulting figures were sent
for confirmation to the companies. f Foreign sales are based on the origin of the sales, unless otherwise stated.
g Data for outside North America.
h Foreign employment data are calculated by applying the share of foreign employment in total employment of the previous year to total employment of 2004. i Foreign data is calculated by applying the share of the foreign into the total component of 2002 to the total component of 2004.
j Data for outside Europe.
k Foreign sales are based on customer location.
l In a number of cases companies reported only partial region-specified sales. In these cases, the ratio of the partial foreign sales to the partial (total) sales was applied to total sales to calculate the total foreign sales. In all cases, the resulting figures were sent for confirmation to the companies. m Foreign employment data are calculated by applying the share of both foreign assets in total assets and foreign sales in total sales to total employment.
n Foreign assets data are calculated by applying the share of foreign assets in total assets of the previous year to total assets of 2004. o Foreign employment data are calculated by applying the average of the shares of foreign employment in total employment of all companies in the same industry (omitting the extremes) to total employment. p Data were obtained from the company in response to an UNCTAD survey.
q Data for outside Western Europe.
r Foreign sales data are calculated by applying the share of foreign sales in total sales of the previous year to total sales of 2004.
s Employment data is based on the data of 2003.
Note: The list covers non-financial TNCs only. In some companies, foreign investors may hold a minority share of more than 10 per cent.
UN
CT
AD
Current Studies on F
DI and D
evelopment
Annexes
45
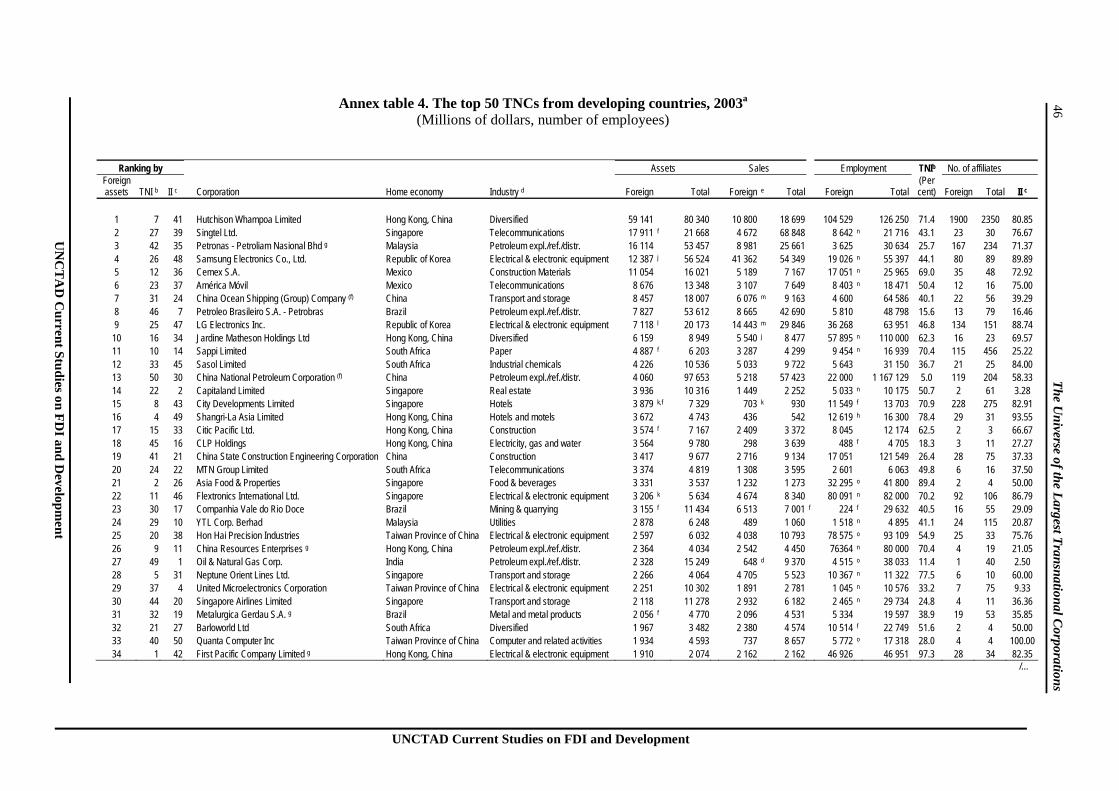
UNCTAD Current Studies on FDI and Development
Annex table 4. The top 50 TNCs from developing countries, 2003a
(Millions of dollars, number of employees)
Ranking by Assets Sales Employment TNIb No. of affiliates
Foreign assets TNI b II c Corporation Home economy Industry d Foreign Total
Foreign e Total Foreign Total
(Per cent) Foreign Total II c
1 7 41 Hutchison Whampoa Limited Hong Kong, China Diversified 59 141 80 340 10 800 18 699 104 529 126 250 71.4 1900 2350 80.85 2 27 39 Singtel Ltd. Singapore Telecommunications 17 911 f 21 668 4 672 68 848 8 642 n 21 716 43.1 23 30 76.67 3 42 35 Petronas - Petroliam Nasional Bhd g Malaysia Petroleum expl./ref./distr. 16 114 53 457 8 981 25 661 3 625 30 634 25.7 167 234 71.37 4 26 48 Samsung Electronics Co., Ltd. Republic of Korea Electrical & electronic equipment 12 387 j 56 524 41 362 54 349 19 026 n 55 397 44.1 80 89 89.89 5 12 36 Cemex S.A. Mexico Construction Materials 11 054 16 021 5 189 7 167 17 051 n 25 965 69.0 35 48 72.92 6 23 37 América Móvil Mexico Telecommunications 8 676 13 348 3 107 7 649 8 403 n 18 471 50.4 12 16 75.00 7 31 24 China Ocean Shipping (Group) Company (f) China Transport and storage 8 457 18 007 6 076 m 9 163 4 600 64 586 40.1 22 56 39.29 8 46 7 Petroleo Brasileiro S.A. - Petrobras Brazil Petroleum expl./ref./distr. 7 827 53 612 8 665 42 690 5 810 48 798 15.6 13 79 16.46 9 25 47 LG Electronics Inc. Republic of Korea Electrical & electronic equipment 7 118 l 20 173 14 443 m 29 846 36 268 63 951 46.8 134 151 88.74
10 16 34 Jardine Matheson Holdings Ltd Hong Kong, China Diversified 6 159 8 949 5 540 j 8 477 57 895 n 110 000 62.3 16 23 69.57 11 10 14 Sappi Limited South Africa Paper 4 887 f 6 203 3 287 4 299 9 454 n 16 939 70.4 115 456 25.22 12 33 45 Sasol Limited South Africa Industrial chemicals 4 226 10 536 5 033 9 722 5 643 31 150 36.7 21 25 84.00 13 50 30 China National Petroleum Corporation (f) China Petroleum expl./ref./distr. 4 060 97 653 5 218 57 423 22 000 1 167 129 5.0 119 204 58.33 14 22 2 Capitaland Limited Singapore Real estate 3 936 10 316 1 449 2 252 5 033 n 10 175 50.7 2 61 3.28 15 8 43 City Developments Limited Singapore Hotels 3 879 k,f 7 329 703 k 930 11 549 f 13 703 70.9 228 275 82.91 16 4 49 Shangri-La Asia Limited Hong Kong, China Hotels and motels 3 672 4 743 436 542 12 619 h 16 300 78.4 29 31 93.55 17 15 33 Citic Pacific Ltd. Hong Kong, China Construction 3 574 f 7 167 2 409 3 372 8 045 12 174 62.5 2 3 66.67 18 45 16 CLP Holdings Hong Kong, China Electricity, gas and water 3 564 9 780 298 3 639 488 f 4 705 18.3 3 11 27.27 19 41 21 China State Construction Engineering Corporation China Construction 3 417 9 677 2 716 9 134 17 051 121 549 26.4 28 75 37.33 20 24 22 MTN Group Limited South Africa Telecommunications 3 374 4 819 1 308 3 595 2 601 6 063 49.8 6 16 37.50 21 2 26 Asia Food & Properties Singapore Food & beverages 3 331 3 537 1 232 1 273 32 295 o 41 800 89.4 2 4 50.00 22 11 46 Flextronics International Ltd. Singapore Electrical & electronic equipment 3 206 k 5 634 4 674 8 340 80 091 n 82 000 70.2 92 106 86.79 23 30 17 Companhia Vale do Rio Doce Brazil Mining & quarrying 3 155 f 11 434 6 513 7 001 f 224 f 29 632 40.5 16 55 29.09 24 29 10 YTL Corp. Berhad Malaysia Utilities 2 878 6 248 489 1 060 1 518 n 4 895 41.1 24 115 20.87 25 20 38 Hon Hai Precision Industries Taiwan Province of China Electrical & electronic equipment 2 597 6 032 4 038 10 793 78 575 o 93 109 54.9 25 33 75.76 26 9 11 China Resources Enterprises g Hong Kong, China Petroleum expl./ref./distr. 2 364 4 034 2 542 4 450 76364 n 80 000 70.4 4 19 21.05 27 49 1 Oil & Natural Gas Corp. India Petroleum expl./ref./distr. 2 328 15 249 648 d 9 370 4 515 o 38 033 11.4 1 40 2.50 28 5 31 Neptune Orient Lines Ltd. Singapore Transport and storage 2 266 4 064 4 705 5 523 10 367 n 11 322 77.5 6 10 60.00 29 37 4 United Microelectronics Corporation Taiwan Province of China Electrical & electronic equipment 2 251 10 302 1 891 2 781 1 045 n 10 576 33.2 7 75 9.33 30 44 20 Singapore Airlines Limited Singapore Transport and storage 2 118 11 278 2 932 6 182 2 465 n 29 734 24.8 4 11 36.36 31 32 19 Metalurgica Gerdau S.A. g Brazil Metal and metal products 2 056 f 4 770 2 096 4 531 5 334 19 597 38.9 19 53 35.85 32 21 27 Barloworld Ltd South Africa Diversified 1 967 3 482 2 380 4 574 10 514 f 22 749 51.6 2 4 50.00 33 40 50 Quanta Computer Inc Taiwan Province of China Computer and related activities 1 934 4 593 737 8 657 5 772 o 17 318 28.0 4 4 100.00 34 1 42 First Pacific Company Limited g Hong Kong, China Electrical & electronic equipment 1 910 2 074 2 162 2 162 46 926 46 951 97.3 28 34 82.35
/…
UN
CT
AD
Current Studies on F
DI and D
evelopment
46
T
he Universe of the L
argest Transnational C
orporations
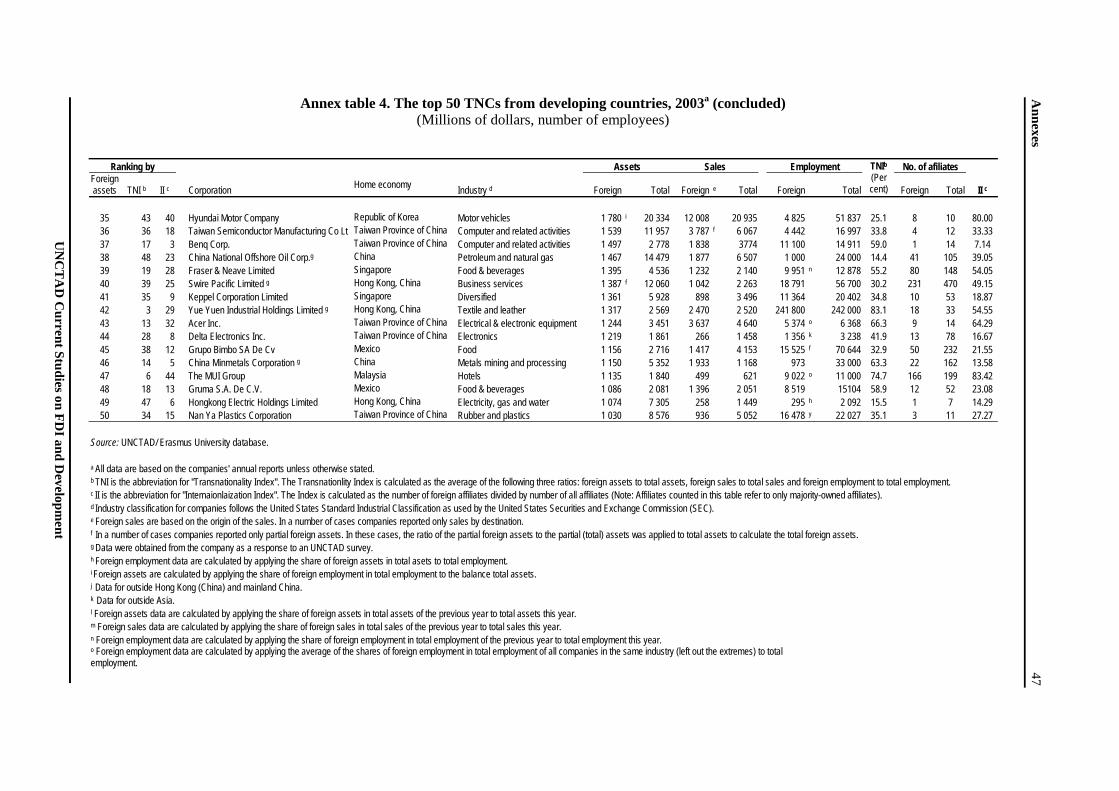
Annex table 4. The top 50 TNCs from developing countries, 2003a (concluded) (Millions of dollars, number of employees)
Ranking by Assets Sales Employment No. of afiliates Foreign assets TNI b II c Corporation Home economy Industry d Foreign Total Foreign e Total Foreign Total
TNIb (Per cent) Foreign Total II c
35 43 40 Hyundai Motor Company Republic of Korea Motor vehicles 1 780 i 20 334 12 008 20 935 4 825 51 837 25.1 8 10 80.00 36 36 18 Taiwan Semiconductor Manufacturing Co Lt Taiwan Province of China Computer and related activities 1 539 11 957 3 787 f 6 067 4 442 16 997 33.8 4 12 33.33 37 17 3 Benq Corp. Taiwan Province of China Computer and related activities 1 497 2 778 1 838 3774 11 100 14 911 59.0 1 14 7.14 38 48 23 China National Offshore Oil Corp.g China Petroleum and natural gas 1 467 14 479 1 877 6 507 1 000 24 000 14.4 41 105 39.05 39 19 28 Fraser & Neave Limited Singapore Food & beverages 1 395 4 536 1 232 2 140 9 951 n 12 878 55.2 80 148 54.05 40 39 25 Swire Pacific Limited g Hong Kong, China Business services 1 387 f 12 060 1 042 2 263 18 791 56 700 30.2 231 470 49.15 41 35 9 Keppel Corporation Limited Singapore Diversified 1 361 5 928 898 3 496 11 364 20 402 34.8 10 53 18.87 42 3 29 Yue Yuen Industrial Holdings Limited g Hong Kong, China Textile and leather 1 317 2 569 2 470 2 520 241 800 242 000 83.1 18 33 54.55 43 13 32 Acer Inc. Taiwan Province of China Electrical & electronic equipment 1 244 3 451 3 637 4 640 5 374 o 6 368 66.3 9 14 64.29 44 28 8 Delta Electronics Inc. Taiwan Province of China Electronics 1 219 1 861 266 1 458 1 356 k 3 238 41.9 13 78 16.67 45 38 12 Grupo Bimbo SA De Cv Mexico Food 1 156 2 716 1 417 4 153 15 525 f 70 644 32.9 50 232 21.55 46 14 5 China Minmetals Corporation g China Metals mining and processing 1 150 5 352 1 933 1 168 973 33 000 63.3 22 162 13.58 47 6 44 The MUI Group Malaysia Hotels 1 135 1 840 499 621 9 022 o 11 000 74.7 166 199 83.42 48 18 13 Gruma S.A. De C.V. Mexico Food & beverages 1 086 2 081 1 396 2 051 8 519 15104 58.9 12 52 23.08 49 47 6 Hongkong Electric Holdings Limited Hong Kong, China Electricity, gas and water 1 074 7 305 258 1 449 295 h 2 092 15.5 1 7 14.29 50 34 15 Nan Ya Plastics Corporation Taiwan Province of China Rubber and plastics 1 030 8 576 936 5 052 16 478 y 22 027 35.1 3 11 27.27
Source: UNCTAD/ Erasmus University database. a All data are based on the companies' annual reports unless otherwise stated. b TNI is the abbreviation for "Transnationality Index". The Transnationlity Index is calculated as the average of the following three ratios: foreign assets to total assets, foreign sales to total sales and foreign employment to total employment. c II is the abbreviation for "Internaionlaization Index". The Index is calculated as the number of foreign affiliates divided by number of all affiliates (Note: Affiliates counted in this table refer to only majority-owned affiliates). d Industry classification for companies follows the United States Standard Industrial Classification as used by the United States Securities and Exchange Commission (SEC). e Foreign sales are based on the origin of the sales. In a number of cases companies reported only sales by destination. f In a number of cases companies reported only partial foreign assets. In these cases, the ratio of the partial foreign assets to the partial (total) assets was applied to total assets to calculate the total foreign assets. g Data were obtained from the company as a response to an UNCTAD survey. h Foreign employment data are calculated by applying the share of foreign assets in total asets to total employment. i Foreign assets are calculated by applying the share of foreign employment in total employment to the balance total assets. j Data for outside Hong Kong (China) and mainland China. k Data for outside Asia. l Foreign assets data are calculated by applying the share of foreign assets in total assets of the previous year to total assets this year. m Foreign sales data are calculated by applying the share of foreign sales in total sales of the previous year to total sales this year. n Foreign employment data are calculated by applying the share of foreign employment in total employment of the previous year to total employment this year. o Foreign employment data are calculated by applying the average of the shares of foreign employment in total employment of all companies in the same industry (left out the extremes) to total employment.
UN
CT
AD
Current Studies on F
DI and D
evelopment
Annexes
47
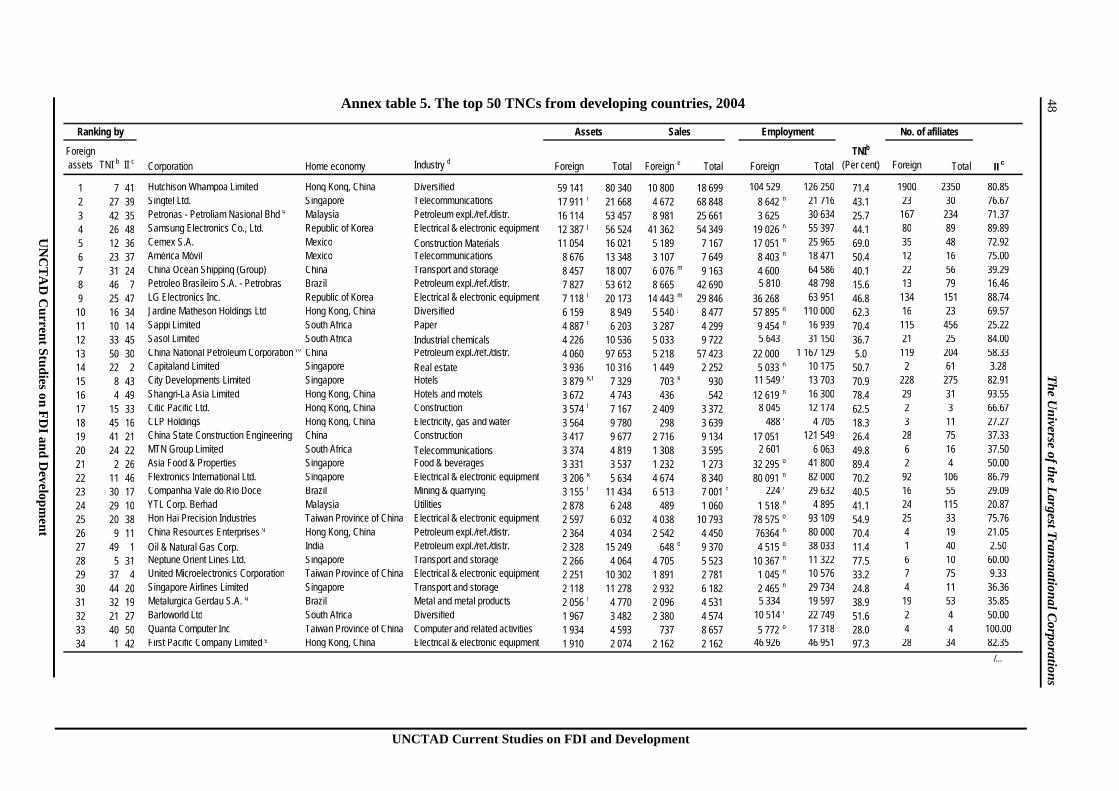
UNCTAD Current Studies on FDI and Development
Annex table 5. The top 50 TNCs from developing countries, 2004
Foreignassets TNI b II c Corporation Home economy Industry d Foreign Total Foreign e Total Foreign Total
TNIb
(Per cent) Foreign Total II c
1 7 41 Hutchison Whampoa Limited Hong Kong, China Diversified 59 141 80 340 10 800 18 699 104 529 126 250 71.4 1900 2350 80.852 27 39 Singtel Ltd. Singapore Telecommunications 17 911 f 21 668 4 672 68 848 8 642 n 21 716 43.1 23 30 76.673 42 35 Petronas - Petroliam Nasional Bhd g Malaysia Petroleum expl./ref./distr. 16 114 53 457 8 981 25 661 3 625 30 634 25.7 167 234 71.374 26 48 Samsung Electronics Co., Ltd. Republic of Korea Electrical & electronic equipment 12 387 j 56 524 41 362 54 349 19 026 n 55 397 44.1 80 89 89.895 12 36 Cemex S.A. Mexico Construction Materials 11 054 16 021 5 189 7 167 17 051 n 25 965 69.0 35 48 72.926 23 37 América Móvil Mexico Telecommunications 8 676 13 348 3 107 7 649 8 403 n 18 471 50.4 12 16 75.007 31 24 China Ocean Shipping (Group) China Transport and storage 8 457 18 007 6 076 m 9 163 4 600 64 586 40.1 22 56 39.298 46 7 Petroleo Brasileiro S.A. - Petrobras Brazil Petroleum expl./ref./distr. 7 827 53 612 8 665 42 690 5 810 48 798 15.6 13 79 16.469 25 47 LG Electronics Inc. Republic of Korea Electrical & electronic equipment 7 118 l 20 173 14 443 m 29 846 36 268 63 951 46.8 134 151 88.7410 16 34 Jardine Matheson Holdings Ltd Hong Kong, China Diversified 6 159 8 949 5 540 j 8 477 57 895 n 110 000 62.3 16 23 69.5711 10 14 Sappi Limited South Africa Paper 4 887 f 6 203 3 287 4 299 9 454 n 16 939 70.4 115 456 25.2212 33 45 Sasol Limited South Africa Industrial chemicals 4 226 10 536 5 033 9 722 5 643 31 150 36.7 21 25 84.0013 50 30 China National Petroleum Corporation (f) China Petroleum expl./ref./distr. 4 060 97 653 5 218 57 423 22 000 1 167 129 5.0 119 204 58.3314 22 2 Capitaland Limited Singapore Real estate 3 936 10 316 1 449 2 252 5 033 n 10 175 50.7 2 61 3.2815 8 43 City Developments Limited Singapore Hotels 3 879 k,f 7 329 703 k 930 11 549 f 13 703 70.9 228 275 82.9116 4 49 Shangri-La Asia Limited Hong Kong, China Hotels and motels 3 672 4 743 436 542 12 619 h 16 300 78.4 29 31 93.5517 15 33 Citic Pacific Ltd. Hong Kong, China Construction 3 574 f 7 167 2 409 3 372 8 045 12 174 62.5 2 3 66.6718 45 16 CLP Holdings Hong Kong, China Electricity, gas and water 3 564 9 780 298 3 639 488 f 4 705 18.3 3 11 27.2719 41 21 China State Construction Engineering China Construction 3 417 9 677 2 716 9 134 17 051 121 549 26.4 28 75 37.3320 24 22 MTN Group Limited South Africa Telecommunications 3 374 4 819 1 308 3 595 2 601 6 063 49.8 6 16 37.5021 2 26 Asia Food & Properties Singapore Food & beverages 3 331 3 537 1 232 1 273 32 295 o 41 800 89.4 2 4 50.0022 11 46 Flextronics International Ltd. Singapore Electrical & electronic equipment 3 206 k 5 634 4 674 8 340 80 091 n 82 000 70.2 92 106 86.7923 30 17 Companhia Vale do Rio Doce Brazil Mining & quarrying 3 155 f 11 434 6 513 7 001 f 224 f 29 632 40.5 16 55 29.0924 29 10 YTL Corp. Berhad Malaysia Utilities 2 878 6 248 489 1 060 1 518 n 4 895 41.1 24 115 20.8725 20 38 Hon Hai Precision Industries Taiwan Province of China Electrical & electronic equipment 2 597 6 032 4 038 10 793 78 575 o 93 109 54.9 25 33 75.7626 9 11 China Resources Enterprises g Hong Kong, China Petroleum expl./ref./distr. 2 364 4 034 2 542 4 450 76364 n 80 000 70.4 4 19 21.0527 49 1 Oil & Natural Gas Corp. India Petroleum expl./ref./distr. 2 328 15 249 648 d 9 370 4 515 o 38 033 11.4 1 40 2.5028 5 31 Neptune Orient Lines Ltd. Singapore Transport and storage 2 266 4 064 4 705 5 523 10 367 n 11 322 77.5 6 10 60.0029 37 4 United Microelectronics Corporation Taiwan Province of China Electrical & electronic equipment 2 251 10 302 1 891 2 781 1 045 n 10 576 33.2 7 75 9.3330 44 20 Singapore Airlines Limited Singapore Transport and storage 2 118 11 278 2 932 6 182 2 465 n 29 734 24.8 4 11 36.3631 32 19 Metalurgica Gerdau S.A. g Brazil Metal and metal products 2 056 f 4 770 2 096 4 531 5 334 19 597 38.9 19 53 35.8532 21 27 Barloworld Ltd South Africa Diversified 1 967 3 482 2 380 4 574 10 514 f 22 749 51.6 2 4 50.0033 40 50 Quanta Computer Inc Taiwan Province of China Computer and related activities 1 934 4 593 737 8 657 5 772 o 17 318 28.0 4 4 100.0034 1 42 First Pacific Company Limited g Hong Kong, China Electrical & electronic equipment 1 910 2 074 2 162 2 162 46 926 46 951 97.3 28 34 82.35
/…
Ranking by Assets Sales Employment No. of afiliates
UN
CT
AD
Current Studies on F
DI and D
evelopment
48
T
he Universe of the L
argest Transnational C
orporations
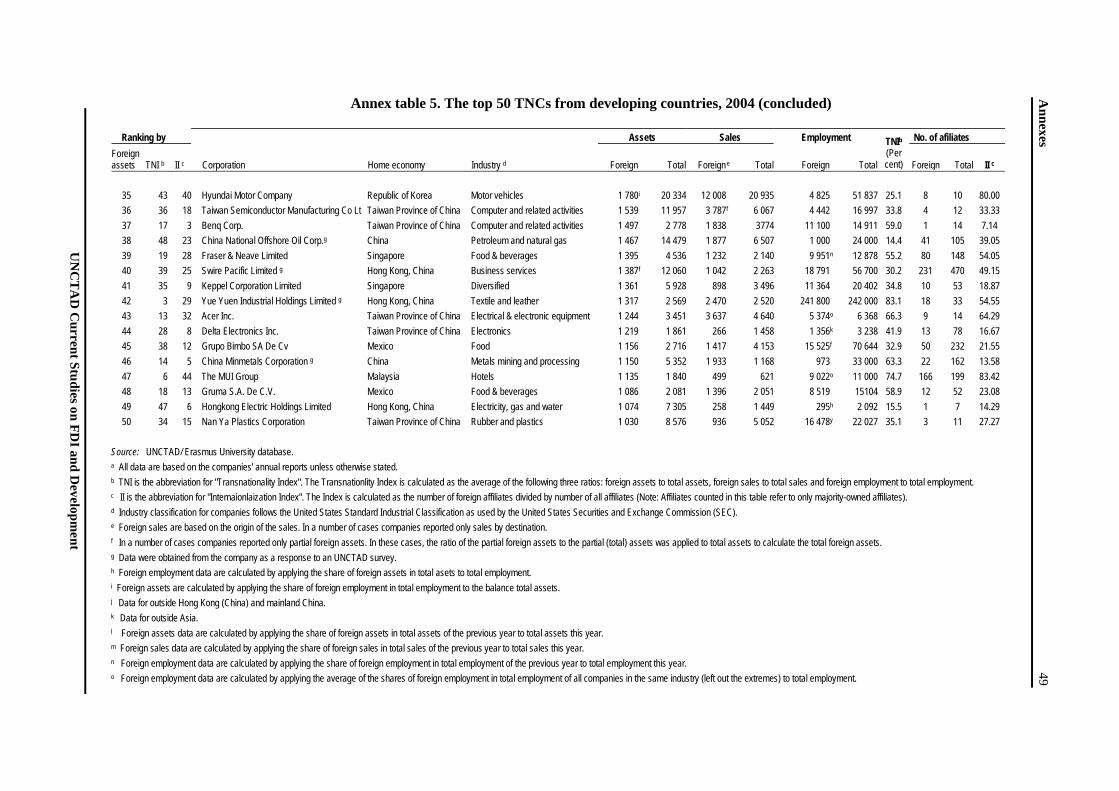
Annex table 5. The top 50 TNCs from developing countries, 2004 (concluded)
Ranking by Assets Sales Employment No. of afiliates
Foreign assets TNI b II c Corporation Home economy Industry d Foreign Total Foreign e Total Foreign Total
TNIb (Per cent) Foreign Total II c
35 43 40 Hyundai Motor Company Republic of Korea Motor vehicles 1 780i 20 334 12 008 20 935 4 825 51 837 25.1 8 10 80.00
36 36 18 Taiwan Semiconductor Manufacturing Co Lt Taiwan Province of China Computer and related activities 1 539 11 957 3 787f 6 067 4 442 16 997 33.8 4 12 33.33
37 17 3 Benq Corp. Taiwan Province of China Computer and related activities 1 497 2 778 1 838 3774 11 100 14 911 59.0 1 14 7.14
38 48 23 China National Offshore Oil Corp.g China Petroleum and natural gas 1 467 14 479 1 877 6 507 1 000 24 000 14.4 41 105 39.05
39 19 28 Fraser & Neave Limited Singapore Food & beverages 1 395 4 536 1 232 2 140 9 951n 12 878 55.2 80 148 54.05
40 39 25 Swire Pacific Limited g Hong Kong, China Business services 1 387f 12 060 1 042 2 263 18 791 56 700 30.2 231 470 49.15
41 35 9 Keppel Corporation Limited Singapore Diversified 1 361 5 928 898 3 496 11 364 20 402 34.8 10 53 18.87
42 3 29 Yue Yuen Industrial Holdings Limited g Hong Kong, China Textile and leather 1 317 2 569 2 470 2 520 241 800 242 000 83.1 18 33 54.55
43 13 32 Acer Inc. Taiwan Province of China Electrical & electronic equipment 1 244 3 451 3 637 4 640 5 374o 6 368 66.3 9 14 64.29
44 28 8 Delta Electronics Inc. Taiwan Province of China Electronics 1 219 1 861 266 1 458 1 356k 3 238 41.9 13 78 16.67
45 38 12 Grupo Bimbo SA De Cv Mexico Food 1 156 2 716 1 417 4 153 15 525f 70 644 32.9 50 232 21.55
46 14 5 China Minmetals Corporation g China Metals mining and processing 1 150 5 352 1 933 1 168 973 33 000 63.3 22 162 13.58
47 6 44 The MUI Group Malaysia Hotels 1 135 1 840 499 621 9 022o 11 000 74.7 166 199 83.42
48 18 13 Gruma S.A. De C.V. Mexico Food & beverages 1 086 2 081 1 396 2 051 8 519 15104 58.9 12 52 23.08
49 47 6 Hongkong Electric Holdings Limited Hong Kong, China Electricity, gas and water 1 074 7 305 258 1 449 295h 2 092 15.5 1 7 14.29
50 34 15 Nan Ya Plastics Corporation Taiwan Province of China Rubber and plastics 1 030 8 576 936 5 052 16 478y 22 027 35.1 3 11 27.27
Source: UNCTAD/ Erasmus University database. a All data are based on the companies' annual reports unless otherwise stated. b TNI is the abbreviation for "Transnationality Index". The Transnationlity Index is calculated as the average of the following three ratios: foreign assets to total assets, foreign sales to total sales and foreign employment to total employment. c II is the abbreviation for "Internaionlaization Index". The Index is calculated as the number of foreign affiliates divided by number of all affiliates (Note: Affiliates counted in this table refer to only majority-owned affiliates). d Industry classification for companies follows the United States Standard Industrial Classification as used by the United States Securities and Exchange Commission (SEC). e Foreign sales are based on the origin of the sales. In a number of cases companies reported only sales by destination. f In a number of cases companies reported only partial foreign assets. In these cases, the ratio of the partial foreign assets to the partial (total) assets was applied to total assets to calculate the total foreign assets. g Data were obtained from the company as a response to an UNCTAD survey. h Foreign employment data are calculated by applying the share of foreign assets in total asets to total employment. i Foreign assets are calculated by applying the share of foreign employment in total employment to the balance total assets. j Data for outside Hong Kong (China) and mainland China. k Data for outside Asia. l Foreign assets data are calculated by applying the share of foreign assets in total assets of the previous year to total assets this year. m Foreign sales data are calculated by applying the share of foreign sales in total sales of the previous year to total sales this year. n Foreign employment data are calculated by applying the share of foreign employment in total employment of the previous year to total employment this year. o Foreign employment data are calculated by applying the average of the shares of foreign employment in total employment of all companies in the same industry (left out the extremes) to total employment.
Annexes
49
UN
CT
AD
Current Studies on F
DI and D
evelopment
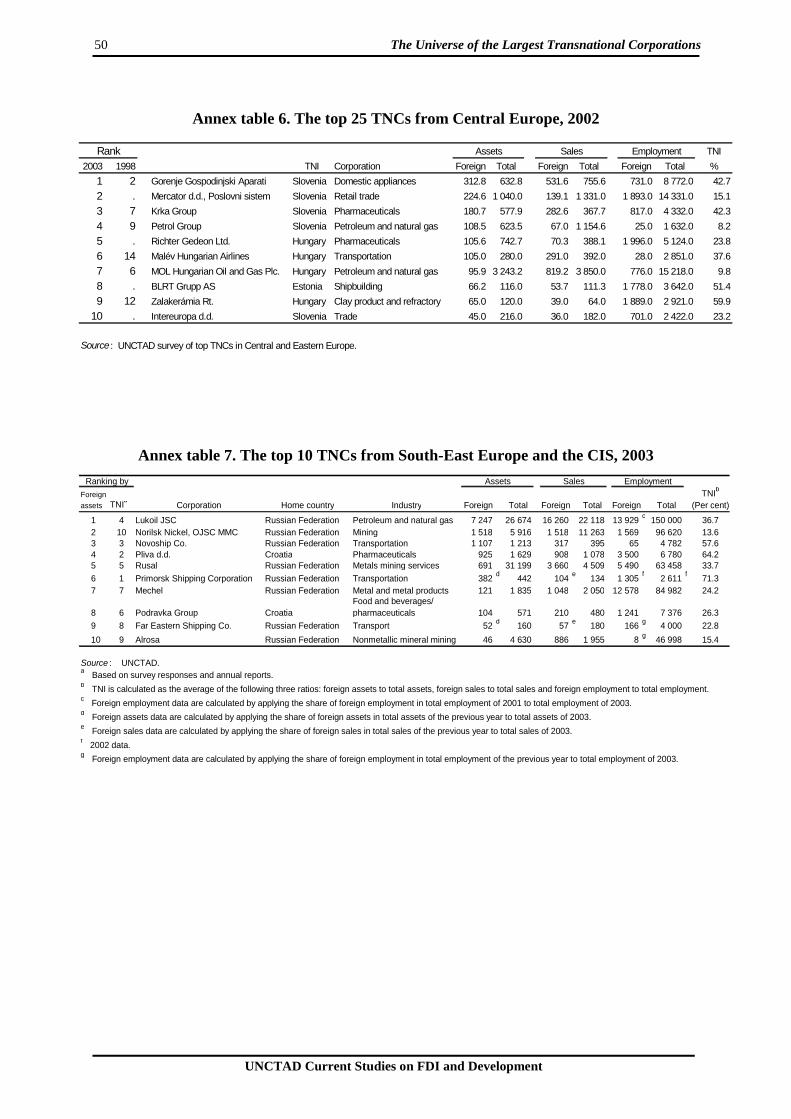
50 The Universe of the Largest Transnational Corporations
UNCTAD Current Studies on FDI and Development
Annex table 6. The top 25 TNCs from Central Europe, 2002
TNI
2003 1998 TNI Corporation Foreign Total Foreign Total Foreign Total %
1 2 Gorenje Gospodinjski Aparati Slovenia Domestic appliances 312.8 632.8 531.6 755.6 731.0 8 772.0 42.7
2 . Mercator d.d., Poslovni sistem Slovenia Retail trade 224.6 1 040.0 139.1 1 331.0 1 893.0 14 331.0 15.1
3 7 Krka Group Slovenia Pharmaceuticals 180.7 577.9 282.6 367.7 817.0 4 332.0 42.3
4 9 Petrol Group Slovenia Petroleum and natural gas 108.5 623.5 67.0 1 154.6 25.0 1 632.0 8.2
5 . Richter Gedeon Ltd. Hungary Pharmaceuticals 105.6 742.7 70.3 388.1 1 996.0 5 124.0 23.8
6 14 Malév Hungarian Airlines Hungary Transportation 105.0 280.0 291.0 392.0 28.0 2 851.0 37.6
7 6 MOL Hungarian Oil and Gas Plc. Hungary Petroleum and natural gas 95.9 3 243.2 819.2 3 850.0 776.0 15 218.0 9.8
8 . BLRT Grupp AS Estonia Shipbuilding 66.2 116.0 53.7 111.3 1 778.0 3 642.0 51.4
9 12 Zalakerámia Rt. Hungary Clay product and refractory 65.0 120.0 39.0 64.0 1 889.0 2 921.0 59.9
10 . Intereuropa d.d. Slovenia Trade 45.0 216.0 36.0 182.0 701.0 2 422.0 23.2
Source : UNCTAD survey of top TNCs in Central and Eastern Europe.
Assets Sales EmploymentRank
Annex table 7. The top 10 TNCs from South-East Europe and the CIS, 2003
Foreign TNIb
assets TNIa
Corporation Home country Industry Foreign Total Foreign Total Foreign Total (Per cent)
1 4 Lukoil JSC Russian Federation Petroleum and natural gas 7 247 26 674 16 260 22 118 13 929 c 150 000 36.72 10 Norilsk Nickel, OJSC MMC Russian Federation Mining 1 518 5 916 1 518 11 263 1 569 96 620 13.63 3 Novoship Co. Russian Federation Transportation 1 107 1 213 317 395 65 4 782 57.64 2 Pliva d.d. Croatia Pharmaceuticals 925 1 629 908 1 078 3 500 6 780 64.25 5 Rusal Russian Federation Metals mining services 691 31 199 3 660 4 509 5 490 63 458 33.7
6 1 Primorsk Shipping Corporation Russian Federation Transportation 382d
442 104e
134 1 305f
2 611f
71.37 7 Mechel Russian Federation Metal and metal products 121 1 835 1 048 2 050 12 578 84 982 24.2
8 6 Podravka Group CroatiaFood and beverages/ pharmaceuticals 104 571 210 480 1 241 7 376 26.3
9 8 Far Eastern Shipping Co. Russian Federation Transport 52 d 160 57 e 180 166 g 4 000 22.8
10 9 Alrosa Russian Federation Nonmetallic mineral mining 46 4 630 886 1 955 8 g 46 998 15.4
Source : UNCTAD.a Based on survey responses and annual reports.b TNI is calculated as the average of the following three ratios: foreign assets to total assets, foreign sales to total sales and foreign employment to total employment. c Foreign employment data are calculated by applying the share of foreign employment in total employment of 2001 to total employment of 2003.d Foreign assets data are calculated by applying the share of foreign assets in total assets of the previous year to total assets of 2003.e Foreign sales data are calculated by applying the share of foreign sales in total sales of the previous year to total sales of 2003. f 2002 data.g Foreign employment data are calculated by applying the share of foreign employment in total employment of the previous year to total employment of 2003.
Assets Sales EmploymentRanking by
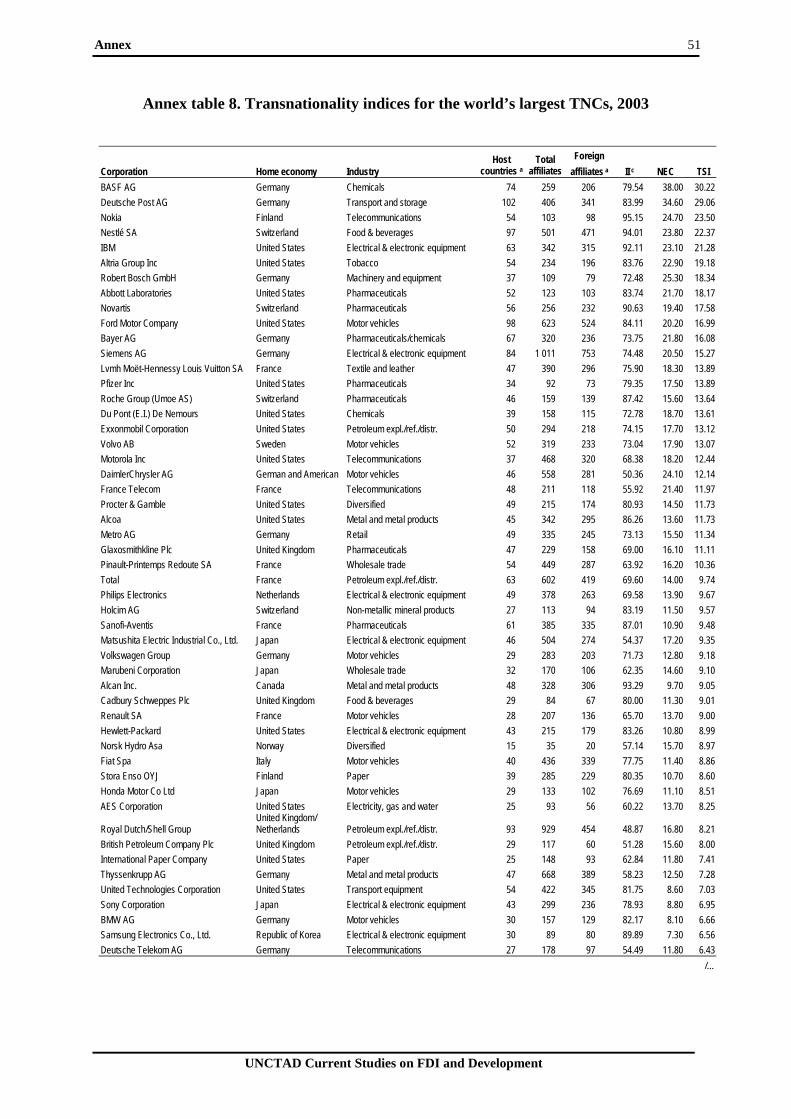
Annex 51
UNCTAD Current Studies on FDI and Development
Annex table 8. Transnationality indices for the world’s largest TNCs, 2003
Foreign
Corporation Home economy Industry Host
countries a Total
affiliates affiliates a II c NEC TSI
BASF AG Germany Chemicals 74 259 206 79.54 38.00 30.22
Deutsche Post AG Germany Transport and storage 102 406 341 83.99 34.60 29.06
Nokia Finland Telecommunications 54 103 98 95.15 24.70 23.50
Nestlé SA Switzerland Food & beverages 97 501 471 94.01 23.80 22.37
IBM United States Electrical & electronic equipment 63 342 315 92.11 23.10 21.28
Altria Group Inc United States Tobacco 54 234 196 83.76 22.90 19.18
Robert Bosch GmbH Germany Machinery and equipment 37 109 79 72.48 25.30 18.34
Abbott Laboratories United States Pharmaceuticals 52 123 103 83.74 21.70 18.17
Novartis Switzerland Pharmaceuticals 56 256 232 90.63 19.40 17.58
Ford Motor Company United States Motor vehicles 98 623 524 84.11 20.20 16.99
Bayer AG Germany Pharmaceuticals/chemicals 67 320 236 73.75 21.80 16.08
Siemens AG Germany Electrical & electronic equipment 84 1 011 753 74.48 20.50 15.27
Lvmh Moët-Hennessy Louis Vuitton SA France Textile and leather 47 390 296 75.90 18.30 13.89
Pfizer Inc United States Pharmaceuticals 34 92 73 79.35 17.50 13.89
Roche Group (Umoe AS) Switzerland Pharmaceuticals 46 159 139 87.42 15.60 13.64
Du Pont (E.I.) De Nemours United States Chemicals 39 158 115 72.78 18.70 13.61
Exxonmobil Corporation United States Petroleum expl./ref./distr. 50 294 218 74.15 17.70 13.12
Volvo AB Sweden Motor vehicles 52 319 233 73.04 17.90 13.07
Motorola Inc United States Telecommunications 37 468 320 68.38 18.20 12.44
DaimlerChrysler AG German and American Motor vehicles 46 558 281 50.36 24.10 12.14
France Telecom France Telecommunications 48 211 118 55.92 21.40 11.97
Procter & Gamble United States Diversified 49 215 174 80.93 14.50 11.73
Alcoa United States Metal and metal products 45 342 295 86.26 13.60 11.73
Metro AG Germany Retail 49 335 245 73.13 15.50 11.34
Glaxosmithkline Plc United Kingdom Pharmaceuticals 47 229 158 69.00 16.10 11.11
Pinault-Printemps Redoute SA France Wholesale trade 54 449 287 63.92 16.20 10.36
Total France Petroleum expl./ref./distr. 63 602 419 69.60 14.00 9.74
Philips Electronics Netherlands Electrical & electronic equipment 49 378 263 69.58 13.90 9.67
Holcim AG Switzerland Non-metallic mineral products 27 113 94 83.19 11.50 9.57
Sanofi-Aventis France Pharmaceuticals 61 385 335 87.01 10.90 9.48
Matsushita Electric Industrial Co., Ltd. Japan Electrical & electronic equipment 46 504 274 54.37 17.20 9.35
Volkswagen Group Germany Motor vehicles 29 283 203 71.73 12.80 9.18
Marubeni Corporation Japan Wholesale trade 32 170 106 62.35 14.60 9.10
Alcan Inc. Canada Metal and metal products 48 328 306 93.29 9.70 9.05
Cadbury Schweppes Plc United Kingdom Food & beverages 29 84 67 80.00 11.30 9.01
Renault SA France Motor vehicles 28 207 136 65.70 13.70 9.00
Hewlett-Packard United States Electrical & electronic equipment 43 215 179 83.26 10.80 8.99
Norsk Hydro Asa Norway Diversified 15 35 20 57.14 15.70 8.97
Fiat Spa Italy Motor vehicles 40 436 339 77.75 11.40 8.86
Stora Enso OYJ Finland Paper 39 285 229 80.35 10.70 8.60
Honda Motor Co Ltd Japan Motor vehicles 29 133 102 76.69 11.10 8.51
AES Corporation United States Electricity, gas and water 25 93 56 60.22 13.70 8.25
Royal Dutch/Shell Group United Kingdom/ Netherlands Petroleum expl./ref./distr. 93 929 454 48.87 16.80 8.21
British Petroleum Company Plc United Kingdom Petroleum expl./ref./distr. 29 117 60 51.28 15.60 8.00
International Paper Company United States Paper 25 148 93 62.84 11.80 7.41
Thyssenkrupp AG Germany Metal and metal products 47 668 389 58.23 12.50 7.28
United Technologies Corporation United States Transport equipment 54 422 345 81.75 8.60 7.03
Sony Corporation Japan Electrical & electronic equipment 43 299 236 78.93 8.80 6.95
BMW AG Germany Motor vehicles 30 157 129 82.17 8.10 6.66
Samsung Electronics Co., Ltd. Republic of Korea Electrical & electronic equipment 30 89 80 89.89 7.30 6.56
Deutsche Telekom AG Germany Telecommunications 27 178 97 54.49 11.80 6.43
/…
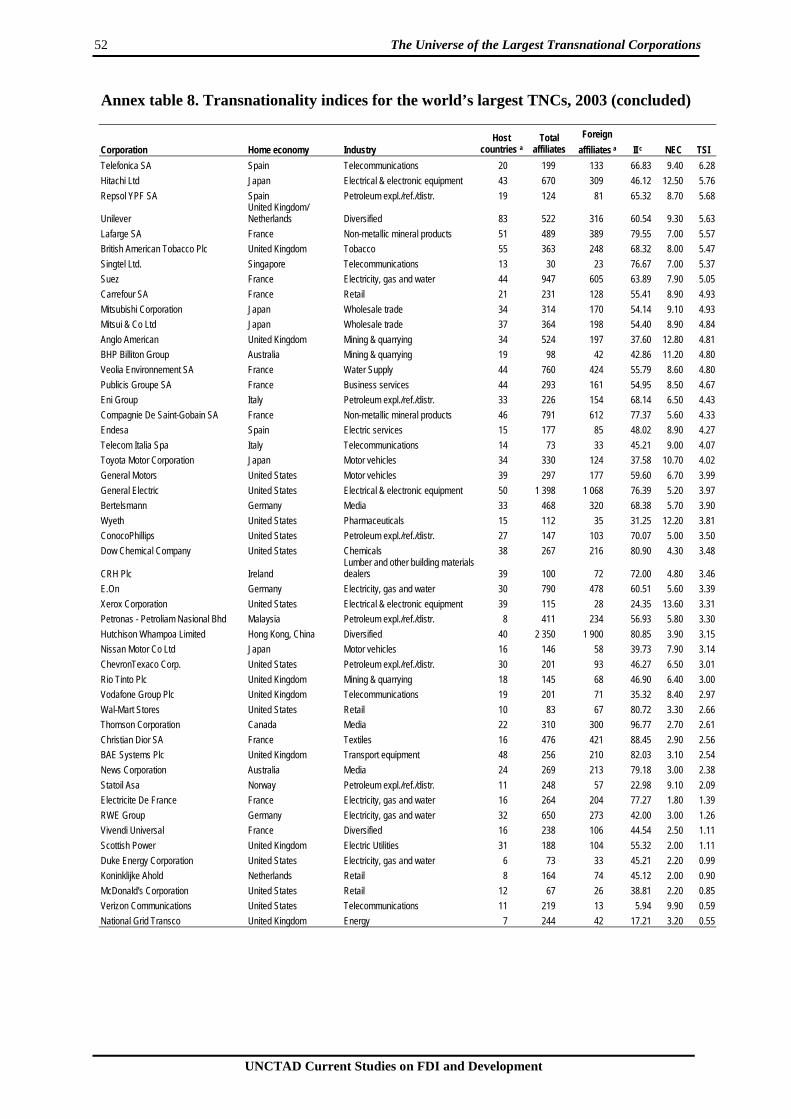
52 The Universe of the Largest Transnational Corporations
UNCTAD Current Studies on FDI and Development
Annex table 8. Transnationality indices for the world’s largest TNCs, 2003 (concluded)
Foreign
Corporation Home economy Industry Host
countries a Total
affiliates affiliates a II c NEC TSI
Telefonica SA Spain Telecommunications 20 199 133 66.83 9.40 6.28
Hitachi Ltd Japan Electrical & electronic equipment 43 670 309 46.12 12.50 5.76
Repsol YPF SA Spain Petroleum expl./ref./distr. 19 124 81 65.32 8.70 5.68
Unilever United Kingdom/ Netherlands Diversified 83 522 316 60.54 9.30 5.63
Lafarge SA France Non-metallic mineral products 51 489 389 79.55 7.00 5.57
British American Tobacco Plc United Kingdom Tobacco 55 363 248 68.32 8.00 5.47
Singtel Ltd. Singapore Telecommunications 13 30 23 76.67 7.00 5.37
Suez France Electricity, gas and water 44 947 605 63.89 7.90 5.05
Carrefour SA France Retail 21 231 128 55.41 8.90 4.93
Mitsubishi Corporation Japan Wholesale trade 34 314 170 54.14 9.10 4.93
Mitsui & Co Ltd Japan Wholesale trade 37 364 198 54.40 8.90 4.84
Anglo American United Kingdom Mining & quarrying 34 524 197 37.60 12.80 4.81
BHP Billiton Group Australia Mining & quarrying 19 98 42 42.86 11.20 4.80
Veolia Environnement SA France Water Supply 44 760 424 55.79 8.60 4.80
Publicis Groupe SA France Business services 44 293 161 54.95 8.50 4.67
Eni Group Italy Petroleum expl./ref./distr. 33 226 154 68.14 6.50 4.43
Compagnie De Saint-Gobain SA France Non-metallic mineral products 46 791 612 77.37 5.60 4.33
Endesa Spain Electric services 15 177 85 48.02 8.90 4.27
Telecom Italia Spa Italy Telecommunications 14 73 33 45.21 9.00 4.07
Toyota Motor Corporation Japan Motor vehicles 34 330 124 37.58 10.70 4.02
General Motors United States Motor vehicles 39 297 177 59.60 6.70 3.99
General Electric United States Electrical & electronic equipment 50 1 398 1 068 76.39 5.20 3.97
Bertelsmann Germany Media 33 468 320 68.38 5.70 3.90
Wyeth United States Pharmaceuticals 15 112 35 31.25 12.20 3.81
ConocoPhillips United States Petroleum expl./ref./distr. 27 147 103 70.07 5.00 3.50
Dow Chemical Company United States Chemicals 38 267 216 80.90 4.30 3.48
CRH Plc Ireland Lumber and other building materials dealers 39 100 72 72.00 4.80 3.46
E.On Germany Electricity, gas and water 30 790 478 60.51 5.60 3.39
Xerox Corporation United States Electrical & electronic equipment 39 115 28 24.35 13.60 3.31
Petronas - Petroliam Nasional Bhd Malaysia Petroleum expl./ref./distr. 8 411 234 56.93 5.80 3.30
Hutchison Whampoa Limited Hong Kong, China Diversified 40 2 350 1 900 80.85 3.90 3.15
Nissan Motor Co Ltd Japan Motor vehicles 16 146 58 39.73 7.90 3.14
ChevronTexaco Corp. United States Petroleum expl./ref./distr. 30 201 93 46.27 6.50 3.01
Rio Tinto Plc United Kingdom Mining & quarrying 18 145 68 46.90 6.40 3.00
Vodafone Group Plc United Kingdom Telecommunications 19 201 71 35.32 8.40 2.97
Wal-Mart Stores United States Retail 10 83 67 80.72 3.30 2.66
Thomson Corporation Canada Media 22 310 300 96.77 2.70 2.61
Christian Dior SA France Textiles 16 476 421 88.45 2.90 2.56
BAE Systems Plc United Kingdom Transport equipment 48 256 210 82.03 3.10 2.54
News Corporation Australia Media 24 269 213 79.18 3.00 2.38
Statoil Asa Norway Petroleum expl./ref./distr. 11 248 57 22.98 9.10 2.09
Electricite De France France Electricity, gas and water 16 264 204 77.27 1.80 1.39
RWE Group Germany Electricity, gas and water 32 650 273 42.00 3.00 1.26
Vivendi Universal France Diversified 16 238 106 44.54 2.50 1.11
Scottish Power United Kingdom Electric Utilities 31 188 104 55.32 2.00 1.11
Duke Energy Corporation United States Electricity, gas and water 6 73 33 45.21 2.20 0.99
Koninklijke Ahold Netherlands Retail 8 164 74 45.12 2.00 0.90
McDonald's Corporation United States Retail 12 67 26 38.81 2.20 0.85
Verizon Communications United States Telecommunications 11 219 13 5.94 9.90 0.59
National Grid Transco United Kingdom Energy 7 244 42 17.21 3.20 0.55
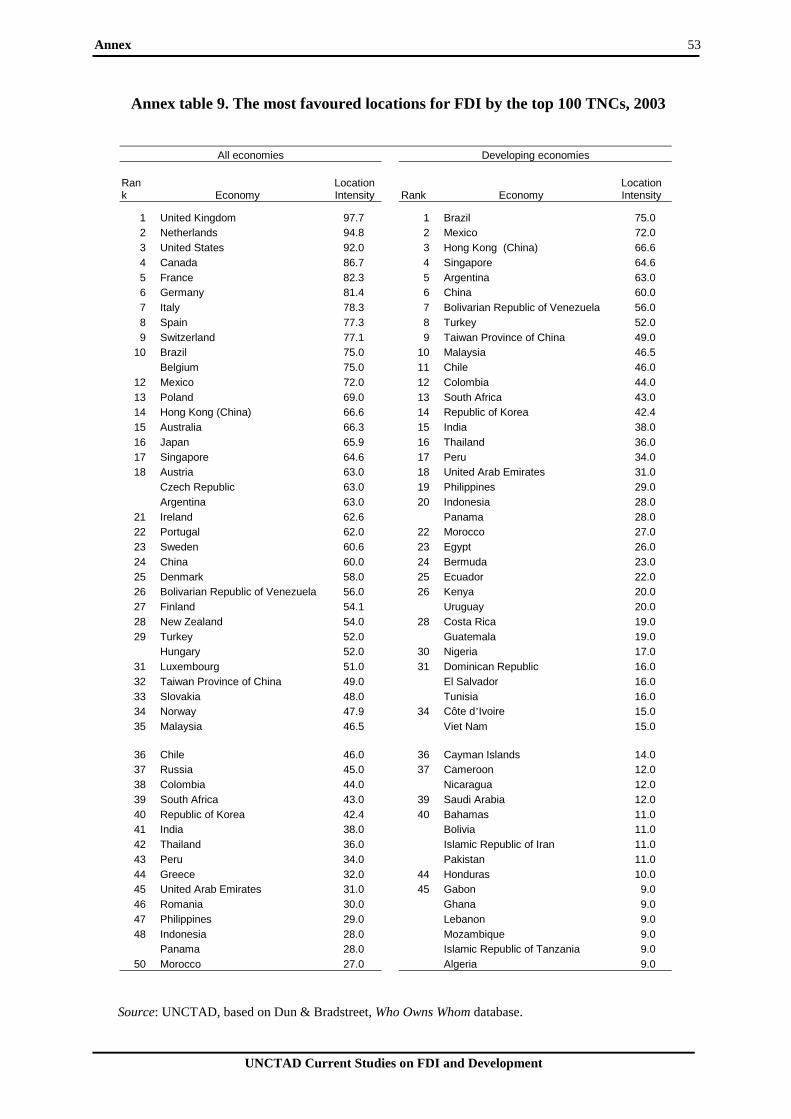
Annex 53
UNCTAD Current Studies on FDI and Development
Annex table 9. The most favoured locations for FDI by the top 100 TNCs, 2003
All economies Developing economies Rank Economy
Location Intensity Rank Economy
Location Intensity
1 United Kingdom 97.7 1 Brazil 75.0 2 Netherlands 94.8 2 Mexico 72.0 3 United States 92.0 3 Hong Kong (China) 66.6 4 Canada 86.7 4 Singapore 64.6 5 France 82.3 5 Argentina 63.0 6 Germany 81.4 6 China 60.0 7 Italy 78.3 7 Bolivarian Republic of Venezuela 56.0 8 Spain 77.3 8 Turkey 52.0 9 Switzerland 77.1 9 Taiwan Province of China 49.0
10 Brazil 75.0 10 Malaysia 46.5 Belgium 75.0 11 Chile 46.0
12 Mexico 72.0 12 Colombia 44.0 13 Poland 69.0 13 South Africa 43.0 14 Hong Kong (China) 66.6 14 Republic of Korea 42.4 15 Australia 66.3 15 India 38.0 16 Japan 65.9 16 Thailand 36.0 17 Singapore 64.6 17 Peru 34.0 18 Austria 63.0 18 United Arab Emirates 31.0
Czech Republic 63.0 19 Philippines 29.0 Argentina 63.0 20 Indonesia 28.0
21 Ireland 62.6 Panama 28.0 22 Portugal 62.0 22 Morocco 27.0 23 Sweden 60.6 23 Egypt 26.0 24 China 60.0 24 Bermuda 23.0 25 Denmark 58.0 25 Ecuador 22.0 26 Bolivarian Republic of Venezuela 56.0 26 Kenya 20.0 27 Finland 54.1 Uruguay 20.0 28 New Zealand 54.0 28 Costa Rica 19.0 29 Turkey 52.0 Guatemala 19.0
Hungary 52.0 30 Nigeria 17.0 31 Luxembourg 51.0 31 Dominican Republic 16.0 32 Taiwan Province of China 49.0 El Salvador 16.0 33 Slovakia 48.0 Tunisia 16.0 34 Norway 47.9 34 Côte d’Ivoire 15.0 35 Malaysia 46.5 Viet Nam 15.0
36 Chile 46.0 36 Cayman Islands 14.0 37 Russia 45.0 37 Cameroon 12.0 38 Colombia 44.0 Nicaragua 12.0 39 South Africa 43.0 39 Saudi Arabia 12.0 40 Republic of Korea 42.4 40 Bahamas 11.0 41 India 38.0 Bolivia 11.0 42 Thailand 36.0 Islamic Republic of Iran 11.0 43 Peru 34.0 Pakistan 11.0 44 Greece 32.0 44 Honduras 10.0 45 United Arab Emirates 31.0 45 Gabon 9.0 46 Romania 30.0 Ghana 9.0 47 Philippines 29.0 Lebanon 9.0 48 Indonesia 28.0 Mozambique 9.0
Panama 28.0 Islamic Republic of Tanzania 9.0 50 Morocco 27.0 Algeria 9.0
Source: UNCTAD, based on Dun & Bradstreet, Who Owns Whom database.
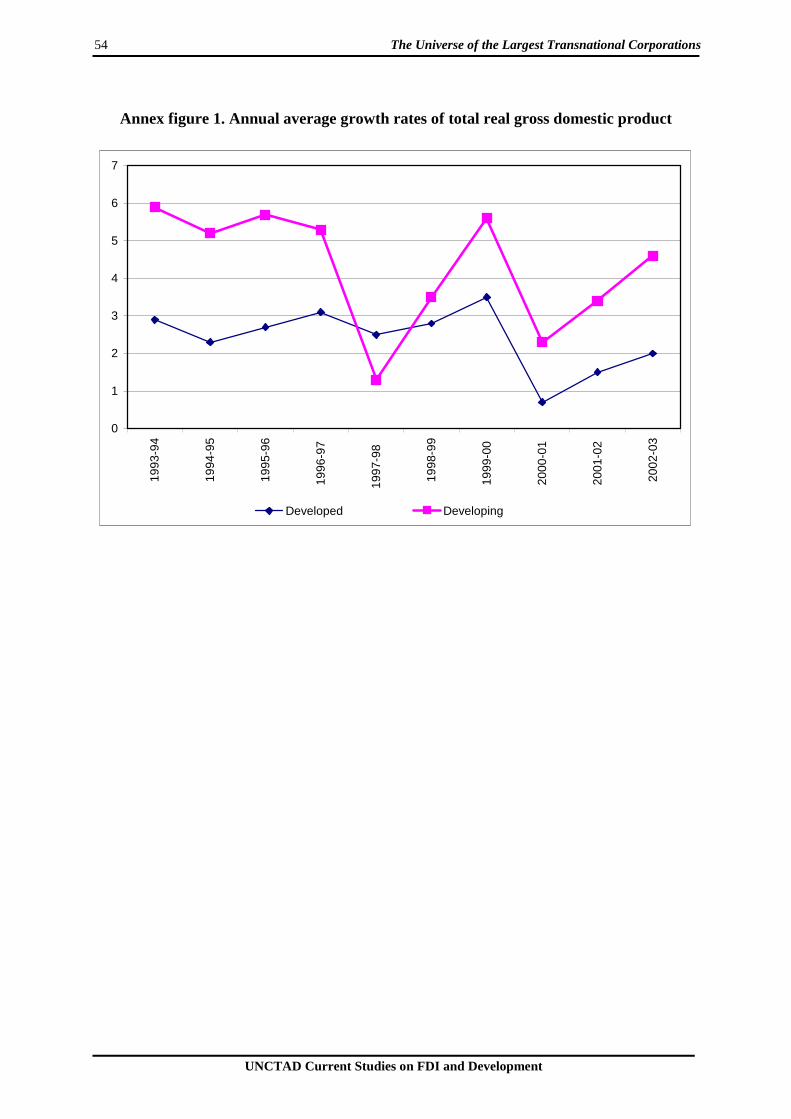
54 The Universe of the Largest Transnational Corporations
UNCTAD Current Studies on FDI and Development
Annex figure 1. Annual average growth rates of total real gross domestic product
0
1
2
3
4
5
6
719
93-9
4
1994
-95
1995
-96
1996
-97
1997
-98
1998
-99
1999
-00
2000
-01
2001
-02
2002
-03
Developed Developing
Selected Recent UNCTAD Publications on TNCs and FDI
(For more information, please visit www.unctad.org/en/pub)
A. Serial publications
World Investment Reports
(For more information visit www.unctad.org/wir) World Investment Report 2006. FDI from Developing and Transition Economies: Implications for Development. Sales No. E.06.II.D.11. $80. http://www.unctad.org/en/docs//wir2006_en.pdf. World Investment Report 2006. FDI from Developing and Transition Economies: Implications for Development. An Overview. 50 p. http://www.unctad. org/en/docs/wir2006overview_en.pdf. World Investment Report 2005. Transnational Corporations and the Internationalization of R&D. Sales No. E.05.II.D.10. $75. http://www.unctad.org/en/docs//wir2005_en.pdf. World Investment Report 2005. Transnational Corporations and the Internationalization of R&D. An Overview. 50 p. http://www.unctad.org/en/docs/wir2005overview_en.pdf. World Investment Report 2004. The Shift Towards Services. Sales No. E.04.II.D.36. $75. http://www.unctad.org/en/docs//wir2004_en.pdf. World Investment Report 2004. The Shift Towards Services. An Overview. 62 p. http://www.unctad.org/en/docs/wir2004overview_en.pdf. World Investment Report 2003. FDI Policies for Development: National and International Perspectives. Sales No. E.03.II.D.8. $49. http://www.unctad.org/en/docs//wir2003_en.pdf. World Investment Report 2003. FDI Polices for Development: National and International Perspectives. An Overview. 66 p. http://www.unctad.org/en/docs/wir2003overview_en.pdf. World Investment Report 2002: Transnational Corporations and Export Competitiveness. 352 p. Sales No. E.02.II.D.4. $49. http://www.unctad.org/en/docs//wir2002_en.pdf. World Investment Report 2002: Transnational Corporations and Export Competitiveness. An Overview. 66 p. http://www.unctad.org/en/docs/wir2002overview_en.pdf.
World Investment Report 2001: Promoting Linkages. 356 p. Sales No. E.01.II.D.12 $49. http://www.unctad.org/wir/contents/wir01content.en.htm. World Investment Report 2001: Promoting Linkages. An Overview. 67 p. http://www.unctad.org/wir/contents/wir01content.en.htm. Ten Years of World Investment Reports: The Challenges Ahead. Proceedings of an UNCTAD special event on future challenges in the area of FDI. UNCTAD/ITE/Misc.45. http://www.unctad.org/wir. World Investment Report 2000: Cross-border Mergers and Acquisitions and Development. 368 p. Sales No. E.99.II.D.20. $49. http://www.unctad.org/wir/contents/wir00content.en.htm. World Investment Report 2000: Cross-border Mergers and Acquisitions and Development. An Overview. 75 p. http://www.unctad.org/wir/contents/wir00content.en.htm.
World Investment Directories (For more information visit
http://r0.unctad.org/en/subsites/dite/fdistats_files/WID2.htm)
World Investment Directory 2004: Latin America and the Caribbean. Volume IX. 599 p. Sales No. E.03.II.D.12. $25. World Investment Directory 2003: Central and Eastern Europe. Vol. VIII. 397 p. Sales No. E.03.II.D.24. $80.
Investment Policy Reviews (For more information visit
http://www.unctad.org/Templates/Startpage.asp?intItemID=2554)
Investment Policy Review – Algeria. 110 p. UNCTAD/ITE/IPC/2003/9. Investment Policy Review – Kenya. 126 p. Sales No. E.05.II.D.21. $25.
Investment Policy Review – Benin. 147 p. Sales No. F.04.II.D.43. $25. Investment Policy Review – Sri Lanka. 89 p. UNCTAD/ITE/IPC/2003/8.
Investment Policy Review – Nepal. 89 p. Sales No. E.03.II.D.17. $20. Investment Policy Review – Lesotho. 105 p. Sales No. E.03.II.D.18. $15/18.
56 The Universe of the Largest Transnational Corporations
UNCTAD Current Studies on FDI and Development
Investment Policy Review – Ghana. 103 p. Sales No. E.02.II.D.20. $20. Investment Policy Review – Tanzania. 109 p. Sales No. E.02.II.D.6 $20. Investment Policy Review – Botswana. 107 p. Sales No. E.01.II.D.I. $22. Investment Policy Review – Ecuador. 136 p. Sales No. E.01.II D.31. $25. Investment and Innovation Policy Review – Ethiopia. 130 p. UNCTAD/ITE/IPC/Misc.4. Investment Policy Review – Mauritius. 92 p. Sales No. E.01.II.D.11. $22. Investment Policy Review – Peru. 109 p. Sales No. E.00.II.D.7. $22. Investment Policy Review – Egypt. 119 p. Sales No. E.99.II.D.20. $19. Investment Policy Review – Uganda. 71 p. Sales No. E.99.II.D.24. $15. Investment Policy Review – Uzbekistan.. 65 p. UNCTAD/ITE/IIP/Misc. 13.
International Investment Instruments (Fore more information visit http://www.unctad.org/iia)
International Investment Instruments: A Compendium. Vol. XIV. Sales No. E.05.II.D.8. 326 p. $60. International Investment Instruments: A Compendium. Vol. XIII. Sales No. E.05.II.D.7. 358 p. $60. International Investment Instruments: A Compendium. Vol. XII. Sales No. E.04.II.D.10. 364 p. $60. International Investment Instruments: A Compendium. Vol. XI. 345 p. Sales No. E.04.II.D.9. $60. http://www.unctad.org/en/docs//dite4volxi_en.pdf. International Investment Instruments: A Compendium. Vol. X. 353 p. Sales No. E.02.II.D.21. $60. http://www.unctad.org/en/docs/psdited3v9.en.pdf. International Investment Instruments: A Compendium. Vol. IX. 353 p. Sales No. E.02.II.D.16. $60. http://www.unctad.org/en/docs/psdited3v9.en.pdf. International Investment Instruments: A Compendium. Vol. VIII. 335 p. Sales No. E.02.II.D.15. $60. http://www.unctad.org/en/docs/psdited3v8.en.pdf.
International Investment Instruments: A Compendium. Vol. VII. 339 p. Sales No. E.02.II.D.14. $60. http://www.unctad.org/en/docs/psdited3v7.en.pdf. International Investment Instruments: A Compendium. Vol. VI. 568 p. Sales No. E.01.II.D.34. $60. http://www.unctad.org/en/docs/ps1dited2v6_p1.en.pdf (part one). International Investment Instruments: A Compendium. Vol. V. 505 p. Sales No. E.00.II.D.14. $55. International Investment Instruments: A Compendium. Vol. IV. 319 p. Sales No. E.00.II.D.13. $55.
LDC Investment Guides (For more information visit
http://www.unctad.org/Templates/Page.asp?intItemID=2705&lang=14)
An Investment Guide to Kenya: Opportunities and Conditions. 92 p. UNCTAD/ITE/IIA/2005/2. An Investment Guide to Tanzania: Opportunities and Conditions. 82 p. UNCTAD/ITE/IIA/2005/3. An Investment Guide to the East African Community: Opportunities and Conditions. 109 p. UNCTAD/ITE/IIA2005/4. An Investment Guide to Mauritania: Opportunities and Conditions. 80 p. UNCTAD/ITE/IIA/2004/4. Guide de l’investissement au Mali: Opportunités et Conditions. 76 p. UNCTAD/ITE/IIA/2004/1. An Investment Guide to Cambodia: Opportunities and Conditions. 89 p. UNCTAD/ITE/IIA/2003/6. http://www.unctad.org/en/docs//iteiia20036_en.pdf. An Investment Guide to Nepal: Opportunities and Conditions. 97 p. UNCTAD/ITE/IIA/2003/2. http://www.unctad.org/en/docs/iteiia20032_en.pdf. An Investment Guide to Mozambique: Opportunities and Conditions. 109 p. UNCTAD/ITE/IIA/4. http://www.unctad.org/en/docs/poiteiiad4.en.pdf. An Investment Guide to Uganda: Opportunities and Conditions. 89 p. UNCTAD/ITE/IIA/2004/3. An Investment Guide to Bangladesh: Opportunities and Conditions. 66 p. UNCTAD/ITE/IIT/Misc.29. http://www.unctad.org/en/docs/poiteiitm29.en.pdf.
Selected UNCTAD Publications on TNCs and FDI 57
UNCTAD Current Studies on FDI and Development
An Investment Guide to Ethiopia: Opportunities and Conditions. 90 p. UNCTAD/ITE/IIA/2004/2.
Issues in International Investment Agreements
(Fore more information visit http://www.unctad.org/iia)
Investor-State Disputes Arising from Investment Treaties: A Review. 106 p. Sales No. E.06.II.D.1 $15 South-South Cooperation in Investment Arrangements. 108 p. Sales No. E.05.II.D.26 $15. The REIO Exception in MFN Treatment Clauses. 92 p. Sales No. E.05.II.D.1. $15. International Investment Agreements in Services. 119 p. Sales No. E.05.II.D.15. $15. State Contracts. 84 p. Sales No. E.05.II.D.5. $15. Competition. 112 p. E.04.II.D.44. $ 15. Key Terms and Concepts in IIAs: a Glossary. 232 p. Sales No. E.04.II.D.31. $15. Incentives. 108 p. Sales No. E.04.II.D.6. $15. Transparency. 118 p. Sales No. E.04.II.D.7. $15.
Dispute Settlement: State-State. 101 p. Sales No. E.03.II.D.6. $15. Dispute Settlement: Investor-State. 125 p. Sales No. E.03.II.D.5. $15. Transfer of Technology. 138 p. Sales No. E.01.II.D.33. $18. Illicit Payments. 108 p. Sales No. E.01.II.D.20. $13. Home Country Measures. 96 p. Sales No.E.01.II.D.19. $12. Host Country Operational Measures. 109 p. Sales No E.01.II.D.18. $15. Social Responsibility. 91 p. Sales No. E.01.II.D.4. $15. Environment. 105 p. Sales No. E.01.II.D.3. $15. Transfer of Funds. 68 p. Sales No. E.00.II.D.27. $12. Employment. 69 p. Sales No. E.00.II.D.15. $12. Taxation. 111 p. Sales No. E.00.II.D.5. $12. International Investment Agreements: Flexibility for Development. 185 p. Sales No. E.00.II.D.6. $12. Taking of Property. 83 p. Sales No. E.00.II.D.4. $12.
B. ASIT Advisory Studies (Formerly Current Studies, Series B) No. 17. The World of Investment Promotion at a Glance: A survey of investment promotion practices. UNCTAD/ITE/IPC/3.
No. 16. Tax Incentives and Foreign Direct Investment: A Global Survey. 180 p. Sales No. E.01.II.D.5. $23. Summary available from http://www.unctad.org/asit/resumé.htm.
C. Individual Studies Globalization of R&D and Developing Countries.. 242 p. Sales No. E.06.II.D.2. $35. Prospects for Foreign Direct Investment and the Strategies of Transnational Corporations, 2005-2008. 74 p. Sales No. E.05.II.D.32. $18. World Economic Situation and Prospects 2005. 136 p. Sales No. E. 05.II.C.2. $15. (Joint publication with the
United Nations Department of Economic and Social Affairs.) Foreign Direct Investment and Performance Requirements: New Evidence from Selected Countries. 318 p. Sales No. E.03.II.D.32. $35.http://www.unctad.org/en/docs//iteiia20037_en.pdf
58 The Universe of the Largest Transnational Corporations
UNCTAD Current Studies on FDI and Development
FDI in Land-Locked Developing Countries at a Glance. 112 p. UNCTAD/ITE/IIA/2003/5. FDI in Least Developed Countries at a Glance: 2002. 136 p. UNCTAD/ITE/IIA/6. http://www.unctad.org/en/docs//iteiia6_en.pdf. The Tradability of Consulting Services. 189 p. UNCTAD/ITE/IPC/Misc.8. http://www.unctad.org/en/docs/poiteipcm8.en.pdf. Foreign Direct Investment in Africa: Performance and Potential. 89 p. UNCTAD/ITE/IIT/Misc.15. Free of charge. Also available from http://www.unctad.org/en/docs/poiteiitm15.pdf. TNC-SME Linkages for Development: Issues–Experiences–Best Practices. Proceedings of the Special Round Table on TNCs, SMEs and Development, UNCTAD X, 15 February 2000, Bangkok, Thailand.113 p. UNCTAD/ITE/TEB1. Free of charge.
Measures of the Transnationalization of Economic Activity. 93 p. Sales No. E.01.II.D.2. $20. The Competitiveness Challenge: Transnational Corporations and Industrial Restructuring in Developing Countries. 283p. Sales No. E.00.II.D.35. $42. FDI Determinants and TNC Strategies: The Case of Brazil. 195 p. Sales No. E.00.II.D.2. $35. Summary available from http://www.unctad.org/en/pub/psiteiitd14.en.htm.
Studies on FDI and Development TNCs and the Removal of Textiles and Clothing Quotas. 78 p. Sales No. E.05.II.D.20. Measures of Restrictions on FDI in Services in Developing Countries. 56 p. Sales No. E.06.II.D.13.
D. Journals Transnational Corporations Journal (formerly The CTC Reporter). Published three times a year. Annual subscription price: $45; individual issues $20. http://www.unctad.org/en/subsites/dite/1_itncs/1_tncs.htm.
Selected UNCTAD Publications on TNCs and FDI 59
UNCTAD Current Studies on FDI and Development
United Nations publications may be obtained from bookstores and distributors throughout the world. Please consult your bookstore or write: For Africa, Asia and Europe to:
Sales Section United Nations Office at Geneva
Palais des Nations CH-1211 Geneva 10
Switzerland Tel: (41-22) 917-1234 Fax: (41-22) 917-0123
E-mail: [email protected] For Asia and the Pacific, the Caribbean, Latin America and North America to:
Sales Section Room DC2-0853
United Nations Secretariat New York, NY 10017
United States Tel: (1-212) 963-8302 or (800) 253-9646
Fax: (1-212) 963-3489 E-mail: [email protected]
All prices are quoted in United States dollars. For further information on the work of the Division on Investment, Technology and Enterprise Development, UNCTAD, please address inquiries to:
United Nations Conference on Trade and Development Division on Investment, Technology and Enterprise Development
Palais des Nations, Room E-10054 CH-1211 Geneva 10, Switzerland
Telephone: (41-22) 907-5651 Telefax: (41-22) 907-0498
http://www.unctad.org

Questionnaire
The Universe of the Largest Transnational Corporations Sales No. E.07.II.D.6
In order to improve the quality and relevance of the work of the UNCTAD Division on Investment, Technology and Enterprise Development, it would be useful to receive the views of readers on this publication. It would therefore be greatly appreciated if you could complete the following questionnaire and return it to:
Readership Survey UNCTAD Division on Investment, Technology and Enterprise Development
United Nations Office in Geneva Palais des Nations, Room E-9123 CH-1211 Geneva 10, Switzerland
Fax: 41-22-917-0194 1. Name and address of respondent (optional):
2. Which of the following best describes your area of work?
Government Public enterprise Private enterprise Academic or research institution International organization Media Not-for-profit organization Other (specify) __________
3. In which country do you work? _________________________ 4. What is your assessment of the contents of this publication?
Excellent Adequate Good Poor
5. How useful is this publication to your work?
Very useful Somewhat useful Irrelevant 6. Please indicate the three things you liked best about this publication:
62 The Universe of the Largest Transnational Corporations
UNCTAD Current Studies on FDI and Development
7. Please indicate the three things you liked least about this publication:
8. If you have read other publications of the UNCTAD Division on Investment, Enterprise
Development and Technology, what is your overall assessment of them?
Consistently good Usually good, but with some exceptions Generally mediocre Poor
9. On the average, how useful are those publications to you in your work?
Very useful Somewhat useful Irrelevant 10. Are you a regular recipient of Transnational Corporations (formerly The CTC
Reporter), UNCTAD-DITE's tri-annual refereed journal?
Yes No
If not, please check here if you would like to receive a sample copy sent to the name and address you have given above
1 See G. Ietto-Gillies (2005). 2 Anglo American (merger of Anglo American Corporation of South Africa and Minorco from Luxembourg) and SAB Miller (merger of South African Breweries and Miller Brewing Company) are two noticeable examples. Mittal Steel, founded and owned by the Indian Mittal family, is registered in the Netherlands and headquartered in the United Kingdom. 3 These results cannot, of course, be compared directly with the usual use of the Herfindahl index to evaluate concentration by industry. The top 100 and 50 represent a number of industries. 4 There are in the literature many indices based on this concept of intensity. See, for example, Dunning (1996), Sullivan (1994) and Ramaswamy et al. (1996). 5 Ietto-Gillies (1998). Sanders and Carpenter (1998) use the number of countries as a percentage of the highest number of countries with subsidiaries in the sample. 6 Of course, a more detailed analysis would also take into account other factors, including the strategies pursued by different companies. 7 Cultural distance is different from geographical distance. Empirical evidence suggests the importance of geography in determining international economic interactions and in shaping the structure of production across space (Overman et al., 2001). Ghemawat (2001) suggested that four dimensions of distance – namely cultural, administrative, geographic and economic – influence companies considering global expansion.

Questionnaire 63
8 Recent work has been carried out by Galan and Gonzales-Benito (2001), Habib and Zurawicki (2002), Javalgi et al. (2003), La Porta et al. (1999, 2000); Kaufmann, D. and A. Kraay (2002), among others. 9 The methodology is available at www.euromoney.com. 10 See www.eiuresources.com. 11 Information on data and methodology are available at www.tranparency.org. 12 Available at www.worldbank.org/wbi/governance. 13 This variable was suggested by Rossi and Volpin (2004) as a control factor but shows a small and non-significant value. 14 See Kaufmann and Kraay (2002) for a review. 15 The UNCTAD secretariat prepared a note (UNCTAD/TD/B/COM.2/EM.18/2) on these issues.


![Transnational Corporations [Grazia Ietto-Gillies]](https://img.pdfslide.us/doc/110x75/577cc4701a28aba711994e6f/transnational-corporations-grazia-ietto-gillies.jpg)