Embed Size (px)
Citation preview
R E S E A R CH AR T I C L E
Transmitter receptors reveal segregation of the arcopallium/amygdala complex in pigeons (Columba livia)
Christina Herold1 | Christina Paulitschek1 | Nicola Palomero-Gallagher2 |
Onur G€unt€urk€un3 | Karl Zilles2,4
1C. and O. Vogt Institute of Brain Research,
Medical Faculty, Heinrich-Heine University
of D€usseldorf, D€usseldorf, Germany
2Institute of Neuroscience and Medicine
INM-1, Research Center J€ulich, J€ulich,
Germany
3Department of Biopsychology, Institute of
Cognitive Neuroscience, Faculty of
Psychology, Ruhr-University Bochum,
Bochum, Germany
4Department of Psychiatry, Psychotherapy
and Psychosomatics, RWTH Aachen
University, and JARA – Translational Brain
Medicine, Aachen, Germany
Correspondence
Christina Herold, C. & O. Vogt-Institute of
Brain Research, University of D€usseldorf,
D€usseldorf 40225, Germany.
Email: [email protected]
Funding information
Grant sponsor: Deutsche
Forschungsgemeinschaft, Grant No.: SFB
1280 (O.G.).
AbstractAt the beginning of the 20th century it was suggested that a complex group of nuclei in the avian
posterior ventral telencephalon is comparable to the mammalian amygdala. Subsequent findings,
however, revealed that most of these structures share premotor characteristics, while some indeed
constitute the avian amygdala. These developments resulted in 2004 in a change of nomenclature
of these nuclei, which from then on were named arcopallial or amygdala nuclei and referred to as
the arcopallium/amygdala complex. The structural basis for the similarities between avian and
mammalian arcopallial and amygdala subregions is poorly understood. Therefore, we analyzed
binding site densities for glutamatergic AMPA, NMDA and kainate, GABAergic GABAA, muscarinic
M1, M2 and nicotinic acetylcholine (nACh; a4b2 subtype), noradrenergic a1 and a2, serotonergic 5-
HT1A and dopaminergic D1/5 receptors using quantitative in vitro receptor autoradiography com-
bined with a detailed analysis of the cyto- and myelo-architecture. Our approach supports a
segregation of the pigeon’s arcopallium/amygdala complex into the following subregions: the arco-
pallium anterius (AA), the arcopallium ventrale (AV), the arcopallium dorsale (AD), the arcopallium
intermedium (AI), the arcopallium mediale (AM), the arcopallium posterius (AP), the nucleus poste-
rioris amygdalopallii pars basalis (PoAb) and pars compacta (PoAc), the nucleus taeniae amgygdalae
(TnA) and the area subpallialis amygdalae (SpA). Some of these subregions showed further subnu-
clei and each region of the arcopallium/amygdala complex are characterized by a distinct multi-
receptor density expression. Here we provide a new detailed map of the pigeon’s arcopallium/
amygdala complex and compare the receptor architecture of the subregions to their possible mam-
malian counterparts.
K E YWORD S
amygdala, arcopallium, avian, autoradiography, receptor, RRID:SCR_013566, RRID:SCR_001905,
RRID:SCR_015627
Abbreviations: A, Arcopallium; AA, Arcopallium anterius; ACh, Acetylcholine; AD, Arcopallium dorsale; ADl, Arcopallium dorsale pars lateralis; ADm, Arcopallium
dorsale pars medialis; ADp, Arcopallium dorsale pars posterior; AI, Arcopallium intermedium; AId, Arcopallium intermedium pars dorsalis; AIv, Arcopallium
intermedium pars ventralis; AIvm, Arcopallium intermedium pars ventromedialis; AM, Arcopallium mediale; AMm, Arcopallium mediale pars magnocellularis; AMp,
Arcopallium mediale pars parvocellularis; AMPA, a-amino-3-hydroxy-5-methyl-4-isoxazolepropionic acid; AP, Arcopallium posterioris; AV, Arcopallium ventrale;
AVm, Arcopallium ventrale pars medialis; BSTL, Bed nucleus of the Stria Terminalis, pars lateralis; CDL, Area corticoidea dorsolateralis; CPi, Cortex piriformis; DA,
Tractus dorso-arcopallialis; FA, Tractus fronto-arcopallialis; GABA, g-Amino-butyric acid; GP, Globus pallidus; HF, Hippocampal formation; LAD, Lamina
arcopallialis dorsalis; LSt, Lateral striatum; M, Mesopallium; N, Nidopallium; NCL, Nidopallium caudolaterale; NCVl, Nidopallium caudoventrale pars lateralis;
NMDA, N-Methyl-D-aspartic acid; PoA, Nucleus posterioris amygdalopallii; PoAb, Nucleus posterioris amygdalopallii pars basalis; PoAc, Nucleus posterioris
amygdalopallii pars compacta; SpA, Area subpallialis amygdalae; ST, Striatum; TnA, Nucleus taeniae amygdalae; TPO, Area temporo-parieto-occipitalis; V, Ventricle.
J Comp Neurol. 2018;526:439–466. wileyonlinelibrary.com/journal/cne VC 2017Wiley Periodicals, Inc. | 439
Received: 10 October 2016 | Revised: 9 October 2017 | Accepted: 10 October 2017
DOI: 10.1002/cne.24344
The Journal ofComparative Neurology
1 | INTRODUCTION
New concepts of vertebrate brain evolution resulted recently in a bet-
ter understanding of the organization of the avian telencephalon (Jarvis
et al., 2005; Reiner et al., 2004). Furthermore, in the last couple of
years, novel but conflicting hypotheses on homologies of avian and
mammalian pallial structures and cell types have been claimed and new
genetic models were developed (Belgard et al., 2013; Butler, Reiner, &
Karten, 2011; Chen, Winkler, Pfenning, & Jarvis, 2013; Dugas-Ford,
Rowell, & Ragsdale, 2012; Jarvis et al., 2013; Karten, 2015; Puelles,
2011; Vicario, Abell�an, Desfilis, & Medina, 2014). Beside the known
homologies of brain regions that are based on the same developmental
origin, some regions also share anatomical and molecular traits, which
seem to be a result of convergent evolution based on functional spe-
cialization (G€unt€urk€un & Bugnyar, 2016; Herold, Coppola, & Bingman,
2015; Herold, Joshi, Chehadi, Hollmann, & G€unt€urk€un, 2012; Herold
et al., 2011; Pfenning et al., 2014). One region that has been intensely
discussed in this context is the avian arcopallium/amygdaloid complex.
According to the old and outdated nomenclature (Karten & Hodos,
1967), this ventrolateral part of the posterior telencephalon was called
archistriatum and was suggested to be partly comparable to the mam-
malian amygdala (Zeier & Karten, 1971). However, evidence from neu-
rochemical, developmental, and behavioral data showed that most
parts of the archistriatum are largely of premotor nature (Butler et al.,
2011; Kuenzel, Medina, Csillag, Perkel, & Reiner, 2011; Reiner et al.,
2004; Yamamoto, Sun, Wang, & Reiner, 2005). Accordingly, these pre-
motor areas were termed arcopallium in the new nomenclature while
the remaining subnuclei were assumed to constitute the amygdala
(Reiner et al., 2004). In mammals, the amygdala is also a complex struc-
ture, with multiple subnuclei, and various neuronal subtypes and con-
nections. Similarly, developmental and genetic studies have confirmed
that both the avian and the mammalian amygdala complexes share sev-
eral expression profiles of specific markers (Dugas-Ford et al., 2012;
Jarvis et al., 2013; Kuenzel et al., 2011; Montiel & Molnar, 2013; Mor-
eno & Gonzalez, 2007; Pfenning et al., 2014; Puelles et al., 2015;
Vicario et al., 2014; Vicario, Abell�an, & Medina, 2015). Not only genetic
but also connectional analyses demonstrate that the premotor subre-
gions of the arcopallium share similar connectivity patterns as the
mammalian premotor areas, while the limbic nuclei showed comparable
connections to parts of the mammalian amygdala (Atoji & Wild, 2012;
G€unt€urk€un & Bugnyar, 2016; Hanics, Teleki, Alpar, Szekely, & Csillag,
2016; Reiner et al., 2004; Shanahan, Bingman, Shimizu, Wild, &
G€unt€urk€un, 2013; Zeier & Karten, 1971). This is also true for functional,
pharmacological and electrophysiological studies in various bird species
that make it likely that the avian arcopallium/amygdaloid complex is
constituted by diverse subregions that have either premotor or limbic
functions and participate in visual, vocal, auditory, and emotional learn-
ing, fear and reproduction behavior as well as neuroendocrine control
and homeostasis (Campanella et al., 2009; Cohen, 1975; Cross et al.,
2013; da Silva et al., 2009; Dafters, 1975; Kuenzel et al., 2011; Pfen-
ning et al., 2014; Saint-Dizier et al., 2009; Scarf, Stuart, Johnston, &
Colombo, 2016; Whitney et al., 2014; Winkowski & Knudsen, 2007).
However, the heterogeneity of this region constitutes a major
challenge to understand the functional organization and evolutionary
origin of the arcopallium/amygdala complex in birds (Medina & Abell�an,
2009). In addition, a common consensus of homologies between birds
and mammals is still missing.
Since the expression of multiple transmitter receptors in the brain
has been proven as a powerful tool to delineate different areas, and to
identify similarities among regions between various mammalian species
(Palomero-Gallagher, Zilles, Schleicher, & Vogt, 2013; Vogt et al., 2013;
Zilles, 2005; Zilles & Palomero-Gallagher, 2016) and also between birds
and mammals (Herold et al., 2015; Herold et al., 2011; Jarvis et al.,
2013; Kubikova, Wada, & Jarvis, 2010; Lovell, Clayton, Replogle, &
Mello, 2008; Sun & Reiner, 2000; Wada, Sakaguchi, Jarvis, & Hagiwara,
2004), we analyzed the neurotransmitter receptor-, myelo- and
cellular-architecture of the pigeon’s arcopallium/amygdala complex.
The resulting detailed map of this region can be used as a basis for
comparisons to the mammalian amygdala complex and cortical areas in
the future.
2 | MATERIAL AND METHODS
2.1 | Receptor autoradiography and histology
We examined six adult pigeon brains (Columba livia) of unknown sex.
Animals were obtained from local breeders and were housed in individ-
ual cages (30 3 30 3 45 cm) at 21618C temperature and in a humid-
ity controlled room with a 12-hr light/dark circle. The birds had free
access to grit, food and water ad libitum. All experimental procedures
were approved by the national authority (LANUV NRW, Germany) and
were carried out in accordance with the National Institute of Health
Guide for Care and Use of Laboratory Animals. Animals were decapi-
tated, brains were removed from the skull, frozen immediately in iso-
pentane at 2408C and stored at 2708C. Serial coronal 10 lm sections
were cut with a cryostat microtome (2800 Frigocut E, Reichert-Jung).
Sections were thaw-mounted on gelatinized glass slides, freeze-dried
and stained with a modified cell body staining or Gallyas myelin stain-
ing (Gallyas, 1971; Merker, 1983) for cyto- and myelo-architectonic
analysis, or processed for receptor autoradiography.
Details of the autoradiographic labeling procedure have been pub-
lished elsewhere (Herold et al., 2014; Zilles, Palomero-Gallagher, et al.,
2002; Zilles, Schleicher, Palomero-Gallagher, & Amunts, 2002). Binding
protocols are summarized in Table 1. Three steps were performed in
the following sequence:
1. A preincubation step removed endogenous ligand from the tissue.
2. During the main incubation step binding sites were labeled with the
respective tritiated ligand (total binding), or co-incubated with the
tritiated ligand and a 1,000–10,000-fold excess of specific non-
labeled ligand (displacer) determined non-displaceable, and thus,
non-specific binding. Specific binding is the difference between total
and non-specific binding. It was less than 5% in all cases.
3. A final rinsing step eliminated unbound radioactive ligand from the
sections.
440 | The Journal ofComparative Neurology
HEROLD ET AL.
The following binding sites were labeled according to the above cited
protocols: (a) a-amino-3-hydroxy-5-methyl-4-isoxalone propionic acid
(AMPA) receptor with [3H] AMPA, (b) kainate receptor with [3H]kai-
nate, (c) N-methyl-D-aspartate (NMDA) receptor with [3H]MK-801, (d)
g-aminobutyric acid A (GABAA) receptor with [3H]muscimol, (e) musca-
rinic cholinergic M1 receptor with [3H]pirenzepine, (f) muscarinic cho-
linergic M2 receptor with [3H]oxotremorine-M, (g) nicotinic cholinergic
(nACh; a4b2 subtype) receptor with [3H]cytisine, (h) noradrenergic a1
adrenoreceptor with [3H]prazosin, (i) noradrenergic a2 adrenoreceptor
with [3H]RX-821002, (j) serotonergic 5-HT1A receptor with [3H]8-OH-
DPAT, and (k) dopaminergic D1/5 receptors with [3H]SCH 23390. Sec-
tions were air-dried overnight and subsequently co-exposed for 4–5
weeks against a tritium-sensitive film (Hyperfilm, Amersham, Braunsch-
weig, Germany, RRID:SCR_013566) with plastic [3H]-standards (Micro-
scales, Amersham) of known concentrations of radioactivity.
2.2 | Image analysis
The resulting autoradiographs were subsequently processed using den-
sitometry with a video-based image analyzing technique (Zilles, Schlei-
cher, et al., 2002). Autoradiographs were digitized by means of a KS-
400 image analyzing system (Kontron, Germany) connected to a CCD
camera (Sony, Japan) equipped with a S-Orthoplanar 60-mm macro
lens (Zeiss, Germany). The images were stored as binary files with a
resolution of 512 3 512 pixels and 8-bit gray value. The gray value
images of the co-exposed microscales were used to compute a calibra-
tion curve by nonlinear, least-squares fitting, which defined the rela-
tionship between gray values in the autoradiographs and
concentrations of radioactivity. This enabled the pixel-wise conversion
of the gray values of an autoradiograph into the corresponding concen-
tration of radioactivity. The concentrations of binding sites occupied by
a ligand under incubation conditions are transformed into fmol/mg pro-
tein at saturation conditions by means of the equation: (KD1 L)/AS 3 L,
where KD is the equilibrium dissociation constant of ligand-binding
kinetics, L is the incubation concentration of ligand, and AS the specific
activity of the ligand. The results of these calculations were used for
binding site density measurements. The digitized autoradiographic
images were color-coded only to facilitate the detection of regional dif-
ferences in binding site densities by visual inspection.
2.3 | Anatomical identification
The borders of the arcopallium/amygdala complex and its subregions
were identified based on our cyto-, myelo- and receptor-architectonic
data, and previous cytoarchitectural, neurochemical, tract-tracing, and
imaging studies (Atoji, Saito, & Wild, 2006; Atoji & Wild, 2009; H.
Karten & Hodos, 1967; Kr€oner & G€unt€urk€un, 1999; Reiner et al., 2004;
Shanahan et al., 2013; Yamamoto & Reiner, 2005; Zeier & Karten,
1971). Borders of the different subregions were traced on prints of the
digitized autoradiographs by projecting the cell body and the myelin
stained sections onto the digitized images of the autoradiographs
between anterior–posterior levels A 7.75 and A 4.50 according to the
atlas of Karten and Hodos (1967). The mean of the concentration of
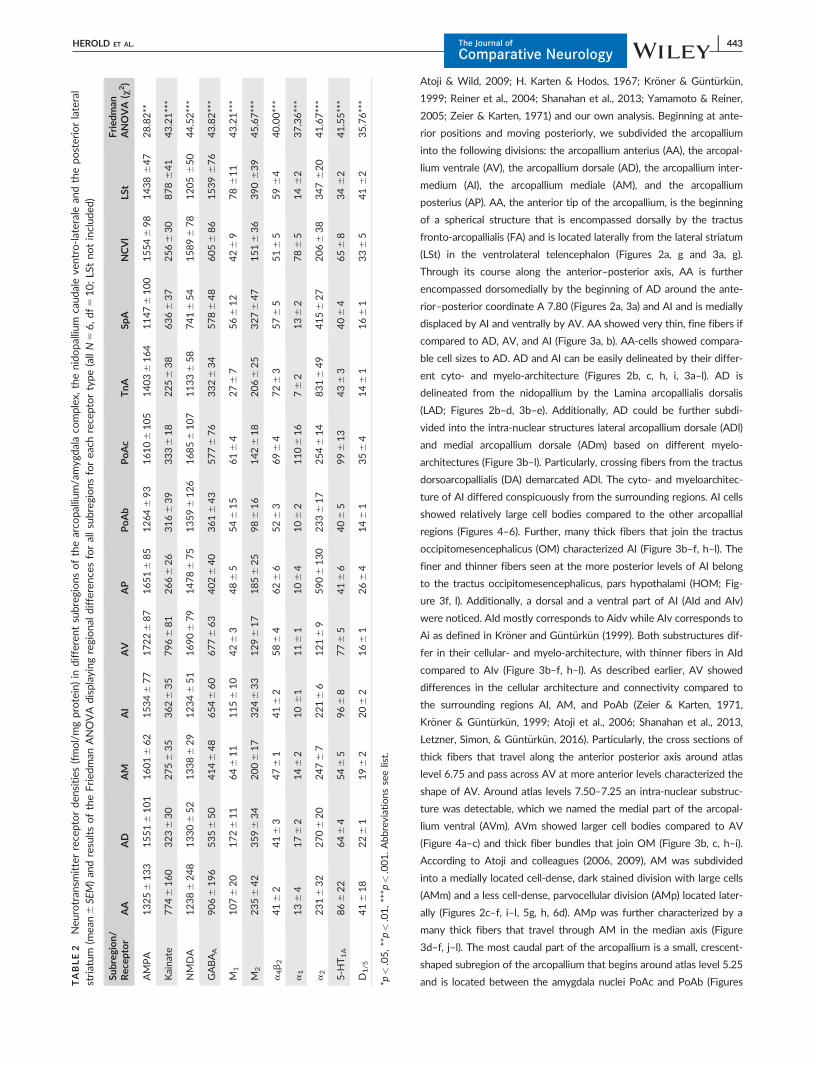
each binding site (fmol/mg protein) in each subregion of the arcopal-
lium/amygdala complex was calculated over the sampled anterior-
posterior levels from each animal, averaged across the six animals, and
is reported as the overall receptor concentration (mean6 standard
error of mean (SEM)). Quantitative, multi-receptor data are presented in
color-coded autoradiographs and in regional fingerprints that are pre-
pared as polar plots or histograms that separately show the density for
the receptors in each subregion.
2.4 | Statistical analysis
To determine differences in receptor densities among subregions and
adjacent structures we compared the main subregions of the arcopal-
lium/amygdala complex and included also the lateral division of the
nidopallium caudoventrale (NCVl). To do so, we first applied a Friedman
ANOVA across all subregions for each ligand (Table 2). If significant,
pair-wise comparisons were run with the Wilcoxon-rank test (Table 3).
Differences between intra-nuclear substructures were directly analyzed
with Wilcoxon-rank tests. For the general statistical analyses, Statistica
10 (StatSoft, Tulsa, RRID:SCR_015627) was used. The significance level
was set at 0.05. Further, a hierarchical cluster analysis was carried out
to detect putative groupings of areas according to the degree of (dis)
similarity of their receptor architecture (Palomero-Gallagher et al.,
2009). The Euclidean distance was applied as a measure of (dis)similar-
ity since it takes both differences, the size and the shape of receptor
fingerprints into account, and the Ward linkage algorithm as the linkage
method. This combination yielded the maximum cophenetic correlation
coefficient as compared to any combination of alternative linkage
methods and measurements of (dis)similarity. Prior to this analysis, the
densities of each receptor type were transformed to z-scores across all
areal densities of that specific receptor, thus ensuring an equal weight-
ing of each receptor without eliminating relative differences in receptor
densities among areas. The hierarchical cluster analysis was carried out
with in house R-scripts (R Foundation for Statistical Computing, http://
www.r-project.org, RRID:SCR_001905).
3 | RESULTS
3.1 | Qualitative analysis of the cyto- and myelo-
architecture of the arcopallium/amygdala complex
Figure 1 shows the arcopallium/amygdala complex in a Nissl (a)- and a
myelin (b)-stained transverse section of a pigeon brain at the anterior–
posterior coordinate A 6.50 (Karten & Hodos, 1967) and a magnifica-
tion of the region of interest (1c) clipped from the Nissl image in Figure
1a. For a more detailed overview, different atlas levels are shown in
representative coronal cell body- and myelin-stained sections depicting
the outlines of the arcopallium/amgydala complex and surrounding
structures in Figure 2 (a–l; Nissl) and Figure 3 (a–l; myelin) that were
used as an orientation for the identification of subregions in the recep-
tor autoradiographs. Thereby, the boundaries to map the different
arcopallium/amygdala subdivisions followed previous cytoarchitectural,
neurochemical, tract-tracing, and imaging studies (Atoji et al., 2006;
HEROLD ET AL. The Journal ofComparative Neurology
| 441
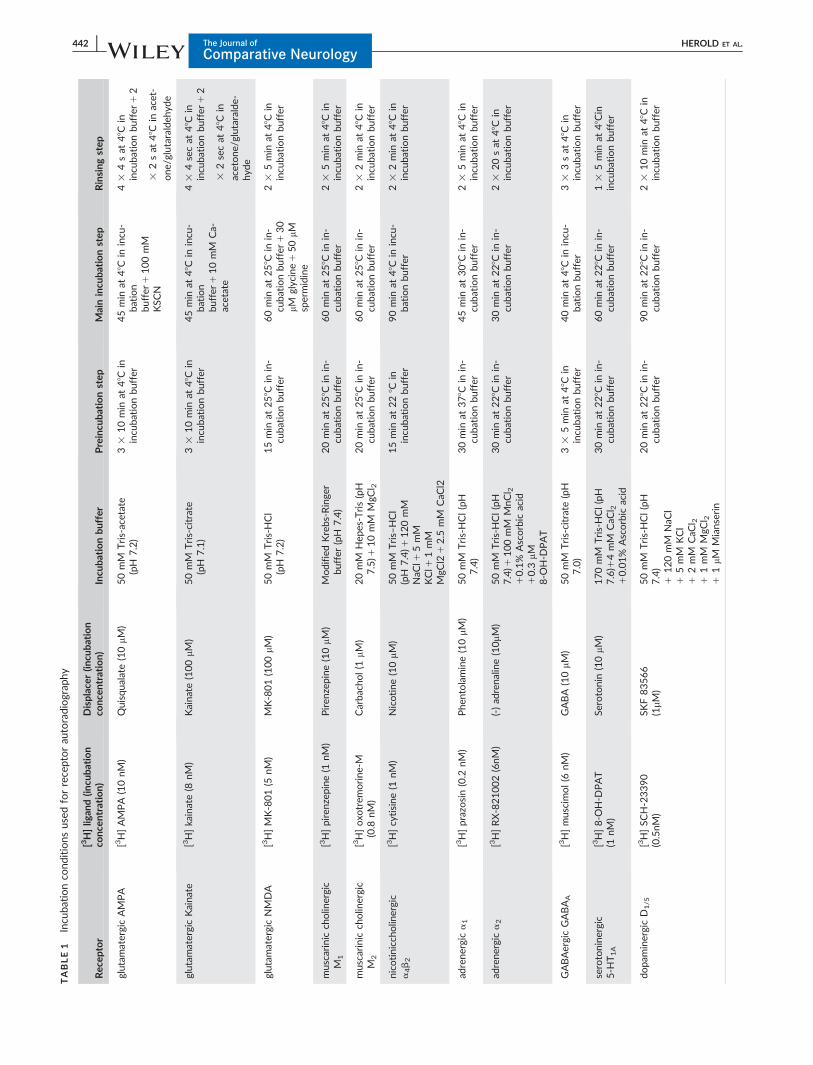
TABLE1
Incu
bationco
nditions
used
forreceptorau
toradiograp
hy
Rec
eptor
[3H]lig
and(in
cuba
tion
conc
entration)
Displacer
(incu
bation
conc
entration)
Incu
bationbu
ffer
Preincu
bationstep
Mainincu
bationstep
Rinsingstep
glutam
atergicAMPA
[3H]AMPA
(10nM
)Quisqua
late
(10lM
)50mM
Tris-acetate
(pH
7.2)
33
10min
at48C
inincu
bationbu
ffer
45min
at48C
inincu
-bation
buffer
1100mM
KSC
N
43
4sat
48C
inincu
bationbuffer
12
32sat
48C
inacet-
one/glutaraldeh
yde
glutam
atergicKaina
te[3H]kainate(8
nM)
Kaina
te(100lM
)50mM
Tris-citrate
(pH
7.1)
33
10min
at48C
inincu
bationbu
ffer
45min
at48C
inincu
-bation
buffer
110mM
Ca-
acetate
43
4secat
48C
inincu
bationbuffer
12
32secat
48C
in
acetone/glutaralde-
hyd
e
glutam
atergicNMDA
[3H]MK-801(5
nM)
MK-801(100lM
)50mM
Tris-HCl
(pH
7.2)
15min
at258C
inin-
cuba
tionbu
ffer
60min
at258C
inin-
cubationbuffer
130
lM
glycine1
50lM
spermidine
23
5min
at48C
inincu
bationbuffer
muscarinicch
olin
ergic
M1
[3H]pirenzep
ine(1
nM)
Piren
zepine
(10lM
)Modified
Krebs-Ringe
rbu
ffer
(pH
7.4)
20min
at258C
inin-
cuba
tionbu
ffer
60min
at258C
inin-
cubationbuffer
23
5min
at48C
inincu
bationbuffer
muscarinicch
olin
ergic
M2
[3H]oxo
trem
orine
-M(0.8
nM)
Carbacho
l(1
lM)
20mM
Hep
es-Tris(pH
7.5)1
10mM
MgC
l 220min
at258C
inin-
cuba
tionbu
ffer
60min
at258C
inin-
cubationbuffer
23
2min
at48C
inincu
bationbuffer
nico
tiniccho
linergic
a4b2
[3H]cytisine
(1nM
)Nicotine
(10mM
)50mM
Tris–
HCl
(pH
7.4)1
120mM
NaC
l15mM
KCl1
1mM
MgC
l212.5
mM
CaC
l2
15min
at228C
inincu
bationbu
ffer
90min
at48C
inincu
-bationbuffer
23
2min
at48C
inincu
bationbuffer
adrene
rgic
a1
[3H]prazosin(0.2
nM)
Phe
ntolamine(10lM
)50mM
Tris-HCl(pH
7.4)
30min
at378C
inin-
cuba
tionbu
ffer
45min
at308C
inin-
cubationbuffer
23
5min
at48C
inincu
bationbuffer
adrene
rgic
a2
[3H]RX-821002(6nM
)(-)ad
rena
line(10mM
)50mM
Tris-HCl(pH
7.4)1
100mM
MnC
l 210.1%
Ascorbic
acid
10.3
mM8-O
H-D
PAT
30min
at228C
inin-
cuba
tionbu
ffer
30min
at228C
inin-
cubationbuffer
23
20sat
48C
inincu
bationbuffer
GABAergicGABAA
[3H]muscimol(6
nM)
GABA
(10mM
)50mM
Tris-citrate(pH
7.0)
33
5min
at48C
inincu
bationbu
ffer
40min
at48C
inincu
-bationbuffer
33
3sat
48C
inincu
bationbuffer
serotonine
rgic
5-H
T1A
[3H]8-O
H-D
PAT
(1nM
)Se
rotonin(10mM
)170mM
Tris-HCl(pH
7.6)1
4mM
CaC
l 210.01%
Ascorbic
acid
30min
at228C
inin-
cuba
tionbu
ffer
60min
at228C
inin-
cubationbuffer
13
5min
at48Cin
incu
bationbuffer
dopa
minergicD
1/5
[3H]SC
H-23390
(0.5nM
)SK
F83566
(1mM
)50mM
Tris-HCl(pH
7.4)
1120mM
NaC
l1
5mM
KCl
12mM
CaC
l 21
1mM
MgC
l 21
1mM
Mianserin
20min
at228C
inin-
cuba
tionbu
ffer
90min
at228C
inin-
cubationbuffer
23
10min
at48C
inincu
bationbuffer
442 | The Journal ofComparative Neurology
HEROLD ET AL.
Atoji & Wild, 2009; H. Karten & Hodos, 1967; Kr€oner & G€unt€urk€un,
1999; Reiner et al., 2004; Shanahan et al., 2013; Yamamoto & Reiner,
2005; Zeier & Karten, 1971) and our own analysis. Beginning at ante-
rior positions and moving posteriorly, we subdivided the arcopallium
into the following divisions: the arcopallium anterius (AA), the arcopal-
lium ventrale (AV), the arcopallium dorsale (AD), the arcopallium inter-
medium (AI), the arcopallium mediale (AM), and the arcopallium
posterius (AP). AA, the anterior tip of the arcopallium, is the beginning
of a spherical structure that is encompassed dorsally by the tractus
fronto-arcopallialis (FA) and is located laterally from the lateral striatum
(LSt) in the ventrolateral telencephalon (Figures 2a, g and 3a, g).
Through its course along the anterior–posterior axis, AA is further
encompassed dorsomedially by the beginning of AD around the ante-
rior–posterior coordinate A 7.80 (Figures 2a, 3a) and AI and is medially
displaced by AI and ventrally by AV. AA showed very thin, fine fibers if
compared to AD, AV, and AI (Figure 3a, b). AA-cells showed compara-
ble cell sizes to AD. AD and AI can be easily delineated by their differ-
ent cyto- and myelo-architecture (Figures 2b, c, h, i, 3a–l). AD is
delineated from the nidopallium by the Lamina arcopallialis dorsalis
(LAD; Figures 2b–d, 3b–e). Additionally, AD could be further subdi-
vided into the intra-nuclear structures lateral arcopallium dorsale (ADl)
and medial arcopallium dorsale (ADm) based on different myelo-
architectures (Figure 3b–l). Particularly, crossing fibers from the tractus
dorsoarcopallialis (DA) demarcated ADl. The cyto- and myeloarchitec-
ture of AI differed conspicuously from the surrounding regions. AI cells
showed relatively large cell bodies compared to the other arcopallial
regions (Figures 4–6). Further, many thick fibers that join the tractus
occipitomesencephalicus (OM) characterized AI (Figure 3b–f, h–l). The
finer and thinner fibers seen at the more posterior levels of AI belong
to the tractus occipitomesencephalicus, pars hypothalami (HOM; Fig-
ure 3f, l). Additionally, a dorsal and a ventral part of AI (AId and AIv)
were noticed. AId mostly corresponds to Aidv while AIv corresponds to
Ai as defined in Kr€oner and G€unt€urk€un (1999). Both substructures dif-
fer in their cellular- and myelo-architecture, with thinner fibers in AId
compared to AIv (Figure 3b–f, h–l). As described earlier, AV showed
differences in the cellular architecture and connectivity compared to
the surrounding regions AI, AM, and PoAb (Zeier & Karten, 1971,
Kr€oner & G€unt€urk€un, 1999; Atoji et al., 2006; Shanahan et al., 2013,
Letzner, Simon, & G€unt€urk€un, 2016). Particularly, the cross sections of
thick fibers that travel along the anterior posterior axis around atlas
level 6.75 and pass across AV at more anterior levels characterized the
shape of AV. Around atlas levels 7.50–7.25 an intra-nuclear substruc-
ture was detectable, which we named the medial part of the arcopal-
lium ventral (AVm). AVm showed larger cell bodies compared to AV
(Figure 4a–c) and thick fiber bundles that join OM (Figure 3b, c, h–i).
According to Atoji and colleagues (2006, 2009), AM was subdivided
into a medially located cell-dense, dark stained division with large cells
(AMm) and a less cell-dense, parvocellular division (AMp) located later-
ally (Figures 2c–f, i–l, 5g, h, 6d). AMp was further characterized by a
many thick fibers that travel through AM in the median axis (Figure
3d–f, j–l). The most caudal part of the arcopallium is a small, crescent-
shaped subregion of the arcopallium that begins around atlas level 5.25
and is located between the amygdala nuclei PoAc and PoAb (FiguresTABLE2
Neu
rotran
smitterreceptorde
nsities(fmol/mgprotein)in
differen
tsubreg
ions
ofthearco
pallium
/amyg
dala
complex
,thenido
pallium
caud
aleve
ntro-lateralean
dtheposteriorlateral
striatum
(mea
n6SE
M)an
dresultsoftheFried
man
ANOVAdisplaying
regiona
ldifferen
cesforallsubreg
ions
forea
chreceptortype
(allN56,d
f510;LS
tnotincluded
)
Subreg
ion/
Rec
eptor
AA
AD
AM
AI
AV
AP
PoAb
PoAc
TnA
SpA
NCVl
LSt
Fried
man
ANOVA
(v2)
AMPA
13256133
15516101
16016
62
1534677
17226
87
1651685
1264693
16106
105
14036
164
11476100
1554698
1438647
28.82**
Kaina
te7746160
3236
30
2756
35
362635
7966
81
266626
316639
3336
18
225638
636637
2566
30
878641
43.21***
NMDA
12386248
1330652
13386
29
1234651
16906
79
1478675
13596126
16856
107
11336
58
741654
1589678
1205650
44.52***
GABAA
9066196
5356
50
4146
48
654660
6776
63
402640
361643
5776
76
332634
578648
6056
86
1539676
43.82***
M1
107620
1726
11
64611
115610
426
34865
546
15
616
42767
56612
426
978611
43.21***
M2
235642
3596
34
2006
17
324633
1296
17
185625
986
16
1426
18
206625
327647
1516
36
390639
45.67***
a4b2
4162
416
34761
4162
586
46266
526
3696
47263
5765
516
55964
40.00***
a1
1364
176
21462
1061
116
11064
106
21106
16
762
1362
786
51462
37.36***
a2
231632
2706
20
2476
722166
1216
95906130
233617
2546
14
831649
415627
2066
38
347620
41.67***
5-H
T1A
86622
646
45465
9668
776
54166
406
5996
13
4363
4064
656
83462
41.55***
D1/5
41618
226
11962
2062
166
12664
146
1356
41461
1661
336
54162
35.76***
*p<.05,**p<.01,***p
<.001.Abb
reviations
seelist.
HEROLD ET AL. The Journal ofComparative Neurology
| 443
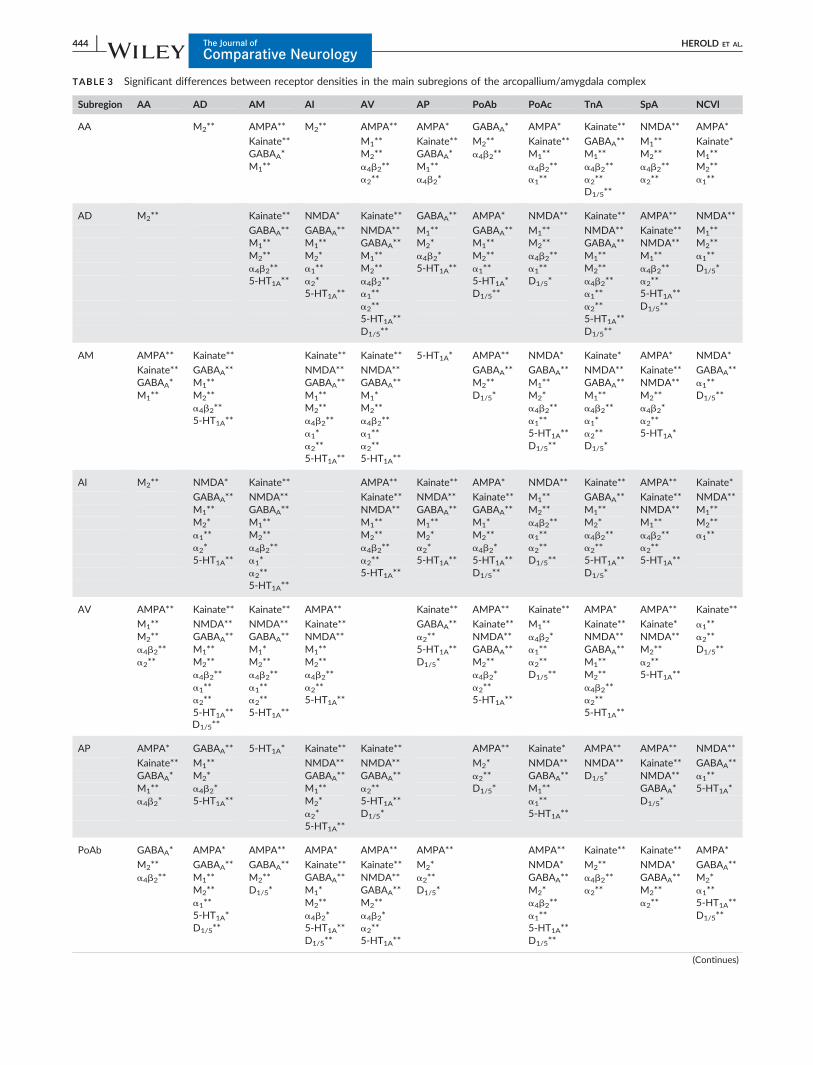
TABLE 3 Significant differences between receptor densities in the main subregions of the arcopallium/amygdala complex
Subregion AA AD AM AI AV AP PoAb PoAc TnA SpA NCVl
AA M2** AMPA** M2** AMPA** AMPA* GABAA* AMPA* Kainate** NMDA** AMPA*
Kainate** M1** Kainate** M2** Kainate** GABAA** M1** Kainate*GABAA* M2** GABAA* a4b2** M1** M1** M2** M1**M1** a4b2** M1** a4b2** a4b2** a4b2** M2**
a2** a4b2* a1** a2** a2** a1**D1/5**
AD M2** Kainate** NMDA* Kainate** GABAA** AMPA* NMDA** Kainate** AMPA** NMDA**
GABAA** GABAA** NMDA** M1** GABAA** M1** NMDA** Kainate** M1**M1** M1** GABAA** M2* M1** M2** GABAA** NMDA** M2**M2** M2* M1** a4b2* M2** a4b2** M1** M1** a1**a4b2** a1** M2** 5-HT1A** a1** a1** M2** a4b2** D1/5*5-HT1A** a2* a4b2** 5-HT1A* D1/5* a4b2** a2**
5-HT1A** a1** D1/5** a1** 5-HT1A**a2** a2** D1/5**5-HT1A** 5-HT1A**D1/5** D1/5**
AM AMPA** Kainate** Kainate** Kainate** 5-HT1A* AMPA** NMDA* Kainate* AMPA* NMDA*
Kainate** GABAA** NMDA** NMDA** GABAA** GABAA** NMDA** Kainate** GABAA**GABAA* M1** GABAA** GABAA** M2** M1** GABAA** NMDA** a1**M1** M2** M1** M1* D1/5* M2* M1** M2** D1/5**
a4b2** M2** M2** a4b2** a4b2** a4b2*5-HT1A** a4b2** a4b2** a1** a1* a2**
a1* a1** 5-HT1A** a2** 5-HT1A*a2** a2** D1/5** D1/5*5-HT1A** 5-HT1A**
AI M2** NMDA* Kainate** AMPA** Kainate** AMPA* NMDA** Kainate** AMPA** Kainate*
GABAA** NMDA** Kainate** NMDA** Kainate** M1** GABAA** Kainate** NMDA**M1** GABAA** NMDA** GABAA** GABAA** M2** M1** NMDA** M1**M2* M1** M1** M1** M1* a4b2** M2* M1** M2**a1** M2** M2** M2* M2** a1** a4b2** a4b2** a1**a2* a4b2** a4b2** a2* a4b2* a2** a2** a2**5-HT1A** a1* a2** 5-HT1A** 5-HT1A** D1/5** 5-HT1A** 5-HT1A**
a2** 5-HT1A** D1/5** D1/5*5-HT1A**
AV AMPA** Kainate** Kainate** AMPA** Kainate** AMPA** Kainate** AMPA* AMPA** Kainate**
M1** NMDA** NMDA** Kainate** GABAA** Kainate** M1** Kainate** Kainate* a1**M2** GABAA** GABAA** NMDA** a2** NMDA** a4b2* NMDA** NMDA** a2**a4b2** M1** M1* M1** 5-HT1A** GABAA** a1** GABAA** M2** D1/5**a2** M2** M2** M2** D1/5* M2** a2** M1** a2**
a4b2** a4b2** a4b2** a4b2* D1/5** M2** 5-HT1A**a1** a1** a2** a2** a4b2**a2** a2** 5-HT1A** 5-HT1A** a2**5-HT1A**D1/5**
5-HT1A** 5-HT1A**
AP AMPA* GABAA** 5-HT1A* Kainate** Kainate** AMPA** Kainate* AMPA** AMPA** NMDA**
Kainate** M1** NMDA** NMDA** M2* NMDA** NMDA** Kainate** GABAA**GABAA* M2* GABAA** GABAA** a2** GABAA** D1/5* NMDA** a1**M1** a4b2* M1** a2** D1/5* M1** GABAA* 5-HT1A*a4b2* 5-HT1A** M2* 5-HT1A** a1** D1/5*
a2* D1/5* 5-HT1A**5-HT1A**
PoAb GABAA* AMPA* AMPA** AMPA* AMPA** AMPA** AMPA** Kainate** Kainate** AMPA*
M2** GABAA** GABAA** Kainate** Kainate** M2* NMDA* M2** NMDA* GABAA**a4b2** M1** M2** GABAA** NMDA** a2** GABAA** a4b2** GABAA** M2*
M2** D1/5* M1* GABAA** D1/5* M2* a2** M2** a1**a1** M2** M2** a4b2** a2** 5-HT1A**5-HT1A* a4b2* a4b2* a1** D1/5**D1/5** 5-HT1A** a2** 5-HT1A**
D1/5** 5-HT1A** D1/5**
(Continues)
444 | The Journal ofComparative Neurology
HEROLD ET AL.
2e, f, k, l, 6). It was also described in Atoji et al. (2006) as the posterior
part of AI. AP has a different connectivity from PoAc and PoAb (Atoji
et al., 2006) and showed cells with larger cell bodies if compared to
PoAc. Cells in PoAb also showed large cell bodies, but cells were less
dense and patchier distributed compared to AP (Figure 6e, f). AP and
AI differed considerably in their myelo-architecture. AP showed intra
nuclear thin fiber labeling and no larger crossing fibers like AI.
The amygdala nuclei were subdivided into the area subpallialis
amygdalae (SpA), which is a subpallial part of the extended amygdala in
birds (Yamamoto et al., 2005), the nucleus taeniae amgygdalae (TnA;
Reiner et al., 2004) and according to Atoji and colleagues (2006) in a
basal and a compact division of the nucleus posterioris amygdalopallii
(PoAb and PoAc). Further, we included the bed nucleus of the stria ter-
minals pars lateralis (BSTL), that was defined based on its cytoarchitec-
tonic characteristics that have been described in detail earlier (Atoji
et al., 2006). The borders of TnA were nicely resolved with the cell
staining and TnA could be distinguished from the surrounding areas by
its small-sized cells (Figures 2c, 5b). The myelin staining showed thin
fibers in TnA and a few thick fibers but with a smaller diameter
compared to AI and AM that travel along the anterior–posterior axis of
TnA at the border to AM (fascicles from OM; Figure 3d, e). Both, PoAc
and PoAb differed considerably in their cyto- and myelo-architecture
(Figures 2d–f, 3d–f). While PoAc showed a compact mass of small cells,
PoAb is speckled with cells with larger cell bodies (Figures 6c, e). Further,
PoAb is characterized by thin and short fibers that were often transver-
sally directed, while in PoAc many longitudinal fibers were detected.
3.2 | Quantitative analysis of the receptor-binding site
densities in the arcopallium/amygdala complex
Quantitative receptor data of the arcopallium/amygdala complex is pre-
sented in form of color-coded autoradiographs for each receptor at dif-
ferent atlas levels of a series of five cross sections with a gap of
approximately 500 mm between each slice to highlight the regional dif-
ferences in receptor expression that nicely resolve distinct subregions
and intra-nuclear substructures (Figures 7–10). Additionally, binding
site densities of all receptors6 SEM are presented in a 2-dimensional
polar coordinate-plot to construct a multi-receptor fingerprint for each
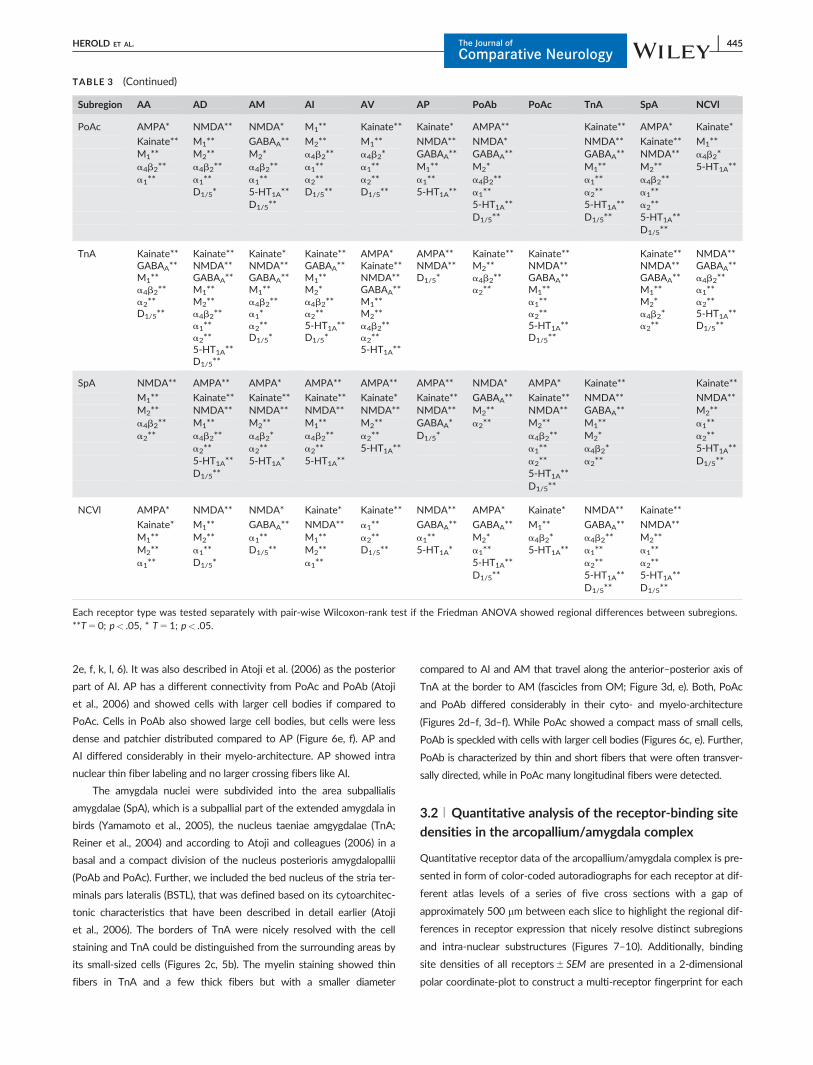
TABLE 3 (Continued)
Subregion AA AD AM AI AV AP PoAb PoAc TnA SpA NCVl
PoAc AMPA* NMDA** NMDA* M1** Kainate** Kainate* AMPA** Kainate** AMPA* Kainate*
Kainate** M1** GABAA** M2** M1** NMDA** NMDA* NMDA** Kainate** M1**M1** M2** M2* a4b2** a4b2* GABAA** GABAA** GABAA** NMDA** a4b2*a4b2** a4b2** a4b2** a1** a1** M1** M2* M1** M2** 5-HT1A**a1** a1** a1** a2** a2** a1** a4b2** a1** a4b2**
D1/5* 5-HT1A** D1/5** D1/5** 5-HT1A** a1** a2** a1**D1/5** 5-HT1A** 5-HT1A** a2**
D1/5** D1/5** 5-HT1A**D1/5**
TnA Kainate**GABAA**M1**a4b2**a2**D1/5**
Kainate**NMDA**GABAA**M1**M2**a4b2**a1**a2**5-HT1A**D1/5**
Kainate*NMDA**GABAA**M1**a4b2**a1*a2**D1/5*
Kainate**GABAA**M1**M2*a4b2**a2**5-HT1A**D1/5*
AMPA*Kainate**NMDA**GABAA**M1**M2**a4b2**a2**5-HT1A**
AMPA**NMDA**D1/5*
Kainate**M2**a4b2**a2**
Kainate**NMDA**GABAA**M1**a1**a2**5-HT1A**D1/5**
Kainate**NMDA**GABAA**M1**M2*a4b2*a2**
NMDA**GABAA**a4b2**a1**a2**5-HT1A**D1/5**
SpA NMDA** AMPA** AMPA* AMPA** AMPA** AMPA** NMDA* AMPA* Kainate** Kainate**
M1** Kainate** Kainate** Kainate** Kainate* Kainate** GABAA** Kainate** NMDA** NMDA**M2** NMDA** NMDA** NMDA** NMDA** NMDA** M2** NMDA** GABAA** M2**a4b2** M1** M2** M1** M2** GABAA* a2** M2** M1** a1**a2** a4b2** a4b2* a4b2** a2** D1/5* a4b2** M2* a2**
a2** a2** a2** 5-HT1A** a1** a4b2* 5-HT1A**5-HT1A** 5-HT1A* 5-HT1A** a2** a2** D1/5**D1/5** 5-HT1A**
D1/5**
NCVl AMPA* NMDA** NMDA* Kainate* Kainate** NMDA** AMPA* Kainate* NMDA** Kainate**
Kainate* M1** GABAA** NMDA** a1** GABAA** GABAA** M1** GABAA** NMDA**M1** M2** a1** M1** a2** a1** M2* a4b2* a4b2** M2**M2** a1** D1/5** M2** D1/5** 5-HT1A* a1** 5-HT1A** a1** a1**a1** D1/5* a1** 5-HT1A** a2** a2**
D1/5** 5-HT1A** 5-HT1A**D1/5** D1/5**
Each receptor type was tested separately with pair-wise Wilcoxon-rank test if the Friedman ANOVA showed regional differences between subregions.**T5 0; p< .05, * T5 1; p< .05.
HEROLD ET AL. The Journal ofComparative Neurology
| 445
analyzed subregion (Figure 11a–l). We also present the receptor data
for the adjacent areas of the arcopallium/amygdala complex, the poste-
rior lateral striatum (LSt, from atlas level A 6.75–6.25; Figure 11c) and
the lateral division of the nidopallium caudoventrale (NCVl); Figure 11i).
Data for the intra-nuclear substructures is provided separately in histo-
grams (Figure 12a–k). Detailed numbers of receptor densities and sta-
tistics are summarized in Tables 2 and 3. In the following subsections,
we describe the highlights in receptor densities that resolved the differ-
ent subregions and intra-nuclear structures one by one.
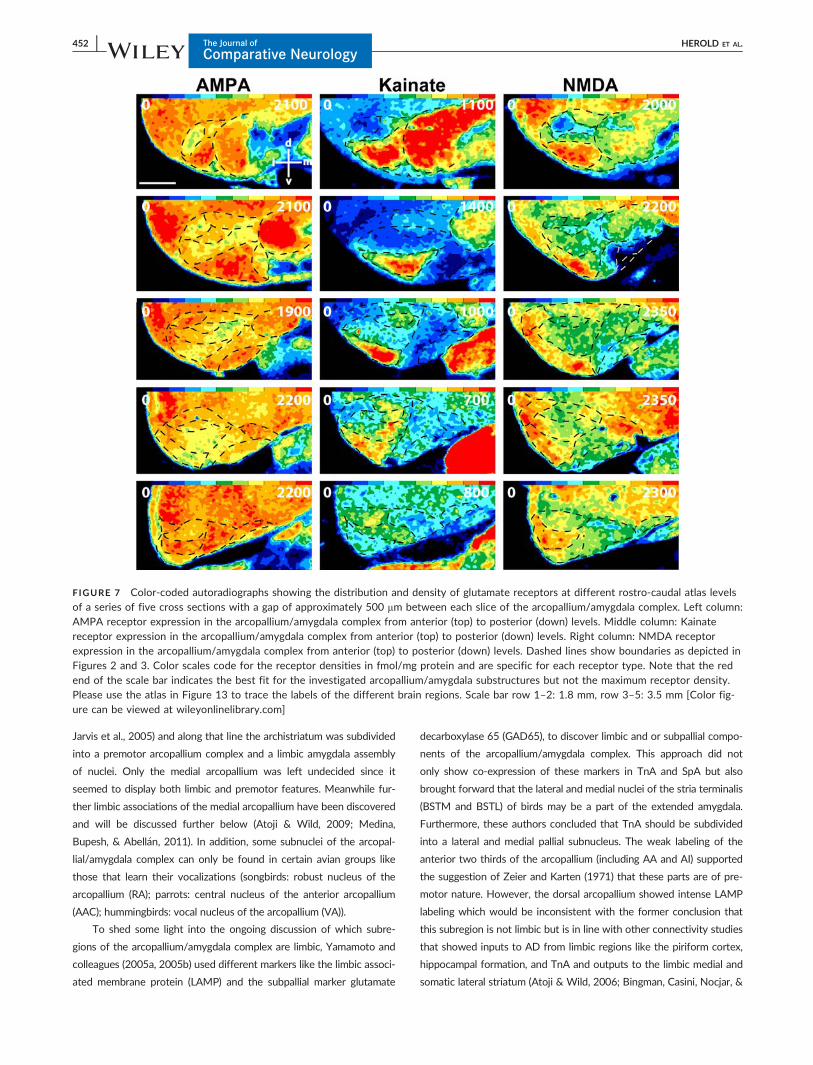
AA The anterior tip of the arcopallium is high in AMPA, kainate
and GABAA receptor densities (Table 2). In contrast to the surrounding
regions AD and AI, AA expressed lower M2-receptor densities and a
trend towards higher kainate receptor densities was detected. If com-
pared to AV, higher M1, M2 and a2-receptor and lower AMPA and
nACh (a4b2 subtype) receptor levels were found (Tables 2 & 3). The
overall receptor expression was comparable to AD and AI (Figures 11
a, d, e; Tables 2, 3).
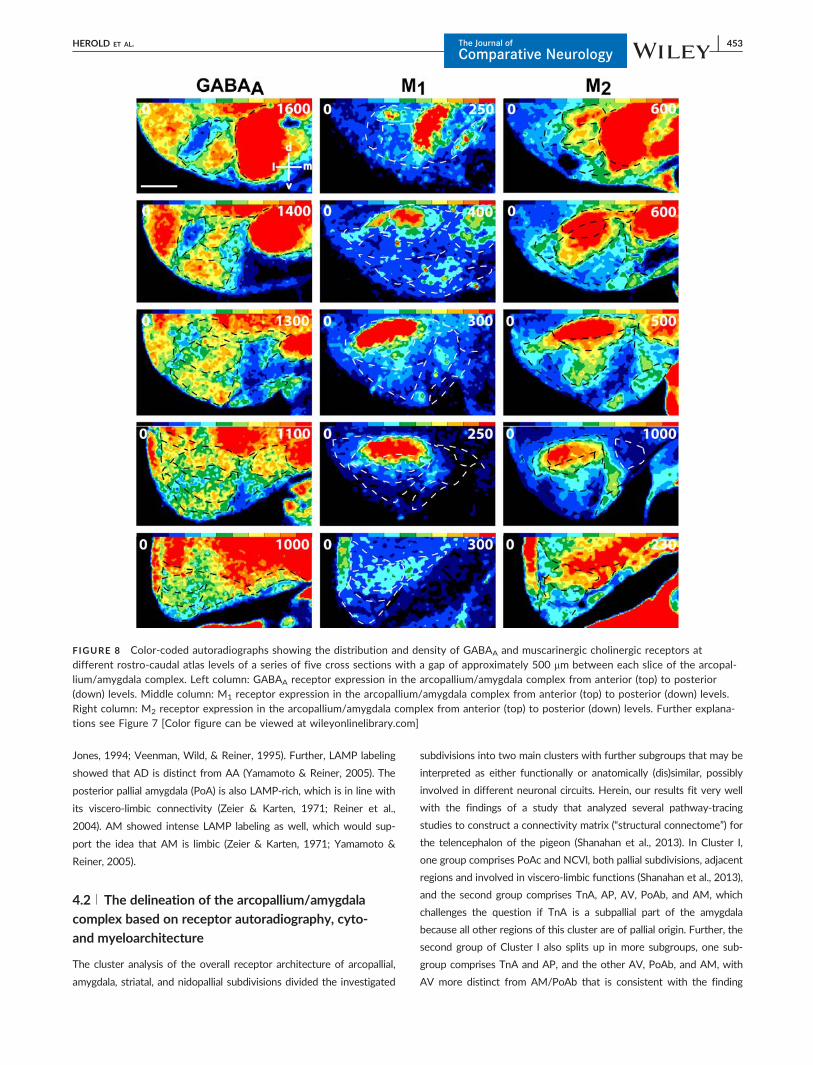
AD Receptor densities in AD differed from the dorsally located
PoAc for NMDA, M1, M2, nACh (a4b2 subtype), a1- and D1/5 receptors
(Figures 7–10; Table 3). Additionally, AD had conspicuously high M1
and M2 receptor densities if compared to the other arcopallial regions
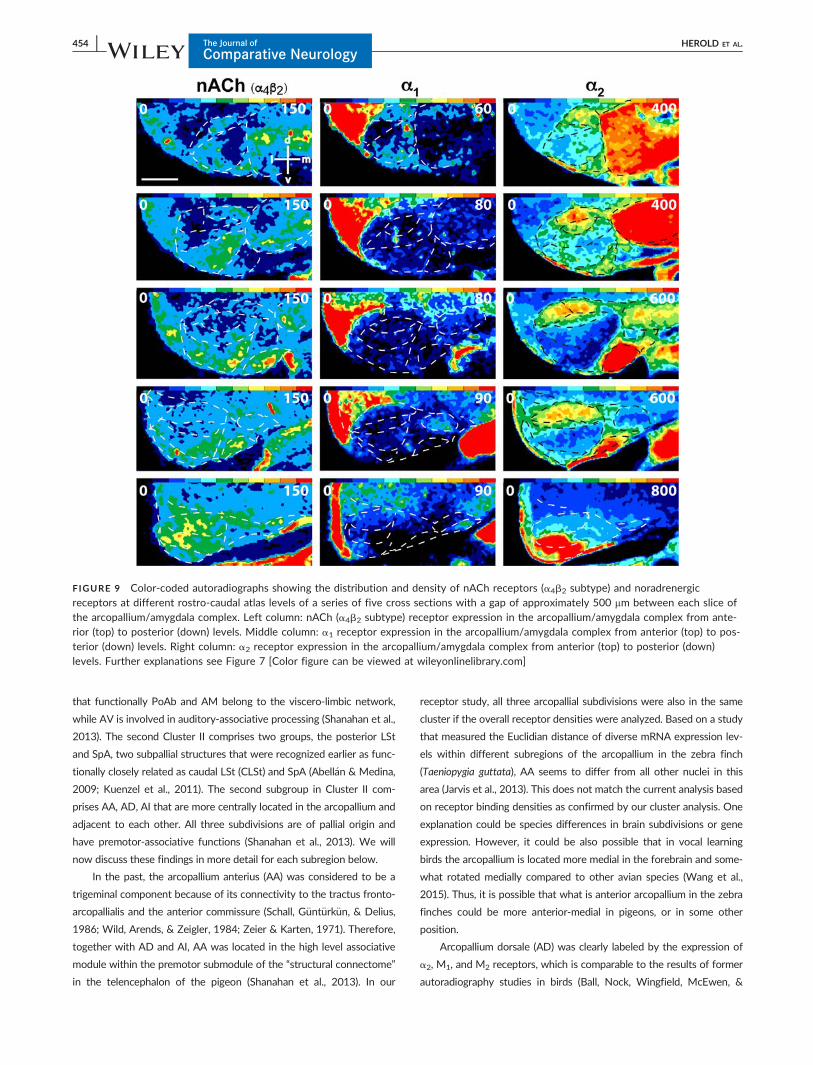
(Figure 8; Table 2) and a2-receptor expression rendered distinctively
the crescent structure of AD (Figure 9). Except AMPA receptors, all
measured receptors were differentially expressed in AD compared to
AV (Figures 7–10; Tables 2, 3). The fingerprints of AD and AI appeared
very similar (Figure 11d, e). ADl and ADm differed in kainate, NMDA,
GABAA, and 5-HT1A receptors (Figure 12b–d, j). This delineation was
primarily observed with the heterogeneously distribution of kainate
receptors in ADl and ADm (Figure 7).
AI AI showed higher densities of M2 receptors and lower densities
of kainate receptors compared to the ventral region of the arcopallium
(Figures 7, 8; Tables 2, 3). GABAA receptor expression was higher in AI
compared to AM, AD, and AP and nicely resolved the borders to these
neighboring regions (Figure 8). Further, the borders of the intermediate
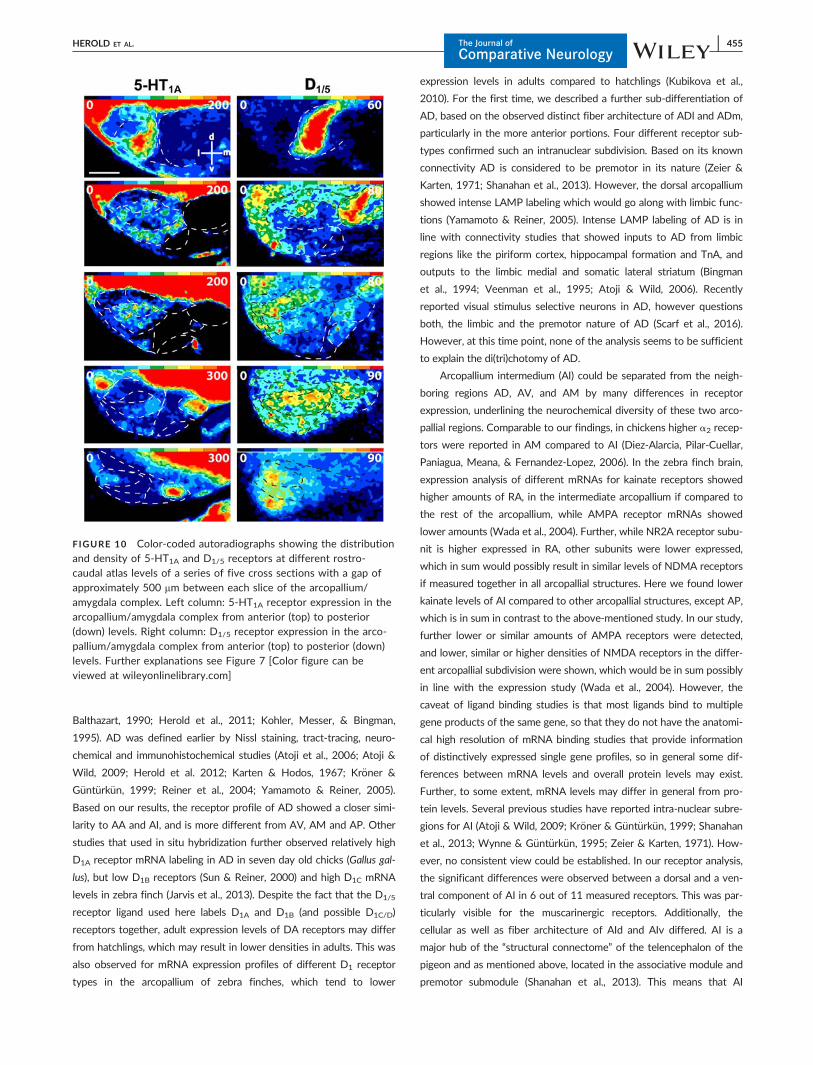
arcopallial region were covered with a higher 5-HT1A-receptor density
compared to the surrounding regions (Figure 10). The sub differentia-
tion of AI into AId and AIv was supported by six significant differences
in receptor binding sites (Figure 12c–f, i, j) and highlighted by a higher
M1-, M2- a2-, and 5-HT1A-receptor expression in AId (Figures 8–10).
AV A high kainate receptor density delineates the ventral arcopal-
lium from the dorsally located regions AI and AD and the medially
located regions AM and TnA (Figure 7). AV additionally showed higher
AMPA receptor densities if compared to AA, AI, TnA, SpA, and PoAb,
and higher NMDA receptor densities if compared to AD, AI, AM, AP,
PoAb, TnA, and SpA (Figure 7; Tables 2, 3). Further, a high GABAA
receptor expression and relatively low M2 receptor densities compared
to the other arcopallial regions characterized AV (Figure 8; Tables 2, 3).
AVm differed in kainate-, NMDA-, GABAA-, M1-, a2-, 5-HT1A-, and D1/
5- receptor densities from AV and AVm showed particularly lower
GABAA receptor amounts if compared to AV (Figures 8, 12b–e, i–k).
AM Kainate and GABAA receptors showed relatively low levels in
the medial arcopallium if compared to the other arcopallial regions,
except AP (Figures 7, 8). AMPA receptor expression in AM was compa-
rable to AD, AV and AP, and higher compared to AA and AI and the
ventrally located TnA (Figure 7; Tables 2, 3). The receptor architecture
of AM was different if compared to the other arcopallial regions AI and
AV (Tables 2, 3) that is also visualized in the receptor fingerprint (Figure
11d, e, g). The substructures AMm and AMp were nicely resolved by
the heterogeneously distribution of NMDA and 5-HT1A receptors in
AM (Figures 7, 10) and receptor densities differed in 8 out of the 11
measured types (Figure 12a–k).
AP AP differed from AI by its higher amounts of NMDA, a2 and
lower amounts of kainate, GABAA, M1, M2, and 5-HT1A receptors (Figures
7–11e, l; Tables 2, 3). Particularly, the glutamatergic receptors demarcated
PoAc, AP and PoAb (Figure 7; Tables 2, 3), and a2 receptors showed
intense labeling of AP compared to PoAc (Figure 9; Tables 2, 3). AP
showed only a significant difference in 5-HT1A receptor expressions com-
pared to AM, but further comparisons between both regions indicated
differences by a trend for NMDA, a4b2 and a2 receptor densities. The
overall receptor architecture of AP is highly similar to AM (Figure 11g, l).
PoA High densities of kainate, a1, 5-HT1A or D1/5 receptors high-
lighted PoAc if compared to the surrounding structures AD, AP and
NCVl (Figures 7, 9, 10; Tables 2, 3), whereas PoAb was separated from
AV by lower AMPA, kainate, NMDA, GABAA, M2, nACh (a4b2 subtype)
and 5-HT1A receptor densities (Figures 7–10; Tables 2, 3). PoAc and
PoAb differed significantly from each other in AMPA, NMDA, GABAA,
M2, nACh (a4b2 subtype), a1, 5-HT1A and D1/5 receptor densities (Fig-
ure 12a, c–d, f–h, j–k; Tables 2, 3).
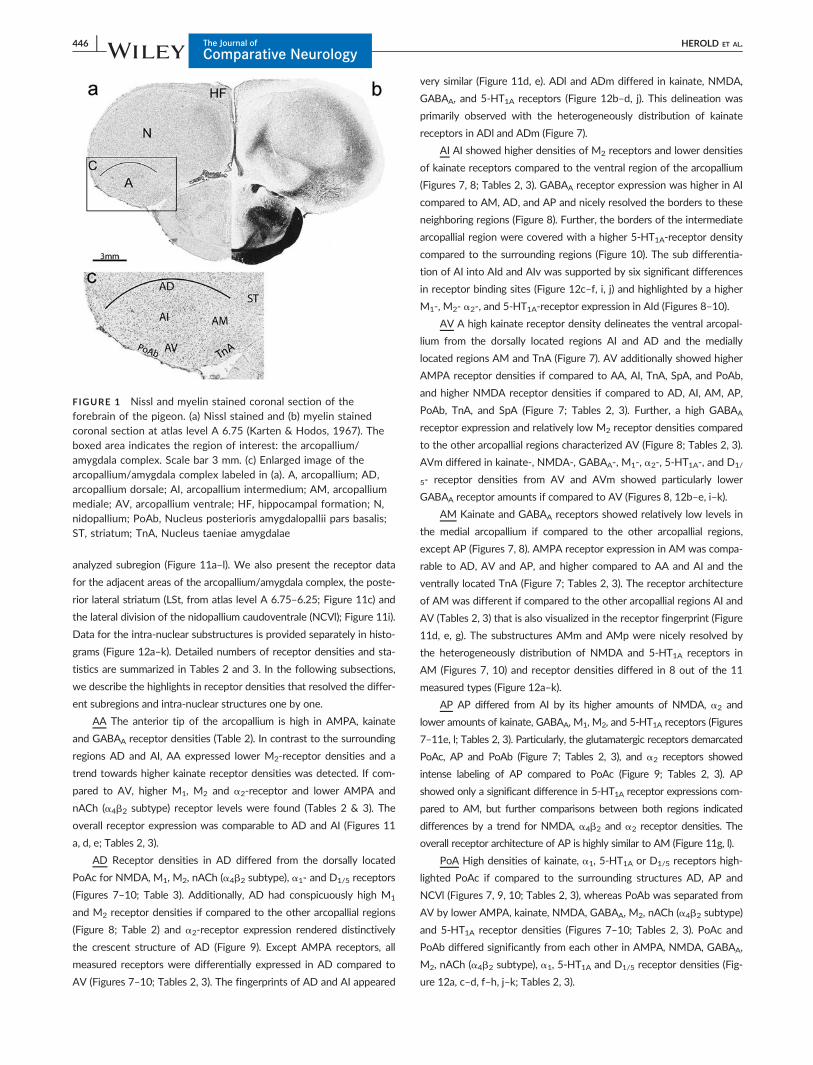
FIGURE 1 Nissl and myelin stained coronal section of theforebrain of the pigeon. (a) Nissl stained and (b) myelin stainedcoronal section at atlas level A 6.75 (Karten & Hodos, 1967). Theboxed area indicates the region of interest: the arcopallium/amygdala complex. Scale bar 3 mm. (c) Enlarged image of thearcopallium/amygdala complex labeled in (a). A, arcopallium; AD,arcopallium dorsale; AI, arcopallium intermedium; AM, arcopalliummediale; AV, arcopallium ventrale; HF, hippocampal formation; N,nidopallium; PoAb, Nucleus posterioris amygdalopallii pars basalis;ST, striatum; TnA, Nucleus taeniae amygdalae
446 | The Journal ofComparative Neurology
HEROLD ET AL.
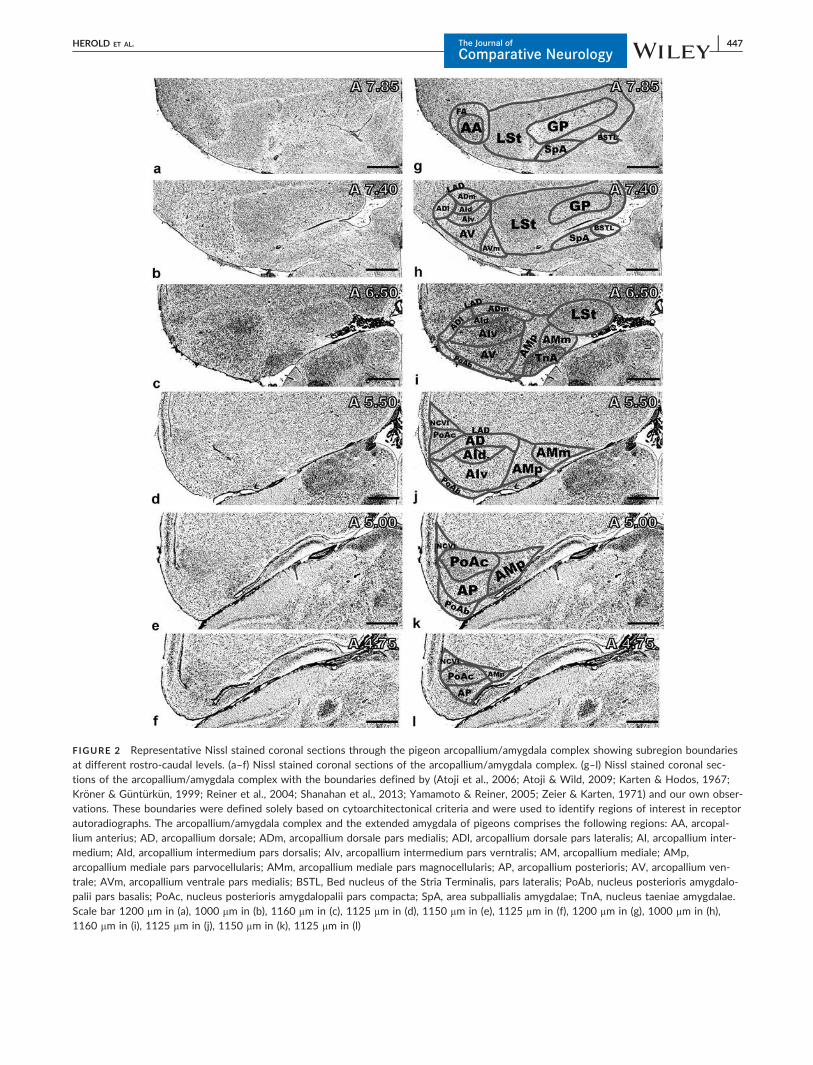
FIGURE 2 Representative Nissl stained coronal sections through the pigeon arcopallium/amygdala complex showing subregion boundariesat different rostro-caudal levels. (a–f) Nissl stained coronal sections of the arcopallium/amygdala complex. (g–l) Nissl stained coronal sec-tions of the arcopallium/amygdala complex with the boundaries defined by (Atoji et al., 2006; Atoji & Wild, 2009; Karten & Hodos, 1967;Kr€oner & G€unt€urk€un, 1999; Reiner et al., 2004; Shanahan et al., 2013; Yamamoto & Reiner, 2005; Zeier & Karten, 1971) and our own obser-vations. These boundaries were defined solely based on cytoarchitectonical criteria and were used to identify regions of interest in receptorautoradiographs. The arcopallium/amygdala complex and the extended amygdala of pigeons comprises the following regions: AA, arcopal-lium anterius; AD, arcopallium dorsale; ADm, arcopallium dorsale pars medialis; ADl, arcopallium dorsale pars lateralis; AI, arcopallium inter-medium; AId, arcopallium intermedium pars dorsalis; AIv, arcopallium intermedium pars verntralis; AM, arcopallium mediale; AMp,arcopallium mediale pars parvocellularis; AMm, arcopallium mediale pars magnocellularis; AP, arcopallium posterioris; AV, arcopallium ven-trale; AVm, arcopallium ventrale pars medialis; BSTL, Bed nucleus of the Stria Terminalis, pars lateralis; PoAb, nucleus posterioris amygdalo-palii pars basalis; PoAc, nucleus posterioris amygdalopalii pars compacta; SpA, area subpallialis amygdalae; TnA, nucleus taeniae amygdalae.Scale bar 1200 mm in (a), 1000 mm in (b), 1160 mm in (c), 1125 mm in (d), 1150 mm in (e), 1125 mm in (f), 1200 mm in (g), 1000 mm in (h),1160 mm in (i), 1125 mm in (j), 1150 mm in (k), 1125 mm in (l)
HEROLD ET AL. The Journal ofComparative Neurology
| 447
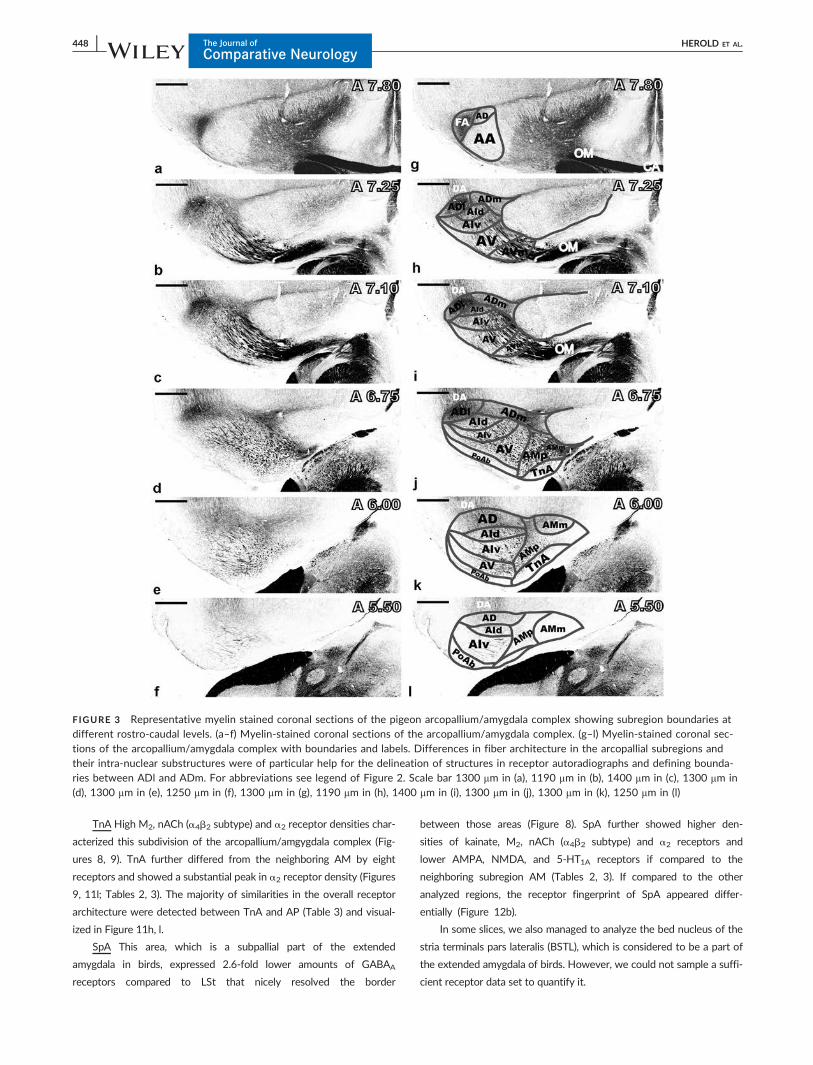
TnA High M2, nACh (a4b2 subtype) and a2 receptor densities char-
acterized this subdivision of the arcopallium/amgygdala complex (Fig-
ures 8, 9). TnA further differed from the neighboring AM by eight
receptors and showed a substantial peak in a2 receptor density (Figures
9, 11l; Tables 2, 3). The majority of similarities in the overall receptor
architecture were detected between TnA and AP (Table 3) and visual-
ized in Figure 11h, l.
SpA This area, which is a subpallial part of the extended
amygdala in birds, expressed 2.6-fold lower amounts of GABAA
receptors compared to LSt that nicely resolved the border
between those areas (Figure 8). SpA further showed higher den-
sities of kainate, M2, nACh (a4b2 subtype) and a2 receptors and
lower AMPA, NMDA, and 5-HT1A receptors if compared to the
neighboring subregion AM (Tables 2, 3). If compared to the other
analyzed regions, the receptor fingerprint of SpA appeared differ-
entially (Figure 12b).
In some slices, we also managed to analyze the bed nucleus of the
stria terminals pars lateralis (BSTL), which is considered to be a part of
the extended amygdala of birds. However, we could not sample a suffi-
cient receptor data set to quantify it.
FIGURE 3 Representative myelin stained coronal sections of the pigeon arcopallium/amygdala complex showing subregion boundaries atdifferent rostro-caudal levels. (a–f) Myelin-stained coronal sections of the arcopallium/amygdala complex. (g–l) Myelin-stained coronal sec-tions of the arcopallium/amygdala complex with boundaries and labels. Differences in fiber architecture in the arcopallial subregions andtheir intra-nuclear substructures were of particular help for the delineation of structures in receptor autoradiographs and defining bounda-ries between ADl and ADm. For abbreviations see legend of Figure 2. Scale bar 1300 mm in (a), 1190 mm in (b), 1400 mm in (c), 1300 mm in(d), 1300 mm in (e), 1250 mm in (f), 1300 mm in (g), 1190 mm in (h), 1400 mm in (i), 1300 mm in (j), 1300 mm in (k), 1250 mm in (l)
448 | The Journal ofComparative Neurology
HEROLD ET AL.
The resulting new atlas from the AP coordinate A 7.75–4.50 is
based, therefore, on the overlay of cellular/fiber-architectonic and
receptor-density information, and is presented in Figure 13.
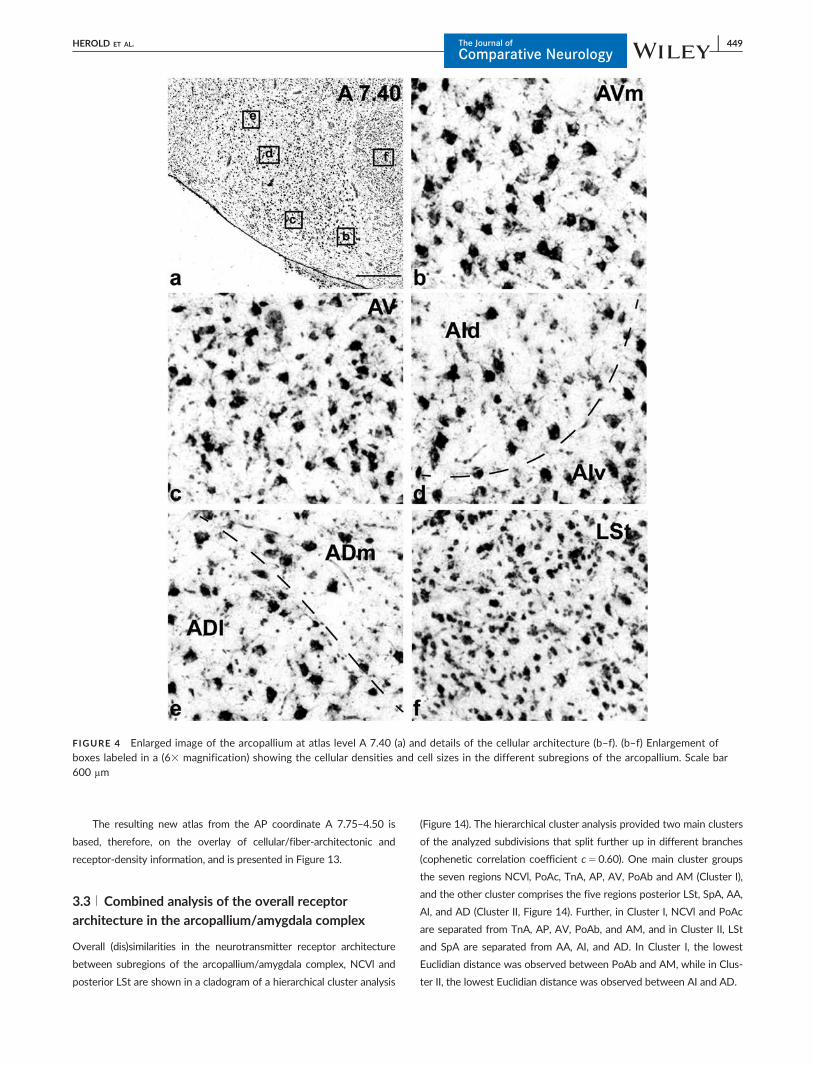
3.3 | Combined analysis of the overall receptor
architecture in the arcopallium/amygdala complex
Overall (dis)similarities in the neurotransmitter receptor architecture
between subregions of the arcopallium/amygdala complex, NCVl and
posterior LSt are shown in a cladogram of a hierarchical cluster analysis
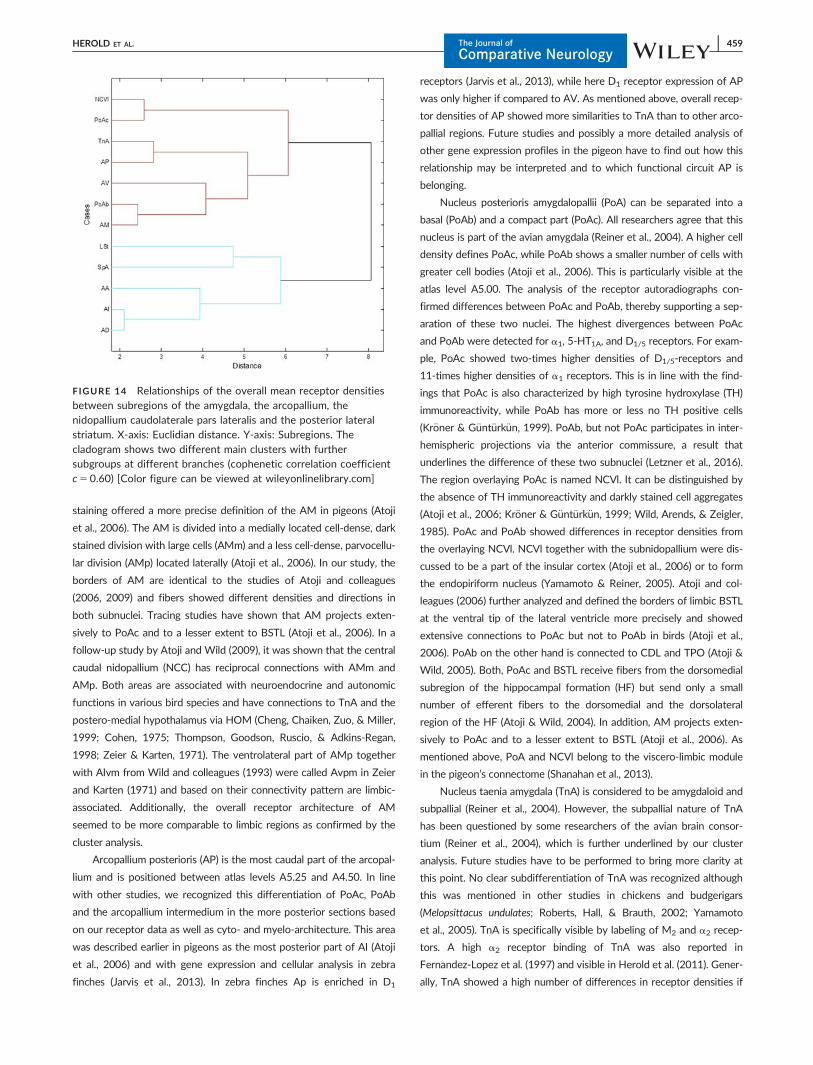
(Figure 14). The hierarchical cluster analysis provided two main clusters
of the analyzed subdivisions that split further up in different branches
(cophenetic correlation coefficient c50.60). One main cluster groups
the seven regions NCVl, PoAc, TnA, AP, AV, PoAb and AM (Cluster I),
and the other cluster comprises the five regions posterior LSt, SpA, AA,
AI, and AD (Cluster II, Figure 14). Further, in Cluster I, NCVl and PoAc
are separated from TnA, AP, AV, PoAb, and AM, and in Cluster II, LSt
and SpA are separated from AA, AI, and AD. In Cluster I, the lowest
Euclidian distance was observed between PoAb and AM, while in Clus-
ter II, the lowest Euclidian distance was observed between AI and AD.
FIGURE 4 Enlarged image of the arcopallium at atlas level A 7.40 (a) and details of the cellular architecture (b–f). (b–f) Enlargement ofboxes labeled in a (63 magnification) showing the cellular densities and cell sizes in the different subregions of the arcopallium. Scale bar
600 mm
HEROLD ET AL. The Journal ofComparative Neurology
| 449
4 | DISCUSSION
The regionally different receptor densities mapped well onto several
subregions of the arcopallium/amygdala complex in pigeons that have
been in part previously described based on connectivity data and cellu-
lar analysis (Atoji et al., 2006; Karten & Hodos, 1967; Kr€oner &
G€unt€urk€un, 1999; Puelles, Martinez-de-la-Torre, Paxinos, Watson, &
Martinez, 2007; Shanahan et al., 2013; Yamamoto et al., 2005). These
subregions are: the arcopallium anterius (AA), the arcopallium ventrale
(AV), the arcopallium dorsale (AD), the arcopallium intermedium (AI),
the arcopallium mediale (AM), the arcopallium posterius (AP), the
nucleus posterioris amygdalopallii pars basalis (PoAb) and pars com-
pacta (PoAc), the nucleus taeniae amgygdalae (TnA) and the area
subpallialis amygdalae (SpA). Based on our results, AV, AM, AD, and AI
can be further subdivided into intra-nuclear substructures. Several
important differences in receptor- cyto- and myelo-architecture high-
lighted the distinct subregions and intra-nuclear substructures that
resulted into a new map of the pigeon arcopallium/amygdala complex.
Together with data from previous studies, our results provide a high-
resolution scheme of the pigeon’s arcopallium/amygdala complex that
can be used for future structural and functional studies. This will also
improve the anatomic identification in different types of data sets from
genetic approaches to functional studies in various avian species, may
help to assess species-specific adaptations, and discover important
basic neurochemical traits that may be conserved in the arcopallium/
amygdala complex. Further, our data will facilitate the comparison
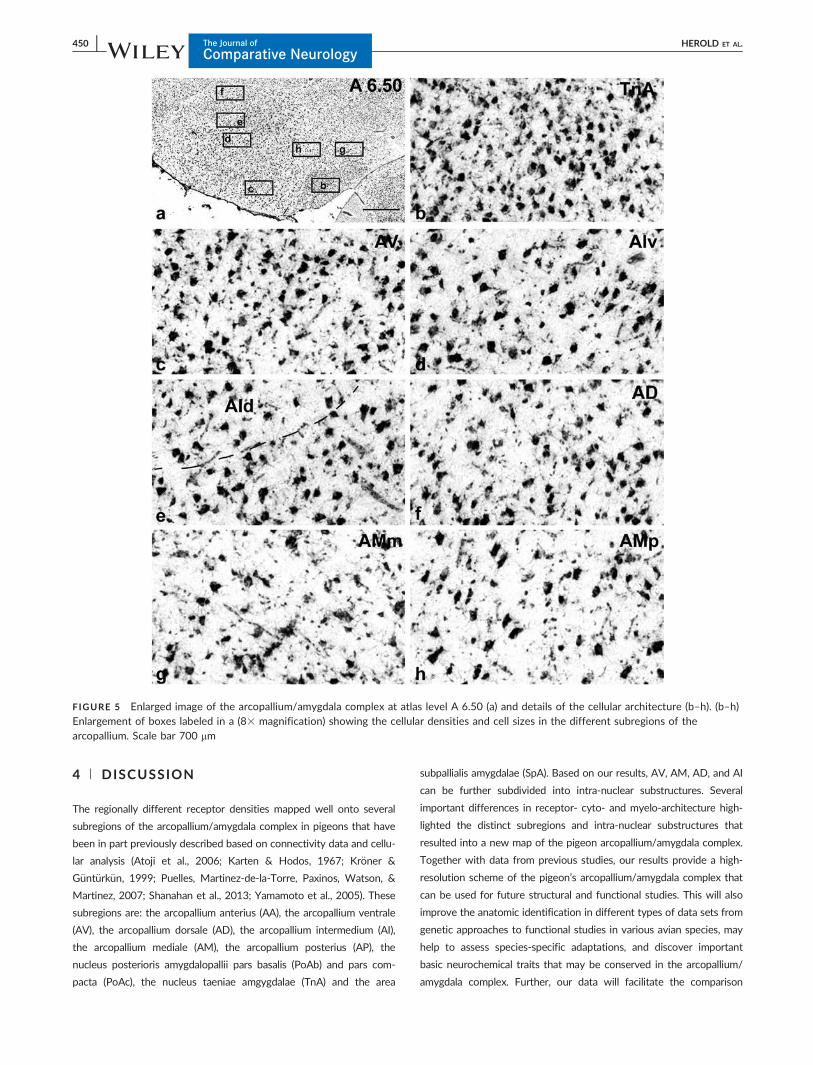
FIGURE 5 Enlarged image of the arcopallium/amygdala complex at atlas level A 6.50 (a) and details of the cellular architecture (b–h). (b–h)Enlargement of boxes labeled in a (83 magnification) showing the cellular densities and cell sizes in the different subregions of thearcopallium. Scale bar 700 mm
450 | The Journal ofComparative Neurology
HEROLD ET AL.
between the avian premotor and amygdala subregions with possibly
corresponding homolog or homoplastic mammalian structures.
4.1 | The avian arcopallium/amygdala complex:
previous studies and thoughts on homologies
According to the classic view of the 19th century, most of the avian
telencephalon was supposed to be homologous to the mammalian
basal ganglia (Edinger, 1896). This interpretation resulted in an avian
brain nomenclature were Greek prefixes and the root word ‘striatum’
were combined to label the different substructures of the bird telen-
cephalon (Ariens-Kappers, Huber, & Crosby, 1936; Edinger, 1903).
Accordingly, the caudal ventrolateral portion of the telencephalon was
termed archistriatum and suggested to be partly comparable to the
mammalian amygdala. Much later and based on connectivity data, Zeier
and Karten (1971) subdivided this area into four major regions: the
archistriatum anterior, intermedium (with a dorsal portion), posterior
(with a postero-ventral portion) and mediale. This delineation differs to
some extent from the pigeon atlas of Karten and Hodos (1967).
According to Zeier and Karten (1971) the posterior and medial archi-
striatum correspond to the amygdala since they are connected via the
tractus occipitomesencephalicus, pars hypothalami (HOM) to the hypo-
thalamus. In contrast, the archistriatum intermedium and anterior were
supposed to be part of the sensorimotor system since they lack limbic
projections and are connected via the tractus occipitomesencephalicus
(OM) to various sensory and motor entities of thalamus and brainstem.
According to Zeier and Karten (1971), only the anterior archistriatum
received fibers both from the anterior commissure and from the tractus
fronto-arcopallialis (FA), whereas the intermediate part received its
input from the tractus arcopallialis dorsalis (DA). However, a new study
revealed that the anterior commissure derives from both the anterior
and the intermediate arcopallium (Letzner et al., 2016). Over the years,
further subnuclei of the archistriatum were defined which will be dis-
cussed below.
At the beginning of the new millennium, neuroanatomists had
reached the consensus that the view of the striatally dominated bird
forebrain was outmoded and wrong. Accordingly, a revised nomencla-
ture of the avian telencephalon was conceived (Reiner et al., 2004;
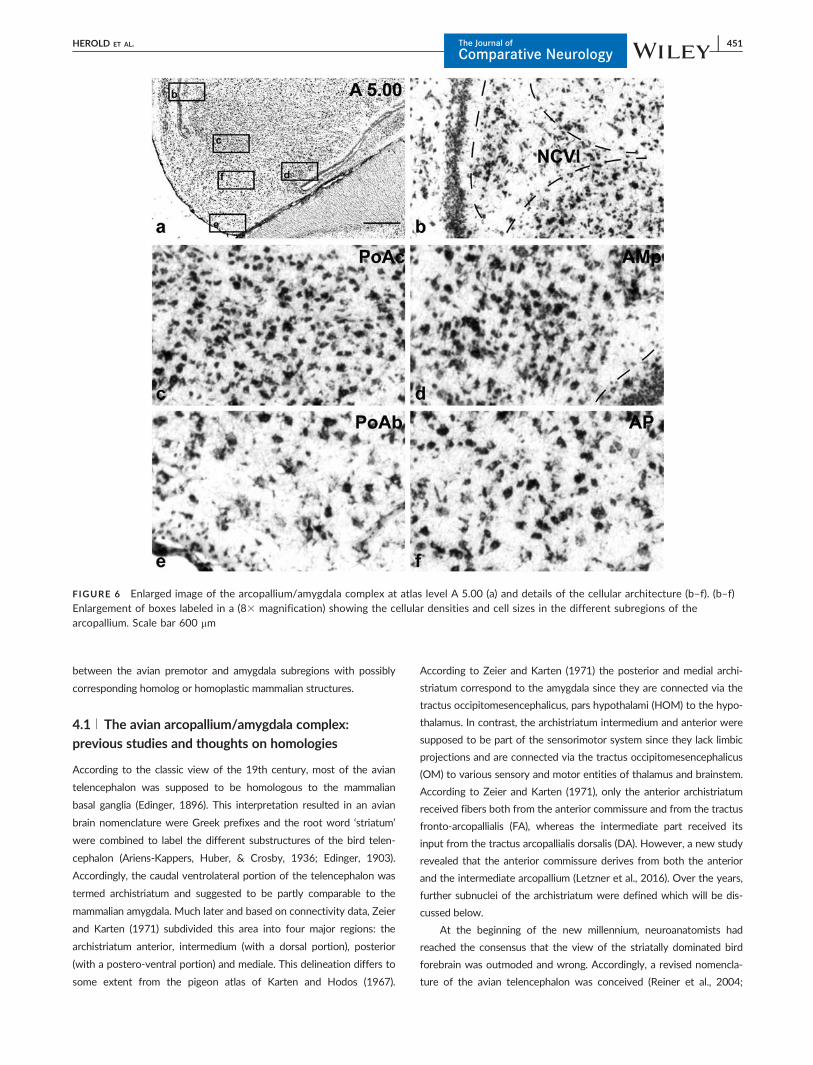
FIGURE 6 Enlarged image of the arcopallium/amygdala complex at atlas level A 5.00 (a) and details of the cellular architecture (b–f). (b–f)Enlargement of boxes labeled in a (83 magnification) showing the cellular densities and cell sizes in the different subregions of thearcopallium. Scale bar 600 mm
HEROLD ET AL. The Journal ofComparative Neurology
| 451
Jarvis et al., 2005) and along that line the archistriatum was subdivided
into a premotor arcopallium complex and a limbic amygdala assembly
of nuclei. Only the medial arcopallium was left undecided since it
seemed to display both limbic and premotor features. Meanwhile fur-
ther limbic associations of the medial arcopallium have been discovered
and will be discussed further below (Atoji & Wild, 2009; Medina,
Bupesh, & Abell�an, 2011). In addition, some subnuclei of the arcopal-
lial/amygdala complex can only be found in certain avian groups like
those that learn their vocalizations (songbirds: robust nucleus of the
arcopallium (RA); parrots: central nucleus of the anterior arcopallium
(AAC); hummingbirds: vocal nucleus of the arcopallium (VA)).
To shed some light into the ongoing discussion of which subre-
gions of the arcopallium/amygdala complex are limbic, Yamamoto and
colleagues (2005a, 2005b) used different markers like the limbic associ-
ated membrane protein (LAMP) and the subpallial marker glutamate
decarboxylase 65 (GAD65), to discover limbic and or subpallial compo-
nents of the arcopallium/amygdala complex. This approach did not
only show co-expression of these markers in TnA and SpA but also
brought forward that the lateral and medial nuclei of the stria terminalis
(BSTM and BSTL) of birds may be a part of the extended amygdala.
Furthermore, these authors concluded that TnA should be subdivided
into a lateral and medial pallial subnucleus. The weak labeling of the
anterior two thirds of the arcopallium (including AA and AI) supported
the suggestion of Zeier and Karten (1971) that these parts are of pre-
motor nature. However, the dorsal arcopallium showed intense LAMP
labeling which would be inconsistent with the former conclusion that
this subregion is not limbic but is in line with other connectivity studies
that showed inputs to AD from limbic regions like the piriform cortex,
hippocampal formation, and TnA and outputs to the limbic medial and
somatic lateral striatum (Atoji & Wild, 2006; Bingman, Casini, Nocjar, &
FIGURE 7 Color-coded autoradiographs showing the distribution and density of glutamate receptors at different rostro-caudal atlas levelsof a series of five cross sections with a gap of approximately 500 mm between each slice of the arcopallium/amygdala complex. Left column:AMPA receptor expression in the arcopallium/amygdala complex from anterior (top) to posterior (down) levels. Middle column: Kainatereceptor expression in the arcopallium/amygdala complex from anterior (top) to posterior (down) levels. Right column: NMDA receptorexpression in the arcopallium/amygdala complex from anterior (top) to posterior (down) levels. Dashed lines show boundaries as depicted inFigures 2 and 3. Color scales code for the receptor densities in fmol/mg protein and are specific for each receptor type. Note that the redend of the scale bar indicates the best fit for the investigated arcopallium/amygdala substructures but not the maximum receptor density.Please use the atlas in Figure 13 to trace the labels of the different brain regions. Scale bar row 1–2: 1.8 mm, row 3–5: 3.5 mm [Color fig-ure can be viewed at wileyonlinelibrary.com]
452 | The Journal ofComparative Neurology
HEROLD ET AL.
Jones, 1994; Veenman, Wild, & Reiner, 1995). Further, LAMP labeling
showed that AD is distinct from AA (Yamamoto & Reiner, 2005). The
posterior pallial amygdala (PoA) is also LAMP-rich, which is in line with
its viscero-limbic connectivity (Zeier & Karten, 1971; Reiner et al.,
2004). AM showed intense LAMP labeling as well, which would sup-
port the idea that AM is limbic (Zeier & Karten, 1971; Yamamoto &
Reiner, 2005).
4.2 | The delineation of the arcopallium/amygdala
complex based on receptor autoradiography, cyto-
and myeloarchitecture
The cluster analysis of the overall receptor architecture of arcopallial,
amygdala, striatal, and nidopallial subdivisions divided the investigated
subdivisions into two main clusters with further subgroups that may be
interpreted as either functionally or anatomically (dis)similar, possibly
involved in different neuronal circuits. Herein, our results fit very well
with the findings of a study that analyzed several pathway-tracing
studies to construct a connectivity matrix (“structural connectome”) for
the telencephalon of the pigeon (Shanahan et al., 2013). In Cluster I,
one group comprises PoAc and NCVl, both pallial subdivisions, adjacent
regions and involved in viscero-limbic functions (Shanahan et al., 2013),
and the second group comprises TnA, AP, AV, PoAb, and AM, which
challenges the question if TnA is a subpallial part of the amygdala
because all other regions of this cluster are of pallial origin. Further, the
second group of Cluster I also splits up in more subgroups, one sub-
group comprises TnA and AP, and the other AV, PoAb, and AM, with
AV more distinct from AM/PoAb that is consistent with the finding
FIGURE 8 Color-coded autoradiographs showing the distribution and density of GABAA and muscarinergic cholinergic receptors atdifferent rostro-caudal atlas levels of a series of five cross sections with a gap of approximately 500 mm between each slice of the arcopal-lium/amygdala complex. Left column: GABAA receptor expression in the arcopallium/amygdala complex from anterior (top) to posterior(down) levels. Middle column: M1 receptor expression in the arcopallium/amygdala complex from anterior (top) to posterior (down) levels.Right column: M2 receptor expression in the arcopallium/amygdala complex from anterior (top) to posterior (down) levels. Further explana-tions see Figure 7 [Color figure can be viewed at wileyonlinelibrary.com]
HEROLD ET AL. The Journal ofComparative Neurology
| 453
that functionally PoAb and AM belong to the viscero-limbic network,
while AV is involved in auditory-associative processing (Shanahan et al.,
2013). The second Cluster II comprises two groups, the posterior LSt
and SpA, two subpallial structures that were recognized earlier as func-
tionally closely related as caudal LSt (CLSt) and SpA (Abell�an & Medina,
2009; Kuenzel et al., 2011). The second subgroup in Cluster II com-
prises AA, AD, AI that are more centrally located in the arcopallium and
adjacent to each other. All three subdivisions are of pallial origin and
have premotor-associative functions (Shanahan et al., 2013). We will
now discuss these findings in more detail for each subregion below.
In the past, the arcopallium anterius (AA) was considered to be a
trigeminal component because of its connectivity to the tractus fronto-
arcopallialis and the anterior commissure (Schall, G€unt€urk€un, & Delius,
1986; Wild, Arends, & Zeigler, 1984; Zeier & Karten, 1971). Therefore,
together with AD and AI, AA was located in the high level associative
module within the premotor submodule of the “structural connectome”
in the telencephalon of the pigeon (Shanahan et al., 2013). In our
receptor study, all three arcopallial subdivisions were also in the same
cluster if the overall receptor densities were analyzed. Based on a study
that measured the Euclidian distance of diverse mRNA expression lev-
els within different subregions of the arcopallium in the zebra finch
(Taeniopygia guttata), AA seems to differ from all other nuclei in this
area (Jarvis et al., 2013). This does not match the current analysis based
on receptor binding densities as confirmed by our cluster analysis. One
explanation could be species differences in brain subdivisions or gene
expression. However, it could be also possible that in vocal learning
birds the arcopallium is located more medial in the forebrain and some-
what rotated medially compared to other avian species (Wang et al.,
2015). Thus, it is possible that what is anterior arcopallium in the zebra
finches could be more anterior-medial in pigeons, or in some other
position.
Arcopallium dorsale (AD) was clearly labeled by the expression of
a2, M1, and M2 receptors, which is comparable to the results of former
autoradiography studies in birds (Ball, Nock, Wingfield, McEwen, &
FIGURE 9 Color-coded autoradiographs showing the distribution and density of nACh receptors (a4b2 subtype) and noradrenergicreceptors at different rostro-caudal atlas levels of a series of five cross sections with a gap of approximately 500 mm between each slice ofthe arcopallium/amygdala complex. Left column: nACh (a4b2 subtype) receptor expression in the arcopallium/amygdala complex from ante-rior (top) to posterior (down) levels. Middle column: a1 receptor expression in the arcopallium/amygdala complex from anterior (top) to pos-terior (down) levels. Right column: a2 receptor expression in the arcopallium/amygdala complex from anterior (top) to posterior (down)levels. Further explanations see Figure 7 [Color figure can be viewed at wileyonlinelibrary.com]
454 | The Journal ofComparative Neurology
HEROLD ET AL.
Balthazart, 1990; Herold et al., 2011; Kohler, Messer, & Bingman,
1995). AD was defined earlier by Nissl staining, tract-tracing, neuro-
chemical and immunohistochemical studies (Atoji et al., 2006; Atoji &
Wild, 2009; Herold et al. 2012; Karten & Hodos, 1967; Kr€oner &
G€unt€urk€un, 1999; Reiner et al., 2004; Yamamoto & Reiner, 2005).
Based on our results, the receptor profile of AD showed a closer simi-
larity to AA and AI, and is more different from AV, AM and AP. Other
studies that used in situ hybridization further observed relatively high
D1A receptor mRNA labeling in AD in seven day old chicks (Gallus gal-
lus), but low D1B receptors (Sun & Reiner, 2000) and high D1C mRNA
levels in zebra finch (Jarvis et al., 2013). Despite the fact that the D1/5
receptor ligand used here labels D1A and D1B (and possible D1C/D)
receptors together, adult expression levels of DA receptors may differ
from hatchlings, which may result in lower densities in adults. This was
also observed for mRNA expression profiles of different D1 receptor
types in the arcopallium of zebra finches, which tend to lower
expression levels in adults compared to hatchlings (Kubikova et al.,
2010). For the first time, we described a further sub-differentiation of
AD, based on the observed distinct fiber architecture of ADl and ADm,
particularly in the more anterior portions. Four different receptor sub-
types confirmed such an intranuclear subdivision. Based on its known
connectivity AD is considered to be premotor in its nature (Zeier &
Karten, 1971; Shanahan et al., 2013). However, the dorsal arcopallium
showed intense LAMP labeling which would go along with limbic func-
tions (Yamamoto & Reiner, 2005). Intense LAMP labeling of AD is in
line with connectivity studies that showed inputs to AD from limbic
regions like the piriform cortex, hippocampal formation and TnA, and
outputs to the limbic medial and somatic lateral striatum (Bingman
et al., 1994; Veenman et al., 1995; Atoji & Wild, 2006). Recently
reported visual stimulus selective neurons in AD, however questions
both, the limbic and the premotor nature of AD (Scarf et al., 2016).
However, at this time point, none of the analysis seems to be sufficient
to explain the di(tri)chotomy of AD.
Arcopallium intermedium (AI) could be separated from the neigh-
boring regions AD, AV, and AM by many differences in receptor
expression, underlining the neurochemical diversity of these two arco-
pallial regions. Comparable to our findings, in chickens higher a2 recep-
tors were reported in AM compared to AI (Diez-Alarcia, Pilar-Cuellar,
Paniagua, Meana, & Fernandez-Lopez, 2006). In the zebra finch brain,
expression analysis of different mRNAs for kainate receptors showed
higher amounts of RA, in the intermediate arcopallium if compared to
the rest of the arcopallium, while AMPA receptor mRNAs showed
lower amounts (Wada et al., 2004). Further, while NR2A receptor subu-
nit is higher expressed in RA, other subunits were lower expressed,
which in sum would possibly result in similar levels of NDMA receptors
if measured together in all arcopallial structures. Here we found lower
kainate levels of AI compared to other arcopallial structures, except AP,
which is in sum in contrast to the above-mentioned study. In our study,
further lower or similar amounts of AMPA receptors were detected,
and lower, similar or higher densities of NMDA receptors in the differ-
ent arcopallial subdivision were shown, which would be in sum possibly
in line with the expression study (Wada et al., 2004). However, the
caveat of ligand binding studies is that most ligands bind to multiple
gene products of the same gene, so that they do not have the anatomi-
cal high resolution of mRNA binding studies that provide information
of distinctively expressed single gene profiles, so in general some dif-
ferences between mRNA levels and overall protein levels may exist.
Further, to some extent, mRNA levels may differ in general from pro-
tein levels. Several previous studies have reported intra-nuclear subre-
gions for AI (Atoji & Wild, 2009; Kr€oner & G€unt€urk€un, 1999; Shanahan
et al., 2013; Wynne & G€unt€urk€un, 1995; Zeier & Karten, 1971). How-
ever, no consistent view could be established. In our receptor analysis,
the significant differences were observed between a dorsal and a ven-
tral component of AI in 6 out of 11 measured receptors. This was par-
ticularly visible for the muscarinergic receptors. Additionally, the
cellular as well as fiber architecture of AId and AIv differed. AI is a
major hub of the “structural connectome” of the telencephalon of the
pigeon and as mentioned above, located in the associative module and
premotor submodule (Shanahan et al., 2013). This means that AI
FIGURE 10 Color-coded autoradiographs showing the distributionand density of 5-HT1A and D1/5 receptors at different rostro-caudal atlas levels of a series of five cross sections with a gap ofapproximately 500 mm between each slice of the arcopallium/amygdala complex. Left column: 5-HT1A receptor expression in thearcopallium/amygdala complex from anterior (top) to posterior(down) levels. Right column: D1/5 receptor expression in the arco-pallium/amygdala complex from anterior (top) to posterior (down)levels. Further explanations see Figure 7 [Color figure can beviewed at wileyonlinelibrary.com]
HEROLD ET AL. The Journal ofComparative Neurology
| 455
innervates pallial, diencephalic and brain stem entities and at the same
time receives input from associative, multimodal structures in the nido-
pallium and the dorsolateral region of the hippocampal formation, and
from visual associative subregions of the hyperpallium and from many
more (see Shanahan et al., 2013 for review).
Arcopallium ventrale (AV) showed the highest concentrations of
glutamate receptors of the arcopallium/amygdala complex and high kai-
nate receptor densities nicely resolved the borders of AV, which would
be comparable to the reported high mRNA levels of kainate receptors
of Ai in zebra finches (Wada et al., 2004) that was not separated into
Ai and Av in the study of Wada and colleagues. However, differences
between RA and the region ventral to RA in the zebra finch were men-
tioned in a recent study (Olson, Hodges, & Mello, 2015). In the pigeon,
AV showed further substantial differences in various receptor densities,
cell densities and fiber architectural details if compared to the sur-
rounding AI, PoAb, and AM. Thus, it could be recognized as a separate
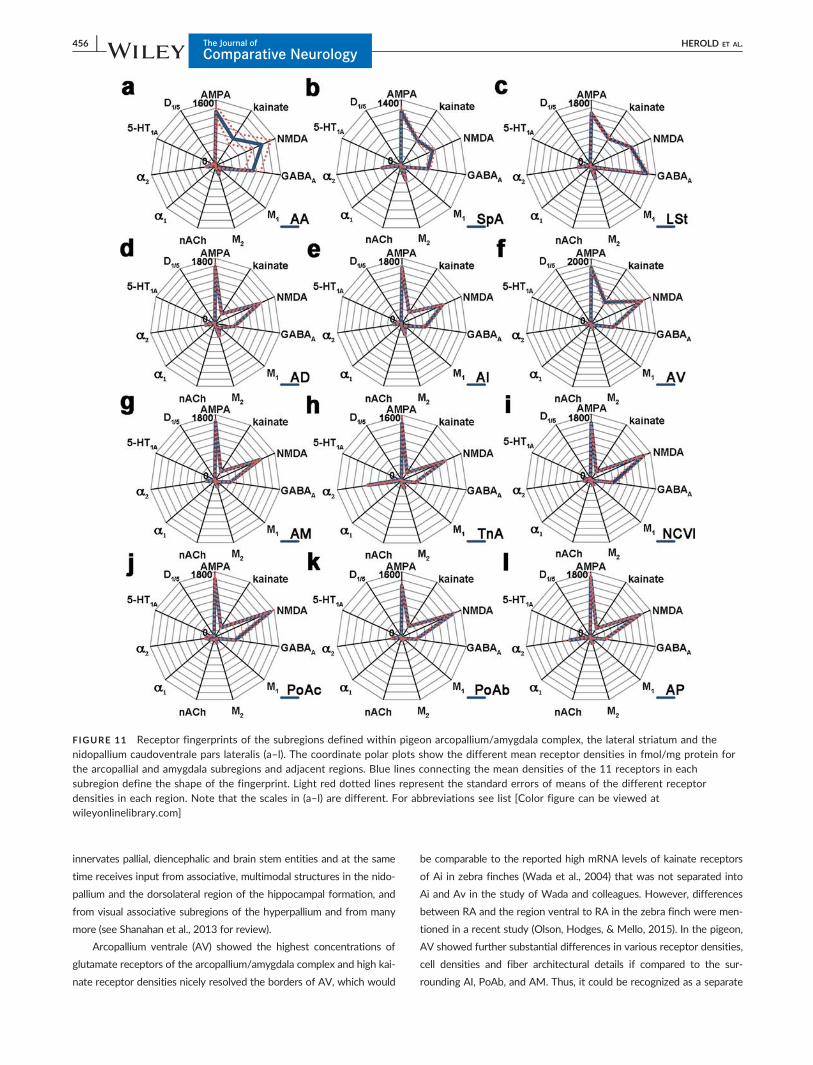
FIGURE 11 Receptor fingerprints of the subregions defined within pigeon arcopallium/amygdala complex, the lateral striatum and thenidopallium caudoventrale pars lateralis (a–l). The coordinate polar plots show the different mean receptor densities in fmol/mg protein forthe arcopallial and amygdala subregions and adjacent regions. Blue lines connecting the mean densities of the 11 receptors in eachsubregion define the shape of the fingerprint. Light red dotted lines represent the standard errors of means of the different receptordensities in each region. Note that the scales in (a–l) are different. For abbreviations see list [Color figure can be viewed atwileyonlinelibrary.com]
456 | The Journal ofComparative Neurology
HEROLD ET AL.
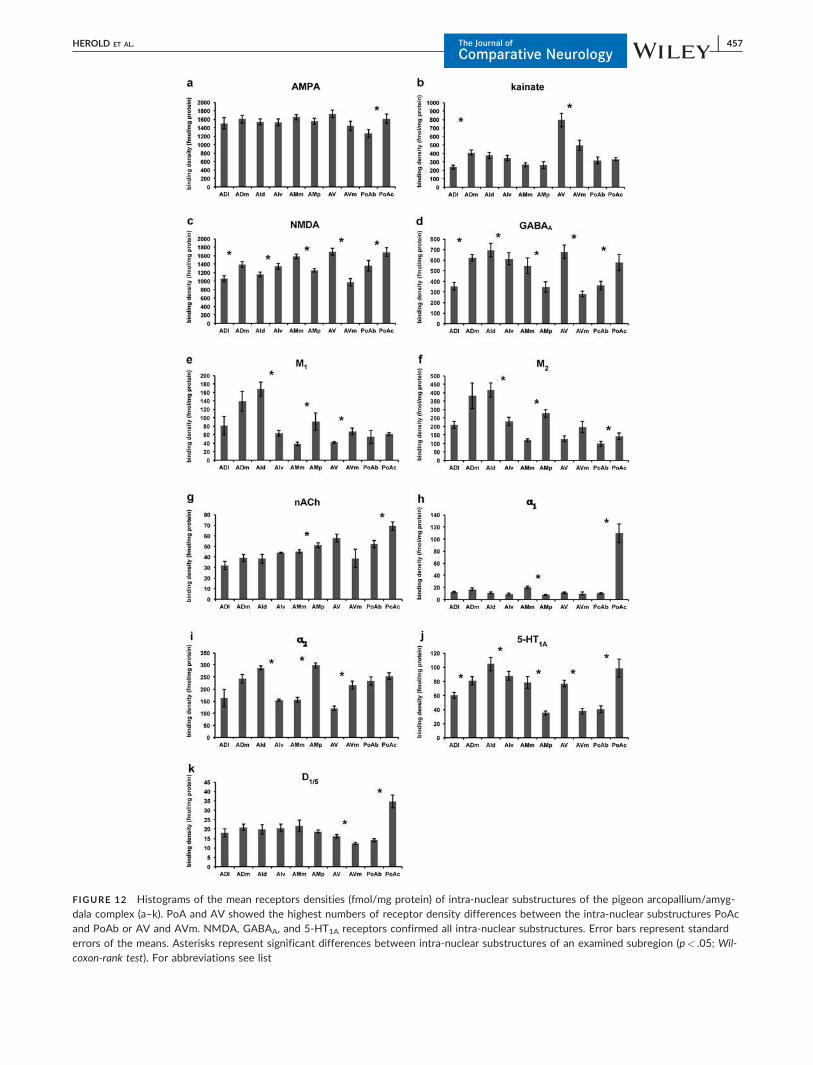
FIGURE 12 Histograms of the mean receptors densities (fmol/mg protein) of intra-nuclear substructures of the pigeon arcopallium/amyg-dala complex (a–k). PoA and AV showed the highest numbers of receptor density differences between the intra-nuclear substructures PoAcand PoAb or AV and AVm. NMDA, GABAA, and 5-HT1A receptors confirmed all intra-nuclear substructures. Error bars represent standarderrors of the means. Asterisks represent significant differences between intra-nuclear substructures of an examined subregion (p< .05; Wil-coxon-rank test). For abbreviations see list
HEROLD ET AL. The Journal ofComparative Neurology
| 457
arcopallial region. Our results were supported by findings from tracing
studies and further analysis of connectivity, which described AV as dif-
ferent from AI (Atoji & Wild, 2004; Kr€oner & G€unt€urk€un, 1999; Shana-
han et al., 2013; Wild, Karten, & Frost, 1993). In the more anterior
portion of AV an intranuclear subregion was recognized that we named
AVm. AVm showed different densities in 8 out of 11 receptors. Atoji
and Wild (2009) showed that both the limbic central caudal nidopallium
(NCC) and the dorsal intermediate mesopallium have tight connections
with a structure named AIvm that is located in about the same location
as our AVm. In a prior publication, Wild and colleagues (1993), how-
ever, had proposed AIvm to be part of an auditory premotor structure.
According to Shanahan et al. (2013), AV could be an associative struc-
ture that is part of the avian prefrontal submodule, while AIvm is
located in the auditory module. Like AA, AV projects via the anterior
commissure to the contralateral arcopallium (Letzner et al., 2016).
Arcopallium mediale (AM) was first described in a study of Zeier
and Karten (1971). Later on, tract-tracing experiments confirmed its
existence and a detailed analysis of the cytoarchitecture with Nissl
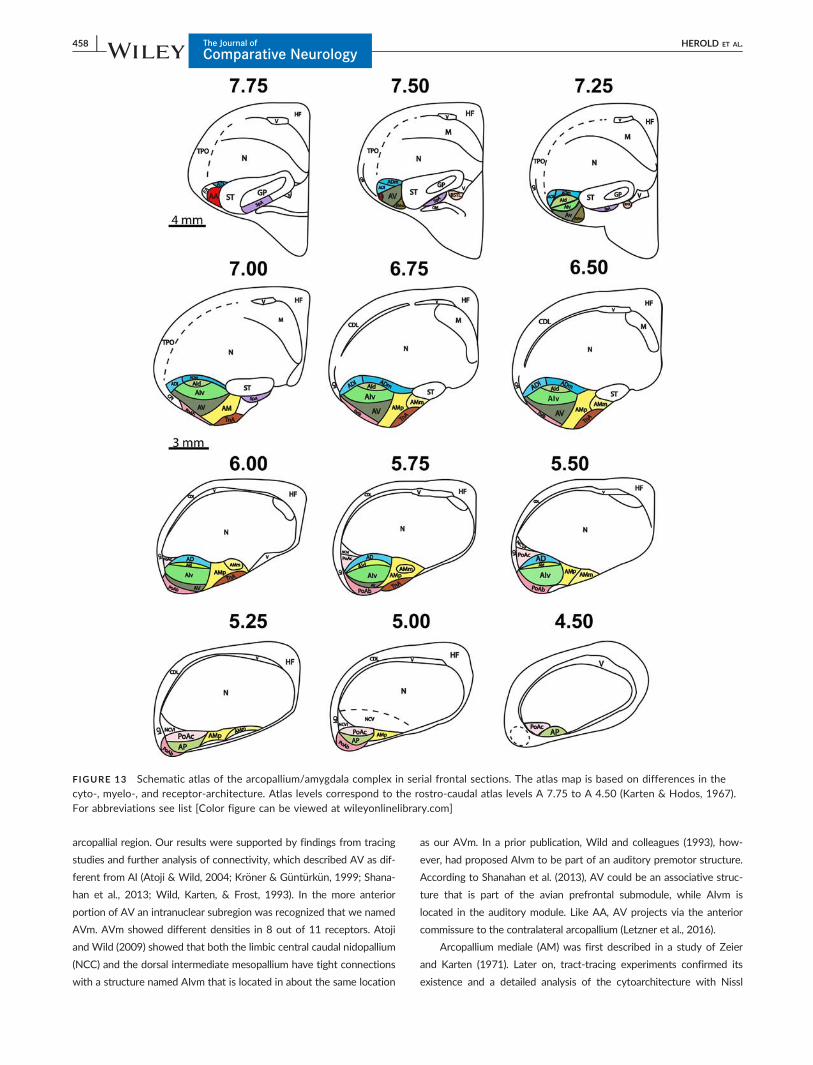
FIGURE 13 Schematic atlas of the arcopallium/amygdala complex in serial frontal sections. The atlas map is based on differences in thecyto-, myelo-, and receptor-architecture. Atlas levels correspond to the rostro-caudal atlas levels A 7.75 to A 4.50 (Karten & Hodos, 1967).For abbreviations see list [Color figure can be viewed at wileyonlinelibrary.com]
458 | The Journal ofComparative Neurology
HEROLD ET AL.
staining offered a more precise definition of the AM in pigeons (Atoji
et al., 2006). The AM is divided into a medially located cell-dense, dark
stained division with large cells (AMm) and a less cell-dense, parvocellu-
lar division (AMp) located laterally (Atoji et al., 2006). In our study, the
borders of AM are identical to the studies of Atoji and colleagues
(2006, 2009) and fibers showed different densities and directions in
both subnuclei. Tracing studies have shown that AM projects exten-
sively to PoAc and to a lesser extent to BSTL (Atoji et al., 2006). In a
follow-up study by Atoji and Wild (2009), it was shown that the central
caudal nidopallium (NCC) has reciprocal connections with AMm and
AMp. Both areas are associated with neuroendocrine and autonomic
functions in various bird species and have connections to TnA and the
postero-medial hypothalamus via HOM (Cheng, Chaiken, Zuo, & Miller,
1999; Cohen, 1975; Thompson, Goodson, Ruscio, & Adkins-Regan,
1998; Zeier & Karten, 1971). The ventrolateral part of AMp together
with AIvm from Wild and colleagues (1993) were called Avpm in Zeier
and Karten (1971) and based on their connectivity pattern are limbic-
associated. Additionally, the overall receptor architecture of AM
seemed to be more comparable to limbic regions as confirmed by the
cluster analysis.
Arcopallium posterioris (AP) is the most caudal part of the arcopal-
lium and is positioned between atlas levels A5.25 and A4.50. In line
with other studies, we recognized this differentiation of PoAc, PoAb
and the arcopallium intermedium in the more posterior sections based
on our receptor data as well as cyto- and myelo-architecture. This area
was described earlier in pigeons as the most posterior part of AI (Atoji
et al., 2006) and with gene expression and cellular analysis in zebra
finches (Jarvis et al., 2013). In zebra finches Ap is enriched in D1
receptors (Jarvis et al., 2013), while here D1 receptor expression of AP
was only higher if compared to AV. As mentioned above, overall recep-
tor densities of AP showed more similarities to TnA than to other arco-
pallial regions. Future studies and possibly a more detailed analysis of
other gene expression profiles in the pigeon have to find out how this
relationship may be interpreted and to which functional circuit AP is
belonging.
Nucleus posterioris amygdalopallii (PoA) can be separated into a
basal (PoAb) and a compact part (PoAc). All researchers agree that this
nucleus is part of the avian amygdala (Reiner et al., 2004). A higher cell
density defines PoAc, while PoAb shows a smaller number of cells with
greater cell bodies (Atoji et al., 2006). This is particularly visible at the
atlas level A5.00. The analysis of the receptor autoradiographs con-
firmed differences between PoAc and PoAb, thereby supporting a sep-
aration of these two nuclei. The highest divergences between PoAc
and PoAb were detected for a1, 5-HT1A, and D1/5 receptors. For exam-
ple, PoAc showed two-times higher densities of D1/5-receptors and
11-times higher densities of a1 receptors. This is in line with the find-
ings that PoAc is also characterized by high tyrosine hydroxylase (TH)
immunoreactivity, while PoAb has more or less no TH positive cells
(Kr€oner & G€unt€urk€un, 1999). PoAb, but not PoAc participates in inter-
hemispheric projections via the anterior commissure, a result that
underlines the difference of these two subnuclei (Letzner et al., 2016).
The region overlaying PoAc is named NCVl. It can be distinguished by
the absence of TH immunoreactivity and darkly stained cell aggregates
(Atoji et al., 2006; Kr€oner & G€unt€urk€un, 1999; Wild, Arends, & Zeigler,
1985). PoAc and PoAb showed differences in receptor densities from
the overlaying NCVl. NCVl together with the subnidopallium were dis-
cussed to be a part of the insular cortex (Atoji et al., 2006) or to form
the endopiriform nucleus (Yamamoto & Reiner, 2005). Atoji and col-
leagues (2006) further analyzed and defined the borders of limbic BSTL
at the ventral tip of the lateral ventricle more precisely and showed
extensive connections to PoAc but not to PoAb in birds (Atoji et al.,
2006). PoAb on the other hand is connected to CDL and TPO (Atoji &
Wild, 2005). Both, PoAc and BSTL receive fibers from the dorsomedial
subregion of the hippocampal formation (HF) but send only a small
number of efferent fibers to the dorsomedial and the dorsolateral
region of the HF (Atoji & Wild, 2004). In addition, AM projects exten-
sively to PoAc and to a lesser extent to BSTL (Atoji et al., 2006). As
mentioned above, PoA and NCVl belong to the viscero-limbic module
in the pigeon’s connectome (Shanahan et al., 2013).
Nucleus taenia amygdala (TnA) is considered to be amygdaloid and
subpallial (Reiner et al., 2004). However, the subpallial nature of TnA
has been questioned by some researchers of the avian brain consor-
tium (Reiner et al., 2004), which is further underlined by our cluster
analysis. Future studies have to be performed to bring more clarity at
this point. No clear subdifferentiation of TnA was recognized although
this was mentioned in other studies in chickens and budgerigars
(Melopsittacus undulates; Roberts, Hall, & Brauth, 2002; Yamamoto
et al., 2005). TnA is specifically visible by labeling of M2 and a2 recep-
tors. A high a2 receptor binding of TnA was also reported in
Fernandez-Lopez et al. (1997) and visible in Herold et al. (2011). Gener-
ally, TnA showed a high number of differences in receptor densities if
FIGURE 14 Relationships of the overall mean receptor densitiesbetween subregions of the amygdala, the arcopallium, thenidopallium caudolaterale pars lateralis and the posterior lateralstriatum. X-axis: Euclidian distance. Y-axis: Subregions. Thecladogram shows two different main clusters with furthersubgroups at different branches (cophenetic correlation coefficientc50.60) [Color figure can be viewed at wileyonlinelibrary.com]
HEROLD ET AL. The Journal ofComparative Neurology
| 459
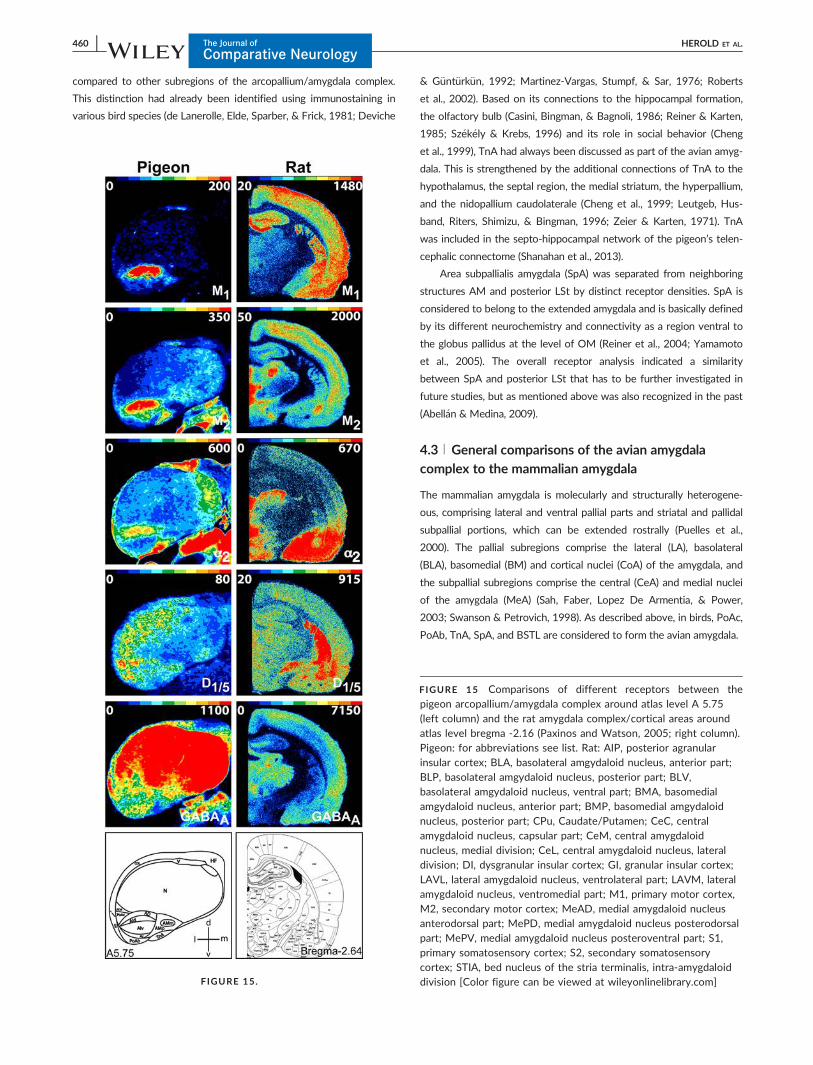
compared to other subregions of the arcopallium/amygdala complex.
This distinction had already been identified using immunostaining in
various bird species (de Lanerolle, Elde, Sparber, & Frick, 1981; Deviche
& G€unt€urk€un, 1992; Martinez-Vargas, Stumpf, & Sar, 1976; Roberts
et al., 2002). Based on its connections to the hippocampal formation,
the olfactory bulb (Casini, Bingman, & Bagnoli, 1986; Reiner & Karten,
1985; Sz�ek�ely & Krebs, 1996) and its role in social behavior (Cheng
et al., 1999), TnA had always been discussed as part of the avian amyg-
dala. This is strengthened by the additional connections of TnA to the
hypothalamus, the septal region, the medial striatum, the hyperpallium,
and the nidopallium caudolaterale (Cheng et al., 1999; Leutgeb, Hus-
band, Riters, Shimizu, & Bingman, 1996; Zeier & Karten, 1971). TnA
was included in the septo-hippocampal network of the pigeon’s telen-
cephalic connectome (Shanahan et al., 2013).
Area subpallialis amygdala (SpA) was separated from neighboring
structures AM and posterior LSt by distinct receptor densities. SpA is
considered to belong to the extended amygdala and is basically defined
by its different neurochemistry and connectivity as a region ventral to
the globus pallidus at the level of OM (Reiner et al., 2004; Yamamoto
et al., 2005). The overall receptor analysis indicated a similarity
between SpA and posterior LSt that has to be further investigated in
future studies, but as mentioned above was also recognized in the past
(Abell�an & Medina, 2009).
4.3 | General comparisons of the avian amygdala
complex to the mammalian amygdala
The mammalian amygdala is molecularly and structurally heterogene-
ous, comprising lateral and ventral pallial parts and striatal and pallidal
subpallial portions, which can be extended rostrally (Puelles et al.,
2000). The pallial subregions comprise the lateral (LA), basolateral
(BLA), basomedial (BM) and cortical nuclei (CoA) of the amygdala, and
the subpallial subregions comprise the central (CeA) and medial nuclei
of the amygdala (MeA) (Sah, Faber, Lopez De Armentia, & Power,
2003; Swanson & Petrovich, 1998). As described above, in birds, PoAc,
PoAb, TnA, SpA, and BSTL are considered to form the avian amygdala.
FIGURE 15.
FIGURE 15 Comparisons of different receptors between thepigeon arcopallium/amygdala complex around atlas level A 5.75
(left column) and the rat amygdala complex/cortical areas aroundatlas level bregma -2.16 (Paxinos and Watson, 2005; right column).Pigeon: for abbreviations see list. Rat: AIP, posterior agranularinsular cortex; BLA, basolateral amgydaloid nucleus, anterior part;BLP, basolateral amgydaloid nucleus, posterior part; BLV,basolateral amgydaloid nucleus, ventral part; BMA, basomedialamgydaloid nucleus, anterior part; BMP, basomedial amgydaloidnucleus, posterior part; CPu, Caudate/Putamen; CeC, centralamygdaloid nucleus, capsular part; CeM, central amygdaloidnucleus, medial division; CeL, central amygdaloid nucleus, lateraldivision; DI, dysgranular insular cortex; GI, granular insular cortex;LAVL, lateral amygdaloid nucleus, ventrolateral part; LAVM, lateralamygdaloid nucleus, ventromedial part; M1, primary motor cortex,M2, secondary motor cortex; MeAD, medial amygdaloid nucleusanterodorsal part; MePD, medial amygdaloid nucleus posterodorsalpart; MePV, medial amygdaloid nucleus posteroventral part; S1,primary somatosensory cortex; S2, secondary somatosensorycortex; STIA, bed nucleus of the stria terminalis, intra-amygdaloiddivision [Color figure can be viewed at wileyonlinelibrary.com]
460 | The Journal ofComparative Neurology
HEROLD ET AL.
PoA: Genoarchitecture and fate mapping studies in diverse species
revealed that PoA expressed various pallial markers and is therefore
considered to be part of the pallial amygdala in birds (Puelles et al.,
2000; Reiner et al., 2004; Puelles et al., 2007; Abell�an & Medina, 2008;
Abell�an et al., 2009, 2010; Butler et al., 2011; Medina et al., 2011;
Kuenzel et al., 2011). The projections of PoAc showed a comparable
connectivity pattern of commissural fibers to the mammalian amygdala,
which projects contralaterally to cortical, medial, and lateral nuclei of
the amygdala, olfactory tubercle and pre-piriform cortex (De Olmos &
Ingram, 1972; Letzner et al., 2016; Sah et al., 2003). However, PoAc
shares connectional characteristics of both, the autonomic and the
fronto-temporal system of mammals and thus with both the central
and the basolateral/lateral nuclei of the mammalian amygdala (Veen-
man et al., 1995; Swanson & Petrovich, 1998; Puelles et al., 2000; Atoji
et al., 2006). Here, PoAc showed the high amounts of a1, 5-HT1A and
D1/5 receptors compared to the other amygdala subregions. In rodents,
a1, a2, and D1/5 receptors are densely expressed in the amygdala, and
in humans in LA and BLA (Cremer et al., 2010; Cremer et al., 2009; Lil-
lethorup et al., 2015; Sanders et al., 2006). Further, a1 receptors
showed higher densities in LA compared to BLA in humans (Graebenitz
et al., 2011). The most striking differences within the mouse amygdala
complex were reported for M1 receptors densities showing higher
amounts in the lateral region compared to the medial and central
nucleus (Yilmazer-Hanke, Roskoden, Zilles, & Schwegler, 2003). In
pigeons, M1 receptors were higher expressed in PoAb, PoAc, SpA com-
pared to TnA. Further, PoAc and PoAb express higher numbers of
NMDA receptors that are also densely expressed in the lateral and
medial regions compared to the central region in mice (Yilmazer-Hanke
et al., 2003). Further, TH-positive fibers and the absence of
acetylcholine-esterase immune-reactivity define LA in rats (Paxinos,
Kus, Ashwell, & Watson, 1999). TH-positive fibers were also reported
for PoAc (Kr€oner & G€unt€urk€un, 1999). Taken together, no unitary pat-
tern could be observed, but at least PoAc showed some similarities in
the receptor expression profile of the mammalian lateral regions of the
amygdala.
TnA: Based on their similarities in olfactory input, hippocampal,
and hypothalamic output, enrichment in androgen and estrogen recep-
tors and involvement in sexual behavior, TnA was considered to be
comparable to the MeA of mammals (Reiner et al., 2004; Yamamoto
et al., 2005). It has been speculated that lateral TnA in chickens (pallial)
is comparable to the anterior division of the corticoid nucleus of the
amygdala (CoAa), whereas medial TnA (subpallial) is comparable to
MeA (Roberts et al., 2002; Yamamoto et al., 2005; Yamamoto & Reiner,
2005). However, we did not observe this subdifferentiation of TnA in
pigeons. TnA showed very high amounts of a2-receptors that are also
densely expressed in the pallial as well as subpallial nuclei of the amyg-
dala (MeA, LA, and BLA) of mice, rats and humans if compared to corti-
cal probes (Graebenitz et al., 2011; Lillethorup et al., 2015; Sanders
et al., 2006; Scheperjans, Grefkes, Palomero-Gallagher, Schleicher, &
Zilles, 2005; Scheperjans, Palomero-Gallagher, Grefkes, Schleicher, &
Zilles, 2005).
Extended amygdala: In mammals, some researchers divide the sub-
pallial amygdaloid nuclei (including the extended amygdala) into the
central and medial extended amygdala complex (Kuenzel et al., 2011).
The central extended amygdala complex consists of the CeA and BSTL
and the medial extended amygdala complex consists of MeA and
BSTM. Both, CeA and MeA are the major output nuclei of the amyg-
dala and confluent with the BST nuclei (Swanson, 2000). Comparative
studies in chick and mouse embryo with subpallial and pallial genetic
markers, as well as connectivity data suggests that the BST nuclei
BSTM and BSTL in birds belong to the extended amygdala nuclei
(Abell�an & Medina, 2008, 2009; Abell�an, Menuet, Dehay, Medina, &
Retaux, 2010; Bruce, Erichsen, & Reiner, 2016; Butler et al., 2011;
Medina et al., 2011; Puelles et al., 2000; Puelles et al., 2007). In birds, it
has been further postulated that SpA and BSTL form the central
extended amygdala complex, while TnA and BSTM form another func-
tional unit and may correspond to the medial extended amygdala com-
plex (Puelles et al., 2000; Reiner et al., 2004; Abell�an & Medina, 2009;
Kuenzel et al., 2011). To test these hypotheses, researchers investi-
gated secretagogin-binding that selectively labels the subpallial and
extended amygdala in mammals (Gati, Lendvai, Hokfelt, Harkany, &
Alpar, 2014; Mulder et al., 2010). In chickens, TnA, SpA and the BNST
nuclei were densely populated with secretagogin-positive neurons.
However, the pallial amygdala PoA as well as AV and AD also con-
tained labeled neurons, which questions the use of this marker as
subpallial-specific in birds. On the other hand, analysis of the connec-
tions of BSTL strongly supports the idea that BSTL belong to the
extended amygdala in birds (Atoji et al., 2006; Veenman et al., 1995).
SpA has been suggested to be comparable to the sublenticular part of
the mammalian extended amygdala (Yamamoto & Reiner, 2005; Kuen-
zel et al., 2011). Both structures show similarities in location (ventral to
GP), connections with the parabrachial area, the nucleus of the solitary
tract, the dorsal motor nucleus of the vagus, the arcopallium, efferents
to the BSTL (Atoji et al., 2006; Reiner et al., 2004; Wild, Arends, & Zei-
gler, 1990) as well as neurotransmitter traits such as enrichment in
CGRP immunopositive fibers, enkephalinergic, and neurotensinergic
neurons (Atoji, Shibata, Yamamoto, & Suzuki, 1996; Lanuza, Davies,
Landete, Novejarque, & Martinez, 2000; Yamamoto et al., 2005). In our
study, SpA showed the lowest densities of NMDA receptors. Lower
NMDA receptors were also observed in the mice central amygdala if
compared to the lateral and medial nuclei (Yilmazer-Hanke et al. 2003),
which would fit with recent theories that SpA is part of the central
extended amygdala complex (Vicario et al., 2014). On the other hand,
the central nucleus in mice is also conspicuously low in GABAA recep-
tors (Yilmazer-Hanke et al., 2003), while the lowest amounts of GABAA
receptors in the pigeon amygdala subregions were detected in PoAb
and TnA.
4.4 | General comparisons of the avian arcopallium
complex to mammalian (pre)-motor cortical areas
The arcopallial subregions of birds are considered to be functionally
comparable to (pre)motor cortical areas by some researchers (Reiner
et al., 2004; Jarvis et al., 2005; Chen et al., 2013; Whitney et al., 2014;
Pfenning et al., 2014; Karten, 2015; G€unt€urk€un & Bugnyar, 2016),
while others still assume that all arcopallial regions belong to the
HEROLD ET AL. The Journal ofComparative Neurology
| 461
amygdala (Puelles et al., 2000, 2007; Medina et al., 2011; Bupesh et al.,
2011). In pigeons the arcopallial subregions receive input from the
NCL, the functional analog of the mammalian prefrontal cortex
(G€unt€urk€un & Bugnyar, 2016; Herold, Diekamp, & G€unt€urk€un, 2008;
Herold, Joshi, et al., 2012; Leutgeb et al., 1996), as well as auditory
(Wild et al., 1993), trigeminal (Wild et al., 1985), somatosensory (Kr€oner
& G€unt€urk€un, 1999) and visual pallial areas (Husband & Shimizu, 1999).
Based on layer-specific gene expression analysis and cell type homolo-
gies Dugas-Ford and colleagues (2012) postulated that regions of the
arcopallium are comparable to layer V neurons of the neocortex. One
example, ER81 showed homogeneous labeling throughout the whole
zebra finch arcopallium, including RA. Another marker, PCP4, showed
intense labeling of subregions in chicken and zebra finch that corre-
spond to AD and AId in our study. However, PCP4 and ER81 are also
expressed in the basolateral amygdala of mammals, a pallial derivative,
and not exclusively in layer V neurons (Jarvis et al., 2013; Nomura, Hat-
tori, & Osumi, 2009). One explanation for this could be that the pallial
amygdala is an extension of cortex layers V and VI, and therefore
shares the expression of the same marker genes (Swanson, 2000). A
more extensive gene expression pattern analysis by Pfenning and col-
leagues (2014) revealed for nearly thousand genes a close functional
similarity of RA and the surrounding intermediate arcopallium in song-
birds with the primate primary motor cortex. A cell type specific analy-
sis from different layers in motor and sensory cortices, showed that
layer V cells of macaque (Macaca mulatta) primary motor cortex had
the strongest match with RA and surrounding arcopallium compared to
all other layers and sensory cortex (Pfenning et al., 2014). Further, for
55 genes, a “convergence” of RA to the human laryngeal motor and
adjacent primary somatosensory cortex was found, since these genes
had similarly different expression profiles from the surrounding arcopal-
lium. Here we think that to analyze different brain regions and cell
types based on expression profiles of gene orthologs and other charac-
teristics more precisely, a detailed brain map with higher resolution is
needed for better comparisons of similarities between cortical layers/
areas in mammals, cortical areas in reptiles and nuclei in birds.
Our new schematic map of the arcopallium/amygdala complex
allows a more precise comparison of the receptor architecture to mam-
malian (pre)-motor, other cortical as well as amygdala subregions.
Although absolute densities of binding sites vary between different
species, relative differences between regional densities are mostly
comparable (Herold et al., 2015; Zilles & Palomero-Gallagher, 2016).
For example, in the (pre)-motor regions of different mammalian species,
NMDA and GABAA receptors showed the highest densities, and M1/a1
receptors were higher expressed compared to M2/a2 receptors (Geb-
hard et al., 1995; Geyer et al., 1998; Herold et al., 2011; Palomero-
Gallagher, Schleicher, Zilles, & Loscher, 2010; Palomero-Gallagher &
Zilles, 2004; Zilles et al., 1995). In humans, M2 and GABAA receptors
are more densely expressed in primary visual (BA17), somatosensory
(BA3) and primary auditory cortex if compared to the primary motor
cortex (BA4; Zilles, Palomero-Gallagher, & Schleicher, 2004; Scheper-
jans, Grefkes et al., 2005; Scheperjans, Palomero-Gallagher et al.,
2005). Particularly the dense M2-receptor expression seems to be a
conservative aspect of cortical organization (Zilles et al. 2004).
Referring to this, it is of further interest that the pallial nuclei, LA and
BLA in humans and BLA in rats have high amounts of M2-receptors
(Graebenitz et al., 2011; Mash & Potter, 1986). Additionally, in humans
and rats, D1/5 receptors are higher expressed and GABAA receptors are
lower expressed in the amygdala if compared to the above-mentioned
cortical areas (Scheperjans, Grefkes et al., 2005; Scheperjans,
Palomero-Gallagher et al., 2005; Cremer et al., 2009, 2010; Graebenitz
et al., 2011). Figure 15 provides examples of the above-mentioned
receptors in the rat amygdala and cortex and the pigeon arcopallium/
amygdala complex that showed differences between divers subregions
in mammalian species. The receptor data of relevant brain regions in
rats have been published earlier (Herold et al., 2011; Cremer et al.,
2009, 2010; Palomero-Gallagher & Zilles, 2004). Comparisons of rela-
tive densities of M1, M2, D1/5, a2, and GABAA receptors between
pigeons and rats support the idea that AA, AD, AI, AV, and AP share
receptor expression characteristics with FR1 (M1), FR2 (M2), and the
insular cortex (AIP, GI, DI). Here, high levels of D1/5 and a2 receptor
densities of AP support the idea that AP could be comparable to AIP
while dense levels of GABAA, D1/5 and M1-receptors in AA support a
comparison with FR1/FR2 and GI/DI/AIP. High GABAA receptor levels
in AV point to a comparison with FR1/FR2 and AIP. In case of AI high
levels of GABAA, M1, and M2 receptors allow further comparison to
FR1/FR2, S1/S2, and GI/DI/AIP. However, as visible in Figure 15
beside similar binding patterns also differences are detectable, which
may be a result of parallel evolution, analogies, and species-specific
adaptations.
5 | CONCLUSIONS
The pigeon arcopallium/amygdala complex is a highly heterogeneous
area of the avian brain, characterized by a large number of subregions
and a diversity of connectional patterns. This complexity is the reason
why scientists still can’t find a consensus on the number and location
of subdivisions or the premotor or limbic nature of all or parts of this
area. We believe that we need proper anatomical maps before embark-
ing onto such scientific voyages. This was the motivation for our study
and the reason we now present a new detailed map of this region,
based on quantitative methods. In addition, our study may promote the
discussions on functional similarities of premotor or limbic components,
by providing details on the neurotransmitter receptor densities in
pigeons in comparison with similar data in rats.
ORCID
Christina Herold http://orcid.org/0000-0002-6530-115X
REFERENCES
Abell�an, A., & Medina, L. (2008). Expression of cLhx6 and cLhx7/8 suggests
a pallido-pedunculo-preoptic origin for the lateral and medial parts of
the avian bed nucleus of the stria terminalis. Brain Research Bulletin, 75
(2–4), 299–304. https://doi.org/10.1016/j.brainresbull.2007.10.034
Abell�an, A., & Medina, L. (2009). Subdivisions and derivatives of the
chicken subpallium based on expression of LIM and other regulatory
genes and markers of neuron subpopulations during development.
462 | The Journal ofComparative Neurology
HEROLD ET AL.
The Journal of Comparative Neurology, 515(4), 465–501. https://doi.org/10.1002/cne.22083
Abell�an, A., Legaz, I., Vernier, B., Rétaux, S., & Medina, L. (2009). Olfac-
tory and amygdalar structures of the chicken ventral pallium based
on the combinatorial expression patterns of LIM and other develop-
mental regulatory genes. The Journal of Comparative Neurology, 516
(3), 166–186. https://doi.org/10.1002/cne.22102
Abell�an, A., Menuet, A., Dehay, C., Medina, L., & Retaux, S. (2010). Dif-
ferential expression of LIM-homeodomain factors in Cajal-Retzius
cells of primates, rodents, and birds. Cerebral Cortex, 20(8), 1788–
1798. https://doi.org/10.1093/cercor/bhp242
Ariens-Kappers, C. U., Huber, G. C., & Crosby, E. C. (1936). The compara-
tive anatomy of the nervous system of vertebrates, inlcuding man. New
York: MacMillan.
Atoji, Y., Saito, S., & Wild, J. M. (2006). Fiber connections of the compact
division of the posterior pallial amygdala and lateral part of the bed
nucleus of the stria terminalis in the pigeon (Columba livia). The Jour-
nal of Comparative Neurology, 499(2), 161–182. https://doi.org/10.
1002/cne.21042
Atoji, Y., Shibata, N., Yamamoto, Y., & Suzuki, Y. (1996). Distribution of
neurotensin-containing neurons in the central nervous system of the
pigeon and the chicken. The Journal of Comparative Neurology, 375(2),
187–211. https://doi.org/10.1002/(SICI)1096-9861(19961111)
375:2<187::AID-CNE2>3.0.CO;2-Z
Atoji, Y., & Wild, J. M. (2004). Fiber connections of the hippocampal formation
and septum and subdivisions of the hippocampal formation in the pigeon
as revealed by tract tracing and kainic acid lesions. The Journal of Compara-
tive Neurology, 475(3), 426–461. https://doi.org/10.1002/cne.20186
Atoji, Y., & Wild, J. M. (2005). Afferent and efferent connections of the
dorsolateral corticoid area and a comparison with connections of the
temporo-parieto-occipital area in the pigeon (Columba livia). The Jour-
nal of Comparative Neurology, 485(2), 165–182. https://doi.org/10.
1002/cne.20490
Atoji, Y., & Wild, J. M. (2006). Anatomy of the avian hippocampal forma-
tion. Reviews in the Neurosciences, 17(1–2), 3–15.
Atoji, Y., & Wild, J. M. (2009). Afferent and efferent projections of the
central caudal nidopallium in the pigeon (Columba livia). The Journal of
Comparative Neurology, 517(3), 350–370. https://doi.org/10.1002/
cne.22146
Atoji, Y., & Wild, J. M. (2012). Afferent and efferent projections of the
mesopallium in the pigeon (Columba livia). The Journal of Comparative
Neurology, 520(4), 717–741. https://doi.org/10.1002/cne.22763
Ball, G. F., Nock, B., Wingfield, J. C., McEwen, B. S., & Balthazart, J. (1990).
Muscarinic cholinergic receptors in the songbird and quail brain: A
quantitative autoradiographic study. The Journal of Comparative Neurol-
ogy, 298(4), 431–442. https://doi.org/10.1002/cne.902980405
Belgard, T. G., Montiel, J. F., Wang, W. Z., Garcia-Moreno, F., Margulies,
E. H., Ponting, C. P., & Molnar, Z. (2013). Adult pallium transcrip-
tomes surprise in not reflecting predicted homologies across diverse
chicken and mouse pallial sectors. Proceedings of the National Acad-
emy of Sciences of the United States of America, 110(32), 13150–13155. https://doi.org/10.1073/pnas.1307444110
Bingman, V. P., Casini, G., Nocjar, C., & Jones, T. J. (1994). Connections of
the piriform cortex in homing pigeons (Columba livia) studied with fast
blue and WGA-HRP. Brain, Behavior and Evolution, 43(4–5), 206–218.
Bruce, L. L., Erichsen, J. T., & Reiner, A. (2016). Neurochemical compartmen-
talization within the pigeon basal ganglia. Journal of Chemical Neuroanat-
omy, 78, 65–86. https://doi.org/10.1016/j.jchemneu.2016.08.005
Bupesh, M., Legaz, I., Abell�an, A., Medina, L. (2011). Multiple telence-
phalic and extratelencephalic embryonic domains contribute neurons
to the medial extended amygdala. The Journal of Comparative Neurol-
ogy, 519(8), 1505–1525. https://doi.org/10.1002/cne.22581
Butler, A. B., Reiner, A., & Karten, H. J. (2011). Evolution of the amniote
pallium and the origins of mammalian neocortex. Annals of the New
York Academy of Sciences, 1225, 14–27. https://doi.org/10.1111/j.
1749-6632.2011.06006.x
Campanella, L. C., da Silva, A. A., Gellert, D. S., Parreira, C., Ramos, M. C.,
Paschoalini, M. A., & Marino-Neto, J. (2009). Tonic serotonergic con-
trol of ingestive behaviours in the pigeon (Columba livia): The role of
the arcopallium. Behavioural Brain Research, 205(2), 396–405. https://doi.org/10.1016/j.bbr.2009.07.017
Casini, G., Bingman, V. P., & Bagnoli, P. (1986). Connections of the
pigeon dorsomedial forebrain studied with WGA-HRP and 3H-pro-
line. The Journal of Comparative Neurology, 245(4), 454–470. https://doi.org/10.1002/cne.902450403
Chen, C. C., Winkler, C. M., Pfenning, A. R., & Jarvis, E. D. (2013). Molec-
ular profiling of the developing avian telencephalon: Regional timing
and brain subdivision continuities. Journal of Comparative Neurology,
521(16), 3666–3701. https://doi.org/10.1002/cne.23406
Cheng, M., Chaiken, M., Zuo, M., & Miller, H. (1999). Nucleus taenia of
the amygdala of birds: Anatomical and functional studies in ring
doves (Streptopelia risoria) and European starlings (Sturnus vulgaris).
Brain, Behavior and Evolution, 53(5–6), 243–270. https://doi.org/6597
Cohen, D. H. (1975). Involvement of the avian amygdalar homologue
(archistriatum posterior and mediale) in defensively conditioned heart
rate change. The Journal of Comparative Neurology, 160(1), 13–35.https://doi.org/10.1002/cne.901600103
Cremer, C. M., Bidmon, H. J., Gorg, B., Palomero-Gallagher, N., Escobar,
J. L., Speckmann, E. J., & Zilles, K. (2010). Inhibition of glutamate/glu-
tamine cycle in vivo results in decreased benzodiazepine binding and
differentially regulated GABAergic subunit expression in the rat brain.
Epilepsia, 51(8), 1446–1455. https://doi.org/EPI2562 [pii]10.1111/
j.1528-1167.2010.02562.x
Cremer, C. M., Palomero-Gallagher, N., Bidmon, H. J., Schleicher, A., Speck-
mann, E. J., & Zilles, K. (2009). Pentylenetetrazole-induced seizures
affect binding site densities for GABA, glutamate and adenosine recep-
tors in the rat brain. Neuroscience, 163(1), 490–499. https://doi.org/S0306-4522(09)00454-0[pii]10.1016/j.neuroscience.2009.03.068
Cross, D. J., Marzluff, J. M., Palmquist, I., Minoshima, S., Shimizu, T., &
Miyaoka, R. (2013). Distinct neural circuits underlie assessment of a
diversity of natural dangers by American crows. Proceedings of the Royal
Society, 280(1765), 20131046. https://doi.org/10.1098/rspb.2013.1046
da Silva, A. A., Campanella, L. C., Ramos, M. C., Parreira, C., Faria, M. S.,
Marino-Neto, J., & Paschoalini, M. A. (2009). Arcopallium, NMDA
antagonists and ingestive behaviors in pigeons. Physiology & Behavior,
98(5), 594–601. https://doi.org/10.1016/j.physbeh.2009.09.009
Dafters, R. (1975). Active avoidance behavior following archistriatal
lesions in pigeons. Journal of Comparative and Physiological Psychology,
89(10), 1169–1179.
de Lanerolle, N. C., Elde, R. P., Sparber, S. B., & Frick, M. (1981). Distri-
bution of methionine-enkephalin immunoreactivity in the chick brain:
An immunohistochemical study. The Journal of Comparative Neurology,
199(4), 513–533. https://doi.org/10.1002/cne.901990406
De Olmos, J. S., & Ingram, W. R. (1972). The projection field of the stria termi-
nalis in the rat brain. An experimental study. The Journal of Comparative
Neurology, 146(3), 303–334. https://doi.org/10.1002/cne.901460303
Deviche, P., & G€unt€urk€un, O. (1992). Peptides for calling? An immunohis-
tochemical study of the avian n. intercollicularis. Brain Research, 569
(1), 93–99.
Diez-Alarcia, R., Pilar-Cuellar, F., Paniagua, M. A., Meana, J. J., & Fernan-
dez-L�opez, A. (2006). Pharmacological characterization and
HEROLD ET AL. The Journal ofComparative Neurology
| 463
autoradiographic distribution of alpha2-adrenoceptor antagonist [3H]
RX 821002 binding sites in the chicken brain. Neuroscience, 141(1),
357–369. https://doi.org/10.1016/j.neuroscience.2006.03.025
Dugas-Ford, J., Rowell, J. J., & Ragsdale, C. W. (2012). Cell-type homolo-
gies and the origins of the neocortex. Proceedings of the National
Academy of Sciences of the United States of America, 109(42), 16974–16979. https://doi.org/10.1073/pnas.1204773109
Edinger, L. (1896). Vorlesungen €uber den Bau der nervœsen Centralorgane
des Menschen und der Tiere f€ur €Arzte und Studierende (5., stark verm.
Aufl. ed.). Leipzig: Vogel.
Edinger, L. (1903). 5 Untersuchungen €uber das Vorderhirn der V€ogel.
Fernandez-Lopez, A., Revilla, V., Candelas, M. A., Gonzalez-Gil, J., Diaz,
A., & Pazos, A. (1997). A comparative study of alpha2- and beta-
adrenoceptor distribution in pigeon and chick brain. The European
Journal of Neuroscience, 9(5), 871–883.
Gallyas, F. (1971). A principle for silver staining of tissue elements by
physical development. Acta Morphologica Academiae Scientiarum Hun-
garicae, 19(1), 57–71.
Gati, G., Lendvai, D., Hokfelt, T., Harkany, T., & Alpar, A. (2014). Revival
of calcium-binding proteins for neuromorphology: Secretagogin typi-
fies distinct cell populations in the avian brain. Brain, Behavior and
Evolution, 83(2), 82–92. https://doi.org/10.1159/000357834
Gebhard, R., Zilles, K., Schleicher, A., Everitt, B. J., Robbins, T. W., &
Divac, I. (1995). Parcellation of the frontal cortex of the New World
monkey Callithrix jacchus by eight neurotransmitter-binding sites.
Anatomy and Embryology, 191(6), 509–517.
Geyer, S., Matelli, M., Luppino, G., Schleicher, A., Jansen, Y., Palomero-Gal-
lagher, N., & Zilles, K. (1998). Receptor autoradiographic mapping of the
mesial motor and premotor cortex of the macaque monkey. The Journal
of Comparative Neurology, 397(2), 231–250. https://doi.org/10.1002/(SICI)1096-9861(19980727)397:2<231::AID-CNE6>3.0.CO;2-1 [pii]
Graebenitz, S., Kedo, O., Speckmann, E. J., Gorji, A., Panneck, H., Hans,
V., . . . Pape, H. C. (2011). Interictal-like network activity and receptor
expression in the epileptic human lateral amygdala. Brain, 134(Pt 10),
2929–2947. https://doi.org/10.1093/brain/awr202
G€unt€urk€un, O., & Bugnyar, T. (2016). Cognition without Cortex. Trends in
Cognitive Sciences, 20(4), 291–303. https://doi.org/10.1016/j.tics.
2016.02.001
Hanics, J., Teleki, G., Alpar, A., Szekely, A. D., & Csillag, A. (2016). Multi-
ple amygdaloid divisions of arcopallium send convergent projections
to the nucleus accumbens and neighboring subpallial amygdala
regions in the domestic chicken: A selective pathway tracing and
reconstruction study. Brain Structure & Function, 222, 301–315.https://doi.org/10.1007/s00429-016-1219-8
Herold, C., Bingman, V. P., Strockens, F., Letzner, S., Sauvage, M., Palo-
mero-Gallagher, N., . . . G€unt€urk€un, O. (2014). Distribution of neuro-
transmitter receptors and zinc in the pigeon (Columba livia)
hippocampal formation: A basis for further comparison with the
mammalian hippocampus. Journal of Comparative Neurology, 522(11),
2553–2575. https://doi.org/10.1002/cne.23549
Herold, C., Coppola, V. J., & Bingman, V. P. (2015). The maturation of
research into the avian hippocampal formation: Recent discoveries
from one of the nature’s foremost navigators. Hippocampus, 25(11),
1193–1211. https://doi.org/10.1002/hipo.22463
Herold, C., Diekamp, B., & G€unt€urk€un, O. (2008). Stimulation of dopa-
mine D1 receptors in the avian fronto-striatal system adjusts daily
cognitive fluctuations. Behavioural Brain Research, 194(2), 223–229.https://doi.org/10.1016/j.bbr.2008.07.017
Herold, C., Joshi, I., Chehadi, O., Hollmann, M., & G€unt€urk€un, O. (2012).
Plasticity in D1-like receptor expression is associated with different
components of cognitive processes. PLoS One, 7(5), e36484. https://
doi.org/10.1371/journal.pone.0036484
Herold, C., Palomero-Gallagher, N., G€unturk€un, O., & Zilles, K. (2012).
Serotonin 5-HT(1A) receptor binding sites in the brain of the pigeon
(Columba livia). Neuroscience, 200, 1–12. https://doi.org/S0306-4522(11)01259-0 [pii]10.1016/j.neuroscience.2011.10.050
Herold, C., Palomero-Gallagher, N., Hellmann, B., Kr€oner, S., Theiss, C.,
G€unt€urk€un, O., & Zilles, K. (2011). The receptor architecture of the
pigeons’ nidopallium caudolaterale: An avian analogue to the mam-
malian prefrontal cortex. Brain Structure and Function, 216(3), 239–254. https://doi.org/10.1007/s00429-011-0301-5
Husband, S. A., & Shimizu, T. (1999). Efferent projections of the ectos-
triatum in the pigeon (Columba livia). The Journal of Comparative Neu-
rology, 406(3), 329–345.
Jarvis, E. D., G€unt€urk€un, O., Bruce, L., Csillag, A., Karten, H., Kuenzel, W.,
. . . Avian Brain Nomenclature, C. (2005). Avian brains and a new
understanding of vertebrate brain evolution. Nature Reviews. Neuro-
science, 6(2), 151–159. https://doi.org/10.1038/nrn1606
Jarvis, E. D., Yu, J., Rivas, M. V., Horita, H., Feenders, G., Whitney, O., . . .
Wada, K. (2013). Global view of the functional molecular organization
of the avian cerebrum: Mirror images and functional columns. Journal
of Comparative Neurology, 521(16), 3614–3665. https://doi.org/10.
1002/cne.23404
Karten, H., & Hodos, W. (1967). A stereotaxic atlas of the brain of the
pigeon (Columba livia). Baltimore: The Johns Hopkins University Press.
Karten, H. J. (2015). Vertebrate brains and evolutionary connectomics:
On the origins of the mammalian ‘neocortex’. Philosophical Transac-tions of the Royal Society of London. Series B, Biological Sciences, 370
(1684), https://doi.org/10.1098/rstb.2015.0060
Kohler, E. C., Messer, W. S., Jr., & Bingman, V. P. (1995). Evidence for
muscarinic acetylcholine receptor subtypes in the pigeon telencepha-
lon. The Journal of Comparative Neurology, 362(2), 271–282. https://doi.org/10.1002/cne.903620209
Kr€oner, S., & G€unt€urk€un, O. (1999). Afferent and efferent connections of
the caudolateral neostriatum in the pigeon (Columba livia): A retro-
and anterograde pathway tracing study. Journal of Comparative Neu-
rology, 407(2), 228–260. https://doi.org/10.1002/(SICI)1096-9861
(19990503)407:2<228::AID-CNE6>3.0.CO;2-2 [pii]
Kubikova, L., Wada, K., & Jarvis, E. D. (2010). Dopamine receptors in a
songbird brain. The Journal of Comparative Neurology, 518(6), 741–769. https://doi.org/10.1002/cne.22255
Kuenzel, W. J., Medina, L., Csillag, A., Perkel, D. J., & Reiner, A. (2011).
The avian subpallium: New insights into structural and functional
subdivisions occupying the lateral subpallial wall and their embryolog-
ical origins. Brain Research, 1424, 67–101. https://doi.org/10.1016/j.brainres.2011.09.037
Lanuza, E., Davies, D. C., Landete, J. M., Novejarque, A., & Martinez, G.,
F. (2000). Distribution of CGRP-like immunoreactivity in the chick
and quail brain. The Journal of Comparative Neurology, 421(4), 515–532.
Letzner, S., Simon, A., & G€unt€urk€un, O. (2016). Connectivity and neuro-
chemistry of the commissura anterior of the pigeon (Columba livia).
The Journal of Comparative Neurology, 524(2), 343–361. https://doi.org/10.1002/cne.23858
Leutgeb, S., Husband, S., Riters, L. V., Shimizu, T., & Bingman, V. P.
(1996). Telencephalic afferents to the caudolateral neostriatum of the
pigeon. Brain Research, 730(1–2), 173–181. https://doi.org/0006-
8993(96)00444-1 [pii]
Lillethorup, T. P., Iversen, P., Fontain, J., Wegener, G., Doudet, D. J., &
Landau, A. M. (2015). Electroconvulsive shocks decrease alpha2-
adrenoceptor binding in the Flinders rat model of depression.
464 | The Journal ofComparative Neurology
HEROLD ET AL.
European Neuropsychopharmacology, 25(3), 404–412. https://doi.org/10.1016/j.euroneuro.2014.12.003
Lovell, P. V., Clayton, D. F., Replogle, K. L., & Mello, C. V. (2008). Bird-
song “transcriptomics”: Neurochemical specializations of the oscine
song system. PLoS One, 3(10), e3440. https://doi.org/10.1371/jour-
nal.pone.0003440
Martinez-Vargas, M. C., Stumpf, W. E., & Sar, M. (1976). Anatomical dis-
tribution of estrogen target cells in the avian CNS: A comparison
with the mammalian CNS. The Journal of Comparative Neurology, 167
(1), 83–103. https://doi.org/10.1002/cne.901670106
Mash, D. C., & Potter, L. T. (1986). Autoradiographic localization of M1
and M2 muscarine receptors in the rat brain. Neuroscience, 19(2),
551–564.
Medina, L., & Abell�an, A. (2009). Development and evolution of the pal-
lium. Seminars in Cell & Developmental Biology, 20(6), 698–711.https://doi.org/10.1016/j.semcdb.2009.04.008
Medina, L., Bupesh, M., & Abell�an, A. (2011). Contribution of genoarchi-
tecture to understanding forebrain evolution and development, with
particular emphasis on the amygdala. Brain, Behavior and Evolution,
78(3), 216–236. https://doi.org/10.1159/000330056
Merker, B. (1983). Silver staining of cell bodies by means of physical
development. Journal of Neuroscience Methods, 9(3), 235–241.
Montiel, J. F., & Molnar, Z. (2013). The impact of gene expression analysis
on evolving views of avian brain organization. The Journal of Comparative
Neurology, 521(16), 3604–3613. https://doi.org/10.1002/cne.23403
Moreno, N., & Gonzalez, A. (2007). Evolution of the amygdaloid complex
in vertebrates, with special reference to the anamnio-amniotic transi-
tion. Journal of Anatomy, 211(2), 151–163. https://doi.org/10.1111/j.1469-7580.2007.00780.x
Mulder, J., Spence, L., Tortoriello, G., Dinieri, J. A., Uhlen, M., Shui, B., . . .
Harkany, T. (2010). Secretagogin is a Ca21-binding protein identify-
ing prospective extended amygdala neurons in the developing mam-
malian telencephalon. European Journal of Neuroscience, 31(12),
2166–2177. https://doi.org/10.1111/j.1460-9568.2010.07275.x
Nomura, T., Hattori, M., & Osumi, N. (2009). Reelin, radial fibers and
cortical evolution: insights from comparative analysis of the mamma-
lian and avian telencephalon. Development, Growth & Differentiation,
51(3), 287–297. https://doi.org/10.1111/j.1440-169X.2008.01073.x
Olson, C. R., Hodges, L. K., & Mello, C. V. (2015). Dynamic gene expres-
sion in the song system of zebra finches during the song learning
period. Developmental Neurobiology, 75(12), 1315–1338. https://doi.org/10.1002/dneu.22286
Palomero-Gallagher, N., Vogt, B. A., Schleicher, A., Mayberg, H. S., Zilles,
K. (2009). Receptor architecture of human cingulate cortex: evalua-
tion of the four-region neurobiological model. Human Brain Mapping,
30(8), 2336–2355. https://doi.org/10.1002/hbm.20667
Palomero-Gallagher, N., Schleicher, A., Zilles, K., & Loscher, W. (2010).
The circling ci2 rat mutant revisited: Receptor architecture of the
motor cortex. Neuroscience, 170(2), 542–550. https://doi.org/10.
1016/j.neuroscience.2010.07.043
Palomero-Gallagher, N., & Zilles, K. (2004). Isocortex. In G. Paxinos (ed), The
rat nervous system (3rd ed., pp. 729–757). San Diego: Acadamic Press.
Palomero-Gallagher, N., Zilles, K., Schleicher, A., & Vogt, B. A. (2013).
Cyto- and receptor architecture of area 32 in human and macaque
brains. The Journal of Comparative Neurology, 521(14), 3272–3286.https://doi.org/10.1002/cne.23346
Paxinos, G., Kus, L., Ashwell, K., & Watson, C. (1999). Chemoarchitecture
of the rat forebrain. San Diego: Academic Press.
Paxinos, G., & Watson, C. (2005). The Rat Brain in Stereotaxic Coordinates.
Elsevier Academic Press.
Pfenning, A. R., Hara, E., Whitney, O., Rivas, M. V., Wang, R., Roulhac, P.
L., . . . Jarvis, E. D. (2014). Convergent transcriptional specializations
in the brains of humans and song-learning birds. Science, 346(6215),
1256846. https://doi.org/10.1126/science.1256846
Puelles, L. (2011). Pallio-pallial tangential migrations and growth signal-
ing: new scenario for cortical evolution? Brain, Behavior and Evolution,
78(1), 108–127. https://doi.org/10.1159/000327905
Puelles, L., Kuwana, E., Puelles, E., Bulfone, A., Shimamura, K., Keleher, J.,
. . . Rubenstein, J. L. (2000). Pallial and subpallial derivatives in the
embryonic chick and mouse telencephalon, traced by the expression
of the genes Dlx-2, Emx-1, Nkx-2.1, Pax-6, and Tbr-1. The Journal of
Comparative Neurology, 424(3), 409–438.
Puelles, L., Martinez-de-la-Torre, M., Paxinos, G., Watson, C., & Martinez,
S. (2007). The chick brain in stereotaxic coordinates: An Atlas featuring
neuromeric subdivisions and mammalian homologies. London: Academic
Press.
Puelles, L., Medina, L., Borello, U., Legaz, I., Teissier, A., Pierani, A., &
Rubenstein, J. L. (2015). Radial derivatives of the mouse ventral pal-
lium traced with Dbx1-LacZ reporters. Journal of Chemical Neuroanat-
omy, 75(Pt A), 2–19 https://doi.org/10.1016/j.jchemneu.2015.10.011
Reiner, A., & Karten, H. J. (1985). Comparison of olfactory bulb projections
in pigeons and turtles. Brain, Behavior and Evolution, 27(1), 11–27.
Reiner, A., Perkel, D. J., Bruce, L. L., Butler, A. B., Csillag, A., Kuenzel, W.
. . . Avian Brain Nomenclature Forum. (2004). Revised nomenclature
for avian telencephalon and some related brainstem nuclei. The Jour-
nal of Comparative Neurology, 473(3), 377–414. https://doi.org/10.
1002/cne.20118
Roberts, T. F., Hall, W. S., & Brauth, S. E. (2002). Organization of the
avian basal forebrain: Chemical anatomy in the parrot (Melopsittacus
undulatus). The Journal of Comparative Neurology, 454(4), 383–408.https://doi.org/10.1002/cne.10456
Sah, P., Faber, E. S., Lopez De Armentia, M., & Power, J. (2003). The
amygdaloid complex: Anatomy and physiology. Physiological Reviews,
83(3), 803–834. https://doi.org/10.1152/physrev.00002.2003
Saint-Dizier, H., Constantin, P., Davies, D. C., Leterrier, C., Levy, F., &
Richard, S. (2009). Subdivisions of the arcopallium/posterior pallial
amygdala complex are differentially involved in the control of fear
behaviour in the Japanese quail. Brain Research Bulletin, 79(5), 288–295. https://doi.org/10.1016/j.brainresbull.2009.03.004
Sanders, J. D., Szot, P., Weinshenker, D., Happe, H. K., Bylund, D. B., &
Murrin, L. C. (2006). Analysis of brain adrenergic receptors in
dopamine-beta-hydroxylase knockout mice. Brain Research, 1109(1),
45–53. https://doi.org/10.1016/j.brainres.2006.06.033
Scarf, D., Stuart, M., Johnston, M., & Colombo, M. (2016). Visual
response properties of neurons in four areas of the avian pallium.
Journal of Comparative Physiology. A, Neuroethology, Sensory, Neural,
and Behavioral Physiology, 202(3), 235–245. https://doi.org/10.1007/s00359-016-1071-6
Schall, U., G€unt€urk€un, O., & Delius, J. D. (1986). Sensory projections to
the nucleus basalis prosencephali of the pigeon. Cell and Tissue
Research, 245(3), 539–546.
Scheperjans, F., Grefkes, C., Palomero-Gallagher, N., Schleicher, A., &
Zilles, K. (2005). Subdivisions of human parietal area 5 revealed by
quantitative receptor autoradiography: A parietal region between
motor, somatosensory, and cingulate cortical areas. Neuroimage, 25
(3), 975–992. https://doi.org/10.1016/j.neuroimage.2004.12.017
Scheperjans, F., Palomero-Gallagher, N., Grefkes, C., Schleicher, A., &
Zilles, K. (2005). Transmitter receptors reveal segregation of cortical
areas in the human superior parietal cortex: Relations to visual and
somatosensory regions. Neuroimage, 28(2), 362–379. https://doi.org/10.1016/j.neuroimage.2005.06.028
HEROLD ET AL. The Journal ofComparative Neurology
| 465
Shanahan, M., Bingman, V. P., Shimizu, T., Wild, M., & G€unt€urk€un, O.
(2013). Large-scale network organization in the avian forebrain: A
connectivity matrix and theoretical analysis. Frontiers in Computational
Neuroscience, 7, 89. https://doi.org/10.3389/fncom.2013.00089
Sun, Z., & Reiner, A. (2000). Localization of dopamine D1A and D1B
receptor mRNAs in the forebrain and midbrain of the domestic chick.
Journal of Chemical Neuroanatomy, 19(4), 211–224.
Swanson, L. W. (2000). Cerebral hemisphere regulation of motivated
behavior. Brain Research, 886(1–2), 113–164.
Swanson, L. W., & Petrovich, G. D. (1998). What is the amygdala? Trends
in Neurosciences, 21(8), 323–331.
Sz�ek�ely, A. D., & Krebs, J. R. (1996). Efferent connectivity of the hippo-
campal formation of the zebra finch (Taenopygia guttata): An antero-
grade pathway tracing study using Phaseolus vulgaris leucoagglutinin.
Journal of Comparative Neurology, 368(2), 198–214. https://doi.org/10.1002/(SICI)1096-9861(19960429)368:2<198::AID-CNE3>3.0.
CO;2-Z [pii]10.1002/(SICI)1096–9861(19960429)368:2<198::AID-
CNE3>3.0.CO;2-Z
Thompson, R. R., Goodson, J. L., Ruscio, M. G., & Adkins-Regan, E.
(1998). Role of the archistriatal nucleus taeniae in the sexual behav-
ior of male Japanese quail (Coturnix japonica): A comparison of func-
tion with the medial nucleus of the amygdala in mammals. Brain,
Behavior and Evolution, 51(4), 215–229.
Veenman, C. L., Wild, J. M., & Reiner, A. (1995). Organization of the
avian “corticostriatal” projection system: A retrograde and antero-
grade pathway tracing study in pigeons. The Journal of Comparative
Neurology, 354(1), 87–126. https://doi.org/10.1002/cne.903540108
Vicario, A., Abell�an, A., Desfilis, E., & Medina, L. (2014). Genetic identifi-
cation of the central nucleus and other components of the central
extended amygdala in chicken during development. Frontiers in Neu-
roanatomy, 8, 90. https://doi.org/10.3389/fnana.2014.00090
Vicario, A., Abell�an, A., & Medina, L. (2015). Embryonic origin of the
Islet1 and Pax6 neurons of the chicken central extended amygdala
using cell migration assays and relation to different neuropeptide-
containing cells. Brain, Behavior and Evolution, 85(3), 139–169.https://doi.org/10.1159/000381004
Vogt, B. A., Hof, P. R., Zilles, K., Vogt, L. J., Herold, C., & Palomero-Gal-
lagher, N. (2013). Cingulate area 32 homologies in mouse, rat, maca-
que and human: Cytoarchitecture and receptor architecture. The
Journal of Comparative Neurology, 521(18), 4189–4204. https://doi.
org/10.1002/cne.23409
Wada, K., Sakaguchi, H., Jarvis, E. D., & Hagiwara, M. (2004). Differential
expression of glutamate receptors in avian neural pathways for
learned vocalization. The Journal of Comparative Neurology, 476(1),
44–64. https://doi.org/10.1002/cne.20201
Wang, R., Chen, C. C., Hara, E., Rivas, M. V., Roulhac, P. L., Howard, J.
T., . . . Jarvis, E. D. (2015). Convergent differential regulation of SLIT-
ROBO axon guidance genes in the brains of vocal learners. The Jour-
nal of Comparative Neurology, 523(6), 892–906. https://doi.org/10.
1002/cne.23719
Whitney, O., Pfenning, A. R., Howard, J. T., Blatti, C. A., Liu, F., Ward, J.
M., . . . Jarvis, E. D. (2014). Core and region-enriched networks of
behaviorally regulated genes and the singing genome. Science, 346
(6215), 1256780. https://doi.org/10.1126/science.1256780
Wild, J. M., Arends, J. J., & Zeigler, H. P. (1984). A trigeminal sensorimo-
tor circuit for pecking, grasping and feeding in the pigeon (Columba
livia). Brain Research, 300(1), 146–151.
Wild, J. M., Arends, J. J., & Zeigler, H. P. (1985). Telencephalic connec-
tions of the trigeminal system in the pigeon (Columba livia): A trigemi-
nal sensorimotor circuit. The Journal of Comparative Neurology, 234(4),
441–464. https://doi.org/10.1002/cne.902340404
Wild, J. M., Arends, J. J., & Zeigler, H. P. (1990). Projections of the parabra-
chial nucleus in the pigeon (Columba livia). The Journal of Comparative
Neurology, 293(4), 499–523. https://doi.org/10.1002/cne.902930402
Wild, J. M., Karten, H. J., & Frost, B. J. (1993). Connections of the auditory
forebrain in the pigeon (Columba livia). The Journal of Comparative Neu-
rology, 337(1), 32–62. https://doi.org/10.1002/cne.903370103
Winkowski, D. E., & Knudsen, E. I. (2007). Top-down control of multimodal
sensitivity in the barn owl optic tectum. The Journal of Neuroscience, 27
(48), 13279–13291. https://doi.org/10.1523/JNEUROSCI.3937-07.2007
Wynne, B., & G€unt€urk€un, O. (1995). Dopaminergic innervation of the tel-
encephalon of the pigeon (Columba livia): A study with antibodies
against tyrosine hydroxylase and dopamine. Journal of Comparative
Neurology, 357(3), 446–464. https://doi.org/10.1002/cne.903570309
Yamamoto, K., & Reiner, A. (2005). Distribution of the limbic system-
associated membrane protein (LAMP) in pigeon forebrain and mid-
brain. The Journal of Comparative Neurology, 486(3), 221–242.https://doi.org/10.1002/cne.20562
Yamamoto, K., Sun, Z., Wang, H. B., & Reiner, A. (2005). Subpallial amyg-
dala and nucleus taeniae in birds resemble extended amygdala and
medial amygdala in mammals in their expression of markers of
regional identity. Brain Research Bulletin, 66(4–6), 341–347. https://doi.org/10.1016/j.brainresbull.2005.02.016
Yilmazer-Hanke, D. M., Roskoden, T., Zilles, K., & Schwegler, H. (2003).
Anxiety-related behavior and densities of glutamate, GABAA, acetyl-
choline and serotonin receptors in the amygdala of seven inbred
mouse strains. Behavioural Brain Research, 145(1–2), 145–159.
Zeier, H., & Karten, H. J. (1971). The archistriatum of the pigeon: Organization
of afferent and efferent connections. Brain Research, 31(2), 313–326.
Zilles, K. (2005). Evolution of the human brain and comparative cyto-
and receptor architecture. In S. Dehaene, J.-R. Duhamel, M. Hauser,
& G. Rizzolatti (Eds), From monkey brain to human brain (pp. 41–56).Cambridge: MIT Press.
Zilles, K., & Palomero-Gallagher, N. (2016). Comparative analysis of
receptor subtypes that identify primary cortical sensory areas. In J.
Kaas, G. Striedter, L. Krubitzer, S. Herculano-Houzel, & T. Preuss
(Eds.), Evolution of the nervous system. Oxford: Elsevier.
Zilles, K., Palomero-Gallagher, N., Grefkes, C., Scheperjans, F., Boy, C.,
Amunts, K., & Schleicher, A. (2002). Architectonics of the human cere-
bral cortex and transmitter receptor fingerprints: Reconciling functional
neuroanatomy and neurochemistry. European Neuropsychopharmacology,
12(6), 587–599. https://doi.org/S0924977X02001086 [pii]
Zilles, K., Palomero-Gallagher, N., & Schleicher, A. (2004). Transmitter recep-
tors and functional anatomy of the cerebral cortex. Journal of Anatomy,
205(6), 417–432. https://doi.org/10.1111/j.0021-8782.2004.00357.x
Zilles, K., Schlaug, G., Matelli, M., Luppino, G., Schleicher, A., Qu, M., . . .
Roland, P. E. (1995). Mapping of human and macaque sensorimotor
areas by integrating architectonic, transmitter receptor, MRI and PET
data. Journal of Anatomy, 187(Pt 3), 515–537.
Zilles, K., Schleicher, A., Palomero-Gallagher, N., & Amunts, K. (2002).
Quantitative analysis of cyto- and receptor architecture of thehuman
brain. In J.C. Mazziotta & A. Toga (Eds.), Brain mapping: The methods
(pp. 573–602). Amsterdam: Elsevier.
How to cite this article: Herold C, Paulitschek C, Palomero-Gal-
lagher N, G€unt€urk€un O, Zilles K. Transmitter receptors reveal
segregation of the arcopallium/amygdala complex in pigeons
(Columba livia). J Comp Neurol. 2018;526:439–466. https://doi.
org/10.1002/cne.24344
466 | The Journal ofComparative Neurology
HEROLD ET AL.