Embed Size (px)
Citation preview

Transmission of material in this release is embargoed until USDL-12-1834 8:30 a.m. (EDT) Friday, September 14, 2012 Technical information: (202) 691-7000 • [email protected] • www.bls.gov/cpi Media Contact: (202) 691-5902 • [email protected]
CONSUMER PRICE INDEX – AUGUST 2012 The Consumer Price Index for All Urban Consumers (CPI-U) increased 0.6 percent in August on a seasonally adjusted basis, the U.S. Bureau of Labor Statistics reported today. Over the last 12 months, the all items index increased 1.7 percent before seasonal adjustment. The seasonally adjusted increase in the all items index was the largest since June 2009. About 80 percent of the increase was accounted for by the gasoline index, which rose 9.0 percent and was the major factor in the energy index rising sharply in August after declining in each of the four previous months. The food index increased 0.2 percent in August, with major grocery store food group indexes mixed. The index for all items less food and energy rose 0.1 percent for the second month in a row. The indexes for shelter, medical care, personal care, new vehicles, and recreation all rose in August. These increases more than offset declines in the indexes for used cars and trucks, apparel, household furnishings and operations, and airline fares. The 12-month change in the index for all items was 1.7 percent in August, an increase from the July figure of 1.4 percent. The index for all items less food and energy rose 1.9 percent for the 12 months ending August, a slight decline from the 2.1 percent figure in July and its smallest increase since July 2011.
-0.3-0.2-0.10.00.10.20.30.40.50.6
Aug'11 Sep Oct Nov Dec Jan Feb Mar Apr May Jun Jul Aug'12
Chart 1. One-month percent change in CPI for All Urban Consumers (CPI-U), seasonally adjusted, Aug. 2011 - Aug. 2012Percent change
0.3 0.3
0.0 0.1
0.0
0.2
0.4 0.3
0.0
-0.3
0.0 0.0
0.6

- 2 -
Chart 2. 12-month percent change in CPI for All Urban Consumers (CPI-U), not seasonally adjusted, Aug. 2011 - Aug. 2012Percent change
All items All items less food and energy
1.0
1.5
2.0
2.5
3.0
3.5
4.0
Aug'11 Sep Oct Nov Dec Jan Feb Mar Apr May Jun Jul Aug'12

- 3 -
Consumer Price Index Data for August 2012 Food The food index rose 0.2 percent in August after a 0.1 percent increase in July and has risen 2.0 percent over the past 12 months. The food at home index, which was unchanged in July, increased 0.1 percent in August. The food at home index has been stable in recent months, increasing a total of 0.1 percent since April. Three of the six major grocery store food group indexes increased in August. The fruits and vegetables index increased 0.5 percent in August after declining in July, with the index for fresh fruits rising 1.9 percent but the fresh vegetables index declining 1.3 percent. The index for meats, poultry, fish, and eggs rose 0.4 percent in August, its third consecutive increase. The index for dairy and related products rose 0.1 percent, ending a streak of six consecutive declines. In contrast to these increases the index for nonalcoholic beverages fell 0.2 percent in August after a 0.5 percent July decrease, and the index for other food at home fell 0.1 percent. The index for cereals and bakery products was unchanged in August. The index for food away from home rose 0.3 percent in August and has risen 2.8 percent over the last 12 months. Energy The energy index, which had declined in each of the four previous months, rose 5.6 percent in August. This was its largest increase since June 2009. The gasoline index accounted for most of the increase, rising 9.0 percent. (Before seasonal adjustment, gasoline prices increased 7.2 percent in August.) However, the other major energy indexes, which had all declined in July, increased as well. The fuel oil index increased 4.6 percent, the index for natural gas rose 2.8 percent, and the electricity index advanced 0.2 percent. Over the last 12 months, the energy index has declined 0.6 percent. The gasoline index has risen 1.8 percent over that span, but the other major indexes have declined, with the index for natural gas down 11.2 percent, the electricity index down 1.2 percent, and the fuel oil index down 0.8 percent. All items less food and energy The index for all items less food and energy increased 0.1 percent in August, the same increase as in July. The index for shelter, which rose 0.1 percent in July, rose 0.2 percent in August. The rent index increased 0.2 percent and the index for owners’ equivalent rent rose 0.3 percent, but the index for lodging away from home fell 0.6 percent. The medical care index rose 0.2 percent in August after rising 0.4 percent in July. The indexes for personal care, new vehicles, and recreation also increased in August. In contrast to these increases, several indexes declined in August. The index for used cars and trucks fell 0.9 percent, the apparel index fell 0.5 percent, and the index for household furnishings and operations fell 0.3 percent. The index for airline fares fell 1.3 percent in August, its third decline in a row, and the tobacco index also declined. The index for all items less food and energy has risen 1.9 percent over the last 12 months; this figure has been trending down slightly since its recent peak of 2.3 percent in March, April, and May. Indexes for most major components have increased over the period, though the indexes for used cars and trucks and airline fares show declines. The medical care index rose 4.1 percent and the shelter index increased 2.1 percent.

- 4 -
Not seasonally adjusted CPI measures The Consumer Price Index for All Urban Consumers (CPI-U) increased 1.7 percent over the last 12 months to an index level of 230.379 (1982-84=100). For the month, the index increased 0.6 percent prior to seasonal adjustment. The Consumer Price Index for Urban Wage Earners and Clerical Workers (CPI-W) increased 1.7 percent over the last 12 months to an index level of 227.056 (1982-84=100). For the month, the index increased 0.7 percent prior to seasonal adjustment. The Chained Consumer Price Index for All Urban Consumers (C-CPI-U) increased 1.5 percent over the last 12 months. For the month, the index increased 0.4 percent on a not seasonally adjusted basis. Please note that the indexes for the post-2010 period are subject to revision. The Consumer Price Index for September 2012 is scheduled to be released on Tuesday, October 16, 2012, at 8:30 a.m. (EDT).

- 5 -
Facilities for Sensory Impaired Information from this release will be made available to sensory impaired individuals upon request. Voice phone: 202-691-5200, Federal Relay Services: 1-800-877-8339. Brief Explanation of the CPI
The Consumer Price Index (CPI) is a measure of the average change in prices over time of goods and services purchased by households. The Bureau of Labor Statistics publishes CPIs for two population groups: (1) the CPI for Urban Wage Earners and Clerical Workers (CPI-W), which covers households of wage earners and clerical workers that comprise approximately 29 percent of the total population and (2) the CPI for All Urban Consumers (CPI-U) and the Chained CPI for All Urban Consumers (C-CPI-U), which cover approximately 88 percent of the total population and include in addition to wage earners and clerical worker households, groups such as professional, managerial, and technical workers, the self-employed, short-term workers, the unemployed, and retirees and others not in the labor force.
The CPIs are based on prices of food, clothing, shelter, and fuels, transportation fares, charges for doctors’ and dentists’ services, drugs, and other goods and services that people buy for day-to-day living. Prices are collected each month in 87 urban areas across the country from about 4,000 housing units and approximately 26,000 retail establishments-department stores, supermarkets, hospitals, filling stations, and other types of stores and service establishments. All taxes directly associated with the purchase and use of items are included in the index. Prices of fuels and a few other items are obtained every month in all 87 locations. Prices of most other commodities and services are collected every month in the three largest geographic areas and every other month in other areas. Prices of most goods and services are obtained by personal visits or telephone calls of the Bureau’s trained representatives.
In calculating the index, price changes for the various items in each location are averaged together with weights, which represent their importance in the spending of the appropriate population group. Local data are then combined to obtain a U.S. city average. For the CPI-U and CPI-W separate indexes are also published by size of city, by region of the country, for cross-classifications of regions and population-size classes, and for 27 local areas. Area indexes do not measure differences in the level of prices among cities; they only measure the average change in prices for each area since the base period. For the C-CPI-U data are issued only at the national level. It is important to note that the CPI-U and CPI-W are considered final when released, but the C-CPI-U is issued in preliminary form and subject to two annual revisions.
The index measures price change from a designed reference date. For the CPI-U and the CPI-W the reference base is 1982-84 equals 100. The reference base for the C-CPI-U is December 1999 equals 100. An increase of 16.5 percent from the reference base, for example, is shown as 116.500. This change can also be expressed in dollars as follows: the price of a base period market basket of goods and services in the CPI has risen from $10 in 1982-84 to $11.65.
For further details visit the CPI home page on the Internet at http://www.bls.gov/cpi/ or contact our CPI Information and Analysis Section on (202) 691-7000.

- 6 -
Note on Sampling Error in the Consumer Price Index
The CPI is a statistical estimate that is subject to sampling error because it is based upon a sample of retail prices and not the complete universe of all prices. BLS calculates and publishes estimates of the 1-month, 2-month, 6-month and 12-month percent change standard errors annually, for the CPI-U. These standard error estimates can be used to construct confidence intervals for hypothesis testing. For example, the estimated standard error of the 1 month percent change is 0.03 percent for the U.S. All Items Consumer Price Index. This means that if we repeatedly sample from the universe of all retail prices using the same methodology, and estimate a percentage change for each sample, then 95% of these estimates would be within 0.06 percent of the 1 month percentage change based on all retail prices. For example, for a 1-month change of 0.2 percent in the All Items CPI for All Urban Consumers, we are 95 percent confident that the actual percent change based on all retail prices would fall between 0.14 and 0.26 percent. For the latest data, including information on how to use the estimates of standard error, see “Variance Estimates for Price Changes in the Consumer Price Index, January-December 2011”. These data are available on the CPI home page (http://www.bls.gov/cpi), or by using the following link http://www.bls.gov/cpi/cpivar2011.pdf Calculating Index Changes Movements of the indexes from one month to another are usually expressed as percent changes rather than changes in index points, because index point changes are affected by the level of the index in relation to its base period while percent changes are not. The example below illustrates the computation of index point and percent changes.
Percent changes for 3-month and 6-month periods are expressed as annual rates and are computed according to the standard formula for compound growth rates. These data indicate what the percent change would be if the current rate were maintained for a 12-month period. Index Point Change CPI 202.416 Less previous index 201.800 Equals index point change .616 Percent Change Index point difference .616 Divided by the previous index 201.800 Equals 0.003 Results multiplied by one hundred 0.003x100 Equals percent change 0.3

- 7 -
Regions Defined The states in the four regions are listed below. The Northeast--Connecticut, Maine, Massachusetts, New Hampshire, New York, New Jersey, Pennsylvania, Rhode Island, and Vermont. The Midwest--Illinois, Indiana, Iowa, Kansas, Michigan, Minnesota, Missouri, Nebraska, North Dakota, Ohio, South Dakota, and Wisconsin. The South--Alabama, Arkansas, Delaware, Florida, Georgia, Kentucky, Louisiana, Maryland, Mississippi, North Carolina, Oklahoma, South Carolina, Tennessee, Texas, Virginia, West Virginia, and the District of Columbia. The West--Alaska, Arizona, California, Colorado, Hawaii, Idaho, Montana, Nevada, New Mexico, Oregon, Utah, Washington, and Wyoming. A Note on Seasonally Adjusted and Unadjusted Data Because price data are used for different purposes by different groups, the Bureau of Labor Statistics publishes seasonally adjusted as well as unadjusted changes each month. For analyzing general price trends in the economy, seasonally adjusted changes are usually preferred since they eliminate the effect of changes that normally occur at the same time and in about the same magnitude every year--such as price movements resulting from changing climatic conditions, production cycles, model changeovers, holidays, and sales. The unadjusted data are of primary interest to consumers concerned about the prices they actually pay. Unadjusted data also are used extensively for escalation purposes. Many collective bargaining contract agreements and pension plans, for example, tie compensation changes to the Consumer Price Index before adjustment for seasonal variation. Seasonal factors used in computing the seasonally adjusted indexes are derived by the X-12-ARIMA Seasonal Adjustment Method. Seasonally adjusted indexes and seasonal factors are computed annually. Each year, the last 5 years of seasonally adjusted data are revised. Data from January 2007 through December 2011 were replaced in January 2012. Exceptions to the usual revision schedule were: the updated seasonal data at the end of 1977 replaced data from 1967 through 1977; and, in January 2002, dependently seasonally adjusted series were revised for January 1987-December 2001 as a result of a change in the aggregation weights for dependently adjusted series. For further information, please see “Aggregation of Dependently Adjusted Seasonally Adjusted Series,” in the October 2001 issue of the CPI Detailed Report. Effective with the publication of data from January 2006 through December 2010 in January 2011, the Video and audio series and the Information technology, hardware and services series were changed from independently adjusted to dependently adjusted. This resulted in an increase in the number of seasonal components used in deriving seasonal movement of the All items and 54 other lower level aggregations, from 73 for the publication of January 1998 through December 2005 data to 82 for the publication of seasonally adjusted data for January 2006 and later. Each year the seasonal status of every series is reevaluated based upon certain statistical criteria. If any of the 82 components change their seasonal adjustment status from seasonally adjusted to not seasonally adjusted, not seasonally adjusted data will be used in the aggregation of the dependent series for the last 5 years, but the seasonally adjusted indexes before that period will not be changed. Note: 38 of the 82 components are not seasonally adjusted for 2012.

- 8 -
Seasonally adjusted data, including the all items index levels, are subject to revision for up to five years after their original release. For this reason, BLS advises against the use of these data in escalation agreements. Effective with the calculation of the seasonal factors for 1990, the Bureau of Labor Statistics has used an enhanced seasonal adjustment procedure called Intervention Analysis Seasonal Adjustment for some CPI series. Intervention Analysis Seasonal Adjustment allows for better estimates of seasonally adjusted data. Extreme values and/or sharp movements which might distort the seasonal pattern are estimated and removed from the data prior to calculation of seasonal factors. Beginning with the calculation of seasonal factors for 1996, X-12-ARIMA software was used for Intervention Analysis Seasonal Adjustment. For the seasonal factors introduced in January 2012, BLS adjusted 31 series using Intervention Analysis Seasonal Adjustment, including selected food and beverage items, motor fuels, electricity and vehicles. For example, this procedure was used for the Motor fuel series to offset the effects of events such as damage to oil refineries from Hurricane Katrina. For a complete list of Intervention Analysis Seasonal Adjustment series and explanations, please refer to the article “Intervention Analysis Seasonal Adjustment”, located on our website at http://www.bls.gov/cpi/cpisapage.htm. For additional information on seasonal adjustment in the CPI, please write to the Bureau of Labor Statistics, Division of Consumer Prices and Price Indexes, Washington, DC 20212 or contact David Levin at (202) 691-6968, or by e-mail at [email protected]. If you have general questions about the CPI, please call our information staff at (202) 691-7000.

Table 1. Consumer Price Index for All Urban Consumers (CPI-U): U.S. city average, by expenditure category,August 2012[1982-84=100, unless otherwise noted]
Expenditure category
Relativeimpor-tanceJul.
2012
Unadjusted indexes Unadjusted percentchange
Seasonally adjusted percentchange
Aug.2011
Jul.2012
Aug.2012
Aug.2011-Aug.2012
Jul.2012-Aug.2012
May2012-Jun.2012
Jun.2012-Jul.
2012
Jul.2012-Aug.2012
All items.. . . . . . . . . . . . . . . . . . . . . . . . . . . . . . . . . . . . . . . . . . . . . . . 100.000 226.545 229.104 230.379 1.7 0.6 0.0 0.0 0.6Food.. . . . . . . . . . . . . . . . . . . . . . . . . . . . . . . . . . . . . . . . . . . . . . . . . 14.235 229.554 233.630 234.156 2.0 0.2 0.2 0.1 0.2
Food at home.. . . . . . . . . . . . . . . . . . . . . . . . . . . . . . . . . . . 8.558 228.354 231.306 231.708 1.5 0.2 0.1 0.0 0.1Cereals and bakery products. . . . . . . . . . . . . . . . 1.235 262.970 268.449 267.794 1.8 -0.2 -0.4 0.3 0.0Meats, poultry, fish, and eggs. . . . . . . . . . . . . . . 1.951 225.651 231.309 232.475 3.0 0.5 0.2 0.3 0.4Dairy and related products1 . . . . . . . . . . . . . . . . . 0.886 216.720 214.434 214.549 -1.0 0.1 -0.3 -0.5 0.1Fruits and vegetables.. . . . . . . . . . . . . . . . . . . . . . . . 1.252 282.579 280.173 280.672 -0.7 0.2 1.3 -0.3 0.5Nonalcoholic beverages and beverage
materials. . . . . . . . . . . . . . . . . . . . . . . . . . . . . . . . . . . . . 0.941 168.268 167.375 167.622 -0.4 0.1 0.1 -0.5 -0.2Other food at home.. . . . . . . . . . . . . . . . . . . . . . . . . . 2.293 200.054 205.508 205.864 2.9 0.2 -0.1 0.0 -0.1
Food away from home1 . . . . . . . . . . . . . . . . . . . . . . . . 5.677 232.513 238.337 239.057 2.8 0.3 0.2 0.2 0.3
Energy. . . . . . . . . . . . . . . . . . . . . . . . . . . . . . . . . . . . . . . . . . . . . . . 9.849 251.706 239.972 250.306 -0.6 4.3 -1.4 -0.3 5.6Energy commodities. . . . . . . . . . . . . . . . . . . . . . . . . . . . . 5.957 315.330 299.361 320.214 1.5 7.0 -2.3 0.2 8.6
Fuel oil1 . . . . . . . . . . . . . . . . . . . . . . . . . . . . . . . . . . . . . . . . 0.213 367.286 348.104 364.165 -0.8 4.6 -7.9 -0.5 4.6Motor fuel. . . . . . . . . . . . . . . . . . . . . . . . . . . . . . . . . . . . . . 5.647 311.962 296.502 317.798 1.9 7.2 -2.0 0.2 8.9
Gasoline (all types). . . . . . . . . . . . . . . . . . . . . . . . . 5.468 311.269 295.498 316.859 1.8 7.2 -2.0 0.3 9.0Energy services2 . . . . . . . . . . . . . . . . . . . . . . . . . . . . . . . . 3.891 201.564 193.679 194.136 -3.7 0.2 0.0 -1.1 0.8
Electricity2 . . . . . . . . . . . . . . . . . . . . . . . . . . . . . . . . . . . . . 3.026 205.362 203.318 202.870 -1.2 -0.2 -0.5 -1.3 0.2Utility (piped) gas service2 . . . . . . . . . . . . . . . . . . 0.865 186.808 162.972 165.953 -11.2 1.8 1.7 -0.2 2.8
All items less food and energy. . . . . . . . . . . . . . . . . . . 75.916 225.874 229.893 230.196 1.9 0.1 0.2 0.1 0.1Commodities less food and energy
commodities. . . . . . . . . . . . . . . . . . . . . . . . . . . . . . . . . . . 19.717 146.159 147.137 147.133 0.7 0.0 0.2 0.0 -0.2Apparel. . . . . . . . . . . . . . . . . . . . . . . . . . . . . . . . . . . . . . . . . 3.476 121.547 122.300 123.568 1.7 1.0 0.5 0.2 -0.5New vehicles. . . . . . . . . . . . . . . . . . . . . . . . . . . . . . . . . . 3.169 142.327 143.953 143.749 1.0 -0.1 0.2 -0.1 0.2Used cars and trucks. . . . . . . . . . . . . . . . . . . . . . . . . 1.982 155.823 155.815 154.851 -0.6 -0.6 0.0 -0.5 -0.9Medical care commodities1 . . . . . . . . . . . . . . . . . 1.730 324.395 335.048 336.004 3.6 0.3 0.1 0.5 0.3Alcoholic beverages. . . . . . . . . . . . . . . . . . . . . . . . . . 0.949 227.126 231.192 230.674 1.6 -0.2 0.3 -0.1 -0.2Tobacco and smoking products1 . . . . . . . . . . . 0.803 837.427 858.730 857.727 2.4 -0.1 0.4 1.1 -0.1
Services less energy services. . . . . . . . . . . . . . . . . 56.199 274.038 280.024 280.526 2.4 0.2 0.2 0.1 0.1Shelter. . . . . . . . . . . . . . . . . . . . . . . . . . . . . . . . . . . . . . . . . . 31.519 252.546 257.409 257.843 2.1 0.2 0.1 0.1 0.2
Rent of primary residence2 . . . . . . . . . . . . . . . 6.460 254.003 260.107 260.677 2.6 0.2 0.1 0.3 0.2Owners’ equivalent rent of residences2 ,
3 . . . . . . . . . . . . . . . . . . . . . . . . . . . . . . . . . . . . . . . . . . . 23.846 260.178 264.740 265.422 2.0 0.3 0.1 0.2 0.3Medical care services. . . . . . . . . . . . . . . . . . . . . . . . 5.416 424.546 442.305 442.410 4.2 0.0 0.7 0.3 0.2
Physicians’ services2 . . . . . . . . . . . . . . . . . . . . . . 1.615 341.141 348.828 349.608 2.5 0.2 0.8 0.4 0.3Hospital services2 , 4 . . . . . . . . . . . . . . . . . . . . . . 1.540 242.032 254.982 253.380 4.7 -0.6 1.2 0.4 -0.4
Transportation services. . . . . . . . . . . . . . . . . . . . . . 5.773 268.940 272.860 272.651 1.4 -0.1 -0.2 -0.2 0.0Motor vehicle maintenance and repair1
. . . . . . . . . . . . . . . . . . . . . . . . . . . . . . . . . . . . . . . . . . . . . . . . . . . . . . . . . . 1.146 253.337 257.423 257.641 1.7 0.1 0.1 -0.1 0.1Motor vehicle insurance. . . . . . . . . . . . . . . . . . . 2.417 388.619 400.709 403.246 3.8 0.6 0.4 0.4 0.6Airline fare. . . . . . . . . . . . . . . . . . . . . . . . . . . . . . . . . . . 0.773 308.670 305.689 299.284 -3.0 -2.1 -2.5 -2.7 -1.3
1 Not seasonally adjusted.2 This index series was calculated using a Laspeyres estimator. All other item stratum index series were calculated using a geometric means estimator.3 Indexes on a December 1982=100 base.4 Indexes on a December 1996=100 base.
NOTE: Index applies to a month as a whole, not to any specific date.
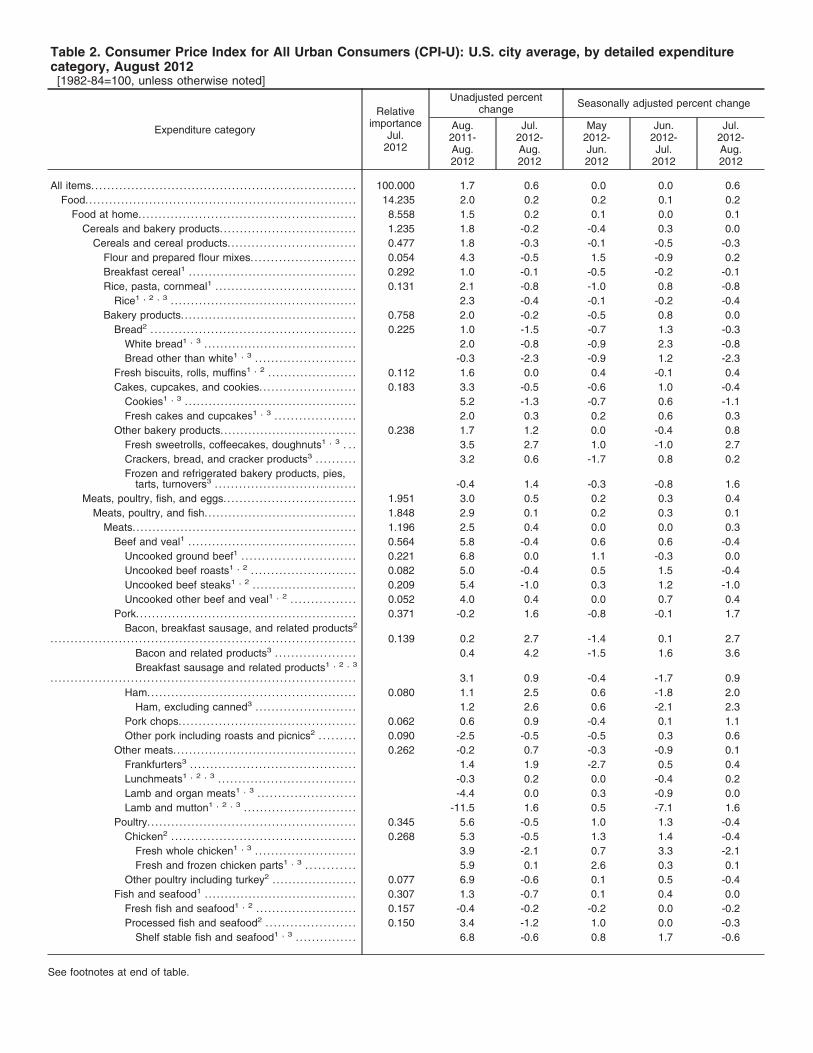
Table 2. Consumer Price Index for All Urban Consumers (CPI-U): U.S. city average, by detailed expenditurecategory, August 2012[1982-84=100, unless otherwise noted]
Expenditure category
Relativeimportance
Jul.2012
Unadjusted percentchange Seasonally adjusted percent change
Aug.2011-Aug.2012
Jul.2012-Aug.2012
May2012-Jun.2012
Jun.2012-Jul.
2012
Jul.2012-Aug.2012
All items.. . . . . . . . . . . . . . . . . . . . . . . . . . . . . . . . . . . . . . . . . . . . . . . . . . . . . . . . . . . . . . . . . 100.000 1.7 0.6 0.0 0.0 0.6Food.. . . . . . . . . . . . . . . . . . . . . . . . . . . . . . . . . . . . . . . . . . . . . . . . . . . . . . . . . . . . . . . . . . . 14.235 2.0 0.2 0.2 0.1 0.2
Food at home.. . . . . . . . . . . . . . . . . . . . . . . . . . . . . . . . . . . . . . . . . . . . . . . . . . . . . 8.558 1.5 0.2 0.1 0.0 0.1Cereals and bakery products. . . . . . . . . . . . . . . . . . . . . . . . . . . . . . . . . . 1.235 1.8 -0.2 -0.4 0.3 0.0
Cereals and cereal products. . . . . . . . . . . . . . . . . . . . . . . . . . . . . . . . 0.477 1.8 -0.3 -0.1 -0.5 -0.3Flour and prepared flour mixes. . . . . . . . . . . . . . . . . . . . . . . . . . 0.054 4.3 -0.5 1.5 -0.9 0.2Breakfast cereal1 . . . . . . . . . . . . . . . . . . . . . . . . . . . . . . . . . . . . . . . . . . 0.292 1.0 -0.1 -0.5 -0.2 -0.1Rice, pasta, cornmeal1 . . . . . . . . . . . . . . . . . . . . . . . . . . . . . . . . . . . 0.131 2.1 -0.8 -1.0 0.8 -0.8
Rice1 , 2 , 3 . . . . . . . . . . . . . . . . . . . . . . . . . . . . . . . . . . . . . . . . . . . . . . 2.3 -0.4 -0.1 -0.2 -0.4Bakery products. . . . . . . . . . . . . . . . . . . . . . . . . . . . . . . . . . . . . . . . . . . . 0.758 2.0 -0.2 -0.5 0.8 0.0
Bread2 . . . . . . . . . . . . . . . . . . . . . . . . . . . . . . . . . . . . . . . . . . . . . . . . . . . 0.225 1.0 -1.5 -0.7 1.3 -0.3White bread1 , 3 . . . . . . . . . . . . . . . . . . . . . . . . . . . . . . . . . . . . . . 2.0 -0.8 -0.9 2.3 -0.8Bread other than white1 , 3 . . . . . . . . . . . . . . . . . . . . . . . . . -0.3 -2.3 -0.9 1.2 -2.3
Fresh biscuits, rolls, muffins1 , 2 . . . . . . . . . . . . . . . . . . . . . . 0.112 1.6 0.0 0.4 -0.1 0.4Cakes, cupcakes, and cookies. . . . . . . . . . . . . . . . . . . . . . . . 0.183 3.3 -0.5 -0.6 1.0 -0.4
Cookies1 , 3 . . . . . . . . . . . . . . . . . . . . . . . . . . . . . . . . . . . . . . . . . . . 5.2 -1.3 -0.7 0.6 -1.1Fresh cakes and cupcakes1 , 3 . . . . . . . . . . . . . . . . . . . . 2.0 0.3 0.2 0.6 0.3
Other bakery products. . . . . . . . . . . . . . . . . . . . . . . . . . . . . . . . . . 0.238 1.7 1.2 0.0 -0.4 0.8Fresh sweetrolls, coffeecakes, doughnuts1 , 3 . . . 3.5 2.7 1.0 -1.0 2.7Crackers, bread, and cracker products3 . . . . . . . . . . 3.2 0.6 -1.7 0.8 0.2Frozen and refrigerated bakery products, pies,
tarts, turnovers3 . . . . . . . . . . . . . . . . . . . . . . . . . . . . . . . . . . . -0.4 1.4 -0.3 -0.8 1.6Meats, poultry, fish, and eggs. . . . . . . . . . . . . . . . . . . . . . . . . . . . . . . . . 1.951 3.0 0.5 0.2 0.3 0.4
Meats, poultry, and fish.. . . . . . . . . . . . . . . . . . . . . . . . . . . . . . . . . . . . . 1.848 2.9 0.1 0.2 0.3 0.1Meats. . . . . . . . . . . . . . . . . . . . . . . . . . . . . . . . . . . . . . . . . . . . . . . . . . . . . . . . 1.196 2.5 0.4 0.0 0.0 0.3
Beef and veal1 . . . . . . . . . . . . . . . . . . . . . . . . . . . . . . . . . . . . . . . . . . 0.564 5.8 -0.4 0.6 0.6 -0.4Uncooked ground beef1 . . . . . . . . . . . . . . . . . . . . . . . . . . . . 0.221 6.8 0.0 1.1 -0.3 0.0Uncooked beef roasts1 , 2 . . . . . . . . . . . . . . . . . . . . . . . . . . 0.082 5.0 -0.4 0.5 1.5 -0.4Uncooked beef steaks1 , 2 . . . . . . . . . . . . . . . . . . . . . . . . . . 0.209 5.4 -1.0 0.3 1.2 -1.0Uncooked other beef and veal1 , 2 . . . . . . . . . . . . . . . . 0.052 4.0 0.4 0.0 0.7 0.4
Pork. . . . . . . . . . . . . . . . . . . . . . . . . . . . . . . . . . . . . . . . . . . . . . . . . . . . . . . 0.371 -0.2 1.6 -0.8 -0.1 1.7Bacon, breakfast sausage, and related products2
. . . . . . . . . . . . . . . . . . . . . . . . . . . . . . . . . . . . . . . . . . . . . . . . . . . . . . . . . . . . . . . . . . . . . . . . . . . . 0.139 0.2 2.7 -1.4 0.1 2.7Bacon and related products3 . . . . . . . . . . . . . . . . . . . . 0.4 4.2 -1.5 1.6 3.6Breakfast sausage and related products1 , 2 , 3
. . . . . . . . . . . . . . . . . . . . . . . . . . . . . . . . . . . . . . . . . . . . . . . . . . . . . . . . . . . . . . . . . . . . . . . . . . . . 3.1 0.9 -0.4 -1.7 0.9Ham.. . . . . . . . . . . . . . . . . . . . . . . . . . . . . . . . . . . . . . . . . . . . . . . . . . . 0.080 1.1 2.5 0.6 -1.8 2.0
Ham, excluding canned3 . . . . . . . . . . . . . . . . . . . . . . . . . 1.2 2.6 0.6 -2.1 2.3Pork chops. . . . . . . . . . . . . . . . . . . . . . . . . . . . . . . . . . . . . . . . . . . . 0.062 0.6 0.9 -0.4 0.1 1.1Other pork including roasts and picnics2 . . . . . . . . . 0.090 -2.5 -0.5 -0.5 0.3 0.6
Other meats. . . . . . . . . . . . . . . . . . . . . . . . . . . . . . . . . . . . . . . . . . . . . . 0.262 -0.2 0.7 -0.3 -0.9 0.1Frankfurters3 . . . . . . . . . . . . . . . . . . . . . . . . . . . . . . . . . . . . . . . . . 1.4 1.9 -2.7 0.5 0.4Lunchmeats1 , 2 , 3 . . . . . . . . . . . . . . . . . . . . . . . . . . . . . . . . . . -0.3 0.2 0.0 -0.4 0.2Lamb and organ meats1 , 3 . . . . . . . . . . . . . . . . . . . . . . . . -4.4 0.0 0.3 -0.9 0.0Lamb and mutton1 , 2 , 3 . . . . . . . . . . . . . . . . . . . . . . . . . . . . -11.5 1.6 0.5 -7.1 1.6
Poultry. . . . . . . . . . . . . . . . . . . . . . . . . . . . . . . . . . . . . . . . . . . . . . . . . . . . 0.345 5.6 -0.5 1.0 1.3 -0.4Chicken2 . . . . . . . . . . . . . . . . . . . . . . . . . . . . . . . . . . . . . . . . . . . . . . 0.268 5.3 -0.5 1.3 1.4 -0.4
Fresh whole chicken1 , 3 . . . . . . . . . . . . . . . . . . . . . . . . . 3.9 -2.1 0.7 3.3 -2.1Fresh and frozen chicken parts1 , 3 . . . . . . . . . . . . 5.9 0.1 2.6 0.3 0.1
Other poultry including turkey2 . . . . . . . . . . . . . . . . . . . . . 0.077 6.9 -0.6 0.1 0.5 -0.4Fish and seafood1 .. . . . . . . . . . . . . . . . . . . . . . . . . . . . . . . . . . . . . 0.307 1.3 -0.7 0.1 0.4 0.0
Fresh fish and seafood1 , 2 . . . . . . . . . . . . . . . . . . . . . . . . . 0.157 -0.4 -0.2 -0.2 0.0 -0.2Processed fish and seafood2 . . . . . . . . . . . . . . . . . . . . . . 0.150 3.4 -1.2 1.0 0.0 -0.3
Shelf stable fish and seafood1 , 3 . . . . . . . . . . . . . . . 6.8 -0.6 0.8 1.7 -0.6
See footnotes at end of table.
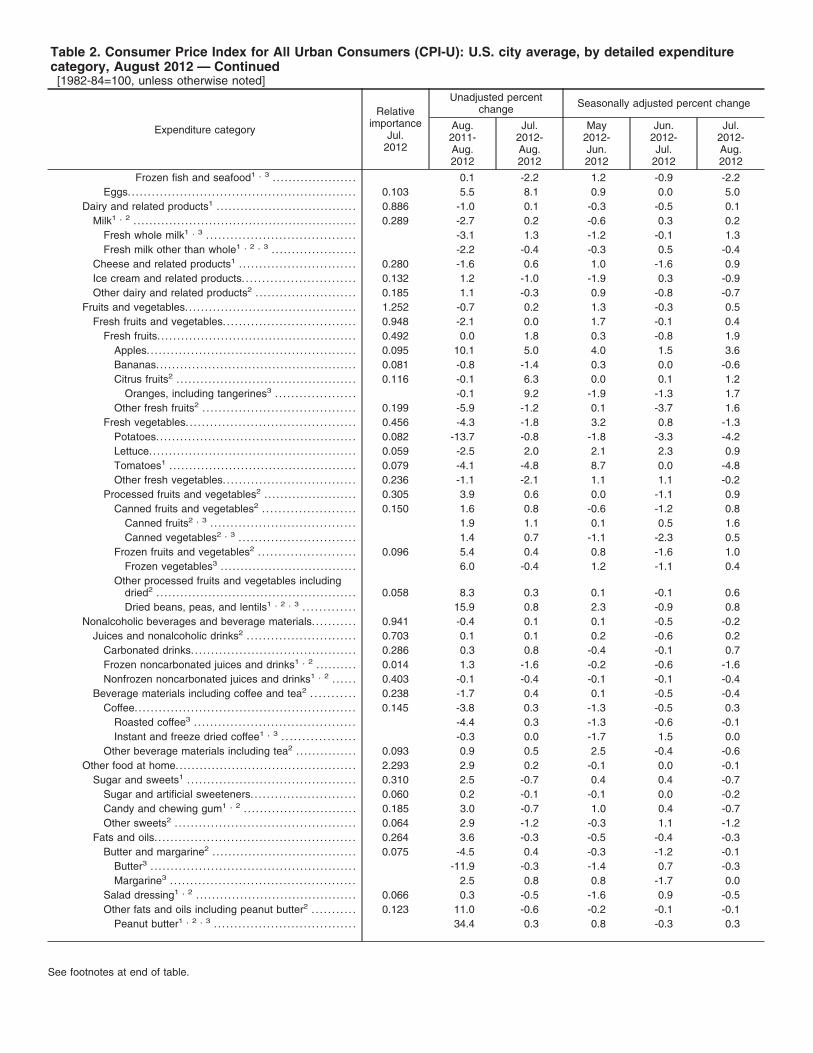
Table 2. Consumer Price Index for All Urban Consumers (CPI-U): U.S. city average, by detailed expenditurecategory, August 2012 — Continued[1982-84=100, unless otherwise noted]
Expenditure category
Relativeimportance
Jul.2012
Unadjusted percentchange Seasonally adjusted percent change
Aug.2011-Aug.2012
Jul.2012-Aug.2012
May2012-Jun.2012
Jun.2012-Jul.
2012
Jul.2012-Aug.2012
Frozen fish and seafood1 , 3 . . . . . . . . . . . . . . . . . . . . . 0.1 -2.2 1.2 -0.9 -2.2Eggs.. . . . . . . . . . . . . . . . . . . . . . . . . . . . . . . . . . . . . . . . . . . . . . . . . . . . . . . . 0.103 5.5 8.1 0.9 0.0 5.0
Dairy and related products1 . . . . . . . . . . . . . . . . . . . . . . . . . . . . . . . . . . . 0.886 -1.0 0.1 -0.3 -0.5 0.1Milk1 , 2 . . . . . . . . . . . . . . . . . . . . . . . . . . . . . . . . . . . . . . . . . . . . . . . . . . . . . . . . 0.289 -2.7 0.2 -0.6 0.3 0.2
Fresh whole milk1 , 3 . . . . . . . . . . . . . . . . . . . . . . . . . . . . . . . . . . . . . -3.1 1.3 -1.2 -0.1 1.3Fresh milk other than whole1 , 2 , 3 . . . . . . . . . . . . . . . . . . . . . -2.2 -0.4 -0.3 0.5 -0.4
Cheese and related products1 . . . . . . . . . . . . . . . . . . . . . . . . . . . . . 0.280 -1.6 0.6 1.0 -1.6 0.9Ice cream and related products. . . . . . . . . . . . . . . . . . . . . . . . . . . . 0.132 1.2 -1.0 -1.9 0.3 -0.9Other dairy and related products2 . . . . . . . . . . . . . . . . . . . . . . . . . 0.185 1.1 -0.3 0.9 -0.8 -0.7
Fruits and vegetables.. . . . . . . . . . . . . . . . . . . . . . . . . . . . . . . . . . . . . . . . . . 1.252 -0.7 0.2 1.3 -0.3 0.5Fresh fruits and vegetables. . . . . . . . . . . . . . . . . . . . . . . . . . . . . . . . . 0.948 -2.1 0.0 1.7 -0.1 0.4
Fresh fruits. . . . . . . . . . . . . . . . . . . . . . . . . . . . . . . . . . . . . . . . . . . . . . . . . . 0.492 0.0 1.8 0.3 -0.8 1.9Apples. . . . . . . . . . . . . . . . . . . . . . . . . . . . . . . . . . . . . . . . . . . . . . . . . . . . 0.095 10.1 5.0 4.0 1.5 3.6Bananas.. . . . . . . . . . . . . . . . . . . . . . . . . . . . . . . . . . . . . . . . . . . . . . . . . 0.081 -0.8 -1.4 0.3 0.0 -0.6Citrus fruits2 . . . . . . . . . . . . . . . . . . . . . . . . . . . . . . . . . . . . . . . . . . . . . 0.116 -0.1 6.3 0.0 0.1 1.2
Oranges, including tangerines3 . . . . . . . . . . . . . . . . . . . . -0.1 9.2 -1.9 -1.3 1.7Other fresh fruits2 . . . . . . . . . . . . . . . . . . . . . . . . . . . . . . . . . . . . . . 0.199 -5.9 -1.2 0.1 -3.7 1.6
Fresh vegetables. . . . . . . . . . . . . . . . . . . . . . . . . . . . . . . . . . . . . . . . . . 0.456 -4.3 -1.8 3.2 0.8 -1.3Potatoes.. . . . . . . . . . . . . . . . . . . . . . . . . . . . . . . . . . . . . . . . . . . . . . . . . 0.082 -13.7 -0.8 -1.8 -3.3 -4.2Lettuce.. . . . . . . . . . . . . . . . . . . . . . . . . . . . . . . . . . . . . . . . . . . . . . . . . . . 0.059 -2.5 2.0 2.1 2.3 0.9Tomatoes1 .. . . . . . . . . . . . . . . . . . . . . . . . . . . . . . . . . . . . . . . . . . . . . . 0.079 -4.1 -4.8 8.7 0.0 -4.8Other fresh vegetables. . . . . . . . . . . . . . . . . . . . . . . . . . . . . . . . . 0.236 -1.1 -2.1 1.1 1.1 -0.2
Processed fruits and vegetables2 . . . . . . . . . . . . . . . . . . . . . . . 0.305 3.9 0.6 0.0 -1.1 0.9Canned fruits and vegetables2 . . . . . . . . . . . . . . . . . . . . . . . 0.150 1.6 0.8 -0.6 -1.2 0.8
Canned fruits2 , 3 . . . . . . . . . . . . . . . . . . . . . . . . . . . . . . . . . . . . 1.9 1.1 0.1 0.5 1.6Canned vegetables2 , 3 . . . . . . . . . . . . . . . . . . . . . . . . . . . . . 1.4 0.7 -1.1 -2.3 0.5
Frozen fruits and vegetables2 . . . . . . . . . . . . . . . . . . . . . . . . 0.096 5.4 0.4 0.8 -1.6 1.0Frozen vegetables3 . . . . . . . . . . . . . . . . . . . . . . . . . . . . . . . . . . 6.0 -0.4 1.2 -1.1 0.4
Other processed fruits and vegetables includingdried2 . . . . . . . . . . . . . . . . . . . . . . . . . . . . . . . . . . . . . . . . . . . . . . . . . . 0.058 8.3 0.3 0.1 -0.1 0.6Dried beans, peas, and lentils1 , 2 , 3 . . . . . . . . . . . . . 15.9 0.8 2.3 -0.9 0.8
Nonalcoholic beverages and beverage materials. . . . . . . . . . . 0.941 -0.4 0.1 0.1 -0.5 -0.2Juices and nonalcoholic drinks2 . . . . . . . . . . . . . . . . . . . . . . . . . . . 0.703 0.1 0.1 0.2 -0.6 0.2
Carbonated drinks. . . . . . . . . . . . . . . . . . . . . . . . . . . . . . . . . . . . . . . . . 0.286 0.3 0.8 -0.4 -0.1 0.7Frozen noncarbonated juices and drinks1 , 2 . . . . . . . . . . 0.014 1.3 -1.6 -0.2 -0.6 -1.6Nonfrozen noncarbonated juices and drinks1 , 2 . . . . . . 0.403 -0.1 -0.4 -0.1 -0.1 -0.4
Beverage materials including coffee and tea2 . . . . . . . . . . . 0.238 -1.7 0.4 0.1 -0.5 -0.4Coffee. . . . . . . . . . . . . . . . . . . . . . . . . . . . . . . . . . . . . . . . . . . . . . . . . . . . . . . 0.145 -3.8 0.3 -1.3 -0.5 0.3
Roasted coffee3 . . . . . . . . . . . . . . . . . . . . . . . . . . . . . . . . . . . . . . . . -4.4 0.3 -1.3 -0.6 -0.1Instant and freeze dried coffee1 , 3 . . . . . . . . . . . . . . . . . . -0.3 0.0 -1.7 1.5 0.0
Other beverage materials including tea2 . . . . . . . . . . . . . . . 0.093 0.9 0.5 2.5 -0.4 -0.6Other food at home.. . . . . . . . . . . . . . . . . . . . . . . . . . . . . . . . . . . . . . . . . . . . 2.293 2.9 0.2 -0.1 0.0 -0.1
Sugar and sweets1 . . . . . . . . . . . . . . . . . . . . . . . . . . . . . . . . . . . . . . . . . . 0.310 2.5 -0.7 0.4 0.4 -0.7Sugar and artificial sweeteners. . . . . . . . . . . . . . . . . . . . . . . . . . 0.060 0.2 -0.1 -0.1 0.0 -0.2Candy and chewing gum1 , 2 . . . . . . . . . . . . . . . . . . . . . . . . . . . . 0.185 3.0 -0.7 1.0 0.4 -0.7Other sweets2 . . . . . . . . . . . . . . . . . . . . . . . . . . . . . . . . . . . . . . . . . . . . . 0.064 2.9 -1.2 -0.3 1.1 -1.2
Fats and oils. . . . . . . . . . . . . . . . . . . . . . . . . . . . . . . . . . . . . . . . . . . . . . . . . . 0.264 3.6 -0.3 -0.5 -0.4 -0.3Butter and margarine2 . . . . . . . . . . . . . . . . . . . . . . . . . . . . . . . . . . . . 0.075 -4.5 0.4 -0.3 -1.2 -0.1
Butter3 . . . . . . . . . . . . . . . . . . . . . . . . . . . . . . . . . . . . . . . . . . . . . . . . . . . -11.9 -0.3 -1.4 0.7 -0.3Margarine3 . . . . . . . . . . . . . . . . . . . . . . . . . . . . . . . . . . . . . . . . . . . . . . 2.5 0.8 0.8 -1.7 0.0
Salad dressing1 , 2 . . . . . . . . . . . . . . . . . . . . . . . . . . . . . . . . . . . . . . . . 0.066 0.3 -0.5 -1.6 0.9 -0.5Other fats and oils including peanut butter2 . . . . . . . . . . . 0.123 11.0 -0.6 -0.2 -0.1 -0.1
Peanut butter1 , 2 , 3 . . . . . . . . . . . . . . . . . . . . . . . . . . . . . . . . . . . 34.4 0.3 0.8 -0.3 0.3
See footnotes at end of table.
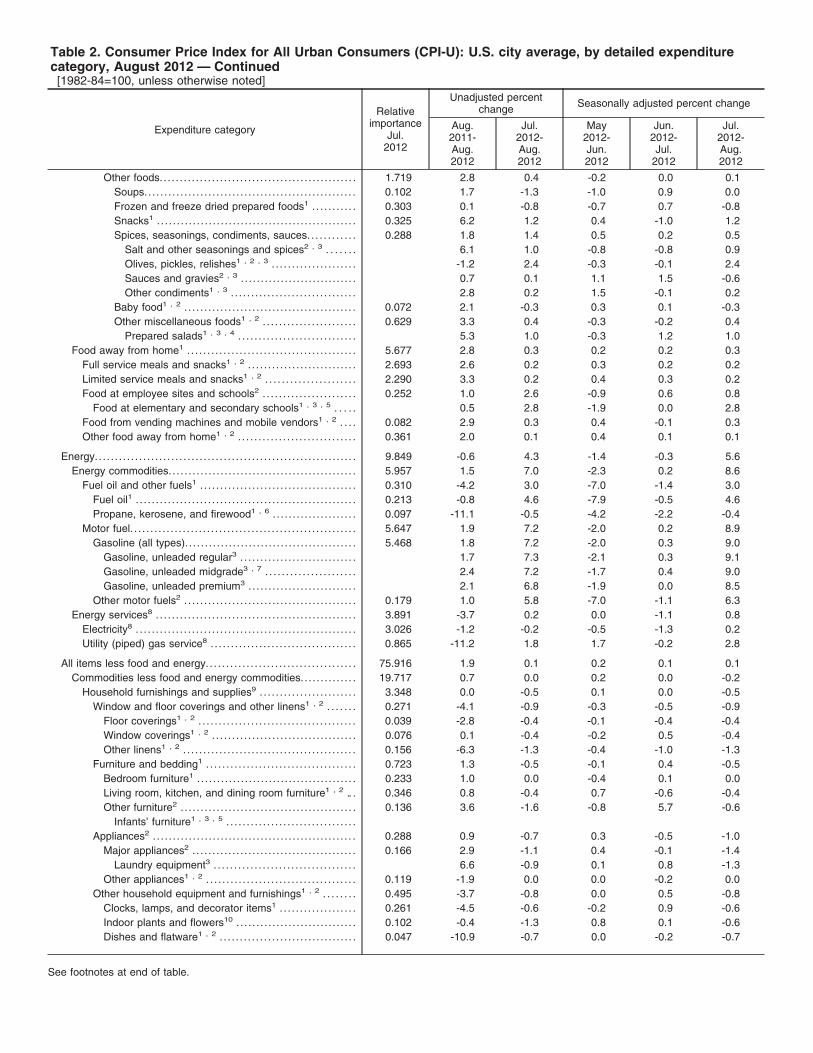
Table 2. Consumer Price Index for All Urban Consumers (CPI-U): U.S. city average, by detailed expenditurecategory, August 2012 — Continued[1982-84=100, unless otherwise noted]
Expenditure category
Relativeimportance
Jul.2012
Unadjusted percentchange Seasonally adjusted percent change
Aug.2011-Aug.2012
Jul.2012-Aug.2012
May2012-Jun.2012
Jun.2012-Jul.
2012
Jul.2012-Aug.2012
Other foods.. . . . . . . . . . . . . . . . . . . . . . . . . . . . . . . . . . . . . . . . . . . . . . . . 1.719 2.8 0.4 -0.2 0.0 0.1Soups.. . . . . . . . . . . . . . . . . . . . . . . . . . . . . . . . . . . . . . . . . . . . . . . . . . . . 0.102 1.7 -1.3 -1.0 0.9 0.0Frozen and freeze dried prepared foods1 . . . . . . . . . . . 0.303 0.1 -0.8 -0.7 0.7 -0.8Snacks1 . . . . . . . . . . . . . . . . . . . . . . . . . . . . . . . . . . . . . . . . . . . . . . . . . . 0.325 6.2 1.2 0.4 -1.0 1.2Spices, seasonings, condiments, sauces. . . . . . . . . . . . 0.288 1.8 1.4 0.5 0.2 0.5
Salt and other seasonings and spices2 , 3 . . . . . . . 6.1 1.0 -0.8 -0.8 0.9Olives, pickles, relishes1 , 2 , 3 . . . . . . . . . . . . . . . . . . . . . -1.2 2.4 -0.3 -0.1 2.4Sauces and gravies2 , 3 . . . . . . . . . . . . . . . . . . . . . . . . . . . . . 0.7 0.1 1.1 1.5 -0.6Other condiments1 , 3 . . . . . . . . . . . . . . . . . . . . . . . . . . . . . . . 2.8 0.2 1.5 -0.1 0.2
Baby food1 , 2 . . . . . . . . . . . . . . . . . . . . . . . . . . . . . . . . . . . . . . . . . . . 0.072 2.1 -0.3 0.3 0.1 -0.3Other miscellaneous foods1 , 2 . . . . . . . . . . . . . . . . . . . . . . . 0.629 3.3 0.4 -0.3 -0.2 0.4
Prepared salads1 , 3 , 4 . . . . . . . . . . . . . . . . . . . . . . . . . . . . . 5.3 1.0 -0.3 1.2 1.0Food away from home1 . . . . . . . . . . . . . . . . . . . . . . . . . . . . . . . . . . . . . . . . . . 5.677 2.8 0.3 0.2 0.2 0.3
Full service meals and snacks1 , 2 . . . . . . . . . . . . . . . . . . . . . . . . . . . 2.693 2.6 0.2 0.3 0.2 0.2Limited service meals and snacks1 , 2 . . . . . . . . . . . . . . . . . . . . . . 2.290 3.3 0.2 0.4 0.3 0.2Food at employee sites and schools2 . . . . . . . . . . . . . . . . . . . . . . . 0.252 1.0 2.6 -0.9 0.6 0.8
Food at elementary and secondary schools1 , 3 , 5 . . . . . 0.5 2.8 -1.9 0.0 2.8Food from vending machines and mobile vendors1 , 2 . . . . 0.082 2.9 0.3 0.4 -0.1 0.3Other food away from home1 , 2 . . . . . . . . . . . . . . . . . . . . . . . . . . . . . 0.361 2.0 0.1 0.4 0.1 0.1
Energy. . . . . . . . . . . . . . . . . . . . . . . . . . . . . . . . . . . . . . . . . . . . . . . . . . . . . . . . . . . . . . . . . 9.849 -0.6 4.3 -1.4 -0.3 5.6Energy commodities. . . . . . . . . . . . . . . . . . . . . . . . . . . . . . . . . . . . . . . . . . . . . . . 5.957 1.5 7.0 -2.3 0.2 8.6
Fuel oil and other fuels1 . . . . . . . . . . . . . . . . . . . . . . . . . . . . . . . . . . . . . . . 0.310 -4.2 3.0 -7.0 -1.4 3.0Fuel oil1 . . . . . . . . . . . . . . . . . . . . . . . . . . . . . . . . . . . . . . . . . . . . . . . . . . . . . . . 0.213 -0.8 4.6 -7.9 -0.5 4.6Propane, kerosene, and firewood1 , 6 . . . . . . . . . . . . . . . . . . . . . 0.097 -11.1 -0.5 -4.2 -2.2 -0.4
Motor fuel. . . . . . . . . . . . . . . . . . . . . . . . . . . . . . . . . . . . . . . . . . . . . . . . . . . . . . . . 5.647 1.9 7.2 -2.0 0.2 8.9Gasoline (all types). . . . . . . . . . . . . . . . . . . . . . . . . . . . . . . . . . . . . . . . . . . 5.468 1.8 7.2 -2.0 0.3 9.0
Gasoline, unleaded regular3 . . . . . . . . . . . . . . . . . . . . . . . . . . . . . 1.7 7.3 -2.1 0.3 9.1Gasoline, unleaded midgrade3 , 7 . . . . . . . . . . . . . . . . . . . . . . 2.4 7.2 -1.7 0.4 9.0Gasoline, unleaded premium3 .. . . . . . . . . . . . . . . . . . . . . . . . . . 2.1 6.8 -1.9 0.0 8.5
Other motor fuels2 . . . . . . . . . . . . . . . . . . . . . . . . . . . . . . . . . . . . . . . . . . . 0.179 1.0 5.8 -7.0 -1.1 6.3Energy services8 . . . . . . . . . . . . . . . . . . . . . . . . . . . . . . . . . . . . . . . . . . . . . . . . . . 3.891 -3.7 0.2 0.0 -1.1 0.8
Electricity8 . . . . . . . . . . . . . . . . . . . . . . . . . . . . . . . . . . . . . . . . . . . . . . . . . . . . . . . 3.026 -1.2 -0.2 -0.5 -1.3 0.2Utility (piped) gas service8 . . . . . . . . . . . . . . . . . . . . . . . . . . . . . . . . . . . . 0.865 -11.2 1.8 1.7 -0.2 2.8
All items less food and energy. . . . . . . . . . . . . . . . . . . . . . . . . . . . . . . . . . . . . 75.916 1.9 0.1 0.2 0.1 0.1Commodities less food and energy commodities. . . . . . . . . . . . . . 19.717 0.7 0.0 0.2 0.0 -0.2
Household furnishings and supplies9 . . . . . . . . . . . . . . . . . . . . . . . . 3.348 0.0 -0.5 0.1 0.0 -0.5Window and floor coverings and other linens1 , 2 . . . . . . . 0.271 -4.1 -0.9 -0.3 -0.5 -0.9
Floor coverings1 , 2 . . . . . . . . . . . . . . . . . . . . . . . . . . . . . . . . . . . . . . . 0.039 -2.8 -0.4 -0.1 -0.4 -0.4Window coverings1 , 2 . . . . . . . . . . . . . . . . . . . . . . . . . . . . . . . . . . . . 0.076 0.1 -0.4 -0.2 0.5 -0.4Other linens1 , 2 . . . . . . . . . . . . . . . . . . . . . . . . . . . . . . . . . . . . . . . . . . . 0.156 -6.3 -1.3 -0.4 -1.0 -1.3
Furniture and bedding1 . . . . . . . . . . . . . . . . . . . . . . . . . . . . . . . . . . . . . 0.723 1.3 -0.5 -0.1 0.4 -0.5Bedroom furniture1 . . . . . . . . . . . . . . . . . . . . . . . . . . . . . . . . . . . . . . . . 0.233 1.0 0.0 -0.4 0.1 0.0Living room, kitchen, and dining room furniture1 , 2 .. . 0.346 0.8 -0.4 0.7 -0.6 -0.4Other furniture2 . . . . . . . . . . . . . . . . . . . . . . . . . . . . . . . . . . . . . . . . . . . . 0.136 3.6 -1.6 -0.8 5.7 -0.6
Infants’ furniture1 , 3 , 5 . . . . . . . . . . . . . . . . . . . . . . . . . . . . . . . .Appliances2 . . . . . . . . . . . . . . . . . . . . . . . . . . . . . . . . . . . . . . . . . . . . . . . . . . . 0.288 0.9 -0.7 0.3 -0.5 -1.0
Major appliances2 . . . . . . . . . . . . . . . . . . . . . . . . . . . . . . . . . . . . . . . . . 0.166 2.9 -1.1 0.4 -0.1 -1.4Laundry equipment3 . . . . . . . . . . . . . . . . . . . . . . . . . . . . . . . . . . . 6.6 -0.9 0.1 0.8 -1.3
Other appliances1 , 2 . . . . . . . . . . . . . . . . . . . . . . . . . . . . . . . . . . . . . 0.119 -1.9 0.0 0.0 -0.2 0.0Other household equipment and furnishings1 , 2 . . . . . . . . 0.495 -3.7 -0.8 0.0 0.5 -0.8
Clocks, lamps, and decorator items1 . . . . . . . . . . . . . . . . . . . 0.261 -4.5 -0.6 -0.2 0.9 -0.6Indoor plants and flowers10 . . . . . . . . . . . . . . . . . . . . . . . . . . . . . . 0.102 -0.4 -1.3 0.8 0.1 -0.6Dishes and flatware1 , 2 . . . . . . . . . . . . . . . . . . . . . . . . . . . . . . . . . . 0.047 -10.9 -0.7 0.0 -0.2 -0.7
See footnotes at end of table.
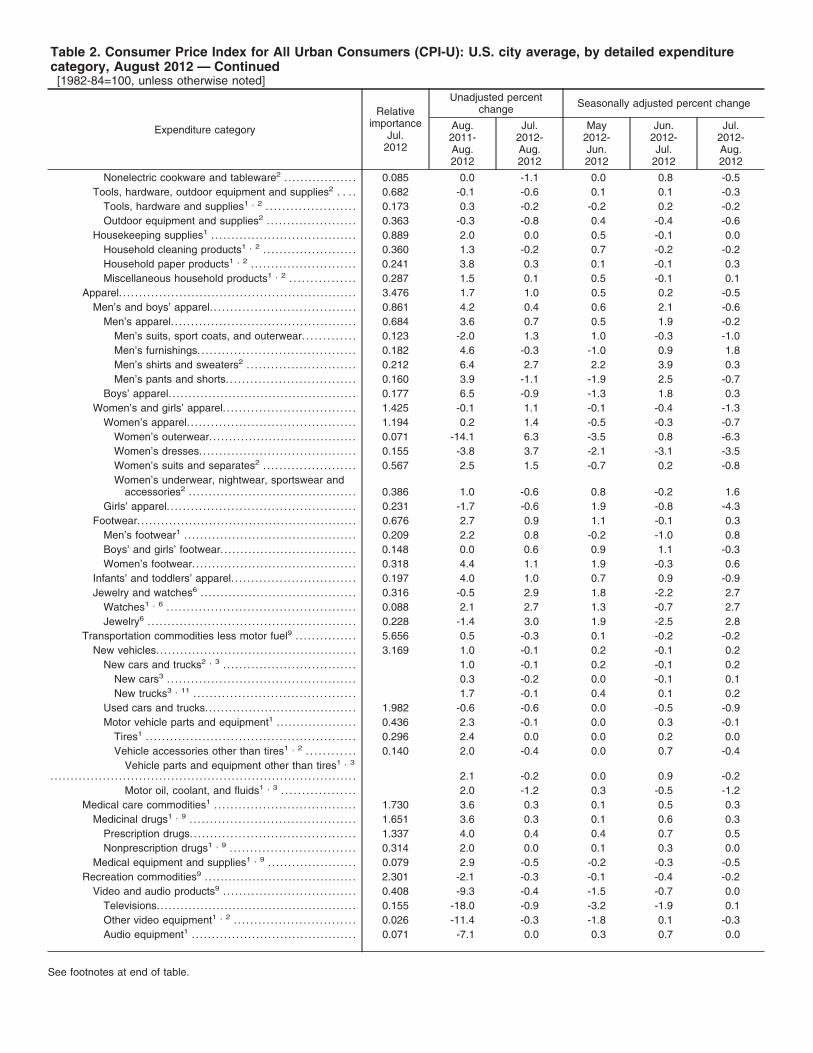
Table 2. Consumer Price Index for All Urban Consumers (CPI-U): U.S. city average, by detailed expenditurecategory, August 2012 — Continued[1982-84=100, unless otherwise noted]
Expenditure category
Relativeimportance
Jul.2012
Unadjusted percentchange Seasonally adjusted percent change
Aug.2011-Aug.2012
Jul.2012-Aug.2012
May2012-Jun.2012
Jun.2012-Jul.
2012
Jul.2012-Aug.2012
Nonelectric cookware and tableware2 . . . . . . . . . . . . . . . . . . 0.085 0.0 -1.1 0.0 0.8 -0.5Tools, hardware, outdoor equipment and supplies2 . . . . 0.682 -0.1 -0.6 0.1 0.1 -0.3
Tools, hardware and supplies1 , 2 . . . . . . . . . . . . . . . . . . . . . . 0.173 0.3 -0.2 -0.2 0.2 -0.2Outdoor equipment and supplies2 . . . . . . . . . . . . . . . . . . . . . . 0.363 -0.3 -0.8 0.4 -0.4 -0.6
Housekeeping supplies1 . . . . . . . . . . . . . . . . . . . . . . . . . . . . . . . . . . . . 0.889 2.0 0.0 0.5 -0.1 0.0Household cleaning products1 , 2 . . . . . . . . . . . . . . . . . . . . . . . 0.360 1.3 -0.2 0.7 -0.2 -0.2Household paper products1 , 2 . . . . . . . . . . . . . . . . . . . . . . . . . . 0.241 3.8 0.3 0.1 -0.1 0.3Miscellaneous household products1 , 2 . . . . . . . . . . . . . . . . 0.287 1.5 0.1 0.5 -0.1 0.1
Apparel. . . . . . . . . . . . . . . . . . . . . . . . . . . . . . . . . . . . . . . . . . . . . . . . . . . . . . . . . . . 3.476 1.7 1.0 0.5 0.2 -0.5Men’s and boys’ apparel. . . . . . . . . . . . . . . . . . . . . . . . . . . . . . . . . . . . 0.861 4.2 0.4 0.6 2.1 -0.6
Men’s apparel. . . . . . . . . . . . . . . . . . . . . . . . . . . . . . . . . . . . . . . . . . . . . . 0.684 3.6 0.7 0.5 1.9 -0.2Men’s suits, sport coats, and outerwear. . . . . . . . . . . . . 0.123 -2.0 1.3 1.0 -0.3 -1.0Men’s furnishings. . . . . . . . . . . . . . . . . . . . . . . . . . . . . . . . . . . . . . . 0.182 4.6 -0.3 -1.0 0.9 1.8Men’s shirts and sweaters2 . . . . . . . . . . . . . . . . . . . . . . . . . . . 0.212 6.4 2.7 2.2 3.9 0.3Men’s pants and shorts. . . . . . . . . . . . . . . . . . . . . . . . . . . . . . . . 0.160 3.9 -1.1 -1.9 2.5 -0.7
Boys’ apparel. . . . . . . . . . . . . . . . . . . . . . . . . . . . . . . . . . . . . . . . . . . . . . . 0.177 6.5 -0.9 -1.3 1.8 0.3Women’s and girls’ apparel. . . . . . . . . . . . . . . . . . . . . . . . . . . . . . . . . 1.425 -0.1 1.1 -0.1 -0.4 -1.3
Women’s apparel. . . . . . . . . . . . . . . . . . . . . . . . . . . . . . . . . . . . . . . . . . 1.194 0.2 1.4 -0.5 -0.3 -0.7Women’s outerwear. . . . . . . . . . . . . . . . . . . . . . . . . . . . . . . . . . . . . 0.071 -14.1 6.3 -3.5 0.8 -6.3Women’s dresses. . . . . . . . . . . . . . . . . . . . . . . . . . . . . . . . . . . . . . . 0.155 -3.8 3.7 -2.1 -3.1 -3.5Women’s suits and separates2 . . . . . . . . . . . . . . . . . . . . . . . 0.567 2.5 1.5 -0.7 0.2 -0.8Women’s underwear, nightwear, sportswear and
accessories2 . . . . . . . . . . . . . . . . . . . . . . . . . . . . . . . . . . . . . . . . . . 0.386 1.0 -0.6 0.8 -0.2 1.6Girls’ apparel. . . . . . . . . . . . . . . . . . . . . . . . . . . . . . . . . . . . . . . . . . . . . . . 0.231 -1.7 -0.6 1.9 -0.8 -4.3
Footwear. . . . . . . . . . . . . . . . . . . . . . . . . . . . . . . . . . . . . . . . . . . . . . . . . . . . . . . 0.676 2.7 0.9 1.1 -0.1 0.3Men’s footwear1 . . . . . . . . . . . . . . . . . . . . . . . . . . . . . . . . . . . . . . . . . . . 0.209 2.2 0.8 -0.2 -1.0 0.8Boys’ and girls’ footwear. . . . . . . . . . . . . . . . . . . . . . . . . . . . . . . . . . 0.148 0.0 0.6 0.9 1.1 -0.3Women’s footwear. . . . . . . . . . . . . . . . . . . . . . . . . . . . . . . . . . . . . . . . . 0.318 4.4 1.1 1.9 -0.3 0.6
Infants’ and toddlers’ apparel. . . . . . . . . . . . . . . . . . . . . . . . . . . . . . . 0.197 4.0 1.0 0.7 0.9 -0.9Jewelry and watches6 . . . . . . . . . . . . . . . . . . . . . . . . . . . . . . . . . . . . . . . 0.316 -0.5 2.9 1.8 -2.2 2.7
Watches1 , 6 . . . . . . . . . . . . . . . . . . . . . . . . . . . . . . . . . . . . . . . . . . . . . . . 0.088 2.1 2.7 1.3 -0.7 2.7Jewelry6 . . . . . . . . . . . . . . . . . . . . . . . . . . . . . . . . . . . . . . . . . . . . . . . . . . . . 0.228 -1.4 3.0 1.9 -2.5 2.8
Transportation commodities less motor fuel9 . . . . . . . . . . . . . . . 5.656 0.5 -0.3 0.1 -0.2 -0.2New vehicles. . . . . . . . . . . . . . . . . . . . . . . . . . . . . . . . . . . . . . . . . . . . . . . . . . 3.169 1.0 -0.1 0.2 -0.1 0.2
New cars and trucks2 , 3 . . . . . . . . . . . . . . . . . . . . . . . . . . . . . . . . . 1.0 -0.1 0.2 -0.1 0.2New cars3 . . . . . . . . . . . . . . . . . . . . . . . . . . . . . . . . . . . . . . . . . . . . . . . 0.3 -0.2 0.0 -0.1 0.1New trucks3 , 11 . . . . . . . . . . . . . . . . . . . . . . . . . . . . . . . . . . . . . . . . 1.7 -0.1 0.4 0.1 0.2
Used cars and trucks.. . . . . . . . . . . . . . . . . . . . . . . . . . . . . . . . . . . . . 1.982 -0.6 -0.6 0.0 -0.5 -0.9Motor vehicle parts and equipment1 . . . . . . . . . . . . . . . . . . . . 0.436 2.3 -0.1 0.0 0.3 -0.1
Tires1 . . . . . . . . . . . . . . . . . . . . . . . . . . . . . . . . . . . . . . . . . . . . . . . . . . . . 0.296 2.4 0.0 0.0 0.2 0.0Vehicle accessories other than tires1 , 2 . . . . . . . . . . . . 0.140 2.0 -0.4 0.0 0.7 -0.4
Vehicle parts and equipment other than tires1 , 3
. . . . . . . . . . . . . . . . . . . . . . . . . . . . . . . . . . . . . . . . . . . . . . . . . . . . . . . . . . . . . . . . . . . . . . . . . . . . 2.1 -0.2 0.0 0.9 -0.2Motor oil, coolant, and fluids1 , 3 . . . . . . . . . . . . . . . . . . 2.0 -1.2 0.3 -0.5 -1.2
Medical care commodities1 . . . . . . . . . . . . . . . . . . . . . . . . . . . . . . . . . . . 1.730 3.6 0.3 0.1 0.5 0.3Medicinal drugs1 , 9 . . . . . . . . . . . . . . . . . . . . . . . . . . . . . . . . . . . . . . . . . 1.651 3.6 0.3 0.1 0.6 0.3
Prescription drugs. . . . . . . . . . . . . . . . . . . . . . . . . . . . . . . . . . . . . . . . . 1.337 4.0 0.4 0.4 0.7 0.5Nonprescription drugs1 , 9 . . . . . . . . . . . . . . . . . . . . . . . . . . . . . . . 0.314 2.0 0.0 0.1 0.3 0.0
Medical equipment and supplies1 , 9 . . . . . . . . . . . . . . . . . . . . . . 0.079 2.9 -0.5 -0.2 -0.3 -0.5Recreation commodities9 . . . . . . . . . . . . . . . . . . . . . . . . . . . . . . . . . . . . . . 2.301 -2.1 -0.3 -0.1 -0.4 -0.2
Video and audio products9 . . . . . . . . . . . . . . . . . . . . . . . . . . . . . . . . . 0.408 -9.3 -0.4 -1.5 -0.7 0.0Televisions.. . . . . . . . . . . . . . . . . . . . . . . . . . . . . . . . . . . . . . . . . . . . . . . . . 0.155 -18.0 -0.9 -3.2 -1.9 0.1Other video equipment1 , 2 . . . . . . . . . . . . . . . . . . . . . . . . . . . . . . 0.026 -11.4 -0.3 -1.8 0.1 -0.3Audio equipment1 . . . . . . . . . . . . . . . . . . . . . . . . . . . . . . . . . . . . . . . . . 0.071 -7.1 0.0 0.3 0.7 0.0
See footnotes at end of table.

Table 2. Consumer Price Index for All Urban Consumers (CPI-U): U.S. city average, by detailed expenditurecategory, August 2012 — Continued[1982-84=100, unless otherwise noted]
Expenditure category
Relativeimportance
Jul.2012
Unadjusted percentchange Seasonally adjusted percent change
Aug.2011-Aug.2012
Jul.2012-Aug.2012
May2012-Jun.2012
Jun.2012-Jul.
2012
Jul.2012-Aug.2012
Audio discs, tapes and other media1 , 2 . . . . . . . . . . . . . . . 0.043 -4.3 -0.3 -0.9 -0.5 -0.3Pets and pet products1 . . . . . . . . . . . . . . . . . . . . . . . . . . . . . . . . . . . . . 0.688 0.7 0.0 0.5 -0.6 0.0
Pet food1 , 2 , 3 . . . . . . . . . . . . . . . . . . . . . . . . . . . . . . . . . . . . . . . . . . . . 1.0 0.0 0.8 -0.6 0.0Purchase of pets, pet supplies, accessories1 , 2 , 3 .. . -0.8 -0.1 0.2 -0.8 -0.1
Sporting goods1 . . . . . . . . . . . . . . . . . . . . . . . . . . . . . . . . . . . . . . . . . . . . . . 0.462 0.0 -0.2 0.2 0.1 -0.2Sports vehicles including bicycles1 . . . . . . . . . . . . . . . . . . . . . 0.243 0.7 -0.4 0.9 0.7 -0.4Sports equipment1 . . . . . . . . . . . . . . . . . . . . . . . . . . . . . . . . . . . . . . . . 0.209 -1.0 0.0 -0.6 -0.5 0.0
Photographic equipment and supplies. . . . . . . . . . . . . . . . . . . . . 0.054 -4.0 -0.6 -0.3 0.2 -0.3Film and photographic supplies1 , 2 , 3 . . . . . . . . . . . . . . . . . 3.7Photographic equipment2 , 3 . . . . . . . . . . . . . . . . . . . . . . . . . . . . . -5.8 -0.4 -0.4 0.5 -0.6
Recreational reading materials1 . . . . . . . . . . . . . . . . . . . . . . . . . . . 0.224 2.6 -0.2 0.1 0.1 -0.2Newspapers and magazines1 , 2 . . . . . . . . . . . . . . . . . . . . . . . . 0.123 5.1 -0.3 0.9 -0.2 -0.3Recreational books1 , 2 . . . . . . . . . . . . . . . . . . . . . . . . . . . . . . . . . . . 0.098 -0.3 -0.2 -1.0 0.4 -0.2
Other recreational goods2 . . . . . . . . . . . . . . . . . . . . . . . . . . . . . . . . . . 0.465 -3.8 -0.7 0.0 -0.6 -0.7Toys1 . . . . . . . . . . . . . . . . . . . . . . . . . . . . . . . . . . . . . . . . . . . . . . . . . . . . . . . 0.344 -6.2 -1.2 -0.1 -0.9 -1.2
Toys, games, hobbies and playground equipment1, 2 , 3 . . . . . . . . . . . . . . . . . . . . . . . . . . . . . . . . . . . . . . . . . . . . . . . . . . . -2.5 -1.1 0.4 -0.8 -1.1
Sewing machines, fabric and supplies2 . . . . . . . . . . . . . . . . 0.062 5.4 1.6 0.3 0.6 1.4Music instruments and accessories2 . . . . . . . . . . . . . . . . . . . 0.039 1.6 0.4 0.5 0.0 0.4
Education and communication commodities9 . . . . . . . . . . . . . . . 0.596 -2.0 -0.3 0.3 -0.4 -0.4Educational books and supplies. . . . . . . . . . . . . . . . . . . . . . . . . . . . 0.204 7.6 2.2 0.3 0.7 1.3
College textbooks1 , 3 , 12 . . . . . . . . . . . . . . . . . . . . . . . . . . . . . . . . 8.4 1.4 0.0 1.9 1.4Information technology commodities9 . . . . . . . . . . . . . . . . . . . . . 0.391 -7.1 -1.6 0.3 -1.0 -1.2
Personal computers and peripheral equipment4 . . . . . . 0.260 -7.4 -1.8 1.3 -1.1 -1.3Computer software and accessories1 , 2 . . . . . . . . . . . . . . . 0.047 -7.2 -2.3 -2.0 -0.7 -2.3Telephone hardware, calculators, and other
consumer information items1 , 2 . . . . . . . . . . . . . . . . . . . . . . 0.085 -5.9 -0.5 -1.5 -0.9 -0.5Alcoholic beverages. . . . . . . . . . . . . . . . . . . . . . . . . . . . . . . . . . . . . . . . . . . . 0.949 1.6 -0.2 0.3 -0.1 -0.2
Alcoholic beverages at home.. . . . . . . . . . . . . . . . . . . . . . . . . . . . . . 0.571 0.8 -0.4 0.0 0.0 -0.4Beer, ale, and other malt beverages at home. . . . . . . . . 0.269 1.8 0.2 -0.4 -0.4 0.4Distilled spirits at home1 . . . . . . . . . . . . . . . . . . . . . . . . . . . . . . . . . 0.072 0.0 0.5 0.7 -0.2 -0.1
Whiskey at home3 .. . . . . . . . . . . . . . . . . . . . . . . . . . . . . . . . . . . . . 0.5 -0.1 1.4 -0.9 -0.4Distilled spirits, excluding whiskey, at home1 , 3 . . . 0.1 0.6 -0.1 0.4 0.6
Wine at home.. . . . . . . . . . . . . . . . . . . . . . . . . . . . . . . . . . . . . . . . . . . . . 0.230 -0.1 -1.4 0.5 0.5 -1.4Alcoholic beverages away from home1 . . . . . . . . . . . . . . . . . . . 0.378 2.6 0.0 0.6 -0.3 0.0
Beer, ale, and other malt beverages away fromhome1 , 2 , 3 . . . . . . . . . . . . . . . . . . . . . . . . . . . . . . . . . . . . . . . . . . . . . 2.1 0.4 0.4 0.0 0.4
Wine away from home1 , 2 , 3 . . . . . . . . . . . . . . . . . . . . . . . . . . . 2.2 -0.8 1.5 0.1 -0.8Distilled spirits away from home1 , 2 , 3 . . . . . . . . . . . . . . . . 3.4 0.3 0.5 -0.5 0.3
Other goods9 .. . . . . . . . . . . . . . . . . . . . . . . . . . . . . . . . . . . . . . . . . . . . . . . . . . . 1.660 2.2 0.1 0.4 0.6 0.3Tobacco and smoking products1 . . . . . . . . . . . . . . . . . . . . . . . . . . 0.803 2.4 -0.1 0.4 1.1 -0.1
Cigarettes1 , 2 . . . . . . . . . . . . . . . . . . . . . . . . . . . . . . . . . . . . . . . . . . . . . 0.743 2.4 -0.1 0.5 1.2 -0.1Tobacco products other than cigarettes1 , 2 . . . . . . . . . . . 0.054 2.4 0.0 -0.2 0.2 0.0
Personal care products1 . . . . . . . . . . . . . . . . . . . . . . . . . . . . . . . . . . . . 0.652 2.6 0.4 0.3 0.2 0.4Hair, dental, shaving, and miscellaneous personal
care products1 , 2 . . . . . . . . . . . . . . . . . . . . . . . . . . . . . . . . . . . . . . . 0.342 2.1 -0.1 0.0 0.8 -0.1Cosmetics, perfume, bath, nail preparations and
implements1 . . . . . . . . . . . . . . . . . . . . . . . . . . . . . . . . . . . . . . . . . . . . . 0.304 3.0 1.0 0.8 -0.5 1.0Miscellaneous personal goods2 . . . . . . . . . . . . . . . . . . . . . . . . . . . . 0.205 0.4 0.0 0.4 -0.2 1.5
Stationery, stationery supplies, gift wrap3 . . . . . . . . . . . . . 1.5 0.2 0.2 -0.2 1.7Infants’ equipment1 , 3 , 5 . . . . . . . . . . . . . . . . . . . . . . . . . . . . . . . . -2.1 -0.4 -0.4 -1.6 -0.4
Services less energy services. . . . . . . . . . . . . . . . . . . . . . . . . . . . . . . . . . . 56.199 2.4 0.2 0.2 0.1 0.1Shelter. . . . . . . . . . . . . . . . . . . . . . . . . . . . . . . . . . . . . . . . . . . . . . . . . . . . . . . . . . . . 31.519 2.1 0.2 0.1 0.1 0.2
Rent of shelter13 . . . . . . . . . . . . . . . . . . . . . . . . . . . . . . . . . . . . . . . . . . . . . 31.170 2.1 0.2 0.1 0.1 0.2Rent of primary residence8 . . . . . . . . . . . . . . . . . . . . . . . . . . . . . . 6.460 2.6 0.2 0.1 0.3 0.2
See footnotes at end of table.

Table 2. Consumer Price Index for All Urban Consumers (CPI-U): U.S. city average, by detailed expenditurecategory, August 2012 — Continued[1982-84=100, unless otherwise noted]
Expenditure category
Relativeimportance
Jul.2012
Unadjusted percentchange Seasonally adjusted percent change
Aug.2011-Aug.2012
Jul.2012-Aug.2012
May2012-Jun.2012
Jun.2012-Jul.
2012
Jul.2012-Aug.2012
Lodging away from home2 .. . . . . . . . . . . . . . . . . . . . . . . . . . . . . . 0.863 0.6 -2.7 0.9 -2.3 -0.6Housing at school, excluding board8 , 13 . . . . . . . . . . . . 0.154 4.0 2.0 0.3 0.5 0.2Other lodging away from home including hotels
and motels. . . . . . . . . . . . . . . . . . . . . . . . . . . . . . . . . . . . . . . . . . . . . 0.709 -0.3 -3.7 1.0 -3.0 -0.9Owners’ equivalent rent of residences8 , 13 . . . . . . . . . . . 23.846 2.0 0.3 0.1 0.2 0.3
Owners’ equivalent rent of primary residence8 , 13
. . . . . . . . . . . . . . . . . . . . . . . . . . . . . . . . . . . . . . . . . . . . . . . . . . . . . . . . . . . . . . . . . . . . . . . . . . . . 22.438 2.0 0.3 0.1 0.2 0.3Tenants’ and household insurance1 , 2 . . . . . . . . . . . . . . . . 0.349 3.3 0.1 0.1 0.3 0.1
Water and sewer and trash collection services2 . . . . . . . . 1.182 6.2 1.1 0.7 0.3 0.8Water and sewerage maintenance8 . . . . . . . . . . . . . . . . . . . . 0.891 7.4 1.5 0.8 0.1 1.0Garbage and trash collection1 , 11 . . . . . . . . . . . . . . . . . . . . . . 0.291 2.6 0.1 0.4 0.9 0.1
Household operations1 , 2 . . . . . . . . . . . . . . . . . . . . . . . . . . . . . . . . . . 0.729 2.3 0.1 0.4 -0.1 0.1Domestic services1 , 2 . . . . . . . . . . . . . . . . . . . . . . . . . . . . . . . . . . . . 0.250 1.5 0.1 0.7 -0.3 0.1Gardening and lawncare services1 , 2 . . . . . . . . . . . . . . . . . . 0.237 1.3 0.1 -0.1 0.0 0.1Moving, storage, freight expense1 , 2 . . . . . . . . . . . . . . . . . . 0.091 4.3 -0.2 0.6 -0.2 -0.2Repair of household items1 , 2 . . . . . . . . . . . . . . . . . . . . . . . . . . 0.078 0.4 0.9 0.4 0.4
Medical care services. . . . . . . . . . . . . . . . . . . . . . . . . . . . . . . . . . . . . . . . 5.416 4.2 0.0 0.7 0.3 0.2Professional services.. . . . . . . . . . . . . . . . . . . . . . . . . . . . . . . . . . . . . 3.003 2.2 0.3 0.4 0.2 0.4
Physicians’ services8 . . . . . . . . . . . . . . . . . . . . . . . . . . . . . . . . . . 1.615 2.5 0.2 0.8 0.4 0.3Dental services8 . . . . . . . . . . . . . . . . . . . . . . . . . . . . . . . . . . . . . . . . 0.760 2.4 0.4 0.3 0.1 0.5Eyeglasses and eye care6 . . . . . . . . . . . . . . . . . . . . . . . . . . . . 0.251 0.6 -0.2 -0.4 -0.8 0.1Services by other medical professionals1 , 8 , 6 . . . . 0.376 1.3 0.3 -0.1 0.0 0.3
Hospital and related services. . . . . . . . . . . . . . . . . . . . . . . . . . . . 1.762 4.4 -0.5 1.1 0.4 -0.4Hospital services8 , 14 . . . . . . . . . . . . . . . . . . . . . . . . . . . . . . . . . . 1.540 4.7 -0.6 1.2 0.4 -0.4
Inpatient hospital services8 , 14 , 3 . . . . . . . . . . . . . . . . . 4.9 -0.9 1.7 0.4 -0.7Outpatient hospital services8 , 3 , 6 . . . . . . . . . . . . . . . . 4.3 -0.6 0.9 0.4 -0.4
Nursing homes and adult day services8 , 14 . . . . . . . . 0.137 3.9 0.1 0.2 0.3 0.2Care of invalids and elderly at home1 , 5 . . . . . . . . . . . . 0.086 1.1 0.1 0.2 0.0 0.1
Health insurance1 , 5 . . . . . . . . . . . . . . . . . . . . . . . . . . . . . . . . . . . . . 0.651 14.8 0.5 1.0 0.9 0.5Transportation services. . . . . . . . . . . . . . . . . . . . . . . . . . . . . . . . . . . . . . 5.773 1.4 -0.1 -0.2 -0.2 0.0
Leased cars and trucks12 . . . . . . . . . . . . . . . . . . . . . . . . . . . . . . . . 0.384 -6.1 -0.8 0.0 -1.3 -0.7Car and truck rental2 . . . . . . . . . . . . . . . . . . . . . . . . . . . . . . . . . . . 0.075 0.9 0.4 0.9 0.2 -2.2
Motor vehicle maintenance and repair1 . . . . . . . . . . . . . . . . 1.146 1.7 0.1 0.1 -0.1 0.1Motor vehicle body work1 . . . . . . . . . . . . . . . . . . . . . . . . . . . . . 0.057 1.9 0.0 0.3 0.1 0.0Motor vehicle maintenance and servicing1 . . . . . . . . . 0.457 1.9 0.1 0.0 -0.1 0.1Motor vehicle repair1 , 2 . . . . . . . . . . . . . . . . . . . . . . . . . . . . . . . 0.596 1.6 0.1 0.1 -0.1 0.1
Motor vehicle insurance.. . . . . . . . . . . . . . . . . . . . . . . . . . . . . . . . . . 2.417 3.8 0.6 0.4 0.4 0.6Motor vehicle fees1 , 2 . . . . . . . . . . . . . . . . . . . . . . . . . . . . . . . . . . . . 0.562 3.1 0.1 0.1 0.3 0.1
State motor vehicle registration and license fees1 ,
8 , 2 . . . . . . . . . . . . . . . . . . . . . . . . . . . . . . . . . . . . . . . . . . . . . . . . . . . . 0.326 0.5 0.0 0.0 0.0 0.0Parking and other fees1 , 2 . . . . . . . . . . . . . . . . . . . . . . . . . . . . 0.214 7.3 0.3 0.2 0.8 0.3
Parking fees and tolls1 , 2 , 3 . . . . . . . . . . . . . . . . . . . . . . . 9.4 0.8 0.1 1.0 0.8Automobile service clubs1 , 2 , 3 . . . . . . . . . . . . . . . . . . . 2.9 -0.2 0.4 0.1 -0.2
Public transportation.. . . . . . . . . . . . . . . . . . . . . . . . . . . . . . . . . . . . . . 1.190 -1.5 -1.6 -1.8 -1.5 -0.9Airline fare. . . . . . . . . . . . . . . . . . . . . . . . . . . . . . . . . . . . . . . . . . . . . . . 0.773 -3.0 -2.1 -2.5 -2.7 -1.3Other intercity transportation. . . . . . . . . . . . . . . . . . . . . . . . . . 0.153 -1.7 -1.7 0.4 -1.5 -1.3
Intercity bus fare1 , 3 , 4 . . . . . . . . . . . . . . . . . . . . . . . . . . . . . 2.2 -0.4 1.4 1.4 -0.4Intercity train fare1 , 3 , 4 . . . . . . . . . . . . . . . . . . . . . . . . . . . . 3.0 -1.6 4.5 6.0 -1.6Ship fare1 , 2 , 3 . . . . . . . . . . . . . . . . . . . . . . . . . . . . . . . . . . . . . . -5.2 -2.8 1.1 0.2 -2.8
Intracity transportation1 . . . . . . . . . . . . . . . . . . . . . . . . . . . . . . . . 0.262 3.5 0.1 0.0 1.3 0.1Intracity mass transit1 , 3 , 9 . . . . . . . . . . . . . . . . . . . . . . . . 3.3 0.2 0.1 1.7 0.2
Recreation services9 . . . . . . . . . . . . . . . . . . . . . . . . . . . . . . . . . . . . . . . . 3.728 3.3 0.1 0.6 0.1 0.2Video and audio services9 . . . . . . . . . . . . . . . . . . . . . . . . . . . . . . . 1.514 4.8 0.2 0.1 0.2 0.4
Cable and satellite television and radio service11 .. . 1.403 5.3 0.3 0.2 0.3 0.5
See footnotes at end of table.
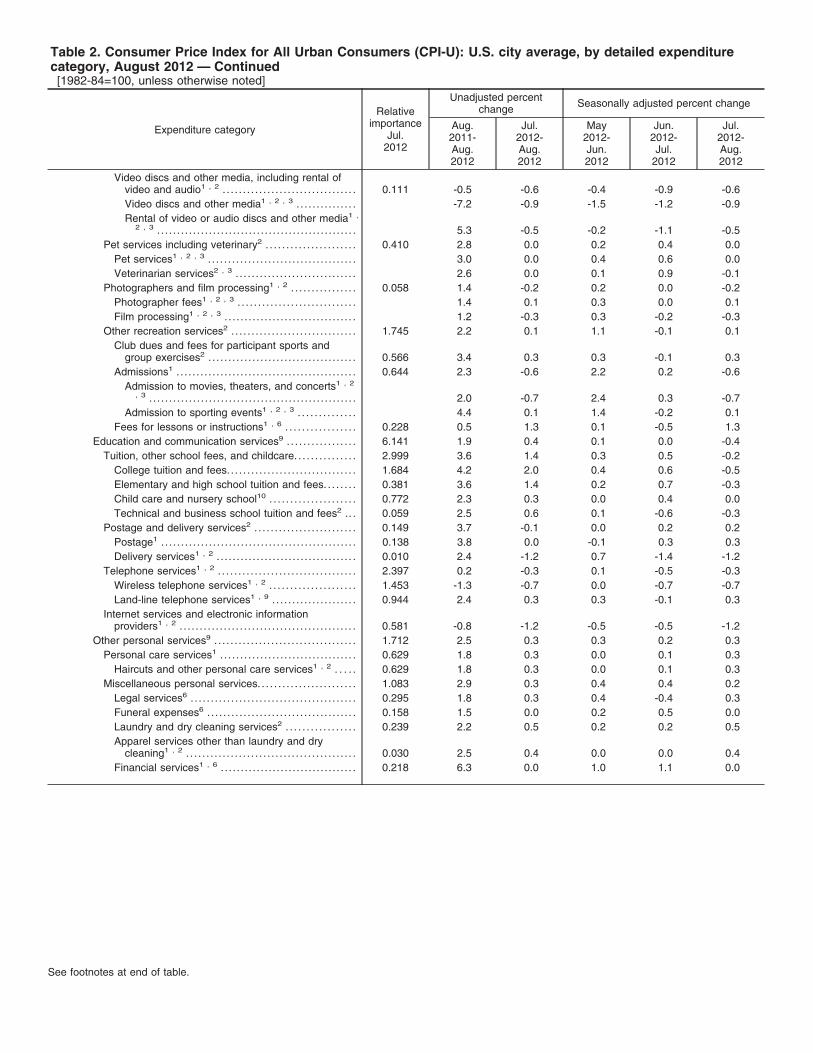
Table 2. Consumer Price Index for All Urban Consumers (CPI-U): U.S. city average, by detailed expenditurecategory, August 2012 — Continued[1982-84=100, unless otherwise noted]
Expenditure category
Relativeimportance
Jul.2012
Unadjusted percentchange Seasonally adjusted percent change
Aug.2011-Aug.2012
Jul.2012-Aug.2012
May2012-Jun.2012
Jun.2012-Jul.
2012
Jul.2012-Aug.2012
Video discs and other media, including rental ofvideo and audio1 , 2 . . . . . . . . . . . . . . . . . . . . . . . . . . . . . . . . . 0.111 -0.5 -0.6 -0.4 -0.9 -0.6Video discs and other media1 , 2 , 3 . . . . . . . . . . . . . . . -7.2 -0.9 -1.5 -1.2 -0.9Rental of video or audio discs and other media1 ,
2 , 3 . . . . . . . . . . . . . . . . . . . . . . . . . . . . . . . . . . . . . . . . . . . . . . . . . . 5.3 -0.5 -0.2 -1.1 -0.5Pet services including veterinary2 . . . . . . . . . . . . . . . . . . . . . . 0.410 2.8 0.0 0.2 0.4 0.0
Pet services1 , 2 , 3 . . . . . . . . . . . . . . . . . . . . . . . . . . . . . . . . . . . . . 3.0 0.0 0.4 0.6 0.0Veterinarian services2 , 3 . . . . . . . . . . . . . . . . . . . . . . . . . . . . . . 2.6 0.0 0.1 0.9 -0.1
Photographers and film processing1 , 2 . . . . . . . . . . . . . . . . 0.058 1.4 -0.2 0.2 0.0 -0.2Photographer fees1 , 2 , 3 . . . . . . . . . . . . . . . . . . . . . . . . . . . . . 1.4 0.1 0.3 0.0 0.1Film processing1 , 2 , 3 . . . . . . . . . . . . . . . . . . . . . . . . . . . . . . . . . 1.2 -0.3 0.3 -0.2 -0.3
Other recreation services2 . . . . . . . . . . . . . . . . . . . . . . . . . . . . . . . 1.745 2.2 0.1 1.1 -0.1 0.1Club dues and fees for participant sports and
group exercises2 . . . . . . . . . . . . . . . . . . . . . . . . . . . . . . . . . . . . . 0.566 3.4 0.3 0.3 -0.1 0.3Admissions1 . . . . . . . . . . . . . . . . . . . . . . . . . . . . . . . . . . . . . . . . . . . . . 0.644 2.3 -0.6 2.2 0.2 -0.6
Admission to movies, theaters, and concerts1 , 2
, 3 . . . . . . . . . . . . . . . . . . . . . . . . . . . . . . . . . . . . . . . . . . . . . . . . . . . . 2.0 -0.7 2.4 0.3 -0.7Admission to sporting events1 , 2 , 3 . . . . . . . . . . . . . . 4.4 0.1 1.4 -0.2 0.1
Fees for lessons or instructions1 , 6 . . . . . . . . . . . . . . . . . 0.228 0.5 1.3 0.1 -0.5 1.3Education and communication services9 . . . . . . . . . . . . . . . . . 6.141 1.9 0.4 0.1 0.0 -0.4
Tuition, other school fees, and childcare. . . . . . . . . . . . . . . 2.999 3.6 1.4 0.3 0.5 -0.2College tuition and fees. . . . . . . . . . . . . . . . . . . . . . . . . . . . . . . . 1.684 4.2 2.0 0.4 0.6 -0.5Elementary and high school tuition and fees. . . . . . . . 0.381 3.6 1.4 0.2 0.7 -0.3Child care and nursery school10 . . . . . . . . . . . . . . . . . . . . . 0.772 2.3 0.3 0.0 0.4 0.0Technical and business school tuition and fees2 .. . 0.059 2.5 0.6 0.1 -0.6 -0.3
Postage and delivery services2 . . . . . . . . . . . . . . . . . . . . . . . . . 0.149 3.7 -0.1 0.0 0.2 0.2Postage1 .. . . . . . . . . . . . . . . . . . . . . . . . . . . . . . . . . . . . . . . . . . . . . . . . 0.138 3.8 0.0 -0.1 0.3 0.3Delivery services1 , 2 . . . . . . . . . . . . . . . . . . . . . . . . . . . . . . . . . . . 0.010 2.4 -1.2 0.7 -1.4 -1.2
Telephone services1 , 2 . . . . . . . . . . . . . . . . . . . . . . . . . . . . . . . . . . 2.397 0.2 -0.3 0.1 -0.5 -0.3Wireless telephone services1 , 2 . . . . . . . . . . . . . . . . . . . . . 1.453 -1.3 -0.7 0.0 -0.7 -0.7Land-line telephone services1 , 9 . . . . . . . . . . . . . . . . . . . . . 0.944 2.4 0.3 0.3 -0.1 0.3
Internet services and electronic informationproviders1 , 2 . . . . . . . . . . . . . . . . . . . . . . . . . . . . . . . . . . . . . . . . . . . . 0.581 -0.8 -1.2 -0.5 -0.5 -1.2
Other personal services9 . . . . . . . . . . . . . . . . . . . . . . . . . . . . . . . . . . . 1.712 2.5 0.3 0.3 0.2 0.3Personal care services1 . . . . . . . . . . . . . . . . . . . . . . . . . . . . . . . . . . 0.629 1.8 0.3 0.0 0.1 0.3
Haircuts and other personal care services1 , 2 . . . . . 0.629 1.8 0.3 0.0 0.1 0.3Miscellaneous personal services. . . . . . . . . . . . . . . . . . . . . . . . 1.083 2.9 0.3 0.4 0.4 0.2
Legal services6 . . . . . . . . . . . . . . . . . . . . . . . . . . . . . . . . . . . . . . . . . 0.295 1.8 0.3 0.4 -0.4 0.3Funeral expenses6 . . . . . . . . . . . . . . . . . . . . . . . . . . . . . . . . . . . . . 0.158 1.5 0.0 0.2 0.5 0.0Laundry and dry cleaning services2 . . . . . . . . . . . . . . . . . 0.239 2.2 0.5 0.2 0.2 0.5Apparel services other than laundry and dry
cleaning1 , 2 . . . . . . . . . . . . . . . . . . . . . . . . . . . . . . . . . . . . . . . . . . 0.030 2.5 0.4 0.0 0.0 0.4Financial services1 , 6 . . . . . . . . . . . . . . . . . . . . . . . . . . . . . . . . . . 0.218 6.3 0.0 1.0 1.1 0.0
See footnotes at end of table.
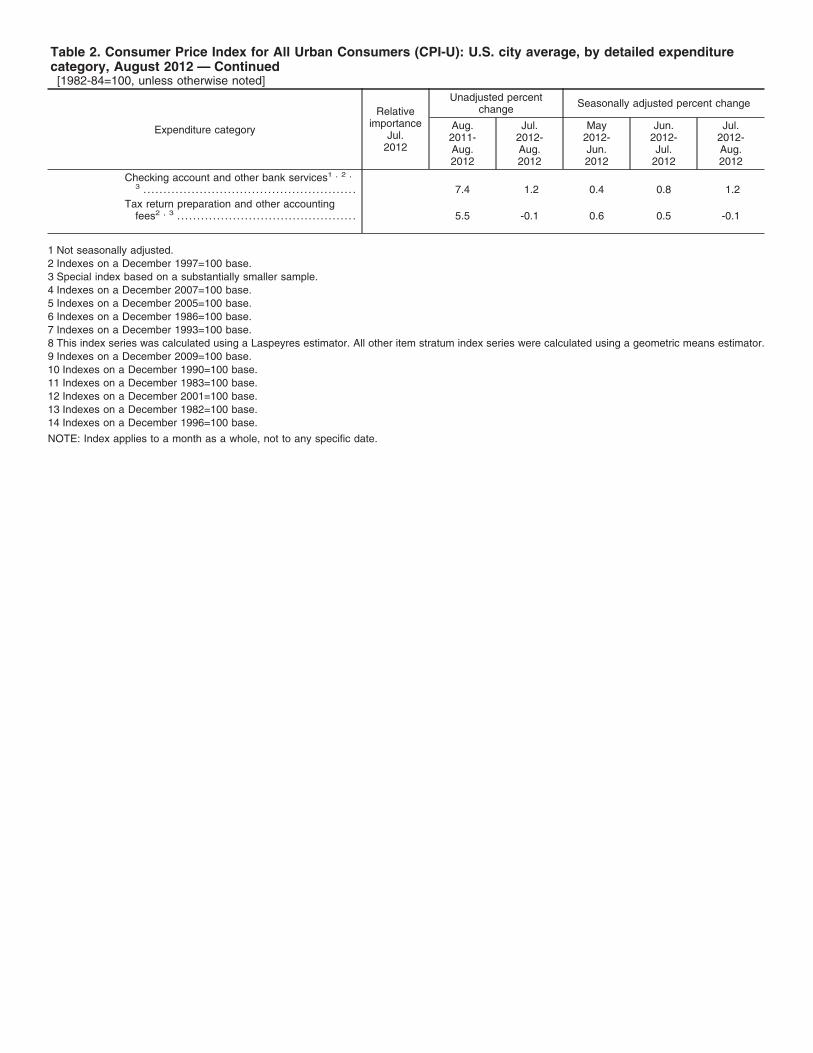
Table 2. Consumer Price Index for All Urban Consumers (CPI-U): U.S. city average, by detailed expenditurecategory, August 2012 — Continued[1982-84=100, unless otherwise noted]
Expenditure category
Relativeimportance
Jul.2012
Unadjusted percentchange Seasonally adjusted percent change
Aug.2011-Aug.2012
Jul.2012-Aug.2012
May2012-Jun.2012
Jun.2012-Jul.
2012
Jul.2012-Aug.2012
Checking account and other bank services1 , 2 ,
3 . . . . . . . . . . . . . . . . . . . . . . . . . . . . . . . . . . . . . . . . . . . . . . . . . . . . . 7.4 1.2 0.4 0.8 1.2Tax return preparation and other accounting
fees2 , 3 . . . . . . . . . . . . . . . . . . . . . . . . . . . . . . . . . . . . . . . . . . . . . 5.5 -0.1 0.6 0.5 -0.1
1 Not seasonally adjusted.2 Indexes on a December 1997=100 base.3 Special index based on a substantially smaller sample.4 Indexes on a December 2007=100 base.5 Indexes on a December 2005=100 base.6 Indexes on a December 1986=100 base.7 Indexes on a December 1993=100 base.8 This index series was calculated using a Laspeyres estimator. All other item stratum index series were calculated using a geometric means estimator.9 Indexes on a December 2009=100 base.10 Indexes on a December 1990=100 base.11 Indexes on a December 1983=100 base.12 Indexes on a December 2001=100 base.13 Indexes on a December 1982=100 base.14 Indexes on a December 1996=100 base.
NOTE: Index applies to a month as a whole, not to any specific date.
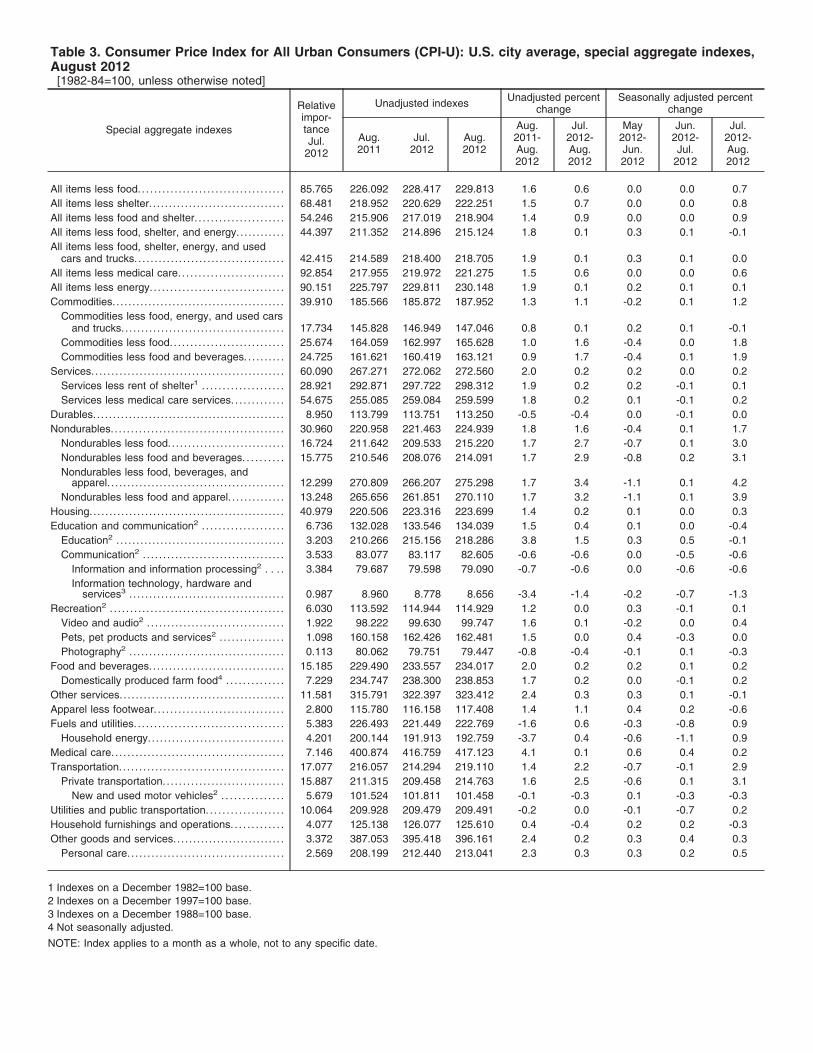
Table 3. Consumer Price Index for All Urban Consumers (CPI-U): U.S. city average, special aggregate indexes,August 2012[1982-84=100, unless otherwise noted]
Special aggregate indexes
Relativeimpor-tanceJul.
2012
Unadjusted indexes Unadjusted percentchange
Seasonally adjusted percentchange
Aug.2011
Jul.2012
Aug.2012
Aug.2011-Aug.2012
Jul.2012-Aug.2012
May2012-Jun.2012
Jun.2012-Jul.
2012
Jul.2012-Aug.2012
All items less food. . . . . . . . . . . . . . . . . . . . . . . . . . . . . . . . . . . . 85.765 226.092 228.417 229.813 1.6 0.6 0.0 0.0 0.7All items less shelter. . . . . . . . . . . . . . . . . . . . . . . . . . . . . . . . . . 68.481 218.952 220.629 222.251 1.5 0.7 0.0 0.0 0.8All items less food and shelter. . . . . . . . . . . . . . . . . . . . . . 54.246 215.906 217.019 218.904 1.4 0.9 0.0 0.0 0.9All items less food, shelter, and energy. . . . . . . . . . . . 44.397 211.352 214.896 215.124 1.8 0.1 0.3 0.1 -0.1All items less food, shelter, energy, and used
cars and trucks. . . . . . . . . . . . . . . . . . . . . . . . . . . . . . . . . . . . . 42.415 214.589 218.400 218.705 1.9 0.1 0.3 0.1 0.0All items less medical care. . . . . . . . . . . . . . . . . . . . . . . . . . 92.854 217.955 219.972 221.275 1.5 0.6 0.0 0.0 0.6All items less energy. . . . . . . . . . . . . . . . . . . . . . . . . . . . . . . . . 90.151 225.797 229.811 230.148 1.9 0.1 0.2 0.1 0.1Commodities. . . . . . . . . . . . . . . . . . . . . . . . . . . . . . . . . . . . . . . . . . . 39.910 185.566 185.872 187.952 1.3 1.1 -0.2 0.1 1.2
Commodities less food, energy, and used carsand trucks.. . . . . . . . . . . . . . . . . . . . . . . . . . . . . . . . . . . . . . . . 17.734 145.828 146.949 147.046 0.8 0.1 0.2 0.1 -0.1
Commodities less food. . . . . . . . . . . . . . . . . . . . . . . . . . . . 25.674 164.059 162.997 165.628 1.0 1.6 -0.4 0.0 1.8Commodities less food and beverages. . . . . . . . . . 24.725 161.621 160.419 163.121 0.9 1.7 -0.4 0.1 1.9
Services. . . . . . . . . . . . . . . . . . . . . . . . . . . . . . . . . . . . . . . . . . . . . . . . 60.090 267.271 272.062 272.560 2.0 0.2 0.2 0.0 0.2Services less rent of shelter1 . . . . . . . . . . . . . . . . . . . . 28.921 292.871 297.722 298.312 1.9 0.2 0.2 -0.1 0.1Services less medical care services. . . . . . . . . . . . . 54.675 255.085 259.084 259.599 1.8 0.2 0.1 -0.1 0.2
Durables.. . . . . . . . . . . . . . . . . . . . . . . . . . . . . . . . . . . . . . . . . . . . . . . 8.950 113.799 113.751 113.250 -0.5 -0.4 0.0 -0.1 0.0Nondurables. . . . . . . . . . . . . . . . . . . . . . . . . . . . . . . . . . . . . . . . . . . 30.960 220.958 221.463 224.939 1.8 1.6 -0.4 0.1 1.7
Nondurables less food.. . . . . . . . . . . . . . . . . . . . . . . . . . . . 16.724 211.642 209.533 215.220 1.7 2.7 -0.7 0.1 3.0Nondurables less food and beverages. . . . . . . . . . 15.775 210.546 208.076 214.091 1.7 2.9 -0.8 0.2 3.1Nondurables less food, beverages, and
apparel. . . . . . . . . . . . . . . . . . . . . . . . . . . . . . . . . . . . . . . . . . . . 12.299 270.809 266.207 275.298 1.7 3.4 -1.1 0.1 4.2Nondurables less food and apparel. . . . . . . . . . . . . . 13.248 265.656 261.851 270.110 1.7 3.2 -1.1 0.1 3.9
Housing.. . . . . . . . . . . . . . . . . . . . . . . . . . . . . . . . . . . . . . . . . . . . . . . . 40.979 220.506 223.316 223.699 1.4 0.2 0.1 0.0 0.3Education and communication2 . . . . . . . . . . . . . . . . . . . . 6.736 132.028 133.546 134.039 1.5 0.4 0.1 0.0 -0.4
Education2 . . . . . . . . . . . . . . . . . . . . . . . . . . . . . . . . . . . . . . . . . . 3.203 210.266 215.156 218.286 3.8 1.5 0.3 0.5 -0.1Communication2 . . . . . . . . . . . . . . . . . . . . . . . . . . . . . . . . . . . 3.533 83.077 83.117 82.605 -0.6 -0.6 0.0 -0.5 -0.6
Information and information processing2 . . . . 3.384 79.687 79.598 79.090 -0.7 -0.6 0.0 -0.6 -0.6Information technology, hardware and
services3 . . . . . . . . . . . . . . . . . . . . . . . . . . . . . . . . . . . . . . . 0.987 8.960 8.778 8.656 -3.4 -1.4 -0.2 -0.7 -1.3Recreation2 . . . . . . . . . . . . . . . . . . . . . . . . . . . . . . . . . . . . . . . . . . . 6.030 113.592 114.944 114.929 1.2 0.0 0.3 -0.1 0.1
Video and audio2 . . . . . . . . . . . . . . . . . . . . . . . . . . . . . . . . . . 1.922 98.222 99.630 99.747 1.6 0.1 -0.2 0.0 0.4Pets, pet products and services2 . . . . . . . . . . . . . . . . 1.098 160.158 162.426 162.481 1.5 0.0 0.4 -0.3 0.0Photography2 .. . . . . . . . . . . . . . . . . . . . . . . . . . . . . . . . . . . . . . 0.113 80.062 79.751 79.447 -0.8 -0.4 -0.1 0.1 -0.3
Food and beverages.. . . . . . . . . . . . . . . . . . . . . . . . . . . . . . . . . 15.185 229.490 233.557 234.017 2.0 0.2 0.2 0.1 0.2Domestically produced farm food4 . . . . . . . . . . . . . . 7.229 234.747 238.300 238.853 1.7 0.2 0.0 -0.1 0.2
Other services. . . . . . . . . . . . . . . . . . . . . . . . . . . . . . . . . . . . . . . . . 11.581 315.791 322.397 323.412 2.4 0.3 0.3 0.1 -0.1Apparel less footwear. . . . . . . . . . . . . . . . . . . . . . . . . . . . . . . . 2.800 115.780 116.158 117.408 1.4 1.1 0.4 0.2 -0.6Fuels and utilities. . . . . . . . . . . . . . . . . . . . . . . . . . . . . . . . . . . . . 5.383 226.493 221.449 222.769 -1.6 0.6 -0.3 -0.8 0.9
Household energy. . . . . . . . . . . . . . . . . . . . . . . . . . . . . . . . . . 4.201 200.144 191.913 192.759 -3.7 0.4 -0.6 -1.1 0.9Medical care. . . . . . . . . . . . . . . . . . . . . . . . . . . . . . . . . . . . . . . . . . . 7.146 400.874 416.759 417.123 4.1 0.1 0.6 0.4 0.2Transportation. . . . . . . . . . . . . . . . . . . . . . . . . . . . . . . . . . . . . . . . . 17.077 216.057 214.294 219.110 1.4 2.2 -0.7 -0.1 2.9
Private transportation. . . . . . . . . . . . . . . . . . . . . . . . . . . . . . 15.887 211.315 209.458 214.763 1.6 2.5 -0.6 0.1 3.1New and used motor vehicles2 . . . . . . . . . . . . . . . 5.679 101.524 101.811 101.458 -0.1 -0.3 0.1 -0.3 -0.3
Utilities and public transportation. . . . . . . . . . . . . . . . . . . 10.064 209.928 209.479 209.491 -0.2 0.0 -0.1 -0.7 0.2Household furnishings and operations. . . . . . . . . . . . . 4.077 125.138 126.077 125.610 0.4 -0.4 0.2 0.2 -0.3Other goods and services.. . . . . . . . . . . . . . . . . . . . . . . . . . . 3.372 387.053 395.418 396.161 2.4 0.2 0.3 0.4 0.3
Personal care. . . . . . . . . . . . . . . . . . . . . . . . . . . . . . . . . . . . . . . 2.569 208.199 212.440 213.041 2.3 0.3 0.3 0.2 0.5
1 Indexes on a December 1982=100 base.2 Indexes on a December 1997=100 base.3 Indexes on a December 1988=100 base.4 Not seasonally adjusted.
NOTE: Index applies to a month as a whole, not to any specific date.

Table 4. Consumer Price Index for All Urban Consumers (CPI-U): Selected areas, all items index, August 2012[1982-84=100, unless otherwise noted]
AreaPricing
Schedule1
Percent change to Aug. 2012 from: Percent change to Jul. 2012 from:
Aug.2011
Jun.2012
Jul.2012
Jul.2011
May2012
Jun.2012
U.S. city average. . . . . . . . . . . . . . . . . . . . . . . . . . M 1.7 0.4 0.6 1.4 -0.3 -0.2
Region and area size2
Northeast urban. . . . . . . . . . . . . . . . . . . . . . . . . M 1.3 0.4 0.5 1.1 -0.3 -0.1Size A - More than 1,500,000. . . . . . M 1.4 0.5 0.6 1.1 -0.2 -0.1Size B/C - 50,000 to 1,500,0003 .. . M 1.1 0.2 0.3 1.0 -0.5 -0.1
Midwest urban.. . . . . . . . . . . . . . . . . . . . . . . . . . M 1.8 0.7 0.7 1.3 -0.1 0.0Size A - More than 1,500,000. . . . . . M 1.7 0.6 0.6 1.3 -0.1 0.0Size B/C - 50,000 to 1,500,0003 .. . M 1.9 0.7 0.8 1.2 -0.2 -0.1Size D - Nonmetropolitan (less
than 50,000). . . . . . . . . . . . . . . . . . . . . . . . M 2.0 0.8 0.6 1.8 0.4 0.2
South urban.. . . . . . . . . . . . . . . . . . . . . . . . . . . . . M 1.6 0.4 0.6 1.4 -0.3 -0.2Size A - More than 1,500,000. . . . . . M 1.5 0.4 0.7 1.2 -0.4 -0.3Size B/C - 50,000 to 1,500,0003 .. . M 1.5 0.4 0.5 1.4 -0.3 -0.1Size D - Nonmetropolitan (less
than 50,000). . . . . . . . . . . . . . . . . . . . . . . . M 2.5 0.9 0.8 1.7 -0.3 0.1
West urban. . . . . . . . . . . . . . . . . . . . . . . . . . . . . . M 2.1 0.1 0.5 1.8 -0.5 -0.3Size A - More than 1,500,000. . . . . . M 2.3 0.3 0.6 2.0 -0.4 -0.3Size B/C - 50,000 to 1,500,0003 .. . M 1.3 -0.3 0.2 1.1 -0.8 -0.5
Size classes
A4 . . . . . . . . . . . . . . . . . . . . . . . . . . . . . . . . . . . . . . . . M 1.8 0.4 0.6 1.4 -0.3 -0.2B/C3 . . . . . . . . . . . . . . . . . . . . . . . . . . . . . . . . . . . . . . M 1.4 0.3 0.5 1.3 -0.4 -0.2D.. . . . . . . . . . . . . . . . . . . . . . . . . . . . . . . . . . . . . . . . . M 2.5 0.7 0.7 2.0 -0.1 0.0
Selected local areas5
Chicago-Gary-Kenosha, IL-IN-WI. . . . . M 1.5 0.4 0.6 1.1 -0.3 -0.2Los Angeles-Riverside-Orange
County, CA.. . . . . . . . . . . . . . . . . . . . . . . . . . . M 2.3 0.5 0.6 1.9 -0.5 -0.1New York-Northern N.J.-Long Island,
NY-NJ-CT-PA.. . . . . . . . . . . . . . . . . . . . . . . . M 1.4 0.4 0.6 1.1 -0.3 -0.2
Boston-Brockton-Nashua,MA-NH-ME-CT.. . . . . . . . . . . . . . . . . . . . . . . 1 0.8 -0.1
Cleveland-Akron, OH.. . . . . . . . . . . . . . . . . . 1 1.4 0.0Dallas-Fort Worth, TX. . . . . . . . . . . . . . . . . . 1 1.3 -0.5Washington-Baltimore,
DC-MD-VA-WV6 . . . . . . . . . . . . . . . . . . . . . 1 1.4 -0.2
Atlanta, GA. . . . . . . . . . . . . . . . . . . . . . . . . . . . . . 2 1.5 0.6Detroit-Ann Arbor-Flint, MI. . . . . . . . . . . . . 2 1.5 1.2Houston-Galveston-Brazoria, TX.. . . . . 2 0.7 -0.4Miami-Fort Lauderdale, FL.. . . . . . . . . . . . 2 1.4 0.9Philadelphia-Wilmington-Atlantic City,
PA-NJ-DE-MD.. . . . . . . . . . . . . . . . . . . . . . . 2 1.4 0.9
See footnotes at end of table.
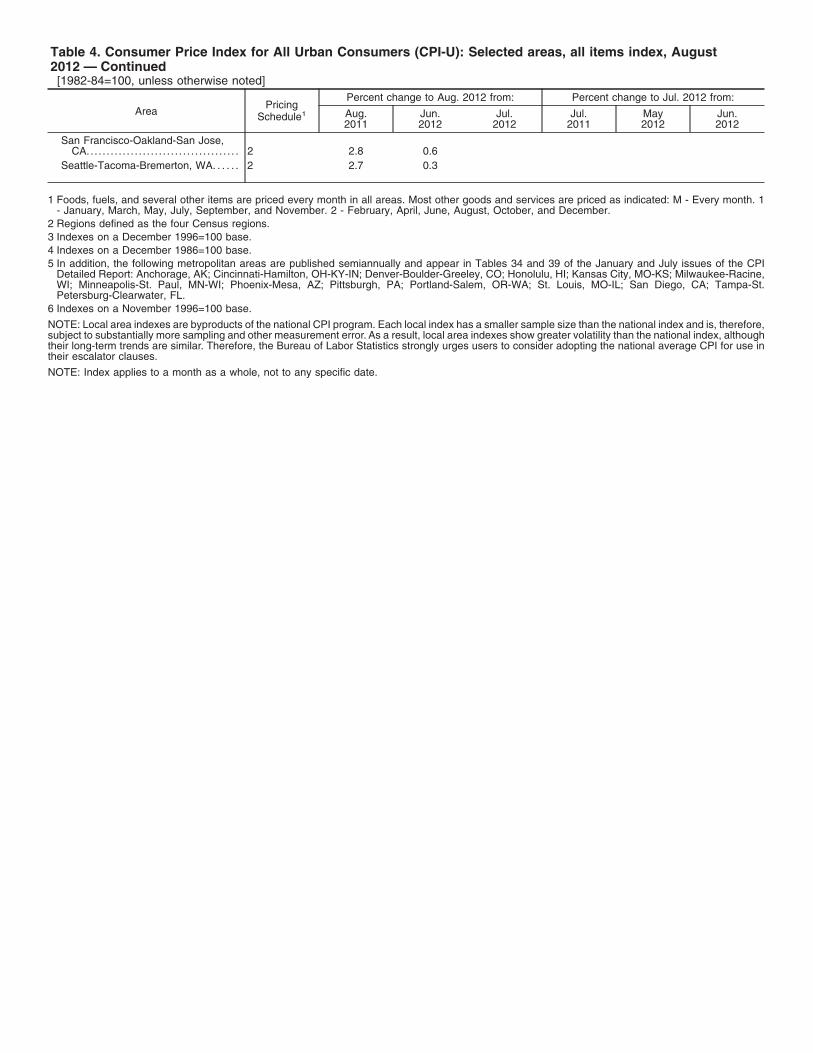
Table 4. Consumer Price Index for All Urban Consumers (CPI-U): Selected areas, all items index, August2012 — Continued[1982-84=100, unless otherwise noted]
AreaPricing
Schedule1
Percent change to Aug. 2012 from: Percent change to Jul. 2012 from:
Aug.2011
Jun.2012
Jul.2012
Jul.2011
May2012
Jun.2012
San Francisco-Oakland-San Jose,CA.. . . . . . . . . . . . . . . . . . . . . . . . . . . . . . . . . . . . . 2 2.8 0.6
Seattle-Tacoma-Bremerton, WA. . . . . . 2 2.7 0.3
1 Foods, fuels, and several other items are priced every month in all areas. Most other goods and services are priced as indicated: M - Every month. 1- January, March, May, July, September, and November. 2 - February, April, June, August, October, and December.
2 Regions defined as the four Census regions.3 Indexes on a December 1996=100 base.4 Indexes on a December 1986=100 base.5 In addition, the following metropolitan areas are published semiannually and appear in Tables 34 and 39 of the January and July issues of the CPI
Detailed Report: Anchorage, AK; Cincinnati-Hamilton, OH-KY-IN; Denver-Boulder-Greeley, CO; Honolulu, HI; Kansas City, MO-KS; Milwaukee-Racine,WI; Minneapolis-St. Paul, MN-WI; Phoenix-Mesa, AZ; Pittsburgh, PA; Portland-Salem, OR-WA; St. Louis, MO-IL; San Diego, CA; Tampa-St.Petersburg-Clearwater, FL.
6 Indexes on a November 1996=100 base.
NOTE: Local area indexes are byproducts of the national CPI program. Each local index has a smaller sample size than the national index and is, therefore,subject to substantially more sampling and other measurement error. As a result, local area indexes show greater volatility than the national index, althoughtheir long-term trends are similar. Therefore, the Bureau of Labor Statistics strongly urges users to consider adopting the national average CPI for use intheir escalator clauses.
NOTE: Index applies to a month as a whole, not to any specific date.

Table 5. Chained Consumer Price Index for All Urban Consumers (C-CPI-U) and the Consumer Price Index forAll Urban Consumers (CPI-U): U.S. city average, all items index, August 2012[Percent changes]
Month YearUnadjusted 1-month percent
changeUnadjusted 12-month percent
change
C-CPI-U1 CPI-U C-CPI-U1 CPI-U
December 2000.. . . . . . . . . . . . . . . . . . . . . . . . . . . . . . . . . . . . . . . . . . . . . . . . . . . . . . . . . . . . . . . . . . . . . . . . . . . 2.6 3.4December 2001.. . . . . . . . . . . . . . . . . . . . . . . . . . . . . . . . . . . . . . . . . . . . . . . . . . . . . . . . . . . . . . . . . . . . . . . . . . . 1.3 1.6December 2002.. . . . . . . . . . . . . . . . . . . . . . . . . . . . . . . . . . . . . . . . . . . . . . . . . . . . . . . . . . . . . . . . . . . . . . . . . . . 2.0 2.4December 2003.. . . . . . . . . . . . . . . . . . . . . . . . . . . . . . . . . . . . . . . . . . . . . . . . . . . . . . . . . . . . . . . . . . . . . . . . . . . 1.7 1.9December 2004.. . . . . . . . . . . . . . . . . . . . . . . . . . . . . . . . . . . . . . . . . . . . . . . . . . . . . . . . . . . . . . . . . . . . . . . . . . . 3.2 3.3December 2005.. . . . . . . . . . . . . . . . . . . . . . . . . . . . . . . . . . . . . . . . . . . . . . . . . . . . . . . . . . . . . . . . . . . . . . . . . . . 2.9 3.4December 2006.. . . . . . . . . . . . . . . . . . . . . . . . . . . . . . . . . . . . . . . . . . . . . . . . . . . . . . . . . . . . . . . . . . . . . . . . . . . 2.3 2.5December 2007.. . . . . . . . . . . . . . . . . . . . . . . . . . . . . . . . . . . . . . . . . . . . . . . . . . . . . . . . . . . . . . . . . . . . . . . . . . . 3.7 4.1December 2008.. . . . . . . . . . . . . . . . . . . . . . . . . . . . . . . . . . . . . . . . . . . . . . . . . . . . . . . . . . . . . . . . . . . . . . . . . . . 0.2 0.1December 2009.. . . . . . . . . . . . . . . . . . . . . . . . . . . . . . . . . . . . . . . . . . . . . . . . . . . . . . . . . . . . . . . . . . . . . . . . . . . 2.5 2.7
January 2010.. . . . . . . . . . . . . . . . . . . . . . . . . . . . . . . . . . . . . . . . . . . . . . . . . . . . . . . . . . . . . . . . . . . . . . . . . . . . . . 0.4 0.3 2.4 2.6February 2010.. . . . . . . . . . . . . . . . . . . . . . . . . . . . . . . . . . . . . . . . . . . . . . . . . . . . . . . . . . . . . . . . . . . . . . . . . . . . . 0.0 0.0 1.9 2.1March 2010.. . . . . . . . . . . . . . . . . . . . . . . . . . . . . . . . . . . . . . . . . . . . . . . . . . . . . . . . . . . . . . . . . . . . . . . . . . . . . . . . 0.4 0.4 2.1 2.3April 2010.. . . . . . . . . . . . . . . . . . . . . . . . . . . . . . . . . . . . . . . . . . . . . . . . . . . . . . . . . . . . . . . . . . . . . . . . . . . . . . . . . . 0.1 0.2 2.1 2.2May 2010.. . . . . . . . . . . . . . . . . . . . . . . . . . . . . . . . . . . . . . . . . . . . . . . . . . . . . . . . . . . . . . . . . . . . . . . . . . . . . . . . . . 0.0 0.1 1.8 2.0June 2010.. . . . . . . . . . . . . . . . . . . . . . . . . . . . . . . . . . . . . . . . . . . . . . . . . . . . . . . . . . . . . . . . . . . . . . . . . . . . . . . . . -0.1 -0.1 0.8 1.1July 2010.. . . . . . . . . . . . . . . . . . . . . . . . . . . . . . . . . . . . . . . . . . . . . . . . . . . . . . . . . . . . . . . . . . . . . . . . . . . . . . . . . . . 0.0 0.0 1.0 1.2August 2010.. . . . . . . . . . . . . . . . . . . . . . . . . . . . . . . . . . . . . . . . . . . . . . . . . . . . . . . . . . . . . . . . . . . . . . . . . . . . . . . 0.2 0.1 0.9 1.1September 2010.. . . . . . . . . . . . . . . . . . . . . . . . . . . . . . . . . . . . . . . . . . . . . . . . . . . . . . . . . . . . . . . . . . . . . . . . . . 0.1 0.1 0.9 1.1October 2010.. . . . . . . . . . . . . . . . . . . . . . . . . . . . . . . . . . . . . . . . . . . . . . . . . . . . . . . . . . . . . . . . . . . . . . . . . . . . . . 0.1 0.1 0.9 1.2November 2010.. . . . . . . . . . . . . . . . . . . . . . . . . . . . . . . . . . . . . . . . . . . . . . . . . . . . . . . . . . . . . . . . . . . . . . . . . . . 0.0 0.0 0.9 1.1December 2010.. . . . . . . . . . . . . . . . . . . . . . . . . . . . . . . . . . . . . . . . . . . . . . . . . . . . . . . . . . . . . . . . . . . . . . . . . . . 0.2 0.2 1.3 1.5January 2011.. . . . . . . . . . . . . . . . . . . . . . . . . . . . . . . . . . . . . . . . . . . . . . . . . . . . . . . . . . . . . . . . . . . . . . . . . . . . . . 0.4 0.5 1.4 1.6February 2011.. . . . . . . . . . . . . . . . . . . . . . . . . . . . . . . . . . . . . . . . . . . . . . . . . . . . . . . . . . . . . . . . . . . . . . . . . . . . . 0.5 0.5 1.9 2.1March 2011.. . . . . . . . . . . . . . . . . . . . . . . . . . . . . . . . . . . . . . . . . . . . . . . . . . . . . . . . . . . . . . . . . . . . . . . . . . . . . . . . 0.8 1.0 2.3 2.7April 2011.. . . . . . . . . . . . . . . . . . . . . . . . . . . . . . . . . . . . . . . . . . . . . . . . . . . . . . . . . . . . . . . . . . . . . . . . . . . . . . . . . . 0.6 0.6 2.7 3.2May 2011.. . . . . . . . . . . . . . . . . . . . . . . . . . . . . . . . . . . . . . . . . . . . . . . . . . . . . . . . . . . . . . . . . . . . . . . . . . . . . . . . . . 0.4 0.5 3.1 3.6June 2011.. . . . . . . . . . . . . . . . . . . . . . . . . . . . . . . . . . . . . . . . . . . . . . . . . . . . . . . . . . . . . . . . . . . . . . . . . . . . . . . . . 0.0 -0.1 3.2 3.6July 2011.. . . . . . . . . . . . . . . . . . . . . . . . . . . . . . . . . . . . . . . . . . . . . . . . . . . . . . . . . . . . . . . . . . . . . . . . . . . . . . . . . . . 0.1 0.1 3.3 3.6August 2011.. . . . . . . . . . . . . . . . . . . . . . . . . . . . . . . . . . . . . . . . . . . . . . . . . . . . . . . . . . . . . . . . . . . . . . . . . . . . . . . 0.3 0.3 3.4 3.8September 2011.. . . . . . . . . . . . . . . . . . . . . . . . . . . . . . . . . . . . . . . . . . . . . . . . . . . . . . . . . . . . . . . . . . . . . . . . . . 0.2 0.2 3.5 3.9October 2011.. . . . . . . . . . . . . . . . . . . . . . . . . . . . . . . . . . . . . . . . . . . . . . . . . . . . . . . . . . . . . . . . . . . . . . . . . . . . . . -0.2 -0.2 3.2 3.5November 2011.. . . . . . . . . . . . . . . . . . . . . . . . . . . . . . . . . . . . . . . . . . . . . . . . . . . . . . . . . . . . . . . . . . . . . . . . . . . -0.1 -0.1 3.1 3.4December 2011.. . . . . . . . . . . . . . . . . . . . . . . . . . . . . . . . . . . . . . . . . . . . . . . . . . . . . . . . . . . . . . . . . . . . . . . . . . . -0.2 -0.2 2.7 3.0January 2012.. . . . . . . . . . . . . . . . . . . . . . . . . . . . . . . . . . . . . . . . . . . . . . . . . . . . . . . . . . . . . . . . . . . . . . . . . . . . . . 0.4 0.4 2.7 2.9February 2012.. . . . . . . . . . . . . . . . . . . . . . . . . . . . . . . . . . . . . . . . . . . . . . . . . . . . . . . . . . . . . . . . . . . . . . . . . . . . . 0.4 0.4 2.6 2.9March 2012.. . . . . . . . . . . . . . . . . . . . . . . . . . . . . . . . . . . . . . . . . . . . . . . . . . . . . . . . . . . . . . . . . . . . . . . . . . . . . . . . 0.6 0.8 2.4 2.7April 2012.. . . . . . . . . . . . . . . . . . . . . . . . . . . . . . . . . . . . . . . . . . . . . . . . . . . . . . . . . . . . . . . . . . . . . . . . . . . . . . . . . . 0.3 0.3 2.1 2.3May 2012.. . . . . . . . . . . . . . . . . . . . . . . . . . . . . . . . . . . . . . . . . . . . . . . . . . . . . . . . . . . . . . . . . . . . . . . . . . . . . . . . . . -0.1 -0.1 1.6 1.7June 2012.. . . . . . . . . . . . . . . . . . . . . . . . . . . . . . . . . . . . . . . . . . . . . . . . . . . . . . . . . . . . . . . . . . . . . . . . . . . . . . . . . -0.1 -0.1 1.6 1.7July 2012.. . . . . . . . . . . . . . . . . . . . . . . . . . . . . . . . . . . . . . . . . . . . . . . . . . . . . . . . . . . . . . . . . . . . . . . . . . . . . . . . . . . -0.2 -0.2 1.3 1.4August 2012.. . . . . . . . . . . . . . . . . . . . . . . . . . . . . . . . . . . . . . . . . . . . . . . . . . . . . . . . . . . . . . . . . . . . . . . . . . . . . . . 0.4 0.6 1.5 1.7
1 The C-CPI-U is designed to be a closer approximation to a cost-of-living index in that it, in its final form, accounts for any substitution that consumersmake across item categories in response to changes in relative prices. Since the expenditure data required for the calculation of the C-CPI-U areavailable only with a time lag, the C-CPI-U is being issued first in preliminary form using the latest available expenditure data at that time and is subjectto two revisions.
NOTE: Indexes for 2012 are intial estimates. Indexes for 2011 are interim adjustments. Data prior to 2011 are final.
NOTE: Index applies to a month as a whole, not to any specific date.

Table 6. Consumer Price Index for All Urban Consumers (CPI-U): U.S. city average, by expenditure category,August 2012, 1-month analysis table[1982-84=100, unless otherwise noted]
Expenditure category
Relativeimportance
Jul.2012
One Month
Seasonallyadjustedpercentchange
Jul. 2012-Aug. 2012
Seasonallyadjusted
effect on AllItems
Jul. 2012-Aug. 20121
Standarderror,
median pricechange2
Largest (L) or Smallest (S)seasonally adjusted
change since:3
Date Percentchange
All items.. . . . . . . . . . . . . . . . . . . . . . . . . . . . . . . . . . . . . . . . . . . . . . . . . . . . . . . . . . . . . . . . . 100.000 0.6 0.03 L-Jun.2009 0.8Food.. . . . . . . . . . . . . . . . . . . . . . . . . . . . . . . . . . . . . . . . . . . . . . . . . . . . . . . . . . . . . . . . . . . 14.235 0.2 0.029 0.08 L-Jun.2012 0.2
Food at home.. . . . . . . . . . . . . . . . . . . . . . . . . . . . . . . . . . . . . . . . . . . . . . . . . . . . . 8.558 0.1 0.012 0.14 L-Jun.2012 0.1Cereals and bakery products. . . . . . . . . . . . . . . . . . . . . . . . . . . . . . . . . . 1.235 0.0 0.000 0.35 S-Jun.2012 -0.4
Cereals and cereal products. . . . . . . . . . . . . . . . . . . . . . . . . . . . . . . . 0.477 -0.3 -0.002 0.50 L-Jun.2012 -0.1Flour and prepared flour mixes. . . . . . . . . . . . . . . . . . . . . . . . . . 0.054 0.2 0.000 0.88 L-Jun.2012 1.5Breakfast cereal4 . . . . . . . . . . . . . . . . . . . . . . . . . . . . . . . . . . . . . . . . . . 0.292 -0.1 0.000 0.69 L-May 2012 0.6Rice, pasta, cornmeal4 . . . . . . . . . . . . . . . . . . . . . . . . . . . . . . . . . . . 0.131 -0.8 -0.001 0.72 S-Jun.2012 -1.0
Rice4 , 5 , 6 . . . . . . . . . . . . . . . . . . . . . . . . . . . . . . . . . . . . . . . . . . . . . . -0.4 0.81 S-May 2012 -0.8Bakery products. . . . . . . . . . . . . . . . . . . . . . . . . . . . . . . . . . . . . . . . . . . . 0.758 0.0 0.000 0.43 S-Jun.2012 -0.5
Bread5 . . . . . . . . . . . . . . . . . . . . . . . . . . . . . . . . . . . . . . . . . . . . . . . . . . . 0.225 -0.3 -0.001 0.89 S-Jun.2012 -0.7White bread4 , 6 . . . . . . . . . . . . . . . . . . . . . . . . . . . . . . . . . . . . . . -0.8 1.19 S-Jun.2012 -0.9Bread other than white4 , 6 . . . . . . . . . . . . . . . . . . . . . . . . . -2.3 1.30 S-Jan.2012 -2.4
Fresh biscuits, rolls, muffins4 , 5 . . . . . . . . . . . . . . . . . . . . . . 0.112 0.4 0.001 0.61 L-Jun.2012 0.4Cakes, cupcakes, and cookies. . . . . . . . . . . . . . . . . . . . . . . . 0.183 -0.4 -0.001 0.88 S-Jun.2012 -0.6
Cookies4 , 6 . . . . . . . . . . . . . . . . . . . . . . . . . . . . . . . . . . . . . . . . . . . -1.1 0.95 S-May 2011 -1.5Fresh cakes and cupcakes4 , 6 . . . . . . . . . . . . . . . . . . . . 0.3 0.97 S-Jun.2012 0.2
Other bakery products. . . . . . . . . . . . . . . . . . . . . . . . . . . . . . . . . . 0.238 0.8 0.002 0.78 L-Oct.2011 1.1Fresh sweetrolls, coffeecakes, doughnuts4 , 6 . . . 2.7 0.92 L-Mar.2000 2.7Crackers, bread, and cracker products6 . . . . . . . . . . 0.2 1.17 S-Jun.2012 -1.7Frozen and refrigerated bakery products, pies,
tarts, turnovers6 . . . . . . . . . . . . . . . . . . . . . . . . . . . . . . . . . . . 1.6 1.11 L-May 2011 2.0Meats, poultry, fish, and eggs. . . . . . . . . . . . . . . . . . . . . . . . . . . . . . . . . 1.951 0.4 0.008 0.23 L-Mar.2012 0.8
Meats, poultry, and fish.. . . . . . . . . . . . . . . . . . . . . . . . . . . . . . . . . . . . . 1.848 0.1 0.002 0.24 S-May 2012 -0.6Meats. . . . . . . . . . . . . . . . . . . . . . . . . . . . . . . . . . . . . . . . . . . . . . . . . . . . . . . . 1.196 0.3 0.004 0.28 L-Mar.2012 0.5
Beef and veal4 . . . . . . . . . . . . . . . . . . . . . . . . . . . . . . . . . . . . . . . . . . 0.564 -0.4 -0.002 0.41 S-Jun.2011 -0.7Uncooked ground beef4 . . . . . . . . . . . . . . . . . . . . . . . . . . . . 0.221 0.0 0.000 0.60 L-Jun.2012 1.1Uncooked beef roasts4 , 5 . . . . . . . . . . . . . . . . . . . . . . . . . . 0.082 -0.4 0.000 1.10 S-Apr.2012 -0.6Uncooked beef steaks4 , 5 . . . . . . . . . . . . . . . . . . . . . . . . . . 0.209 -1.0 -0.002 0.79 S-Jun.2011 -2.0Uncooked other beef and veal4 , 5 . . . . . . . . . . . . . . . . 0.052 0.4 0.000 0.73 S-Jun.2012 0.0
Pork. . . . . . . . . . . . . . . . . . . . . . . . . . . . . . . . . . . . . . . . . . . . . . . . . . . . . . . 0.371 1.7 0.006 0.48 L-Oct.2010 2.0Bacon, breakfast sausage, and related products5
. . . . . . . . . . . . . . . . . . . . . . . . . . . . . . . . . . . . . . . . . . . . . . . . . . . . . . . . . . . . . . . . . . . . . . . . . . . . 0.139 2.7 0.004 0.84 L-Mar.2011 3.8Bacon and related products6 . . . . . . . . . . . . . . . . . . . . 3.6 1.07 L-Mar.2011 4.5Breakfast sausage and related products4 , 5 , 6
. . . . . . . . . . . . . . . . . . . . . . . . . . . . . . . . . . . . . . . . . . . . . . . . . . . . . . . . . . . . . . . . . . . . . . . . . . . . 0.9 1.23 L-May 2012 2.8Ham.. . . . . . . . . . . . . . . . . . . . . . . . . . . . . . . . . . . . . . . . . . . . . . . . . . . 0.080 2.0 0.002 0.98 L-Mar.2012 2.4
Ham, excluding canned6 . . . . . . . . . . . . . . . . . . . . . . . . . 2.3 1.04 L-Mar.2012 2.5Pork chops. . . . . . . . . . . . . . . . . . . . . . . . . . . . . . . . . . . . . . . . . . . . 0.062 1.1 0.001 1.02 L-Apr.2012 1.8Other pork including roasts and picnics5 . . . . . . . . . 0.090 0.6 0.001 1.09 L-Dec.2011 0.6
Other meats. . . . . . . . . . . . . . . . . . . . . . . . . . . . . . . . . . . . . . . . . . . . . . 0.262 0.1 0.000 0.63 L-May 2012 0.6Frankfurters6 . . . . . . . . . . . . . . . . . . . . . . . . . . . . . . . . . . . . . . . . . 0.4 2.08 S-Jun.2012 -2.7Lunchmeats4 , 5 , 6 . . . . . . . . . . . . . . . . . . . . . . . . . . . . . . . . . . 0.2 0.64 L-Mar.2012 0.2Lamb and organ meats4 , 6 . . . . . . . . . . . . . . . . . . . . . . . . 0.0 1.06 L-Jun.2012 0.3Lamb and mutton4 , 5 , 6 . . . . . . . . . . . . . . . . . . . . . . . . . . . . 1.6 1.19 L-Feb.2012 3.4
Poultry. . . . . . . . . . . . . . . . . . . . . . . . . . . . . . . . . . . . . . . . . . . . . . . . . . . . 0.345 -0.4 -0.002 0.62 S-May 2012 -1.3Chicken5 . . . . . . . . . . . . . . . . . . . . . . . . . . . . . . . . . . . . . . . . . . . . . . 0.268 -0.4 -0.001 0.80 S-May 2012 -1.9
Fresh whole chicken4 , 6 . . . . . . . . . . . . . . . . . . . . . . . . . -2.1 1.91 S-May 2012 -4.8Fresh and frozen chicken parts4 , 6 . . . . . . . . . . . . 0.1 0.85 S-May 2012 -0.8
Other poultry including turkey5 . . . . . . . . . . . . . . . . . . . . . 0.077 -0.4 0.000 0.80 S-Apr.2012 -1.1Fish and seafood4 .. . . . . . . . . . . . . . . . . . . . . . . . . . . . . . . . . . . . . 0.307 0.0 0.000 0.52 S-May 2012 -1.2
Fresh fish and seafood4 , 5 . . . . . . . . . . . . . . . . . . . . . . . . . 0.157 -0.2 0.000 0.75 S-Jun.2012 -0.2Processed fish and seafood5 . . . . . . . . . . . . . . . . . . . . . . 0.150 -0.3 0.000 0.70 S-May 2012 -1.4
See footnotes at end of table.

Table 6. Consumer Price Index for All Urban Consumers (CPI-U): U.S. city average, by expenditure category,August 2012, 1-month analysis table — Continued[1982-84=100, unless otherwise noted]
Expenditure category
Relativeimportance
Jul.2012
One Month
Seasonallyadjustedpercentchange
Jul. 2012-Aug. 2012
Seasonallyadjusted
effect on AllItems
Jul. 2012-Aug. 20121
Standarderror,
median pricechange2
Largest (L) or Smallest (S)seasonally adjusted
change since:3
Date Percentchange
Shelf stable fish and seafood4 , 6 . . . . . . . . . . . . . . . -0.6 1.17 S-May 2012 -1.3Frozen fish and seafood4 , 6 . . . . . . . . . . . . . . . . . . . . . -2.2 1.03 S-Sep.2009 -3.1
Eggs.. . . . . . . . . . . . . . . . . . . . . . . . . . . . . . . . . . . . . . . . . . . . . . . . . . . . . . . . 0.103 5.0 0.006 0.77 L-May 2011 5.4Dairy and related products4 . . . . . . . . . . . . . . . . . . . . . . . . . . . . . . . . . . . 0.886 0.1 0.000 0.31 L-Jan.2012 0.9
Milk4 , 5 . . . . . . . . . . . . . . . . . . . . . . . . . . . . . . . . . . . . . . . . . . . . . . . . . . . . . . . . 0.289 0.2 0.001 0.33 S-Jun.2012 -0.6Fresh whole milk4 , 6 . . . . . . . . . . . . . . . . . . . . . . . . . . . . . . . . . . . . . 1.3 0.44 L-Aug.2011 1.3Fresh milk other than whole4 , 5 , 6 . . . . . . . . . . . . . . . . . . . . . -0.4 0.48 S-Apr.2012 -1.0
Cheese and related products4 . . . . . . . . . . . . . . . . . . . . . . . . . . . . . 0.280 0.9 0.003 0.59 L-Jun.2012 1.0Ice cream and related products. . . . . . . . . . . . . . . . . . . . . . . . . . . . 0.132 -0.9 -0.001 0.83 S-Jun.2012 -1.9Other dairy and related products5 . . . . . . . . . . . . . . . . . . . . . . . . . 0.185 -0.7 -0.001 0.61 L-Jun.2012 0.9
Fruits and vegetables.. . . . . . . . . . . . . . . . . . . . . . . . . . . . . . . . . . . . . . . . . . 1.252 0.5 0.006 0.37 L-Jun.2012 1.3Fresh fruits and vegetables. . . . . . . . . . . . . . . . . . . . . . . . . . . . . . . . . 0.948 0.4 0.004 0.47 L-Jun.2012 1.7
Fresh fruits. . . . . . . . . . . . . . . . . . . . . . . . . . . . . . . . . . . . . . . . . . . . . . . . . . 0.492 1.9 0.009 0.63 L-Apr.2012 1.9Apples. . . . . . . . . . . . . . . . . . . . . . . . . . . . . . . . . . . . . . . . . . . . . . . . . . . . 0.095 3.6 0.003 1.15 L-Jun.2012 4.0Bananas.. . . . . . . . . . . . . . . . . . . . . . . . . . . . . . . . . . . . . . . . . . . . . . . . . 0.081 -0.6 0.000 0.82 S-Feb.2012 -2.1Citrus fruits5 . . . . . . . . . . . . . . . . . . . . . . . . . . . . . . . . . . . . . . . . . . . . . 0.116 1.2 0.001 1.48 L-Apr.2012 2.0
Oranges, including tangerines6 . . . . . . . . . . . . . . . . . . . . 1.7 1.73 L-Mar.2012 2.0Other fresh fruits5 . . . . . . . . . . . . . . . . . . . . . . . . . . . . . . . . . . . . . . 0.199 1.6 0.003 1.07 L-Apr.2012 2.9
Fresh vegetables. . . . . . . . . . . . . . . . . . . . . . . . . . . . . . . . . . . . . . . . . . 0.456 -1.3 -0.006 0.63 S-Mar.2012 -1.6Potatoes.. . . . . . . . . . . . . . . . . . . . . . . . . . . . . . . . . . . . . . . . . . . . . . . . . 0.082 -4.2 -0.003 1.06 S-Apr.2009 -4.9Lettuce.. . . . . . . . . . . . . . . . . . . . . . . . . . . . . . . . . . . . . . . . . . . . . . . . . . . 0.059 0.9 0.001 1.57 S-Apr.2012 -2.6Tomatoes4 .. . . . . . . . . . . . . . . . . . . . . . . . . . . . . . . . . . . . . . . . . . . . . . 0.079 -4.8 -0.004 1.80 S-Feb.2012 -5.7Other fresh vegetables. . . . . . . . . . . . . . . . . . . . . . . . . . . . . . . . . 0.236 -0.2 0.000 0.91 S-Mar.2012 -0.2
Processed fruits and vegetables5 . . . . . . . . . . . . . . . . . . . . . . . 0.305 0.9 0.003 0.47 L-Feb.2012 1.2Canned fruits and vegetables5 . . . . . . . . . . . . . . . . . . . . . . . 0.150 0.8 0.001 0.69 L-Apr.2012 1.5
Canned fruits5 , 6 . . . . . . . . . . . . . . . . . . . . . . . . . . . . . . . . . . . . 1.6 0.81 L-Jan.2011 2.6Canned vegetables5 , 6 . . . . . . . . . . . . . . . . . . . . . . . . . . . . . 0.5 0.98 L-Apr.2012 2.0
Frozen fruits and vegetables5 . . . . . . . . . . . . . . . . . . . . . . . . 0.096 1.0 0.001 0.87 L-Feb.2012 1.1Frozen vegetables6 . . . . . . . . . . . . . . . . . . . . . . . . . . . . . . . . . . 0.4 1.04 L-Jun.2012 1.2
Other processed fruits and vegetables includingdried5 . . . . . . . . . . . . . . . . . . . . . . . . . . . . . . . . . . . . . . . . . . . . . . . . . . 0.058 0.6 0.000 0.79 L-Mar.2012 0.8Dried beans, peas, and lentils4 , 5 , 6 . . . . . . . . . . . . . 0.8 1.19 L-Jun.2012 2.3
Nonalcoholic beverages and beverage materials. . . . . . . . . . . 0.941 -0.2 -0.001 0.42 L-Jun.2012 0.1Juices and nonalcoholic drinks5 . . . . . . . . . . . . . . . . . . . . . . . . . . . 0.703 0.2 0.002 0.50 L-Jun.2012 0.2
Carbonated drinks. . . . . . . . . . . . . . . . . . . . . . . . . . . . . . . . . . . . . . . . . 0.286 0.7 0.002 0.72 L-Mar.2011 1.2Frozen noncarbonated juices and drinks4 , 5 . . . . . . . . . . 0.014 -1.6 0.000 1.09 S-Jun.2009 -1.7Nonfrozen noncarbonated juices and drinks4 , 5 . . . . . . 0.403 -0.4 -0.001 0.65 S-May 2012 -0.4
Beverage materials including coffee and tea5 . . . . . . . . . . . 0.238 -0.4 -0.001 0.59 L-Jun.2012 0.1Coffee. . . . . . . . . . . . . . . . . . . . . . . . . . . . . . . . . . . . . . . . . . . . . . . . . . . . . . . 0.145 0.3 0.000 0.81 L-Nov.2011 1.8
Roasted coffee6 . . . . . . . . . . . . . . . . . . . . . . . . . . . . . . . . . . . . . . . . -0.1 0.77 L-Dec.2011 0.7Instant and freeze dried coffee4 , 6 . . . . . . . . . . . . . . . . . . 0.0 1.18 S-Jun.2012 -1.7
Other beverage materials including tea5 . . . . . . . . . . . . . . . 0.093 -0.6 -0.001 0.77 S-May 2012 -1.6Other food at home.. . . . . . . . . . . . . . . . . . . . . . . . . . . . . . . . . . . . . . . . . . . . 2.293 -0.1 -0.002 0.26 S-Jun.2012 -0.1
Sugar and sweets4 . . . . . . . . . . . . . . . . . . . . . . . . . . . . . . . . . . . . . . . . . . 0.310 -0.7 -0.002 0.59 S-Nov.2011 -1.7Sugar and artificial sweeteners. . . . . . . . . . . . . . . . . . . . . . . . . . 0.060 -0.2 0.000 0.49 S-Mar.2012 -1.0Candy and chewing gum4 , 5 . . . . . . . . . . . . . . . . . . . . . . . . . . . . 0.185 -0.7 -0.001 0.92 S-May 2012 -1.2Other sweets5 . . . . . . . . . . . . . . . . . . . . . . . . . . . . . . . . . . . . . . . . . . . . . 0.064 -1.2 -0.001 0.71 S-Mar.2012 -1.2
Fats and oils. . . . . . . . . . . . . . . . . . . . . . . . . . . . . . . . . . . . . . . . . . . . . . . . . . 0.264 -0.3 -0.001 0.51 L-May 2012 0.1Butter and margarine5 . . . . . . . . . . . . . . . . . . . . . . . . . . . . . . . . . . . . 0.075 -0.1 0.000 0.79 L-May 2012 0.1
Butter6 . . . . . . . . . . . . . . . . . . . . . . . . . . . . . . . . . . . . . . . . . . . . . . . . . . . -0.3 1.21 S-Jun.2012 -1.4Margarine6 . . . . . . . . . . . . . . . . . . . . . . . . . . . . . . . . . . . . . . . . . . . . . . 0.0 1.06 L-Jun.2012 0.8
Salad dressing4 , 5 . . . . . . . . . . . . . . . . . . . . . . . . . . . . . . . . . . . . . . . . 0.066 -0.5 0.000 0.80 S-Jun.2012 -1.6Other fats and oils including peanut butter5 . . . . . . . . . . . 0.123 -0.1 0.000 0.91 – –
See footnotes at end of table.

Table 6. Consumer Price Index for All Urban Consumers (CPI-U): U.S. city average, by expenditure category,August 2012, 1-month analysis table — Continued[1982-84=100, unless otherwise noted]
Expenditure category
Relativeimportance
Jul.2012
One Month
Seasonallyadjustedpercentchange
Jul. 2012-Aug. 2012
Seasonallyadjusted
effect on AllItems
Jul. 2012-Aug. 20121
Standarderror,
median pricechange2
Largest (L) or Smallest (S)seasonally adjusted
change since:3
Date Percentchange
Peanut butter4 , 5 , 6 . . . . . . . . . . . . . . . . . . . . . . . . . . . . . . . . . . . 0.3 1.09 L-Jun.2012 0.8Other foods.. . . . . . . . . . . . . . . . . . . . . . . . . . . . . . . . . . . . . . . . . . . . . . . . 1.719 0.1 0.001 0.31 L-May 2012 0.5
Soups.. . . . . . . . . . . . . . . . . . . . . . . . . . . . . . . . . . . . . . . . . . . . . . . . . . . . 0.102 0.0 0.000 1.05 S-Jun.2012 -1.0Frozen and freeze dried prepared foods4 . . . . . . . . . . . 0.303 -0.8 -0.003 0.76 S-Sep.2010 -2.6Snacks4 . . . . . . . . . . . . . . . . . . . . . . . . . . . . . . . . . . . . . . . . . . . . . . . . . . 0.325 1.2 0.004 0.75 L-May 2012 1.4Spices, seasonings, condiments, sauces. . . . . . . . . . . . 0.288 0.5 0.002 0.75 L-Jun.2012 0.5
Salt and other seasonings and spices5 , 6 . . . . . . . 0.9 0.81 L-Jan.2012 2.8Olives, pickles, relishes4 , 5 , 6 . . . . . . . . . . . . . . . . . . . . . 2.4 1.36 L-Jan.2012 8.9Sauces and gravies5 , 6 . . . . . . . . . . . . . . . . . . . . . . . . . . . . . -0.6 1.40 S-May 2012 -2.0Other condiments4 , 6 . . . . . . . . . . . . . . . . . . . . . . . . . . . . . . . 0.2 0.74 L-Jun.2012 1.5
Baby food4 , 5 . . . . . . . . . . . . . . . . . . . . . . . . . . . . . . . . . . . . . . . . . . . 0.072 -0.3 0.000 0.51 S-May 2011 -0.3Other miscellaneous foods4 , 5 . . . . . . . . . . . . . . . . . . . . . . . 0.629 0.4 0.003 0.57 L-May 2012 0.9
Prepared salads4 , 7 , 6 . . . . . . . . . . . . . . . . . . . . . . . . . . . . . 1.0 0.89 S-Jun.2012 -0.3Food away from home4 . . . . . . . . . . . . . . . . . . . . . . . . . . . . . . . . . . . . . . . . . . 5.677 0.3 0.017 0.06 L-Apr.2012 0.3
Full service meals and snacks4 , 5 . . . . . . . . . . . . . . . . . . . . . . . . . . . 2.693 0.2 0.006 0.07 – –Limited service meals and snacks4 , 5 . . . . . . . . . . . . . . . . . . . . . . 2.290 0.2 0.004 0.10 S-Feb.2012 0.1Food at employee sites and schools5 . . . . . . . . . . . . . . . . . . . . . . . 0.252 0.8 0.002 0.14 L-Aug.2011 2.2
Food at elementary and secondary schools4 , 8 , 6 . . . . . 2.8 0.12 L-Aug.2011 4.1Food from vending machines and mobile vendors4 , 5 . . . . 0.082 0.3 0.000 0.23 L-Jun.2012 0.4Other food away from home4 , 5 . . . . . . . . . . . . . . . . . . . . . . . . . . . . . 0.361 0.1 0.000 0.12 – –
Energy. . . . . . . . . . . . . . . . . . . . . . . . . . . . . . . . . . . . . . . . . . . . . . . . . . . . . . . . . . . . . . . . . 9.849 5.6 0.534 0.11 L-Jun.2009 9.3Energy commodities. . . . . . . . . . . . . . . . . . . . . . . . . . . . . . . . . . . . . . . . . . . . . . . 5.957 8.6 0.506 0.11 L-Jun.2009 19.0
Fuel oil and other fuels4 . . . . . . . . . . . . . . . . . . . . . . . . . . . . . . . . . . . . . . . 0.310 3.0 0.009 0.42 L-Mar.2011 4.6Fuel oil4 . . . . . . . . . . . . . . . . . . . . . . . . . . . . . . . . . . . . . . . . . . . . . . . . . . . . . . . 0.213 4.6 0.010 0.54 L-Mar.2011 6.2Propane, kerosene, and firewood4 , 9 . . . . . . . . . . . . . . . . . . . . . 0.097 -0.4 0.000 0.44 L-Apr.2012 0.8
Motor fuel. . . . . . . . . . . . . . . . . . . . . . . . . . . . . . . . . . . . . . . . . . . . . . . . . . . . . . . . 5.647 8.9 0.496 0.11 L-Jun.2009 20.1Gasoline (all types). . . . . . . . . . . . . . . . . . . . . . . . . . . . . . . . . . . . . . . . . . . 5.468 9.0 0.484 0.12 L-Jun.2009 20.3
Gasoline, unleaded regular6 . . . . . . . . . . . . . . . . . . . . . . . . . . . . . 9.1 0.28 L-Jun.2009 20.8Gasoline, unleaded midgrade10 , 6 . . . . . . . . . . . . . . . . . . . . . 9.0 0.27 L-Jun.2009 19.3Gasoline, unleaded premium6 .. . . . . . . . . . . . . . . . . . . . . . . . . . 8.5 0.27 L-Jun.2009 18.5
Other motor fuels5 . . . . . . . . . . . . . . . . . . . . . . . . . . . . . . . . . . . . . . . . . . . 0.179 6.3 0.011 0.16 L-Mar.2011 9.2Energy services11 . . . . . . . . . . . . . . . . . . . . . . . . . . . . . . . . . . . . . . . . . . . . . . . . . 3.891 0.8 0.028 0.16 L-Sep.2011 0.8
Electricity11 . . . . . . . . . . . . . . . . . . . . . . . . . . . . . . . . . . . . . . . . . . . . . . . . . . . . . . 3.026 0.2 0.005 0.18 L-May 2012 0.3Utility (piped) gas service11 . . . . . . . . . . . . . . . . . . . . . . . . . . . . . . . . . . . 0.865 2.8 0.024 0.18 L-Jan.2010 3.7
All items less food and energy. . . . . . . . . . . . . . . . . . . . . . . . . . . . . . . . . . . . . 75.916 0.1 0.040 0.04 – –Commodities less food and energy commodities. . . . . . . . . . . . . . 19.717 -0.2 -0.038 0.09 S-Sep.2011 -0.2
Household furnishings and supplies12 . . . . . . . . . . . . . . . . . . . . . . . 3.348 -0.5 -0.016 0.15 S-Apr.2010 -0.7Window and floor coverings and other linens4 , 5 . . . . . . . 0.271 -0.9 -0.002 0.62 S-May 2012 -1.1
Floor coverings4 , 5 . . . . . . . . . . . . . . . . . . . . . . . . . . . . . . . . . . . . . . . 0.039 -0.4 0.000 0.55 – –Window coverings4 , 5 . . . . . . . . . . . . . . . . . . . . . . . . . . . . . . . . . . . . 0.076 -0.4 0.000 0.68 S-Mar.2012 -0.9Other linens4 , 5 . . . . . . . . . . . . . . . . . . . . . . . . . . . . . . . . . . . . . . . . . . . 0.156 -1.3 -0.002 0.92 S-May 2012 -2.0
Furniture and bedding4 . . . . . . . . . . . . . . . . . . . . . . . . . . . . . . . . . . . . . 0.723 -0.5 -0.004 0.34 S-Sep.2011 -0.6Bedroom furniture4 . . . . . . . . . . . . . . . . . . . . . . . . . . . . . . . . . . . . . . . . 0.233 0.0 0.000 0.65 S-Jun.2012 -0.4Living room, kitchen, and dining room furniture4 , 5 .. . 0.346 -0.4 -0.001 0.42 L-Jun.2012 0.7Other furniture5 . . . . . . . . . . . . . . . . . . . . . . . . . . . . . . . . . . . . . . . . . . . . 0.136 -0.6 -0.001 0.73 S-Jun.2012 -0.8
Infants’ furniture4 , 8 , 6 . . . . . . . . . . . . . . . . . . . . . . . . . . . . . . . .Appliances5 . . . . . . . . . . . . . . . . . . . . . . . . . . . . . . . . . . . . . . . . . . . . . . . . . . . 0.288 -1.0 -0.003 0.38 S-Nov.2011 -1.0
Major appliances5 . . . . . . . . . . . . . . . . . . . . . . . . . . . . . . . . . . . . . . . . . 0.166 -1.4 -0.002 0.48 S-Nov.2011 -1.5Laundry equipment6 . . . . . . . . . . . . . . . . . . . . . . . . . . . . . . . . . . . -1.3 0.58 S-Nov.2011 -1.4
Other appliances4 , 5 . . . . . . . . . . . . . . . . . . . . . . . . . . . . . . . . . . . . . 0.119 0.0 0.000 0.59 L-Jun.2012 0.0Other household equipment and furnishings4 , 5 . . . . . . . . 0.495 -0.8 -0.004 0.41 S-Mar.2012 -1.4
Clocks, lamps, and decorator items4 . . . . . . . . . . . . . . . . . . . 0.261 -0.6 -0.001 0.51 S-Mar.2012 -1.9
See footnotes at end of table.
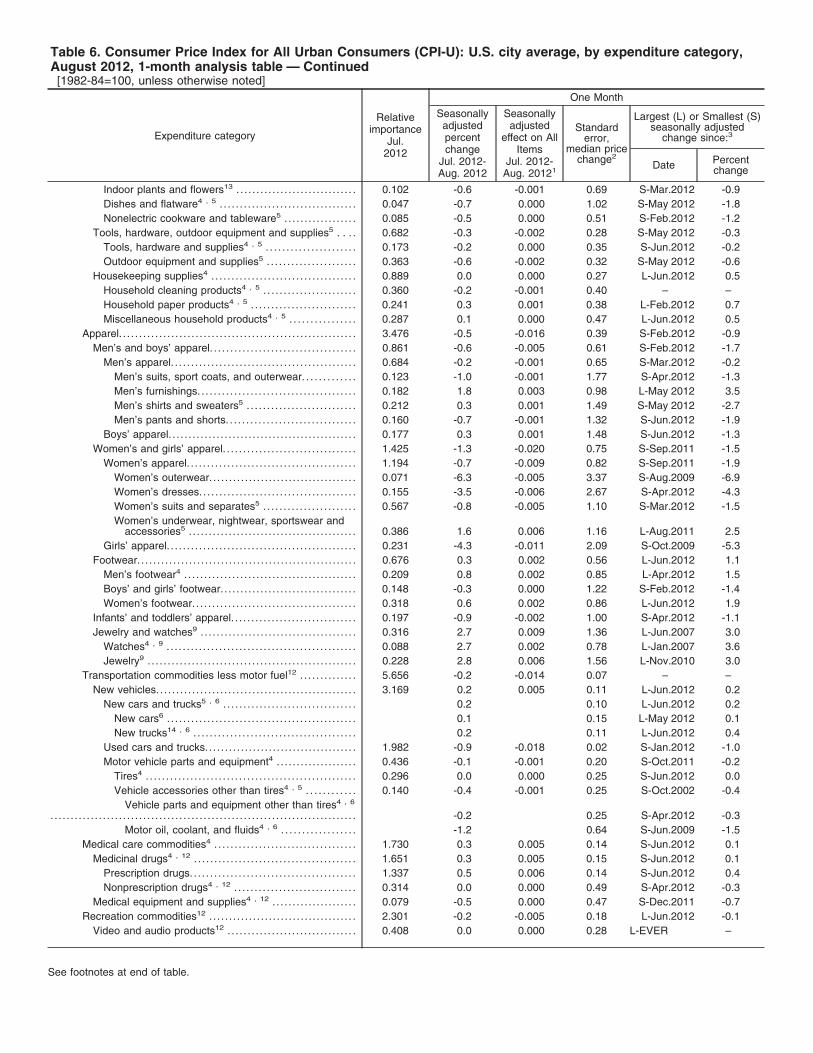
Table 6. Consumer Price Index for All Urban Consumers (CPI-U): U.S. city average, by expenditure category,August 2012, 1-month analysis table — Continued[1982-84=100, unless otherwise noted]
Expenditure category
Relativeimportance
Jul.2012
One Month
Seasonallyadjustedpercentchange
Jul. 2012-Aug. 2012
Seasonallyadjusted
effect on AllItems
Jul. 2012-Aug. 20121
Standarderror,
median pricechange2
Largest (L) or Smallest (S)seasonally adjusted
change since:3
Date Percentchange
Indoor plants and flowers13 . . . . . . . . . . . . . . . . . . . . . . . . . . . . . . 0.102 -0.6 -0.001 0.69 S-Mar.2012 -0.9Dishes and flatware4 , 5 . . . . . . . . . . . . . . . . . . . . . . . . . . . . . . . . . . 0.047 -0.7 0.000 1.02 S-May 2012 -1.8Nonelectric cookware and tableware5 . . . . . . . . . . . . . . . . . . 0.085 -0.5 0.000 0.51 S-Feb.2012 -1.2
Tools, hardware, outdoor equipment and supplies5 . . . . 0.682 -0.3 -0.002 0.28 S-May 2012 -0.3Tools, hardware and supplies4 , 5 . . . . . . . . . . . . . . . . . . . . . . 0.173 -0.2 0.000 0.35 S-Jun.2012 -0.2Outdoor equipment and supplies5 . . . . . . . . . . . . . . . . . . . . . . 0.363 -0.6 -0.002 0.32 S-May 2012 -0.6
Housekeeping supplies4 . . . . . . . . . . . . . . . . . . . . . . . . . . . . . . . . . . . . 0.889 0.0 0.000 0.27 L-Jun.2012 0.5Household cleaning products4 , 5 . . . . . . . . . . . . . . . . . . . . . . . 0.360 -0.2 -0.001 0.40 – –Household paper products4 , 5 . . . . . . . . . . . . . . . . . . . . . . . . . . 0.241 0.3 0.001 0.38 L-Feb.2012 0.7Miscellaneous household products4 , 5 . . . . . . . . . . . . . . . . 0.287 0.1 0.000 0.47 L-Jun.2012 0.5
Apparel. . . . . . . . . . . . . . . . . . . . . . . . . . . . . . . . . . . . . . . . . . . . . . . . . . . . . . . . . . . 3.476 -0.5 -0.016 0.39 S-Feb.2012 -0.9Men’s and boys’ apparel. . . . . . . . . . . . . . . . . . . . . . . . . . . . . . . . . . . . 0.861 -0.6 -0.005 0.61 S-Feb.2012 -1.7
Men’s apparel. . . . . . . . . . . . . . . . . . . . . . . . . . . . . . . . . . . . . . . . . . . . . . 0.684 -0.2 -0.001 0.65 S-Mar.2012 -0.2Men’s suits, sport coats, and outerwear. . . . . . . . . . . . . 0.123 -1.0 -0.001 1.77 S-Apr.2012 -1.3Men’s furnishings. . . . . . . . . . . . . . . . . . . . . . . . . . . . . . . . . . . . . . . 0.182 1.8 0.003 0.98 L-May 2012 3.5Men’s shirts and sweaters5 . . . . . . . . . . . . . . . . . . . . . . . . . . . 0.212 0.3 0.001 1.49 S-May 2012 -2.7Men’s pants and shorts. . . . . . . . . . . . . . . . . . . . . . . . . . . . . . . . 0.160 -0.7 -0.001 1.32 S-Jun.2012 -1.9
Boys’ apparel. . . . . . . . . . . . . . . . . . . . . . . . . . . . . . . . . . . . . . . . . . . . . . . 0.177 0.3 0.001 1.48 S-Jun.2012 -1.3Women’s and girls’ apparel. . . . . . . . . . . . . . . . . . . . . . . . . . . . . . . . . 1.425 -1.3 -0.020 0.75 S-Sep.2011 -1.5
Women’s apparel. . . . . . . . . . . . . . . . . . . . . . . . . . . . . . . . . . . . . . . . . . 1.194 -0.7 -0.009 0.82 S-Sep.2011 -1.9Women’s outerwear. . . . . . . . . . . . . . . . . . . . . . . . . . . . . . . . . . . . . 0.071 -6.3 -0.005 3.37 S-Aug.2009 -6.9Women’s dresses. . . . . . . . . . . . . . . . . . . . . . . . . . . . . . . . . . . . . . . 0.155 -3.5 -0.006 2.67 S-Apr.2012 -4.3Women’s suits and separates5 . . . . . . . . . . . . . . . . . . . . . . . 0.567 -0.8 -0.005 1.10 S-Mar.2012 -1.5Women’s underwear, nightwear, sportswear and
accessories5 . . . . . . . . . . . . . . . . . . . . . . . . . . . . . . . . . . . . . . . . . . 0.386 1.6 0.006 1.16 L-Aug.2011 2.5Girls’ apparel. . . . . . . . . . . . . . . . . . . . . . . . . . . . . . . . . . . . . . . . . . . . . . . 0.231 -4.3 -0.011 2.09 S-Oct.2009 -5.3
Footwear. . . . . . . . . . . . . . . . . . . . . . . . . . . . . . . . . . . . . . . . . . . . . . . . . . . . . . . 0.676 0.3 0.002 0.56 L-Jun.2012 1.1Men’s footwear4 . . . . . . . . . . . . . . . . . . . . . . . . . . . . . . . . . . . . . . . . . . . 0.209 0.8 0.002 0.85 L-Apr.2012 1.5Boys’ and girls’ footwear. . . . . . . . . . . . . . . . . . . . . . . . . . . . . . . . . . 0.148 -0.3 0.000 1.22 S-Feb.2012 -1.4Women’s footwear. . . . . . . . . . . . . . . . . . . . . . . . . . . . . . . . . . . . . . . . . 0.318 0.6 0.002 0.86 L-Jun.2012 1.9
Infants’ and toddlers’ apparel. . . . . . . . . . . . . . . . . . . . . . . . . . . . . . . 0.197 -0.9 -0.002 1.00 S-Apr.2012 -1.1Jewelry and watches9 . . . . . . . . . . . . . . . . . . . . . . . . . . . . . . . . . . . . . . . 0.316 2.7 0.009 1.36 L-Jun.2007 3.0
Watches4 , 9 . . . . . . . . . . . . . . . . . . . . . . . . . . . . . . . . . . . . . . . . . . . . . . . 0.088 2.7 0.002 0.78 L-Jan.2007 3.6Jewelry9 . . . . . . . . . . . . . . . . . . . . . . . . . . . . . . . . . . . . . . . . . . . . . . . . . . . . 0.228 2.8 0.006 1.56 L-Nov.2010 3.0
Transportation commodities less motor fuel12 . . . . . . . . . . . . . . 5.656 -0.2 -0.014 0.07 – –New vehicles. . . . . . . . . . . . . . . . . . . . . . . . . . . . . . . . . . . . . . . . . . . . . . . . . . 3.169 0.2 0.005 0.11 L-Jun.2012 0.2
New cars and trucks5 , 6 . . . . . . . . . . . . . . . . . . . . . . . . . . . . . . . . . 0.2 0.10 L-Jun.2012 0.2New cars6 . . . . . . . . . . . . . . . . . . . . . . . . . . . . . . . . . . . . . . . . . . . . . . . 0.1 0.15 L-May 2012 0.1New trucks14 , 6 . . . . . . . . . . . . . . . . . . . . . . . . . . . . . . . . . . . . . . . . 0.2 0.11 L-Jun.2012 0.4
Used cars and trucks.. . . . . . . . . . . . . . . . . . . . . . . . . . . . . . . . . . . . . 1.982 -0.9 -0.018 0.02 S-Jan.2012 -1.0Motor vehicle parts and equipment4 . . . . . . . . . . . . . . . . . . . . 0.436 -0.1 -0.001 0.20 S-Oct.2011 -0.2
Tires4 . . . . . . . . . . . . . . . . . . . . . . . . . . . . . . . . . . . . . . . . . . . . . . . . . . . . 0.296 0.0 0.000 0.25 S-Jun.2012 0.0Vehicle accessories other than tires4 , 5 . . . . . . . . . . . . 0.140 -0.4 -0.001 0.25 S-Oct.2002 -0.4
Vehicle parts and equipment other than tires4 , 6
. . . . . . . . . . . . . . . . . . . . . . . . . . . . . . . . . . . . . . . . . . . . . . . . . . . . . . . . . . . . . . . . . . . . . . . . . . . . -0.2 0.25 S-Apr.2012 -0.3Motor oil, coolant, and fluids4 , 6 . . . . . . . . . . . . . . . . . . -1.2 0.64 S-Jun.2009 -1.5
Medical care commodities4 . . . . . . . . . . . . . . . . . . . . . . . . . . . . . . . . . . . 1.730 0.3 0.005 0.14 S-Jun.2012 0.1Medicinal drugs4 , 12 . . . . . . . . . . . . . . . . . . . . . . . . . . . . . . . . . . . . . . . . 1.651 0.3 0.005 0.15 S-Jun.2012 0.1
Prescription drugs. . . . . . . . . . . . . . . . . . . . . . . . . . . . . . . . . . . . . . . . . 1.337 0.5 0.006 0.14 S-Jun.2012 0.4Nonprescription drugs4 , 12 . . . . . . . . . . . . . . . . . . . . . . . . . . . . . . 0.314 0.0 0.000 0.49 S-Apr.2012 -0.3
Medical equipment and supplies4 , 12 . . . . . . . . . . . . . . . . . . . . . 0.079 -0.5 0.000 0.47 S-Dec.2011 -0.7Recreation commodities12 . . . . . . . . . . . . . . . . . . . . . . . . . . . . . . . . . . . . . 2.301 -0.2 -0.005 0.18 L-Jun.2012 -0.1
Video and audio products12 . . . . . . . . . . . . . . . . . . . . . . . . . . . . . . . . 0.408 0.0 0.000 0.28 L-EVER –
See footnotes at end of table.

Table 6. Consumer Price Index for All Urban Consumers (CPI-U): U.S. city average, by expenditure category,August 2012, 1-month analysis table — Continued[1982-84=100, unless otherwise noted]
Expenditure category
Relativeimportance
Jul.2012
One Month
Seasonallyadjustedpercentchange
Jul. 2012-Aug. 2012
Seasonallyadjusted
effect on AllItems
Jul. 2012-Aug. 20121
Standarderror,
median pricechange2
Largest (L) or Smallest (S)seasonally adjusted
change since:3
Date Percentchange
Televisions.. . . . . . . . . . . . . . . . . . . . . . . . . . . . . . . . . . . . . . . . . . . . . . . . . 0.155 0.1 0.000 0.64 L-May 2012 0.2Other video equipment4 , 5 . . . . . . . . . . . . . . . . . . . . . . . . . . . . . . 0.026 -0.3 0.000 0.61 S-Jun.2012 -1.8Audio equipment4 . . . . . . . . . . . . . . . . . . . . . . . . . . . . . . . . . . . . . . . . . 0.071 0.0 0.000 0.45 S-May 2012 -2.0Audio discs, tapes and other media4 , 5 . . . . . . . . . . . . . . . 0.043 -0.3 0.000 0.47 L-May 2012 -0.2
Pets and pet products4 . . . . . . . . . . . . . . . . . . . . . . . . . . . . . . . . . . . . . 0.688 0.0 0.000 0.39 L-Jun.2012 0.5Pet food4 , 5 , 6 . . . . . . . . . . . . . . . . . . . . . . . . . . . . . . . . . . . . . . . . . . . . 0.0 0.41 L-Jun.2012 0.8Purchase of pets, pet supplies, accessories4 , 5 , 6 .. . -0.1 0.76 L-Jun.2012 0.2
Sporting goods4 . . . . . . . . . . . . . . . . . . . . . . . . . . . . . . . . . . . . . . . . . . . . . . 0.462 -0.2 -0.001 0.31 S-May 2012 -0.3Sports vehicles including bicycles4 . . . . . . . . . . . . . . . . . . . . . 0.243 -0.4 -0.001 0.33 S-Apr.2012 -0.6Sports equipment4 . . . . . . . . . . . . . . . . . . . . . . . . . . . . . . . . . . . . . . . . 0.209 0.0 0.000 0.53 L-Apr.2012 1.8
Photographic equipment and supplies. . . . . . . . . . . . . . . . . . . . . 0.054 -0.3 0.000 0.62 S-Jun.2012 -0.3Film and photographic supplies4 , 5 , 6 . . . . . . . . . . . . . . . . .Photographic equipment5 , 6 . . . . . . . . . . . . . . . . . . . . . . . . . . . . . -0.6 0.82 S-May 2012 -1.9
Recreational reading materials4 . . . . . . . . . . . . . . . . . . . . . . . . . . . 0.224 -0.2 -0.001 0.34 S-Feb.2012 -0.5Newspapers and magazines4 , 5 . . . . . . . . . . . . . . . . . . . . . . . . 0.123 -0.3 0.000 0.48 S-Feb.2012 -0.7Recreational books4 , 5 . . . . . . . . . . . . . . . . . . . . . . . . . . . . . . . . . . . 0.098 -0.2 0.000 0.47 S-Jun.2012 -1.0
Other recreational goods5 . . . . . . . . . . . . . . . . . . . . . . . . . . . . . . . . . . 0.465 -0.7 -0.003 0.44 S-Apr.2012 -1.0Toys4 . . . . . . . . . . . . . . . . . . . . . . . . . . . . . . . . . . . . . . . . . . . . . . . . . . . . . . . 0.344 -1.2 -0.004 0.53 S-Apr.2012 -1.5
Toys, games, hobbies and playground equipment4, 5 , 6 . . . . . . . . . . . . . . . . . . . . . . . . . . . . . . . . . . . . . . . . . . . . . . . . . . . -1.1 0.51 S-Apr.2012 -1.1
Sewing machines, fabric and supplies5 . . . . . . . . . . . . . . . . 0.062 1.4 0.001 0.91 L-Oct.2011 1.8Music instruments and accessories5 . . . . . . . . . . . . . . . . . . . 0.039 0.4 0.000 0.42 L-Jun.2012 0.5
Education and communication commodities12 . . . . . . . . . . . . . 0.596 -0.4 -0.002 0.34 – –Educational books and supplies. . . . . . . . . . . . . . . . . . . . . . . . . . . . 0.204 1.3 0.003 0.29 L-Aug.2008 2.4
College textbooks4 , 15 , 6 . . . . . . . . . . . . . . . . . . . . . . . . . . . . . . . . 1.4 0.24 S-Jun.2012 0.0Information technology commodities12 . . . . . . . . . . . . . . . . . . . . 0.391 -1.2 -0.005 0.43 S-Apr.2012 -1.3
Personal computers and peripheral equipment7 . . . . . . 0.260 -1.3 -0.003 0.51 S-Apr.2012 -1.6Computer software and accessories4 , 5 . . . . . . . . . . . . . . . 0.047 -2.3 -0.001 0.75 S-Dec.2010 -2.7Telephone hardware, calculators, and other
consumer information items4 , 5 . . . . . . . . . . . . . . . . . . . . . . 0.085 -0.5 0.000 0.77 L-May 2012 -0.2Alcoholic beverages. . . . . . . . . . . . . . . . . . . . . . . . . . . . . . . . . . . . . . . . . . . . 0.949 -0.2 -0.002 0.13 S-Mar.2012 -0.2
Alcoholic beverages at home.. . . . . . . . . . . . . . . . . . . . . . . . . . . . . . 0.571 -0.4 -0.002 0.21 S-Jan.2010 -0.4Beer, ale, and other malt beverages at home. . . . . . . . . 0.269 0.4 0.001 0.27 L-May 2012 0.5Distilled spirits at home4 . . . . . . . . . . . . . . . . . . . . . . . . . . . . . . . . . 0.072 -0.1 0.000 0.33 L-Jun.2012 0.7
Whiskey at home6 .. . . . . . . . . . . . . . . . . . . . . . . . . . . . . . . . . . . . . -0.4 0.49 L-Jun.2012 1.4Distilled spirits, excluding whiskey, at home4 , 6 . . . 0.6 0.59 L-Jan.2012 1.2
Wine at home.. . . . . . . . . . . . . . . . . . . . . . . . . . . . . . . . . . . . . . . . . . . . . 0.230 -1.4 -0.003 0.37 S-EVER –Alcoholic beverages away from home4 . . . . . . . . . . . . . . . . . . . 0.378 0.0 0.000 0.16 L-Jun.2012 0.6
Beer, ale, and other malt beverages away fromhome4 , 5 , 6 . . . . . . . . . . . . . . . . . . . . . . . . . . . . . . . . . . . . . . . . . . . . . 0.4 0.13 L-Jun.2012 0.4
Wine away from home4 , 5 , 6 . . . . . . . . . . . . . . . . . . . . . . . . . . . -0.8 0.20 S-Dec.2002 -0.8Distilled spirits away from home4 , 5 , 6 . . . . . . . . . . . . . . . . 0.3 0.20 L-Jun.2012 0.5
Other goods12 . . . . . . . . . . . . . . . . . . . . . . . . . . . . . . . . . . . . . . . . . . . . . . . . . . 1.660 0.3 0.005 0.19 S-May 2012 -0.5Tobacco and smoking products4 . . . . . . . . . . . . . . . . . . . . . . . . . . 0.803 -0.1 -0.001 0.16 S-May 2012 -0.2
Cigarettes4 , 5 . . . . . . . . . . . . . . . . . . . . . . . . . . . . . . . . . . . . . . . . . . . . . 0.743 -0.1 -0.001 0.17 S-May 2012 -0.2Tobacco products other than cigarettes4 , 5 . . . . . . . . . . . 0.054 0.0 0.000 0.46 S-Jun.2012 -0.2
Personal care products4 . . . . . . . . . . . . . . . . . . . . . . . . . . . . . . . . . . . . 0.652 0.4 0.003 0.37 L-Mar.2012 1.2Hair, dental, shaving, and miscellaneous personal
care products4 , 5 . . . . . . . . . . . . . . . . . . . . . . . . . . . . . . . . . . . . . . . 0.342 -0.1 0.000 0.54 S-May 2012 -1.1Cosmetics, perfume, bath, nail preparations and
implements4 . . . . . . . . . . . . . . . . . . . . . . . . . . . . . . . . . . . . . . . . . . . . . 0.304 1.0 0.003 0.56 L-Mar.2012 1.0Miscellaneous personal goods5 . . . . . . . . . . . . . . . . . . . . . . . . . . . . 0.205 1.5 0.003 0.44 L-Oct.2008 1.5
Stationery, stationery supplies, gift wrap6 . . . . . . . . . . . . . 1.7 0.46 L-Oct.1993 3.0Infants’ equipment4 , 8 , 6 . . . . . . . . . . . . . . . . . . . . . . . . . . . . . . . . -0.4 0.51 L-Jun.2012 -0.4
See footnotes at end of table.

Table 6. Consumer Price Index for All Urban Consumers (CPI-U): U.S. city average, by expenditure category,August 2012, 1-month analysis table — Continued[1982-84=100, unless otherwise noted]
Expenditure category
Relativeimportance
Jul.2012
One Month
Seasonallyadjustedpercentchange
Jul. 2012-Aug. 2012
Seasonallyadjusted
effect on AllItems
Jul. 2012-Aug. 20121
Standarderror,
median pricechange2
Largest (L) or Smallest (S)seasonally adjusted
change since:3
Date Percentchange
Services less energy services. . . . . . . . . . . . . . . . . . . . . . . . . . . . . . . . . . . 56.199 0.1 0.077 0.03 – –Shelter. . . . . . . . . . . . . . . . . . . . . . . . . . . . . . . . . . . . . . . . . . . . . . . . . . . . . . . . . . . . 31.519 0.2 0.069 0.05 L-May 2012 0.2
Rent of shelter16 . . . . . . . . . . . . . . . . . . . . . . . . . . . . . . . . . . . . . . . . . . . . . 31.170 0.2 0.068 0.05 L-May 2012 0.2Rent of primary residence11 . . . . . . . . . . . . . . . . . . . . . . . . . . . . . 6.460 0.2 0.012 0.07 S-Jun.2012 0.1Lodging away from home5 .. . . . . . . . . . . . . . . . . . . . . . . . . . . . . . 0.863 -0.6 -0.005 0.86 L-Jun.2012 0.9
Housing at school, excluding board11 , 16 . . . . . . . . . . . 0.154 0.2 0.000 0.05 S-Jan.2012 0.2Other lodging away from home including hotels
and motels. . . . . . . . . . . . . . . . . . . . . . . . . . . . . . . . . . . . . . . . . . . . . 0.709 -0.9 -0.006 1.07 L-Jun.2012 1.0Owners’ equivalent rent of residences11 , 16 . . . . . . . . . . 23.846 0.3 0.062 0.04 L-Nov.2008 0.3
Owners’ equivalent rent of primary residence11 , 16
. . . . . . . . . . . . . . . . . . . . . . . . . . . . . . . . . . . . . . . . . . . . . . . . . . . . . . . . . . . . . . . . . . . . . . . . . . . . 22.438 0.3 0.058 0.04 L-Nov.2008 0.3Tenants’ and household insurance4 , 5 . . . . . . . . . . . . . . . . 0.349 0.1 0.000 0.21 S-Jun.2012 0.1
Water and sewer and trash collection services5 . . . . . . . . 1.182 0.8 0.009 0.13 L-Apr.2012 0.8Water and sewerage maintenance11 . . . . . . . . . . . . . . . . . . . 0.891 1.0 0.009 0.17 L-Apr.2012 1.1Garbage and trash collection4 , 14 . . . . . . . . . . . . . . . . . . . . . . 0.291 0.1 0.000 0.15 S-May 2012 0.0
Household operations4 , 5 . . . . . . . . . . . . . . . . . . . . . . . . . . . . . . . . . . 0.729 0.1 0.001 0.10 L-Jun.2012 0.4Domestic services4 , 5 . . . . . . . . . . . . . . . . . . . . . . . . . . . . . . . . . . . . 0.250 0.1 0.000 0.07 L-Jun.2012 0.7Gardening and lawncare services4 , 5 . . . . . . . . . . . . . . . . . . 0.237 0.1 0.000 0.11 L-Apr.2012 0.5Moving, storage, freight expense4 , 5 . . . . . . . . . . . . . . . . . . 0.091 -0.2 0.000 0.43 – –Repair of household items4 , 5 . . . . . . . . . . . . . . . . . . . . . . . . . . 0.078 0.4 0.000 0.14 – –
Medical care services. . . . . . . . . . . . . . . . . . . . . . . . . . . . . . . . . . . . . . . . 5.416 0.2 0.008 0.06 S-Feb.2012 0.0Professional services.. . . . . . . . . . . . . . . . . . . . . . . . . . . . . . . . . . . . . 3.003 0.4 0.011 0.08 L-Jun.2012 0.4
Physicians’ services11 . . . . . . . . . . . . . . . . . . . . . . . . . . . . . . . . . 1.615 0.3 0.005 0.12 S-May 2012 0.2Dental services11 . . . . . . . . . . . . . . . . . . . . . . . . . . . . . . . . . . . . . . . 0.760 0.5 0.004 0.08 L-Apr.2010 0.7Eyeglasses and eye care9 . . . . . . . . . . . . . . . . . . . . . . . . . . . . 0.251 0.1 0.000 0.23 L-May 2012 1.6Services by other medical professionals4 , 11 , 9 . . . 0.376 0.3 0.001 0.12 L-Feb.2012 0.3
Hospital and related services. . . . . . . . . . . . . . . . . . . . . . . . . . . . 1.762 -0.4 -0.006 0.11 S-EVER –Hospital services11 , 17 . . . . . . . . . . . . . . . . . . . . . . . . . . . . . . . . 1.540 -0.4 -0.007 0.12 S-Jul.2010 -0.4
Inpatient hospital services11 , 17 , 6 . . . . . . . . . . . . . . . . -0.7 0.18 S-EVER –Outpatient hospital services11 , 9 , 6 . . . . . . . . . . . . . . . -0.4 0.22 S-Jul.2010 -0.5
Nursing homes and adult day services11 , 17 . . . . . . . 0.137 0.2 0.000 0.12 S-Jun.2012 0.2Care of invalids and elderly at home4 , 8 . . . . . . . . . . . . 0.086 0.1 0.000 0.15 L-Jun.2012 0.2
Health insurance4 , 8 . . . . . . . . . . . . . . . . . . . . . . . . . . . . . . . . . . . . . 0.651 0.5 0.003 0.07 S-Aug.2011 0.3Transportation services. . . . . . . . . . . . . . . . . . . . . . . . . . . . . . . . . . . . . . 5.773 0.0 0.001 0.11 L-May 2012 0.3
Leased cars and trucks15 . . . . . . . . . . . . . . . . . . . . . . . . . . . . . . . . 0.384 -0.7 -0.003 0.44 L-Jun.2012 0.0Car and truck rental5 . . . . . . . . . . . . . . . . . . . . . . . . . . . . . . . . . . . 0.075 -2.2 -0.002 1.34 S-May 2012 -2.4
Motor vehicle maintenance and repair4 . . . . . . . . . . . . . . . . 1.146 0.1 0.001 0.12 L-Jun.2012 0.1Motor vehicle body work4 . . . . . . . . . . . . . . . . . . . . . . . . . . . . . 0.057 0.0 0.000 0.14 S-Dec.2011 0.0Motor vehicle maintenance and servicing4 . . . . . . . . . 0.457 0.1 0.000 0.15 L-May 2012 0.2Motor vehicle repair4 , 5 . . . . . . . . . . . . . . . . . . . . . . . . . . . . . . . 0.596 0.1 0.001 0.19 L-Jun.2012 0.1
Motor vehicle insurance.. . . . . . . . . . . . . . . . . . . . . . . . . . . . . . . . . . 2.417 0.6 0.015 0.16 L-Oct.2010 0.6Motor vehicle fees4 , 5 . . . . . . . . . . . . . . . . . . . . . . . . . . . . . . . . . . . . 0.562 0.1 0.001 0.12 S-Jun.2012 0.1
State motor vehicle registration and license fees4 ,
11 , 5 . . . . . . . . . . . . . . . . . . . . . . . . . . . . . . . . . . . . . . . . . . . . . . . . . . . 0.326 0.0 0.000 0.12 – –Parking and other fees4 , 5 . . . . . . . . . . . . . . . . . . . . . . . . . . . . 0.214 0.3 0.001 0.16 S-Jun.2012 0.2
Parking fees and tolls4 , 5 , 6 . . . . . . . . . . . . . . . . . . . . . . . 0.8 0.13 S-Jun.2012 0.1Automobile service clubs4 , 5 , 6 . . . . . . . . . . . . . . . . . . . -0.2 0.26 S-Dec.2011 -0.6
Public transportation.. . . . . . . . . . . . . . . . . . . . . . . . . . . . . . . . . . . . . . 1.190 -0.9 -0.011 0.29 L-May 2012 0.8Airline fare. . . . . . . . . . . . . . . . . . . . . . . . . . . . . . . . . . . . . . . . . . . . . . . 0.773 -1.3 -0.010 0.40 L-May 2012 1.0Other intercity transportation. . . . . . . . . . . . . . . . . . . . . . . . . . 0.153 -1.3 -0.002 0.66 L-Jun.2012 0.4
Intercity bus fare4 , 7 , 6 . . . . . . . . . . . . . . . . . . . . . . . . . . . . . -0.4 0.52 S-May 2012 -0.8Intercity train fare4 , 7 , 6 . . . . . . . . . . . . . . . . . . . . . . . . . . . . -1.6 1.24 S-Jan.2012 -5.9Ship fare4 , 5 , 6 . . . . . . . . . . . . . . . . . . . . . . . . . . . . . . . . . . . . . . -2.8 0.82 S-Jan.2009 -3.2
See footnotes at end of table.

Table 6. Consumer Price Index for All Urban Consumers (CPI-U): U.S. city average, by expenditure category,August 2012, 1-month analysis table — Continued[1982-84=100, unless otherwise noted]
Expenditure category
Relativeimportance
Jul.2012
One Month
Seasonallyadjustedpercentchange
Jul. 2012-Aug. 2012
Seasonallyadjusted
effect on AllItems
Jul. 2012-Aug. 20121
Standarderror,
median pricechange2
Largest (L) or Smallest (S)seasonally adjusted
change since:3
Date Percentchange
Intracity transportation4 . . . . . . . . . . . . . . . . . . . . . . . . . . . . . . . . 0.262 0.1 0.000 0.07 S-Jun.2012 0.0Intracity mass transit4 , 12 , 6 . . . . . . . . . . . . . . . . . . . . . . . 0.2 0.09 S-Jun.2012 0.1
Recreation services12 . . . . . . . . . . . . . . . . . . . . . . . . . . . . . . . . . . . . . . . 3.728 0.2 0.008 0.19 L-Jun.2012 0.6Video and audio services12 . . . . . . . . . . . . . . . . . . . . . . . . . . . . . . 1.514 0.4 0.007 0.23 L-May 2012 0.4
Cable and satellite television and radio service14 .. . 1.403 0.5 0.007 0.23 L-May 2012 0.5Video discs and other media, including rental of
video and audio4 , 5 . . . . . . . . . . . . . . . . . . . . . . . . . . . . . . . . . 0.111 -0.6 -0.001 0.84 L-Jun.2012 -0.4Video discs and other media4 , 5 , 6 . . . . . . . . . . . . . . . -0.9 1.22 L-May 2012 -0.1Rental of video or audio discs and other media4 ,
5 , 6 . . . . . . . . . . . . . . . . . . . . . . . . . . . . . . . . . . . . . . . . . . . . . . . . . . -0.5 0.75 L-Jun.2012 -0.2Pet services including veterinary5 . . . . . . . . . . . . . . . . . . . . . . 0.410 0.0 0.000 0.19 S-Feb.2012 -0.3
Pet services4 , 5 , 6 . . . . . . . . . . . . . . . . . . . . . . . . . . . . . . . . . . . . . 0.0 0.22 S-May 2012 0.0Veterinarian services5 , 6 . . . . . . . . . . . . . . . . . . . . . . . . . . . . . . -0.1 0.19 S-Feb.2012 -0.1
Photographers and film processing4 , 5 . . . . . . . . . . . . . . . . 0.058 -0.2 0.000 0.36 S-Feb.2012 -0.2Photographer fees4 , 5 , 6 . . . . . . . . . . . . . . . . . . . . . . . . . . . . . 0.1 0.36 L-Jun.2012 0.3Film processing4 , 5 , 6 . . . . . . . . . . . . . . . . . . . . . . . . . . . . . . . . . -0.3 0.44 S-Jan.2012 -0.3
Other recreation services5 . . . . . . . . . . . . . . . . . . . . . . . . . . . . . . . 1.745 0.1 0.002 0.35 L-Jun.2012 1.1Club dues and fees for participant sports and
group exercises5 . . . . . . . . . . . . . . . . . . . . . . . . . . . . . . . . . . . . . 0.566 0.3 0.002 0.71 L-Jun.2012 0.3Admissions4 . . . . . . . . . . . . . . . . . . . . . . . . . . . . . . . . . . . . . . . . . . . . . 0.644 -0.6 -0.004 0.50 S-Feb.2012 -0.9
Admission to movies, theaters, and concerts4 , 5
, 6 . . . . . . . . . . . . . . . . . . . . . . . . . . . . . . . . . . . . . . . . . . . . . . . . . . . . -0.7 0.42 S-Feb.2012 -1.0Admission to sporting events4 , 5 , 6 . . . . . . . . . . . . . . 0.1 0.52 L-Jun.2012 1.4
Fees for lessons or instructions4 , 9 . . . . . . . . . . . . . . . . . 0.228 1.3 0.003 0.23 L-Jun.2007 2.1Education and communication services12 . . . . . . . . . . . . . . . . 6.141 -0.4 -0.023 0.07 S-EVER –
Tuition, other school fees, and childcare. . . . . . . . . . . . . . . 2.999 -0.2 -0.007 0.12 S-Aug.2000 -0.2College tuition and fees. . . . . . . . . . . . . . . . . . . . . . . . . . . . . . . . 1.684 -0.5 -0.008 0.21 S-Sep.1987 -0.6Elementary and high school tuition and fees. . . . . . . . 0.381 -0.3 -0.001 0.03 S-Aug.2011 -0.6Child care and nursery school13 . . . . . . . . . . . . . . . . . . . . . 0.772 0.0 0.000 0.11 S-Jun.2012 0.0Technical and business school tuition and fees5 .. . 0.059 -0.3 0.000 0.18 L-Jun.2012 0.1
Postage and delivery services5 . . . . . . . . . . . . . . . . . . . . . . . . . 0.149 0.2 0.000 0.01 – –Postage4 .. . . . . . . . . . . . . . . . . . . . . . . . . . . . . . . . . . . . . . . . . . . . . . . . 0.138 0.3 0.000 0.00 – –Delivery services4 , 5 . . . . . . . . . . . . . . . . . . . . . . . . . . . . . . . . . . . 0.010 -1.2 0.000 0.12 L-Jun.2012 0.7
Telephone services4 , 5 . . . . . . . . . . . . . . . . . . . . . . . . . . . . . . . . . . 2.397 -0.3 -0.008 0.05 L-Jun.2012 0.1Wireless telephone services4 , 5 . . . . . . . . . . . . . . . . . . . . . 1.453 -0.7 -0.011 0.06 – –Land-line telephone services4 , 12 . . . . . . . . . . . . . . . . . . . . 0.944 0.3 0.003 0.09 L-Jun.2012 0.3
Internet services and electronic informationproviders4 , 5 . . . . . . . . . . . . . . . . . . . . . . . . . . . . . . . . . . . . . . . . . . . . 0.581 -1.2 -0.007 0.29 S-Jun.2007 -1.2
Other personal services12 . . . . . . . . . . . . . . . . . . . . . . . . . . . . . . . . . . 1.712 0.3 0.004 0.10 L-Jun.2012 0.3Personal care services4 . . . . . . . . . . . . . . . . . . . . . . . . . . . . . . . . . . 0.629 0.3 0.002 0.11 L-Feb.2012 0.4
Haircuts and other personal care services4 , 5 . . . . . 0.629 0.3 0.002 0.11 L-Feb.2012 0.4Miscellaneous personal services. . . . . . . . . . . . . . . . . . . . . . . . 1.083 0.2 0.002 0.13 S-Apr.2012 0.2
Legal services9 . . . . . . . . . . . . . . . . . . . . . . . . . . . . . . . . . . . . . . . . . 0.295 0.3 0.001 0.12 L-Jun.2012 0.4Funeral expenses9 . . . . . . . . . . . . . . . . . . . . . . . . . . . . . . . . . . . . . 0.158 0.0 0.000 0.09 S-May 2012 0.0Laundry and dry cleaning services5 . . . . . . . . . . . . . . . . . 0.239 0.5 0.001 0.09 L-Aug.2009 0.6Apparel services other than laundry and dry
cleaning4 , 5 . . . . . . . . . . . . . . . . . . . . . . . . . . . . . . . . . . . . . . . . . . 0.030 0.4 0.000 0.19 L-Dec.2011 0.7Financial services4 , 9 . . . . . . . . . . . . . . . . . . . . . . . . . . . . . . . . . . 0.218 0.0 0.000 0.62 S-Feb.2012 -0.9
Checking account and other bank services4 , 5 ,
6 . . . . . . . . . . . . . . . . . . . . . . . . . . . . . . . . . . . . . . . . . . . . . . . . . . . . . 1.2 0.51 L-Feb.2012 2.0Tax return preparation and other accounting
fees5 , 6 . . . . . . . . . . . . . . . . . . . . . . . . . . . . . . . . . . . . . . . . . . . . . -0.1 0.73 S-Jan.2012 -1.3
Special aggregate indexes
All items less food.. . . . . . . . . . . . . . . . . . . . . . . . . . . . . . . . . . . . . . . . . . . . . . . . . . . 85.765 0.7 0.573 0.03 L-Jun.2009 1.0
See footnotes at end of table.

Table 6. Consumer Price Index for All Urban Consumers (CPI-U): U.S. city average, by expenditure category,August 2012, 1-month analysis table — Continued[1982-84=100, unless otherwise noted]
Expenditure category
Relativeimportance
Jul.2012
One Month
Seasonallyadjustedpercentchange
Jul. 2012-Aug. 2012
Seasonallyadjusted
effect on AllItems
Jul. 2012-Aug. 20121
Standarderror,
median pricechange2
Largest (L) or Smallest (S)seasonally adjusted
change since:3
Date Percentchange
All items less shelter. . . . . . . . . . . . . . . . . . . . . . . . . . . . . . . . . . . . . . . . . . . . . . . . . 68.481 0.8 0.534 0.04 L-Jun.2009 1.3All items less food and shelter. . . . . . . . . . . . . . . . . . . . . . . . . . . . . . . . . . . . . . 54.246 0.9 0.505 0.05 L-Jun.2009 1.6All items less food, shelter, and energy. . . . . . . . . . . . . . . . . . . . . . . . . . . 44.397 -0.1 -0.029 0.05 S-Oct.2008 -0.1All items less food, shelter, energy, and used cars and
trucks.. . . . . . . . . . . . . . . . . . . . . . . . . . . . . . . . . . . . . . . . . . . . . . . . . . . . . . . . . . . . . . . 42.415 0.0 -0.011 0.05 S-Dec.2010 0.0All items less medical care. . . . . . . . . . . . . . . . . . . . . . . . . . . . . . . . . . . . . . . . . . 92.854 0.6 0.589 0.03 L-Mar.2011 0.6All items less energy.. . . . . . . . . . . . . . . . . . . . . . . . . . . . . . . . . . . . . . . . . . . . . . . . 90.151 0.1 0.069 0.03 – –Commodities. . . . . . . . . . . . . . . . . . . . . . . . . . . . . . . . . . . . . . . . . . . . . . . . . . . . . . . . . . 39.910 1.2 0.491 0.06 L-Jun.2009 2.0
Commodities less food, energy, and used cars and trucks.. . 17.734 -0.1 -0.019 0.09 S-Sep.2011 -0.1Commodities less food.. . . . . . . . . . . . . . . . . . . . . . . . . . . . . . . . . . . . . . . . . . . 25.674 1.8 0.461 0.07 L-Jun.2009 3.1Commodities less food and beverages. . . . . . . . . . . . . . . . . . . . . . . . . 24.725 1.9 0.463 0.07 L-Jun.2009 3.3
Services. . . . . . . . . . . . . . . . . . . . . . . . . . . . . . . . . . . . . . . . . . . . . . . . . . . . . . . . . . . . . . . 60.090 0.2 0.106 0.04 L-Jun.2012 0.2Services less rent of shelter16 . . . . . . . . . . . . . . . . . . . . . . . . . . . . . . . . . . . 28.921 0.1 0.041 0.05 L-Jun.2012 0.2Services less medical care services. . . . . . . . . . . . . . . . . . . . . . . . . . . . 54.675 0.2 0.115 0.04 L-May 2012 0.2
Durables. . . . . . . . . . . . . . . . . . . . . . . . . . . . . . . . . . . . . . . . . . . . . . . . . . . . . . . . . . . . . . . 8.950 0.0 -0.002 0.07 L-Jun.2012 0.0Nondurables.. . . . . . . . . . . . . . . . . . . . . . . . . . . . . . . . . . . . . . . . . . . . . . . . . . . . . . . . . . 30.960 1.7 0.524 0.07 L-Jun.2009 2.8
Nondurables less food. . . . . . . . . . . . . . . . . . . . . . . . . . . . . . . . . . . . . . . . . . . . 16.724 3.0 0.496 0.10 L-Jun.2009 5.5Nondurables less food and beverages.. . . . . . . . . . . . . . . . . . . . . . . . . 15.775 3.1 0.497 0.11 L-Jun.2009 5.9Nondurables less food, beverages, and apparel. . . . . . . . . . . . . . 12.299 4.2 0.516 0.07 L-Jun.2009 8.0Nondurables less food and apparel. . . . . . . . . . . . . . . . . . . . . . . . . . . . . 13.248 3.9 0.513 0.07 L-Jun.2009 7.3
Housing.. . . . . . . . . . . . . . . . . . . . . . . . . . . . . . . . . . . . . . . . . . . . . . . . . . . . . . . . . . . . . . . 40.979 0.3 0.105 0.05 L-Jul.2008 0.5Education and communication5 . . . . . . . . . . . . . . . . . . . . . . . . . . . . . . . . . . . . 6.736 -0.4 -0.025 0.08 S-Mar.2002 -0.4
Education5 . . . . . . . . . . . . . . . . . . . . . . . . . . . . . . . . . . . . . . . . . . . . . . . . . . . . . . . . . 3.203 -0.1 -0.005 0.12 S-Aug.2000 -0.1Communication5 . . . . . . . . . . . . . . . . . . . . . . . . . . . . . . . . . . . . . . . . . . . . . . . . . . . 3.533 -0.6 -0.020 0.07 S-Dec.2010 -0.6
Information and information processing5 . . . . . . . . . . . . . . . . . . . . 3.384 -0.6 -0.020 0.08 – –Information technology, hardware and services18 . . . . . . . . . 0.987 -1.3 -0.012 0.26 S-Jul.2009 -1.3
Recreation5 . . . . . . . . . . . . . . . . . . . . . . . . . . . . . . . . . . . . . . . . . . . . . . . . . . . . . . . . . . . 6.030 0.1 0.003 0.15 L-Jun.2012 0.3Video and audio5 . . . . . . . . . . . . . . . . . . . . . . . . . . . . . . . . . . . . . . . . . . . . . . . . . 1.922 0.4 0.007 0.19 L-Jan.2012 0.6Pets, pet products and services5 . . . . . . . . . . . . . . . . . . . . . . . . . . . . . . . 1.098 0.0 0.000 0.26 L-Jun.2012 0.4Photography5 . . . . . . . . . . . . . . . . . . . . . . . . . . . . . . . . . . . . . . . . . . . . . . . . . . . . . . 0.113 -0.3 0.000 0.36 S-May 2012 -0.9
Food and beverages.. . . . . . . . . . . . . . . . . . . . . . . . . . . . . . . . . . . . . . . . . . . . . . . . 15.185 0.2 0.027 0.08 L-Jun.2012 0.2Domestically produced farm food4 . . . . . . . . . . . . . . . . . . . . . . . . . . . . . . 7.229 0.2 0.017 0.14 L-Jan.2012 0.7
Other services. . . . . . . . . . . . . . . . . . . . . . . . . . . . . . . . . . . . . . . . . . . . . . . . . . . . . . . . 11.581 -0.1 -0.011 0.08 S-Dec.2010 -0.1Apparel less footwear. . . . . . . . . . . . . . . . . . . . . . . . . . . . . . . . . . . . . . . . . . . . . . . . 2.800 -0.6 -0.019 0.47 S-Feb.2012 -1.1Fuels and utilities. . . . . . . . . . . . . . . . . . . . . . . . . . . . . . . . . . . . . . . . . . . . . . . . . . . . . 5.383 0.9 0.047 0.13 L-Dec.2010 0.9
Household energy. . . . . . . . . . . . . . . . . . . . . . . . . . . . . . . . . . . . . . . . . . . . . . . . . 4.201 0.9 0.038 0.15 L-Feb.2011 0.9Medical care. . . . . . . . . . . . . . . . . . . . . . . . . . . . . . . . . . . . . . . . . . . . . . . . . . . . . . . . . . 7.146 0.2 0.013 0.06 S-Feb.2012 0.2Transportation.. . . . . . . . . . . . . . . . . . . . . . . . . . . . . . . . . . . . . . . . . . . . . . . . . . . . . . . . 17.077 2.9 0.484 0.06 L-Jun.2009 4.9
Private transportation.. . . . . . . . . . . . . . . . . . . . . . . . . . . . . . . . . . . . . . . . . . . . . 15.887 3.1 0.495 0.06 L-Jun.2009 5.3New and used motor vehicles5 . . . . . . . . . . . . . . . . . . . . . . . . . . . . . . . 5.679 -0.3 -0.017 0.08 – –
Utilities and public transportation. . . . . . . . . . . . . . . . . . . . . . . . . . . . . . . . . . . 10.064 0.2 0.016 0.09 L-Apr.2012 0.4Household furnishings and operations.. . . . . . . . . . . . . . . . . . . . . . . . . . . . 4.077 -0.3 -0.010 0.12 S-May 2012 -0.3
See footnotes at end of table.

Table 6. Consumer Price Index for All Urban Consumers (CPI-U): U.S. city average, by expenditure category,August 2012, 1-month analysis table — Continued[1982-84=100, unless otherwise noted]
Expenditure category
Relativeimportance
Jul.2012
One Month
Seasonallyadjustedpercentchange
Jul. 2012-Aug. 2012
Seasonallyadjusted
effect on AllItems
Jul. 2012-Aug. 20121
Standarderror,
median pricechange2
Largest (L) or Smallest (S)seasonally adjusted
change since:3
Date Percentchange
Other goods and services. . . . . . . . . . . . . . . . . . . . . . . . . . . . . . . . . . . . . . . . . . . 3.372 0.3 0.011 0.11 S-Jun.2012 0.3Personal care. . . . . . . . . . . . . . . . . . . . . . . . . . . . . . . . . . . . . . . . . . . . . . . . . . . . . . 2.569 0.5 0.012 0.13 L-Nov.2011 0.5
1 The ’effect’ of an item category is a measure of that item’s contribution to the All items price change. For example, if the Food index had an effect of 0.40,and the All items index rose 1.2 percent, then the increase in food prices contributed 0.40 / 1.2, or 33.3 percent, to that All items increase. Said anotherway, had food prices been unchanged for that month the change in the All items index would have been 1.2 percent minus 0.40, or 0.8 percent. Effectscan be negative as well. For example, if the effect of food was a negative 0.1, and the All items index rose 0.5 percent, the All items index actually wouldhave been 0.1 percent higher (or 0.6 percent) had food prices been unchanged. Since food prices fell while prices overall were rising, the contributionof food to the All items price change was negative (in this case, -0.1 / 0.5, or minus 20 percent).
2 A statistic’s margin of error is often expressed as its point estimate plus or minus two standard errors. For example, if a CPI category rose 0.6 percent,and its standard error was 0.15 percent, the margin of error on this item’s 1-month percent change would be 0.6 percent, plus or minus 0.3 percent.
3 If the current seasonally adjusted 1-month percent change is greater than the previous published 1-month percent change, then this column identifiesthe closest prior month with a 1-month percent change as (L)arge as or (L)arger than the current 1-month change. If the current 1-month percent changeis smaller than the previous published 1-month percent change, the most recent month with a change as (S)mall or (S)maller than the current monthchange is identified. If the current and previous published 1-month percent changes are equal, a dash will appear. Standard numerical comparisons areused. For example, 0.8% is greater than 0.6%, -0.4% is less than -0.2%, and -0.2% is less than 0.0%. Note that a (L)arger change can be a smallerdecline, for example, a -0.2% change is larger than a -0.4% change, but still represents a decline in the price index. Likewise, (S)maller changes canbe increases, for example, a 0.6% change is smaller than 0.8%, but still represents an increase in the price index. In this context, a -0.2% change isconsidered to be smaller than a 0.0% change.
4 Not seasonally adjusted.5 Indexes on a December 1997=100 base.6 Special indexes based on a substantially smaller sample. These series do not contribute to the all items index aggregation and therefore do not have
a relative importance or effect.7 Indexes on a December 2007=100 base.8 Indexes on a December 2005=100 base.9 Indexes on a December 1986=100 base.10 Indexes on a December 1993=100 base.11 This index series was calculated using a Laspeyres estimator. All other item stratum index series were calculated using a geometric means estimator.12 Indexes on a December 2009=100 base.13 Indexes on a December 1990=100 base.14 Indexes on a December 1983=100 base.15 Indexes on a December 2001=100 base.16 Indexes on a December 1982=100 base.17 Indexes on a December 1996=100 base.18 Indexes on a December 1988=100 base.
NOTE: Index applies to a month as a whole, not to any specific date.

Table 7. Consumer Price Index for All Urban Consumers (CPI-U): U.S. city average, by expenditure category,August 2012, 12-month analysis table[1982-84=100, unless otherwise noted]
Expenditure category
Relativeimportance
Jul.2012
Twelve Month
Unadjustedpercentchange
Aug. 2011-Aug. 2012
Unadjustedeffect on All
ItemsAug. 2011-Aug. 20121
Standarderror,
median pricechange2
Largest (L) or Smallest (S)unadjusted change since:3
Date Percentchange
All items.. . . . . . . . . . . . . . . . . . . . . . . . . . . . . . . . . . . . . . . . . . . . . . . . . . . . . . . . . . . . . . . . . 100.000 1.7 0.07 L-Jun.2012 1.7Food.. . . . . . . . . . . . . . . . . . . . . . . . . . . . . . . . . . . . . . . . . . . . . . . . . . . . . . . . . . . . . . . . . . . 14.235 2.0 0.281 0.14 S-Jan.2011 1.8
Food at home.. . . . . . . . . . . . . . . . . . . . . . . . . . . . . . . . . . . . . . . . . . . . . . . . . . . . . 8.558 1.5 0.121 0.20 S-Oct.2010 1.4Cereals and bakery products. . . . . . . . . . . . . . . . . . . . . . . . . . . . . . . . . . 1.235 1.8 0.021 0.43 S-Mar.2011 1.8
Cereals and cereal products. . . . . . . . . . . . . . . . . . . . . . . . . . . . . . . . 0.477 1.8 0.006 0.72 S-Apr.2011 1.7Flour and prepared flour mixes. . . . . . . . . . . . . . . . . . . . . . . . . . 0.054 4.3 0.002 1.33 S-Apr.2011 3.4Breakfast cereal. . . . . . . . . . . . . . . . . . . . . . . . . . . . . . . . . . . . . . . . . . . . 0.292 1.0 0.002 0.94 S-Jan.2011 0.4Rice, pasta, cornmeal. . . . . . . . . . . . . . . . . . . . . . . . . . . . . . . . . . . . . 0.131 2.1 0.002 1.08 S-Apr.2011 1.4
Rice4 , 5 . . . . . . . . . . . . . . . . . . . . . . . . . . . . . . . . . . . . . . . . . . . . . . . . . . 2.3 1.67 S-Jun.2012 1.7Bakery products. . . . . . . . . . . . . . . . . . . . . . . . . . . . . . . . . . . . . . . . . . . . 0.758 2.0 0.015 0.59 S-Mar.2011 1.6
Bread4 . . . . . . . . . . . . . . . . . . . . . . . . . . . . . . . . . . . . . . . . . . . . . . . . . . . 0.225 1.0 0.002 1.22 S-Nov.2010 0.5White bread5 . . . . . . . . . . . . . . . . . . . . . . . . . . . . . . . . . . . . . . . . . 2.0 1.78 – –Bread other than white5 . . . . . . . . . . . . . . . . . . . . . . . . . . . . -0.3 1.73 S-Nov.2010 -0.7
Fresh biscuits, rolls, muffins4 . . . . . . . . . . . . . . . . . . . . . . . . . 0.112 1.6 0.002 1.05 S-Oct.2010 1.5Cakes, cupcakes, and cookies. . . . . . . . . . . . . . . . . . . . . . . . 0.183 3.3 0.006 1.06 S-Aug.2011 2.6
Cookies5 . . . . . . . . . . . . . . . . . . . . . . . . . . . . . . . . . . . . . . . . . . . . . . 5.2 1.51 S-Mar.2012 5.0Fresh cakes and cupcakes5 . . . . . . . . . . . . . . . . . . . . . . . . 2.0 1.15 S-Jul.2011 1.9
Other bakery products. . . . . . . . . . . . . . . . . . . . . . . . . . . . . . . . . . 0.238 1.7 0.004 1.00 L-Jun.2012 2.1Fresh sweetrolls, coffeecakes, doughnuts5 . . . . . . 3.5 1.61 L-Jun.2012 3.8Crackers, bread, and cracker products5 . . . . . . . . . . 3.2 1.88 L-Apr.2012 6.3Frozen and refrigerated bakery products, pies,
tarts, turnovers5 . . . . . . . . . . . . . . . . . . . . . . . . . . . . . . . . . . . -0.4 1.52 L-Jun.2012 0.8Meats, poultry, fish, and eggs. . . . . . . . . . . . . . . . . . . . . . . . . . . . . . . . . 1.951 3.0 0.057 0.39 S-May 2012 2.7
Meats, poultry, and fish.. . . . . . . . . . . . . . . . . . . . . . . . . . . . . . . . . . . . . 1.848 2.9 0.052 0.41 S-May 2012 2.9Meats. . . . . . . . . . . . . . . . . . . . . . . . . . . . . . . . . . . . . . . . . . . . . . . . . . . . . . . . 1.196 2.5 0.030 0.52 S-May 2010 2.1
Beef and veal. . . . . . . . . . . . . . . . . . . . . . . . . . . . . . . . . . . . . . . . . . . . 0.564 5.8 0.031 0.74 S-May 2012 5.4Uncooked ground beef. . . . . . . . . . . . . . . . . . . . . . . . . . . . . . 0.221 6.8 0.014 1.14 L-Jun.2012 7.3Uncooked beef roasts4 . . . . . . . . . . . . . . . . . . . . . . . . . . . . . 0.082 5.0 0.004 1.80 L-Jun.2012 5.6Uncooked beef steaks4 . . . . . . . . . . . . . . . . . . . . . . . . . . . . . 0.209 5.4 0.010 1.12 S-Jun.2011 4.0Uncooked other beef and veal4 . . . . . . . . . . . . . . . . . . . . 0.052 4.0 0.002 1.47 S-Jun.2012 3.1
Pork. . . . . . . . . . . . . . . . . . . . . . . . . . . . . . . . . . . . . . . . . . . . . . . . . . . . . . . 0.371 -0.2 0.000 0.87 L-Apr.2012 3.0Bacon, breakfast sausage, and related products4
. . . . . . . . . . . . . . . . . . . . . . . . . . . . . . . . . . . . . . . . . . . . . . . . . . . . . . . . . . . . . . . . . . . . . . . . . . . . 0.139 0.2 0.000 1.49 L-Apr.2012 2.0Bacon and related products5 . . . . . . . . . . . . . . . . . . . . 0.4 2.54 L-Apr.2012 3.3Breakfast sausage and related products4 , 5 .. . 3.1 1.68 L-Jun.2012 3.5
Ham.. . . . . . . . . . . . . . . . . . . . . . . . . . . . . . . . . . . . . . . . . . . . . . . . . . . 0.080 1.1 0.001 1.75 – –Ham, excluding canned5 . . . . . . . . . . . . . . . . . . . . . . . . . 1.2 2.43 L-Jun.2012 2.0
Pork chops. . . . . . . . . . . . . . . . . . . . . . . . . . . . . . . . . . . . . . . . . . . . 0.062 0.6 0.000 1.66 S-Apr.2010 0.3Other pork including roasts and picnics4 . . . . . . . . . 0.090 -2.5 -0.002 1.96 L-Jun.2012 -2.2
Other meats. . . . . . . . . . . . . . . . . . . . . . . . . . . . . . . . . . . . . . . . . . . . . . 0.262 -0.2 -0.001 1.30 S-May 2010 -0.3Frankfurters5 . . . . . . . . . . . . . . . . . . . . . . . . . . . . . . . . . . . . . . . . . 1.4 3.30 L-Jun.2012 5.6Lunchmeats4 , 5 . . . . . . . . . . . . . . . . . . . . . . . . . . . . . . . . . . . . . . -0.3 0.93 S-Jul.2010 -0.3Lamb and organ meats5 . . . . . . . . . . . . . . . . . . . . . . . . . . . . -4.4 3.30 S-Jun.2007 -5.3Lamb and mutton4 , 5 . . . . . . . . . . . . . . . . . . . . . . . . . . . . . . . -11.5 5.73 S-EVER –
Poultry. . . . . . . . . . . . . . . . . . . . . . . . . . . . . . . . . . . . . . . . . . . . . . . . . . . . 0.345 5.6 0.019 0.93 S-Jun.2012 5.1Chicken4 . . . . . . . . . . . . . . . . . . . . . . . . . . . . . . . . . . . . . . . . . . . . . . 0.268 5.3 0.014 0.99 S-Jun.2012 4.2
Fresh whole chicken5 . . . . . . . . . . . . . . . . . . . . . . . . . . . . 3.9 2.17 L-Apr.2012 8.8Fresh and frozen chicken parts5 . . . . . . . . . . . . . . . . 5.9 1.25 S-May 2012 3.4
Other poultry including turkey4 . . . . . . . . . . . . . . . . . . . . . 0.077 6.9 0.005 2.24 S-Jun.2011 6.6Fish and seafood.. . . . . . . . . . . . . . . . . . . . . . . . . . . . . . . . . . . . . . . 0.307 1.3 0.004 1.03 S-Aug.2010 0.5
Fresh fish and seafood4 . . . . . . . . . . . . . . . . . . . . . . . . . . . . 0.157 -0.4 -0.001 1.47 S-Jun.2012 -0.4Processed fish and seafood4 . . . . . . . . . . . . . . . . . . . . . . 0.150 3.4 0.005 1.17 S-Apr.2011 3.4
Shelf stable fish and seafood5 . . . . . . . . . . . . . . . . . . 6.8 2.12 L-May 2012 7.2
See footnotes at end of table.

Table 7. Consumer Price Index for All Urban Consumers (CPI-U): U.S. city average, by expenditure category,August 2012, 12-month analysis table — Continued[1982-84=100, unless otherwise noted]
Expenditure category
Relativeimportance
Jul.2012
Twelve Month
Unadjustedpercentchange
Aug. 2011-Aug. 2012
Unadjustedeffect on All
ItemsAug. 2011-Aug. 20121
Standarderror,
median pricechange2
Largest (L) or Smallest (S)unadjusted change since:3
Date Percentchange
Frozen fish and seafood5 . . . . . . . . . . . . . . . . . . . . . . . . 0.1 2.12 S-Aug.2010 -2.7Eggs.. . . . . . . . . . . . . . . . . . . . . . . . . . . . . . . . . . . . . . . . . . . . . . . . . . . . . . . . 0.103 5.5 0.005 1.18 L-Apr.2012 5.6
Dairy and related products. . . . . . . . . . . . . . . . . . . . . . . . . . . . . . . . . . . . . 0.886 -1.0 -0.009 0.51 S-Feb.2010 -2.8Milk4 . . . . . . . . . . . . . . . . . . . . . . . . . . . . . . . . . . . . . . . . . . . . . . . . . . . . . . . . . . . 0.289 -2.7 -0.008 0.79 S-Jan.2010 -6.9
Fresh whole milk5 . . . . . . . . . . . . . . . . . . . . . . . . . . . . . . . . . . . . . . . . . -3.1 1.28 – –Fresh milk other than whole4 , 5 . . . . . . . . . . . . . . . . . . . . . . . . -2.2 1.16 S-Jan.2010 -5.4
Cheese and related products. . . . . . . . . . . . . . . . . . . . . . . . . . . . . . . 0.280 -1.6 -0.005 0.88 S-Mar.2010 -2.8Ice cream and related products. . . . . . . . . . . . . . . . . . . . . . . . . . . . 0.132 1.2 0.002 1.31 S-Nov.2010 -1.1Other dairy and related products4 . . . . . . . . . . . . . . . . . . . . . . . . . 0.185 1.1 0.002 0.93 S-Mar.2011 0.9
Fruits and vegetables.. . . . . . . . . . . . . . . . . . . . . . . . . . . . . . . . . . . . . . . . . . 1.252 -0.7 -0.009 0.55 – –Fresh fruits and vegetables. . . . . . . . . . . . . . . . . . . . . . . . . . . . . . . . . 0.948 -2.1 -0.020 0.69 S-May 2012 -2.1
Fresh fruits. . . . . . . . . . . . . . . . . . . . . . . . . . . . . . . . . . . . . . . . . . . . . . . . . . 0.492 0.0 0.000 1.01 L-Jun.2012 3.3Apples. . . . . . . . . . . . . . . . . . . . . . . . . . . . . . . . . . . . . . . . . . . . . . . . . . . . 0.095 10.1 0.010 1.75 L-Oct.2011 12.3Bananas.. . . . . . . . . . . . . . . . . . . . . . . . . . . . . . . . . . . . . . . . . . . . . . . . . 0.081 -0.8 -0.001 1.44 S-May 2012 -1.0Citrus fruits4 . . . . . . . . . . . . . . . . . . . . . . . . . . . . . . . . . . . . . . . . . . . . . 0.116 -0.1 0.005 2.25 S-Mar.2012 -5.4
Oranges, including tangerines5 . . . . . . . . . . . . . . . . . . . . -0.1 2.47 S-Feb.2012 -2.8Other fresh fruits4 . . . . . . . . . . . . . . . . . . . . . . . . . . . . . . . . . . . . . . 0.199 -5.9 -0.015 1.56 L-Jun.2012 2.0
Fresh vegetables. . . . . . . . . . . . . . . . . . . . . . . . . . . . . . . . . . . . . . . . . . 0.456 -4.3 -0.020 1.01 S-May 2012 -6.9Potatoes.. . . . . . . . . . . . . . . . . . . . . . . . . . . . . . . . . . . . . . . . . . . . . . . . . 0.082 -13.7 -0.012 1.86 S-Jan.2010 -14.7Lettuce.. . . . . . . . . . . . . . . . . . . . . . . . . . . . . . . . . . . . . . . . . . . . . . . . . . . 0.059 -2.5 -0.002 2.27 L-Jan.2012 -1.4Tomatoes.. . . . . . . . . . . . . . . . . . . . . . . . . . . . . . . . . . . . . . . . . . . . . . . . 0.079 -4.1 -0.004 2.40 S-Jun.2012 -6.9Other fresh vegetables. . . . . . . . . . . . . . . . . . . . . . . . . . . . . . . . . 0.236 -1.1 -0.003 1.33 S-Jun.2012 -1.8
Processed fruits and vegetables4 . . . . . . . . . . . . . . . . . . . . . . . 0.305 3.9 0.011 0.70 L-Jun.2012 5.1Canned fruits and vegetables4 . . . . . . . . . . . . . . . . . . . . . . . 0.150 1.6 0.003 1.02 L-Jun.2012 3.5
Canned fruits4 , 5 . . . . . . . . . . . . . . . . . . . . . . . . . . . . . . . . . . . . 1.9 1.19 L-May 2012 3.2Canned vegetables4 , 5 . . . . . . . . . . . . . . . . . . . . . . . . . . . . . 1.4 1.43 – –
Frozen fruits and vegetables4 . . . . . . . . . . . . . . . . . . . . . . . . 0.096 5.4 0.005 1.23 L-Jun.2012 6.9Frozen vegetables5 . . . . . . . . . . . . . . . . . . . . . . . . . . . . . . . . . . 6.0 1.25 L-Jun.2012 6.8
Other processed fruits and vegetables includingdried4 . . . . . . . . . . . . . . . . . . . . . . . . . . . . . . . . . . . . . . . . . . . . . . . . . . 0.058 8.3 0.004 1.36 L-Apr.2009 9.3Dried beans, peas, and lentils4 , 5 . . . . . . . . . . . . . . . . . 15.9 2.74 L-Feb.2012 16.0
Nonalcoholic beverages and beverage materials. . . . . . . . . . . 0.941 -0.4 -0.004 0.68 S-Dec.2010 -1.2Juices and nonalcoholic drinks4 . . . . . . . . . . . . . . . . . . . . . . . . . . . 0.703 0.1 0.001 0.84 L-Jun.2012 1.2
Carbonated drinks. . . . . . . . . . . . . . . . . . . . . . . . . . . . . . . . . . . . . . . . . 0.286 0.3 0.001 1.14 L-Jun.2012 0.9Frozen noncarbonated juices and drinks4 . . . . . . . . . . . . . 0.014 1.3 0.000 2.34 S-Jan.2011 0.6Nonfrozen noncarbonated juices and drinks4 . . . . . . . . . 0.403 -0.1 -0.001 1.05 L-Jun.2012 1.1
Beverage materials including coffee and tea4 . . . . . . . . . . . 0.238 -1.7 -0.004 0.99 S-Jul.1999 -1.7Coffee. . . . . . . . . . . . . . . . . . . . . . . . . . . . . . . . . . . . . . . . . . . . . . . . . . . . . . . 0.145 -3.8 -0.005 1.45 S-Mar.2002 -5.1
Roasted coffee5 . . . . . . . . . . . . . . . . . . . . . . . . . . . . . . . . . . . . . . . . -4.4 1.78 S-Jun.2002 -5.6Instant and freeze dried coffee5 . . . . . . . . . . . . . . . . . . . . . . -0.3 2.00 L-Jun.2012 2.1
Other beverage materials including tea4 . . . . . . . . . . . . . . . 0.093 0.9 0.001 1.25 S-May 2012 -1.0Other food at home.. . . . . . . . . . . . . . . . . . . . . . . . . . . . . . . . . . . . . . . . . . . . 2.293 2.9 0.065 0.41 S-May 2011 2.5
Sugar and sweets. . . . . . . . . . . . . . . . . . . . . . . . . . . . . . . . . . . . . . . . . . . . 0.310 2.5 0.007 0.99 S-May 2011 1.6Sugar and artificial sweeteners. . . . . . . . . . . . . . . . . . . . . . . . . . 0.060 0.2 0.000 0.92 S-Mar.2008 -1.7Candy and chewing gum4 . . . . . . . . . . . . . . . . . . . . . . . . . . . . . . . 0.185 3.0 0.006 1.53 S-Jul.2011 1.9Other sweets4 . . . . . . . . . . . . . . . . . . . . . . . . . . . . . . . . . . . . . . . . . . . . . 0.064 2.9 0.002 1.05 S-Apr.2011 2.4
Fats and oils. . . . . . . . . . . . . . . . . . . . . . . . . . . . . . . . . . . . . . . . . . . . . . . . . . 0.264 3.6 0.009 0.82 S-Dec.2010 1.6Butter and margarine4 . . . . . . . . . . . . . . . . . . . . . . . . . . . . . . . . . . . . 0.075 -4.5 -0.003 1.41 S-Jan.2010 -5.0
Butter5 . . . . . . . . . . . . . . . . . . . . . . . . . . . . . . . . . . . . . . . . . . . . . . . . . . . -11.9 2.47 S-Nov.2009 -14.9Margarine5 . . . . . . . . . . . . . . . . . . . . . . . . . . . . . . . . . . . . . . . . . . . . . . 2.5 1.86 S-Dec.2010 1.2
Salad dressing4 . . . . . . . . . . . . . . . . . . . . . . . . . . . . . . . . . . . . . . . . . . . 0.066 0.3 0.000 1.32 S-Sep.2010 0.1Other fats and oils including peanut butter4 . . . . . . . . . . . 0.123 11.0 0.012 1.22 S-Sep.2011 10.8
Peanut butter4 , 5 . . . . . . . . . . . . . . . . . . . . . . . . . . . . . . . . . . . . . . . 34.4 1.63 L-Jun.2012 39.2Other foods.. . . . . . . . . . . . . . . . . . . . . . . . . . . . . . . . . . . . . . . . . . . . . . . . 1.719 2.8 0.048 0.49 S-Jul.2011 2.5
See footnotes at end of table.

Table 7. Consumer Price Index for All Urban Consumers (CPI-U): U.S. city average, by expenditure category,August 2012, 12-month analysis table — Continued[1982-84=100, unless otherwise noted]
Expenditure category
Relativeimportance
Jul.2012
Twelve Month
Unadjustedpercentchange
Aug. 2011-Aug. 2012
Unadjustedeffect on All
ItemsAug. 2011-Aug. 20121
Standarderror,
median pricechange2
Largest (L) or Smallest (S)unadjusted change since:3
Date Percentchange
Soups.. . . . . . . . . . . . . . . . . . . . . . . . . . . . . . . . . . . . . . . . . . . . . . . . . . . . 0.102 1.7 0.002 1.59 S-Jun.2011 1.2Frozen and freeze dried prepared foods. . . . . . . . . . . . . 0.303 0.1 0.000 1.11 S-Jun.2012 -0.2Snacks.. . . . . . . . . . . . . . . . . . . . . . . . . . . . . . . . . . . . . . . . . . . . . . . . . . . 0.325 6.2 0.020 0.93 S-Apr.2012 5.6Spices, seasonings, condiments, sauces. . . . . . . . . . . . 0.288 1.8 0.006 1.04 L-Jun.2012 2.2
Salt and other seasonings and spices4 , 5 . . . . . . . 6.1 1.99 L-Jun.2012 7.9Olives, pickles, relishes4 , 5 . . . . . . . . . . . . . . . . . . . . . . . . -1.2 1.64 L-Jun.2012 2.1Sauces and gravies4 , 5 . . . . . . . . . . . . . . . . . . . . . . . . . . . . . 0.7 1.83 S-Jun.2012 0.5Other condiments5 . . . . . . . . . . . . . . . . . . . . . . . . . . . . . . . . . . . 2.8 1.66 S-Jun.2012 2.8
Baby food4 . . . . . . . . . . . . . . . . . . . . . . . . . . . . . . . . . . . . . . . . . . . . . . 0.072 2.1 0.002 0.94 S-Jun.2011 1.3Other miscellaneous foods4 .. . . . . . . . . . . . . . . . . . . . . . . . . . 0.629 3.3 0.019 0.80 S-Dec.2011 3.2
Prepared salads6 , 5 . . . . . . . . . . . . . . . . . . . . . . . . . . . . . . . . . 5.3 1.42 – –Food away from home.. . . . . . . . . . . . . . . . . . . . . . . . . . . . . . . . . . . . . . . . . . . 5.677 2.8 0.160 0.17 S-Oct.2011 2.7
Full service meals and snacks4 . . . . . . . . . . . . . . . . . . . . . . . . . . . . . . 2.693 2.6 0.072 0.21 S-May 2012 2.6Limited service meals and snacks4 . . . . . . . . . . . . . . . . . . . . . . . . . . 2.290 3.3 0.076 0.30 – –Food at employee sites and schools4 . . . . . . . . . . . . . . . . . . . . . . . 0.252 1.0 0.002 0.54 S-Jul.2010 0.4
Food at elementary and secondary schools7 , 5 . . . . . . . . . 0.5 0.73 S-Jul.2010 -0.3Food from vending machines and mobile vendors4 . . . . . . . 0.082 2.9 0.003 0.88 S-Dec.2011 2.7Other food away from home4 .. . . . . . . . . . . . . . . . . . . . . . . . . . . . . . . . 0.361 2.0 0.007 0.45 S-May 2012 2.0
Energy. . . . . . . . . . . . . . . . . . . . . . . . . . . . . . . . . . . . . . . . . . . . . . . . . . . . . . . . . . . . . . . . . 9.849 -0.6 -0.035 0.19 L-Apr.2012 0.9Energy commodities. . . . . . . . . . . . . . . . . . . . . . . . . . . . . . . . . . . . . . . . . . . . . . . 5.957 1.5 0.100 0.18 L-Apr.2012 3.1
Fuel oil and other fuels. . . . . . . . . . . . . . . . . . . . . . . . . . . . . . . . . . . . . . . . . 0.310 -4.2 -0.014 0.92 L-May 2012 -1.8Fuel oil. . . . . . . . . . . . . . . . . . . . . . . . . . . . . . . . . . . . . . . . . . . . . . . . . . . . . . . . . 0.213 -0.8 -0.002 1.14 L-Apr.2012 0.9Propane, kerosene, and firewood8 . . . . . . . . . . . . . . . . . . . . . . . . 0.097 -11.1 -0.012 1.24 S-Oct.2009 -17.4
Motor fuel. . . . . . . . . . . . . . . . . . . . . . . . . . . . . . . . . . . . . . . . . . . . . . . . . . . . . . . . 5.647 1.9 0.114 0.19 L-Apr.2012 3.3Gasoline (all types). . . . . . . . . . . . . . . . . . . . . . . . . . . . . . . . . . . . . . . . . . . 5.468 1.8 0.113 0.19 L-Apr.2012 3.2
Gasoline, unleaded regular5 . . . . . . . . . . . . . . . . . . . . . . . . . . . . . 1.7 0.48 L-Apr.2012 3.3Gasoline, unleaded midgrade9 , 5 . . . . . . . . . . . . . . . . . . . . . . 2.4 0.45 L-Apr.2012 3.2Gasoline, unleaded premium5 .. . . . . . . . . . . . . . . . . . . . . . . . . . 2.1 0.45 L-Apr.2012 3.1
Other motor fuels4 . . . . . . . . . . . . . . . . . . . . . . . . . . . . . . . . . . . . . . . . . . . 0.179 1.0 0.001 0.33 L-Apr.2012 1.6Energy services10 . . . . . . . . . . . . . . . . . . . . . . . . . . . . . . . . . . . . . . . . . . . . . . . . . 3.891 -3.7 -0.135 0.32 L-Jun.2012 -3.0
Electricity10 . . . . . . . . . . . . . . . . . . . . . . . . . . . . . . . . . . . . . . . . . . . . . . . . . . . . . . 3.026 -1.2 -0.030 0.37 L-Jun.2012 0.5Utility (piped) gas service10 . . . . . . . . . . . . . . . . . . . . . . . . . . . . . . . . . . . 0.865 -11.2 -0.105 0.62 L-Mar.2012 -9.1
All items less food and energy. . . . . . . . . . . . . . . . . . . . . . . . . . . . . . . . . . . . . 75.916 1.9 1.446 0.09 S-Jul.2011 1.8Commodities less food and energy commodities. . . . . . . . . . . . . . 19.717 0.7 0.131 0.20 S-Apr.2011 0.7
Household furnishings and supplies11 . . . . . . . . . . . . . . . . . . . . . . . 3.348 0.0 -0.002 0.35 S-Aug.2011 -0.1Window and floor coverings and other linens4 . . . . . . . . . . 0.271 -4.1 -0.012 1.43 S-Jun.2012 -4.1
Floor coverings4 . . . . . . . . . . . . . . . . . . . . . . . . . . . . . . . . . . . . . . . . . . . 0.039 -2.8 -0.001 1.43 S-Dec.2010 -3.6Window coverings4 . . . . . . . . . . . . . . . . . . . . . . . . . . . . . . . . . . . . . . . 0.076 0.1 0.000 2.32 S-May 2012 0.1Other linens4 .. . . . . . . . . . . . . . . . . . . . . . . . . . . . . . . . . . . . . . . . . . . . . . 0.156 -6.3 -0.010 1.74 – –
Furniture and bedding. . . . . . . . . . . . . . . . . . . . . . . . . . . . . . . . . . . . . . . 0.723 1.3 0.010 0.91 S-Jun.2012 0.6Bedroom furniture.. . . . . . . . . . . . . . . . . . . . . . . . . . . . . . . . . . . . . . . . . 0.233 1.0 0.003 1.64 L-Jun.2012 1.3Living room, kitchen, and dining room furniture4 . . . . . 0.346 0.8 0.002 1.20 S-May 2011 -1.8Other furniture4 . . . . . . . . . . . . . . . . . . . . . . . . . . . . . . . . . . . . . . . . . . . . 0.136 3.6 0.005 2.17 S-Jun.2012 -4.9
Infants’ furniture7 , 5 . . . . . . . . . . . . . . . . . . . . . . . . . . . . . . . . . . . .Appliances4 . . . . . . . . . . . . . . . . . . . . . . . . . . . . . . . . . . . . . . . . . . . . . . . . . . . 0.288 0.9 0.003 0.76 S-Nov.2011 0.9
Major appliances4 . . . . . . . . . . . . . . . . . . . . . . . . . . . . . . . . . . . . . . . . . 0.166 2.9 0.005 1.10 S-Nov.2011 2.1Laundry equipment5 . . . . . . . . . . . . . . . . . . . . . . . . . . . . . . . . . . . 6.6 1.75 S-Dec.2011 4.0
Other appliances4 . . . . . . . . . . . . . . . . . . . . . . . . . . . . . . . . . . . . . . . . . 0.119 -1.9 -0.002 1.22 L-Jun.2012 -1.8Other household equipment and furnishings4 . . . . . . . . . . . 0.495 -3.7 -0.019 1.21 L-Sep.2011 -3.6
Clocks, lamps, and decorator items.. . . . . . . . . . . . . . . . . . . . 0.261 -4.5 -0.012 1.82 L-Jul.2011 -3.6Indoor plants and flowers12 . . . . . . . . . . . . . . . . . . . . . . . . . . . . . . 0.102 -0.4 0.000 1.49 S-Jun.2012 -0.5Dishes and flatware4 . . . . . . . . . . . . . . . . . . . . . . . . . . . . . . . . . . . . . 0.047 -10.9 -0.006 2.54 S-May 2012 -11.2Nonelectric cookware and tableware4 . . . . . . . . . . . . . . . . . . 0.085 0.0 0.000 1.31 S-Jun.2012 -0.4
See footnotes at end of table.
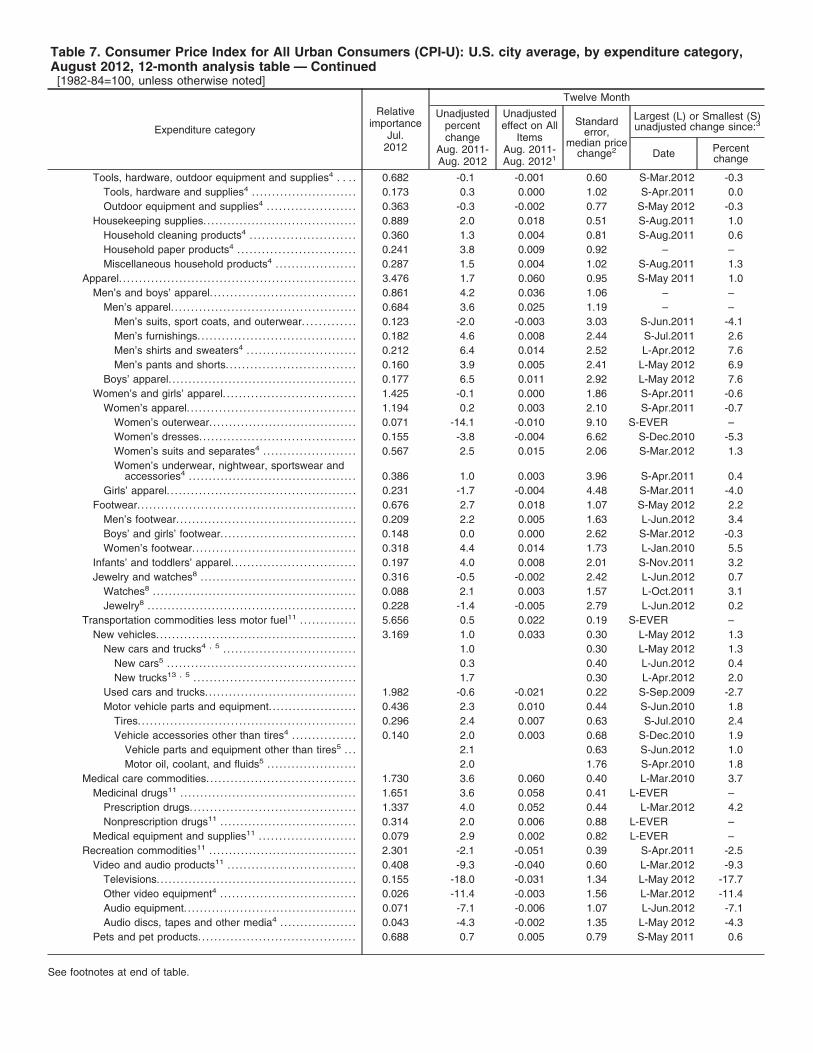
Table 7. Consumer Price Index for All Urban Consumers (CPI-U): U.S. city average, by expenditure category,August 2012, 12-month analysis table — Continued[1982-84=100, unless otherwise noted]
Expenditure category
Relativeimportance
Jul.2012
Twelve Month
Unadjustedpercentchange
Aug. 2011-Aug. 2012
Unadjustedeffect on All
ItemsAug. 2011-Aug. 20121
Standarderror,
median pricechange2
Largest (L) or Smallest (S)unadjusted change since:3
Date Percentchange
Tools, hardware, outdoor equipment and supplies4 . . . . 0.682 -0.1 -0.001 0.60 S-Mar.2012 -0.3Tools, hardware and supplies4 . . . . . . . . . . . . . . . . . . . . . . . . . . 0.173 0.3 0.000 1.02 S-Apr.2011 0.0Outdoor equipment and supplies4 . . . . . . . . . . . . . . . . . . . . . . 0.363 -0.3 -0.002 0.77 S-May 2012 -0.3
Housekeeping supplies. . . . . . . . . . . . . . . . . . . . . . . . . . . . . . . . . . . . . . 0.889 2.0 0.018 0.51 S-Aug.2011 1.0Household cleaning products4 . . . . . . . . . . . . . . . . . . . . . . . . . . 0.360 1.3 0.004 0.81 S-Aug.2011 0.6Household paper products4 . . . . . . . . . . . . . . . . . . . . . . . . . . . . . 0.241 3.8 0.009 0.92 – –Miscellaneous household products4 . . . . . . . . . . . . . . . . . . . . 0.287 1.5 0.004 1.02 S-Aug.2011 1.3
Apparel. . . . . . . . . . . . . . . . . . . . . . . . . . . . . . . . . . . . . . . . . . . . . . . . . . . . . . . . . . . 3.476 1.7 0.060 0.95 S-May 2011 1.0Men’s and boys’ apparel. . . . . . . . . . . . . . . . . . . . . . . . . . . . . . . . . . . . 0.861 4.2 0.036 1.06 – –
Men’s apparel. . . . . . . . . . . . . . . . . . . . . . . . . . . . . . . . . . . . . . . . . . . . . . 0.684 3.6 0.025 1.19 – –Men’s suits, sport coats, and outerwear. . . . . . . . . . . . . 0.123 -2.0 -0.003 3.03 S-Jun.2011 -4.1Men’s furnishings. . . . . . . . . . . . . . . . . . . . . . . . . . . . . . . . . . . . . . . 0.182 4.6 0.008 2.44 S-Jul.2011 2.6Men’s shirts and sweaters4 . . . . . . . . . . . . . . . . . . . . . . . . . . . 0.212 6.4 0.014 2.52 L-Apr.2012 7.6Men’s pants and shorts. . . . . . . . . . . . . . . . . . . . . . . . . . . . . . . . 0.160 3.9 0.005 2.41 L-May 2012 6.9
Boys’ apparel. . . . . . . . . . . . . . . . . . . . . . . . . . . . . . . . . . . . . . . . . . . . . . . 0.177 6.5 0.011 2.92 L-May 2012 7.6Women’s and girls’ apparel. . . . . . . . . . . . . . . . . . . . . . . . . . . . . . . . . 1.425 -0.1 0.000 1.86 S-Apr.2011 -0.6
Women’s apparel. . . . . . . . . . . . . . . . . . . . . . . . . . . . . . . . . . . . . . . . . . 1.194 0.2 0.003 2.10 S-Apr.2011 -0.7Women’s outerwear. . . . . . . . . . . . . . . . . . . . . . . . . . . . . . . . . . . . . 0.071 -14.1 -0.010 9.10 S-EVER –Women’s dresses. . . . . . . . . . . . . . . . . . . . . . . . . . . . . . . . . . . . . . . 0.155 -3.8 -0.004 6.62 S-Dec.2010 -5.3Women’s suits and separates4 . . . . . . . . . . . . . . . . . . . . . . . 0.567 2.5 0.015 2.06 S-Mar.2012 1.3Women’s underwear, nightwear, sportswear and
accessories4 . . . . . . . . . . . . . . . . . . . . . . . . . . . . . . . . . . . . . . . . . . 0.386 1.0 0.003 3.96 S-Apr.2011 0.4Girls’ apparel. . . . . . . . . . . . . . . . . . . . . . . . . . . . . . . . . . . . . . . . . . . . . . . 0.231 -1.7 -0.004 4.48 S-Mar.2011 -4.0
Footwear. . . . . . . . . . . . . . . . . . . . . . . . . . . . . . . . . . . . . . . . . . . . . . . . . . . . . . . 0.676 2.7 0.018 1.07 S-May 2012 2.2Men’s footwear. . . . . . . . . . . . . . . . . . . . . . . . . . . . . . . . . . . . . . . . . . . . . 0.209 2.2 0.005 1.63 L-Jun.2012 3.4Boys’ and girls’ footwear. . . . . . . . . . . . . . . . . . . . . . . . . . . . . . . . . . 0.148 0.0 0.000 2.62 S-Mar.2012 -0.3Women’s footwear. . . . . . . . . . . . . . . . . . . . . . . . . . . . . . . . . . . . . . . . . 0.318 4.4 0.014 1.73 L-Jan.2010 5.5
Infants’ and toddlers’ apparel. . . . . . . . . . . . . . . . . . . . . . . . . . . . . . . 0.197 4.0 0.008 2.01 S-Nov.2011 3.2Jewelry and watches8 . . . . . . . . . . . . . . . . . . . . . . . . . . . . . . . . . . . . . . . 0.316 -0.5 -0.002 2.42 L-Jun.2012 0.7
Watches8 . . . . . . . . . . . . . . . . . . . . . . . . . . . . . . . . . . . . . . . . . . . . . . . . . . . 0.088 2.1 0.003 1.57 L-Oct.2011 3.1Jewelry8 . . . . . . . . . . . . . . . . . . . . . . . . . . . . . . . . . . . . . . . . . . . . . . . . . . . . 0.228 -1.4 -0.005 2.79 L-Jun.2012 0.2
Transportation commodities less motor fuel11 . . . . . . . . . . . . . . 5.656 0.5 0.022 0.19 S-EVER –New vehicles. . . . . . . . . . . . . . . . . . . . . . . . . . . . . . . . . . . . . . . . . . . . . . . . . . 3.169 1.0 0.033 0.30 L-May 2012 1.3
New cars and trucks4 , 5 . . . . . . . . . . . . . . . . . . . . . . . . . . . . . . . . . 1.0 0.30 L-May 2012 1.3New cars5 . . . . . . . . . . . . . . . . . . . . . . . . . . . . . . . . . . . . . . . . . . . . . . . 0.3 0.40 L-Jun.2012 0.4New trucks13 , 5 . . . . . . . . . . . . . . . . . . . . . . . . . . . . . . . . . . . . . . . . 1.7 0.30 L-Apr.2012 2.0
Used cars and trucks.. . . . . . . . . . . . . . . . . . . . . . . . . . . . . . . . . . . . . 1.982 -0.6 -0.021 0.22 S-Sep.2009 -2.7Motor vehicle parts and equipment. . . . . . . . . . . . . . . . . . . . . . 0.436 2.3 0.010 0.44 S-Jun.2010 1.8
Tires. . . . . . . . . . . . . . . . . . . . . . . . . . . . . . . . . . . . . . . . . . . . . . . . . . . . . . 0.296 2.4 0.007 0.63 S-Jul.2010 2.4Vehicle accessories other than tires4 . . . . . . . . . . . . . . . . 0.140 2.0 0.003 0.68 S-Dec.2010 1.9
Vehicle parts and equipment other than tires5 . . . 2.1 0.63 S-Jun.2012 1.0Motor oil, coolant, and fluids5 . . . . . . . . . . . . . . . . . . . . . . 2.0 1.76 S-Apr.2010 1.8
Medical care commodities. . . . . . . . . . . . . . . . . . . . . . . . . . . . . . . . . . . . . 1.730 3.6 0.060 0.40 L-Mar.2010 3.7Medicinal drugs11 . . . . . . . . . . . . . . . . . . . . . . . . . . . . . . . . . . . . . . . . . . . . 1.651 3.6 0.058 0.41 L-EVER –
Prescription drugs. . . . . . . . . . . . . . . . . . . . . . . . . . . . . . . . . . . . . . . . . 1.337 4.0 0.052 0.44 L-Mar.2012 4.2Nonprescription drugs11 . . . . . . . . . . . . . . . . . . . . . . . . . . . . . . . . . . 0.314 2.0 0.006 0.88 L-EVER –
Medical equipment and supplies11 . . . . . . . . . . . . . . . . . . . . . . . . 0.079 2.9 0.002 0.82 L-EVER –Recreation commodities11 . . . . . . . . . . . . . . . . . . . . . . . . . . . . . . . . . . . . . 2.301 -2.1 -0.051 0.39 S-Apr.2011 -2.5
Video and audio products11 . . . . . . . . . . . . . . . . . . . . . . . . . . . . . . . . 0.408 -9.3 -0.040 0.60 L-Mar.2012 -9.3Televisions.. . . . . . . . . . . . . . . . . . . . . . . . . . . . . . . . . . . . . . . . . . . . . . . . . 0.155 -18.0 -0.031 1.34 L-May 2012 -17.7Other video equipment4 . . . . . . . . . . . . . . . . . . . . . . . . . . . . . . . . . . 0.026 -11.4 -0.003 1.56 L-Mar.2012 -11.4Audio equipment. . . . . . . . . . . . . . . . . . . . . . . . . . . . . . . . . . . . . . . . . . . 0.071 -7.1 -0.006 1.07 L-Jun.2012 -7.1Audio discs, tapes and other media4 . . . . . . . . . . . . . . . . . . . 0.043 -4.3 -0.002 1.35 L-May 2012 -4.3
Pets and pet products. . . . . . . . . . . . . . . . . . . . . . . . . . . . . . . . . . . . . . . 0.688 0.7 0.005 0.79 S-May 2011 0.6
See footnotes at end of table.
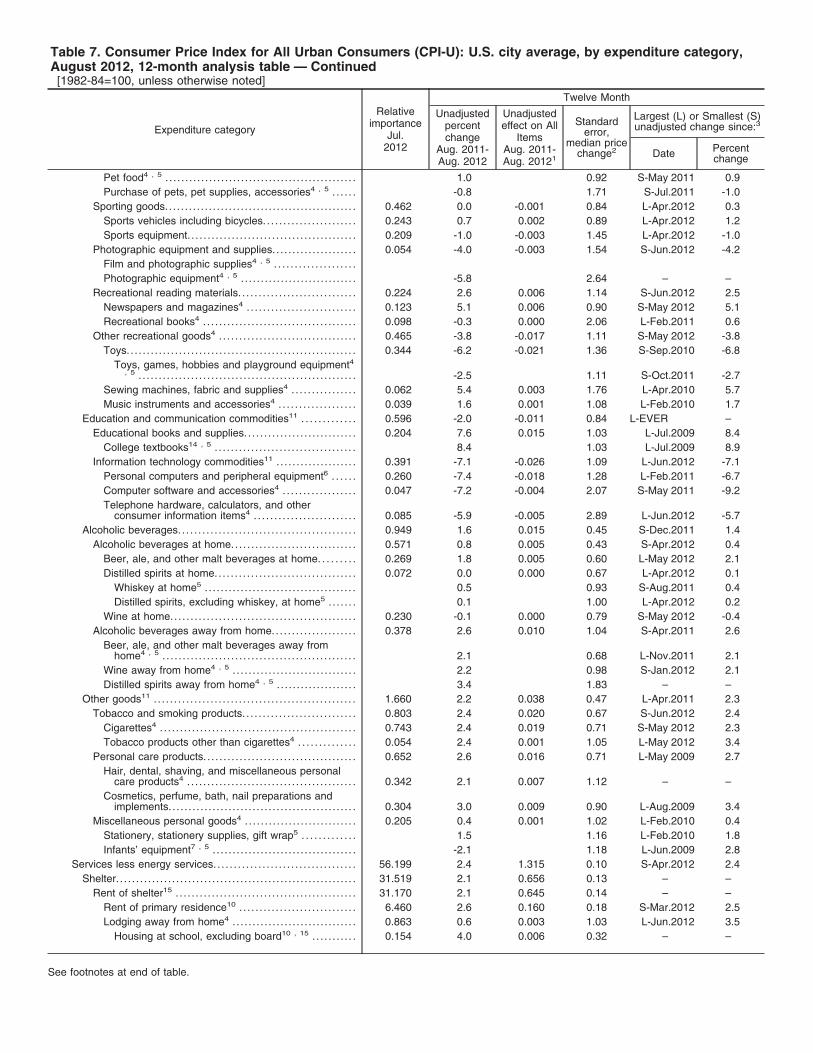
Table 7. Consumer Price Index for All Urban Consumers (CPI-U): U.S. city average, by expenditure category,August 2012, 12-month analysis table — Continued[1982-84=100, unless otherwise noted]
Expenditure category
Relativeimportance
Jul.2012
Twelve Month
Unadjustedpercentchange
Aug. 2011-Aug. 2012
Unadjustedeffect on All
ItemsAug. 2011-Aug. 20121
Standarderror,
median pricechange2
Largest (L) or Smallest (S)unadjusted change since:3
Date Percentchange
Pet food4 , 5 . . . . . . . . . . . . . . . . . . . . . . . . . . . . . . . . . . . . . . . . . . . . . . . . 1.0 0.92 S-May 2011 0.9Purchase of pets, pet supplies, accessories4 , 5 . . . . . . -0.8 1.71 S-Jul.2011 -1.0
Sporting goods.. . . . . . . . . . . . . . . . . . . . . . . . . . . . . . . . . . . . . . . . . . . . . . . 0.462 0.0 -0.001 0.84 L-Apr.2012 0.3Sports vehicles including bicycles. . . . . . . . . . . . . . . . . . . . . . . 0.243 0.7 0.002 0.89 L-Apr.2012 1.2Sports equipment. . . . . . . . . . . . . . . . . . . . . . . . . . . . . . . . . . . . . . . . . . 0.209 -1.0 -0.003 1.45 L-Apr.2012 -1.0
Photographic equipment and supplies. . . . . . . . . . . . . . . . . . . . . 0.054 -4.0 -0.003 1.54 S-Jun.2012 -4.2Film and photographic supplies4 , 5 . . . . . . . . . . . . . . . . . . . .Photographic equipment4 , 5 . . . . . . . . . . . . . . . . . . . . . . . . . . . . . -5.8 2.64 – –
Recreational reading materials. . . . . . . . . . . . . . . . . . . . . . . . . . . . . 0.224 2.6 0.006 1.14 S-Jun.2012 2.5Newspapers and magazines4 . . . . . . . . . . . . . . . . . . . . . . . . . . . 0.123 5.1 0.006 0.90 S-May 2012 5.1Recreational books4 . . . . . . . . . . . . . . . . . . . . . . . . . . . . . . . . . . . . . . 0.098 -0.3 0.000 2.06 L-Feb.2011 0.6
Other recreational goods4 . . . . . . . . . . . . . . . . . . . . . . . . . . . . . . . . . . 0.465 -3.8 -0.017 1.11 S-May 2012 -3.8Toys. . . . . . . . . . . . . . . . . . . . . . . . . . . . . . . . . . . . . . . . . . . . . . . . . . . . . . . . . 0.344 -6.2 -0.021 1.36 S-Sep.2010 -6.8
Toys, games, hobbies and playground equipment4, 5 . . . . . . . . . . . . . . . . . . . . . . . . . . . . . . . . . . . . . . . . . . . . . . . . . . . . . . -2.5 1.11 S-Oct.2011 -2.7
Sewing machines, fabric and supplies4 . . . . . . . . . . . . . . . . 0.062 5.4 0.003 1.76 L-Apr.2010 5.7Music instruments and accessories4 . . . . . . . . . . . . . . . . . . . 0.039 1.6 0.001 1.08 L-Feb.2010 1.7
Education and communication commodities11 . . . . . . . . . . . . . 0.596 -2.0 -0.011 0.84 L-EVER –Educational books and supplies. . . . . . . . . . . . . . . . . . . . . . . . . . . . 0.204 7.6 0.015 1.03 L-Jul.2009 8.4
College textbooks14 , 5 . . . . . . . . . . . . . . . . . . . . . . . . . . . . . . . . . . . 8.4 1.03 L-Jul.2009 8.9Information technology commodities11 . . . . . . . . . . . . . . . . . . . . 0.391 -7.1 -0.026 1.09 L-Jun.2012 -7.1
Personal computers and peripheral equipment6 . . . . . . 0.260 -7.4 -0.018 1.28 L-Feb.2011 -6.7Computer software and accessories4 . . . . . . . . . . . . . . . . . . 0.047 -7.2 -0.004 2.07 S-May 2011 -9.2Telephone hardware, calculators, and other
consumer information items4 . . . . . . . . . . . . . . . . . . . . . . . . . 0.085 -5.9 -0.005 2.89 L-Jun.2012 -5.7Alcoholic beverages. . . . . . . . . . . . . . . . . . . . . . . . . . . . . . . . . . . . . . . . . . . . 0.949 1.6 0.015 0.45 S-Dec.2011 1.4
Alcoholic beverages at home.. . . . . . . . . . . . . . . . . . . . . . . . . . . . . . 0.571 0.8 0.005 0.43 S-Apr.2012 0.4Beer, ale, and other malt beverages at home. . . . . . . . . 0.269 1.8 0.005 0.60 L-May 2012 2.1Distilled spirits at home.. . . . . . . . . . . . . . . . . . . . . . . . . . . . . . . . . . 0.072 0.0 0.000 0.67 L-Apr.2012 0.1
Whiskey at home5 .. . . . . . . . . . . . . . . . . . . . . . . . . . . . . . . . . . . . . 0.5 0.93 S-Aug.2011 0.4Distilled spirits, excluding whiskey, at home5 .. . . . . . 0.1 1.00 L-Apr.2012 0.2
Wine at home.. . . . . . . . . . . . . . . . . . . . . . . . . . . . . . . . . . . . . . . . . . . . . 0.230 -0.1 0.000 0.79 S-May 2012 -0.4Alcoholic beverages away from home.. . . . . . . . . . . . . . . . . . . . 0.378 2.6 0.010 1.04 S-Apr.2011 2.6
Beer, ale, and other malt beverages away fromhome4 , 5 . . . . . . . . . . . . . . . . . . . . . . . . . . . . . . . . . . . . . . . . . . . . . . . . 2.1 0.68 L-Nov.2011 2.1
Wine away from home4 , 5 . . . . . . . . . . . . . . . . . . . . . . . . . . . . . . . 2.2 0.98 S-Jan.2012 2.1Distilled spirits away from home4 , 5 . . . . . . . . . . . . . . . . . . . . 3.4 1.83 – –
Other goods11 . . . . . . . . . . . . . . . . . . . . . . . . . . . . . . . . . . . . . . . . . . . . . . . . . . 1.660 2.2 0.038 0.47 L-Apr.2011 2.3Tobacco and smoking products. . . . . . . . . . . . . . . . . . . . . . . . . . . . 0.803 2.4 0.020 0.67 S-Jun.2012 2.4
Cigarettes4 . . . . . . . . . . . . . . . . . . . . . . . . . . . . . . . . . . . . . . . . . . . . . . . . . 0.743 2.4 0.019 0.71 S-May 2012 2.3Tobacco products other than cigarettes4 . . . . . . . . . . . . . . 0.054 2.4 0.001 1.05 L-May 2012 3.4
Personal care products. . . . . . . . . . . . . . . . . . . . . . . . . . . . . . . . . . . . . . 0.652 2.6 0.016 0.71 L-May 2009 2.7Hair, dental, shaving, and miscellaneous personal
care products4 . . . . . . . . . . . . . . . . . . . . . . . . . . . . . . . . . . . . . . . . . . 0.342 2.1 0.007 1.12 – –Cosmetics, perfume, bath, nail preparations and
implements. . . . . . . . . . . . . . . . . . . . . . . . . . . . . . . . . . . . . . . . . . . . . . . 0.304 3.0 0.009 0.90 L-Aug.2009 3.4Miscellaneous personal goods4 . . . . . . . . . . . . . . . . . . . . . . . . . . . . 0.205 0.4 0.001 1.02 L-Feb.2010 0.4
Stationery, stationery supplies, gift wrap5 . . . . . . . . . . . . . 1.5 1.16 L-Feb.2010 1.8Infants’ equipment7 , 5 . . . . . . . . . . . . . . . . . . . . . . . . . . . . . . . . . . . . -2.1 1.18 L-Jun.2009 2.8
Services less energy services. . . . . . . . . . . . . . . . . . . . . . . . . . . . . . . . . . . 56.199 2.4 1.315 0.10 S-Apr.2012 2.4Shelter. . . . . . . . . . . . . . . . . . . . . . . . . . . . . . . . . . . . . . . . . . . . . . . . . . . . . . . . . . . . 31.519 2.1 0.656 0.13 – –
Rent of shelter15 . . . . . . . . . . . . . . . . . . . . . . . . . . . . . . . . . . . . . . . . . . . . . 31.170 2.1 0.645 0.14 – –Rent of primary residence10 . . . . . . . . . . . . . . . . . . . . . . . . . . . . . 6.460 2.6 0.160 0.18 S-Mar.2012 2.5Lodging away from home4 .. . . . . . . . . . . . . . . . . . . . . . . . . . . . . . 0.863 0.6 0.003 1.03 L-Jun.2012 3.5
Housing at school, excluding board10 , 15 . . . . . . . . . . . 0.154 4.0 0.006 0.32 – –
See footnotes at end of table.

Table 7. Consumer Price Index for All Urban Consumers (CPI-U): U.S. city average, by expenditure category,August 2012, 12-month analysis table — Continued[1982-84=100, unless otherwise noted]
Expenditure category
Relativeimportance
Jul.2012
Twelve Month
Unadjustedpercentchange
Aug. 2011-Aug. 2012
Unadjustedeffect on All
ItemsAug. 2011-Aug. 20121
Standarderror,
median pricechange2
Largest (L) or Smallest (S)unadjusted change since:3
Date Percentchange
Other lodging away from home including hotelsand motels. . . . . . . . . . . . . . . . . . . . . . . . . . . . . . . . . . . . . . . . . . . . . 0.709 -0.3 -0.004 1.27 L-Jun.2012 3.2
Owners’ equivalent rent of residences10 , 15 . . . . . . . . . . 23.846 2.0 0.482 0.15 – –Owners’ equivalent rent of primary residence10 , 15
. . . . . . . . . . . . . . . . . . . . . . . . . . . . . . . . . . . . . . . . . . . . . . . . . . . . . . . . . . . . . . . . . . . . . . . . . . . . 22.438 2.0 0.452 0.15 – –Tenants’ and household insurance4 . . . . . . . . . . . . . . . . . . . . 0.349 3.3 0.011 0.94 S-Jun.2012 3.2
Water and sewer and trash collection services4 . . . . . . . . 1.182 6.2 0.070 0.48 L-Jun.2010 6.2Water and sewerage maintenance10 . . . . . . . . . . . . . . . . . . . 0.891 7.4 0.063 0.63 L-Jul.2010 7.6Garbage and trash collection13 . . . . . . . . . . . . . . . . . . . . . . . . . 0.291 2.6 0.007 0.48 S-Jun.2012 1.9
Household operations4 . . . . . . . . . . . . . . . . . . . . . . . . . . . . . . . . . . . . . . 0.729 2.3 0.017 0.42 S-May 2012 2.1Domestic services4 . . . . . . . . . . . . . . . . . . . . . . . . . . . . . . . . . . . . . . . 0.250 1.5 0.004 0.53 – –Gardening and lawncare services4 . . . . . . . . . . . . . . . . . . . . . 0.237 1.3 0.003 0.42 – –Moving, storage, freight expense4 . . . . . . . . . . . . . . . . . . . . . . 0.091 4.3 0.004 2.54 S-Jun.2012 3.8Repair of household items4 .. . . . . . . . . . . . . . . . . . . . . . . . . . . . . 0.078 0.005 1.03 – –
Medical care services. . . . . . . . . . . . . . . . . . . . . . . . . . . . . . . . . . . . . . . . 5.416 4.2 0.217 0.23 S-May 2012 3.9Professional services.. . . . . . . . . . . . . . . . . . . . . . . . . . . . . . . . . . . . . 3.003 2.2 0.064 0.24 L-Dec.2011 2.2
Physicians’ services10 . . . . . . . . . . . . . . . . . . . . . . . . . . . . . . . . . 1.615 2.5 0.039 0.39 L-Dec.2011 2.7Dental services10 . . . . . . . . . . . . . . . . . . . . . . . . . . . . . . . . . . . . . . . 0.760 2.4 0.018 0.38 L-Feb.2012 2.4Eyeglasses and eye care8 . . . . . . . . . . . . . . . . . . . . . . . . . . . . 0.251 0.6 0.002 0.69 S-Mar.2012 0.5Services by other medical professionals10 , 8 . . . . . . 0.376 1.3 0.005 0.34 L-Dec.2011 1.3
Hospital and related services. . . . . . . . . . . . . . . . . . . . . . . . . . . . 1.762 4.4 0.075 0.43 S-Oct.1999 4.4Hospital services10 , 16 . . . . . . . . . . . . . . . . . . . . . . . . . . . . . . . . 1.540 4.7 0.069 0.50 S-Sep.2005 4.7
Inpatient hospital services10 , 16 , 5 . . . . . . . . . . . . . . . . 4.9 1.10 S-Nov.2004 4.9Outpatient hospital services10 , 8 , 5 . . . . . . . . . . . . . . . 4.3 0.81 S-Jun.2005 4.0
Nursing homes and adult day services10 , 16 . . . . . . . 0.137 3.9 0.005 0.34 L-Nov.2009 4.1Care of invalids and elderly at home7 . . . . . . . . . . . . . . . 0.086 1.1 0.001 0.62 – –
Health insurance7 . . . . . . . . . . . . . . . . . . . . . . . . . . . . . . . . . . . . . . . . . 0.651 14.8 0.078 0.24 L-EVER –Transportation services. . . . . . . . . . . . . . . . . . . . . . . . . . . . . . . . . . . . . . 5.773 1.4 0.080 0.34 S-Mar.2012 1.4
Leased cars and trucks14 . . . . . . . . . . . . . . . . . . . . . . . . . . . . . . . . 0.384 -6.1 -0.028 1.06 L-May 2012 -6.0Car and truck rental4 . . . . . . . . . . . . . . . . . . . . . . . . . . . . . . . . . . . 0.075 0.9 0.000 2.53 S-Jun.2012 0.7
Motor vehicle maintenance and repair. . . . . . . . . . . . . . . . . . 1.146 1.7 0.019 0.32 S-Apr.2011 1.7Motor vehicle body work. . . . . . . . . . . . . . . . . . . . . . . . . . . . . . . 0.057 1.9 0.001 0.61 S-May 2012 1.8Motor vehicle maintenance and servicing. . . . . . . . . . . 0.457 1.9 0.008 0.46 S-Nov.2011 1.9Motor vehicle repair4 . . . . . . . . . . . . . . . . . . . . . . . . . . . . . . . . . . . 0.596 1.6 0.009 0.47 L-Jun.2012 1.7
Motor vehicle insurance.. . . . . . . . . . . . . . . . . . . . . . . . . . . . . . . . . . 2.417 3.8 0.092 0.69 L-May 2011 3.8Motor vehicle fees4 . . . . . . . . . . . . . . . . . . . . . . . . . . . . . . . . . . . . . . . 0.562 3.1 0.017 0.40 S-Jun.2012 3.0
State motor vehicle registration and license fees10 ,
4 . . . . . . . . . . . . . . . . . . . . . . . . . . . . . . . . . . . . . . . . . . . . . . . . . . . . . . . . 0.326 0.5 0.002 0.59 S-Jun.2012 0.5Parking and other fees4 . . . . . . . . . . . . . . . . . . . . . . . . . . . . . . . 0.214 7.3 0.014 0.37 L-EVER –
Parking fees and tolls4 , 5 . . . . . . . . . . . . . . . . . . . . . . . . . . 9.4 0.65 L-EVER –Automobile service clubs4 , 5 . . . . . . . . . . . . . . . . . . . . . . 2.9 0.62 S-May 2012 2.8
Public transportation.. . . . . . . . . . . . . . . . . . . . . . . . . . . . . . . . . . . . . . 1.190 -1.5 -0.020 0.74 S-Oct.2009 -4.5Airline fare. . . . . . . . . . . . . . . . . . . . . . . . . . . . . . . . . . . . . . . . . . . . . . . 0.773 -3.0 -0.026 1.04 S-Oct.2009 -6.5Other intercity transportation. . . . . . . . . . . . . . . . . . . . . . . . . . 0.153 -1.7 -0.003 1.41 S-Mar.2012 -2.8
Intercity bus fare6 , 5 . . . . . . . . . . . . . . . . . . . . . . . . . . . . . . . . 2.2 0.72 S-Jan.2010 -0.5Intercity train fare6 , 5 . . . . . . . . . . . . . . . . . . . . . . . . . . . . . . . 3.0 2.70 L-Jun.2011 4.6Ship fare4 , 5 . . . . . . . . . . . . . . . . . . . . . . . . . . . . . . . . . . . . . . . . . -5.2 1.72 S-Nov.2009 -8.1
Intracity transportation. . . . . . . . . . . . . . . . . . . . . . . . . . . . . . . . . . 0.262 3.5 0.009 0.48 L-Dec.2011 4.3Intracity mass transit11 , 5 . . . . . . . . . . . . . . . . . . . . . . . . . . 3.3 1.48 L-Dec.2011 4.5
Recreation services11 . . . . . . . . . . . . . . . . . . . . . . . . . . . . . . . . . . . . . . . 3.728 3.3 0.122 0.50 S-Jun.2012 3.3Video and audio services11 . . . . . . . . . . . . . . . . . . . . . . . . . . . . . . 1.514 4.8 0.070 0.78 L-Jun.2012 4.9
Cable and satellite television and radio service13 .. . 1.403 5.3 0.070 0.83 L-Jul.2006 5.9Video discs and other media, including rental of
video and audio4 . . . . . . . . . . . . . . . . . . . . . . . . . . . . . . . . . . . . . 0.111 -0.5 0.000 3.13 S-May 2011 -0.6
See footnotes at end of table.

Table 7. Consumer Price Index for All Urban Consumers (CPI-U): U.S. city average, by expenditure category,August 2012, 12-month analysis table — Continued[1982-84=100, unless otherwise noted]
Expenditure category
Relativeimportance
Jul.2012
Twelve Month
Unadjustedpercentchange
Aug. 2011-Aug. 2012
Unadjustedeffect on All
ItemsAug. 2011-Aug. 20121
Standarderror,
median pricechange2
Largest (L) or Smallest (S)unadjusted change since:3
Date Percentchange
Video discs and other media4 , 5 . . . . . . . . . . . . . . . . . . -7.2 3.14 L-Jun.2012 -5.0Rental of video or audio discs and other media4 ,
5 . . . . . . . . . . . . . . . . . . . . . . . . . . . . . . . . . . . . . . . . . . . . . . . . . . . . . 5.3 4.48 S-Jun.2011 4.9Pet services including veterinary4 . . . . . . . . . . . . . . . . . . . . . . 0.410 2.8 0.011 1.14 S-Apr.2010 2.5
Pet services4 , 5 . . . . . . . . . . . . . . . . . . . . . . . . . . . . . . . . . . . . . . . . 3.0 1.05 – –Veterinarian services4 , 5 . . . . . . . . . . . . . . . . . . . . . . . . . . . . . . 2.6 1.50 S-Jun.2012 2.5
Photographers and film processing4 . . . . . . . . . . . . . . . . . . . 0.058 1.4 0.001 1.20 S-Oct.2010 1.3Photographer fees4 , 5 . . . . . . . . . . . . . . . . . . . . . . . . . . . . . . . . . 1.4 1.73 L-Apr.2012 1.8Film processing4 , 5 . . . . . . . . . . . . . . . . . . . . . . . . . . . . . . . . . . . . 1.2 1.08 S-Apr.2010 0.3
Other recreation services4 . . . . . . . . . . . . . . . . . . . . . . . . . . . . . . . 1.745 2.2 0.039 0.79 S-Jun.2012 2.0Club dues and fees for participant sports and
group exercises4 . . . . . . . . . . . . . . . . . . . . . . . . . . . . . . . . . . . . . 0.566 3.4 0.019 1.56 – –Admissions.. . . . . . . . . . . . . . . . . . . . . . . . . . . . . . . . . . . . . . . . . . . . . . 0.644 2.3 0.014 1.05 S-May 2012 0.6
Admission to movies, theaters, and concerts4 , 5
. . . . . . . . . . . . . . . . . . . . . . . . . . . . . . . . . . . . . . . . . . . . . . . . . . . . . . . . . . . . . . . . . . . . . . . . . . . . 2.0 1.24 S-May 2012 0.3Admission to sporting events4 , 5 . . . . . . . . . . . . . . . . . . 4.4 1.31 S-May 2012 2.4
Fees for lessons or instructions8 . . . . . . . . . . . . . . . . . . . . . 0.228 0.5 0.001 0.94 L-May 2012 0.5Education and communication services11 . . . . . . . . . . . . . . . . 6.141 1.9 0.111 0.26 S-Nov.2011 1.9
Tuition, other school fees, and childcare. . . . . . . . . . . . . . . 2.999 3.6 0.105 0.44 S-EVER –College tuition and fees. . . . . . . . . . . . . . . . . . . . . . . . . . . . . . . . 1.684 4.2 0.068 0.77 S-Dec.2010 4.1Elementary and high school tuition and fees. . . . . . . . 0.381 3.6 0.014 0.51 L-Jun.2012 3.6Child care and nursery school12 . . . . . . . . . . . . . . . . . . . . . 0.772 2.3 0.018 0.35 S-Jun.2012 2.3Technical and business school tuition and fees4 .. . 0.059 2.5 0.001 0.81 S-Jul.2007 2.3
Postage and delivery services4 . . . . . . . . . . . . . . . . . . . . . . . . . 0.149 3.7 0.005 0.29 – –Postage.. . . . . . . . . . . . . . . . . . . . . . . . . . . . . . . . . . . . . . . . . . . . . . . . . . 0.138 3.8 0.005 0.30 – –Delivery services4 . . . . . . . . . . . . . . . . . . . . . . . . . . . . . . . . . . . . . . 0.010 2.4 0.000 0.43 S-Dec.2009 1.6
Telephone services4 . . . . . . . . . . . . . . . . . . . . . . . . . . . . . . . . . . . . . . 2.397 0.2 0.005 0.33 S-Dec.2011 -0.3Wireless telephone services4 . . . . . . . . . . . . . . . . . . . . . . . . . 1.453 -1.3 -0.019 0.50 S-Dec.2011 -2.3Land-line telephone services11 . . . . . . . . . . . . . . . . . . . . . . . 0.944 2.4 0.024 0.36 L-Jun.2012 2.7
Internet services and electronic informationproviders4 . . . . . . . . . . . . . . . . . . . . . . . . . . . . . . . . . . . . . . . . . . . . . . . 0.581 -0.8 -0.004 0.77 S-Nov.2011 -0.9
Other personal services11 . . . . . . . . . . . . . . . . . . . . . . . . . . . . . . . . . . 1.712 2.5 0.042 0.40 – –Personal care services. . . . . . . . . . . . . . . . . . . . . . . . . . . . . . . . . . . . 0.629 1.8 0.011 0.47 L-Jun.2009 1.8
Haircuts and other personal care services4 . . . . . . . . 0.629 1.8 0.011 0.47 L-Jun.2009 1.8Miscellaneous personal services. . . . . . . . . . . . . . . . . . . . . . . . 1.083 2.9 0.031 0.46 S-May 2012 2.7
Legal services8 . . . . . . . . . . . . . . . . . . . . . . . . . . . . . . . . . . . . . . . . . 0.295 1.8 0.005 1.07 S-Feb.2012 1.7Funeral expenses8 . . . . . . . . . . . . . . . . . . . . . . . . . . . . . . . . . . . . . 0.158 1.5 0.002 0.45 S-EVER –Laundry and dry cleaning services4 . . . . . . . . . . . . . . . . . 0.239 2.2 0.005 0.51 L-Dec.2010 2.2Apparel services other than laundry and dry
cleaning4 . . . . . . . . . . . . . . . . . . . . . . . . . . . . . . . . . . . . . . . . . . . . . . 0.030 2.5 0.001 0.95 S-Apr.2011 2.4Financial services8 . . . . . . . . . . . . . . . . . . . . . . . . . . . . . . . . . . . . . 0.218 6.3 0.013 1.11 S-Jun.2012 6.1
Checking account and other bank services4 , 5
. . . . . . . . . . . . . . . . . . . . . . . . . . . . . . . . . . . . . . . . . . . . . . . . . . . . . . . . . . . . . . . . . . . . . . . . . . . . 7.4 1.54 L-Mar.2012 8.9Tax return preparation and other accounting
fees4 , 5 . . . . . . . . . . . . . . . . . . . . . . . . . . . . . . . . . . . . . . . . . . . . . 5.5 1.27 L-May 2012 6.4
Special aggregate indexes
All items less food.. . . . . . . . . . . . . . . . . . . . . . . . . . . . . . . . . . . . . . . . . . . . . . . . . . . 85.765 1.6 1.411 0.08 L-Apr.2012 2.2All items less shelter. . . . . . . . . . . . . . . . . . . . . . . . . . . . . . . . . . . . . . . . . . . . . . . . . 68.481 1.5 1.036 0.08 L-Apr.2012 2.3All items less food and shelter. . . . . . . . . . . . . . . . . . . . . . . . . . . . . . . . . . . . . . 54.246 1.4 0.755 0.10 L-Apr.2012 2.1All items less food, shelter, and energy. . . . . . . . . . . . . . . . . . . . . . . . . . . 44.397 1.8 0.790 0.11 S-May 2011 1.8All items less food, shelter, energy, and used cars and
trucks.. . . . . . . . . . . . . . . . . . . . . . . . . . . . . . . . . . . . . . . . . . . . . . . . . . . . . . . . . . . . . . . 42.415 1.9 0.811 0.12 S-Jul.2011 1.9All items less medical care. . . . . . . . . . . . . . . . . . . . . . . . . . . . . . . . . . . . . . . . . . 92.854 1.5 1.415 0.08 L-Jun.2012 1.5All items less energy.. . . . . . . . . . . . . . . . . . . . . . . . . . . . . . . . . . . . . . . . . . . . . . . . 90.151 1.9 1.727 0.08 S-May 2011 1.8Commodities. . . . . . . . . . . . . . . . . . . . . . . . . . . . . . . . . . . . . . . . . . . . . . . . . . . . . . . . . . 39.910 1.3 0.512 0.12 L-Apr.2012 2.6
See footnotes at end of table.

Table 7. Consumer Price Index for All Urban Consumers (CPI-U): U.S. city average, by expenditure category,August 2012, 12-month analysis table — Continued[1982-84=100, unless otherwise noted]
Expenditure category
Relativeimportance
Jul.2012
Twelve Month
Unadjustedpercentchange
Aug. 2011-Aug. 2012
Unadjustedeffect on All
ItemsAug. 2011-Aug. 20121
Standarderror,
median pricechange2
Largest (L) or Smallest (S)unadjusted change since:3
Date Percentchange
Commodities less food, energy, and used cars and trucks.. . 17.734 0.8 0.152 0.22 S-Apr.2011 0.4Commodities less food.. . . . . . . . . . . . . . . . . . . . . . . . . . . . . . . . . . . . . . . . . . . 25.674 1.0 0.231 0.17 L-Apr.2012 2.4Commodities less food and beverages. . . . . . . . . . . . . . . . . . . . . . . . . 24.725 0.9 0.216 0.18 L-Apr.2012 2.4
Services. . . . . . . . . . . . . . . . . . . . . . . . . . . . . . . . . . . . . . . . . . . . . . . . . . . . . . . . . . . . . . . 60.090 2.0 1.180 0.10 – –Services less rent of shelter15 . . . . . . . . . . . . . . . . . . . . . . . . . . . . . . . . . . . 28.921 1.9 0.535 0.13 S-May 2012 1.9Services less medical care services. . . . . . . . . . . . . . . . . . . . . . . . . . . . 54.675 1.8 0.963 0.10 – –
Durables. . . . . . . . . . . . . . . . . . . . . . . . . . . . . . . . . . . . . . . . . . . . . . . . . . . . . . . . . . . . . . . 8.950 -0.5 -0.052 0.18 S-Feb.2011 -0.5Nondurables.. . . . . . . . . . . . . . . . . . . . . . . . . . . . . . . . . . . . . . . . . . . . . . . . . . . . . . . . . . 30.960 1.8 0.564 0.15 L-Apr.2012 3.0
Nondurables less food. . . . . . . . . . . . . . . . . . . . . . . . . . . . . . . . . . . . . . . . . . . . 16.724 1.7 0.283 0.26 L-Apr.2012 3.0Nondurables less food and beverages.. . . . . . . . . . . . . . . . . . . . . . . . . 15.775 1.7 0.268 0.27 L-Apr.2012 3.1Nondurables less food, beverages, and apparel. . . . . . . . . . . . . . 12.299 1.7 0.209 0.16 L-Apr.2012 2.5Nondurables less food and apparel. . . . . . . . . . . . . . . . . . . . . . . . . . . . . 13.248 1.7 0.224 0.15 L-Apr.2012 2.5
Housing.. . . . . . . . . . . . . . . . . . . . . . . . . . . . . . . . . . . . . . . . . . . . . . . . . . . . . . . . . . . . . . . 40.979 1.4 0.592 0.11 – –Education and communication4 . . . . . . . . . . . . . . . . . . . . . . . . . . . . . . . . . . . . 6.736 1.5 0.100 0.25 S-Nov.2011 1.4
Education4 . . . . . . . . . . . . . . . . . . . . . . . . . . . . . . . . . . . . . . . . . . . . . . . . . . . . . . . . . 3.203 3.8 0.120 0.41 S-Jun.2011 3.8Communication4 . . . . . . . . . . . . . . . . . . . . . . . . . . . . . . . . . . . . . . . . . . . . . . . . . . . 3.533 -0.6 -0.020 0.27 S-Jan.2012 -0.6
Information and information processing4 . . . . . . . . . . . . . . . . . . . . 3.384 -0.7 -0.025 0.28 S-Jan.2012 -0.7Information technology, hardware and services17 . . . . . . . . . 0.987 -3.4 -0.030 0.59 S-Apr.2012 -3.4
Recreation4 . . . . . . . . . . . . . . . . . . . . . . . . . . . . . . . . . . . . . . . . . . . . . . . . . . . . . . . . . . . 6.030 1.2 0.071 0.35 S-May 2012 0.9Video and audio4 . . . . . . . . . . . . . . . . . . . . . . . . . . . . . . . . . . . . . . . . . . . . . . . . . 1.922 1.6 0.030 0.65 L-Jul.2006 1.8Pets, pet products and services4 . . . . . . . . . . . . . . . . . . . . . . . . . . . . . . . 1.098 1.5 0.016 0.62 S-Jan.2011 1.5Photography4 . . . . . . . . . . . . . . . . . . . . . . . . . . . . . . . . . . . . . . . . . . . . . . . . . . . . . . 0.113 -0.8 -0.001 0.94 S-May 2012 -1.2
Food and beverages.. . . . . . . . . . . . . . . . . . . . . . . . . . . . . . . . . . . . . . . . . . . . . . . . 15.185 2.0 0.296 0.14 S-Jan.2011 1.8Domestically produced farm food.. . . . . . . . . . . . . . . . . . . . . . . . . . . . . . . 7.229 1.7 0.122 0.21 S-Sep.2010 1.7
Other services. . . . . . . . . . . . . . . . . . . . . . . . . . . . . . . . . . . . . . . . . . . . . . . . . . . . . . . . 11.581 2.4 0.275 0.22 S-Feb.2012 2.4Apparel less footwear. . . . . . . . . . . . . . . . . . . . . . . . . . . . . . . . . . . . . . . . . . . . . . . . 2.800 1.4 0.041 1.12 S-May 2011 1.1Fuels and utilities. . . . . . . . . . . . . . . . . . . . . . . . . . . . . . . . . . . . . . . . . . . . . . . . . . . . . 5.383 -1.6 -0.079 0.27 L-Jun.2012 -1.4
Household energy. . . . . . . . . . . . . . . . . . . . . . . . . . . . . . . . . . . . . . . . . . . . . . . . . 4.201 -3.7 -0.149 0.31 L-Jun.2012 -3.3Medical care. . . . . . . . . . . . . . . . . . . . . . . . . . . . . . . . . . . . . . . . . . . . . . . . . . . . . . . . . . 7.146 4.1 0.277 0.18 – –Transportation.. . . . . . . . . . . . . . . . . . . . . . . . . . . . . . . . . . . . . . . . . . . . . . . . . . . . . . . . 17.077 1.4 0.217 0.15 L-Apr.2012 2.9
Private transportation.. . . . . . . . . . . . . . . . . . . . . . . . . . . . . . . . . . . . . . . . . . . . . 15.887 1.6 0.237 0.15 L-Apr.2012 3.0New and used motor vehicles4 . . . . . . . . . . . . . . . . . . . . . . . . . . . . . . . 5.679 -0.1 -0.015 0.21 S-Aug.2009 -0.1
Utilities and public transportation. . . . . . . . . . . . . . . . . . . . . . . . . . . . . . . . . . . 10.064 -0.2 -0.009 0.23 L-Jun.2012 0.5Household furnishings and operations.. . . . . . . . . . . . . . . . . . . . . . . . . . . . 4.077 0.4 0.015 0.29 S-Sep.2011 0.4
See footnotes at end of table.

Table 7. Consumer Price Index for All Urban Consumers (CPI-U): U.S. city average, by expenditure category,August 2012, 12-month analysis table — Continued[1982-84=100, unless otherwise noted]
Expenditure category
Relativeimportance
Jul.2012
Twelve Month
Unadjustedpercentchange
Aug. 2011-Aug. 2012
Unadjustedeffect on All
ItemsAug. 2011-Aug. 20121
Standarderror,
median pricechange2
Largest (L) or Smallest (S)unadjusted change since:3
Date Percentchange
Other goods and services. . . . . . . . . . . . . . . . . . . . . . . . . . . . . . . . . . . . . . . . . . . 3.372 2.4 0.079 0.33 L-Sep.2010 2.5Personal care. . . . . . . . . . . . . . . . . . . . . . . . . . . . . . . . . . . . . . . . . . . . . . . . . . . . . . 2.569 2.3 0.059 0.35 L-Feb.2009 2.4
1 The ’effect’ of an item category is a measure of that item’s contribution to the All items price change. For example, if the Food index had an effect of 0.40,and the All items index rose 1.2 percent, then the increase in food prices contributed 0.40 / 1.2, or 33.3 percent, to that All items increase. Said anotherway, had food prices been unchanged for that year the change in the All items index would have been 1.2 percent minus 0.40, or 0.8 percent. Effectscan be negative as well. For example, if the effect of food was a negative 0.1, and the All items index rose 0.5 percent, the All items index actually wouldhave been 0.1 percent higher (or 0.6 percent) had food prices been unchanged. Since food prices fell while prices overall were rising, the contributionof food to the All items price change was negative (in this case, -0.1 / 0.5, or minus 20 percent).
2 A statistic’s margin of error is often expressed as its point estimate plus or minus two standard errors. For example, if a CPI category rose 2.6 percent,and its standard error was 0.25 percent, the margin of error on this item’s 12-month percent change would be 2.6 percent, plus or minus 0.5 percent.
3 If the current 12-month percent change is greater than the previous published 12-month percent change, then this column identifies the closest priormonth with a 12-month percent change as (L)arge as or (L)arger than the current 12-month change. If the current 12-month percent change is smallerthan the previous published 12-month percent change, the most recent month with a change as (S)mall or (S)maller than the current month change isidentified. If the current and previous published 12-month percent changes are equal, a dash will appear. Standard numerical comparison is used. Forexample, 2.0% is greater than 0.6%, -4.4% is less than -2.0%, and -2.0% is less than 0.0%. Note that a (L)arger change can be a smaller decline, forexample, a -0.2% change is larger than a -0.4% change, but still represents a decline in the price index. Likewise, (S)maller changes can be increases,for example, a 0.6% change is smaller than 0.8%, but still represents an increase in the price index. In this context, a -0.2% change is considered to besmaller than a 0.0% change.
4 Indexes on a December 1997=100 base.5 Special indexes based on a substantially smaller sample. These series do not contribute to the all items index aggregation and therefore do not have
a relative importance or effect.6 Indexes on a December 2007=100 base.7 Indexes on a December 2005=100 base.8 Indexes on a December 1986=100 base.9 Indexes on a December 1993=100 base.10 This index series was calculated using a Laspeyres estimator. All other item stratum index series were calculated using a geometric means estimator.11 Indexes on a December 2009=100 base.12 Indexes on a December 1990=100 base.13 Indexes on a December 1983=100 base.14 Indexes on a December 2001=100 base.15 Indexes on a December 1982=100 base.16 Indexes on a December 1996=100 base.17 Indexes on a December 1988=100 base.
NOTE: Index applies to a month as a whole, not to any specific date.