Embed Size (px)
Citation preview

Bilge International Journal of Science and Technology Research Web : http://dergipark.gov.tr/bilgesci - E-mail : [email protected]
ISSN: 2587-0742 e-ISSN: 2587-1749
1(2), 46-58, 2017
Evaluation of Electric Field Pollution from 132 kVA Power Transmission Lines to Proximity of Infrastructures in Ibadan, Nigeria
R. A. Badru1*, K. P. Olorunyomi2, A. O. Salau3, O. I. Akinwale2, J. Alwadood1, and A. O. Atijosan1
Abstract: Electrical power transmission lines (PTL) generate electromagnetic field while carrying electrical energy from power generating stations to the electrical power distribution systems. Due to increase in population, infrastructure are being built close to or under the power lines; thus, violating the range of the tower setback. This exposes nearby residence to electric field pollution. In this paper, we present an evaluation of the electric field pollution from the 330/132kVA power transmission lines in Ibadan (Ido local government), Oyo state Nigeria. we measured the electric field of the power transmission line of the closest proximity to the nearest infrastructure using electromagnetic tester (model 3120-EN-00). Evaluation of spatial distance between the nearest infrastructure and the transmission lines was done by obtaining the spatial position of the transmission tower and the infrastructure using Global Positioning System (GPS) receiver (model GPSMAP 78 Series) satellite system. The sets of data obtained were processed in ARCGIS environment and the distance from the transmission tower to the nearest infrastructure was obtained. Also, the range between the tower with reference to a particular tower was obtained using analytical techniques. The ICNIRP standards were used to evaluate the result. The results showed that the electric field strength is below the standard limit. Regulatory bodies like the Power Holding Company of Nigeria (PHCN), Occupational Health and Safety Code (OHSC) and Lagos State Urban and Regional Planning (LSURP) regulations legislated a minimum setback for every infrastructures proximity to power lines. These regulations were used to evaluate infrastructures violating the rules. 12.5% of the infrastructures assecible complied with the PHCN regulation, 56.85% complied with the LSURP regulation and 78.12% compiled with the OHSC regulation.
Keywords: Electric power transmission, ARCGIS, ICNIRP, GPS, Safety distance, Electric field pollution, Occupational and General public exposure
1. Introduction
Electric power transmission and distribution is key to the successful transportation of electrical power from its generation site to the user locations. Electric power transmission lines generate eletric and magnetic field around the power lines used to transmit electric power. An electric field is the force that fills the space around any electric charge or group of charges which are caused by electrical forces (James, 2017). Electric fields are analogous
to magnetic fields resulting from forces acting upon magnetic substances or magnet poles (Semat and Katz, 1958). Electric fields (Efs) converge and diverge at points of electric charge and can be induced by time-varying magnetic fields. Efs exists whenever positive or negative electrical charges are present, they exert forces on other charges within the field. The higher the voltage, the stronger the electric field at any distance from the wire. The strength of an electric field is typically measured in volts per meter (V/m) or in kilovolt per meter
1Obafemi Awolowo University, Cooperative Information Network (COPINE), National Space Research and Development Agency, Ile-Ife, Nigeria. 2Obafemi Awolowo University, African Regional Centre for Space Science Education in English, Ile-Ife, Nigeria. 3Department of Electronic and Electrical Engineering, Obafemi Awolowo University, Faculty of Technology, Ile-Ife, Nigeria. *Corresponding author (İletişim yazarı): [email protected]
Citation (Atıf): Badru, R.A., Olorunyomi, K.P., Salau, A.O., Akinwale, O.I., Alwadood, J., Atijosan, A.O. (2017). Evaluation of Electric Field Pollution from 132 kVA Power Transmission Lines to Proximity of Infrastructures in Ibadan, Nigeria. Bilge International Journal of Science and Technology Research, 1(2): 46-58.
46

Bilge International Journal of Science and Technology Research 2017, 1(2): 46-58
(kV/m) (Glover et al., 2012). Increase in population and development within the cities have made people to build houses, workshops, religious centre, schools and farms, close to or under power transmission lines. The development of rural areas to urban communities has social and environmental impact; the growth of urban populations and associated industrialization has resulted in a range of detrimental and often de-humanizing outcomes (Baker, 1974; Olamiju and Oyinloye, 2015). The electric field generated around a wire by the flow of current has adverse biological effects on the human neurological system, causing cardiovascular disorders, low sperm counts and many other effects on workers who regularly service the lines (Aliyu and Ali, 2011; Aliyu et al., 2012). Also, these adverse effects affect people who stay for long periods without shielding near/under power transmission lines. There are simple ways to reduce human exposure. The effects of Electric fields decrease rapidly as human beings move away from the source. This means that increasing the distance between human beings and a source of extremely low frequencies (ELFs) which can be generated from power lines or electrical appliances will easily reduce the level of exposure to ELFs. One of the best ways to reduce exposure is to spend less time close to large sources of ELFs such as places near or under high-voltage transmission lines (hydro corridors) and transformers (Anderson, 1993).
2. Related Work
Several studies have been carried out on the effects/dangers of electric field pollution generated from power transmission lines on lives and property. This section gives an overview of related works in this area. Petkovic et al. (2006) worked on the effect of the electric component of an electromagnetic field of 50 Hz, originating from over ground 110 kV power line, on humans in its immediate vicinity. In their paper, the electric field which penetrates the human body was calculated with the help of a human model. This model, contained blocks which represent different human organs or body parts (e.g. brain, lungs, digestive organs, etc.). Their response to electromagnetic features such as conductivity, electric and magnetic permittivity was obtained. In this case, the distribution of the electric field surrounding humans is given, as well as the values of the field which penetrates humans. In evaluating their results, a comparison was made between calculated values and the values obtained through the usage of adequate software solutions. Aliyu et
al. (2012) worked on the Analysis of Electromagnetic Pollution due to High Voltage Transmission Lines. The research work examined the field pollution from 132kV and 330kV lines in Bauchi/Gombo areas in Nigeria as the case study. The evaluation was based on the safety limits recommendations of ICNIRP. When the measurements were being carried out, Tri-field meter was used to measure the fields in the vicinity of the lines with horizontal distance ranging from 0 – 450 m and vertical distance of 1.5m. In theassessment, general public and occupational exposure levels from the power lines were sampled. For the general public, the highest magnetic flux density and electric field strength measured is 45 mG and 130 V/m which is 4.5 % and 2.6 % of the CNIRP, 1998 exposure limit. The highest magnetic flux density and electric field strength measured is 100 mG and 130 V/m respectively which correspond to 2 % and 1.3 % of the ICNIRP (1998) exposure limit for the occupational worker. The result showed that the measured fields are within the required safety limits.
Table 1: ICNIRP (1998, 2010) and Council for European Union (2004) exposure guideline.
Exposure limits
Magnetic Field (μT)
Electric Field (V/m)
Public 100 5000 Occupational 500 10000
A. Electrical power transmission lines
Electrical power transmission lines are wired conductors that carry electric power from generating plants to the substations that deliver power to customers.
B. Interaction of human body with electric and magnetic fields of power lines
Electric and magnetic fields generated by electric power transmission lines are harmeful to the human body. Expose to these fields cause damages to the body tissues. For the electric field generated, Ohm’s Law relates the current density (J) and electric field (E) (ICNIRP, 1998) as shown in equation (1).
𝐽𝐽 = 𝜎𝜎𝜎𝜎 (1)
Rachedi et al. (2014) studied the behavior of the of electric field exposure on human beings. They observed that at certain distances human are mostly
47
Bilge International Journal of Science and Technology Research 2017, 1(2): 46-58
likely to experience these health treats: the ground (0 m), exposure of the heart (1, 5m) and brain exposure (1.8m).
3. Material and Methods
In this section we present the materials and methods used to carry out this work.
A. Satellite imagery for the study area
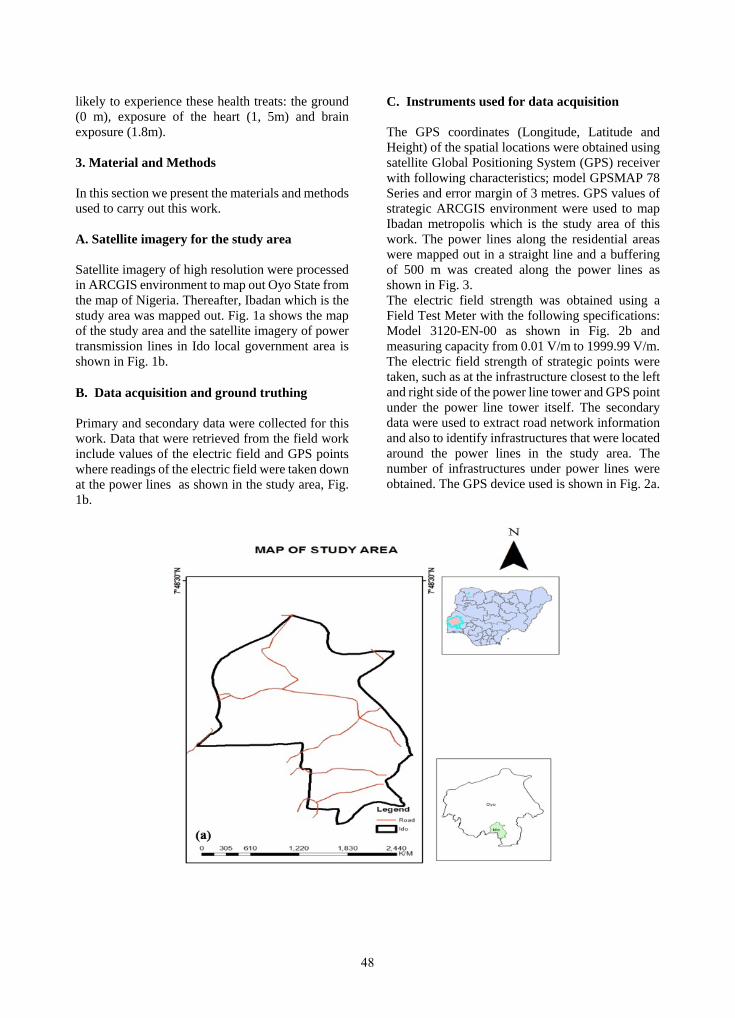
Satellite imagery of high resolution were processed in ARCGIS environment to map out Oyo State from the map of Nigeria. Thereafter, Ibadan which is the study area was mapped out. Fig. 1a shows the map of the study area and the satellite imagery of power transmission lines in Ido local government area is shown in Fig. 1b.
B. Data acquisition and ground truthing
Primary and secondary data were collected for this work. Data that were retrieved from the field work include values of the electric field and GPS points where readings of the electric field were taken down at the power lines as shown in the study area, Fig. 1b.
C. Instruments used for data acquisition
The GPS coordinates (Longitude, Latitude and Height) of the spatial locations were obtained using satellite Global Positioning System (GPS) receiver with following characteristics; model GPSMAP 78 Series and error margin of 3 metres. GPS values of strategic ARCGIS environment were used to map Ibadan metropolis which is the study area of this work. The power lines along the residential areas were mapped out in a straight line and a buffering of 500 m was created along the power lines as shown in Fig. 3. The electric field strength was obtained using a Field Test Meter with the following specifications: Model 3120-EN-00 as shown in Fig. 2b and measuring capacity from 0.01 V/m to 1999.99 V/m. The electric field strength of strategic points were taken, such as at the infrastructure closest to the left and right side of the power line tower and GPS point under the power line tower itself. The secondary data were used to extract road network information and also to identify infrastructures that were located around the power lines in the study area. The number of infrastructures under power lines were obtained. The GPS device used is shown in Fig. 2a.
48
Bilge International Journal of Science and Technology Research 2017, 1(2): 46-58
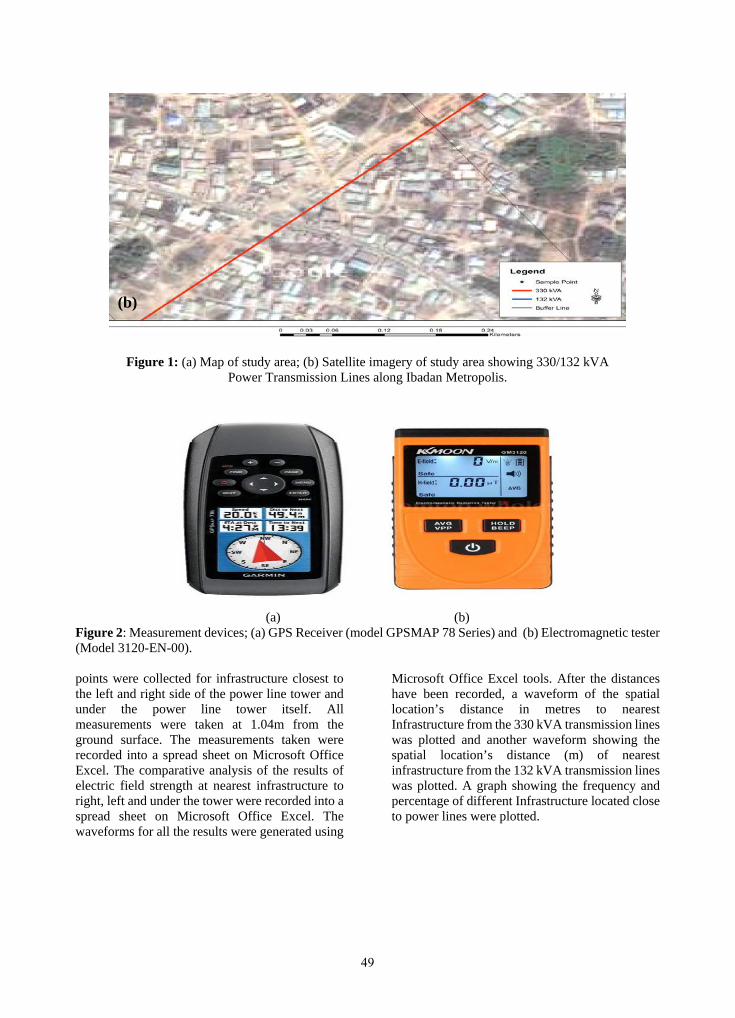
Figure 1: (a) Map of study area; (b) Satellite imagery of study area showing 330/132 kVA Power Transmission Lines along Ibadan Metropolis.
(a) (b) Figure 2: Measurement devices; (a) GPS Receiver (model GPSMAP 78 Series) and (b) Electromagnetic tester (Model 3120-EN-00).
points were collected for infrastructure closest to the left and right side of the power line tower and under the power line tower itself. All measurements were taken at 1.04m from the ground surface. The measurements taken were recorded into a spread sheet on Microsoft Office Excel. The comparative analysis of the results of electric field strength at nearest infrastructure to right, left and under the tower were recorded into a spread sheet on Microsoft Office Excel. The waveforms for all the results were generated using
Microsoft Office Excel tools. After the distances have been recorded, a waveform of the spatial location’s distance in metres to nearest Infrastructure from the 330 kVA transmission lines was plotted and another waveform showing the spatial location’s distance (m) of nearest infrastructure from the 132 kVA transmission lines was plotted. A graph showing the frequency and percentage of different Infrastructure located close to power lines were plotted.
(b)
49

Bilge International Journal of Science and Technology Research 2017, 1(2): 46-58
Figure 3: Buffering at 500 m along Ibadan Metropolis.
D. Measurement of electric field from transmission lines to infrastructure
The measurement of electric field strength under the transmission lines were taken with the electromagnetic tester, while that of the left and right side of the transmission line were taken with the use of gauss meter, and the corresponding GPS points of the tower were recorded. All measurements were taken at 1.04m from the ground surface.
The measurements taken were recorded into a spread sheet on Microsoft Office Excel. The comparative analysis of the results of electric field strength at nearest infrastructure to right, left and under the tower were recorded into a spread sheet on Microsoft Office Excel. The waveforms for all the results were generated using Microsoft Office Excel tools. After the distances have been recorded, a waveform of the spatial location’s distance in metres to nearest Infrastructure from the 330 kVA transmission lines was plotted and another waveform showing the spatial location’s distance (m) of nearest infrastructure from the 132 kVA transmission lines was plotted. A graph showing the frequency and percentage of different Infrastructure located close to power lines were plotted. The range of each point was calculated making the first GPS value where the reading started as the reference point (0 Ref. pt).
The range R was obtained using the equation (2):
𝑅𝑅2 = (𝑥𝑥𝐴𝐴 − 𝑥𝑥𝐵𝐵)2 + (𝑦𝑦𝐴𝐴 − 𝑦𝑦𝐵𝐵)2 + (𝑧𝑧𝐴𝐴 − 𝑧𝑧𝐵𝐵)2 (2)
The ranges of each point were calculated with equation 3.1 using the first GPS value, where the reading started as the reference point. Therefore, from Table 4.1, 𝑥𝑥𝐴𝐴 = 591775, 𝑦𝑦𝐴𝐴 = 822236,𝑧𝑧𝐵𝐵 = 242. where A and B represent two points in the rectangular coordinate system and 𝑥𝑥, 𝑦𝑦 and 𝑧𝑧 represent the latitude, longitude and altitude (height) of the points. The measurements were recorded into a spread sheet on Microsoft Office Excel. Afterwards, waveforms were generated from the results on the table using Microsoft Office Excel tools.
E. Comparative analysis of the electric field based on standards and regulations
There are different regulatory standards on limits of human exposure to electric field resulting to the guidelines which state the minimum distance which an infrastructure can be located close to a power lines. The results of the electric field experienced were obtained and a comparative analysis of all the measurement of electric field strength recorded around the power line based on the guidelines of the Power Holding Company of Nigeria (PHCN), Lagos State Urban and Regional Planning (LSURP), Occupational Health and Safety Code (OHSC) and International Commission on Non-Ionizing Radiation Protection guidelines (ICNIRP) was made. Furthermore, the waveforms to show the comparison were plotted.
50

Bilge International Journal of Science and Technology Research 2017, 1(2): 46-58
Table 2: Percentage of compliance to regulations and standards.
S/N Organisation
Power Transmission
Rating
Regulation and
Standards Compliance
1. PHCN 330kVA 50 m pathway proximity 12.5% 2. LSURP 330kVA 22.5m pathway proximity 56.85% 3. OHSC 230kVA, 500kVA 5 – 7 m pathway proximity 78.12%
Table 3: Infrastructures under power lines.
S/N Infrastructure Under Lines
Left to Lines
Right to Lines Frequency Percentage
1 Workshop/Shop 4 4 5 13 27.1 2 Church/Mosque 1 2 3 6 12.5 3 Crop Farm 1 0 0 1 2.1 4 House 0 12 11 23 47.9 5 Block Industry 2 0 1 3 6.2 6 School 0 0 2 2 4.2
48 100%
Table 4: Results of electric field under transmission tower.
Point on Ground surface
Electric field @ Infrastructure HT (V/m)
Values of GPS @Towers Range (m)
RUT(m) XUT (N) Latitude
YUT(E) Longitude
ZUT(m) Height
1 1680 591775 822236 242 0(Ref. Pt) 2 707 591517 822221 225 258.99 3 2000 591009 822217 206 767.08 4 2000 590562 822114 216 1219.4 5 2000 590159 822086 202 1623.44 6 2000 593186 821522 218 1581.55 7 2000 593292 821047 220 1927.44 8 2000 593368 820732 223 2190.9 9 2000 593470 820286 204 2583.71
10 2000 592986 822370 207 1218.89 11 2000 594308 823779 210 2958.56 12 2000 594061 823510 200 2617.37 13 2000 593667 823099 207 2079.82 14 2000 593494 822910 225 1846.49 15 2000 593221 822604 216 1492.32 16 934 595341 819790 206 4324.42 17 679 595520 819955 208 4385.1 18 48 595817 820208 193 4522.49 19 2000 596019 820390 204 4628.25 20 1070 596215 820563 207 4744.87
51
Bilge International Journal of Science and Technology Research 2017, 1(2): 46-58
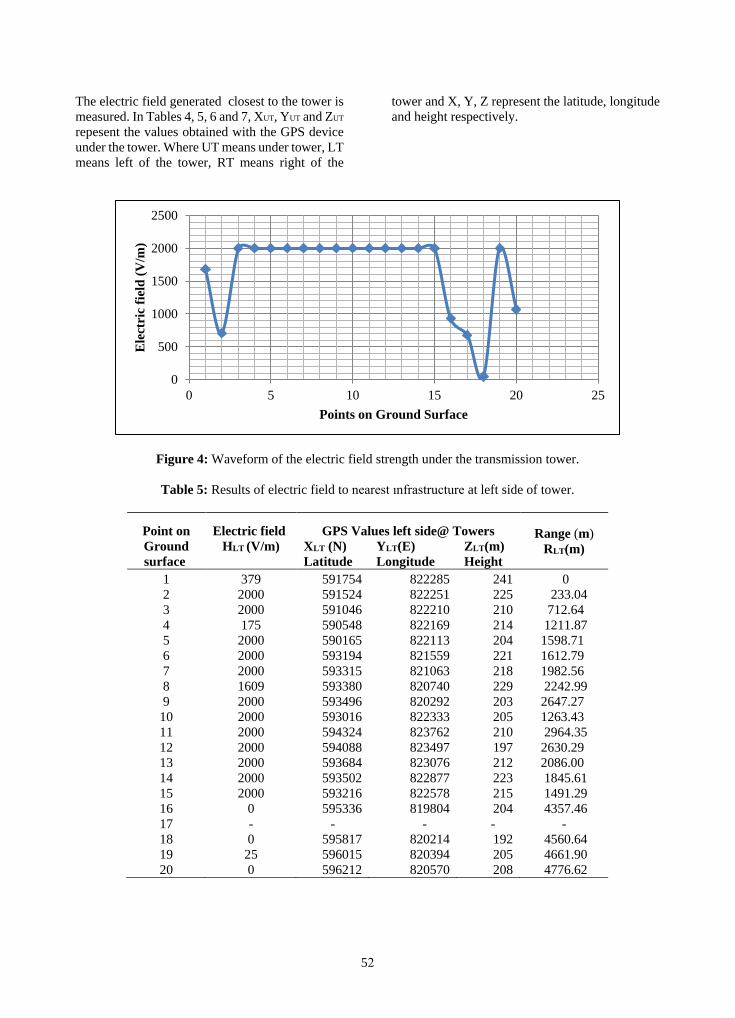
The electric field generated closest to the tower is measured. In Tables 4, 5, 6 and 7, XUT, YUT and ZUT repesent the values obtained with the GPS device under the tower. Where UT means under tower, LT means left of the tower, RT means right of the
tower and X, Y, Z represent the latitude, longitude and height respectively.
Figure 4: Waveform of the electric field strength under the transmission tower.
Table 5: Results of electric field to nearest ınfrastructure at left side of tower.
Point on Ground surface
Electric field HLT (V/m)
GPS Values left side@ Towers Range (m) RLT(m) XLT (N)
Latitude YLT(E) Longitude
ZLT(m) Height
1 379 591754 822285 241 0 2 2000 591524 822251 225 233.04 3 2000 591046 822210 210 712.64 4 175 590548 822169 214 1211.87 5 2000 590165 822113 204 1598.71 6 2000 593194 821559 221 1612.79 7 2000 593315 821063 218 1982.56 8 1609 593380 820740 229 2242.99 9 2000 593496 820292 203 2647.27
10 2000 593016 822333 205 1263.43 11 2000 594324 823762 210 2964.35 12 2000 594088 823497 197 2630.29 13 2000 593684 823076 212 2086.00 14 2000 593502 822877 223 1845.61 15 2000 593216 822578 215 1491.29 16 0 595336 819804 204 4357.46 17 - - - - - 18 0 595817 820214 192 4560.64 19 25 596015 820394 205 4661.90 20 0 596212 820570 208 4776.62
0
500
1000
1500
2000
2500
0 5 10 15 20 25
Ele
ctri
c fie
ld (V
/m)
Points on Ground Surface
52
Bilge International Journal of Science and Technology Research 2017, 1(2): 46-58
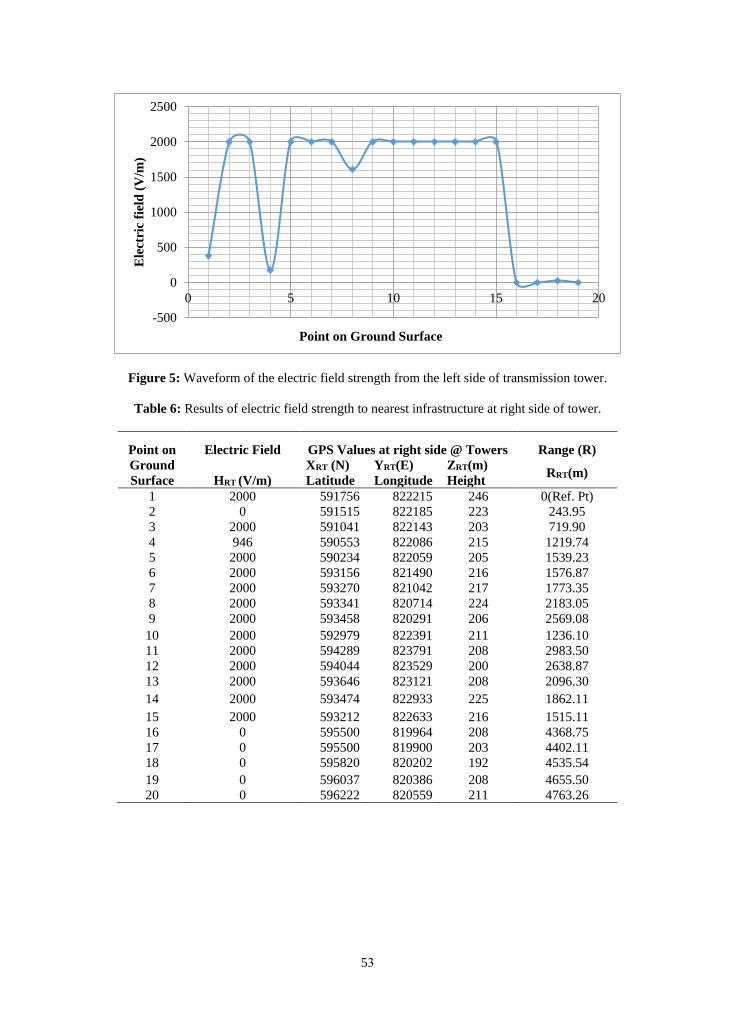
Figure 5: Waveform of the electric field strength from the left side of transmission tower.
Table 6: Results of electric field strength to nearest infrastructure at right side of tower.
Point on Ground Surface
Electric Field GPS Values at right side @ Towers Range (R)
HRT (V/m) XRT (N) Latitude
YRT(E) Longitude
ZRT(m) Height RRT(m)
1 2000 591756 822215 246 0(Ref. Pt) 2 0 591515 822185 223 243.95 3 2000 591041 822143 203 719.90 4 946 590553 822086 215 1219.74 5 2000 590234 822059 205 1539.23 6 2000 593156 821490 216 1576.87 7 2000 593270 821042 217 1773.35 8 2000 593341 820714 224 2183.05 9 2000 593458 820291 206 2569.08
10 2000 592979 822391 211 1236.10 11 2000 594289 823791 208 2983.50 12 2000 594044 823529 200 2638.87 13 2000 593646 823121 208 2096.30 14 2000 593474 822933 225 1862.11 15 2000 593212 822633 216 1515.11 16 0 595500 819964 208 4368.75 17 0 595500 819900 203 4402.11 18 0 595820 820202 192 4535.54 19 0 596037 820386 208 4655.50 20 0 596222 820559 211 4763.26
-500
0
500
1000
1500
2000
2500
0 5 10 15 20
Ele
ctri
c fie
ld (V
/m)
Point on Ground Surface
53
Bilge International Journal of Science and Technology Research 2017, 1(2): 46-58
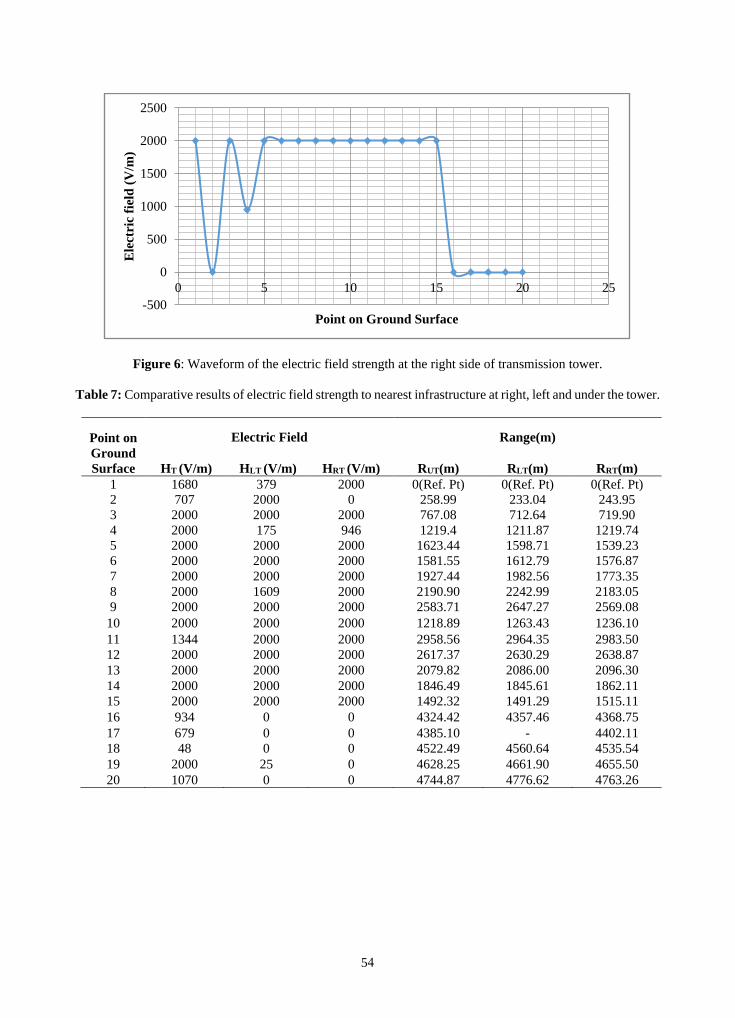
Figure 6: Waveform of the electric field strength at the right side of transmission tower.
Table 7: Comparative results of electric field strength to nearest infrastructure at right, left and under the tower.
Point on Ground Surface
Electric Field Range(m)
HT (V/m) HLT (V/m) HRT (V/m) RUT(m) RLT(m) RRT(m) 1 1680 379 2000 0(Ref. Pt) 0(Ref. Pt) 0(Ref. Pt) 2 707 2000 0 258.99 233.04 243.95 3 2000 2000 2000 767.08 712.64 719.90 4 2000 175 946 1219.4 1211.87 1219.74 5 2000 2000 2000 1623.44 1598.71 1539.23 6 2000 2000 2000 1581.55 1612.79 1576.87 7 2000 2000 2000 1927.44 1982.56 1773.35 8 2000 1609 2000 2190.90 2242.99 2183.05 9 2000 2000 2000 2583.71 2647.27 2569.08
10 2000 2000 2000 1218.89 1263.43 1236.10 11 1344 2000 2000 2958.56 2964.35 2983.50 12 2000 2000 2000 2617.37 2630.29 2638.87 13 2000 2000 2000 2079.82 2086.00 2096.30 14 2000 2000 2000 1846.49 1845.61 1862.11 15 2000 2000 2000 1492.32 1491.29 1515.11 16 934 0 0 4324.42 4357.46 4368.75 17 679 0 0 4385.10 - 4402.11 18 48 0 0 4522.49 4560.64 4535.54 19 2000 25 0 4628.25 4661.90 4655.50 20 1070 0 0 4744.87 4776.62 4763.26
-500
0
500
1000
1500
2000
2500
0 5 10 15 20 25
Ele
ctri
c fie
ld (V
/m)
Point on Ground Surface
54
Bilge International Journal of Science and Technology Research 2017, 1(2): 46-58
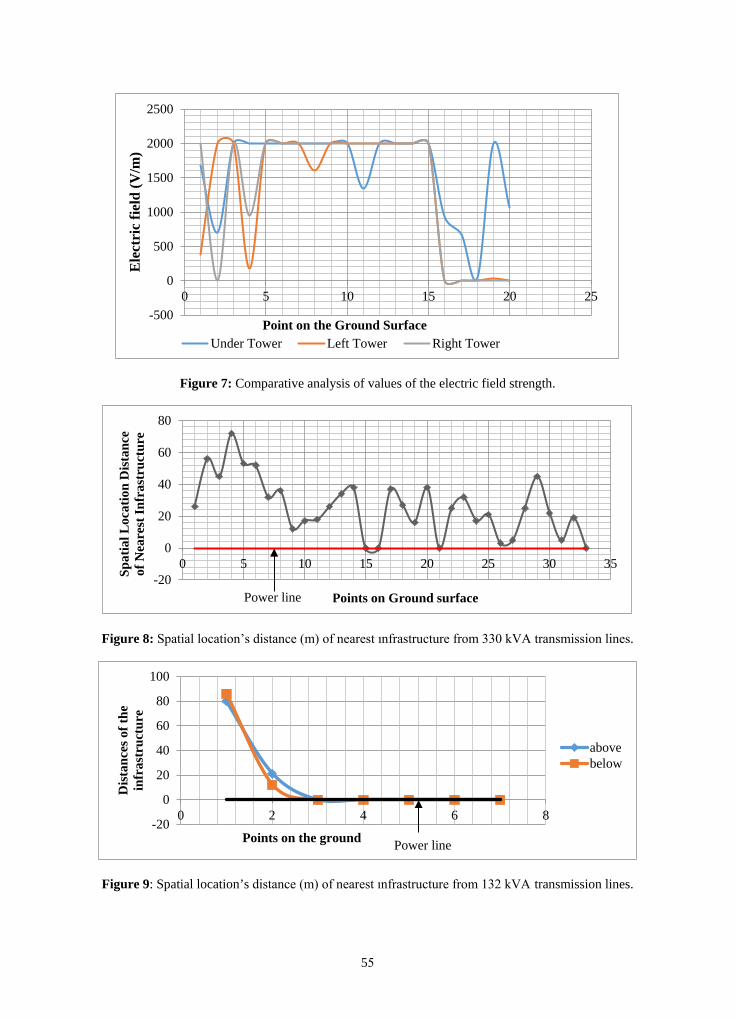
Figure 7: Comparative analysis of values of the electric field strength.
Figure 8: Spatial location’s distance (m) of nearest ınfrastructure from 330 kVA transmission lines.
Figure 9: Spatial location’s distance (m) of nearest ınfrastructure from 132 kVA transmission lines.
-500
0
500
1000
1500
2000
2500
0 5 10 15 20 25
Ele
ctri
c fie
ld (V
/m)
Point on the Ground SurfaceUnder Tower Left Tower Right Tower
-20
0
20
40
60
80
0 5 10 15 20 25 30 35
Spat
ial L
ocat
ion
Dis
tanc
e of
Nea
rest
Infr
astr
uctu
re
Points on Ground surface
-20
0
20
40
60
80
100
0 2 4 6 8
Dis
tanc
es o
f the
in
fras
truc
ture
Points on the ground
abovebelow
Power line
Power line
55
Bilge International Journal of Science and Technology Research 2017, 1(2): 46-58
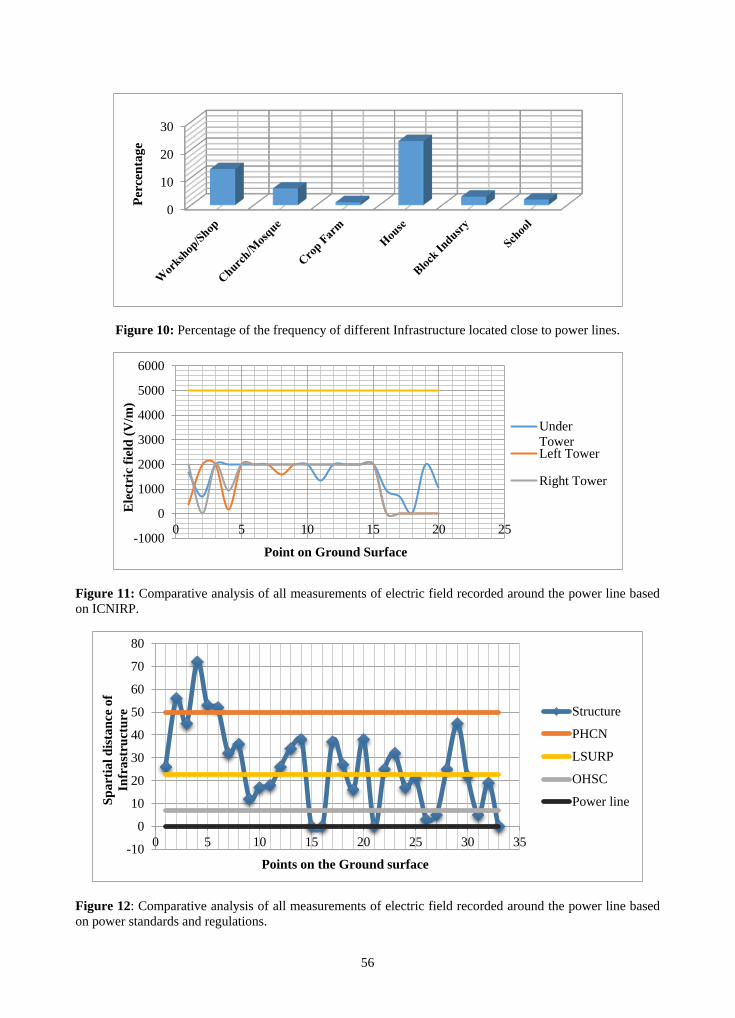
Figure 10: Percentage of the frequency of different Infrastructure located close to power lines.
Figure 11: Comparative analysis of all measurements of electric field recorded around the power line based on ICNIRP.
Figure 12: Comparative analysis of all measurements of electric field recorded around the power line based on power standards and regulations.
0
10
20
30Pe
rcen
tage
-1000
0
1000
2000
3000
4000
5000
6000
0 5 10 15 20 25
Ele
ctri
c fie
ld (V
/m)
Point on Ground Surface
UnderTowerLeft Tower
Right Tower
-10
0
10
20
30
40
50
60
70
80
0 5 10 15 20 25 30 35
Spar
tial d
ista
nce
of
Infr
astr
uctu
re
Points on the Ground surface
Structure
PHCN
LSURP
OHSC
Power line
56
4. Results and Discussion
The results obtained from the experiment is shown in Tables (1-7), from the waveform plotted for the electric field strength values recorded under the tower at the left and right side of the tower, it was observed that the electric field strength is approximately 0 V/m at 132 kVA and higher at 330 kVA. Meanwhile, more infrastructure particularly residential houses are located directly under the 132 kVA transmission power lines. Also, in comparison to the guidelines set by International Commission for Non-Ionizing Radiation Protection (ICNIRP) on the exposure limit of human being to electric field, the results clearly showed that the values are still very low and in the safe limits of exposure. Lastly, it was observed that many infrastructures violate the minimum distance given for buildings to be situated near the electric power line. The results obtained within the study area indicate that 12.5% infrastructure complied with the PHCN regulations, 56.85% compiled with Lagos State Urban and Regional Planning regulations and 78.12% compiled with Occupational Health and Safety Code (OHSC) regulation. The summary of the data collected is shown in Tables 4, 5, 6 and 7 respectively. The percentage of compliance of our obtained results to the regulations and standards of the PHCN, LSURP and OHSC are shown in Table 2, the data obtained for the electric field under the transmission tower is shown in Table 4 and its waveform is shown in Fig. 4, while that of the electric field of the nearest infrastructure to left side of tower is shown in Table 5 and its waveform is shown in Fig. 5. The electric field strength of the nearest infrastructure to right side of tower is shown in Table 6 and the waveform is shown in Fig. 6. Comparison of the results of electric field strength at nearest infrastructure to right, Left and Under the Tower is given in Table 7and the waveform is shown in Fig. 7. The Spatial Location’s Distance (m) of Nearest Infrastructure from the 330 kVA Transmission Lines and from 132kVA are shown in Fig. 8 and Fig. 9 respectively. The number of infrastructures under power lines is shown in Table 3. The plot of the percentage of the frequency ofdifferent Infrastructure located close to power lines is shown in Fig. 10 obtained from the result of Table 3. Comparative analysis of all the measurement ofelectric field recorded around the Power line based on Power Standard and Regulations such as PHCN, LSURP and OHSC is represented in Fig. 12 while the plot of the comparison based on the ICNIRP standard is shown in Fig. 11.
5. Conclusions
In this paper, the magnitude of electrical field pollution in the vicinity of 132 kVA and 330 kVA have been analyzed for the general public and also the occupational exposure using ICNIRP, 1998 standard and the regulations of the PHCN, LSURP and OHSC. The analysis showed that 12.5% of the infrastructure complied with the PHCN regulations, 56.85% compiled with Lagos State Urban and Regional Planning (LSURP) regulation and 78.12% compiled with Occupational Health and Safety Code (OHSC) regulation. These results are compared with the ICNIRP standard.
Acknowledgements
Authors wish to acknowledge the support provided by the Department of Electronic and Electrical Engineering and the National Space Research and Development Agency, Obafemi Awolowo University, Ile-Ife, Osun State, Nigeria.
References
Aliyu, O. I. and Ali, H. (2011). Analysis of Magnetic Field Pollution due to 330kVA and 132kVA Transmission Lines, Abubakar Tafawa Balewa University Bauchi, Nigeria Journal of Technology and Educational Research, 4(20), 87-93.
Aliyu, O., Maina, I. and Ali, H. (2012). Analysis of Electromagnetic Pollution due to High Voltage Transmission Lines, Journal of Energy Technologies and Policy, 2(7). 1-10.
Anderson, J. G. and Short, T. A. (1993). Algorithms for Calculating of Lightning İnduced Voltages on Distribution Lines, in IEEE Transactions on Power Delivery, 8(3), 1217-1225.
Baker, P. H. (1974). Urbanization and Political Change: The Politics of Lagos, London: University of California Press, 1917-1967.
Glover, J. D., Sarma M. S. and Overbye, T. (2012). Power System Analysis and Design, 5th Edition, Scamford, USA: Cengage Learning, 850p.
ICNIRP (1998): Guidelines for Limiting Exposure to Time-varying Electric, Magnetic, and
57
Bilge International Journal of Science and Technology Research 2017, 1(2): 46-58
Electromagnetic Fields ‘’Quantities and Units’’ p. 495.
James, D. D. (2017). A Gestalt Aether Theory on the Nature of Light and Related Phenomena: A New Physics, Educreation Publishing, p. 350.
Olamiju, I. O. and Oyinloye, M. A. (2015). Characteristics and Vulnerability of Houses under Overhead High-Tension Powerline in Akure, Nigeria, World Environment, 5(3), 121-133.
Petkovic, D. M., Krstic, D. D. and Stankovic, V. B. (2006). The Effect of Electric Field on Humans in the Immediate Vicinity of 110 kVA Power Lines. Facta Universitatis-Series: Working and Living Environmental Protection, 3(1), 63-72.
Rachedi, B. A., Babouri, A. and Berrouk, F. (2014). A Study of Electromagnetic Field Generated by High Voltage Lines using COMSOL MULTIPHYSICS, International Conference on Electrical Sciences and Technologies in Maghreb (CISTEM), Tunis, pp. 1-5.
Semat, H. and Katz, R. (1958). Physics, Chapter 29: The Magnetic Field, Robert Katz Publications, p. 153.
58