Embed Size (px)
Citation preview

CASE REPORT Open Access
Translocational renal cell carcinoma(t(6;11)(p21;q12) with transcription factorEB (TFEB) amplification and an integratedprecision approach: a case reportWolfgang Lilleby1*, Ljiljana Vlatkovic2, Leonardo A. Meza-Zepeda4,5, Mona-Elisabeth Revheim3 and Eivind Hovig1,6,7
Abstract
Introduction: Renal cell carcinoma with the distinct type of t(6;11)(p21;q12) translocation (transcription factor EB)is a rare neoplasm. In the present case study, we show for the first time an autophagy signature in a patient withtranscription factor EB renal cell carcinoma. We attempted to characterize the mutational and expressional featuresof a t(6;11)(p21;q12) renal cell carcinoma, in an effort to address the potential for molecular guidance of personalizedmedical decision for a case in this renal cell carcinoma category.
Case presentation: We report the case of a 42-year-old white man who had a late relapse of his renal cell carcinoma.The first diagnosis of clear cell renal carcinoma was derived from a histological examination; analyzing the metastasisand going back to the primary tumor it turned out to be a transcription factor EB-renal cell carcinoma. The treatmentplan included local radiation and systemic therapy. As part of the multimodal approach, tumor samples for geneticassessment were obtained. However, there is no recommended standard therapy for transcription factor EB-renal cellcarcinoma. Despite four lines of medical treatment with targeted therapy and one checkpoint inhibitor, all attempts toprolong the patient’s survival failed.
Conclusions: During the course of this unusual disease, we gained insights which, to the best of our knowledge, wereunknown before in the expression of the gene signature linked to autophagy. This might in part explain the resistanceto conventional targeted therapy acknowledged in our patient.
Keywords: Autophagy, Gene signature, Translocation renal cell carcinoma
IntroductionThe translocation involves on chromosome 6 the MITFtranscription factor family member transcription factorEB (TFEB), and on chromosome 11 the metastasis-associated lung adenocarcinoma transcript 1 (MALAT1).It has previously been shown that the TFEB transcriptionfactor is involved in the regulation of autophagy (see [1]for a review of the role of TFEB in this setting). Sardielloet al. defined an autophagy gene network regulatinglysosomal biogenesis and function through a systematicstudy of TFEB upregulation [2]. Indirectly, these features
can be observed immunohistochemically when tumorcells express cathepsin K in the cytoplasm [3]. This is aconsequence of the dysregulation induced by the trans-location, as TFEB controls cathepsin K expression. TFEBprotein is highly expressed in osteoclasts and TFEB islinked to RANKL activity [4].Among the published cases of this pathologic trans-
location variant, it appears that the therapeutic targetsagainst common renal cell carcinoma (RCC) may not beeffective against translocation type RCC, possibly due todistinct molecular alterations of these carcinomas [5].
Case presentationA 42-year-old white man had a history of kidney cancerfrom 2005. At that time, his right kidney was removed,
* Correspondence: [email protected] of Oncology, Oslo University Hospital, Nydalen, Postboks49500424 Oslo, NorwayFull list of author information is available at the end of the article
JOURNAL OF MEDICALCASE REPORTS
© 2015 Lilleby et al. Open Access This article is distributed under the terms of the Creative Commons Attribution 4.0International License (http://creativecommons.org/licenses/by/4.0/), which permits unrestricted use, distribution, andreproduction in any medium, provided you give appropriate credit to the original author(s) and the source, provide a link tothe Creative Commons license, and indicate if changes were made. The Creative Commons Public Domain Dedication waiver(http://creativecommons.org/publicdomain/zero/1.0/) applies to the data made available in this article, unless otherwise stated.
Lilleby et al. Journal of Medical Case Reports (2015) 9:281 DOI 10.1186/s13256-015-0749-7
and RCC was concluded on the basis of histology. Thedisease was staged as T3apN0M0 (TNM-Union forInternational Cancer Control, TNM-UICC, 2010). Thecancer was regarded as localized and no further investi-gation was undertaken at the time. In the winter of2013, the patient consulted his general practitioner forincreasing right-sided lateral chest pain. Computed tom-ography (CT) of his thorax revealed a lateral massdestructing his third rib, without penetrating throughthe pleural cavity. Several biopsies were obtained andthe tumor was confirmed as clear cell RCC. However,the pathologist responsible had doubts about the correcthistology and consulted experts in the field for a secondopinion abroad. Techniques including Sanger sequencingof the candidate translocation region and fluorescence insitu hybridization (FISH) confirmed a translocation in-cluding TFEB (t6;11), which is diagnostic of RCC. Im-munohistochemistry was positive for cathepsin K andMelan-A, which supported the diagnosis.Further investigation of the patient with magnetic res-
onance imaging (MRI; Fig. 1) of his vertebral columnshowed small lesions in his lower lumbar spine, suspi-cious of tumor spreading to his skeleton. This clinicalpicture, and the first immunohistochemical resultsshowing intensive staining of cathepsin K, pointed todysfunctional activity in osteoclasts, and linked thera-peutic choices to autophagy and metabolism. He was re-ferred to surgical resection of the part of his chest wallafflicted by a tumor mass, which was conducted at theUniversity Hospital Oslo in September 2013. Postopera-tively, he received irradiation to the tumor bed, 3 Gy perfraction to a total dose of 30 Gy.Today, there is no commonly accepted treatment rec-
ommendation for non-RCC. Pending the final histologyreport, while having the clinicopathological suspicion oftranslocational RCC, several therapeutical strategies werediscussed. In the light of no available standard treatmentfor patients with translocational RCC, a mammalian targetof rapamycin (mTOR) inhibitor (everolimus 10 mg daily)
counteracting phosphorylation of TFEB by mTOR com-plex 1 (mTORC1) [6] and denosumab (120 mg subcutane-ously every fourth week), a monoclonal antibodyregulating osteoclast activity by targeting the RANK lig-and, were both applied during and after postsurgicalradiotherapy. This therapeutic strategy aimed to counter-act the dysfunctional signaling effect in catabolism andbone reabsorption as described for TFEB tumors. Inaddition, the formerly nephrectomized patient had moder-ately reduced kidney function after the operation, andneeded self-catheterization. Often tyrosine kinase inhibi-tors (TKIs) affect kidney function, supporting an mTORpharmacological treatment instead of TKI for this patient.Unfortunately, everolimus led to thrombocytopenia andhad to be reduced to 7.5 mg per day taken orally. Duringthe next 2 months, the patient’s health deteriorated, andthe mTOR-inhibitor therapy was eventually interrupted.A new series of MRI (Fig. 1) confirmed progression,
with multiple additional bony lesions. The patient wastreated with a broadly acting TKI, pazopanib (800 mgonce daily) as second-line medical treatment, interferingwith platelet-derived growth factor (PDGF) and vascularendothelial growth factor (VEGF) pathways. At the sametime, neither anti-1-amino-3-18F-fluorocyclobutane-1-carboxylic acid (18F-FACBC) positron emission tomog-raphy (PET)/CT nor 2-deoxy-2-(18F)fluoro-D-glucose(18F-FDG) PET/CT scans detected tumor spreading.Acknowledging the difficulty in identifying a rational
therapeutic approach, the patient consented to serial bi-opsies taken in February and June 2014, preceding thechoice of a new treatment due to a major lesion in hissacrum. Both samples were then assessed molecularly byAgilent SureSelect exome capture with Illumina sequen-cing, and expression profiling using bead arrays fromIllumina.Ribonucleic acid (RNA) extraction from the tumor
taken at the first time point was split in two parts and aTissueLyser (Qiagen) was used to disrupt the sample.RNA from both parts was extracted using a GenElute
Fig. 1 Magnetic resonance imaging visualizing metastatic spine lesion (arrow)
Lilleby et al. Journal of Medical Case Reports (2015) 9:281 Page 2 of 9
Mammalian Total RNA Miniprep Kit (Sigma-Aldrich),according to the manufacturer’s instructions. DNA wasextracted from the tumor taken at the second time point,using the NucleoSpin Tissue Kit (Macherey-Nagel), ac-cording to the manufacturer’s protocol. Normal DNA wasextracted from ethylenediaminetetraacetic acid (EDTA)blood using the NucleoSpin Blood Midi Kit (Macherey-Nagel), according to the manufacturer’s protocol. Normaland tumor DNA was subjected to whole exome sequen-cing using the SureSelect whole exome v5 and Illuminasequencing by synthesis technology (HiSeq 2500) follow-ing the supplier’s protocol. The resulting FASTQ fileswere further analyzed using an in-house developed pipe-line for somatic event detection. Reads of the tumor andits matched control sample were separately mapped withBWA-MEM [7] to human reference genome (build b37)with an added decoy contig, obtained from [8]. Sample-wise sorting and duplicate marking was performed on theinitial alignments with Picard tools [9]. Genome AnalysisToolkit (GATK) tools [10] were subsequently used fortwo-step local realignment around indels (in this step,both samples were processed together). Each sample’spair-end read information was then checked for inconsist-encies with Picard, and base-quality recalibration was per-formed by GATK.Somatic variant calling on the sample pair was done
with MuTect [11] (somatic single nucleotide variant,SNV, detection), Strelka [12] (somatic SNV and INDELdetection), DELLY [13] (large-scale variation – deletions,duplications, translocations and inversions – detection)and VarScan2 [14] (somatic copy number variation,CNV, analysis).GATK tools were used for computing coverage statis-
tics based on the recalibrated alignment files.Most of the analysis (starting with the local realignment
step) was limited to exome regions, defined by Agilent se-quencing probes (for further details, see Additional file 1).One translocation was identified through sequencing,
involving positions chr11:65,267,772 and chr6:41,659,234,involving the expected TFEB translocation previously de-scribed for this patient.We identified 23 somatic single SNVs, and three inser-
tion/deletion events. Among these, one mutated gene waslocated in the tumor necrosis factor (TNF) receptor path-way (MAP3K7, G110V), a pathway previously implicatedin clear cell RCC [15]. However, no obvious candidatetherapeutic target genes were identified as mutated.A DNA copy number plot is shown in Fig. 2. Gain of a
region of 1q including the gene KIF14 has previouslybeen associated with fatal progression, and KIF14 wasamong the genes reported to be overexpressed in tumorswith 1q [16]. We did identify a somatic mutation for thisgene (H849Y), but the tumorigenic potential remainsunclear. Other chromosome arm scale events with more
or less clear breaks could be seen on chromosomes 1, 3,18 and 22. Some chromosomes (9, 13, 19) appeared tobe generally underrepresented by sequencing reads inthe tumor, while some other chromosomes (for example2 and 7) seemed to be affected by many smaller events.Transcriptome analysis was performed using the TruSeq
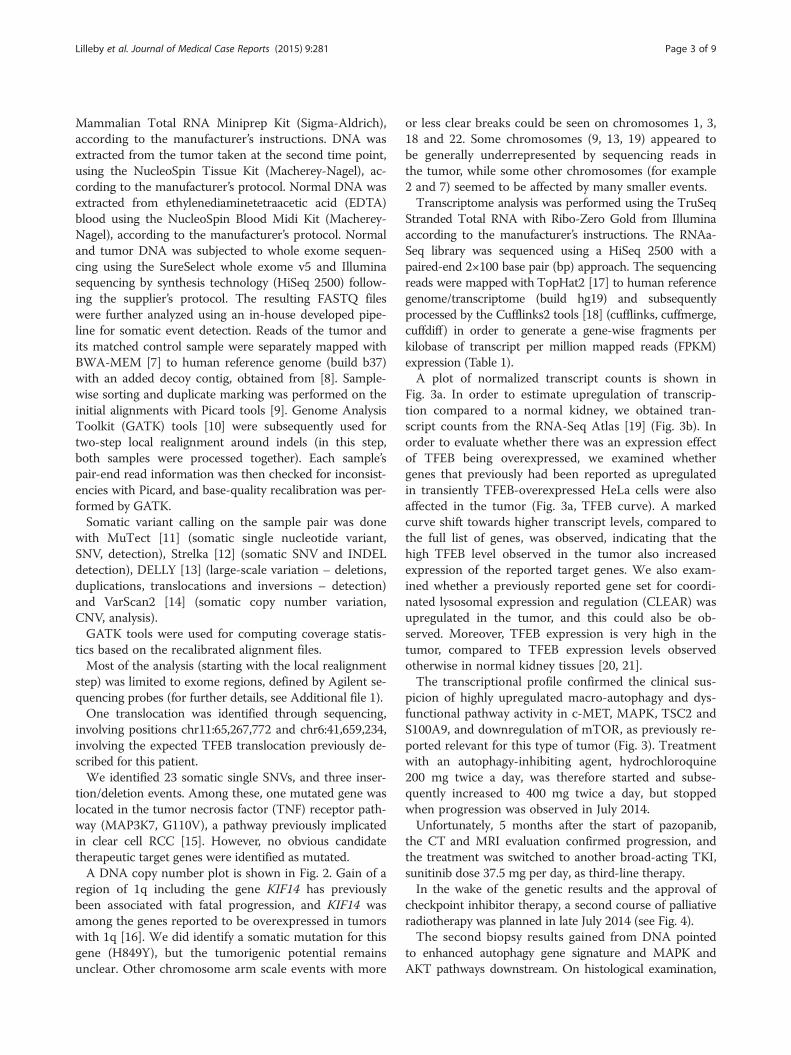
Stranded Total RNA with Ribo-Zero Gold from Illuminaaccording to the manufacturer’s instructions. The RNAa-Seq library was sequenced using a HiSeq 2500 with apaired-end 2×100 base pair (bp) approach. The sequencingreads were mapped with TopHat2 [17] to human referencegenome/transcriptome (build hg19) and subsequentlyprocessed by the Cufflinks2 tools [18] (cufflinks, cuffmerge,cuffdiff) in order to generate a gene-wise fragments perkilobase of transcript per million mapped reads (FPKM)expression (Table 1).A plot of normalized transcript counts is shown in
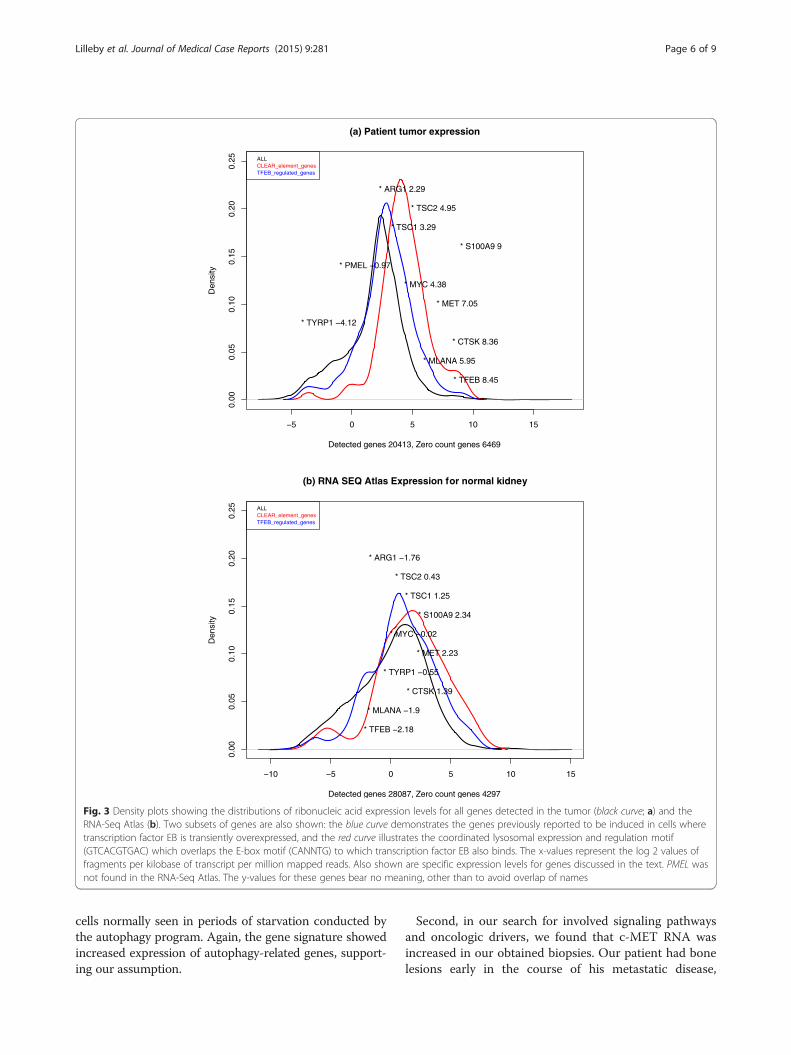
Fig. 3a. In order to estimate upregulation of transcrip-tion compared to a normal kidney, we obtained tran-script counts from the RNA-Seq Atlas [19] (Fig. 3b). Inorder to evaluate whether there was an expression effectof TFEB being overexpressed, we examined whethergenes that previously had been reported as upregulatedin transiently TFEB-overexpressed HeLa cells were alsoaffected in the tumor (Fig. 3a, TFEB curve). A markedcurve shift towards higher transcript levels, compared tothe full list of genes, was observed, indicating that thehigh TFEB level observed in the tumor also increasedexpression of the reported target genes. We also exam-ined whether a previously reported gene set for coordi-nated lysosomal expression and regulation (CLEAR) wasupregulated in the tumor, and this could also be ob-served. Moreover, TFEB expression is very high in thetumor, compared to TFEB expression levels observedotherwise in normal kidney tissues [20, 21].The transcriptional profile confirmed the clinical sus-
picion of highly upregulated macro-autophagy and dys-functional pathway activity in c-MET, MAPK, TSC2 andS100A9, and downregulation of mTOR, as previously re-ported relevant for this type of tumor (Fig. 3). Treatmentwith an autophagy-inhibiting agent, hydrochloroquine200 mg twice a day, was therefore started and subse-quently increased to 400 mg twice a day, but stoppedwhen progression was observed in July 2014.Unfortunately, 5 months after the start of pazopanib,
the CT and MRI evaluation confirmed progression, andthe treatment was switched to another broad-acting TKI,sunitinib dose 37.5 mg per day, as third-line therapy.In the wake of the genetic results and the approval of
checkpoint inhibitor therapy, a second course of palliativeradiotherapy was planned in late July 2014 (see Fig. 4).The second biopsy results gained from DNA pointed
to enhanced autophagy gene signature and MAPK andAKT pathways downstream. On histological examination,
Lilleby et al. Journal of Medical Case Reports (2015) 9:281 Page 3 of 9

cathepsin K and Melan-A were highly positive. Due tolocal pain in the patient’s chest wall, a second course ofthree-dimensional CT conformal radiotherapy encompass-ing pleural metastases (3 Gy per fraction, 5 days per week)was planned 4 weeks later, and sunitinib treatmentwas halted prior to radiotherapy. Acute pleural bleedingconfirmed with a CT scan showed tumor growth after 8fractions of radiotherapy, and further irradiation wasabolished. Sunitinib treatment was discontinued.In view of the young age of the patient and the specific
staining for Melan-A expressing tumor cells [22] (Fig. 5),he was finally accepted for ipilimumab, targeting CTLA-4, activating the immune system, combined with third-line sorafenib treatment, a kinase inhibitor used in thetreatment of renal cancer. Ipilimumab was withdrawnrapidly, due to controversies around combined treat-ment in the physicians group, exaggerated by temporaryhealth deterioration of the patient. At last follow-up, 16months after the diagnosis of translocational RCC, thepatient’s sorafenib treatment stopped due to disease pro-gression and he died shortly afterwards.Attempts of cell culture of excess cell material from
the bone biopsy in medium were unsuccessful.
DiscussionA subclass of renal tumors, translocation renal tumors,involves somatic translocations of transcription factorsthat are members of the MITF family, essentially deregu-lating gene expression control. Translocations involvingthe TFEB are less common than transcription factor E3(TFE3), with only 30 confirmed cases reported in the lit-erature [23]. Here we describe the therapeutic despairwhich comes along when treating such a fatal cancer,and an attempt to apply molecular guidance for treat-ment of this disease. To the best of our knowledge, it isthe first such study of the clinical course of TFEB RCCcombined with genetic elucidation in a young man withmetastatic disease. There is a paucity of comprehensivereports on the clinicogenetic findings in translocation-driven RCC, but recently the clinicopathological mani-festations in TFEB have been acknowledged, contribut-ing to the correct diagnosis [23]. The sequencing-basedapproaches added some important clues to the under-standing of this entity in our patient, primarily from ex-pression profiling, as a few mutations that can potentiallyserve as a drug target could be identified. The main find-ing in our case was the upregulated activity in autophagy.
Fig. 2 Copy number analysis by chromosome (using VarScan2/DNAcopy)
Lilleby et al. Journal of Medical Case Reports (2015) 9:281 Page 4 of 9
Dysfunctional autophagy activity guided us in our searchfor interpretation of the results showing activity in genesand transcript expression in self-destruction [24, 25]. TheTFEB gene mutation correlated clinically with prolifera-tion and invasion of bony structures, liver and pleuralmanifestations. The tumor exhibited an extremely aggres-sive clinical behavior during radiotherapy and was non-responsive to mTOR inhibitor, and moreover showed onlymodest response to a variety of medical interventions andTKIs. In addition, patients with von Hippel–Lindau(VHL) syndrome can develop clear cell RCC and a sub-group of such patients may have similarities with thosedescribed in the transcriptome of our study [26].The role of MITF family transcription factors in renal
cell transformation to mutant cancer cell has yet to beelucidated in depth. However, the transcription of TFEBis acknowledged as the master regulator of the mTORnutrients sensing machinery, in a hypoxia-inducibletranscription factor (HIF) independent manner [27]. Theintriguing overlap between the more common phenotype
of RCC to translocation-driven RCC constitutes the meta-bolic disarrangement leading to dysfunctional activity inthese cells and, as we propose in our case, to uncontrolledautophagy.In our data, the TFEB driver mutation favored en-
hanced osteoclast activity, and upregulated cathepsin Kwas confirmed in several biopsies, and promoting a genesignature connected to MAPK and c-MET signal path-ways. It is known that TFEB, the master regulator oflysosome biogenesis, controls transcription of targetgenes closely related to lysosomal structure and func-tion, including hydrolases. Our findings in the DNAmotif demonstrated upregulation of genes previouslyreported to be induced in cells where TFEB was over-expressed. The same signature overlapped with theCLEAR motif in RNA samples. Tsuda et al. showedrecently that mTORC1 is a key upstream kinase thatdirectly phosphorylates TFEB and inhibits its activity[28]. In addition, nuclear TFEB translocation may re-establish autophagy, enforcing metabolic activity in cancer
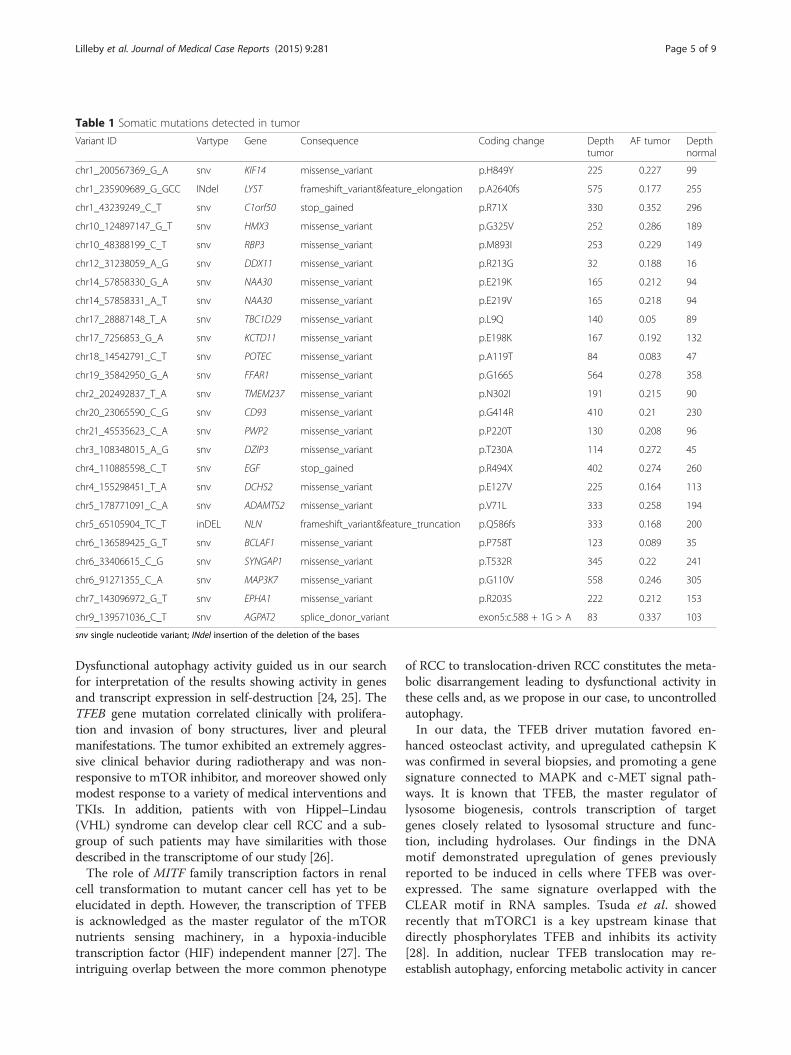
Table 1 Somatic mutations detected in tumor
Variant ID Vartype Gene Consequence Coding change Depthtumor
AF tumor Depthnormal
chr1_200567369_G_A snv KIF14 missense_variant p.H849Y 225 0.227 99
chr1_235909689_G_GCC INdel LYST frameshift_variant&feature_elongation p.A2640fs 575 0.177 255
chr1_43239249_C_T snv C1orf50 stop_gained p.R71X 330 0.352 296
chr10_124897147_G_T snv HMX3 missense_variant p.G325V 252 0.286 189
chr10_48388199_C_T snv RBP3 missense_variant p.M893I 253 0.229 149
chr12_31238059_A_G snv DDX11 missense_variant p.R213G 32 0.188 16
chr14_57858330_G_A snv NAA30 missense_variant p.E219K 165 0.212 94
chr14_57858331_A_T snv NAA30 missense_variant p.E219V 165 0.218 94
chr17_28887148_T_A snv TBC1D29 missense_variant p.L9Q 140 0.05 89
chr17_7256853_G_A snv KCTD11 missense_variant p.E198K 167 0.192 132
chr18_14542791_C_T snv POTEC missense_variant p.A119T 84 0.083 47
chr19_35842950_G_A snv FFAR1 missense_variant p.G166S 564 0.278 358
chr2_202492837_T_A snv TMEM237 missense_variant p.N302I 191 0.215 90
chr20_23065590_C_G snv CD93 missense_variant p.G414R 410 0.21 230
chr21_45535623_C_A snv PWP2 missense_variant p.P220T 130 0.208 96
chr3_108348015_A_G snv DZIP3 missense_variant p.T230A 114 0.272 45
chr4_110885598_C_T snv EGF stop_gained p.R494X 402 0.274 260
chr4_155298451_T_A snv DCHS2 missense_variant p.E127V 225 0.164 113
chr5_178771091_C_A snv ADAMTS2 missense_variant p.V71L 333 0.258 194
chr5_65105904_TC_T inDEL NLN frameshift_variant&feature_truncation p.Q586fs 333 0.168 200
chr6_136589425_G_T snv BCLAF1 missense_variant p.P758T 123 0.089 35
chr6_33406615_C_G snv SYNGAP1 missense_variant p.T532R 345 0.22 241
chr6_91271355_C_A snv MAP3K7 missense_variant p.G110V 558 0.246 305
chr7_143096972_G_T snv EPHA1 missense_variant p.R203S 222 0.212 153
chr9_139571036_C_T snv AGPAT2 splice_donor_variant exon5:c.588 + 1G > A 83 0.337 103
snv single nucleotide variant; INdel insertion of the deletion of the bases
Lilleby et al. Journal of Medical Case Reports (2015) 9:281 Page 5 of 9
cells normally seen in periods of starvation conducted bythe autophagy program. Again, the gene signature showedincreased expression of autophagy-related genes, support-ing our assumption.
Second, in our search for involved signaling pathwaysand oncologic drivers, we found that c-MET RNA wasincreased in our obtained biopsies. Our patient had bonelesions early in the course of his metastatic disease,
−5 0 5 10 15
0.00
0.05
0.10
0.15
0.20
0.25
(a) Patient tumor expression
Detected genes 20413, Zero count genes 6469
Den
sity
ALLCLEAR_element_genesTFEB_regulated_genes
* TFEB 8.45
* MLANA 5.95
* CTSK 8.36
* TYRP1 −4.12
* MET 7.05
* MYC 4.38
* PMEL −0.97
* S100A9 9
* TSC1 3.29
* TSC2 4.95
* ARG1 2.29
−10 −5 0 5 10 15
0.00
0.05
0.10
0.15
0.20
0.25
(b) RNA SEQ Atlas Expression for normal kidney
Detected genes 28087, Zero count genes 4297
Den
sity
ALLCLEAR_element_genesTFEB_regulated_genes
* TFEB −2.18
* MLANA −1.9
* CTSK 1.39
* TYRP1 −0.55
* MET 2.23
* MYC −0.02
* S100A9 2.34
* TSC1 1.25
* TSC2 0.43
* ARG1 −1.76
Fig. 3 Density plots showing the distributions of ribonucleic acid expression levels for all genes detected in the tumor (black curve; a) and theRNA-Seq Atlas (b). Two subsets of genes are also shown: the blue curve demonstrates the genes previously reported to be induced in cells wheretranscription factor EB is transiently overexpressed, and the red curve illustrates the coordinated lysosomal expression and regulation motif(GTCACGTGAC) which overlaps the E-box motif (CANNTG) to which transcription factor EB also binds. The x-values represent the log 2 values offragments per kilobase of transcript per million mapped reads. Also shown are specific expression levels for genes discussed in the text. PMEL wasnot found in the RNA-Seq Atlas. The y-values for these genes bear no meaning, other than to avoid overlap of names
Lilleby et al. Journal of Medical Case Reports (2015) 9:281 Page 6 of 9

which is in line with the c-MET hyperactivity seen ingermline mutations of hereditary papillary RCC and bonemetastases of RCC. Moreover, patients with upregulationof lysosomes in osteoclasts might benefit from c-MET in-hibitors, such as cabozantinib, where the c-MET signalpathway is stimulated by TFEB to trigger lysosomal acid-ification and degradation of the extracellular bone micro-environment supporting the activity of osteoclasts [29]. Inour case, the metastasis stemmed from the rib, and thefirst signs of disseminated spread were localized to thespine. We tried to counteract the possibility of tumor-related autophagy with hydrochloroquine. This was an un-proven experimental off-label approach, but has been triedin other solid tumors before. Unfortunately, we did nothave access to c-MET inhibitors, which would have beena more targeted attempt supported by the gene expressionfindings from the biopsies.Some interesting similarities, but also striking differ-
ences, to clear cell RCC were seen. In clear cell RCC,mutations in the VHL gene lead to upregulation ofmTOR and glycolysis. In TFEB RCC, mechanisms differ-ent from aerobic glycolysis may be active. One possiblemajor difference is the involvement of c-MYC, which
has been linked to HIF-1 metabolism and glutaminolysis[30]. One other interesting feature in our patient withautophagy addiction points to the use of the amino acidarginine, and an increased arginase activity was seen,which also could be clinically exploited. The often re-lated metabolic shift in energy rescue seen in clear cellRCC was not apparent in our case. This may have con-sequences for imaging, in that 18F-FDG PET may not besuitable to detect disease activity. Previously, baselinehigh 18F-FDG PET uptake and increased number ofpositive lesions have been associated with prognostic in-formation in patients receiving sunitinib [31]. As seen inour patient, the hybrid PET/CT combined with 18F-FDGor 18F-FACBC as radiotracers could not convey valuableinformation about the location or activity of metastases.However, the possible addiction for glutamine and/or ar-ginine and possible dysfunctional metabolism should betested with novel amino acid radiotracers in these pa-tients. In the wake of specific TFEB RCC radiotracers, itseems that the first choice of standard radiological diag-nosis in this tumor is MRI. MRI assessment conceivedbone and soft tissue lesions and was reliable to addressthe efficacy of target therapy.
Fig. 4 The course of treatment
Fig. 5 a Primary tumor with positive Melan-A staining. b Metastasis with positive Melan-A staining
Lilleby et al. Journal of Medical Case Reports (2015) 9:281 Page 7 of 9

ConclusionsThe clinical features with initially osteolytic bony lesionsin our patient, together with the recognized autophagicgenetic fingerprint supervised our therapeutic approach,representing a first step into precision medicine for thispatient group.The efficacy of TKIs and mTOR inhibitors appears lim-
ited in translocational RCC. Treatment duration in thosepatients may last when intrinsic patterns of resistance to aparticular agent could be obtained. To do so, serial biopsiesof metastatic lesions were sampled in our patient. Wefound a clear molecular link to activated autophagy andosteoclast enhancement, but poor response to existing tar-geted therapy. Of note, a possible durable effect by ipilimu-mab in combination with a TKI presumably stimulatingthe immune system and this observation deserves furtherinvestigation. Despite the limited therapeutic benefitsachieved in our case, clarifying the essential genetic make-up may portend the future treatment in this rare disease.
ConsentWritten informed consent was obtained from the patientfor research purposes when he was still alive. A copy ofthe written consent is available for review by the Editor-in-Chief of this journal.
Additional file
Additional file 1: Reference data DNA/RNA analysis and individualpipeline steps DNA/RNA (DOCX 22 kb)
Competing interestsThe authors declare that they have no competing interests.
Authors’ contributionsEH, LM and WL analyzed and interpreted the patient data regarding theneoplasm and were major contributors to the manuscript. LV performed thehistological examination of the kidney, and MR contributed in interpretingthe nuclear medicine findings and in writing the manuscript. All authorsread and approved the final manuscript.
AcknowledgementsCourtesy to the radiologist Knut Hole who helped with the MR imaging.
Author details1Department of Oncology, Oslo University Hospital, Nydalen, Postboks49500424 Oslo, Norway. 2Department of Pathology, Oslo University Hospital,Nydalen, Postboks 49500424 Oslo, Norway. 3Department of Radiology andNuclear Medicine, Oslo University Hospital, Nydalen, Postboks 49500424 Oslo,Norway. 4Department of Tumor Biology, Institute for Cancear Research, Oslo,Oslo University Hospital, Nydalen, Postboks 49500424 Oslo, Norway.5Department of Core Facilities, Institute for Cancer Research, Oslo UniversityHospital, Nydalen, Postboks 49500424 Oslo, Norway. 6Department of CancerGenetics and Informatics, University of Oslo, Oslo University Hospital,Nydalen, Postboks 49500424 Oslo, Norway. 7Department of Informatics,University of Oslo, Blindern, Postboks 10800316 Oslo, Norway.
Received: 20 February 2015 Accepted: 26 October 2015
References1. Rao Q, Liu B, Cheng L, Zhu Y, Shi QL, Wu B, et al. Renal cell carcinomas with
t(6;11)(p21;q12): a clinicopathologic study emphasizing unusualmorphology, novel alpha-TFEB gene fusion point, immunobiomarkers, andultrastructural features, as well as detection of the gene fusion byfluorescence in situ hybridization. Am J Surg Pathol. 2012;36(9):1327–38.
2. Sardiello M, Palmieri M, di Ronza A, Medina DL, Valenza M, Gennarino VA,et al. A gene network regulating lysosomal biogenesis and function.Science. 2009;325(5939):473–7.
3. Argani P, Lae M, Hutchinson B, Reuter VE, Collins MH, Perentesis J, et al.Renal carcinomas with the t(6;11)(p21;q12): clinicopathologic features anddemonstration of the specific alpha-TFEB gene fusion byimmunohistochemistry, RT-PCR, and DNA PCR. Am J Surg Pathol.2005;29(2):230–40.
4. Lacombe J, Karsenty G, Ferron M. Regulation of lysosome biogenesis andfunctions in osteoclasts. Cell Cycle. 2013;12(17):2744–52.
5. Malouf GG, Camparo P, Molinie V, Dedet G, Oudard S, Schleiermacher G,et al. Transcription factor E3 and transcription factor EB renal cellcarcinomas: clinical features, biological behavior and prognostic factors.J Urol. 2011;185(1):24–9.
6. Pena-Llopis S, Brugarolas J. TFEB, a novel mTORC1 effector implicated inlysosome biogenesis, endocytosis and autophagy. Cell Cycle.2011;10(23):3987–8.
7. Li H, Durbin R. Fast and accurate short read alignment with Burrows-Wheelertransform. Bioinformatics. 2009;25(14):1754–60.
8. (GATK resource bundle) [email protected]. 2015.Ref Type: Internet Communication
9. (Picard tools)broadinstitute.github.io/picard. 2015. Ref Type: InternetCommunication
10. McKenna A, Hanna M, Banks E, Sivachenko A, Cibulskis K, Kernytsky A, et al.The genome analysis toolkit: a MapReduce framework for analyzing next-generation DNA sequencing data. Genome Res. 2010;20(9):1297–303.
11. Cibulskis K, Lawrence MS, Carter SL, Sivachenko A, Jaffe D, Sougnez C, et al.Sensitive detection of somatic point mutations in impure andheterogeneous cancer samples. Nat Biotechnol. 2013;31(3):213–9.
12. Saunders CT, Wong WS, Swamy S, Becq J, Murray LJ, Cheetham RK. Strelka:accurate somatic small-variant calling from sequenced tumor-normalsample pairs. Bioinformatics. 2012;28(14):1811–7.
13. Rausch T, Zichner T, Schlattl A, Stutz AM, Benes V, Korbel JO. DELLY:structural variant discovery by integrated paired-end and split-read analysis.Bioinformatics. 2012;28(18):i333–9.
14. Koboldt DC, Zhang Q, Larson DE, Shen D, McLellan MD, Lin L, et al. VarScan2: somatic mutation and copy number alteration discovery in cancer byexome sequencing. Genome Res. 2012;22(3):568–76.
15. Al-Lamki RS, Sadler TJ, Wang J, Reid MJ, Warren AY, Movassagh M, et al.Tumor necrosis factor receptor expression and signaling in renal cellcarcinoma. Am J Pathol. 2010;177(2):943–54.
16. Szponar A, Zubakov D, Pawlak J, Jauch A, Kovacs G. Three geneticdevelopmental stages of papillary renal cell tumors: duplication ofchromosome 1q marks fatal progression. Int J Cancer. 2009;124(9):2071–6.
17. Kim D, Pertea G, Trapnell C, Pimentel H, Kelley R, Salzberg SL. TopHat2:accurate alignment of transcriptomes in the presence of insertions,deletions and gene fusions. Genome Biol. 2013;14(4):R36.
18. Trapnell C, Hendrickson DG, Sauvageau M, Goff L, Rinn JL, Pachter L.Differential analysis of gene regulation at transcript resolution with RNA-seq.Nat Biotechnol. 2013;31(1):46–53.
19. Trapnell C, Williams BA, Pertea G, Mortazavi A, Kwan G, van Baren MJ, et al.Transcript assembly and quantification by RNA-Seq reveals unannotatedtranscripts and isoform switching during cell differentiation. Nat Biotechnol.2010;28(5):511–5.
20. Langmead B, Trapnell C, Pop M, Salzberg SL. Ultrafast and memory-efficientalignment of short DNA sequences to the human genome. Genome Biol.2009;10(3):R25.
21. Martignoni G, Pea M, Gobbo S, Brunelli M, Bonetti F, Segala D, et al.Cathepsin-K immunoreactivity distinguishes MiTF/TFE family renaltranslocation carcinomas from other renal carcinomas. Mod Pathol.2009;22(8):1016–22.
22. Klein O, Ebert LM, Nicholaou T, Browning J, Russell SE, Zuber M, et al.Melan-A-specific cytotoxic T cells are associated with tumor regression andautoimmunity following treatment with anti-CTLA-4. Clin Cancer Res.2009;15(7):2507–13.
Lilleby et al. Journal of Medical Case Reports (2015) 9:281 Page 8 of 9
23. Inamura K, Fujiwara M, Togashi Y, Nomura K, Mukai H, Fujii Y, et al. Diversefusion patterns and heterogeneous clinicopathologic features of renal cellcarcinoma with t(6;11) translocation. Am J Surg Pathol. 2012;36(1):35–42.
24. Fullgrabe J, Klionsky DJ, Joseph B. The return of the nucleus:transcriptional and epigenetic control of autophagy. Nat RevMol Cell Biol. 2014;15(1):65–74.
25. Kauffman EC, Ricketts CJ, Rais-Bahrami S, Yang Y, Merino MJ, Bottaro DP,et al. Molecular genetics and cellular features of TFE3 and TFEB fusionkidney cancers. Nat Rev Urol. 2014;11(8):465–75.
26. Glasker S, Neumann HPH, Koch CA, Vortmeyer AO. Von Hippel-Lindausyndrome. In: De Groot LJ, Beck-Peccoz P, Chrousos G, Dungan K, GrossmanA, Hershman JM, Koch C, McLachlan R, New M, Rebar R, Singer F, Vinik A,Weickert MO, editors. Endotext. South Dartmouth: MDText.com; 2012.
27. Turcotte S, Chan DA, Sutphin PD, Hay MP, Denny WA, Giaccia AJ. Amolecule targeting VHL-deficient renal cell carcinoma that inducesautophagy. Cancer Cell. 2008;14(1):90–102.
28. Tsuda M, Davis IJ, Argani P, Shukla N, McGill GG, Nagai M, et al. TFE3 fusionsactivate MET signaling by transcriptional up-regulation, defining anotherclass of tumors as candidates for therapeutic MET inhibition. Cancer Res.2007;67(3):919–29.
29. Choueiri TK, Pal SK, McDermott DF, Morrissey S, Ferguson KC, Holland J,et al. A phase I study of cabozantinib (XL184) in patients with renal cellcancer. Ann Oncol. 2014;25(8):1603–8.
30. Chan DA, Sutphin PD, Nguyen P, Turcotte S, Lai EW, Banh A, et al. TargetingGLUT1 and the Warburg effect in renal cell carcinoma by chemicalsynthetic lethality. Sci Transl Med. 2011;3(94):94ra70.
31. Revheim ME, Winge-Main AK, Hagen G, Fjeld JG, Fossa SD, Lilleby W.Combined positron emission tomography/computed tomography insunitinib therapy assessment of patients with metastatic renal cellcarcinoma. Clin Oncol (R Coll Radiol). 2011;23(5):339–43.
Submit your next manuscript to BioMed Centraland take full advantage of:
• Convenient online submission
• Thorough peer review
• No space constraints or color figure charges
• Immediate publication on acceptance
• Inclusion in PubMed, CAS, Scopus and Google Scholar
• Research which is freely available for redistribution
Submit your manuscript at www.biomedcentral.com/submit
Lilleby et al. Journal of Medical Case Reports (2015) 9:281 Page 9 of 9