Embed Size (px)
Citation preview

TRANSLATION OF THE FRENCHINTERIM FINANCIAL REPORT
SIX-MONTH PERIOD ENDED JUNE 30, 2018

CONTENTS
EXECUTIVE AND SUPERVISORY BODIES; STATUTORY AUDITORS AS OF JUNE 30, 2018 1FINANCIAL HIGHLIGHTS 2HIGHLIGHTS 4SHARE CAPITAL AND VOTING RIGHTS 4
BUSINESS REVIEW AND COMMENTS ON THE HALF-YEAR CONSOLIDATED FINANCIAL STATEMENTS OF LVMH GROUP 5
COMMENTS ON THE CONSOLIDATED INCOME STATEMENT 6WINES AND SPIRITS 10FASHION AND LEATHER GOODS 11PERFUMES AND COSMETICS 12WATCHES AND JEWELRY 14SELECTIVE RETAILING 15COMMENTS ON THE CONSOLIDATED BALANCE SHEET 16COMMENTS ON THE CONSOLIDATED CASH FLOW STATEMENT 17
CONDENSED HALF-YEAR CONSOLIDATED FINANCIAL STATEMENTS 19
CONSOLIDATED INCOME STATEMENT 20CONSOLIDATED STATEMENT OF COMPREHENSIVE GAINS AND LOSSES 21CONSOLIDATED BALANCE SHEET 22CONSOLIDATED STATEMENT OF CHANGES IN EQUITY 24CONSOLIDATED CASH FLOW STATEMENT 26SELECTED NOTES TO THE CONSOLIDATED FINANCIAL STATEMENTS 27
STATUTORY AUDITORS’ REVIEW REPORT ON THE HALF-YEARLY FINANCIAL INFORMATION 56
STATEMENT BY THE COMPANY OFFICER RESPONSIBLE FOR THE INTERIM FINANCIAL REPORT 57
This document is a free translation into English of the original French “Rapport financier semestriel”, hereafter referredto as the “Interim Financial Report”. It is not a binding document. In the event of a conflict in interpretation, reference shouldbe made to the French version, which is the authentic text.
(a) Independent Director.
Board of Directors
Bernard ArnaultChairman and Chief Executive Officer
Antonio Belloni Group Managing Director
Antoine Arnault
Delphine Arnault
Nicolas Bazire
Bernadette Chirac (a)
Charles de Croisset (a)
Diego Della Valle (a)
Clara Gaymard (a)
Marie-Josée Kravis (a)
Lord Powell of Bayswater
Marie-Laure Sauty de Chalon (a)
Yves-Thibault de Silguy (a)
Hubert Védrine (a)
Advisory Board members
Paolo Bulgari
Albert Frère
Executive Committee
Bernard ArnaultChairman and Chief Executive Officer
Antonio BelloniGroup Managing Director
Nicolas BazireDevelopment and acquisitions
Pietro BeccariChristian Dior Couture
Michael BurkeLouis Vuitton
Chantal GaemperleHuman Resources and Synergies
Jean-Jacques GuionyFinance
Christopher de LapuenteSephora and beauty
Pierre-Yves RousselSpecial Advisor to the Chairman
Philippe SchausWines and Spirits
Sidney ToledanoFashion Group
Jean-Baptiste VoisinStrategy
General secretary
Marc-Antoine Jamet
Performance Audit Committee
Yves-Thibault de Silguy (a)
Chairman
Antoine Arnault
Charles de Croisset (a)
Nominations and Compensation Committee
Charles de Croisset (a)
Chairman
Marie-Josée Kravis (a)
Yves-Thibault de Silguy (a)
Ethical and SustainableDevelopment Committee
Yves-Thibault de Silguy (a)
Chairman
Delphine Arnault
Marie-Laure Sauty de Chalon (a)
Hubert Védrine (a)
Statutory Auditors
ERNST & YOUNG Auditrepresented by Jeanne Boillet and Patrick Vincent-Genod
MAZARSrepresented by Simon Beillevaireand Loïc Wallaert
EXECUTIVE AND SUPERVISORY BODIES; STATUTORY AUDITORS AS OF JUNE 30, 2018
1Interim Financial Report - Six-month period ended June 30, 2018
2 Interim Financial Report - Six-month period ended June 30, 2018
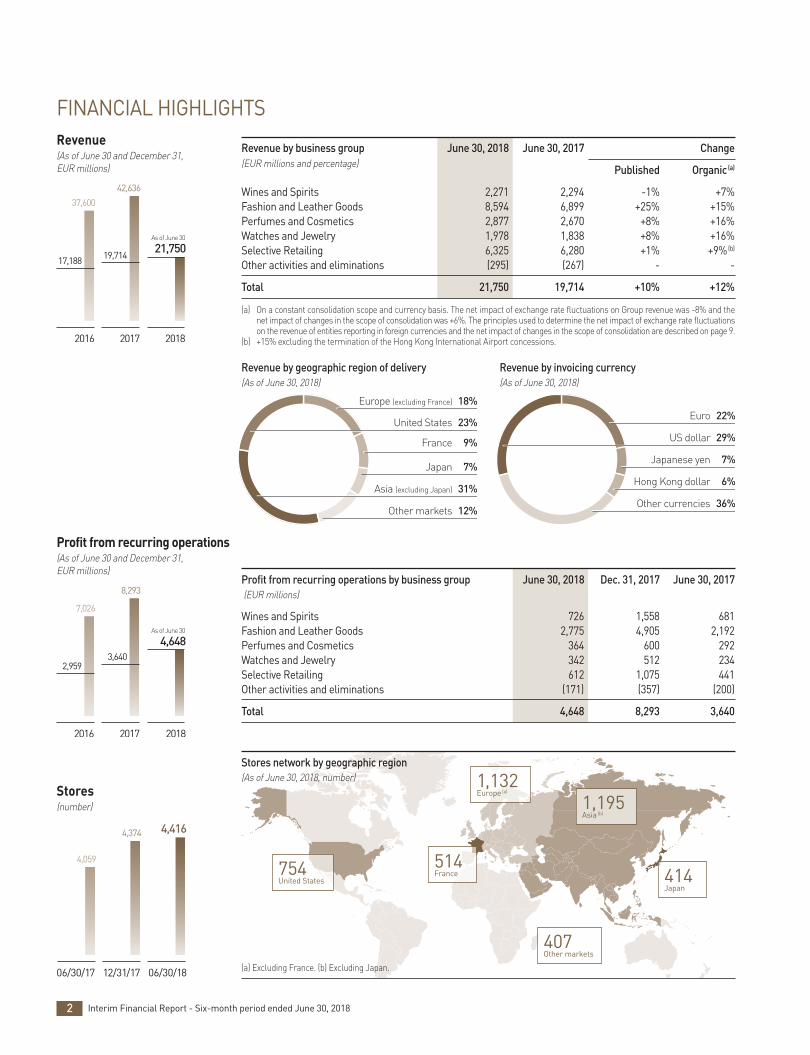
FINANCIAL HIGHLIGHTSRevenue(As of June 30 and December 31,EUR millions)
Profit from recurring operations by business group June 30, 2018 Dec. 31, 2017 June 30, 2017(EUR millions)
Wines and Spirits 726 1,558 681 Fashion and Leather Goods 2,775 4,905 2,192 Perfumes and Cosmetics 364 600 292 Watches and Jewelry 342 512 234Selective Retailing 612 1,075 441 Other activities and eliminations (171) (357) (200)
Total 4,648 8,293 3,640
12%Other markets
18%Europe (excluding France)
23%United States
Asia (excluding Japan) 31%
Japan 7%
France 9%
22%Euro
29%US dollar
Hong Kong dollar 6%
Other currencies 36%
Japanese yen 7%
Revenue by invoicing currency (As of June 30, 2018)
2016 2017
37,600
42,636
2018 1000
2000
3000
4000
5000
17,188 19,71421,750
As of June 30
Profit from recurring operations(As of June 30 and December 31,EUR millions)
7,026
8,293
2016 2017 2018 200
400
600
800
1000
2,9593,640
4,648As of June 30
Stores(number)
Stores network by geographic region(As of June 30, 2018, number)
06/30/17 12/31/17
4,374 4,416
4,059
06/30/1830
60
90
120
150
Revenue by geographic region of delivery(As of June 30, 2018)
754United States
514France
1,132Europe (a)
407Other markets
1,195Asia (b)
414Japan
Revenue by business group June 30, 2018 June 30, 2017 Change (EUR millions and percentage) Published Organic(a)
Wines and Spirits 2,271 2,294 -1% +7%Fashion and Leather Goods 8,594 6,899 +25% +15%Perfumes and Cosmetics 2,877 2,670 +8% +16%Watches and Jewelry 1,978 1,838 +8% +16%Selective Retailing 6,325 6,280 +1% +9%(b)
Other activities and eliminations (295) (267) - -
Total 21,750 19,714 +10% +12%
(a) On a constant consolidation scope and currency basis. The net impact of exchange rate fluctuations on Group revenue was - 8% and thenet impact of changes in the scope of consolidation was +6%. The principles used to determine the net impact of exchange rate fluctuationson the revenue of entities reporting in foreign currencies and the net impact of changes in the scope of consolidation are described on page 9.
(b) +15% excluding the termination of the Hong Kong International Airport concessions.
(a) Excluding France. (b) Excluding Japan.
3Interim Financial Report - Six-month period ended June 30, 2018
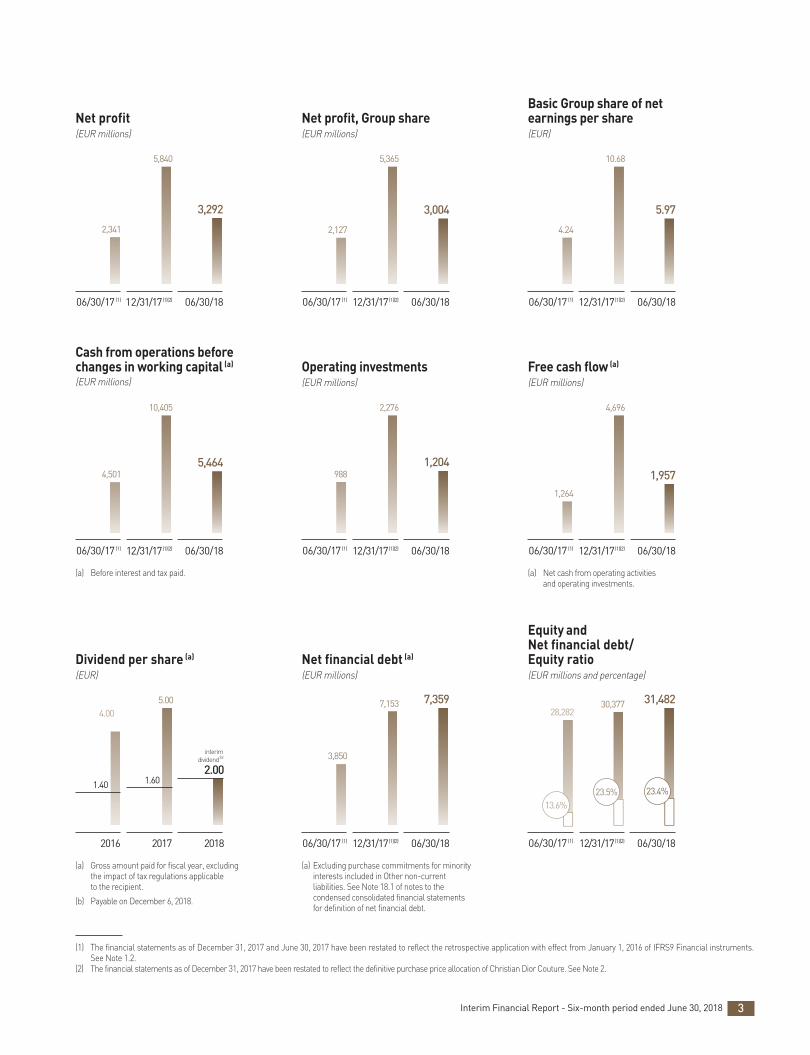
Net profit(EUR millions)
5,840
3,292
2,341
06/30/17 (1) 12/31/17 (1)(2) 06/30/18
Net profit, Group share(EUR millions)
5,365
3,004
2,127
06/30/17 (1) 12/31/17 (1)(2) 06/30/18
10.68
5.97
4.24
06/30/17 (1) 12/31/17 (1)(2) 06/30/18
5.004.00
1.40 1.60
2016 2017 2018
2.00
interimdividend (b)
7,153 7,359
3,850
06/30/17 (1) 12/31/17 (1)(2) 06/30/18
28,28230,377 31,482
23.5% 23.4%13.6%
06/30/17 (1) 12/31/17 (1)(2) 06/30/18
10,405
5,4644,501
06/30/1806/30/17 (1) 12/31/17 (1)(2)
Operating investments(EUR millions)
2,276
1,204988
06/30/17 (1) 12/31/17 (1)(2) 06/30/18
4,696
1,9571,264
06/30/17 (1) 12/31/17 (1)(2) 06/30/18
(a) Gross amount paid for fiscal year, excludingthe impact of tax regulations applicable to the recipient.
(b) Payable on December 6, 2018.
(a) Before interest and tax paid.
(a) Excluding purchase commitments for minorityinterests included in Other non-current liabilities. See Note 18.1 of notes to thecondensed consolidated financial statementsfor definition of net financial debt.
(a) Net cash from operating activities and operating investments.
Dividend per share (a)
(EUR)
Cash from operations beforechanges in working capital (a)
(EUR millions)
Net financial debt (a)
(EUR millions)
Free cash flow (a)
(EUR millions)
Basic Group share of netearnings per share(EUR)
(1) The financial statements as of December 31, 2017 and June 30, 2017 have been restated to reflect the retrospective application with effect from January 1, 2016 of IFRS9 Financial instruments.See Note 1.2.
(2) The financial statements as of December 31, 2017 have been restated to reflect the definitive purchase price allocation of Christian Dior Couture. See Note 2.
Equity and Net financial debt/Equity ratio(EUR millions and percentage)

SHARE CAPITAL AND VOTING RIGHTS
Number Number of % of share % of voting of shares voting rights(a) capital rights
Arnault Family Group 237,996,093 462,937,088 47.05% 63.13%Other 267,791,941 270,356,027 52.95% 36.87%
Total 505,788,034 733,293,115 100.00% 100.00%
(a) Total number of voting rights that may be exercised at Shareholders’ Meetings.
Highlights of the first half of 2018 include:
• double-digit increases in revenue and profit from recurringoperations;
• strong growth in Asia and the United States;
• good start to the year for Wines and Spirits;
• outstanding momentum at Louis Vuitton; profitability remainsat an exceptional level;
• success of new products at Christian Dior across all productlines;
• new creative talent at several fashion brands;
• excellent performance of Bvlgari;
• good performance of watch brands;
• Sephora's strong revenue growth in stores and online;
• rebound of profitability at DFS;
• cash from operations before changes in working capital was5.5 billion euros, an increase of 21%;
• net debt to equity ratio of 23% as of the end of June 2018.
4 Interim Financial Report - Six-month period ended June 30, 2018
HIGHLIGHTS

5Interim Financial Report - Six-month period ended June 30, 2018
BUSINESS REVIEW AND COMMENTS ON THE HALF-YEAR CONSOLIDATED FINANCIAL STATEMENTS OF LVMH GROUP
1. COMMENTS ON THE CONSOLIDATED INCOME STATEMENT 62. WINES AND SPIRITS 103. FASHION AND LEATHER GOODS 114. PERFUMES AND COSMETICS 125. WATCHES AND JEWELRY 146. SELECTIVE RETAILING 157. COMMENTS ON THE CONSOLIDATED BALANCE SHEET 168. COMMENTS ON THE CONSOLIDATED CASH FLOW STATEMENT 17
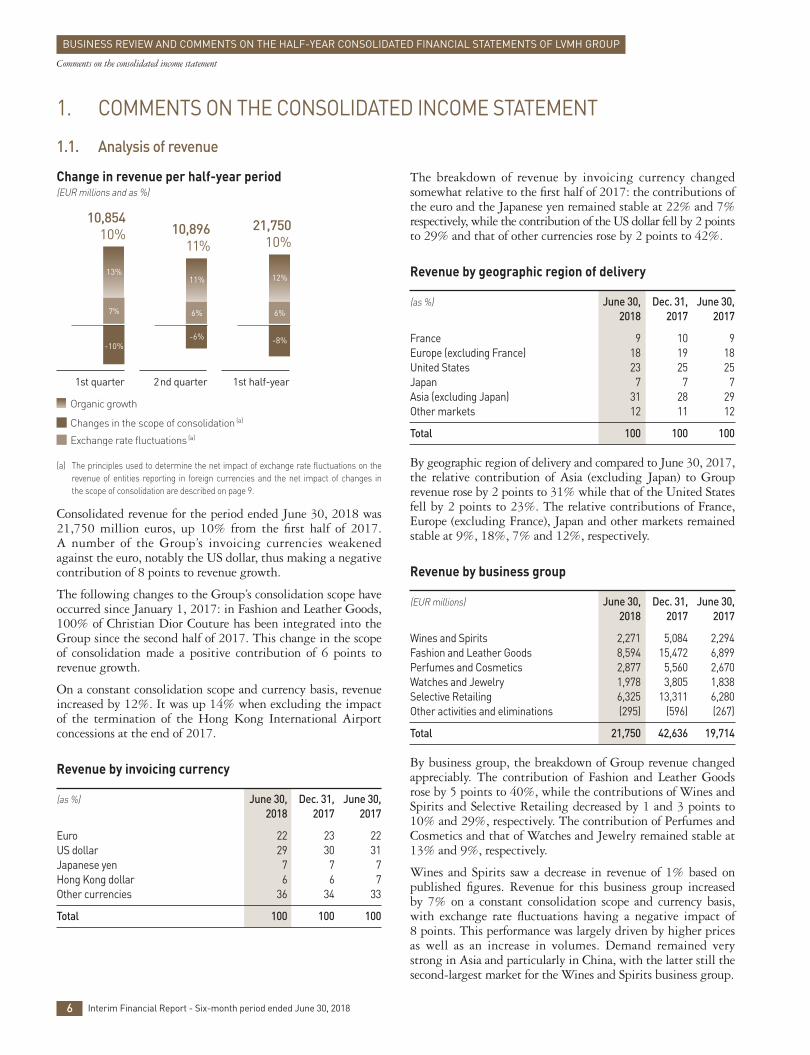
Change in revenue per half-year period (EUR millions and as %)
(a) The principles used to determine the net impact of exchange rate fluctuations on therevenue of entities reporting in foreign currencies and the net impact of changes in the scope of consolidation are described on page 9.
Consolidated revenue for the period ended June 30, 2018 was21,750 million euros, up 10% from the first half of 2017. A number of the Group’s invoicing currencies weakenedagainst the euro, notably the US dollar, thus making a negativecontribution of 8 points to revenue growth.
The following changes to the Group’s consolidation scope haveoccurred since January 1, 2017: in Fashion and Leather Goods,100% of Christian Dior Couture has been integrated into theGroup since the second half of 2017. This change in the scopeof consolidation made a positive contribution of 6 points torevenue growth.
On a constant consolidation scope and currency basis, revenueincreased by 12%. It was up 14% when excluding the impactof the termination of the Hong Kong International Airportconcessions at the end of 2017.
Revenue by invoicing currency
(as %) June 30, Dec. 31, June 30, 2018 2017 2017
Euro 22 23 22US dollar 29 30 31Japanese yen 7 7 7Hong Kong dollar 6 6 7Other currencies 36 34 33
Total 100 100 100
The breakdown of revenue by invoicing currency changedsomewhat relative to the first half of 2017: the contributions ofthe euro and the Japanese yen remained stable at 22% and 7%respectively, while the contribution of the US dollar fell by 2 pointsto 29% and that of other currencies rose by 2 points to 42%.
Revenue by geographic region of delivery
(as %) June 30, Dec. 31, June 30, 2018 2017 2017
France 9 10 9Europe (excluding France) 18 19 18United States 23 25 25Japan 7 7 7Asia (excluding Japan) 31 28 29Other markets 12 11 12
Total 100 100 100
By geographic region of delivery and compared to June 30, 2017,the relative contribution of Asia (excluding Japan) to Grouprevenue rose by 2 points to 31% while that of the United Statesfell by 2 points to 23%. The relative contributions of France,Europe (excluding France), Japan and other markets remainedstable at 9%, 18%, 7% and 12%, respectively.
Revenue by business group
(EUR millions) June 30, Dec. 31, June 30, 2018 2017 2017
Wines and Spirits 2,271 5,084 2,294Fashion and Leather Goods 8,594 15,472 6,899Perfumes and Cosmetics 2,877 5,560 2,670Watches and Jewelry 1,978 3,805 1,838Selective Retailing 6,325 13,311 6,280Other activities and eliminations (295) (596) (267)
Total 21,750 42,636 19,714
By business group, the breakdown of Group revenue changedappreciably. The contribution of Fashion and Leather Goodsrose by 5 points to 40%, while the contributions of Wines andSpirits and Selective Retailing decreased by 1 and 3 points to10% and 29%, respectively. The contribution of Perfumes andCosmetics and that of Watches and Jewelry remained stable at13% and 9%, respectively.
Wines and Spirits saw a decrease in revenue of 1% based onpublished figures. Revenue for this business group increased by 7% on a constant consolidation scope and currency basis,with exchange rate fluctuations having a negative impact of 8 points. This performance was largely driven by higher pricesas well as an increase in volumes. Demand remained verystrong in Asia and particularly in China, with the latter still thesecond-largest market for the Wines and Spirits business group.
1. COMMENTS ON THE CONSOLIDATED INCOME STATEMENT
1.1. Analysis of revenue
6 Interim Financial Report - Six-month period ended June 30, 2018
Comments on the consolidated income statement
BUSINESS REVIEW AND COMMENTS ON THE HALF-YEAR CONSOLIDATED FINANCIAL STATEMENTS OF LVMH GROUP
21,75010%
10,89611%
10,85410%
13%11% 12%
-10%
7%
-6%
6% 6%
-8%
1st half-year2 nd quarter1st quarter
Organic growth
Changes in the scope of consolidation (a)
Exchange rate fluctuations (a)

(EUR millions) June 30, Dec. 31, June 30, 2018 2017 2017
Revenue 21,750 42,636 19,714Cost of sales (7,130) (14,783) (6,881)
Gross margin 14,620 27,853 12,833
Marketing and selling expenses (8,305) (16,395) (7,704)General and administrative expenses (1,679) (3,162) (1,488)Income (loss) from investments in joint ventures and associates 12 (3) (1)
Profit from recurring operations 4,648 8,293 3,640Operating margin (%) 21.4 19.5 18.5
The Group achieved a gross margin of 14,620 million euros,up 14% from the first half of 2017. As a percentage of revenue,the gross margin was 67%, 2 points higher than in the firsthalf of 2017.
Marketing and selling expenses totaled 8,305 million euros, up 8% based on published figures and up 7% on a constantconsolidation scope and currency basis. This increase was mainlydue to the integration of Christian Dior Couture, the develop -ment of retail networks but also to higher communicationsinvestments, especially in Perfumes and Cosmetics. The levelof these expenses, expressed as a percentage of revenue, fell by0.8 points to 38%. Among these marketing and selling expenses,advertising and promotion costs amounted to 12% of revenue,increasing by 13% on a constant consolidation scope andcurrency basis.
The geographic breakdown of stores is as follows:
(number) June 30, Dec. 31, June 30, 2018 2017 2017
France 514 508 494Europe (excluding France) 1,132 1,156 1,086United States 754 754 715Japan 414 412 401Asia (excluding Japan) 1,195 1,151 1,022Other markets 407 393 341
Total 4,416 4,374 4,059
General and administrative expenses totaled 1,679 million euros,up 13% based on published figures and up 12% on a constantconsolidation scope and currency basis. They amounted to 8%of revenue, up 0.2 points relative to the first half of 2017.
Profit from recurring operations by business group
(EUR millions) June 30, Dec. 31, June 30, 2018 2017 2017
Wines and Spirits 726 1,558 681Fashion and Leather Goods 2,775 4,905 2,192Perfumes and Cosmetics 364 600 292Watches and Jewelry 342 512 234Selective Retailing 612 1,075 441Other activities and eliminations (171) (357) (200)
Total 4,648 8,293 3,640
The Group’s profit from recurring operations was 4,648 millioneuros, up 28%. The Group’s operating margin as a percentageof revenue was 21.4%, up 2.9 points from the first half of 2017.
1.2. Profit from recurring operations
Fashion and Leather Goods posted organic growth of 15%. The positive consolidation scope impact of 17 points resultingfrom the integration of Christian Dior Couture, tempered by the negative exchange rate impact of 7 points, raised thisgrowth to 25% based on published figures. This businessgroup’s performance was driven by the very solid momentumachieved by Louis Vuitton, as well as by Céline, Kenzo, Loewe,Givenchy, Loro Piana and Berluti, which confirmed their potentialfor strong growth.
Revenue for Perfumes and Cosmetics increased by 16% on a constant consolidation scope and currency basis, and by 8%based on published figures. This growth and the related market share gains confirmed the effectiveness of the value-enhancingstrategy resolutely pursued by the Group’s brands in the face ofcompetitive pressures. The Perfumes and Cosmetics businessgroup saw very significant revenue growth across all regions,and in particular in Asia.
Revenue for Watches and Jewelry increased by 16% on a constantconsolidation scope and currency basis, and by 8% based on published figures. This business group benefited from the excellent performance of Bvlgari; Chaumet, Hublot, Fredand Zenith saw strong gains. Asia and Europe were the mostbuoyant regions.
Revenue for Selective Retailing increased by 9% on a constantconsolidation scope and currency basis and by 1% based onpublished figures. It is worth noting that this performance wasachieved in spite of the negative impact of the termination ofthe concessions at Hong Kong International Airport at the closeof 2017. At the same time, the business group’s performancewas driven by Sephora, which saw very appreciable growth inrevenue, and by the return of Chinese tourists to regions whereDFS has many locations and is recording very solid growth.
7Interim Financial Report - Six-month period ended June 30, 2018
Comments on the consolidated income statement
BUSINESS REVIEW AND COMMENTS ON THE HALF-YEAR CONSOLIDATED FINANCIAL STATEMENTS OF LVMH GROUP

8 Interim Financial Report - Six-month period ended June 30, 2018
BUSINESS REVIEW AND COMMENTS ON THE HALF-YEAR CONSOLIDATED FINANCIAL STATEMENTS OF LVMH GROUP
Change in profit from recurring operations (EUR millions)
(a) The principles used to determine the net impact of exchange rate fluctuations on therevenue of entities reporting in foreign currencies and the net impact of changes in the scope of consolidation are described on page 9.
Exchange rate fluctuations had a negative overall impact of301 million euros on profit from recurring operations comparedto the first half of 2017. This total comprises the following threeitems: the impact of exchange rate fluctuations on export andimport sales and purchases by Group companies, the change inthe net impact of the Group’s policy of hedging its commercialexposure to various currencies, and the impact of exchange ratefluctuations on the consolidation of profit from recurringoperations of subsidiaries outside the eurozone.
On a constant consolidation scope and currency basis, theGroup’s profit from recurring operations was up 32%.
Wines and Spirits
June 30, Dec. 31, June 30, 2018 2017 2017
Revenue (EUR millions) 2,271 5,084 2,294Profit from recurring operations (EUR millions) 726 1,558 681Operating margin (%) 32.0 30.6 29.7
Profit from recurring operations for Wines and Spirits was726 million euros, up 7% relative to the first half of 2017.Champagne and wines contributed 196 million euros whilecognacs and spirits accounted for 529 million euros. Thisperformance was the result of both sales volume growth and arobust price increase policy. The operating margin as a percentageof revenue for this business group increased by 2.3 points to 32%.
Fashion and Leather Goods
June 30, Dec. 31, June 30, 2018 2017 2017
Revenue (EUR millions) 8,594 15,472 6,899Profit from recurring operations (EUR millions) 2,775 4,905 2,192Operating margin (%) 32.3 31.7 31.8
Fashion and Leather Goods posted profit from recurringoperations of 2,775 million euros, up 27% compared to the firsthalf of 2017. This sharp increase includes the positive impactof the consolidation of Christian Dior Couture, but especiallyreflects the very strong performance of our Maisons. LouisVuitton maintained its exceptional level of profitability whileLoewe, Céline, Givenchy, Kenzo and Loro Piana confirmed theirgrowth momentum. The business group’s operating margin asa percentage of revenue grew by 0.5 points to 32.3%.
Perfumes and Cosmetics
June 30, Dec. 31, June 30, 2018 2017 2017
Revenue (EUR millions) 2,877 5,560 2,670Profit from recurring operations (EUR millions) 364 600 292Operating margin (%) 12.7 10.8 10.9
Profit from recurring operations for Perfumes and Cosmetics was364 million euros, up 24% compared to the first half of 2017.This growth was driven by Parfums Christian Dior, Guerlain,Benefit, Parfums Givenchy and Fresh, which posted improvedresults thanks to the success of their flagship product lines andstrong innovative momentum. The business group’s operatingmargin as a percentage of revenue increased by 1.8 points to 12.7%.
Watches and Jewelry
June 30, Dec. 31, June 30, 2018 2017 2017
Revenue (EUR millions) 1,978 3,805 1,838Profit from recurring operations (EUR millions) 342 512 234Operating margin (%) 17.3 13.5 12.7
Profit from recurring operations for Watches and Jewelry was342 million euros, up 46% relative to the first half of 2017.This increase was the result of strong performances at Bvlgari,Chaumet and Hublot. The operating margin as a percentage of revenue for the Watches and Jewelry business group rose by4.6 points to 17.3%.
Selective Retailing
June 30, Dec. 31, June 30, 2018 2017 2017
Revenue (EUR millions) 6,325 13,311 6,280Profit from recurring operations (EUR millions) 612 1,075 441Operating margin (%) 9.7 8.1 7.0
Comments on the consolidated income statement
151Organicgrowth
(a)Changes inthe scope of
consolidation
(a)Exchangerate
fluctuations
1st half-year2017
1st half-year2018
3,640
(301)1,158 4,648
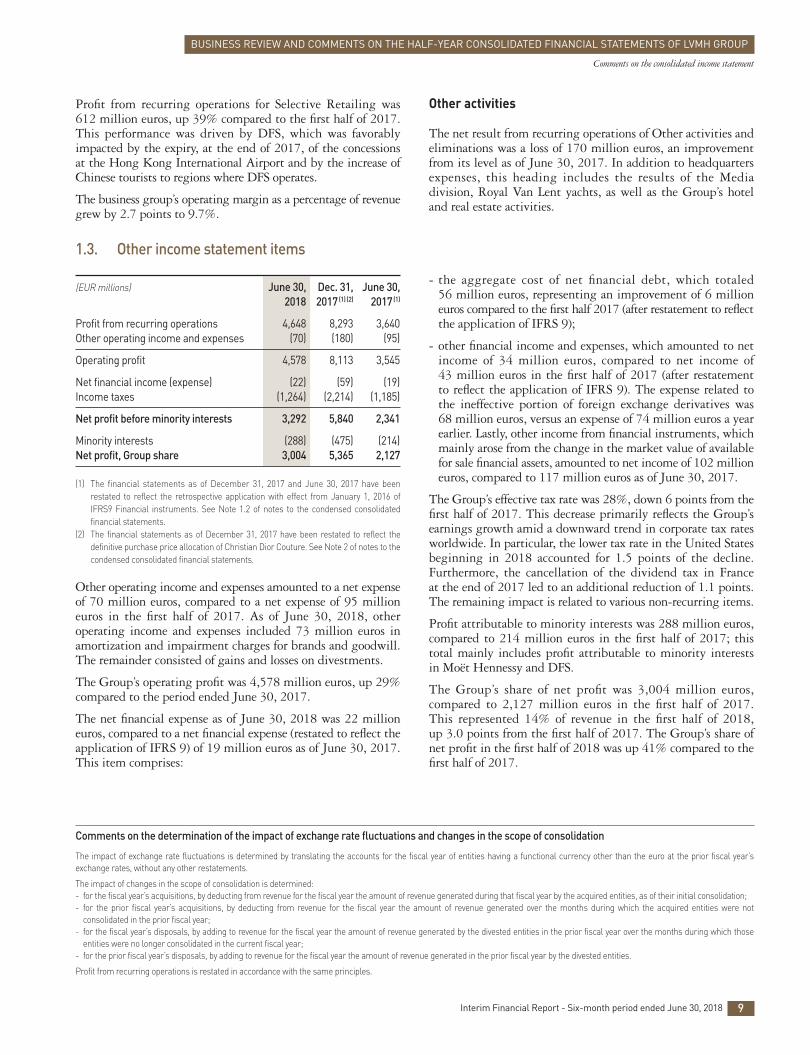
(EUR millions) June 30, Dec. 31, June 30, 2018 2017(1) (2) 2017(1)
Profit from recurring operations 4,648 8,293 3,640Other operating income and expenses (70) (180) (95)
Operating profit 4,578 8,113 3,545
Net financial income (expense) (22) (59) (19)Income taxes (1,264) (2,214) (1,185)
Net profit before minority interests 3,292 5,840 2,341
Minority interests (288) (475) (214)Net profit, Group share 3,004 5,365 2,127
(1) The financial statements as of December 31, 2017 and June 30, 2017 have beenrestated to reflect the retrospective application with effect from January 1, 2016 ofIFRS9 Financial instruments. See Note 1.2 of notes to the condensed consolidatedfinancial statements.
(2) The financial statements as of December 31, 2017 have been restated to reflect thedefinitive purchase price allocation of Christian Dior Couture. See Note 2 of notes to thecondensed consolidated financial statements.
Other operating income and expenses amounted to a net expenseof 70 million euros, compared to a net expense of 95 millioneuros in the first half of 2017. As of June 30, 2018, otheroperating income and expenses included 73 million euros inamortization and impairment charges for brands and goodwill.The remainder consisted of gains and losses on divestments.
The Group’s operating profit was 4,578 million euros, up 29%compared to the period ended June 30, 2017.
The net financial expense as of June 30, 2018 was 22 millioneuros, compared to a net financial expense (restated to reflect theapplication of IFRS 9) of 19 million euros as of June 30, 2017.This item comprises:
- the aggregate cost of net financial debt, which totaled56 million euros, representing an improvement of 6 millioneuros compared to the first half 2017 (after restatement to reflectthe application of IFRS 9);
- other financial income and expenses, which amounted to netincome of 34 million euros, compared to net income of43 million euros in the first half of 2017 (after restatement to reflect the application of IFRS 9). The expense related tothe ineffective portion of foreign exchange derivatives was68 million euros, versus an expense of 74 million euros a yearearlier. Lastly, other income from financial instruments, whichmainly arose from the change in the market value of availablefor sale financial assets, amounted to net income of 102 millioneuros, compared to 117 million euros as of June 30, 2017.
The Group’s effective tax rate was 28%, down 6 points from thefirst half of 2017. This decrease primarily reflects the Group’searnings growth amid a downward trend in corporate tax ratesworldwide. In particular, the lower tax rate in the United Statesbeginning in 2018 accounted for 1.5 points of the decline.Furthermore, the cancellation of the dividend tax in France at the end of 2017 led to an additional reduction of 1.1 points.The remaining impact is related to various non-recurring items.
Profit attributable to minority interests was 288 million euros,compared to 214 million euros in the first half of 2017; thistotal mainly includes profit attributable to minority interestsin Moët Hennessy and DFS.
The Group’s share of net profit was 3,004 million euros,compared to 2,127 million euros in the first half of 2017. This represented 14% of revenue in the first half of 2018, up 3.0 points from the first half of 2017. The Group’s share ofnet profit in the first half of 2018 was up 41% compared to thefirst half of 2017.
1.3. Other income statement items
Profit from recurring operations for Selective Retailing was612 million euros, up 39% compared to the first half of 2017.This performance was driven by DFS, which was favorablyimpacted by the expiry, at the end of 2017, of the concessions at the Hong Kong International Airport and by the increase ofChinese tourists to regions where DFS operates.
The business group’s operating margin as a percentage of revenuegrew by 2.7 points to 9.7%.
Other activities
The net result from recurring operations of Other activities andeliminations was a loss of 170 million euros, an improvementfrom its level as of June 30, 2017. In addition to headquartersexpenses, this heading includes the results of the Mediadivision, Royal Van Lent yachts, as well as the Group’s hoteland real estate activities.
9Interim Financial Report - Six-month period ended June 30, 2018
Comments on the consolidated income statement
BUSINESS REVIEW AND COMMENTS ON THE HALF-YEAR CONSOLIDATED FINANCIAL STATEMENTS OF LVMH GROUP
Comments on the determination of the impact of exchange rate fluctuations and changes in the scope of consolidation
The impact of exchange rate fluctuations is determined by translating the accounts for the fiscal year of entities having a functional currency other than the euro at the prior fiscal year’sexchange rates, without any other restatements.
The impact of changes in the scope of consolidation is determined:- for the fiscal year’s acquisitions, by deducting from revenue for the fiscal year the amount of revenue generated during that fiscal year by the acquired entities, as of their initial consolidation;- for the prior fiscal year’s acquisitions, by deducting from revenue for the fiscal year the amount of revenue generated over the months during which the acquired entities were not
consolidated in the prior fiscal year;- for the fiscal year’s disposals, by adding to revenue for the fiscal year the amount of revenue generated by the divested entities in the prior fiscal year over the months during which those
entities were no longer consolidated in the current fiscal year;- for the prior fiscal year’s disposals, by adding to revenue for the fiscal year the amount of revenue generated in the prior fiscal year by the divested entities.
Profit from recurring operations is restated in accordance with the same principles.

June 30, Dec. 31, June 30, 2018 2017 2017
Revenue (EUR millions) 2,271 5,084 2,294Of which: Champagne and wines 903 2,406 942
Cognac and spirits 1,368 2,679 1,352
Sales volume (millions of bottles) Champagne 24.8 65.6 25.0Cognac 46.9 90.9 45.7Other spirits 8.8 17.8 7.5Still and sparkling wines 15.3 43.8 16.6
Revenue by geographic region of delivery (%) France 5 6 5Europe (excluding France) 15 18 15United States 33 32 35Japan 6 6 6Asia (excluding Japan) 27 22 25Other markets 14 16 14
Total 100 100 100
Profit from recurring operations(EUR millions) 726 1,558 681Operating margin (%) 32.0 30.6 29.7
Operating investments of the period (EUR millions) 108 292 108
Highlights
The good performance achieved by the Wines and Spiritsbusiness group was driven by its high-quality portfolio of brands,the strength of each of its Maisons and their complementarypositioning. The business group pursued its value-enhancingstrategy, backed by a robust innovation policy and targetedinvestments in communication. It reaffirmed its leadershipposition in prestige Wines and Spirits, with particularly remarkablemomentum in Asia.
While champagne volumes were down 1%, organic revenuegrowth was 3%. The increased value was driven by more rapidgrowth in prestige vintages. Moët & Chandon achieved asolid performance in Europe and Asia. Its growth was fueled asmuch by its iconic Moët Impérial champagne as by its premiumqualities. The Maison’s “sustainable winegrowing” certificationwas renewed, reaffirming its commitment to the environment.Continuing its strong growth trajectory, Dom Pérignon preparedto unveil its latest vintage, Dom Pérignon Vintage 2008, and onceagain illustrated its creative vision through an artistic collaborationwith Lenny Kravitz. Veuve Clicquot’s performance was againdriven by its iconic Carte Jaune, but also by its Rosé and its latestinnovations, Extra Brut Extra Old, Rich and Rich Rosé. The Maisoncelebrated the bicentenary of the first mixed rosé champagne,an invention that exemplifies the bold vision of Madame
Clicquot. Krug further reinforced its growth momentum withthe introduction of its Krug Grande Cuvée 166th Edition andKrug Rosé 21st Edition. The “Krug and the Single Ingredient”series, conducted with chefs from Krug Ambassades around theworld, was a great success. Ruinart continued its development,focused in particular on markets in Western Europe and theUnited States, and enriched its creative palette through acollaboration with Chinese artist Liu Bolin. To celebrate its160th anniversary, Mercier renovated its visitors’ center andoffered a new multimedia experience.
The performance of Estates & Wines was buoyed by a firmprice increase policy. Chandon celebrated the 45th anniversaryof its arrival in California, and built on its 2017 product launchesin China and Australia.
Hennessy delivered a good performance in the first half of theyear, continuing the trend observed in 2017. Growth was fueledby strong demand in its two main markets – the United Statesand China – and by major inroads in Central Europe and Africa.Organic revenue growth for cognac was 8%, with volumes up 3%. Against the current backdrop of supply constraints,Hennessy firmly maintained its extremely high quality standardsand accentuated its value-enhancing strategy by focusing on itsinnovations such as Hennessy Black, Classivm and James Hennessy,and on its most prestigious cognacs, particularly X.O andParadis Impérial.
Glenmorangie and Ardbeg whiskies started off the year withstrong growth. An ambitious expansion plan is underway forthe distilleries of these two companies.
Belvedere won the “Vodka Producer of the Year” award forthe third year in a row at the International Spirits Challenge,and obtained the highest level of certification for sustainabledevelopment, becoming one of the most environmentallyfriendly distilleries in the world.
The Clos19 online boutique was launched in Florida, expandingits presence in the United States, and continued to develop itsexpertise in the United Kingdom and Germany.
Acquired in July 2017, Woodinville Whiskey Company beganits commercial expansion outside Washington State and provedhighly successful at the first points of sale to offer its productsin California.
Volcán De Mi Tierra tequila, launched in late 2017 in the UnitedStates and Mexico, continued its rollout, targeting a highlyselective distribution.
Outlook
In the face of variable weather conditions and economic cycles,the Wines and Spirits Maisons continue to draw on theexcellence of their products, their innovative spirit and theirhighly dedicated distribution staff. Over the coming months,they will keep investing in communication in their key markets
10 Interim Financial Report - Six-month period ended June 30, 2018
Wines and Spirits
BUSINESS REVIEW AND COMMENTS ON THE HALF-YEAR CONSOLIDATED FINANCIAL STATEMENTS OF LVMH GROUP
2. WINES AND SPIRITS

June 30, Dec. 31, June 30, 2018 2017 2017
Revenue (EUR millions) 8,594 15,472 6,899
Revenue by geographic region of delivery (%) France 9 9 8Europe (excluding France) 23 24 24United States 17 19 19Japan 11 11 12Asia (excluding Japan) 32 29 29Other markets 8 8 8
Total 100 100 100
Type of revenue as a percentage of total revenue (excluding Louis Vuitton) Retail 64 64 62Wholesale 35 35 36Licenses 1 1 2
Total 100 100 100
Profit from recurring operations(EUR millions) 2,775 4,905 2,192Operating margin (%) 32.3 31.7 31.8
Operating investments of the period (EUR millions) 325 563 245
Number of stores 1,772 1,769 1,561
Highlights
Growth at Louis Vuitton was driven once again by exceptionalcreativity in all its businesses and by maintaining the rightbalance between tradition and modernity, the development oficonic lines, and new designs. The half-year period featured aseries of successful runway shows, in exceptional settings for the2019 Autumn-Winter and 2019 Cruise collections of NicolasGhesquière. A new chapter began for its menswear collectionswith the arrival of the talented, multi-award-winning artist,architect and designer Virgil Abloh, the new Men’s ArtisticDirector, whose debut collection was very well received andwidely commented on social media. Louis Vuitton renewed its partnerships with the French Open and with FIFA for the
2018 World Cup. It unveiled its first men’s fragrance collection,featuring five exceptional scents that evoke a sense of adventureand travel. In communications, actress Emma Stone made herfirst appearance as the new face of the “Spirit of Travel” in theheart of the California desert. With the constant aim of offeringits customers unique experiences, Louis Vuitton opened pop-up stores in a number of different locations and continuedenhancing the quality of its retail network.
Christian Dior Couture, which has been consolidated since thesecond half of 2017, maintained its dynamism in all geographicregions and all its product categories. Leather goods, ready-to-wear, footwear and jewelry all saw strong growth. Excellence andcreativity were on high display at the runway shows for MariaGrazia Chiuri’s collections: the Spring / Summer 2018 HauteCouture show, an ode to surrealism, was followed by a hugemasked ball in the gardens of the Rodin Museum, and theCruise collection show was held at the Domaine de Chantillyfollowing a performance by traditional female equestrians fromMexico. Kim Jones joined the Fashion house as Artistic Directorof the Men’s Ready-to-Wear and Men’s Accessories collections.His first runway show, for Summer 2019, was very well received.
Fendi’s performance was buoyed by the brand’s strongdesirability, especially for ready-to-wear and footwear, and themomentum achieved by its menswear collections. Its heritageand creativity were showcased at several high-profile events in Rome, London and Shanghai. The “FF Reloaded” capsulecollection inspired by its emblematic logo was enthusiasticallyreceived.
Loro Piana continued to accentuate the beauty and nobility ofits raw materials, enriching its range of exceptional productswith a special focus on its premium womenswear. It expandedits distribution network and strengthened its presence in Asia.
Céline maintained its excellent momentum, driven by theongoing success of its leather goods lines. It embarked on anambitious new phase in its development with the arrival ofHedi Slimane as Artistic, Creative and Image Director.
Givenchy benefited from the success of Clare Waight Keller’sfirst collections, presented with an exclusive staging at severalemblematic boutiques. The main highlight of the half-yearperiod was the design of the Duchess of Sussex’s weddinggown, with media coverage of the event generating extremelyhigh visibility for Givenchy.
3. FASHION AND LEATHER GOODS
to promote their brands and enhance their appeal. Hennessyhas reaffirmed its foresight and agility by investing in newproduction capacity and, further upstream, in strong relationshipswith its eaux-de-vie suppliers. Focused more than ever on the
quality of the customer experience and respecting their specificidentities, all of the business group’s Maisons are stepping uptheir commitment to social and environmental responsibility,the key to maintaining sustainable, balanced growth.
11Interim Financial Report - Six-month period ended June 30, 2018
Fashion and Leather Goods
BUSINESS REVIEW AND COMMENTS ON THE HALF-YEAR CONSOLIDATED FINANCIAL STATEMENTS OF LVMH GROUP

June 30, Dec. 31, June 30, 2018 2017 2017
Revenue (EUR millions) 2,877 5,560 2,670
Revenue by product category (%) Perfumes 32 36 34Makeup 49 47 48Skincare products 19 17 18
Total 100 100 100
Revenue by geographic region of delivery (%) France 11 11 11Europe (excluding France) 21 24 22United States 14 17 16Japan 5 5 5Asia (excluding Japan) 37 30 33Other markets 12 13 13
Total 100 100 100
Profit from recurring operations (EUR millions) 364 600 292Operating margin (%) 12.7 10.8 10.9
Operating investments of the period (EUR millions) 135 286 112
Number of stores 316 302 266
Highlights
All product categories and all regions worldwide – especiallyAsia, which advanced at a particularly fast pace – contributedto the strong growth achieved by the Perfumes and Cosmeticsbusiness group. The different Maisons leveraged their creativityto innovate and enrich their iconic product lines, and madesignificant investments in their communication campaigns,particularly online.
Parfums Christian Dior continued to show excellent momentum,increasing and consolidating its market shares in all regions,with outstanding growth in Asia. One of the drivers of thisperformance was the exceptional interest generated by Sauvageand the launch of its Eau de Parfum version, as well as the strongappeal of its women’s fragrances: J’adore reaffirmed its vitalityfollowing a record-setting year, and Miss Dior made furtherheadway, driven by its new communication campaign and its innovative “roller-pearl” bottles, a fresh new way to applyperfume. Parfums Christian Dior continued to develop its auraas a prestigious perfume house by cultivating its unique roots inGrasse, the cradle of perfumery. Makeup saw strong momentumin lipsticks, with rapid international growth for Rouge Dior andthe performance of the Forever foundations. The new DiorBackstage line, inspired by products used by runway makeupartists, had a promising start. Growth in skincare was drivenby strategic, premium and anti-age products: the Prestige linewas boosted by the Micro-Huile de Rose and Cushion Teint de Roseproducts, and the Capture Youth line launched in January didwell among younger age groups.
4. PERFUMES AND COSMETICS
Under the leadership of its Creative Director Jonathan Anderson,Loewe achieved good growth, with particularly strong resultsin Japan and the rest of Asia. Its Gate bag was very well received.
Kenzo continued its ascent and launched its Memento N°2collection, which celebrates and reinterprets the brand’s heritage.Strengthening its distribution capacities and expanding itsdigital presence remained major strategic priorities.
Marc Jacobs continued to reorganize and to develop its productlines. Its Snapshot leather goods line saw rapid growth.
Rimowa worked to strengthen its distribution capacities andlaunched a highly successful collaboration with New York-basedbrand Supreme to design a limited edition of suitcases.
Berluti welcomed Kris Van Assche as its new Artistic Director.More personalized product services were developed and thestore network continued to expand.
Manifattura Thélios, the new production facility in Italy foreyewear designed by certain Group brands, was inaugurated in April.
Outlook
Louis Vuitton will keep building on its creative momentumand its unique traditional craftmanship. In terms of products,high-profile initiatives will be launched in all businesses, andplans are underway for a number of emblematic stores. Campaignsand events closely interwoven with Louis Vuitton’s businesshighlights will support these developments, and it will continueto reinforce its production capacity. Growth at Christian Dior Couture will continue to be founded on its core values ofexcellence and creativity, coupled with highly attentive customercare. Several events held in its strategic markets will furthersolidify its exceptional reputation. For Céline, Hedi Slimane’shighly anticipated first runway show in September will be amajor highlight of the second half of the year. Fendi will open its first store in Spain, in Barcelona. To continue makingprogress, all of the brands will maintain their focus on creativityin their collections, the utmost quality of their products, retailexcellence, the customer experience, raising their digital profiles,and expanding online sales.
12 Interim Financial Report - Six-month period ended June 30, 2018
Fashion and Leather Goods. Perfumes and Cosmetics
BUSINESS REVIEW AND COMMENTS ON THE HALF-YEAR CONSOLIDATED FINANCIAL STATEMENTS OF LVMH GROUP

Guerlain achieved very strong performance in the perfumesegment, with the expansion of Mon Guerlain through the launchof its Eau de Parfum Florale version, along with the internationalrollout of Guerlain Parfumeur boutiques. The new Tsumboutique in Moscow and the pop-up store at Le Bon Marchéreflected the success of this new concept of perfume-centeredboutiques, combining heritage and bold creativity. In makeup,the iconic Rouge G lipstick delivered a remarkable performance,boosted by an unrivaled potential for customization, offering450 possible case and color combinations. The Abeille Royaleskincare line posted strong growth. In Paris, Guerlain held itssecond annual “Bee University” symposium dedicated to theprotection of bees and biodiversity.
Parfums Givenchy’s makeup, lipstick and Prisme Libre lineswere immensely popular. The success of Gentleman Givenchyand the relaunch of Irrésistible Givenchy boosted the perfumesbusiness. Kenzo Parfums continued on its growth track thanksto its latest opus, Kenzo World Eau de Toilette. Flower by Kenzorolled out a new marketing campaign.
Benefit expanded its offering with the successful launch of itsthird mascara, BADgal BANG!, bolstering its leading positionin this segment. The highly anticipated relaunch of its GimmeBrow eyebrow gel, featuring a wider palette of shades, was verywell received. Make Up For Ever continued its internationaldevelopment, particularly thanks to the expansion of its onlinesales. Fresh achieved strong growth, particularly in Asia, withthe success of its Rose and Black Tea skincare lines, enriched by itsBlack Tea Kombucha essence, a new iconic product in keeping withthe pioneering spirit of Fresh in the use of natural ingredients.The proportion of revenue attributable to online sales increasedstrongly over the period. Acqua di Parma saw strong growthin its Colonia lines, thanks to Colonia Pura in particular, while the
Chinotto di Liguria fragrance rounded out the Blu Mediterraneorange. A year after its launch, Fenty Beauty by Rihannaconfirmed its remarkable global success and has alreadyestablished itself as a major cosmetics brand. Marc JacobsBeauty’s momentum was driven by the successful launch of itsnew Shameless liquid foundation. Maison Francis Kurkdjianopened its first boutique in the United States, in Miami, and a new space at Galeries Lafayette in Paris. Parfums Loewemade its debut in China, where its 001 range was very popularwith younger Chinese customers.
Outlook
Excellence and creativity will drive the activities of the differentbrands in the months to come. Parfums Christian Dior willcontinue to reaffirm its status as a leading perfume house. In addition to supporting its iconic fragrances, the brand willlaunch a new women’s fragrance, with actress and Dior brandambassador Jennifer Lawrence as its face. Innovations in makeupwill highlight the brand’s expertise, its mastery of the art ofcolor and its firm roots in fashion, exemplified by the new Dior Backstage foundation, which will continue its rollout. Diorskincare will benefit from its development in Asian markets,which have a vast potential for this product category. Guerlainwill continue rolling out its Guerlain Parfumeur stores, includinga new boutique in Paris. The second half of the year will alsosee the launch, in skincare, of the Double R Abeille Royale serum.Parfums Givenchy will launch a new perfume, with theAmerican actress Rooney Mara as its muse. Benefit will add toits range of brow products and launch a new foundation that staystrue to the brand’s identity. Kenzo Parfums will present a newEau de Toilette, Flower by Kenzo Red Edition, and Kenzo Worldwill make its debut in China.
13Interim Financial Report - Six-month period ended June 30, 2018
Perfumes and Cosmetics
BUSINESS REVIEW AND COMMENTS ON THE HALF-YEAR CONSOLIDATED FINANCIAL STATEMENTS OF LVMH GROUP

June 30, Dec. 31, June 30, 2018 2017 2017
Revenue (EUR millions) 1,978 3,805 1,838
Revenue by geographic region of delivery (%) France 5 6 5Europe (excluding France) 22 25 25United States 9 9 9Japan 12 13 13Asia (excluding Japan) 37 31 32Other markets 15 16 16
Total 100 100 100
Profit from recurring operations (EUR millions) 342 512 234Operating margin (%) 17.3 13.5 12.7
Operating investments of the period (EUR millions) 145 269 130
Number of stores 413 405 391
Highlights
Growth for the Watches and Jewelry business group was fueledby the excellent performance of its main brands, buoyed by the strength of their iconic lines and the creativity embodied in their new products. Jewelry and directly operated stores didparticularly well. The Watches and Jewelry brands raised theirprofile by opening new stores and remodeling existing stores in prestigious locations, as well as through ongoing selectiveinvestments in communications.
Bvlgari had an excellent first half and increased its market share.This growth momentum, especially apparent in jewelry and in the Chinese and US markets, was driven by the success ofthe iconic Serpenti, B.Zero1, Diva, Lvcea and Octo product lines, and supported by highly creative digital communication as wellas the launch of new product lines, such as the B.Zero1 Multigoldand Lvcea Tubogas collections. The Wild Pop fine jewelry collectionshowcases Bvlgari’s contemporary design, bold vision and uniqueexpertise. At Baselworld, the brand presented the Serpenti TwistYour Time, which offers a range of color combinations, and OctoFinissimo Tourbillon, a technical masterpiece that set a new worldrecord for its ultra-thin design. Its store renovation programcontinued, by opening new stores in Boston, Vancouver,Melbourne and Saint Petersburg. In Rome, the “New CuriosityShop” concept featuring exclusive collections and an interactiveexperience provides a magnificent showcase for Bvlgari’s creativity.
TAG Heuer’s dynamism was reflected in new additions to itsflagship Carrera, Aquaracer and Formula 1 collections. TheCarrera Calibre Heuer 02 Tourbillon and Monaco Bamford modelswere particularly well received at Baselworld. A smaller versionof the smartwatch proved a successful addition to the range.
TAG Heuer opened a flagship store on Fifth Avenue in NewYork. Faithful to its avant-garde spirit, the company also unveileda modular and connected store, in Tokyo’s Ginza district,offering a unique customer experience. TAG Heuer continuedto draw on its network of brand ambassadors and its manysports and cultural contracts, helping to increase its visibilitywith target customers, and its very active social media presence.
Hublot continued its robust growth, particularly in China andthe United States, driven by its flagship Classic Fusion and Big Bang lines, and by the development of Spirit of Big Bang,which is now the brand’s third core collection. The watchmakerillustrated its creativity and innovative spirit with new modelsincluding Big Bang Red Magic, Meca 10 Ceramic Blue and ClassicFusion Aerofusion Orlinski, designed in collaboration withrenowned French sculptor Richard Orlinski. A wide range ofpublicity and events helped raise the brand’s profile. Specialemphasis was placed on the soccer World Cup, including thelaunch of Hublot’s first smartwatch, the Big Bang Referee 2018.Hublot continued to improve its distribution and expand itsnetwork of directly operated stores.
While continuing to develop its iconic Chronomaster, Elite andPilot collections, Zenith completed the launch of its Defy line.The brand’s revolutionary El Primero 21 model, which measurestime down to the hundredth of a second, proved highly successful.Zenith continued to consolidate its organization while leveragingsynergies offered by the Group’s other watchmaking brands.
Growth at Chaumet was primarily fueled by the successful Liensand Joséphine lines, and by its ongoing shift further upmarket,particularly in China and the rest of Asia. New designs enrichedits collections, including the Liens Evidence and Liens Séductionbracelets, as well as the new Jeux de Liens models. In fine jewelry,the brand launched its Les Mondes de Chaumet collection, withthe first chapter, Promenades Impériales, drawing inspirationfrom Russia.
Fred actively developed its Force 10 line and its new 8°0collection. A new store was opened in Saint-Tropez in April.
Outlook
The Watches and Jewelry business group has maintained itstargets for market share gains in 2018. It is therefore paying closeattention to market developments and remains highly rigorousin the allocation of resources. The watches and jewelry brandswill benefit from targeted investments, particularly focused ononline campaigns, while continuing their programs dedicatedto enhancing the quality and productivity of their distributionmodel. Bvlgari will open a new store in Hong Kong. Chaumetwill inaugurate an exhibition on its culture and history at Tokyo’sMitsubishi Ichigokan Museum in late June, while a new conceptstore has just been opened in the city’s Ginza district. An active360-degree communications strategy is being rolled out acrossthe country. Hublot will open a flagship store on Bond Streetin London.
5. WATCHES AND JEWELRY
14 Interim Financial Report - Six-month period ended June 30, 2018
Watches and Jewelry
BUSINESS REVIEW AND COMMENTS ON THE HALF-YEAR CONSOLIDATED FINANCIAL STATEMENTS OF LVMH GROUP

June 30, Dec. 31, June 30, 2018 2017 2017
Revenue (EUR millions) 6,325 13,311 6,280
Revenue by geographic region of delivery (%) France 11 12 11Europe (excluding France) 9 8 8United States 37 39 39Japan 2 1 1Asia (excluding Japan) 29 28 29Other markets 12 12 12
Total 100 100 100
Profit from recurring operations (EUR millions) 612 1,075 441Operating margin (%) 9.7 8.1 7.0
Operating investments of the period (EUR millions) 205 570 261
Number of stores Sephora 1,840 1,825 1,769Other trade names 57 55 54
Highlights
Selective Retailing delivered organic revenue growth of 9%,reflecting the momentum at all of its brands. Excluding theimpact of the termination of DFS’s Hong Kong InternationalAirport concessions, which helped improve profitability, thisgrowth came to 15%.
Sephora once again saw strong growth and gained market sharein all its key countries and regions. Very good results were alsoachieved in Germany, where it made its debut in 2017. Sephorasignificantly increased the proportion of its online sales, whilecontinuing to expand and renovate its network of stores for anever more innovative customer experience. Highlights includedthe reopening of its store at the Saint-Lazare train station in Parisand the inauguration of a second Sephora Studio in Hoboken,New Jersey. Whether new or renovated, all of these stores areequipped with the full Sephora digital ecosystem, includingnotably the Beauty Hub, the Beauty Board, the Virtual Artistaugmented reality mirror, as well as mobile checkout. Sephora’sexpanding digital presence is being more and more seamlesslyintegrated into the shopping experience to offer customers evermore personalized recommendations. Online and in its stores,Sephora continued to enhance its services and add disruptive,innovative products to its line-up. Sephora Collection, its ownbrand, has gained a strong following among younger customers,who closely track the latest social media-driven trends. Theproducts launched in the first half of the year – Lipstories, theSephora Collection Bath range and new Cream Lip Stain shades –met with great success.
Le Bon Marché’s growth was driven by its excellent selectionof products, the quality of service offered to its customers andthe success of its loyalty program. The store’s makeover plancontinued with the renovation of the children’s department.Two highlights of the first half of the year were Under the Sky,an exhibition by the Argentine artist Leandro Erlich, followedby the Mosaert exhibition, featuring a collection developed by singer Stromae. La Grande Épicerie de Paris now enjoys adual presence on the city’s Right and Left Banks. The 24 Sèvresdigital platform, which was launched in June 2017, continuedits targeted development, aiming to offer a unique onlineshopping experience. In the first half of the year, its productoffering was expanded beyond its selection of fashion andaccessories with the addition of jewelry.
DFS continued to benefit from the upturn in its markets. Two key shopping periods in Asia – the New Year and Japan’s“Golden Week” – saw particularly strong results. With steadilyrising tourist numbers and offerings in keeping with the spiritof each destination, the recently opened stores in Venice and atSiem Reap in Cambodia achieved excellent results. Highlightsof the first half of the year included the reopening of the T Galleria in Sydney’s business district and the inauguration of two new stores devoted to beauty products in Macao. DFS expanded its digital initiatives to better serve travelers andstreamline their shopping experience. Sales made to Loyal Trewards program members reached record levels.
Starboard Cruise Services strengthened its position as thepremier retailer of luxury brands in the cruise industry byexpanding its presence in Asia. The company further enhancedthe attractiveness of its stores while improving the quality of itsproduct offerings and the experiences created for its customers.
Outlook
Sephora will continue its geographic expansion and omni-channeldevelopment to consolidate its leadership position. The secondhalf of the year will feature the openings of new Sephora Studiosin the United States and a number of renovations throughoutthe world. Sephora will rely more than ever on innovation, its highly motivated staff and its in-depth understanding of its customers’ needs to offer each and every one of them anexceptional in-person or digital shopping experience, whereverthey are. Le Bon Marché will continue to cultivate its uniqueidentity, which has won over a highly discerning clientele. Fall highlights will include the opening of the renovatedchildren’s department and an exhibition on Los Angeles. DFSwill continue to focus on its key priorities: enhancing the appealof its stores and moving them upmarket, developing its digitalplatform and planning events. Major renovations are underwayat the flagship store on Canton Road in Hong Kong and at San Francisco International Airport, where its concession wasrecently renewed.
6. SELECTIVE RETAILING
Selective retailing
15Interim Financial Report - Six-month period ended June 30, 2018
BUSINESS REVIEW AND COMMENTS ON THE HALF-YEAR CONSOLIDATED FINANCIAL STATEMENTS OF LVMH GROUP

LVMH’s consolidated balance sheet totaled 71.7 billion eurosas of end-June 2018, 1.9 billion euros higher than at year-end2017. Non-current assets rose by 0.8 billion euros and represented69% of total assets, as was the case at year-end 2017.
Tangible and intangible fixed assets grew by 0.5 billion euros,of which 0.2 billion euros was due to the impact on goodwill ofthe revaluation of purchase commitments for minority interests.Investments for the half-year period, net of depreciation and amortization charges as well as disposals, represented anadditional increase of 0.1 billion euros. The comments on thecash flow statement provide further information on investments.Exchange rate fluctuations had a positive 0.2 billion euroimpact, mainly due to the appreciation of the US dollar againstthe euro between December 31, 2017 and June 30, 2018.
Other non-current assets increased by 0.3 billion euros, amountingto 4.3 billion euros, primarily as a result of the change in themarket value of derivatives and available for sale financialassets.
Inventories increased by 1.0 billion euros, a change related toinventory build-up over the period (see comments on theconsolidated cash flow statement).
Within other current assets, cash and cash equivalents increasedby 0.7 billion euros. Conversely, the market value of derivativesdecreased by 0.4 billion euros. Operating receivables were also lower, declining by 0.2 billion euros, a change related to the seasonal nature of the Group’s business activities. The change in other current assets was thus limited, increasingby 0.1 billion euros.
Other non-current liabilities totaled 17.8 billion euros, up0.4 billion euros from 17.4 billion euros as of December 31, 2017.This change was due, for 0.3 billion euros, to the increase inthe liability in respect of purchase commitments for minorityinterests and, for the remainder, to the increase in the marketvalue of derivatives.
Lastly, other current liabilities decreased by 0.5 billion euros,amounting to 10.0 billion euros. This decline was mainly dueto the decrease in tax and social security liabilities, a changereflecting the seasonal nature of the Group’s business activities.
(1) The financial statements as of December 31, 2017 and June 30, 2017 have been restated to reflect the retrospective application with effect from January 1, 2016 of IFRS9 Financialinstruments. See Note 1.2 of notes to the condensed consolidated financial statements.
(2) The financial statements as of December 31, 2017 have been restated to reflect the definitive purchase price allocation of Christian Dior Couture. See Note 2 of notes to the condensedconsolidated financial statements.
(EUR billions) June 30, Dec. 31, Change(1) (2)
2018 2017
Tangible and intangible fixed assets 45.2 44.7 0.5Other non-current assets 4.3 4.0 0.3
Non-current assets 49.5 48.7 0.8
Inventories 11.9 10.9 1.0Other current assets 10.3 10.2 0.1
Current assets 22.2 21.1 1.1
Assets 71.7 69.8 1.9
(EUR billions) June 30, Dec. 31, Change(1) (2)
2018 2017
Total equity 31.5 30.4 1.1Long term borrowings 6.7 7.0 (0.3)Other non-current liabilities 17.8 17.4 0.4
Equity and non-current liabilities 56.0 54.8 1.2
Short term borrowings 5.7 4.5 1.2Other current liabilities 10.0 10.5 (0.5)
Current liabilities 15.7 15.0 0.7
Liabilities and equity 71.7 69.8 1.9
7. COMMENTS ON THE CONSOLIDATED BALANCE SHEET
7.1. Restatements to the balance sheet as of December 31, 2017
The balance sheet as of December 31, 2017 has been restated to reflect:
- the retrospective application of IFRS 9 Financial Instruments as of January 1, 2016;
- the finalization of the purchase price allocation for Christian Dior, acquired in 2017.
See Notes 1.2 and 2 to the condensed half-year consolidated financial statements;
7.2. Balance sheet as of June 30, 2018
16 Interim Financial Report - Six-month period ended June 30, 2018
Comments on the consolidated balance sheet.
BUSINESS REVIEW AND COMMENTS ON THE HALF-YEAR CONSOLIDATED FINANCIAL STATEMENTS OF LVMH GROUP

8. COMMENTS ON THE CONSOLIDATED CASH FLOW STATEMENT
8.1. Restatements to the consolidated cash flow statement as of June 30, 2017
The consolidated cash flow statement as of June 30, 2017 has been restated to reflect the retrospective application of IFRS 9 FinancialInstruments as of January 1, 2016: see Note 1.2 to the condensed half-year consolidated financial statements.
8.2. Cash flow statement as of June 30, 2018
(EUR millions) June 30, 2018 June 30, 2017(1) Change
Cash from operations before changes in working capital 5,464 4,501 963Cost of net financial debt: interest paid (73) (51) (22)Income taxes paid (907) (1,068) 161
Net cash from operating activities before changes in working capital 4,484 3,382 1,102
Change in working capital (1,323) (1,130) (193)Operating investments (1,204) (988) (216)
Free cash flow 1,957 1,264 693
Financial investments (35) (441) 406Transactions relating to equity (2,134) (1,686) (448)
Change in cash before financing activities (212) (863) 651
(1) The financial statements as of December 31, 2017 and June 30, 2017 have been restated to reflect the retrospective application with effect from January 1, 2016 of IFRS9 Financialinstruments. See Note 1.2 of notes to the condensed consolidated financial statements.
(2) The financial statements as of December 31, 2017 have been restated to reflect the definitive purchase price allocation of Christian Dior Couture. See Note 2 of notes to the condensedconsolidated financial statements.
Net financial debt and equity
(EUR billions or as %) June 30, Dec. 31, Change(1) (2)
2018 2017
Long-term borrowings 6.7 7.0 (0.3)Short-term borrowings and derivatives 5.7 4.5 1.2
Gross borrowings after derivatives 12.4 11.5 0.9
Cash and cash equivalents and other (5.0) (4.3) (0.7)
Net financial debt 7.4 7.2 0.2
Equity 31.5 30.4 1.1Net financial debt / Total equity ratio 23.4% 23.5% -0.1 pt
The ratio of net financial debt to equity, remained stable at23.4%, compared to 23.5% as of December 31, 2017.
Total equity amounted to 31.5 billion euros as of June 30, 2018,up 1.1 billion euros from year-end 2017. Net profit for the six-month period, after the distribution of dividends, contributed1.3 billion euros to this increase. In addition to this, exchangerate fluctuations had a positive impact of 0.1 billion euros on
the reserves of entities reporting in foreign currencies; thismainly concerned the reserves of entities reporting in US dollars.Conversely, the change in revaluation reserves had a negativeimpact of 0.3 billion euros, resulting mainly from the transferto the income statement of unrealized gains on hedges of futurecash flows. As of June 30, 2018, total equity was equal to 44%of total assets, as was the case at year-end 2017.
Gross borrowings after derivatives totaled 12.4 billion euros asof end-June 2018, an increase of 0.9 billion euros over year-end2017. Bond debt declined by 0.5 billion euros, following the redemption of the 500 million euro bond issued in 2011,which matured in the first half. Conversely, commercial paper outstanding increased by 1.4 billion euros. Cash, cashequivalents, and current and non-current available for salefinancial assets used to hedge financial debt totaled 5.0 billioneuros as of end-June 2018, up 0.7 billion euros from 4.3 billioneuros at year-end 2017. The net financial debt thus increasedby 0.2 billion euros.
As of end-June 2018, the Group’s undrawn confirmed credit linesamounted to 3.9 billion euros, thus exceeding the outstandingportion of its commercial paper program, which came to 3.3 billion euros as of June 30, 2018.
17Interim Financial Report - Six-month period ended June 30, 2018
Comments on the consolidated balance sheet. Comments on the consolidated cash flow statement
BUSINESS REVIEW AND COMMENTS ON THE HALF-YEAR CONSOLIDATED FINANCIAL STATEMENTS OF LVMH GROUP

Cash from operations before changes in working capital totaled5,464 million euros, up 21% from 4,501 million euros a yearearlier. Net cash from operating activities before changes inworking capital (i.e. after interest and income taxes paid)amounted to 4,484 million euros, up 33% from the first half of 2017.
Interest paid totaled 73 million euros in the first half of 2018,up from 51 million euros in the first half of 2017, mainly dueto the change in the amounts paid in respect of forward pointsrelating to foreign exchange swaps having matured during theperiod.
Income taxes paid came to 907 million euros, 15% less thanthe 1,068 million euros paid a year earlier, primarily due to thelower tax rate in the United States beginning in 2018.
The 1,323 million euro increase in the working capitalrequirement was close to the 1,130 million euro increase observeda year earlier. The cash requirement relating to the increase ininventories amounted to 1,038 million euros, versus 938 millioneuros a year earlier. The increase in inventories affected allbusiness groups. The decreases in trade accounts payable andtax and social security liabilities generated an additional cashrequirement of 567 million euros in the first half, very near the 559 million euros observed ine the first half of 2017 andfinanced in the amount of 282 million euros by the decline intrade accounts receivable, which was lower than the decline of366 million euros a year earlier. These amounts reflect theseasonal nature of the Group’s business activities.
Operating investments net of disposals resulted in an outflowof 1,204 million euros as of June 30, 2018, compared with988 million euros a year earlier. These mainly includedinvestments by the Group’s brands, notably Sephora, Louis
Vuitton, Parfums Christian Dior, Christian Dior Couture andBvlgari, in their retail networks. They also included investmentsby the champagne houses and Hennessy in their productionequipment, investments related to the La Samaritaine andJardin d’Acclimatation projects, as well as real estate investments.
As of June 30, 2018, non-current available for sale financialassets accounted for an outflow of 35 million euros, versus anoutflow of 441 million euros as of June 30, 2017, mainly relatedto the acquisition of 80% of Rimowa.
Transactions relating to equity generated an outflow of2,134 million euros. A portion of this amount, 1,752 millioneuros, relates to dividends paid during the fiscal year by LVMHSE, excluding the amount attributable to treasury shares, ofwhich 1,709 million euros was for the final dividend paymentin respect of fiscal year 2017 and 43 million euros was for thetax on dividends paid. Added to this were the dividends paidout to minority shareholders of consolidated subsidiaries, in the amount of 287 million euros, acquisitions of minorityinterests for 72 million euros, and an 88 million euro outflowrelating to acquisitions and disposals of LVMH treasury shares.Conversely, share subscription options exercised during the firsthalf and capital increases subscribed by minority shareholdersof Group subsidiaries generated an inflow of 65 million euros.
The financing requirement after all transactions relating tooperating activities, investments and equity thus totaled212 million euros, financed in the amount of 618 million eurosby means of net cash from financing activities, generating a cashsurplus of 406 million euros. As the change in the cumulativetranslation adjustment relating to cash flows was a positiveimpact of 29 million euros, the cash balance at the end of the period amounted to 4,053 million euros, representing anincrease of 435 million euros from its level at year-end 2017.
18 Interim Financial Report - Six-month period ended June 30, 2018
Comments on the consolidated cash flow statement
BUSINESS REVIEW AND COMMENTS ON THE HALF-YEAR CONSOLIDATED FINANCIAL STATEMENTS OF LVMH GROUP

19Interim Financial Report - Six-month period ended June 30, 2018
CONDENSED HALF-YEAR CONSOLIDATED FINANCIAL STATEMENTS
CONSOLIDATED INCOME STATEMENT 20CONSOLIDATED STATEMENT OF COMPREHENSIVE GAINS AND LOSSES 21CONSOLIDATED BALANCE SHEET 22CONSOLIDATED STATEMENT OF CHANGES IN EQUITY 24CONSOLIDATED CASH FLOW STATEMENT 26SELECTED NOTES TO THE CONSOLIDATED FINANCIAL STATEMENTS 27

(1) The financial statements as of December 31, 2017 and June 30, 2017 have been restated to reflect the retrospective application with effect from January 1, 2016 of IFRS9 Financialinstruments. See Note 1.2.
(2) The financial statements as of December 31, 2017 have been restated to reflect the definitive purchase price allocation of Christian Dior Couture. See Note 2.
20 Interim Financial Report - Six-month period ended June 30, 2018
CONDENSED HALF-YEAR CONSOLIDATED FINANCIAL STATEMENTS
CONSOLIDATED INCOME STATEMENT
(EUR millions, except for earnings per share) Notes June 30, 2018 Dec. 31, 2017(1) (2) June 30, 2017(1)
Revenue 23 21,750 42,636 19,714Cost of sales (7,130) (14,783) (6,881)
Gross margin 14,620 27,853 12,833
Marketing and selling expenses (8,305) (16,395) (7,704)General and administrative expenses (1,679) (3,162) (1,488)Income (loss) from joint ventures and associates 7 12 (3) (1)
Profit from recurring operations 23-24 4,648 8,293 3,640
Other operating income and expenses 25 (70) (180) (95)
Operating profit 4,578 8,113 3,545
Cost of net financial debt (56) (137) (62)Other financial income and expenses 34 78 43
Net financial income (expense) 26 (22) (59) (19)
Income taxes 27 (1,264) (2,214) (1,185)
Net profit before minority interests 3,292 5,840 2,341
Minority interests 17 (288) (475) (214)
Net profit, Group share 3,004 5,365 2,127
Basic Group share of net earnings per share (EUR) 28 5.97 10.68 4.24Number of shares on which the calculation is based 502,816,581 502,412,694 502,241,900
Diluted Group share of net earnings per share (EUR) 28 5.96 10.64 4.22Number of shares on which the calculation is based 504,102,671 504,010,291 504,049,366

(1) The financial statements as of December 31, 2017 and June 30, 2017 have been restated to reflect the retrospective application with effect from January 1, 2016 of IFRS9 Financialinstruments. See Note 1.2.
(2) The financial statements as of December 31, 2017 have been restated to reflect the definitive purchase price allocation of Christian Dior Couture. See Note 2.
21Interim Financial Report - Six-month period ended June 30, 2018
CONDENSED HALF-YEAR CONSOLIDATED FINANCIAL STATEMENTS
CONSOLIDATED STATEMENT OF COMPREHENSIVE GAINS AND LOSSES
(EUR millions) Notes June 30, 2018 Dec. 31, 2017(1) (2) June 30, 2017(1)
Net profit before minority interests 3,292 5,840 2,341
Translation adjustments 133 (958) (500)Amounts transferred to income statement - 18 -Tax impact 7 (49) (25)
15.4 140 (989) (525)
Change in value of hedges of future foreign currency cash flows (7) 372 158Amounts transferred to income statement (266) (104) (2)Tax impact 79 (77) (46)
(194) 191 110
Change in value of the ineffective portion of hedging instruments (159) (91) 50Amounts transferred to income statement 56 210 75Tax impact 25 (35) (36)
(78) 84 89
Gains and losses recognized in equity, transferable to income statement (132) (714) (326)
Change in value of vineyard land 6 - (35) 5Amounts transferred to consolidated reserves - - -Tax impact - 82 (2)
- 47 3
Employee benefit commitments: change in value resulting from actuarial gains and losses - 57 38Tax impact - (24) (11)
- 33 27
Gains and losses recognized in equity, not transferable to income statement - 80 30
Comprehensive income 3,160 5,206 2,045Minority interests (303) (341) (126)
Comprehensive income, Group share 2,857 4,865 1,919

(1) The financial statements as of December 31, 2017 and June 30, 2017 have been restated to reflect the retrospective application with effect from January 1, 2016 of IFRS9 Financialinstruments. See Note 1.2.
(2) The financial statements as of December 31, 2017 have been restated to reflect the definitive purchase price allocation of Christian Dior Couture. See Note 2.
22 Interim Financial Report - Six-month period ended June 30, 2018
CONDENSED HALF-YEAR CONSOLIDATED FINANCIAL STATEMENTS
CONSOLIDATED BALANCE SHEET
ASSETS Notes June 30, 2018 Dec. 31, 2017(1) (2) June 30, 2017(1)
(EUR millions)
Brands and other intangible assets 3 17,026 16,957 13,119Goodwill 4 14,026 13,837 11,899Property, plant and equipment 6 14,162 13,862 12,140Investments in joint ventures and associates 7 640 639 671Non-current available for sale financial assets 8 883 789 740Other non-current assets 9 1,062 869 854Deferred tax 1,775 1,741 1,916
Non-current assets 49,574 48,694 41,339
Inventories and work in progress 10 11,883 10,888 10,865Trade accounts receivable 11 2,738 2,736 2,271Income taxes 463 780 301Other current assets 12 2,860 2,919 2,604Cash and cash equivalents 14 4,222 3,738 8,449
Current assets 22,166 21,061 24,490
Total assets 71,740 69,755 65,829
(1) The financial statements as of December 31, 2017 and June 30, 2017 have been restated to reflect the retrospective application with effect from January 1, 2016 of IFRS9 Financialinstruments. See Note 1.2.
(2) The financial statements as of December 31, 2017 have been restated to reflect the definitive purchase price allocation of Christian Dior Couture. See Note 2.
23Interim Financial Report - Six-month period ended June 30, 2018
CONDENSED HALF-YEAR CONSOLIDATED FINANCIAL STATEMENTS
23
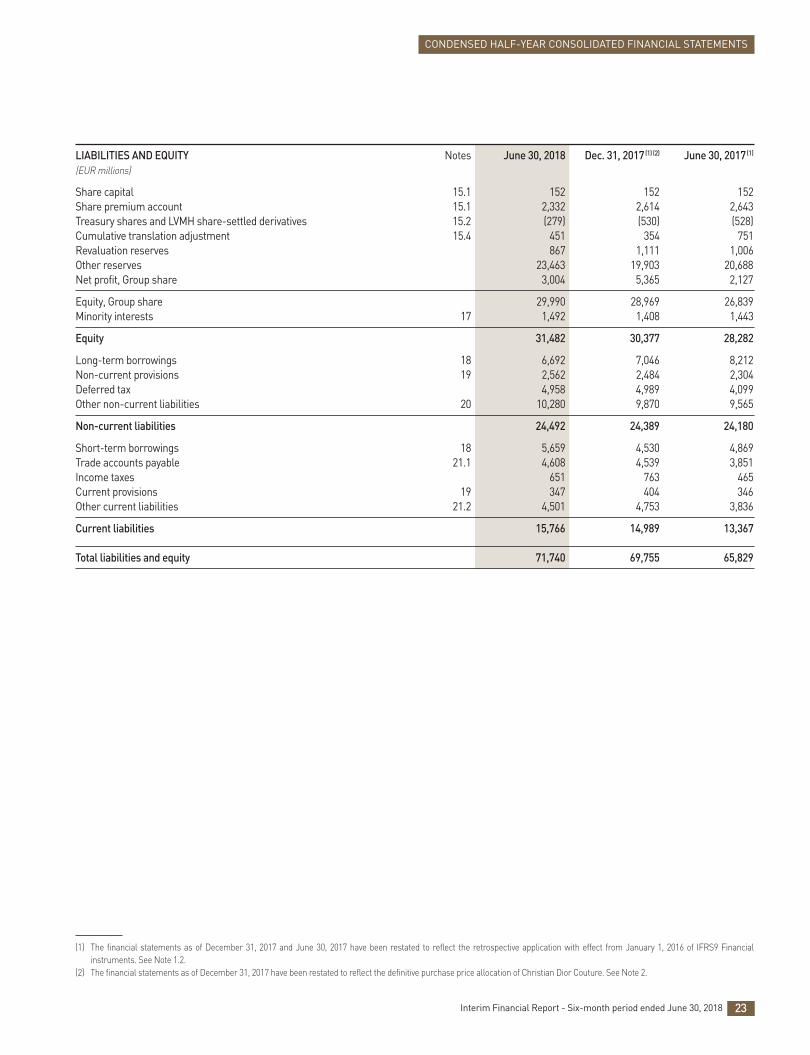
LIABILITIES AND EQUITY Notes June 30, 2018 Dec. 31, 2017(1) (2) June 30, 2017(1)
(EUR millions)
Share capital 15.1 152 152 152Share premium account 15.1 2,332 2,614 2,643Treasury shares and LVMH share-settled derivatives 15.2 (279) (530) (528)Cumulative translation adjustment 15.4 451 354 751Revaluation reserves 867 1,111 1,006Other reserves 23,463 19,903 20,688Net profit, Group share 3,004 5,365 2,127
Equity, Group share 29,990 28,969 26,839Minority interests 17 1,492 1,408 1,443
Equity 31,482 30,377 28,282
Long-term borrowings 18 6,692 7,046 8,212Non-current provisions 19 2,562 2,484 2,304Deferred tax 4,958 4,989 4,099Other non-current liabilities 20 10,280 9,870 9,565
Non-current liabilities 24,492 24,389 24,180
Short-term borrowings 18 5,659 4,530 4,869Trade accounts payable 21.1 4,608 4,539 3,851Income taxes 651 763 465Current provisions 19 347 404 346Other current liabilities 21.2 4,501 4,753 3,836
Current liabilities 15,766 14,989 13,367
Total liabilities and equity 71,740 69,755 65,829

CONSOLIDATED STATEMENT OF CHANGES IN EQUITY
(EUR millions) Number Share Share Treasury Cumulative of shares capital premium shares and translation account LVMH-share adjustment
settled derivatives
Notes 15.1 15.2 15.4 As of December 31, 2016 507,126,088 152 2,601 (520) 1,165
Impact of changes in accounting standards (1) As of January 1, 2017, after restatement 507,126,088 152 2,601 (520) 1,165
Gains and losses recognized in equity (811) Net profit Comprehensive income - - - (811) Stock option plan and similar expenses (Acquisition) / disposal of treasury shares and LVMH share-settled derivatives - (50) Exercise of LVMH share subscription options 708,485 53 - Retirement of LVMH shares (791,977) (40) 40 Capital increase in subsidiaries Interim and final dividends paid Changes in control of consolidated entities Acquisition and disposal of minority interests’ shares Purchase commitments for minority interests’ shares As of December 31, 2017 (1) (2) 507,042,596 152 2,614 (530) 354
Gains and losses recognized in equity 97 Net profit Comprehensive income - - - 97 Stock option plan and similar expenses (Acquisition) / disposal of treasury shares and LVMH share-settled derivatives (80) Exercise of LVMH share subscription options 760,695 49 Retirement of LVMH shares (2,015,257) (331) 331 Capital increase in subsidiaries Interim and final dividends paid Changes in control of consolidated entities Acquisition and disposal of minority interests’ shares Purchase commitments for minority interests’ shares As of June 30, 2018 505,788,034 152 2,332 (279) 451
As of December 31, 2016 507,126,088 152 2,601 (520) 1,165
Impact of changes in accounting standards (1) As of January 1, 2017, after restatement 507,126,088 152 2,601 (520) 1,165
Gains and losses recognized in equity (414) Net profit Comprehensive income - - - (414) Stock option plan and similar expenses (Acquisition) / disposal of treasury shares and LVMH share-settled derivatives (15) Exercise of LVMH share subscription options 646,188 49 Retirement of LVMH shares (145,789) (7) 7 Capital increase in subsidiaries Interim and final dividends paid Changes in control of consolidated entities Acquisition and disposal of minority interests’ shares Purchase commitments for minority interests’ shares As of June 30, 2017 507,626,487 152 2,643 (528) 751
(1) The financial statements as of December 31, 2017 and June 30, 2017 have been restated to reflect the retrospective application with effect from January 1, 2016 of IFRS9 Financial instruments. See Note 1.2.
(2) The financial statements as of December 31, 2017 have been restated to reflect the definitive purchase price allocation of Christian Dior Couture. See Note 2.
24 Interim Financial Report - Six-month period ended June 30, 2018
CONDENSED HALF-YEAR CONSOLIDATED FINANCIAL STATEMENTS

25Interim Financial Report - Six-month period ended June 30, 2018
Revaluation reserves Net profit Total equity and other Available Hedges of future Vineyard Employee reserves Group Minority Total for sale foreign currency land benefit share interests financial cash flows commitments assets
17 125 9 1,078 (163) 21,946 26,393 1,510 27,903
(125) (124) - - 244 (5) - (5) - (115) 1,078 (163) 22,190 26,388 1,510 27,898
- 245 36 30 - (500) (134) (634) 5,365 5,365 475 5,840 - 245 36 30 5,365 4,865 341 5,206 55 55 7 62
(11) (61) - (61) - 53 - 53 - - - - - - 44 44 (2,110) (2,110) (261) (2,371) (6) (6) 114 108 (86) (86) (56) (142) (129) (129) (291) (420) - 130 1,114 (133) 25,268 28,969 1,408 30,377
- (244) - - - (147) 15 (132) 3,004 3,004 288 3,292 - (244) - - 3,004 2,857 303 3,160 38 38 2 40
(6) (86) - (86) - 49 - 49 - - - - - - 25 25 (1,709) (1,709) (287) (1,996) - - (2) (2) (69) (69) (14) (83) (59) (59) 57 (2) - (114) 1,114 (133) 26,467 29,990 1,492 31,482
125 9 1,078 (163) 21,946 26,393 1,510 27,903
(125) (124) - - 244 (5) - (5) - (115) 1,078 (163) 22,190 26,388 1,510 27,898
- 177 2 27 - (208) (88) (296) 2,127 2,127 214 2,341 - 177 2 27 2,127 1,919 126 2,045 24 24 1 25
3 (12) - (12) - 49 - 49 - - - - - - 33 33 (1,305) (1,305) (199) (1,504) (7) (7) 36 29 (82) (82) (55) (137) (135) (135) (9) (144) - 62 1,080 (136) 22,815 26,839 1,443 28,282
CONDENSED HALF-YEAR CONSOLIDATED FINANCIAL STATEMENTS

26 Interim Financial Report - Six-month period ended June 30, 2018
CONDENSED HALF-YEAR CONSOLIDATED FINANCIAL STATEMENTS
CONSOLIDATED CASH FLOW STATEMENT
(EUR millions) Notes June 30, 2018 Dec. 31, 2017(1) (2) June 30, 2017(1)
I. OPERATING ACTIVITIES AND OPERATING INVESTMENTS Operating profit 4,578 8,113 3,545Income / (loss) and dividends from joint ventures and associates 7 (2) 25 6Net increase in depreciation, amortization and provisions 1,066 2,376 1,010Other computed expenses (141) (43) (32)Other adjustments (37) (66) (28)
Cash from operations before changes in working capital 5,464 10,405 4,501Cost of net financial debt: interest paid (73) (129) (51)Tax paid (907) (2,790) (1,068)
Net cash from operating activities before changes in working capital 4,484 7,486 3,382Change in working capital 14.3 (1,323) (514) (1,130)
Net cash from operating activities 3,161 6,972 2,252Operating investments 14.4 (1,204) (2,276) (988)
Net cash from operating activities and operating investments (free cash flow) 1,957 4,696 1,264
II. FINANCIAL INVESTMENTS Purchase of non-current available for sale financial assets(a) 8 (72) (125) (53)Proceeds from sale of non-current available for sale financial assets 8 25 87 18Dividends received 18 13 4Tax paid related to non-current available for sale financial assets and consolidated investments (1) - (1)Impact of purchase and sale of consolidated investments 2 (5) (6,306) (409)
Net cash from (used in) financial investments (35) (6,331) (441)
III. TRANSACTIONS RELATING TO EQUITY Capital increases of LVMH SE 15.1 49 53 49Capital increases of subsidiaries subscribed by minority interests 17 16 44 33Acquisition and disposals of treasury shares and LVMH share-settled derivatives 15.2 (88) (67) (10)Interim and final dividends paid by LVMH SE 15.3 (1,709) (2,110) (1,306)Tax paid related to interim and final dividends paid (43) 388 (100)Interim and final dividends paid to minority interests in consolidated subsidiaries 17 (287) (260) (201)Purchase and proceeds from sale of minority interests 2 (72) (153) (151)
Net cash from (used in) transactions relating to equity (2,134) (2,105) (1,686)
Change in cash before financing activities (212) (3,740) (863)
IV. FINANCING ACTIVITIES Proceeds from borrowings 14.2 1,571 5,931 7,002Repayment of borrowings 14.2 (822) (1,760) (1,051)Purchase and proceeds from sale of current available for sale financial assets(a) 13 (131) 92 (23)
Net cash from (used in) financing activities 14.2 618 4,263 5,928
V. EFFECT OF EXCHANGE RATE CHANGES 29 (242) (87)
NET INCREASE (DECREASE) IN CASH AND CASH EQUIVALENTS (I+II+III+IV+V) 435 281 4,978
CASH AND CASH EQUIVALENTS AT BEGINNING OF PERIOD 14.1 3,618 3,337 3,337CASH AND CASH EQUIVALENTS AT END OF PERIOD 14.1 4,053 3,618 8,315
TOTAL TAX PAID (951) (2,402) (1,169)
(a) The cash impact of non-current available for sale financial assets used to hedge net financial debt (see Note 18) is presented under “IV. Financing activities”, as “Purchase and proceedsfrom sale of current available for sale financial assets”.
(1) The financial statements as of December 31, 2017 and June 30, 2017 have been restated to reflect the retrospective application with effect from January 1, 2016 of IFRS9 Financialinstruments. See Note 1.2.
(2) The financial statements as of December 31, 2017 have been restated to reflect the definitive purchase price allocation of Christian Dior Couture. See Note 2.

SELECTED NOTES TO THE CONSOLIDATEDFINANCIAL STATEMENTS
1. ACCOUNTING POLICIES 282. CHANGES IN OWNERSHIP INTERESTS IN CONSOLIDATED ENTITIES 313. BRANDS, TRADE NAMES AND OTHER INTANGIBLE ASSETS 324. GOODWILL 335. IMPAIRMENT TESTING OF INTANGIBLE ASSETS
WITH INDEFINITE USEFUL LIVES 336. PROPERTY, PLANT AND EQUIPMENT 337. INVESTMENTS IN JOINT VENTURES AND ASSOCIATES 358. NON-CURRENT AVAILABLE FOR SALE FINANCIAL ASSETS 359. OTHER NON-CURRENT ASSETS 3510. INVENTORIES AND WORK IN PROGRESS 3611. TRADE ACCOUNTS RECEIVABLE 3712. OTHER CURRENT ASSETS 3713. CURRENT AVAILABLE FOR SALE FINANCIAL ASSETS 3814. CASH AND CHANGE IN CASH 3815. EQUITY 4016. STOCK OPTION AND SIMILAR PLANS 4217. MINORITY INTERESTS 4318. BORROWINGS 4419. PROVISIONS 4520. OTHER NON-CURRENT LIABILITIES 4621. TRADE ACCOUNTS PAYABLE AND OTHER CURRENT LIABILITIES 4722. FINANCIAL INSTRUMENTS AND MARKET RISK MANAGEMENT 4723. SEGMENT INFORMATION 5024. EXPENSES BY NATURE 5325. OTHER OPERATING INCOME AND EXPENSES 5326. NET FINANCIAL INCOME / (EXPENSE) 5327. INCOME TAXES 5428. EARNINGS PER SHARE 5429. OFF-BALANCE SHEET COMMITMENTS 5530. EXCEPTIONAL EVENTS AND LITIGATION 5531. RELATED-PARTY TRANSACTIONS 5532. SUBSEQUENT EVENTS 55
27Interim Financial Report - Six-month period ended June 30, 2018
The financial statements as of December 31, 2017 and June 30, 2017 have been restated to reflect the retrospective application with effect from January 1, 2016 of IFRS9 Financial instruments.See Note 1.2The financial statements as of December 31, 2017 have been restated to reflect the definitive purchase price allocation of Christian Dior Couture. See Note 2.

Standards, amendments and interpretations for which application became mandatory in 2018
IFRS 15 on revenue recognition was applied prospectively fromJanuary 1, 2018. Its application did not have any significantimpact on the Group’s financial statements, due to the natureof the Group’s business activities. Pursuant to IFRS 15, theprovision for product returns, which was previously deductedfrom trade receivables (see Note 1.25 to the 2017 consolidatedfinancial statements), is now presented within “Other currentliabilities” (see Note 21.2).
IFRS 9 on financial instruments was applied retrospectively witheffect from January 1, 2016. The Group’s financial statementsfor the comparative periods, including the notes to these financialstatements, were restated. The impact of the application ofIFRS 9 within the Group is mainly related to the change in themethod used to recognize the cost of hedging (option premiumsand forward points associated with forward contracts) and in therevaluation at market value of available for sale financial assets.
The cost of hedging is now recognized as follows:
- for foreign exchange hedges that are commercial in nature,the changes in the value of forward points associated withforward contracts and in the time value component of optionsare included in gains and losses recognized directly in equity.The cost of the forward contracts (forward points) and of theoptions (premiums) is transferred to Other financial incomeand expenses upon realization of the hedged transaction;
- for hedges that are financial in nature or tied to the Group’sinvestment portfolio, expenses and income arising fromdiscounts or premiums are recognized in Cost of financial debton a pro rata basis over the term of the hedging instruments.The cash flow impact of expenses and income arising fromforward points is presented under “Cost of net financial debt:interest paid”. The difference between the amounts recognizedin net financial income / expense and the change in the valueof forward points is included in gains and losses recognizeddirectly in equity. The fair value of hedges that are financialin nature or tied to the Group’s investment portfolio are nowpresented under “Net financial debt” (see Note 18).
The Group has opted to present the change in market value of available for sale financial assets under “Net financialincome / (expense)” (within “Other financial income and expenses”)for all shares held in the portfolio during the reported periods.
1.2. Changes in the accounting framework applicable to LVMH
The condensed consolidated financial statements for the six-month period ended June 30, 2018 were approved by theBoard of Directors on July 24, 2018. The financial statementswere established in accordance with IAS 34 relating to thepreparation of interim financial statements in addition tointernational accounting standards and interpretations (IAS / IFRS)adopted by the European Union and in force on June 30, 2018;these standards and interpretations have been applied consistentlyto the periods presented.
The interim financial statements have been prepared using thesame accounting principles and policies as those applied for thepreparation of the annual financial statements, with the exceptionof the determination of the income tax rate, which has beencalculated based on the expected rate for the fiscal year.Moreover, comparability of the Group’s half-year and annualaccounts may be affected by the seasonal nature of the Group’sbusinesses, which achieve a higher level of revenue during thesecond half of the year (see Note 23 Segment information).
1. ACCOUNTING POLICIES
1.1. General framework and environment
28 Interim Financial Report - Six-month period ended June 30, 2018
CONDENSED HALF-YEAR CONSOLIDATED FINANCIAL STATEMENTS
Selected notes to the consolidated financial statements
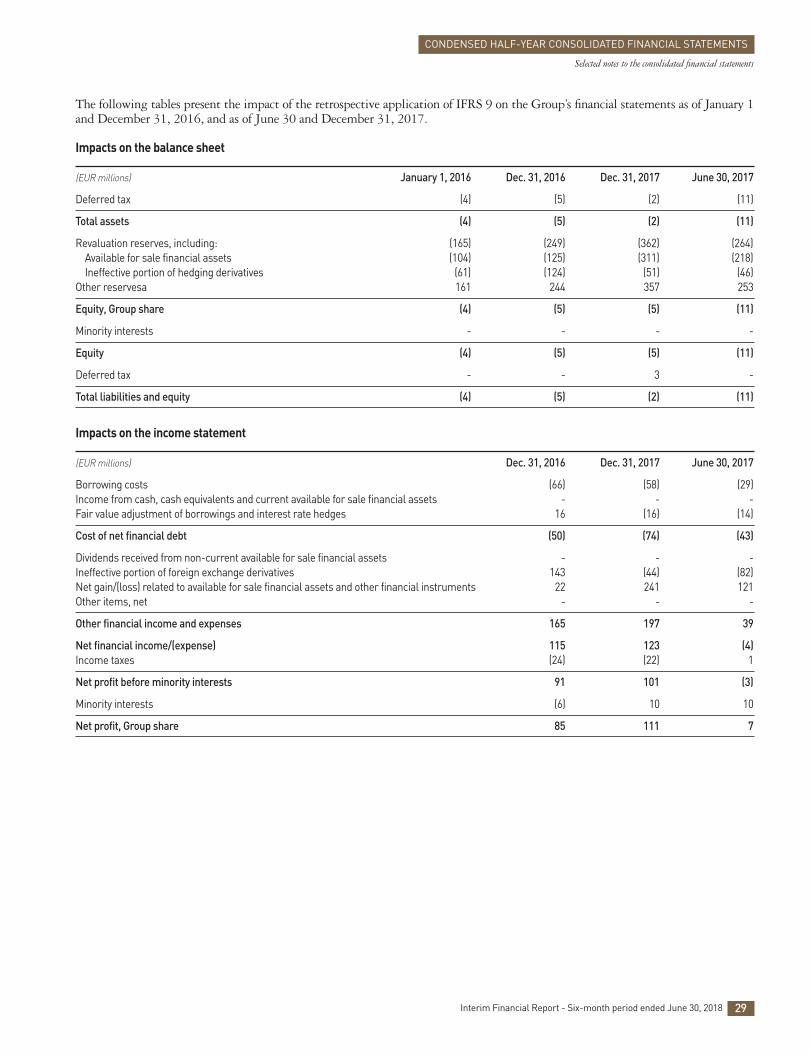
The following tables present the impact of the retrospective application of IFRS 9 on the Group’s financial statements as of January 1and December 31, 2016, and as of June 30 and December 31, 2017.
Impacts on the balance sheet
(EUR millions) January 1, 2016 Dec. 31, 2016 Dec. 31, 2017 June 30, 2017
Deferred tax (4) (5) (2) (11)
Total assets (4) (5) (2) (11)
Revaluation reserves, including: (165) (249) (362) (264)Available for sale financial assets (104) (125) (311) (218)Ineffective portion of hedging derivatives (61) (124) (51) (46)
Other reservesa 161 244 357 253
Equity, Group share (4) (5) (5) (11)
Minority interests - - - -
Equity (4) (5) (5) (11)
Deferred tax - - 3 -
Total liabilities and equity (4) (5) (2) (11)
Impacts on the income statement
(EUR millions) Dec. 31, 2016 Dec. 31, 2017 June 30, 2017
Borrowing costs (66) (58) (29)Income from cash, cash equivalents and current available for sale financial assets - - -Fair value adjustment of borrowings and interest rate hedges 16 (16) (14)
Cost of net financial debt (50) (74) (43)
Dividends received from non-current available for sale financial assets - - -Ineffective portion of foreign exchange derivatives 143 (44) (82)Net gain / (loss) related to available for sale financial assets and other financial instruments 22 241 121Other items, net - - -
Other financial income and expenses 165 197 39
Net financial income / (expense) 115 123 (4)Income taxes (24) (22) 1
Net profit before minority interests 91 101 (3)
Minority interests (6) 10 10
Net profit, Group share 85 111 7
29Interim Financial Report - Six-month period ended June 30, 2018
CONDENSED HALF-YEAR CONSOLIDATED FINANCIAL STATEMENTS
Selected notes to the consolidated financial statements

Other changes in the accounting framework and standards for which application will becomemandatory beyond the 2018 fiscal year
At the end of 2016, the Group launched its project for theimplementation of IFRS 16 relating to leases, which applies to accounting periods beginning on or after January 1, 2019.When entering into a lease involving fixed payments, thisstandard requires that a liability be recognized in the balancesheet, offset against a right-of-use asset and measured at the
discounted present value of future lease payments. The liabilityamount recognized therefore depends quite heavily on theassumptions used for the discount rate and lease term; extensionand early termination options offered by lease agreements willalso need to be included in the calculation of the liability if theirexercise is considered reasonably certain when entering into thelease. See Note 1.2 to the 2017 consolidated financial statements.
The inventory of the leases and the gathering of the informationrequired to precisely estimate the balance sheet impact of theinitial application of IFRS 16 are still underway.
Impacts on the consolidated statement of comprehensive gains and losses
(EUR millions) Dec. 31, 2016 Dec. 31, 2017 June 30, 2017
Net profit before minority interests 91 101 (3)
Change in value of available for sale financial assets (18) (274) (125)Amounts transferred to income statement (4) 33 4Tax impact (1) 57 30
(23) (184) (91)
Change in value of the ineffective portion of hedging derivatives (273) (92) 50Amounts transferred to income statement 180 210 75Tax impact 24 (35) (36)
(69) 83 89
Gains and losses recognized in equity, transferable to income statement (92) (101) (2)
Comprehensive income (1) - (5)Minority interests 2 (4) (4)
Comprehensive income, Group share 1 (4) (9)
Impacts on the consolidated cash-flow statement
(EUR millions) Dec. 31, 2016 Dec. 31, 2017 June 30, 2017
Cost of net financial debt: interest paid (63) (58) (14)
Net cash from operating activities and operating investments (free cash flow) (63) (58) (14)
Net cash from (used-in) financing activities (36) 187 (32)Effect of exchange rate changes 99 (129) 46
30 Interim Financial Report - Six-month period ended June 30, 2018
CONDENSED HALF-YEAR CONSOLIDATED FINANCIAL STATEMENTS
Selected notes to the consolidated financial statements

The Christian Dior Couture brand was valued primarily usingthe relief from royalty method and secondarily using the excessearnings method. The value determined – 3,500 millioneuros – corresponds to the high end of the average range ofvalues obtained using these methods. Definitive goodwill, inthe amount of 2,179 million euros, represents the internationallyrenowned expertise and creativity of Christian Dior Couture in the fields of fashion, leather goods and jewelry, as well as itscapacity to draw on a quality-driven network of directly-operated stores in prime locations.
The balance sheet and income statement as of December 31,2017, including the notes to the financial statements, wererestated to reflect the definitive allocation of the purchase priceof Christian Dior Couture. Aside from the impact on the balance
sheet presented in the table above, restated net profit for the2017 fiscal year includes 124 million euros in deferred taxincome arising from the impact on long-term deferred tax of thedecrease in the corporate income tax rate in France, as stipulatedin the 2018 Budget Act.
In 2017, the Christian Dior Couture acquisition generated anoutflow of 5,782 million euros, net of cash acquired in theamount of 218 million euros. A number of bond issues, in atotal amount of 5 billion euros, together with commercialpaper for the remainder, was used to fund this acquisition (seeNote 18 to the 2017 consolidated financial statements).
The acquisition costs for Christian Dior Couture were recognizedin Other operating income and expenses and totaled 6 millioneuros as of December 31, 2017 (see Note 25).
The final allocation of the purchase price paid by LVMH on July 3, 2017, the date of acquisition of the controlling interest, is shownin the table below:
(EUR millions) Provisional purchase Change Definitive purchase price allocation price allocation
Brand and other intangible fixed assets 361 3,243 3,604Tangible fixed assets 952 661 1,613Other non-current assets 59 - 59Non-current provisions (32) (10) (42)Current assets 649 (22) 627Current liabilities (519) - (519)Net financial debt (385) - (385)Deferred tax 69 (1,196) (1,127)
Net assets acquired 1,154 2,676 3,830Indirect minority interests (9) - (9)
Net assets, Group share 1,145 2,676 3,821Goodwill 4,855 (2,676) 2,179
Carrying amount of shares held as of July 3, 2017 6,000 - 6,000
The Group did not make any significant acquisitions or disposalsduring the period.
Christian Dior Couture
On July 3, 2017, as part of the project aimed at simplifyingthe structures of the Christian Dior – LVMH group and inaccordance with the terms of the memorandum of understandingconcluded with Christian Dior on April 24, 2017, LVMHacquired 100% of Christian Dior Couture from Christian Diorfor 6 billion euros. Christian Dior directly and indirectly holds41.0% of the share capital and 56.8% of the voting rights ofLVMH.
The scope acquired includes Grandville (100%-owned byChristian Dior) and its subsidiary, Christian Dior Couture. The price paid was determined on the basis of an enterprisevalue of 6.5 billion euros, representing 15.6 times the adjustedEBITDA for the 12-month period ending March 2017.
The acquisition of Christian Dior Couture has allowed one ofthe world’s most iconic brands to join LVMH, alongsideParfums Christian Dior, which was already part of the LVMHgroup. On the strength of its history and its favorable prospects,Christian Dior Couture will be a source of growth for LVMH.Christian Dior Couture’s expansion in the coming years will be supported in particular by its creative momentum and bythe significant investments already made, especially in theAmericas, China and Japan.
2. CHANGES IN OWNERSHIP INTERESTS IN CONSOLIDATED ENTITIES
31Interim Financial Report - Six-month period ended June 30, 2018
CONDENSED HALF-YEAR CONSOLIDATED FINANCIAL STATEMENTS
Selected notes to the consolidated financial statements

3. BRANDS, TRADE NAMES AND OTHER INTANGIBLE ASSETS
(EUR millions) June 30, 2018 Dec. 31, 2017 June 30, 2017
Gross Amortization Net Net Net and impairment
Brands 14,209 (686) 13,523 13,515 9,710Trade names 3,788 (1,559) 2,229 2,176 2,273License rights 93 (79) 14 14 15Leasehold rights 905 (479) 426 398 339Software, websites 1,748 (1,291) 457 459 367Other 885 (508) 377 395 415
Total 21,628 (4,602) 17,026 16,957 13,119
Movements during the six-month period in the net amounts of brands, trade names and other intangible assets were as follows:
Gross value Brands Trade names Software, Leasehold Other intangible Total(EUR millions) websites rights assets
As of December 31, 2017 14,184 3,692 1,661 858 989 21,384
Acquisitions - - 35 50 113 198Disposals and retirements - - (21) (6) (67) (94)Changes in the scope of consolidation - - - - 2 2Translation adjustment 25 96 13 1 6 141Reclassifications - - 60 2 (65) (3)
As of June 30, 2018 14,209 3,788 1,748 905 978 21,628
Accumulated amortization Brands Trade names Software, Leasehold Other intangible Totaland impairment (EUR millions) websites rights assets
As of December 31, 2017 (669) (1,516) (1,202) (460) (580) (4,427)
Amortization expense (13) - (101) (24) (70) (208)Impairment expense - - - - (1) (1)Disposals and retirements - - 21 6 67 94Changes in the scope of consolidation - - - - - -Translation adjustment (4) (43) (9) (1) (3) (60)Reclassifications - - - - - -
As of June 30, 2018 (686) (1,559) (1,291) (479) (587) (4,602)
Carrying amount as of June 30, 2018 13,523 2,229 457 426 391 17,026
For the second half of fiscal year 2017, Christian Dior Couturehad consolidated revenue of 1,183 million euros and its profitfrom recurring operations totaled 236 million euros. For fiscalyear 2017 as a whole, Christian Dior Couture had consolidatedrevenue of 2,230 million euros, for profit from recurringoperations of 353 million euros.
Christian Dior Couture has been consolidated as part of theFashion and Leather Goods business group since July 2017. If the acquisition date for Christian Dior Couture had beenJanuary 1, 2017, the Group would have had consolidatedrevenue of 43,683 million euros in 2017 and profit fromrecurring operations for the year would have been 8,410 millioneuros, with net profit of 5,189 million euros.
32 Interim Financial Report - Six-month period ended June 30, 2018
CONDENSED HALF-YEAR CONSOLIDATED FINANCIAL STATEMENTS
Selected notes to the consolidated financial statements

4. GOODWILL
(EUR millions) June 30, 2018 Dec. 31, 2017 June 30, 2017
Gross Impairment Net Net Net
Goodwill arising on consolidated investments 10,198 (1,684) 8,514 8,538 6,578Goodwill arising on purchase commitments for minority interests’ shares 5,512 - 5,512 5,299 5,321
Total 15,710 (1,684) 14,026 13,837 11,899
Changes in net goodwill during the periods presented break down as follows:
(EUR millions) June 30, 2018 Dec. 31, 2017 June 30, 2017
Gross Impairment Net Net Net
As of January 1 15,446 (1,609) 13,837 10,401 10,401
Changes in the scope of consolidation (35) - (35) 2,605 580Changes in purchase commitments for minority interests’ shares 248 - 248 1,008 1,037Changes in impairment - (61) (61) (51) (51)Translation adjustment 51 (14) 37 (126) (68)
As of period-end 15,710 (1,684) 14,026 13,837 11,899
Please refer also to Note 20 for goodwill arising on purchase commitments for minority interests’ shares.
5. IMPAIRMENT TESTING OF INTANGIBLE ASSETS WITH INDEFINITE USEFUL LIVES
Brands, trade names and other intangible assets with indefinite useful lives as well as the goodwill arising on acquisition weresubject to annual impairment testing as of December 31, 2017. No significant impairment expense was recognized during the firsthalf of 2018, as no events likely to lead to a material loss in value occurred during the period.
6. PROPERTY, PLANT AND EQUIPMENT
(EUR millions) June 30, 2018 Dec. 31, 2017 June 30, 2017
Gross Depreciation Net Net Net and impairment
Land 2,537 (81) 2,456 2,374 1,275Vineyard land and producing vineyards(a) 2,529 (109) 2,420 2,432 2,472Buildings 4,076 (1,749) 2,327 2,052 1,775Investment property 573 (39) 534 763 817Leasehold improvements, machinery and equipment 12,167 (8,285) 3,882 3,971 3,395Assets in progress 1,036 (2) 1,034 785 924Other tangible fixed assets 1,969 (460) 1,509 1,485 1,482
Total 24,887 (10,725) 14,162 13,862 12,140
Of which: assets held under finance leases 485 (206) 279 267 276historical cost of vineyard land and producing vineyards 745 (109) 636 648 643
(a) Almost all of the carrying amount of “Vineyard land and producing vineyards” corresponds to vineyard land.
33Interim Financial Report - Six-month period ended June 30, 2018
CONDENSED HALF-YEAR CONSOLIDATED FINANCIAL STATEMENTS
Selected notes to the consolidated financial statements

Other tangible fixed assets include in particular the works ofart owned by the Group.
Purchases of property, plant and equipment mainly includeinvestments by the Group’s brands, notably Sephora, LouisVuitton, Parfums Christian Dior, Christian Dior Couture andBvlgari in their retail networks. They also included investmentsby the champagne houses and Hennessy in their production
equipment, in addition to investments related to the LaSamaritaine and Jardin d’Acclimatation projects, as well as realestate investments.
Translation adjustments arose mainly on tangible assetsrecognized in US dollars, due to fluctuations against the euroby the close of the fiscal year.
Movements in property, plant and equipment during the period break down as follows:
Gross value Vineyard Land and Investment Leaseholds improvements, Assets in Other Total(EUR millions) land and buildings property machinery and equipment progress tangible producing fixed assets vineyards Stores Production, Other logistics
As of December 31, 2017 2,538 6,169 819 7,889 2,572 1,286 786 1,932 23,991
Acquisitions 1 130 - 192 60 25 486 52 946Change in the market value of vineyard land - - - - - - - - -Disposals and retirements - (28) - (155) (21) (13) (1) (13) (231)Changes in the scope of consolidation - - - 1 - - - 5 6Translation adjustment (3) 61 6 101 1 11 2 4 183Other movements, including transfers (7) 281 (252) 202 29 (13) (237) (11) (8)
As of June 30, 2018 2,529 6,613 573 8,230 2,641 1,296 1,036 1,969 24,887
Depreciation Vineyard Land and Investment Leaseholds improvements, Assets in Other Totaland impairment land and buildings property machinery and equipment progress tangible (EUR millions) producing fixed assets vineyards Stores Production, Other logistics
As of December 31, 2017 (106) (1,742) (56) (5,207) (1,689) (880) (2) (447) (10,129)
Depreciation expense (3) (88) (2) (457) (79) (59) - (29) (717)Impairment expense - (1) - 3 - - - - 2Disposals and retirements - 28 - 152 18 13 - 14 225Changes in the scope of consolidation - - - (1) - - - (2) (3)Translation adjustment - (19) - (73) 1 (9) - (4) (104)Other movements, including transfers - (8) 19 (49) 1 30 - 8 1
As of June 30, 2018 (109) (1,830) (39) (5,632) (1,748) (905) (2) (460) (10,725)
Carrying amount as of June 30, 2018 2,420 4,783 534 2,598 893 391 1,034 1,509 14,162
34 Interim Financial Report - Six-month period ended June 30, 2018
CONDENSED HALF-YEAR CONSOLIDATED FINANCIAL STATEMENTS
Selected notes to the consolidated financial statements

7. INVESTMENTS IN JOINT VENTURES AND ASSOCIATES
(EUR millions) June 30, 2018 Dec. 31, 2017 June 30, 2017
Gross Impairment Net Of which joint Net Of which joint Net Of which joint arrangements arrangements arrangementsShare of net assets of joint ventures and associates as of January 1 647 (8) 639 273 770 362 770 362
Share of net profit (loss) for the period 12 - 12 7 (3) 2 (1) -Dividends paid (10) - (10) - (22) (8) (5) -Changes in the scope of consolidation (19) 8 (11) 2 (82) (84) (77) (80)Capital increases subscribed 2 - 2 1 5 3 3 2Translation adjustment 3 - 3 - (33) (7) (22) (4)Other, including transfers 5 - 5 1 4 5 3 4
Share of net assets of joint ventures and associates as of period-end 640 - 640 284 639 273 671 284
8. NON-CURRENT AVAILABLE FOR SALE FINANCIAL ASSETS
(EUR millions) June 30, 2018 Dec. 31, 2017 June 30, 2017
As of January 1 789 744 744
Acquisitions 92 125 53Disposals at net realized value (25) (85) (18)Changes in market value 17 101 55Changes in the scope of consolidation - 5 5Translation adjustment 10 (43) (39)Reclassifications - (58) (60)
As of period-end 883 789 740
9. OTHER NON-CURRENT ASSETS
(EUR millions) June 30, 2018 Dec. 31, 2017 June 30, 2017
Warranty deposits 348 320 303Derivatives(a) 371 246 255Loans and receivables 306 264 272Other 37 39 24
Total 1,062 869 854
(a) See Note 22.
35Interim Financial Report - Six-month period ended June 30, 2018
CONDENSED HALF-YEAR CONSOLIDATED FINANCIAL STATEMENTS
Selected notes to the consolidated financial statements

10. INVENTORIES AND WORK IN PROGRESS
(EUR millions) June 30, 2018 Dec. 31, 2017 June 30, 2017
Gross Impairment Net Net Net
Wines and eaux-de-vie in the process of aging 4,550 (9) 4,541 4,517 4,386Other raw materials and work in progress 2,022 (402) 1,620 1,370 1,465
6,572 (411) 6,161 5,887 5,851
Goods purchased for resale 2,194 (228) 1,966 1,767 1,847Finished products 4,722 (966) 3,756 3,234 3,167
6,916 (1,194) 5,722 5,001 5,014
Total 13,488 (1,605) 11,883 10,888 10,865
The net change in inventories for the periods presented breaks down as follows:
(EUR millions) June 30, 2018 Dec. 31, 2017 June 30, 2017
Gross Impairment Net Net Net
As of January 1 12,426 (1,538) 10,888 10,546 10,546
Change in gross inventories 1,038 - 1,038 1,006 938Impact of provision for returns(a) - - - 11 (5)Impact of marking harvests to market 5 - 5 (21) 5Changes in provision for impairment - (138) (138) (339) (143)Changes in the scope of consolidation 21 (4) 17 237 (140)Translation adjustment 84 (16) 68 (550) (333)Other, including reclassifications (86) 91 5 (2) (3)
As of period-end 13,488 (1,605) 11,883 10,888 10,865
(a) See Note 1.25 to the consolidated financial statements as of December 31, 2017.
The effects of marking harvests to market on Wines and Spirits’ cost of sales and value of inventory are as follows:
(EUR millions) June 30, 2018 Dec. 31, 2017 June 30, 2017
Impact of marking the period’s harvest to market 14 5 14Impact of inventory sold during the period (9) (26) (9)
Net impact on cost of sales of the period 5 (21) 5
36 Interim Financial Report - Six-month period ended June 30, 2018
CONDENSED HALF-YEAR CONSOLIDATED FINANCIAL STATEMENTS
Selected notes to the consolidated financial statements

12. OTHER CURRENT ASSETS
(EUR millions) June 30, 2018 Dec. 31, 2017 June 30, 2017
Current available for sale financial assets(a) 728 515 510Derivatives(b) 145 496 447Tax accounts receivable, excluding income taxes 794 747 590Advances and payments on account to vendors 169 203 139Prepaid expenses 495 396 460Other receivables 529 562 458
Total 2,860 2,919 2,604
(a) See Note 13.(b) See Note 22.
The trade accounts receivable balance is comprised essentially ofreceivables from wholesalers or agents, who are limited in numberand with whom the Group maintains ongoing relationships forthe most part. As of June 30, 2018, coverage of customer credit
risk had been requested from insurers for the majority of tradereceivables, approximately 92% of the amount of which wasgranted, versus 91% as of December 31, 2017 and 88% as ofJune 30, 2017.
37Interim Financial Report - Six-month period ended June 30, 2018
CONDENSED HALF-YEAR CONSOLIDATED FINANCIAL STATEMENTS
Selected notes to the consolidated financial statements
11. TRADE ACCOUNTS RECEIVABLE
(EUR millions) June 30, 2018 Dec. 31, 2017 June 30, 2017
Trade accounts receivable, nominal amount 2,812 3,079 2,537Provision for impairment (74) (78) (63)Provision for product returns(a) - (265) (203)
Net amount 2,738 2,736 2,271
The change in trade accounts receivable for the periods presented breaks down as follows:
(EUR millions) June 30, 2018 Dec. 31, 2017 June 30, 2017
Gross Impairment Net Net Net
As of January 1 2,814 (77) 2,736 2,685 2,685
Changes in gross receivables (304) - (304) 134 (387)Changes in provision for impairment - 3 3 (11) 3Changes in provision for product returns(a) - - - (43) 19Changes in the scope of consolidation 4 - 4 141 25Translation adjustment 26 - 26 (154) (77)Reclassifications(a) 273 - 273 (16) 3
As of period-end 2,813 (74) 2,738 2,736 2,271
(a) See Note 1.25 to the consolidated financial statements as of December 31, 2017. See also Note 1.2.
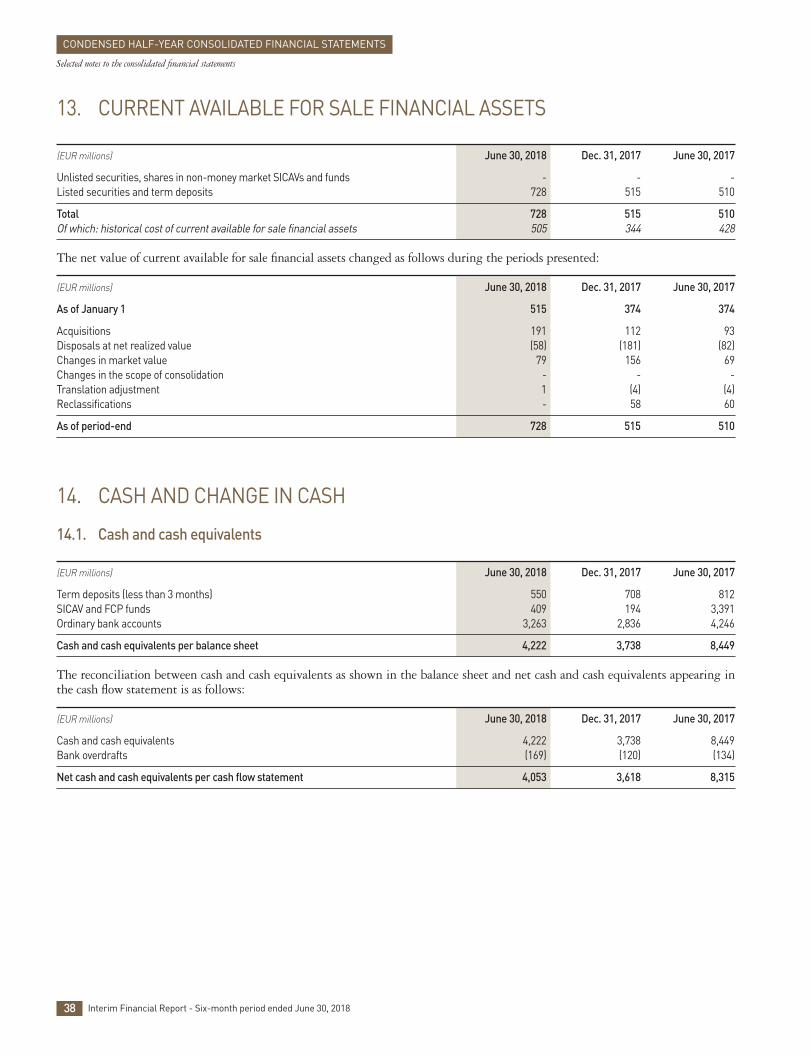
38 Interim Financial Report - Six-month period ended June 30, 2018
CONDENSED HALF-YEAR CONSOLIDATED FINANCIAL STATEMENTS
Selected notes to the consolidated financial statements
13. CURRENT AVAILABLE FOR SALE FINANCIAL ASSETS
(EUR millions) June 30, 2018 Dec. 31, 2017 June 30, 2017
Unlisted securities, shares in non-money market SICAVs and funds - - -Listed securities and term deposits 728 515 510
Total 728 515 510Of which: historical cost of current available for sale financial assets 505 344 428
The net value of current available for sale financial assets changed as follows during the periods presented:
(EUR millions) June 30, 2018 Dec. 31, 2017 June 30, 2017
As of January 1 515 374 374
Acquisitions 191 112 93Disposals at net realized value (58) (181) (82)Changes in market value 79 156 69Changes in the scope of consolidation - - -Translation adjustment 1 (4) (4)Reclassifications - 58 60
As of period-end 728 515 510
14. CASH AND CHANGE IN CASH
14.1. Cash and cash equivalents
(EUR millions) June 30, 2018 Dec. 31, 2017 June 30, 2017
Term deposits (less than 3 months) 550 708 812SICAV and FCP funds 409 194 3,391Ordinary bank accounts 3,263 2,836 4,246
Cash and cash equivalents per balance sheet 4,222 3,738 8,449
The reconciliation between cash and cash equivalents as shown in the balance sheet and net cash and cash equivalents appearing inthe cash flow statement is as follows:
(EUR millions) June 30, 2018 Dec. 31, 2017 June 30, 2017
Cash and cash equivalents 4,222 3,738 8,449Bank overdrafts (169) (120) (134)
Net cash and cash equivalents per cash flow statement 4,053 3,618 8,315

39Interim Financial Report - Six-month period ended June 30, 2018
CONDENSED HALF-YEAR CONSOLIDATED FINANCIAL STATEMENTS
Selected notes to the consolidated financial statements
14.2. Net cash from (used in) financing activities
For the first half of 2018, the reconciliation of the cash impact of the change in net financial debt presented in Note 18.1 and netcash from (used in) financing activities is as follows:
(EUR millions) Notes June 30, 2018 Dec. 31, 2017 June 30, 2017
Impact on cash of the change in net financial debt 18.1 108 3,816 929Elimination of the change in positive bank balances and bank overdrafts(a) 405 199 5,047Change in cash related to other assets not included in net financial debt 105 248 (48)
Net cash from (used in) financing activities 618 4,263 5,928
(a) The change in positive bank balances and bank overdrafts is not disclosed within net cash from (used in) financing activities.
14.3. Change in working capital
The change in working capital breaks down as follows for the periods presented:
(EUR millions) Notes June 30, 2018 Dec. 31, 2017 June 30, 2017
Change in inventories and work in progress 10 (1,038) (1,006) (938)Change in trade accounts receivable(a) 11 282 (132) 366Change in trade accounts payable 21 35 257 (263)Change in other receivables and payables (602) 367 (295)
Change in working capital(b) (1,323) (514) (1,130)
(a) Including a negative impact of 21 million euros related to amounts owed to customers (versus a positive impact of 2 million euros as of December 31, 2017 and negative impact of21 million euros as of June 30, 2017).
(b) Increase / (Decrease) in cash and cash equivalents.
14.4. Operating investments
Operating investments comprise the following elements for the periods presented:
(EUR millions) Notes June 30, 2018 Dec. 31, 2017 June 30, 2017
Purchase of intangible fixed assets 3 (198) (456) (204)Purchase of tangible fixed assets(a) 6 (946) (1,889) (768)Deduction of purchase under finance lease - 6 -Changes in accounts payable related to fixed asset purchases (47) 40 (21)
Net cash used in purchases of fixed assets (1,191) (2,299) (993)Net cash from fixed asset disposals 5 26 13Guarantee deposits paid and other cash flows related to operating investments (18) (3) (8)
Operating investments(b) (1,204) (2,276) (988)
(a) Including finance lease acquisitions.(b) Increase / (Decrease) in cash and cash equivalents.

15.2. LVMH treasury shares
The portfolio of LVMH treasury shares is allocated as follows:
(Number of shares or EUR millions) June 30, 2018 Dec. 31, 2017 June 30, 2017
Number Amount Amount Amount
Share subscription option plans 1,174,440 54 57 90Bonus share plans 1,261,244 193 122 91
Shares held for stock option and similar plans(a) 2,435,684 247 179 181
Liquidity contract 107,008 32 23 19Shares pending retirement - - 328 328
LVMH treasury shares 2,542,692 279 530 528
(a) See Note 16 regarding stock option and similar plans.
The market value of LVMH shares held under the liquidity contract as of June 30, 2018 amounts to 31 million euros.
The portfolio movements of LVMH treasury shares during the six-month period were as follows:
(Number of shares or EUR millions) Number Amount Impact on cash
As of December 31, 2017 4,281,097 530
Share purchases(a) 812,128 203 (203)Vested bonus shares (93,156) (13) -Retirement of shares (2,015,257) (331) -Disposals at net realized value(a) (442,120) (115) 115Gain / (loss) on disposal - 5 -
As of June 30, 2018 2,542,692 279 (88)
(a) Purchases and sales of LVMH shares mainly related to the management of the liquidity contract.
As of June 30, 2018, the share capital consisted of505,788,034 actions (507,042,596 shares as of December 31,2017 and 507,626,487 as of June 30, 2017), with a par valueof 0.30 euros per share, including 230,051,242 shares withdouble voting rights (229,656,385 as of December 31, 2017and 230,087,347 as of June 30, 2017). Double voting rightsare attached to registered shares held for more than three years.
During the six-month period, 760,695 were issued followingthe exercise of share subscription options, which resulted in anincrease in the share capital and share premium account of49 million euros, and 2,015,257 shares were retired, whichresulted in a reduction of the share capital and share premiumaccount of 331 million euros.
40 Interim Financial Report - Six-month period ended June 30, 2018
CONDENSED HALF-YEAR CONSOLIDATED FINANCIAL STATEMENTS
Selected notes to the consolidated financial statements
15. EQUITY
15.1. Share capital and share premium account

41Interim Financial Report - Six-month period ended June 30, 2018
CONDENSED HALF-YEAR CONSOLIDATED FINANCIAL STATEMENTS
Selected notes to the consolidated financial statements
15.3. Dividends paid by the parent company LVMH SE
(EUR millions, except for data per share in EUR) June 30, 2018 Dec. 31, 2017 June 30, 2017
Interim dividend for the current fiscal year (2017: 1.60 euros) - 811 -Impact of treasury shares - (7) -
Gross amount disbursed for the fiscal year - 804 -
Final dividend for the previous fiscal year (2017: 3.40 euros; 2016: 2.60 euros) 1,717 1,319 1,318Impact of treasury shares (8) (13) (13)
Gross amount disbursed for the previous fiscal year 1,709 1,306 1,305
Total gross amount disbursed during the period(a) 1,709 2,110 1,305
(a) Excluding the impact of tax regulations applicable to the recipient.
The final dividend for fiscal year 2017 was distributed on April 19, 2018 in accordance with the resolutions of the Shareholders’Meeting of April 12, 2018.
At its meeting of July 24, 2018 the Board of Directors approved the payment on December 6, 2018, of an interim dividend of 2.00 euros per share for fiscal year 2018.
15.4. Cumulative translation adjustment
The change in the translation adjustment recognized under equity, Group share net of hedging effects of net assets denominated inforeign currency, breaks down as follows by currency:
(EUR millions) June 30, 2018 Change Dec. 31, 2017 June 30, 2017
US dollar 236 97 139 253Swiss franc 552 24 528 717Japanese yen 93 24 69 93Hong Kong dollar 340 24 316 385Pound sterling (108) (1) (107) (102)Other currencies (227) (57) (170) (126)Foreign currency net investment hedges(a) (435) (14) (421) (469)
Total, Group share 451 97 354 751
(a) Including: -137 million euros with respect to the US dollar (-130 million euros as of December 31, 2017 and -143 million euros as of June 30, 2017), -117 million euros with respect to theHong Kong dollar (-117 million euros as of December 31, 2017 and -123 million euros as of June 30, 2017) and -184 million euros with respect to the Swiss franc (-180 million euros as ofDecember 31, 2017 and -206 million euros as of June 30, 2017). These amounts include the tax impact.

16.3. Expense for the period
(EUR millions) June 30, 2018 Dec. 31, 2017 June 30, 2017
Expense for the period for share subscription option and bonus share plans 40 62 25
The average unit value of non-vested bonus shares in awards granted during the period was 246.46 euros at the time of the grant.
Vested share allocations were settled in existing shares held. The LVMH closing share price the day before the grant date of the plan dated January 25, 2018 was 241.20 euros and itwas 278.25 euros the day before the grant date of the plan datedApril 12, 2018.
16. STOCK OPTION AND SIMILAR PLANS
16.1. Share subscription option plans
The number of unexercised share subscription options and the weighted average exercise price changed as follows during the periodspresented:
June 30, 2018 Dec. 31, 2017 June 30, 20 17
Number Weighted Number Weighted Number Weighted average average average exercise price exercise price exercise price (EUR) (EUR) (EUR)
Share subscription options outstanding as of January 1 1,180,692 59.56 1,903,010 65.17 1,903,010 65.17
Options expired (6,252) 65.04 (13,833) 74.67 (13,416) 75.41Options exercised (760,695) 64.24 (708,485) 74.33 (646,188) 75.49
Share subscription options outstanding as of period-end 413,745 50.86 1,180,692 59.56 1,243,406 59.69
16.2. Bonus share plans
The number of non-vested shares awarded changed as follows during the periods presented:
(number of shares) June 30, 2018 Dec. 31, 2017 June 30, 2017
Non-vested shares as of January 1 1,395,351 1,312,587 1,312,587
Shares initially awarded during the period 452,804 455,252 46,860Shares vested during the period (93,156) (335,567) (345)Shares expired during the period (20,470) (36,921) (19,455)
Non-vested shares as of period-end 1,734,529 1,395,351 1,339,647
42 Interim Financial Report - Six-month period ended June 30, 2018
CONDENSED HALF-YEAR CONSOLIDATED FINANCIAL STATEMENTS
Selected notes to the consolidated financial statements
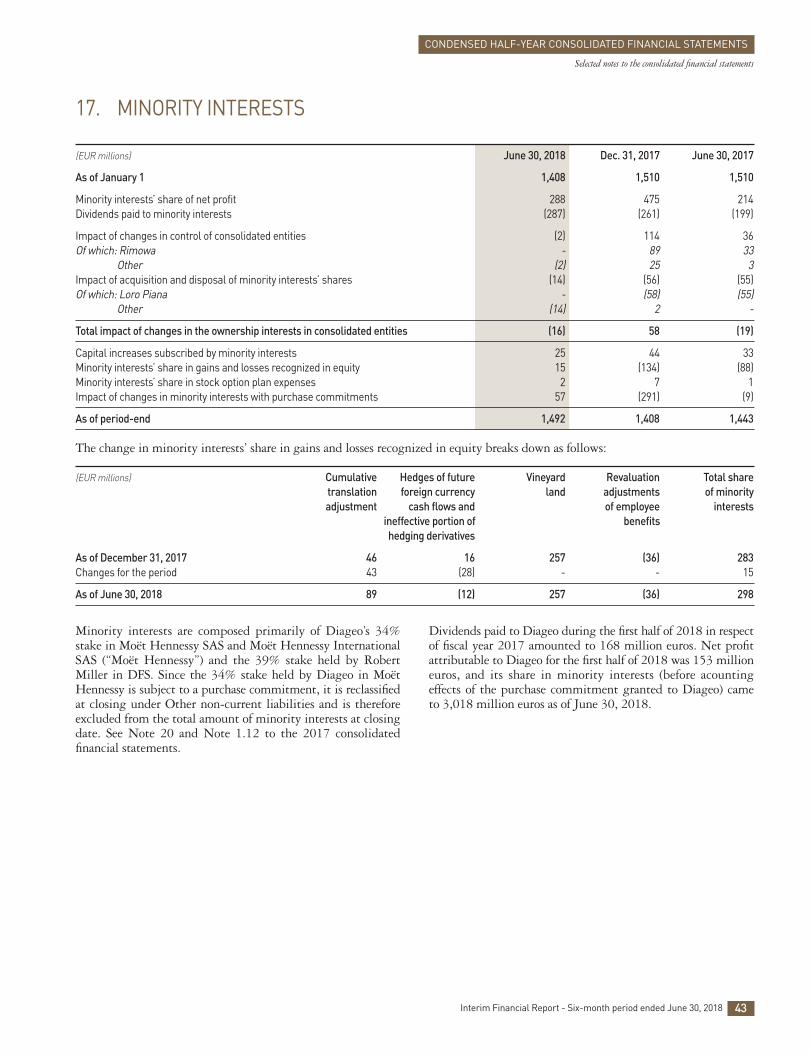
Minority interests are composed primarily of Diageo’s 34%stake in Moët Hennessy SAS and Moët Hennessy InternationalSAS (“Moët Hennessy”) and the 39% stake held by RobertMiller in DFS. Since the 34% stake held by Diageo in MoëtHennessy is subject to a purchase commitment, it is reclassifiedat closing under Other non-current liabilities and is thereforeexcluded from the total amount of minority interests at closingdate. See Note 20 and Note 1.12 to the 2017 consolidatedfinancial statements.
Dividends paid to Diageo during the first half of 2018 in respectof fiscal year 2017 amounted to 168 million euros. Net profitattributable to Diageo for the first half of 2018 was 153 millioneuros, and its share in minority interests (before acountingeffects of the purchase commitment granted to Diageo) cameto 3,018 million euros as of June 30, 2018.
17. MINORITY INTERESTS
(EUR millions) June 30, 2018 Dec. 31, 2017 June 30, 2017
As of January 1 1,408 1,510 1,510
Minority interests’ share of net profit 288 475 214Dividends paid to minority interests (287) (261) (199)
Impact of changes in control of consolidated entities (2) 114 36Of which: Rimowa - 89 33
Other (2) 25 3Impact of acquisition and disposal of minority interests’ shares (14) (56) (55)Of which: Loro Piana - (58) (55)
Other (14) 2 -
Total impact of changes in the ownership interests in consolidated entities (16) 58 (19)
Capital increases subscribed by minority interests 25 44 33Minority interests’ share in gains and losses recognized in equity 15 (134) (88)Minority interests’ share in stock option plan expenses 2 7 1Impact of changes in minority interests with purchase commitments 57 (291) (9)
As of period-end 1,492 1,408 1,443
The change in minority interests’ share in gains and losses recognized in equity breaks down as follows:
(EUR millions) Cumulative Hedges of future Vineyard Revaluation Total share translation foreign currency land adjustments of minority adjustment cash flows and of employee interests ineffective portion of benefits hedging derivatives
As of December 31, 2017 46 16 257 (36) 283Changes for the period 43 (28) - - 15
As of June 30, 2018 89 (12) 257 (36) 298
43Interim Financial Report - Six-month period ended June 30, 2018
CONDENSED HALF-YEAR CONSOLIDATED FINANCIAL STATEMENTS
Selected notes to the consolidated financial statements
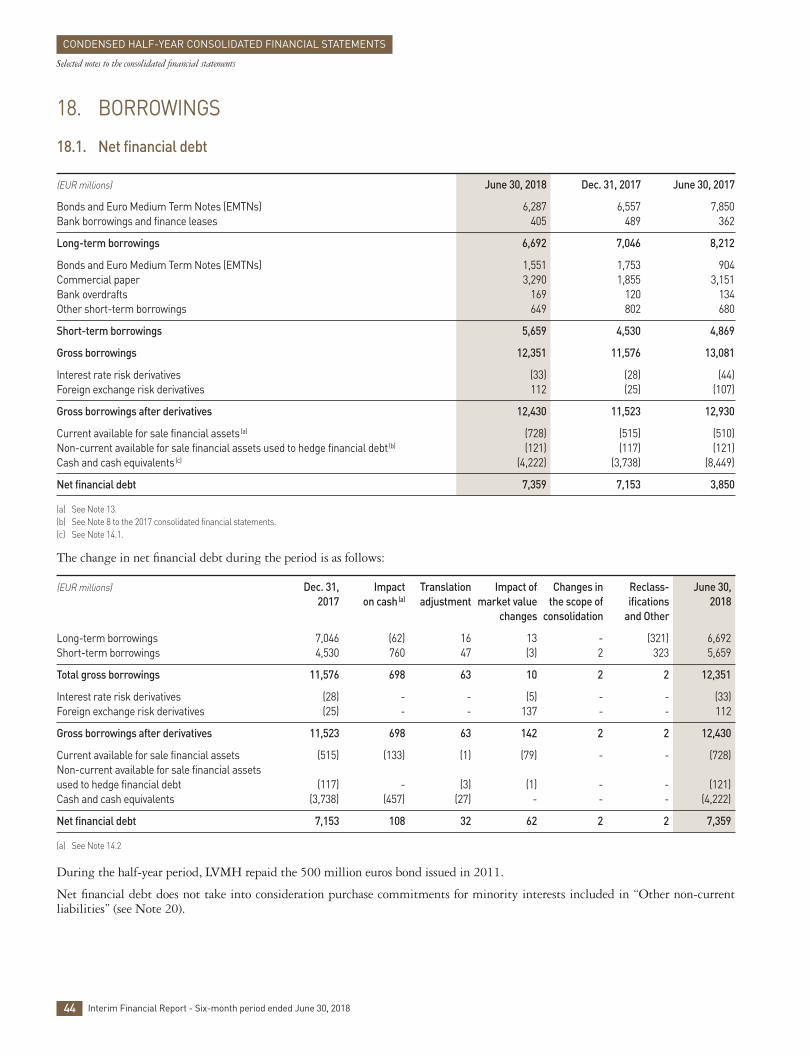
44 Interim Financial Report - Six-month period ended June 30, 2018
CONDENSED HALF-YEAR CONSOLIDATED FINANCIAL STATEMENTS
Selected notes to the consolidated financial statements
18. BORROWINGS
18.1. Net financial debt
(EUR millions) June 30, 2018 Dec. 31, 2017 June 30, 2017
Bonds and Euro Medium Term Notes (EMTNs) 6,287 6,557 7,850Bank borrowings and finance leases 405 489 362
Long-term borrowings 6,692 7,046 8,212
Bonds and Euro Medium Term Notes (EMTNs) 1,551 1,753 904Commercial paper 3,290 1,855 3,151Bank overdrafts 169 120 134Other short-term borrowings 649 802 680
Short-term borrowings 5,659 4,530 4,869
Gross borrowings 12,351 11,576 13,081
Interest rate risk derivatives (33) (28) (44)Foreign exchange risk derivatives 112 (25) (107)
Gross borrowings after derivatives 12,430 11,523 12,930
Current available for sale financial assets(a) (728) (515) (510)Non-current available for sale financial assets used to hedge financial debt(b) (121) (117) (121)Cash and cash equivalents(c) (4,222) (3,738) (8,449)
Net financial debt 7,359 7,153 3,850
(a) See Note 13.(b) See Note 8 to the 2017 consolidated financial statements.(c) See Note 14.1.
The change in net financial debt during the period is as follows:
(EUR millions) Dec. 31, Impact Translation Impact of Changes in Reclass- June 30, 2017 on cash(a) adjustment market value the scope of ifications 2018 changes consolidation and Other
Long-term borrowings 7,046 (62) 16 13 - (321) 6,692Short-term borrowings 4,530 760 47 (3) 2 323 5,659
Total gross borrowings 11,576 698 63 10 2 2 12,351
Interest rate risk derivatives (28) - - (5) - - (33)Foreign exchange risk derivatives (25) - - 137 - - 112
Gross borrowings after derivatives 11,523 698 63 142 2 2 12,430
Current available for sale financial assets (515) (133) (1) (79) - - (728)Non-current available for sale financial assets used to hedge financial debt (117) - (3) (1) - - (121)Cash and cash equivalents (3,738) (457) (27) - - - (4,222)
Net financial debt 7,153 108 32 62 2 2 7,359
(a) See Note 14.2
During the half-year period, LVMH repaid the 500 million euros bond issued in 2011.
Net financial debt does not take into consideration purchase commitments for minority interests included in “Other non-currentliabilities” (see Note 20).

18.2. Analysis of gross borrowings by payment date and by type of interest rate
(EUR millions) Gross Impacts Gross borrowings borrowings of derivatives after derivatives
Fixed Floating Total Fixed Floating Total Fixed Floating Total rate rate rate rate rate rate
Maturity: June 30, 2019 3,652 2,007 5,659 20 8 28 3,672 2,015 5,687 June 30, 2020 1,998 10 2,008 (304) 347 43 1,694 357 2,051 June 30, 2021 1,315 2 1,317 (394) 402 8 921 404 1,325 June 30, 2022 1,931 2 1,933 (965) 956 (9) 966 958 1,924 June 30, 2023 21 1 22 9 - 9 30 1 31 June 30, 2024 1,210 1 1,211 (299) 299 - 911 300 1,211 Thereafter 195 6 201 - - - 195 6 201
Total 10,322 2,029 12,351 (1,933) 2,012 79 8,389 4,041 12,430
See Note 22.3 regarding the market value of interest rate risk derivatives.
18.3. Analysis of gross borrowings by currency after derivatives
(EUR millions) June 30, 2018 Dec. 31, 2017 June 30, 2017
Euro 7,637 6,665 7,492US dollar 3,596 3,045 3,476Swiss franc 171 144 305Japanese yen 601 722 629Other currencies 425 947 1,028
Total 12,430 11,523 12,930
The purpose of foreign currency borrowings is to finance the development of the Group’s activities outside of the eurozone, as well asthe Group’s net worth denominated in foreign currency.
19. PROVISIONS
(EUR millions) June 30, 2018 Dec. 31, 2017 June 30, 2017
Provisions for pensions, medical costs and similar commitments 639 625 664Provisions for contingencies and losses 1,920 1,850 1,634Provisions for reorganization 3 9 6
Non-current provisions 2,562 2,484 2,304
Provisions for pensions, medical costs and similar commitments 4 4 3Provisions for contingencies and losses 319 366 294Provisions for reorganization 24 34 49
Current provisions 347 404 346
Total 2,909 2,888 2,650
45Interim Financial Report - Six-month period ended June 30, 2018
CONDENSED HALF-YEAR CONSOLIDATED FINANCIAL STATEMENTS
Selected notes to the consolidated financial statements

As of June 30, 2018, purchase commitments for minorityinterests’ shares mainly include the put option granted byLVMH to Diageo plc for its 34% share in Moët Hennessy, withsix months’ advance notice and for 80% of the fair value of Moët Hennessy at the exercise date of the commitment.With regard to this commitment’s valuation, the fair value wasdetermined by applying the share price multiples of comparablefirms to Moët Hennessy’s consolidated operating results.
Moët Hennessy SAS and Moët Hennessy International SAS(“Moët Hennessy”) hold the LVMH group’s investments in theWines and Spirits businesses, with the exception of the equityinvestments in Château d’Yquem, Château Cheval Blanc and Closdes Lambrays, and excluding certain champagne vineyards.
Purchase commitments for minority interests’ shares also includecommitments relating to minority shareholders in Loro Piana(15%), Rimowa (20%), Fresh (20%) and distribution subsidiariesin various countries, mainly in the Middle East.
46 Interim Financial Report - Six-month period ended June 30, 2018
CONDENSED HALF-YEAR CONSOLIDATED FINANCIAL STATEMENTS
Selected notes to the consolidated financial statements
During the six-month period, the changes in provisions were as follows:
(EUR millions) Dec. 31, Increases Amounts Amounts Changes in Other(a) June 30, 2017 used released the scope of 2018 consolidation
Provisions for pensions, medical costs and similar commitments 629 46 (35) - - 3 643Provisions for contingencies and losses 2,216 165 (92) (43) - (7) 2,239Provisions for reorganization 43 - (16) - - - 27
Total 2,888 211 (143) (43) - (4) 2,909
Of which: profit from recurring operations 140 (135) (13) net financial income (expense) - (1) (1) other 71 (7) (29)
(a) Including the impact of translation adjustment and change in revaluation reserves.
20. OTHER NON-CURRENT LIABILITIES
(EUR millions) June 30, 2018 Dec. 31, 2017 June 30, 2017
Purchase commitments for minority interests’ shares 9,461 9,177 8,948Derivatives(a) 386 229 160Employee profit sharing 78 94 75Other liabilities 355 370 382
Total 10,280 9,870 9,565
(a) See Note 22.

Financial instruments are mainly used by the Group to hedgerisks arising from Group activity and protect its assets.
The management of foreign exchange and interest rate risk, inaddition to transactions involving shares and financial instruments,is centralized.
The Group has implemented a stringent policy and rigorousmanagement guidelines to manage, measure, and monitorthese market risks.
These activities are organized based on a segregation of dutiesbetween risk measurement, hedging (front office), administration(back office) and financial control.
The backbone of this organization is an integrated informationsystem which allows hedging transactions to be monitoredquickly.
The Group’s hedging strategy is presented to the AuditCommittee. Hedging decisions are made according to anestablished process that includes regular presentations to theGroup’s Executive Committee and detailed documentation.
Counterparties are selected based on their rating and in accordancewith the Group’s risk diversification strategy.
47Interim Financial Report - Six-month period ended June 30, 2018
CONDENSED HALF-YEAR CONSOLIDATED FINANCIAL STATEMENTS
Selected notes to the consolidated financial statements
21. TRADE ACCOUNTS PAYABLE AND OTHER CURRENT LIABILITIES
21.1. Trade accounts payable
The change in trade accounts payable for the periods presented breaks down as follows:
(EUR millions) June 30, 2018 Dec. 31, 2017 June 30, 2017
As of January 1 4,539 4,184 4,184
Changes in trade accounts payable 35 257 (263)Changes in amounts owed to customers (21) 2 (21)Changes in the scope of consolidation 29 315 41Translation adjustment 33 (198) (104)Reclassifications (7) (21) 14
As of period-end 4,608 4,539 3,851
21.2. Other current liabilities
(EUR millions) June 30, 2018 Dec. 31, 2017 June 30, 2017
Derivatives(a) 79 45 71Employees and social institutions 1,291 1,530 1,139Employee profit sharing 57 101 57Taxes other than income taxes 523 634 443Advances and payments on account from customers 367 354 283Provision for product returns(b) 288 - -Deferred payment for non-current assets 500 548 522Deferred income 260 255 249Other liabilities 1,136 1,286 1,072
Total 4,501 4,753 3,836
(a) See Note 22.(b) See Note 1.2 and Note 1.25 to the 2017 consolidated financial statements.
22. FINANCIAL INSTRUMENTS AND MARKET RISK MANAGEMENT
22.1. Organization of foreign exchange, interest rate and equity market risk management

48 Interim Financial Report - Six-month period ended June 30, 2018
22.2. Summary of derivatives
Derivatives are recorded in the balance sheet for the amounts and in the captions detailed as follows:
(EUR millions) Notes June 30, 2018 Dec. 31, 2017 June 30, 2017
Interest rate risk Assets: non-current 36 33 37 current 14 9 16 Liabilities: non-current (8) (8) (4) current (9) (6) (5)
22.3 33 28 44
Foreign exchange risk Assets: non-current 46 34 82 current 131 485 431 Liabilities: non-current (89) (42) (20) current (70) (39) (64)
22.4 18 438 429
Other risks Assets: non-current 289 179 136 current - 2 - Liabilities: non-current (289) (179) (136) current - - (2)
- 2 (2)
Total Assets: non-current 9 371 246 255 current 12 145 496 447 Liabilities: non-current 20 (386) (229) (160) current 21 (79) (45) (71)
51 468 471
22.3. Derivatives used to manage interest rate risk
The aim of the Group’s debt management policy is to adapt the debt maturity profile to the characteristics of the assets held, to contain borrowing costs, and to protect net profit from the impact of significant changes in interest rates.
For these purposes, the Group uses interest rate swaps and options.
Derivatives used to manage interest rate risk outstanding as of June 30, 2018 break down as follows:
(EUR millions) Nominal amounts by maturity Market value(a) (b)
Less than One to More than Total Fair value Not Total one year five years five years hedges allocated
Interest rate swaps in euros, floating-rate payer - 2,046 300 2,346 37 - 37Interest rate swaps in euros, fixed-rate payer - 343 - 343 - (1) (1)Foreign currency swaps 66 698 - 764 (3) - (3)Other interest rate risk derivatives - 172 - 172 - - -
Total 34 (1) 33
(a) Gain / (Loss).(b) See Note 1.9 to the 2017 consolidated financial statements regarding the methodology used for market value measurement
CONDENSED HALF-YEAR CONSOLIDATED FINANCIAL STATEMENTS
Selected notes to the consolidated financial statements
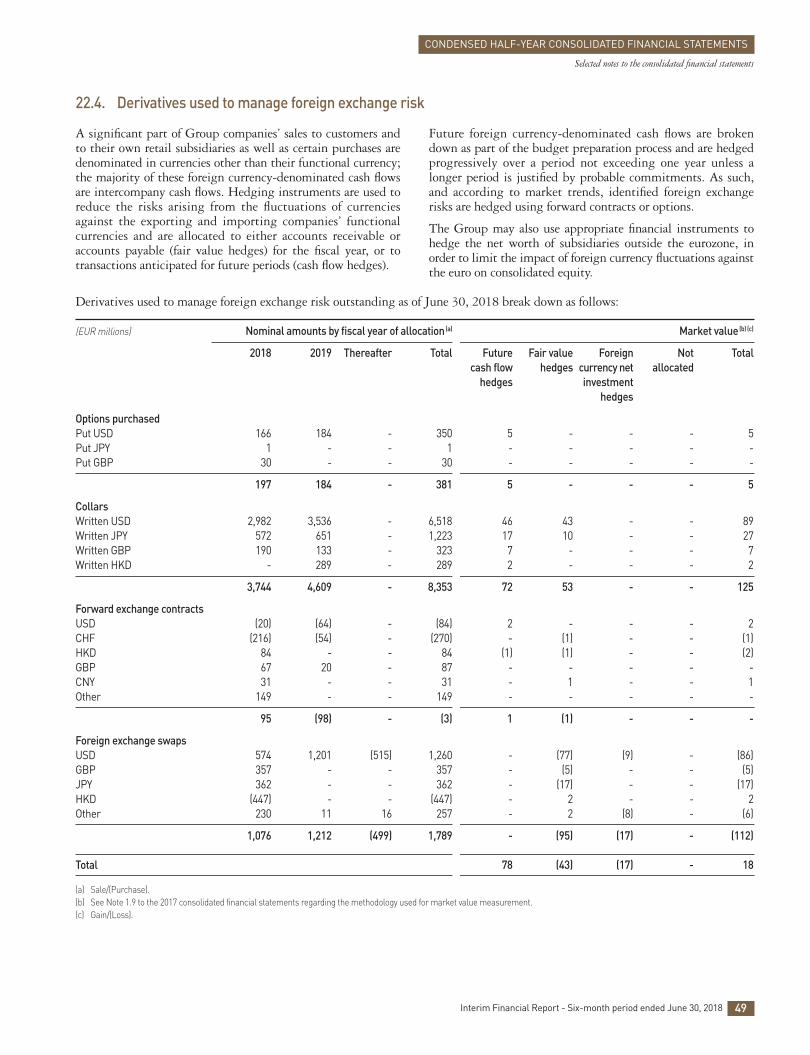
Derivatives used to manage foreign exchange risk outstanding as of June 30, 2018 break down as follows:
(EUR millions) Nominal amounts by fiscal year of allocation(a) Market value(b) (c)
2018 2019 Thereafter Total Future Fair value Foreign Not Total cash flow hedges currency net allocated hedges investment hedges
Options purchased Put USD 166 184 - 350 5 - - - 5Put JPY 1 - - 1 - - - - -Put GBP 30 - - 30 - - - - -
197 184 - 381 5 - - - 5
Collars Written USD 2,982 3,536 - 6,518 46 43 - - 89Written JPY 572 651 - 1,223 17 10 - - 27Written GBP 190 133 - 323 7 - - - 7Written HKD - 289 - 289 2 - - - 2
3,744 4,609 - 8,353 72 53 - - 125
Forward exchange contracts USD (20) (64) - (84) 2 - - - 2CHF (216) (54) - (270) - (1) - - (1)HKD 84 - - 84 (1) (1) - - (2)GBP 67 20 - 87 - - - - -CNY 31 - - 31 - 1 - - 1Other 149 - - 149 - - - - -
95 (98) - (3) 1 (1) - - -
Foreign exchange swaps USD 574 1,201 (515) 1,260 - (77) (9) - (86)GBP 357 - - 357 - (5) - - (5)JPY 362 - - 362 - (17) - - (17)HKD (447) - - (447) - 2 - - 2Other 230 11 16 257 - 2 (8) - (6)
1,076 1,212 (499) 1,789 - (95) (17) - (112)
Total 78 (43) (17) - 18
(a) Sale / (Purchase).(b) See Note 1.9 to the 2017 consolidated financial statements regarding the methodology used for market value measurement.(c) Gain / (Loss).
A significant part of Group companies’ sales to customers andto their own retail subsidiaries as well as certain purchases aredenominated in currencies other than their functional currency;the majority of these foreign currency-denominated cash flowsare intercompany cash flows. Hedging instruments are used toreduce the risks arising from the fluctuations of currenciesagainst the exporting and importing companies’ functionalcurrencies and are allocated to either accounts receivable oraccounts payable (fair value hedges) for the fiscal year, or totransactions anticipated for future periods (cash flow hedges).
Future foreign currency-denominated cash flows are brokendown as part of the budget preparation process and are hedgedprogressively over a period not exceeding one year unless alonger period is justified by probable commitments. As such,and according to market trends, identified foreign exchangerisks are hedged using forward contracts or options.
The Group may also use appropriate financial instruments tohedge the net worth of subsidiaries outside the eurozone, inorder to limit the impact of foreign currency fluctuations againstthe euro on consolidated equity.
22.4. Derivatives used to manage foreign exchange risk
49Interim Financial Report - Six-month period ended June 30, 2018
CONDENSED HALF-YEAR CONSOLIDATED FINANCIAL STATEMENTS
Selected notes to the consolidated financial statements
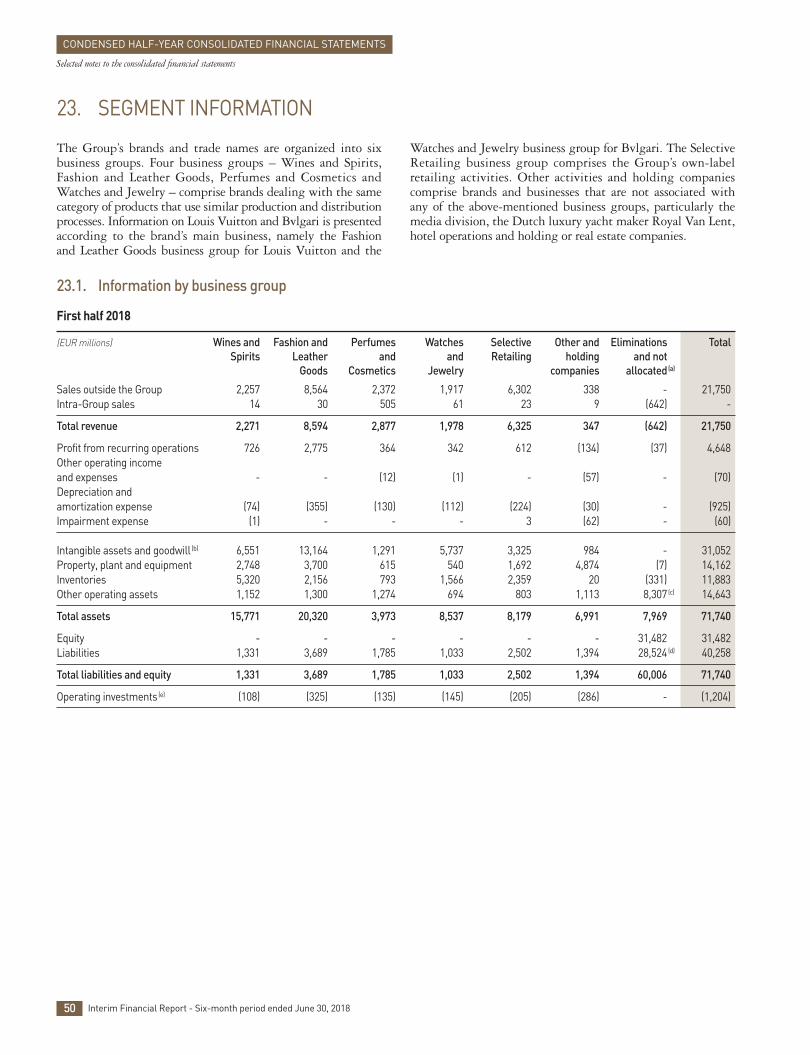
23.1. Information by business group
First half 2018
(EUR millions) Wines and Fashion and Perfumes Watches Selective Other and Eliminations Total Spirits Leather and and Retailing holding and not
Goods Cosmetics Jewelry companies allocated(a)
Sales outside the Group 2,257 8,564 2,372 1,917 6,302 338 - 21,750Intra-Group sales 14 30 505 61 23 9 (642) -
Total revenue 2,271 8,594 2,877 1,978 6,325 347 (642) 21,750
Profit from recurring operations 726 2,775 364 342 612 (134) (37) 4,648Other operating income and expenses - - (12) (1) - (57) - (70)Depreciation and amortization expense (74) (355) (130) (112) (224) (30) - (925)Impairment expense (1) - - - 3 (62) - (60)
Intangible assets and goodwill(b) 6,551 13,164 1,291 5,737 3,325 984 - 31,052Property, plant and equipment 2,748 3,700 615 540 1,692 4,874 (7) 14,162Inventories 5,320 2,156 793 1,566 2,359 20 (331) 11,883Other operating assets 1,152 1,300 1,274 694 803 1,113 8,307(c) 14,643
Total assets 15,771 20,320 3,973 8,537 8,179 6,991 7,969 71,740
Equity - - - - - - 31,482 31,482Liabilities 1,331 3,689 1,785 1,033 2,502 1,394 28,524(d) 40,258
Total liabilities and equity 1,331 3,689 1,785 1,033 2,502 1,394 60,006 71,740
Operating investments(e) (108) (325) (135) (145) (205) (286) - (1,204)
The Group’s brands and trade names are organized into sixbusiness groups. Four business groups – Wines and Spirits,Fashion and Leather Goods, Perfumes and Cosmetics andWatches and Jewelry – comprise brands dealing with the samecategory of products that use similar production and distributionprocesses. Information on Louis Vuitton and Bvlgari is presentedaccording to the brand’s main business, namely the Fashionand Leather Goods business group for Louis Vuitton and the
Watches and Jewelry business group for Bvlgari. The SelectiveRetailing business group comprises the Group’s own-labelretailing activities. Other activities and holding companiescomprise brands and businesses that are not associated withany of the above-mentioned business groups, particularly themedia division, the Dutch luxury yacht maker Royal Van Lent,hotel operations and holding or real estate companies.
50 Interim Financial Report - Six-month period ended June 30, 2018
CONDENSED HALF-YEAR CONSOLIDATED FINANCIAL STATEMENTS
Selected notes to the consolidated financial statements
23. SEGMENT INFORMATION

Fiscal year 2017
(EUR millions) Wines and Fashion and Perfumes Watches Selective Other and Eliminations Total Spirits Leather and and Retailing holding and not
Goods Cosmetics Jewelry companies allocated(a)
Sales outside the Group 5,051 15,422 4,534 3,722 13,272 635 - 42,636Intra-Group sales 33 50 1,026 83 39 16 (1,247) -
Total revenue 5,084 15,472 5,560 3,805 13,311 651 (1,247) 42,636
Profit from recurring operations 1,558 4,905 600 512 1,075 (309) (48) 8,293Other operating income and expenses (18) (29) (8) (90) (42) 7 - (180)Depreciation and amortization expense (159) (669) (254) (223) (452) (65) - (1,822)Impairment expense 1 - - (50) (58) (2) - (109)
Intangible assets and goodwill(b) 6,277 13,149 1,280 5,684 3,348 1,056 - 30,794Property, plant and equipment 2,740 3,714 607 537 1,701 4,570 (7) 13,862Inventories 5,115 1,884 634 1,420 2,111 16 (292) 10,888Other operating assets 1,449 1,234 1,108 598 845 1,279 7,698(c) 14,211
Total assets 15,581 19,981 3,629 8,239 8,005 6,921 7,399 69,755
Equity - - - - - - 30,377 30,377Liabilities 1,544 3,539 1,706 895 2,839 1,223 27,632(d) 39,378
Total liabilities and equity 1,544 3,539 1,706 895 2,839 1,223 58,009 69,755
Operating investments(e) (292) (563) (286) (269) (570) (297) 1 (2,276)
First half 2017
(EUR millions) Wines and Fashion and Perfumes Watches Selective Other and Eliminations Total Spirits Leather and and Retailing holding and not
Goods Cosmetics Jewelry companies allocated(a)
Sales outside the Group 2,275 6,876 2,187 1,794 6,264 318 - 19,714Intra-Group sales 19 23 483 44 16 8 (593) -
Total revenue 2,294 6,899 2,670 1,838 6,280 326 (593) 19,714
Profit from recurring operations 681 2,192 292 234 441 (175) (25) 3,640Other operating income and expenses (7) (14) (3) (26) (39) (6) - (95)Depreciation and amortization expense (74) (294) (112) (106) (223) (29) - (838)Impairment expense - - (1) - (49) (1) - (51)
Intangible assets and goodwill(b) 6,260 7,100 1,296 5,875 3,433 1,054 - 25,018Property, plant and equipment 2,651 2,174 560 513 1,721 4,528 (7) 12,140Inventories 5,105 1,622 653 1,552 2,192 19 (278) 10,865Other operating assets 1,090 829 924 689 796 1,280 12,198(c) 17,806
Total assets 15,106 11,725 3,433 8,629 8,142 6,881 11,913 65,829
Equity - - - - - - 28,282 28,282Liabilities 1,349 2,748 1,452 963 2,346 1,269 27,420(d) 37,547
Total liabilities and equity 1,349 2,748 1,452 963 2,346 1,269 55,702 65,829
Operating investments(e) (108) (245) (112) (130) (261) (132) - (988)
(a) Eliminations correspond to sales between business groups; these generally consist of sales to Selective Retailing from other business groups. Selling prices between the differentbusiness groups correspond to the prices applied in the normal course of business for sales transactions to wholesalers or distributors outside the Group.
(b) Intangible assets and goodwill correspond to the net carrying amounts shown under Notes 3 and 4.(c) Assets not allocated include available for sale financial assets, other financial assets, and both current and deferred tax assets.(d) Liabilities not allocated include financial debt and both current and deferred tax liabilities.(e) Increase / (Decrease) in cash and cash equivalents.
51Interim Financial Report - Six-month period ended June 30, 2018
CONDENSED HALF-YEAR CONSOLIDATED FINANCIAL STATEMENTS
Selected notes to the consolidated financial statements

23.2. Information by geographic region
Revenue by geographic region of delivery breaks down as follows:
(EUR millions) June 30, 2018 Dec. 31, 2017 June 30, 2017
France 2,057 4,172 1,857Europe (excluding France) 3,863 8,000 3,506United States 5,041 10,691 4,967Japan 1,554 2,957 1,383Asia (excluding Japan) 6,739 11,877 5,725Other countries 2,496 4,939 2,276
Revenue 21,750 42,636 19,714
Operating investments by geographic region of delivery breaks down as follows:
(EUR millions) June 30, 2018 Dec. 31, 2017 June 30, 2017
France 504 921 405Europe (excluding France) 224 450 186United States 228 393 181Japan 39 51 41Asia (excluding Japan) 141 309 123Other countries 68 152 52
Operating investments 1,204 2,276 988
No geographic breakdown of segment assets is provided since a significant portion of these assets consists of brands and goodwill,which must be analyzed on the basis of the revenue generated by these assets in each region, and not in relation to the region of theirlegal ownership.
23.3. Quarterly information
Quarterly revenue by business group break down as follows:
(EUR millions) Wines and Fashion and Perfumes Watches Selective Other and Eliminations Total Spirits Leather and and Retailing holding
Goods Cosmetics Jewelry companies
First quarter 1,195 4,270 1,500 959 3,104 161 (335) 10,854Second quarter 1,076 4,324 1,377 1,019 3,221 186 (307) 10,896
Total for first half 2018 2,271 8,594 2,877 1,978 6,325 347 (642) 21,750
(EUR millions) Wines and Fashion and Perfumes Watches Selective Other and Eliminations Total Spirits Leather and and Retailing holding
Goods Cosmetics Jewelry companies
First quarter 1,196 3,405 1,395 879 3,154 163 (308) 9,884Second quarter 1,098 3,494(a) 1,275 959 3,126 163 (285) 9,830
Total for first half 2017 2,294 6,899 2,670 1,838 6,280 326 (593) 19,714
Third quarter 1,220 3,939 1,395 951 3,055 146 (325) 10,381Fourth quarter 1,570 4,634 1,495 1,016 3,976 179 (329) 12,541
Total for second half 2017 2,790 8,573 2,890 1,967 7,031 325 (654) 22,922
Total for 2017 5,084 15,472 5,560 3,805 13,311 651 (1,247) 42,636
(a) Including the entire revenue of Rimowa of the first half of 2017.
52 Interim Financial Report - Six-month period ended June 30, 2018
CONDENSED HALF-YEAR CONSOLIDATED FINANCIAL STATEMENTS
Selected notes to the consolidated financial statements

24. EXPENSES BY NATURE
Profit from recurring operations includes the following expenses:
(EUR millions) June 30, 2018 Dec. 31, 2017 June 30, 2017
Advertising and promotion expenses 2,523 4,831 2,226Lease expenses 1,766 3,783 1,824Personnel costs 4,045 7,618 3,593Research and development expenses 59 130 65
25. OTHER OPERATING INCOME AND EXPENSES
(EUR millions) June 30, 2018 Dec. 31, 2017 June 30, 2017
Net gains (losses) on disposals 3 (15) (8)Restructuring costs - (15) (13)Remeasurement of shares acquired prior to their initial consolidation - (12) -Transaction costs relating to the acquisition of consolidated companies - (13) (7)Impairment or amortization of brands, trade names, goodwill and other property (73) (128) (65)Other items, net - 3 (2)
Other operating income and expenses (70) (180) (95)
Impairment and amortization expenses recorded are mostly for brands and goodwill.
26. NET FINANCIAL INCOME / (EXPENSE)
(EUR millions) June 30, 2018 Dec. 31, 2017 June 30, 2017
Borrowing costs (73) (169) (78)Income from cash, cash equivalents and current available for sale financial assets 18 34 16Fair value adjustment of borrowings and interest rate hedges (1) (2) -
Cost of net financial debt (56) (137) (62)
Dividends received from non-current available for sale financial assets 18 13 4Ineffective portion of foreign exchange derivatives (68) (168) (74)Net gain / (loss) related to available for sale financial assets and other financial instruments 95 264 127Other items, net (11) (31) (14)
Other financial income and expenses 34 78 43
Net financial income / (expense) (22) (59) (19)
The ineffective portion of exchange rate derivatives breaks down as follows:
(EUR millions) June 30, 2018 Dec. 31, 2017 June 30, 2017
Ineffective portion of commercial foreign exchange derivatives (65) (175) (86)Ineffective portion of foreign exchange derivatives related to net investments denominated in foreign currency 2 - -Ineffective portion of other foreign exchange derivatives (5) 7 12
Ineffective portion of foreign exchange derivatives (68) (168) (74)
53Interim Financial Report - Six-month period ended June 30, 2018
CONDENSED HALF-YEAR CONSOLIDATED FINANCIAL STATEMENTS
Selected notes to the consolidated financial statements

28. EARNINGS PER SHARE
June 30, 2018 Dec. 31, 2017 June 30, 2017
Net profit, Group share (EUR millions) 3,004 5,365 2,127
Average number of shares in circulation during the fiscal year 506,624,444 507,172,381 507,277,480Average number of treasury shares owned during the fiscal year (3,807,863) (4,759,687) (5,035,580)
Average number of shares on which the calculation before dilution is based 502,816,581 502,412,694 502,241,900
Basic earnings per share (EUR) 5.97 10.68 4.24
Average number of shares in circulation on which the above calculation is based 502,816,581 502,412,694 502,241,900Dilution effect of stock option and bonus share plans 1,286,090 1,597,597 1,807,466Other dilution effects - - -
Average number of shares on which the calculation after dilution is based 504,102,671 504,010,291 504,049,366
Diluted earnings per share (EUR) 5.96 10.64 4.22
The effective tax rate used as of June 30 is the forecast effectivetax rate for the fiscal year.
The Group’s effective tax rate was 28%, down 6 points fromthe first half of 2017. This decrease primarily reflects the Group’searnings growth amid a downward trend in corporate tax rates
worldwide. In particular, the lower tax rate in the United Statesbeginning in 2018 accounted for 1.5 points of the decline.Furthermore, the cancellation of the dividend tax in France atthe end of 2017 led to an additional reduction of 1.1 points.The remaining impact is related to various non-recurring items.
27. INCOME TAXES
(EUR millions) June 30, 2018 Dec. 31, 2017 June 30, 2017
Current income taxes for the fiscal year (1,232) (2,875) (1,205)Current income taxes relating to previous fiscal years 6 474 (1)
Current income taxes (1,226) (2,401) (1,206)
Change in deferred income taxes (29) 137 22Impact of changes in tax rates on deferred income taxes (9) 50 (1)
Deferred income taxes (38) 187 21
Total tax expense per income statement (1,264) (2,214) (1,185)
Tax on items recognized in equity 110 (103) (120)
The effective tax rate is as follows:
(EUR millions) June 30, 2018 Dec. 31, 2017 June 30, 2017
Profit before tax 4,556 8,054 3,526Total income tax expense (1,264) (2,214) (1,185)
Effective tax rate 27.7% 27.5% 33.6%
54 Interim Financial Report - Six-month period ended June 30, 2018
CONDENSED HALF-YEAR CONSOLIDATED FINANCIAL STATEMENTS
Selected notes to the consolidated financial statements
29. OFF-BALANCE SHEET COMMITMENTS
The Group’s off-balance sheet commitments, which amounted to 14.9 billion euros as of December 31, 2017, rose by 0.6 billioneuros in the first half of 2018 due essentially to purchase commitments for raw materials, grapes and eaux-de-vie for 0.3 billion eurosand to foreign exchange fluctuations for 0.2 billion euros.
30. EXCEPTIONAL EVENTS AND LITIGATION
No significant exceptional events or litigation occurred during the six-month period.
31. RELATED-PARTY TRANSACTIONS
No significant related-party transactions occured during the six-month period.
32. SUBSEQUENT EVENTS
No significant subsequent events occurred between June 30, 2018 and July 24, 2018, the date on which the financial statementswere approved for publication by the Board of Directors.
55Interim Financial Report - Six-month period ended June 30, 2018
CONDENSED HALF-YEAR CONSOLIDATED FINANCIAL STATEMENTS
Selected notes to the consolidated financial statements

STATUTORY AUDITORS’ REVIEW REPORT ON THE HALF-YEARLY FINANCIAL INFORMATION
To the Shareholders’ Meeting of LVMH Moët Hennessy - Louis Vuitton,
In compliance with the assignment entrusted to us by the Shareholder’s Meeting and in accordance with the requirements of the Article L.451-1-2 III of the French Monetary and Financial Code (Code monétaire et financier), we hereby report to you on:
- the review of the accompanying condensed half-yearly consolidated financial statements of LVMH Moët Hennessy - Louis Vuitton(“LVMH”), for the period from January 1 to June 30, 2018;
- the verification of the information presented in the half-yearly management report.
These condensed half-yearly consolidated financial statements are the Board of Directors’ responsibility. Our role is to express aconclusion on these financial statements based on our review.
I. Conclusion on the financial statements
We conducted our review in accordance with professional standards applicable in France. A review of interim financial informationconsists of making inquiries, primarily of persons responsible for financial and accounting matters, and applying analytical and otherreview procedures. A review is substantially less in scope than an audit conducted in accordance with the professional standardsapplicable in France and consequently does not enable us to obtain assurance that the financial statements, taken as a whole, are freefrom material misstatements, as we would not become aware of all significant matters that might be identified in an audit.Accordingly, we do not express an audit opinion.
Based on our review, nothing has come to our attention that causes us to believe that the accompanying condensed half-yearlyconsolidated financial statements are not prepared, in all material respects, in accordance with IAS 34 – standard of the IFRSs asadopted by the European Union applicable to interim financial information.
Without qualifying our conclusion, we draw your attention to the matter set out in Note 1.2 to the condensed half-yearly consolidatedfinancial statements regarding the impacts related to the first application of IFRS 9 on financial instruments and IFRS 15 on revenuerecognition.
II. Specific verification
We have also verified the information presented in the half-yearly management report on the condensed half-yearly consolidatedfinancial statements subject to our review.
We have no matters to report as to its fair presentation and consistency with the condensed half-yearly consolidated financial statements.
Courbevoie and Paris-La Défense, July 24, 2018
The Statutory Auditors
French original signed by
Mazars Ernst & Young Audit
Loïc Wallaert Simon Beillevaire Jeanne Boillet Patrick Vincent-Genod
56 Interim Financial Report - Six-month period ended June 30, 2018
This is a translation into English of the statutory auditors' review report on the half-yearly financial information issued in French and is provided solely for theconvenience of English-speaking users. This report includes information relating to the specific verification of information given in the Group’s half-yearlymanagement report.
This report should be read in conjunction with, and construed in accordance with, French law and professional standards applicable in France.

STATEMENT BY THE COMPANY OFFICER RESPONSIBLE FOR THE INTERIM FINANCIAL REPORT
We declare that, to the best of our knowledge, the condensed interim consolidated financial statements have been prepared inaccordance with applicable accounting standards and provide a true and fair view of the assets, liabilities, financial position andprofit or loss of the parent company and of all consolidated companies, and that the interim management report presented on page 6gives a true and fair picture of the significant events during the first six months of the fiscal year and their impact on the financialstatements, and the main related party transactions, as well as a description of the main risks and uncertainties for the remaining six months of the fiscal year.
Paris, July 24, 2018
Under delegation from the Chairman and Chief Executive Officer
Jean-Jacques GUIONY
Chief Financial Officer, Member of the Executive Committee
57Interim Financial Report - Six-month period ended June 30, 2018

58 Interim Financial Report - Six-month period ended June 30, 2018

Design and production: Agence Marc Praquin

For any information:LVMH, 22 avenue Montaigne - 75008 Paris
Tel. +33 1 44 13 22 22 - Fax +33 1 44 13 21 19
www.lvmh.com