Embed Size (px)
Citation preview

TRANSIT QUALITY OF SERVICE APPLICATIONS GUIDE
PILOT WORKSHOP DRAFT SEPTEMBER 4, 2007

i
Table of Contents
1.1 FDOT Transit Quality of Service Initiative ............................................................ 3 1.2 Incorporating Transit LOS Measures into Agency Activities ................................ 4 1.3 How to Use This Report ......................................................................................... 5
2.1 Concept ................................................................................................................... 7
3.1 Fixed-Route Transit LOS Measure Overview ...................................................... 11 3.2 Fixed-Route Transit LOL Measure Applications ................................................. 13 3.3 Demand-Responsive Transit................................................................................. 28 3.4 Transit Quality of Service Tools Matrix............................................................... 31 3.5 Sample Applications ............................................................................................. 32
4.1 Fixed-Route Transit .............................................................................................. 33 4.2 Demand-Responsive Transit................................................................................. 55
Chapter 1 - INTRODUCTION ...................................................................................... 3
Chapter 2 - TRANSIT QUALITY OF SERVICE OVERVIEW................................... 7
Chapter 3 - LOS MEASURE APPLICATIONS ......................................................... 11
Chapter 4 - CALCULATION PROCEDURES ........................................................... 33

ii
List of Figures Figure 1- Activity Center LOS Analysis for Northern Virginia................................... 15 Figure 2- LOS for Urban Village Transit Network in Seattle ...................................... 17 Figure 3- Portland, OR Regional Public Transportation Plan ...................................... 18 Figure 4- Transit Service Coverage Assessment for Tualatin, OR .............................. 19 Figure 5- Cost Feasible Transit Plan for Tallahassee Area .......................................... 20 Figure 6- Service Coverage In Relation to Pedestrian System Connectivity in
Jacksonville……........................................................................................... 21 Figure 7- TriMet Service Coverage Area ..................................................................... 38 Figure 8- Transit-Supportive Areas .............................................................................. 38 Figure 9- Transit-Supportive Areas Served.................................................................. 39 Figure 10- Street Pattern Types ..................................................................................... 42 Figure 11- Pedestrian Crossing Factor........................................................................... 45
List of Tables Table 1- TCQSM Fixed-Route Transit Quality of Service Framework........................ 8 Table 2- TCQSM Demand-Responsive Transit Quality of Service Framework .......... 9 Table 3- Activity Center Based LOS Analysis for Tampa Area................................. 16 Table 4- Service Reliability LOS Definitions from TCQSM, 2nd Edition .................. 23 Table 5- Hours of Service Standards for ADA vs. Non-ADA Trips – Portland, OR . 30 Table 6- Service Frequency LOS Standards ............................................................... 33 Table 7- Hours of Service LOS Standards .................................................................. 34 Table 8- Service Coverage LOS Standards................................................................. 36 Table 9- Service Coverage Results ............................................................................. 39 Table 10- Street Connectivity Factors........................................................................... 43 Table 11- Relationship Between Network Connectivity Index and Street Pattern
Type…...……………………………………………………………………43 Table 12- Grade Factor.................................................................................................. 43 Table 13- Average Pedestrian Street Crossing Delay: Signalized Crossings ................. 46 Table 14- Average Pedestrian Crossing Delay: Unsignalized Crossing with no
Pedestrian Right-of-Way ...............................................................................47 Table 15- Passenger Space Requirements..................................................................... 49 Table 16- Passenger Load LOS..................................................................................... 50 Table 17- Reliability LOS Standards ............................................................................ 51 Table 18- Headway Adherence LOS............................................................................. 52 Table 19- Transit-Auto Travel Time LOS Standards.................................................... 54 Table 20- DRT Response Time LOS ............................................................................ 56 Table 21- DRT Service Span LOS................................................................................ 57 Table 22- DRT On-Time Performance LOS................................................................. 59 Table 23- DRT Trips Not Served LOS ......................................................................... 60 Table 24- DRT-Auto Travel Time LOS........................................................................ 61

FDOT TQoS Applications Guide – Pilot Workshop Draft September 4, 2007
FDOT Public Transit Office 3
Chapter 1 - INTRODUCTION
1.1 FDOT Transit Quality of Service Initiative
History The Florida Department of Transportation has had an intense interest in transit quality of service assessment for almost ten years, since the initial research was performed on the subject in the preparation of the first edition of the Transit Capacity and Quality of Service Manual by the Transit Cooperative Research Program (published in 1999). This interest and direction within FDOT has come from the Central Office in Tallahassee. The first edition of the TCQSM identified for the first time a set of transit level of service measures from the passengers’ point‐of‐view, for fixed‐route transit service. Subsequent to the preparation of the first edition, the second edition of the TCQSM published in 2004 refined the fixed‐route LOS measures and identified a set of LOS measures for demand‐responsive transit service. Beginning in 1999, FDOT sponsored a multi‐year effort to develop the Transit Level of Service, or TLOS, software package. This software is a GIS‐based model to evaluate the availability of fixed‐route transit service in real time, through the creation of pedestrian accessibility buffers around transit stops and stations, and the development of the % transit supportive area served by transit measure, which has been translated into a LOS measure. Five versions of the software package were eventually developed, including the ability to identify transit travel time and estimate transit ridership by stop. In 2000, FDOT sponsored a state research effort involving the University of Florida to develop enhanced corridor transit level of service analysis procedures, associated with the development of overall multi‐modal LOS measures and procedures including the auto, bicycle, and pedestrian modes. In particular related to transit, pedestrian accessibility factors (such as sidewalk availability and street connectivity) were built into refined transit LOS measures. In 2001, the FDOT Central Office decided to require all MPO’s in Florida to conduct a transit level of service evaluation associated with their existing transit systems. The procedures for conducting these evaluations were addressed in the initial FDOT Transit Level of Service Agency Reporting Guide, published in 2002. All MPO’s were requested to conduct their evaluations and submit data on designated reporting sheets by the end of 2002. Some MPO’s actually had the transit agencies in their jurisdiction conduct and report the evaluations. The procedures focused on all six LOS measures for fixed‐route

FDOT TQoS Applications Guide – Pilot Workshop Draft September 4, 2007
FDOT Public Transit Office 4
service identified in the first edition of the TCQSM, with service frequency, hours of service and transit to auto travel time measures calculated for transit trips between designated activity centers. In 2002, FDOT produced an updated Transit LOS Agency Reporting Guide, which scaled back and only included procedures for four of the fixed‐route service measures – service frequency, hours of service, service coverage and transit to auto travel time. The passenger loading and on‐time performance LOS measures were dropped due to the extensive field data collection required to provide meaningful data. At this juncture, FDOT also identified that transit LOS evaluations be conducted and submitted with all MPO Long‐Range Transportation Plan Updates in Florida. In 2005, FDOT sponsored a study to refine the transit to auto travel time LOS measure calculation procedures, based on an extensive transit to auto travel time data collection effort in the Jacksonville area.
Purpose Over the past couple of years, several MPO’s have expressed frustration to FDOT on the usefulness of conducting transit LOS evaluations associated with their LRTP updates. Many MPO’s have conducted the evaluations due to the reporting requirements, but really have not integrated the transit LOS concept into the transportation system alternatives development and evaluation process. Several MPO’s have also inquired as to possible modifications to the procedures including more route based assessment.
1.2 Incorporating Transit LOS Measures into Agency Activities
FDOT MPO Reporting Requirements FDOT plans to continue to require MPO’s to incorporate transit level of service evaluations in their LRTP updates. To that end, updated MPO reporting procedures have been prepared and are included in this Guide. The procedures have been refined to reflect the latest modifications to the transit LOS measures and analysis procedures, and provide more flexibility in conducting the level of service assessment. It is the hope that MPO’s will apply the transit level of service assessment procedures in the actual transportation system needs and alternatives development and evaluation tasks of their LRTP updates, as opposed to only reporting the transit level of service impacts associated with the recommended plan.

FDOT TQoS Applications Guide – Pilot Workshop Draft September 4, 2007
FDOT Public Transit Office 5
Other Applications There are many other planning and design applications for transit level of service measurement beyond MPO LRTP updates. These include the following:
• Transit Development Plans • Long‐range Transportation Plans (by jurisdictions other than MPO’s) • Statewide Transportation Planning • Transit Service Planning • Comprehensive Operational Analysis • Demand‐Responsive Transit Planning • Facility Planning and Design • Corridor Master Plans/PD&E Studies • Premium Transit Alternatives Analysis
FDOT has decided to provide a broader perspective on the use of transit level of service measurement in this Guide for each of the nine identified applications.
1.3 How to Use This Report
Education This Guide is intended to provide a universal reference in the application of transit level of service measurement in transit planning and design. It is intended to educate Florida MPO, FDOT, County and City, and local transit agency staff and their consultants. Information is provided on the basic structure and calculation procedures associated with both the fixed‐route and demand‐responsive transit service measures in the TCQSM 2nd Edition. A series of workshops will be presented in 2007 around Florida that reviews the information in this Guide and its application to different transit planning and design activities.
Application Identification This Guide presents how transit level of service measurement can be applied for the nine transit planning and design applications identified in Section 1.2. It identifies typical situations where transit LOS measurement can aid in establishing transit improvement need, and in the development and evaluation of transit service and facility alternatives. Sample problems are also presented that illustrate approaches to particularly relevant planning and design issues associated with certain applications.

FDOT TQoS Applications Guide – Pilot Workshop Draft September 4, 2007
FDOT Public Transit Office 6
Procedures For each fixed–route and demand‐response transit level of service measures, procedures are presented on how to calculate each measure under different physical or operating scenarios. The calculation procedures in many cases are similar in applying certain transit LOS measures to different planning and design applications. The identified procedures are consistent with their presentation in the TCQSM 2nd Edition.

FDOT TQoS Applications Guide – Pilot Workshop Draft September 4, 2007
FDOT Public Transit Office 7
Chapter 2 - TRANSIT QUALITY OF SERVICE OVERVIEW
2.1 Concept
Transit quality of service is the evaluation of transit service from the passenger’s point‐of‐view. It takes a different approach to service evaluation than that historically used by the transit industry, which is to measure the business aspects of transit service—things such as ridership, cost effectiveness, and productivity. Transit quality of service evaluations are not intended to replace these traditional measures, but rather to supplement them. For example, transit quality of service measures can help agencies better understand their ridership patterns and help them plan their service to provide the best‐quality service possible to the greatest number of potential customers, within the constraints of their budget. There are two primary aspects of quality of service to consider. The first is the availability of service, both geographically and by time of day. If service isn’t available between the locations where one wants to travel, or isn’t provided at the times one wants to travel, transit isn’t an option for that trip. In addition, even if service is available, people need to know how to use it (e.g., where to go to catch the bus, what time the bus is scheduled to arrive, what the fare is and how to pay it, etc.). The second aspect is the comfort and convenience of the service. This encompasses a number of factors, for example, the waiting environment at the bus stop, the ability to get a seat on the bus, the overall travel time, the reliability of the service, passengers’ perceptions of the safety and security of the trip, and the cost of the trip relative to other choices. Assuming transit is an option for a trip, these factors help influence whether one would choose to use it.
Research The background for much of the research work done on quality of service has been customer satisfaction surveys conducted by individual agencies and research organizations. The most recently reported of these, conducted for a federal research project, asked transit riders in Broward County, Florida; Northern Virginia; and Portland, Oregon to list up to five factors that influenced their overall rating of satisfaction with their transit trip. The factors that were consistently mentioned across these three regions (and which are also consistent with previously reported survey

FDOT TQoS Applications Guide – Pilot Workshop Draft September 4, 2007
FDOT Public Transit Office 8
results) were service frequency, reliability, wait time during the trip, having service close to one’s home, having service close to one’s destination, and service span.1 Research on how ridership changes in response to service changes also provides insights into factors that matter to customers. For example, the relationships between improvements in service frequency and ridership are well‐documented.2 There are also documented relationships between service span and ridership, and between travel time and ridership. A third source of information about transit quality of service factors, and the relative importance of these factors, are studies that identify the value (either a monetary or time value) that customers place on different service attributes. For example, there have been British studies on the value passengers place on having a seat on a train, compared to having to stand under crowded conditions, and on the value provided by bus stop amenities such as shelters and benches.3 The national reference on transit quality of service matters is TCRP Report 100, Transit Capacity and Quality of Service Manual, 2nd Edition (TCQSM). This document identifies six measures of quality of service for fixed‐route transit that (1) are important to passengers and (2) can be readily quantified by transit agencies. As shown in Table 1 below, three of these measures relate to service availability, while the other three relate to comfort and convenience:
Table 1- TCQSM Fixed-Route Transit Quality of Service Framework
Transit Stop Route Segment System
Availability Frequency Hours of Service Service Coverage Comfort &
Convenience Passenger Load Reliability Transit-Auto Travel Time
The TCQSM provides a similar set of five measures for demand‐responsive transit, as shown in Table 2:
1 Dowling Associates, et al., NCHRP 3-70 Task 3a Working Paper: Recommended Transit Model, December 2006. 2 See, for example, John Evans, et al., TCRP Report 95, Chapter 9: Transit Scheduling and Frequency, 2004. 3 Balcombe, R. (editor), “The demand for transport: a practical guide,” Report TRL593, TRL Limited, Wokingham, United Kingdom, 2004.

FDOT TQoS Applications Guide – Pilot Workshop Draft September 4, 2007
FDOT Public Transit Office 9
Table 2- TCQSM Demand-Responsive Transit Quality of Service Framework
Service Measures
Availability Response Time Service Span Comfort &
Convenience On-Time Performance Trips Not Served DRT-Auto Travel Time
Source: TCQSM, 2nd Edition The TCQSM describes quality of service using the concept of levels of service. For a given quality of service measure, ranges of values of that measure are assigned level of service (LOS) letters ranging from LOS A (best, from the passenger perspective) to LOS F (worst, from the passenger perspective).4 For an example of how this system works, consider how people typically choose to sit on a bus: at first, people traveling by themselves will usually choose an empty row of seats to sit in. As the bus fills up, people will eventually need to sit next to someone else, but will have a choice of whom to sit next to, which gradually goes away as all the seats fill. Once all the seats are filled, one will need to stand, but one can often find a convenient place to stand and will have the opportunity to get a seat if someone else exits the bus. As the standing room fills up, one gets less and less personal space and gets jostled more at stops when exiting passengers try to make their way to one of the doors. Finally, the bus may get completely full and have to pass up passengers. Each of these situations is progressively worse from a passenger point‐of‐view and can be assigned a level of service. It’s important to note that from an agency point of view, a full bus can be good to have, as it represents an efficient use of resources. The challenge is finding the proper balance between service that is both attractive to passengers and is cost‐effective to operate. The levels of service should not be perceived as grades in the sense that A’s and B’s are always the levels of service an agency should be striving to obtain (although LOS F always represents an undesirable condition). Instead, the levels of service should be used as tools to help describe how passengers would likely perceive current or future conditions, and to help agencies evaluate how much of their service falls below, or is close to falling below, their operating standard. The TCQSM uses a LOS system in large part for compatibility with the Highway Capacity Manual’s LOS system for the automobile mode. Jurisdictions across the United States use auto LOS to help plan roadway facilities and to justify the need for roadway improvements. The intent is for the TCQSM to obtain a similar stature and use over time, so that transit agencies can use transit LOS results to help justify the need for transit service improvements. Florida has also developed bicycle and pedestrian LOS measures to provide a complete package of tools for multimodal planning, allowing
4 Demand-responsive transit uses a LOS 1 to LOS 8 scale, but is similar otherwise.

FDOT TQoS Applications Guide – Pilot Workshop Draft September 4, 2007
FDOT Public Transit Office 10
planners to assess the impacts of one mode on the others, or the impact of a particular transportation improvement on all modes. Examples of how agencies have applied the TCQSM to different projects are provided later in this guidebook.
Keys to Successful Applications Measuring quality of service by itself without a specific application in mind accomplishes little. Typically, quality of service is assessed in one of two ways. The first way is to compare existing or future LOS to a standard established by the agency, to evaluate how much service meets, doesn’t meet, and/or is close to not meeting the standard. The second way is to comparing the LOS results of a set of alternatives to each other, to assess the relative differences in service quality among the alternatives. Although either of these types of analysis could be performed without using levels of service to report the results, the LOS ranges help in the presentation of the results to others. The LOS system takes a range of values for a given measure (for example, passenger load) and simplifies them to six or eight categories, which helps in preparing maps, tables, and graphs of results. The system also helps interpret whether a difference in values represents a meaningful difference in service quality from the passenger’s perspective. For example, passenger loads of 20 and 25 people on a standard bus both indicate that a person will probably have to sit next to someone else, but will also have a good selection of seats to choose from. As a result, both loads equate to LOS B, indicating no meaningful difference in service quality exists between the two scenarios, from the passenger perspective. Chapter 3 of this guidebook describes how the TCQSM’s level of service measures can be applied to a variety of common transit and transportation planning activities.
FDOT TQoS Applications Guide – Pilot Workshop Draft September 4, 2007
FDOT Public Transit Office 11
Chapter 3 - LOS MEASURE APPLICATIONS
3.1 Fixed-Route Transit LOS Measure Overview
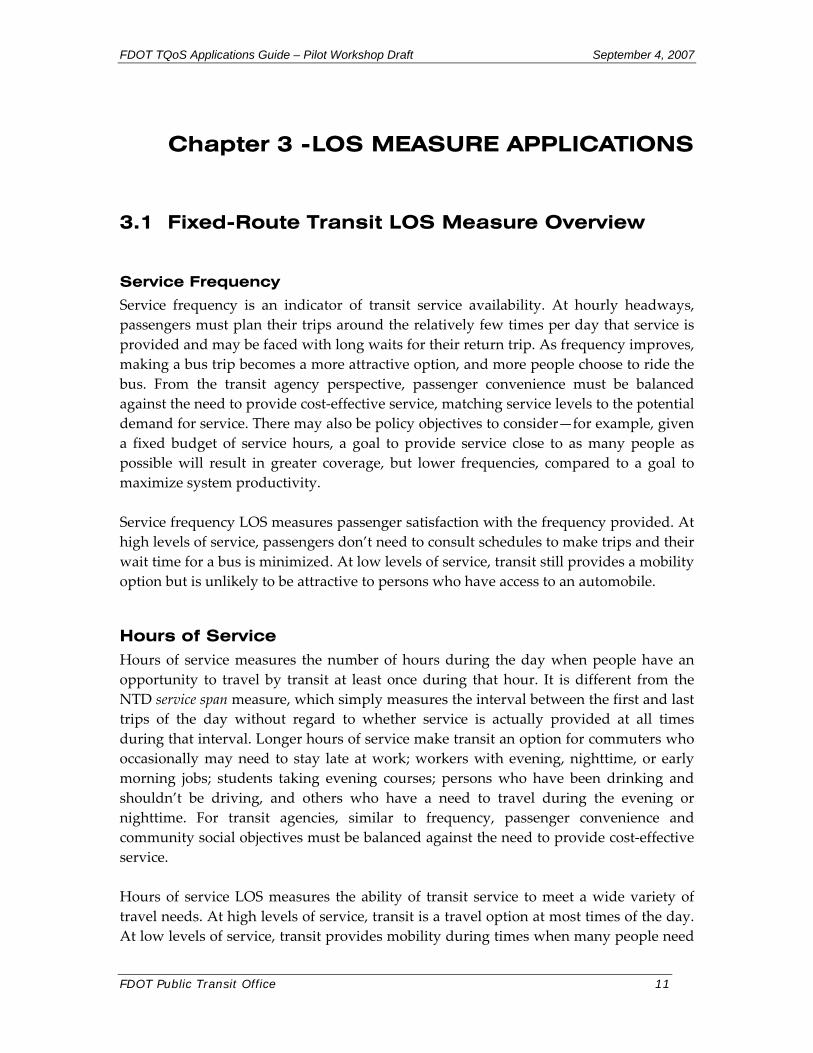
Service Frequency
Service frequency is an indicator of transit service availability. At hourly headways, passengers must plan their trips around the relatively few times per day that service is provided and may be faced with long waits for their return trip. As frequency improves, making a bus trip becomes a more attractive option, and more people choose to ride the bus. From the transit agency perspective, passenger convenience must be balanced against the need to provide cost‐effective service, matching service levels to the potential demand for service. There may also be policy objectives to consider—for example, given a fixed budget of service hours, a goal to provide service close to as many people as possible will result in greater coverage, but lower frequencies, compared to a goal to maximize system productivity. Service frequency LOS measures passenger satisfaction with the frequency provided. At high levels of service, passengers don’t need to consult schedules to make trips and their wait time for a bus is minimized. At low levels of service, transit still provides a mobility option but is unlikely to be attractive to persons who have access to an automobile.
Hours of Service Hours of service measures the number of hours during the day when people have an opportunity to travel by transit at least once during that hour. It is different from the NTD service span measure, which simply measures the interval between the first and last trips of the day without regard to whether service is actually provided at all times during that interval. Longer hours of service make transit an option for commuters who occasionally may need to stay late at work; workers with evening, nighttime, or early morning jobs; students taking evening courses; persons who have been drinking and shouldn’t be driving, and others who have a need to travel during the evening or nighttime. For transit agencies, similar to frequency, passenger convenience and community social objectives must be balanced against the need to provide cost‐effective service. Hours of service LOS measures the ability of transit service to meet a wide variety of travel needs. At high levels of service, transit is a travel option at most times of the day. At low levels of service, transit provides mobility during times when many people need
FDOT TQoS Applications Guide – Pilot Workshop Draft September 4, 2007
FDOT Public Transit Office 12
to travel, but focuses on serving only one or two types of trips (e.g., traditional commute trips).
Service Coverage The roadway network provides near‐universal access to locations. In comparison, transit service is only available to areas located close to transit stops and stations. Although the automobile and bicycle modes can be access options under certain circumstances, most people access transit service by walking, and nearly all passengers must walk once transit delivers them to the vicinity of their destination. Because it is unproductive to provide transit service to low‐density areas, service coverage LOS measures how much of the area capable of supporting at least hourly daytime service is actually served by transit. Higher LOS levels indicate a greater variety of origins and destinations that potential passengers can travel between. Service coverage LOS focuses on the area within walking distance of transit stops (up to ¼ mile for local bus routes and up to ½ mile for BRT and rail routes). Optionally, users can adjust the area served by a stop or station to reflect the level of street connectivity in the surrounding neighborhood, and to reflect street‐crossing difficulty.
Passenger Loads Passenger loading is a measure of passenger comfort. Similar to many of the other measures, a balance must be struck between the passengers’ desire to have a seat and the transit agency’s desire to provide productive service. Frequently, transit agencies strike this balance by accepting higher loads during peak periods compared to off‐peak periods, and by differentiating loading standards among different service types. Higher LOS levels indicate that passengers are able to find a seat, while lower LOS levels indicate the relative levels of crowding that standees experience. When mapped, passenger load LOS can be used to depict the length of a route that experiences standing loads, which is an indicator of how long persons must stand.
Reliability The TCQSM provides two measures of reliability: on‐time performance and headway adherence. On‐time performance reflects one’s chances of getting to one’s destination within 5 minutes of the scheduled time and the amount of extra time one must allow to be reasonably sure of getting to one’s destination on time. Headway adherence is a measure of the “bus bunching” phenomenon and an indicator of the extra amount of time, on average, that passengers must wait at a bus stop. Very high reliability LOS levels are difficult for buses to achieve without a high level of priority (e.g., bus lanes), but low LOS levels are an indication of underlying problems—for example, traffic congestion, scheduling, or route supervision—that should be addressed.
FDOT TQoS Applications Guide – Pilot Workshop Draft September 4, 2007
FDOT Public Transit Office 13
Transit-Auto Travel Time Transit‐auto travel time is one measure of the competitiveness of transit with the automobile for a given trip. The longer a trip takes by transit, the less attractive transit is as an option for that trip. Achieving LOS A (transit is faster than the automobile for a given trip) requires rapid service operating in its own right‐of‐way. Where a given route falls within the other possible LOS grades is a function of both service design (particularly stop spacing, route directness, overall route connectivity, and transfer times) and traffic conditions.
3.2 Fixed-Route Transit LOL Measure Applications
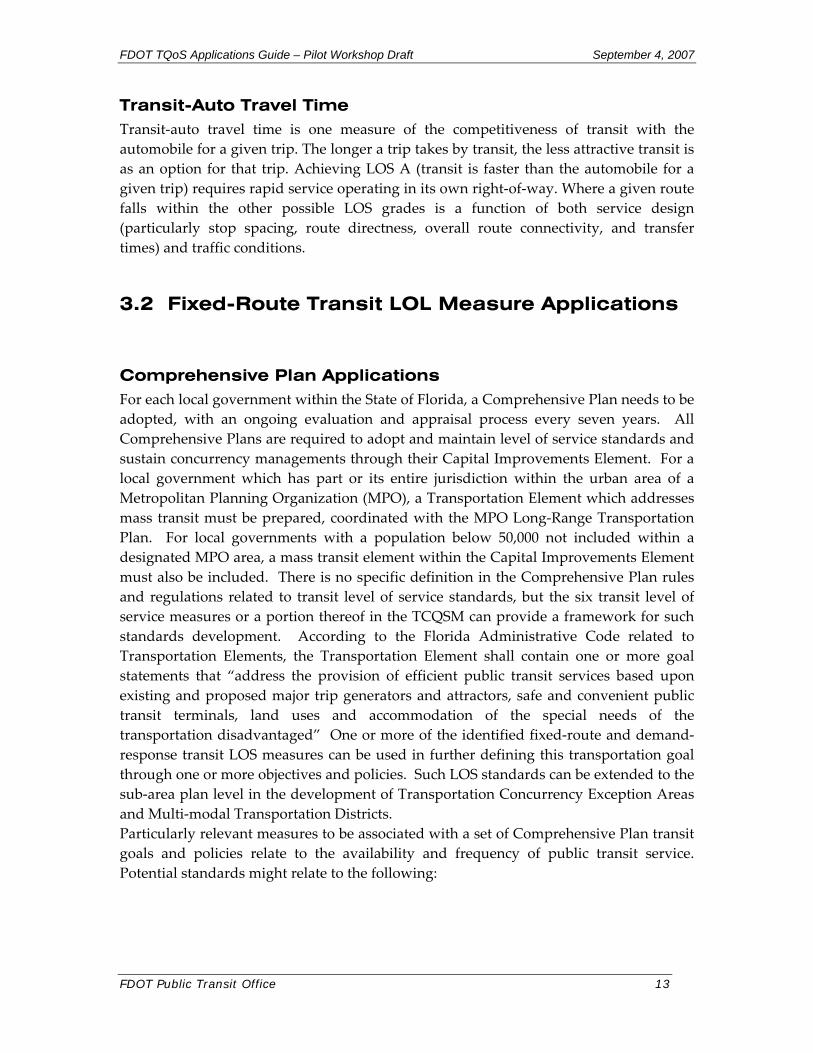
Comprehensive Plan Applications For each local government within the State of Florida, a Comprehensive Plan needs to be adopted, with an ongoing evaluation and appraisal process every seven years. All Comprehensive Plans are required to adopt and maintain level of service standards and sustain concurrency managements through their Capital Improvements Element. For a local government which has part or its entire jurisdiction within the urban area of a Metropolitan Planning Organization (MPO), a Transportation Element which addresses mass transit must be prepared, coordinated with the MPO Long‐Range Transportation Plan. For local governments with a population below 50,000 not included within a designated MPO area, a mass transit element within the Capital Improvements Element must also be included. There is no specific definition in the Comprehensive Plan rules and regulations related to transit level of service standards, but the six transit level of service measures or a portion thereof in the TCQSM can provide a framework for such standards development. According to the Florida Administrative Code related to Transportation Elements, the Transportation Element shall contain one or more goal statements that “address the provision of efficient public transit services based upon existing and proposed major trip generators and attractors, safe and convenient public transit terminals, land uses and accommodation of the special needs of the transportation disadvantaged” One or more of the identified fixed‐route and demand‐response transit LOS measures can be used in further defining this transportation goal through one or more objectives and policies. Such LOS standards can be extended to the sub‐area plan level in the development of Transportation Concurrency Exception Areas and Multi‐modal Transportation Districts. Particularly relevant measures to be associated with a set of Comprehensive Plan transit goals and policies relate to the availability and frequency of public transit service. Potential standards might relate to the following:

FDOT TQoS Applications Guide – Pilot Workshop Draft September 4, 2007
FDOT Public Transit Office 14
• Service Frequency: Minimum service frequency for trunk vs. local transit routes • Span of Service: Minimum span of service for trunk vs. local transit routes • Service Coverage: % of transit‐supportive population within walking distance of
transit service with a minimum hourly headway
For Comprehensive Plans, such transit level of service standards would be applied to projected future land use patterns and densities. The standards have implications on required added transit services and facilities which can be incorporated into transportation system alternatives analysis and eventual transportation plan and program development.
Long-Range Transportation Plan Applications LRTPs focus on collector and arterial streets and city/region‐wide travel. The projects identified within a LRTP historically have related more to public works and DOT responsibilities than to transit needs, but the growing awareness of (and requirements for) multimodal considerations are increasing the degree to which transit is addressed within these plans. LRTPs have a broad community point‐of‐view, with transit being addressed in a more generalized way (e.g., the need for service in a particular neighborhood may be identified, but not the particular route). Activity Center Analysis An activity center analysis measures the quality of service between key locations within the study area. Rather than try to assess the quality of every potential trip a person might take, this type of analysis evaluates a representative cross‐section of trips. Potential applications include:
• Evaluating existing conditions, identifying pairs of locations with travel demands that may be underserved by transit; • Demonstrating the benefit of transit investments being evaluated for a particular future alternative; and • Comparing the service provided to the minimum level of service set by policy for routes connecting different land use types.
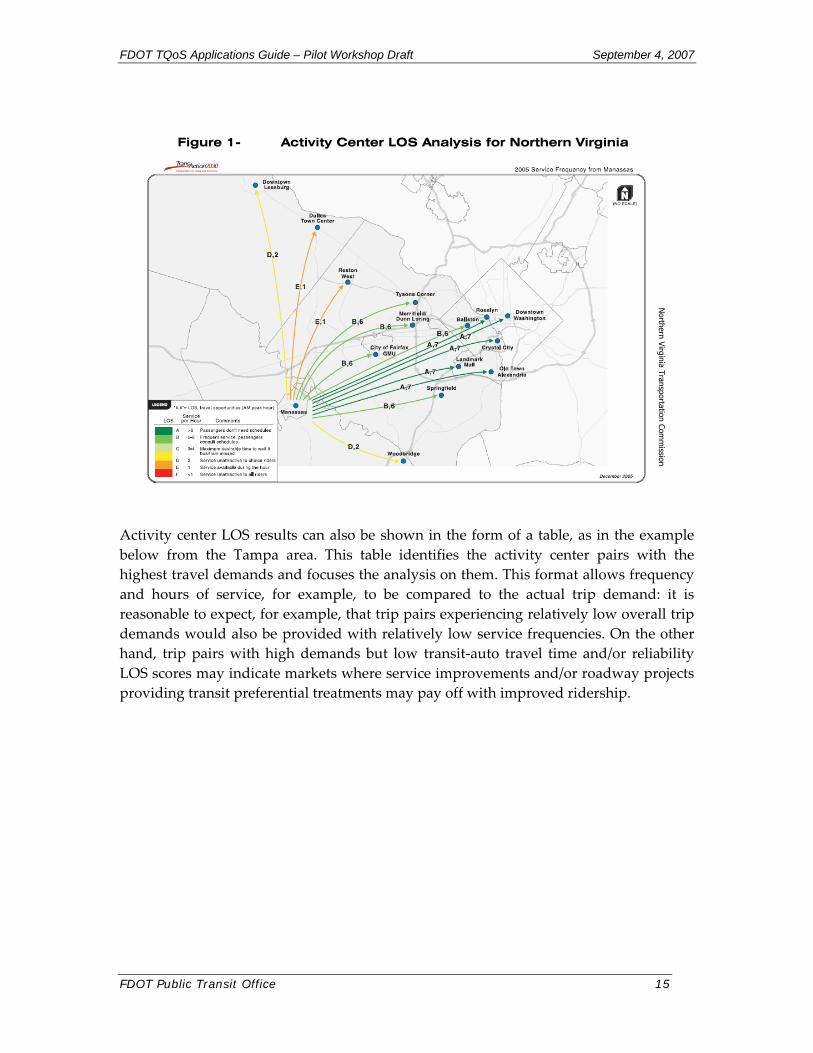
The measures typically evaluated as part of an activity center analysis are frequency, hours of service, and transit‐auto travel time. However, if the data were available, passenger loads and reliability could also be evaluated. The figure below, from TransAction 2030, the Northern Virginia Long‐Range Transportation Plan, depicts weekday a.m. peak hour transit service frequency and LOS from Manassas to other activity centers within the plan’s study area.
FDOT TQoS Applications Guide – Pilot Workshop Draft September 4, 2007
FDOT Public Transit Office 15
Figure 1- Activity Center LOS Analysis for Northern Virginia
Activity center LOS results can also be shown in the form of a table, as in the example below from the Tampa area. This table identifies the activity center pairs with the highest travel demands and focuses the analysis on them. This format allows frequency and hours of service, for example, to be compared to the actual trip demand: it is reasonable to expect, for example, that trip pairs experiencing relatively low overall trip demands would also be provided with relatively low service frequencies. On the other hand, trip pairs with high demands but low transit‐auto travel time and/or reliability LOS scores may indicate markets where service improvements and/or roadway projects providing transit preferential treatments may pay off with improved ridership.
Northern Virginia Transportation Com
mission

FDOT TQoS Applications Guide – Pilot Workshop Draft September 4, 2007
FDOT Public Transit Office 16
Table 3- Activity Center Based LOS Analysis for Tampa Area
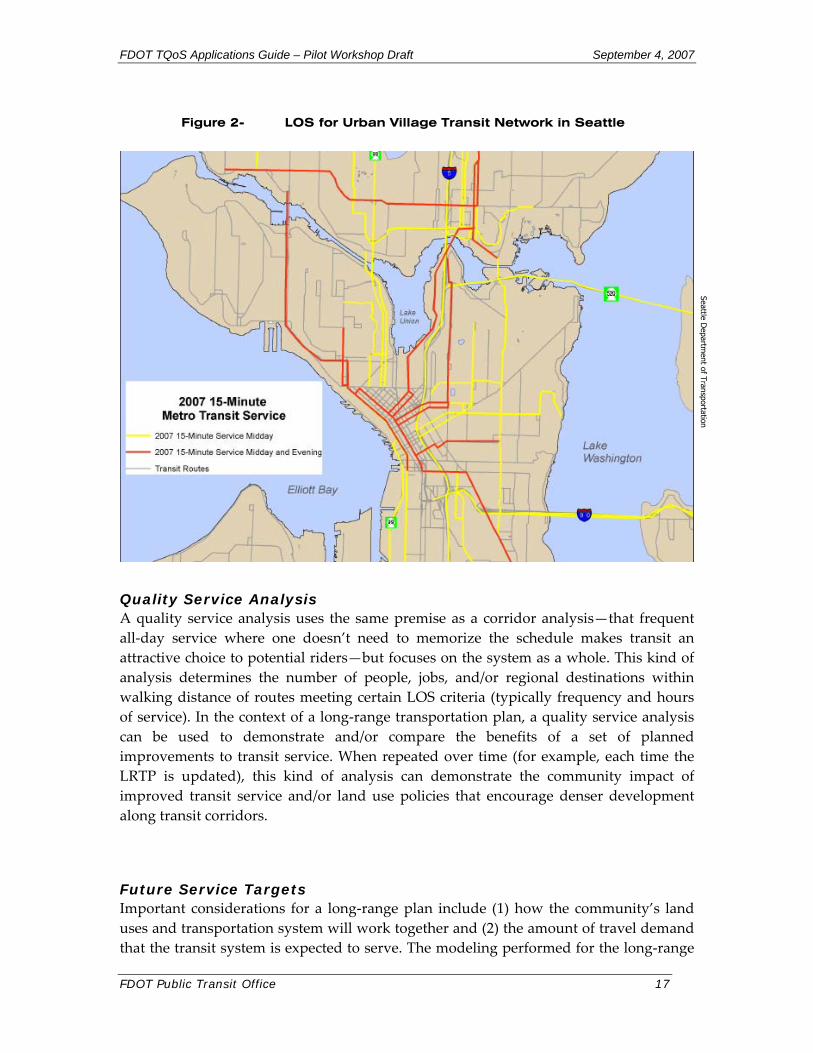
Source: TCQSM, 2nd Edition Corridor Analysis Some jurisdictions identify transit streets or transit corridors as part of their roadway functional classification system. These streets typically are slated to have frequent all‐day service (e.g., service every 15 minutes or better during midday hours). Given the concentration of bus service on these streets, it is important that buses operate reliably and quickly for the service to achieve its full ridership potential and minimize its operating costs (slower, less reliable routes require more buses to operate for a given headway and route length). The reliability and transit‐auto travel time LOS measures can be used to identify corridors where bus‐focused roadway improvements may make transit more competitive with the automobile, or avoid the need to add buses to maintain headways, allowing that bus to be allocated elsewhere in the area. Passenger load LOS in a corridor can also be used to identify the need to add service in the future, if buses would routinely be overcrowded. The figure below depicts the “urban village transit network” for Seattle, streets on which 15‐minute or better all‐day headways are provided.
Hillsborough M
PO
FDOT TQoS Applications Guide – Pilot Workshop Draft September 4, 2007
FDOT Public Transit Office 17
Figure 2- LOS for Urban Village Transit Network in Seattle
Quality Service Analysis A quality service analysis uses the same premise as a corridor analysis—that frequent all‐day service where one doesn’t need to memorize the schedule makes transit an attractive choice to potential riders—but focuses on the system as a whole. This kind of analysis determines the number of people, jobs, and/or regional destinations within walking distance of routes meeting certain LOS criteria (typically frequency and hours of service). In the context of a long‐range transportation plan, a quality service analysis can be used to demonstrate and/or compare the benefits of a set of planned improvements to transit service. When repeated over time (for example, each time the LRTP is updated), this kind of analysis can demonstrate the community impact of improved transit service and/or land use policies that encourage denser development along transit corridors. Future Service Targets Important considerations for a long‐range plan include (1) how the community’s land uses and transportation system will work together and (2) the amount of travel demand that the transit system is expected to serve. The modeling performed for the long‐range
Seattle Departm
ent of Transportation

FDOT TQoS Applications Guide – Pilot Workshop Draft September 4, 2007
FDOT Public Transit Office 18
plan identifies the future high‐demand travel corridors, nodes of activity, and overall travel activity. Based on a realistic estimate of transit’s long‐term mode share, daily and peak‐period passenger demands can be forecast for a corridor, the required bus frequency LOS to meet those demands based on a given passenger loading LOS standard can be determined, and finally, the resulting operating and capital costs can be calculated. The regional public transportation system for Portland, Oregon shown below is the result of such as a process. Streets shown with “frequent bus” or “rapid bus” service are slated to have 15‐minute or better bus service in the future, if they don’t already.
Figure 3- Portland, OR Regional Public Transportation Plan
Service Coverage Analysis—Area wide The service coverage LOS measure identifies which areas in a city or region are capable of supporting at least hourly transit service, and measures the proportion of those areas actually served by transit. It is a useful tool for identifying potential unserved transit markets, as shown in the first example below: the dot pattern indicates “transit‐supportive” areas, while areas shaded red indicate areas served by transit—dotted areas lying outside the red shading represent potential unserved transit markets. When
Metro (Portland, O
R)

FDOT TQoS Applications Guide – Pilot Workshop Draft September 4, 2007
FDOT Public Transit Office 19
supplemented with demographic information, this kind of analysis can also be used to identify potentially underserved neighborhoods—that is, areas that currently receive some transit service, but are capable of supporting additional service.
Figure 4- Transit Service Coverage Assessment for Tualatin, OR
Service coverage maps can also be combined with hours of service maps, as shown in the following example from Tallahassee. This map shows at a glance where transit is planned to be provided in the future, and at what level of service.
City of Tualatin, OR

FDOT TQoS Applications Guide – Pilot Workshop Draft September 4, 2007
FDOT Public Transit Office 20
Figure 5- Cost Feasible Transit Plan for Tallahassee Area
Service Coverage Analysis—Corridors The “detailed methodology” for the service coverage LOS measure provides a number of adjustment factors that reduce the assumed service coverage area based on the difficulty of crossing the street with transit service, the connectivity of the street network within a neighborhood, and the age characteristics of neighborhood residents. By comparing the ideal service coverage area produced by the “planning methodology” (i.e., a ¼‐mile radius around a bus stop) to the reduced service coverage area resulting from the application of these adjustment factors, one can identify areas where pedestrian‐focused improvements may result in increased transit ridership.
Tallahassee-Leon County Planning Departm
ent

FDOT TQoS Applications Guide – Pilot Workshop Draft September 4, 2007
FDOT Public Transit Office 21
#S
#S#S #S #S#S
#S #S#S#S #S
#S#S
#S
#S
#S#S
#S#S #S #S #S #S #S #S
#S
#S
SPRING GLEN RD
KENNERLY RD
BA R
NES
RD
BARNES RD S
SPRING
PARK R
D
UNIV
ERSI
TY B
LVD
W
SPRING PARK RD
PAR
ENTA
L H
OM
E R
D
0.25 0 0.25 0.5 Miles
Studies have shown that approximately 85% of bus riders walk ¼ mile or less (equivalent to approximately 5 minutes) to a bus stop. Although pedestrians expect some delay when crossing streets, pedestrians who experience especially long delays, (particularly if they have to stand next to a busy street in the hot sun or a downpour while they wait), will be less inclined to walk to a bus stop and, thus, use transit. Usually, when bus service is provided along an arterial street, one needs to cross the street during one’s trip coming or going. The “street crossing difficulty” factor used for service coverage LOS measures the barrier effect of wide, busy streets. Locations with particularly high crossing difficulties can be targeted in the LRTP for pedestrian crossing improvements. Land use patterns also impact one’s ability to access transit. If bus service is provided along an arterial street, but the area’s surrounding street network provides few opportunities to walk out to the street, many residences located in the neighborhoods adjacent to the arterial may be within ¼ mile of service “as the crow flies,” but actual walking distances to a bus stop will be considerably longer. The “street connectivity factor” used for service coverage LOS reflects the reduced service coverage area resulting from poor street connectivity. In an LRTP process, this factor can be used to demonstrate the differences in transit service coverage that would result if development standards required more frequent pedestrian connections. Figure 6 shows a portion of Jacksonville visually depicts the reduction in service coverage caused by poor street connectivity and challenges in crossing the street:
Figure 6- Service Coverage In Relation to Pedestrian System Connectivity in Jacksonville
TCRP R
eport 100: TCQSM
2nd Edition

FDOT TQoS Applications Guide – Pilot Workshop Draft September 4, 2007
FDOT Public Transit Office 22
Statewide Transportation Planning Applications Mobility Performance Measures FDOT’s statewide Mobility Performance Measures program uses several of the transit LOS measures to report the transit component of statewide mobility, although the actual measure values are reported, rather than the levels of service themselves. Individual agency results are aggregated into groups representing three or four different population ranges for this work. The measures included in the program are the following:
• Peak frequency (derived from National Transit Database data), a measure of modal service quality;
• Service span (derived from National Transit Database data), a measure of modal service quality;
• Service coverage, a measure of modal accessibility; • Percent travel heavily crowded (% of passenger miles traveled at LOS D
or worse for crowding), a measure of modal utilization. FDOT uses these measures to track mobility trends from year‐to‐year and could use these measures to help justify the need for future transit investments and/or to measure the impacts of prior transit investments or disinvestments. Service Coverage—Corridor Focus Arterial streets in Florida’s urban areas are frequently state highways. These streets typically carry high volumes of traffic and often have fairly wide cross‐sections and, as a result, frequently pose barriers to pedestrian access to transit service. The “pedestrian crossing factor” component of the service coverage LOS measure can be used to measure the barrier effect of wide, busy streets and to evaluate the benefit of alternative treatments to improve pedestrian crossings.
Comprehensive Operational Analysis Applications Comprehensive operational analyses provide a detail, route‐by‐route evaluation of existing service, as well as an evaluation of system‐wide operations. They are often conducted in conjunction with, or immediately prior to, a Transit Development Plan update. Transit LOS measures can be incorporated into a COA process in several ways: to describe the results of portions of the analysis in terms of what passengers experience, to compare the results to established standards, and to compare changes in results from the previous analysis. Passenger Loads Passenger loading at a route’s maximum load point can be expressed in terms of a level of service—for example, LOS D indicates that some passengers must stand, but the bus as a whole is not overcrowded. This not only expresses results from the passenger point‐of‐view, but aids in the presentation of results—a graph showing the percentage of trips

FDOT TQoS Applications Guide – Pilot Workshop Draft September 4, 2007
FDOT Public Transit Office 23
with a particular passenger load LOS grade, for example, helps to visually and simply depicts the current state of the system. Relatively high levels of service at the maximum load point may, for instance, depending on the context, indicate an underperforming route or a route with sufficient capacity to absorb the future growth anticipated within its service area. Poor levels of service at the maximum load point indicate overcrowding and the potential need to add service which, in turn, will likely generate additional ridership. Reliability The comments provided in the LOS tables for on‐time performance and headway adherence help explain numerical results in terms a layman can understand:
Table 4- Service Reliability LOS Definitions from TCQSM, 2nd Edition
LOS On-Time Percentage Comments* A 95.0-100.0% 1 late transit vehicle every 2 weeks (no transfer)B 90.0-94.9% 1 late transit vehicle every week (no transfer) C 85.0-89.9% 3 late transit vehicles every 2 weeks (no
transfer) D 80.0-84.9% 2 late transit vehicles every week (no transfer) E 75.0-79.9% 1 late transit vehicle every day (with a transfer) F <75.0% 1 late transit vehicle at least daily (with a
transfer) Table 5-
LOS cvh P (hi > 0.5 h)
Comments
A 0.00-0.21 ≤2% Service provided like clockwork B 0.22-0.30 ≤10% Vehicles slightly off headway C 0.31-0.39 ≤20% Vehicles often off headway D 0.40-0.52 ≤33% Irregular headways, with some bunchingE 0.53-0.74 ≤50% Frequent bunching F ≥0.75 >50% Most vehicles bunched
For systems with buses equipped with GPS units capable of storing data, measuring reliability LOS at several points along a route over a period of time can help identify causes of unreliability. Poor LOS leaving the start of a route may indicate insufficient schedule recovery time or the need for better driver supervision. A drop in on‐time performance LOS between two timepoints along the route may suggest the need to review the schedule, while a drop in either measure between timepoints may suggest the need to investigate transit preferential treatments in that section of the route to improve reliability. Service Coverage Service coverage LOS can be used as one measure to evaluate whether potential transit markets are being served; agencies will typically also want to look at broader set of measures, such as the number of zero‐car households served, the percentage of lower‐
FDOT TQoS Applications Guide – Pilot Workshop Draft September 4, 2007
FDOT Public Transit Office 24
income areas served, and the percentage of areas with significant proportions of seniors and/or youths. Environmental Justice LOS measures can be used to help evaluate whether the service provided to lower‐income and minority areas is being provided equitably. Service frequency, service span, service coverage, passenger load, and reliability LOS are all applicable to this type of evaluation—similar LOS grades indicate similar service quality, when comparing two areas.
Transit Development Plans TDPs are six‐year plans that set out an agency’s near‐term service strategy. Transit LOS measures can be used both in the development of these plans and in communicating the intended outcomes of these plans to decision‐makers and the general public. Mapping Several LOS measures lend themselves to mapping on a route‐by‐route or street‐by‐street basis: frequency, hours of service, loading, and reliability. Maps can depict the extent of potential service issues (e.g., the extent of crowded service) as well as illustrate planned service outcomes (e.g., the extent of frequent transit service at the end of the six‐year planning period). The LOS categories help to group routes on the basis of similar service quality, which helps the reader better comprehend the information being presented. Prioritization of Improvements The loading LOS measure can be used by itself, or in combination with other measures (e.g., the length of time a certain LOS condition occurs) to help prioritize service improvements. The reliability and transit‐auto travel time LOS measures can be used the same way. Existing and Future Service Comparisons The frequency, hours of service, and loading LOS measures can be used to compare existing service conditions to those forecast at the end of the planning period, by route and/or number of riders (e.g., 20% of routes and 45% of passengers are forecast to experience frequency LOS C or better conditions by the end of the planning period). Service Equity Comparisons County‐wide agencies that receive financial support from different communities within the county may face questions about whether communities are receiving an equitable amount of service in return. The hours of service and service coverage LOS measures are well‐suited for answering these kinds of questions.
FDOT TQoS Applications Guide – Pilot Workshop Draft September 4, 2007
FDOT Public Transit Office 25
Environmental Justice Comparisons Agencies may also need to demonstrate that service to low‐income and minority‐based communities is being provided equitably. The frequency and hours of service LOS measures address the supply of service, and service coverage LOS may also be useful in this regard. Passenger load LOS can be used to address relative levels of overcrowding. Peer Reviews The development of a TDP often involves a comparison of existing service with that provided by peer agencies. This comparison often involves National Transit Database measure, in part because of their standardization and the ease of obtaining peer data. Average peak period headway (i.e., frequency LOS) and maximum service span can both be derived at a system level from NTD data. However, several other quality of service measures can also be relatively easily compared, using data available from public timetables, GIS databases, and/or information routinely collected by transit agencies. Frequency and hours of service information is readily available on a route‐by‐route basis and can be compared in terms of the percentage of routes operating at or above a given LOS (e.g., the LOS corresponding to the standard of the agency preparing the TDP). Passenger load and reliability LOS could be compared at a system or route level, depending on whether the peer agencies routinely collected and summarized this information, and the level of detail the peers used to report this information. Finally, service coverage LOS can be readily compared between agencies when GIS data for each agencies’ route structure is available. (Population and employment data can be obtained from the Census Bureau). Service Expansion The service coverage LOS measure can be used to portions of the service area that are currently underserved by transit. The transit‐auto transit LOS measure can be used to help identify and prioritize origin‐destination patterns that could use more direct transit connections.
Service Planning Service Monitoring One function of service planning is to monitor existing service and to make adjustments as needed when service falls outside the service. Two areas that agencies commonly monitor are passenger loads and service reliability, both of which have corresponding LOS measures. These measures can be used to group routes by performance, which can help in presenting results to decision‐makers. For example, if loading was measured at the maximum load point, routes in the LOS E and F range might be considered to be overcrowded and potential targets for added service, routes in the LOS C and D range might be considered acceptably loaded, routes in the LOS B range might be considered at risk of having insufficient passenger loads and targeted for follow‐up, and routes in the LOS A range might be considered unproductive. Similarly, routes could be

FDOT TQoS Applications Guide – Pilot Workshop Draft September 4, 2007
FDOT Public Transit Office 26
categorized by on‐time performance LOS and prioritized for remedial efforts on that basis. Service Development As communities or regions grow, so may the need for service. The service coverage LOS measure can be used to help identify new developments that will have sufficient density at build‐out to support transit service. The transit‐auto transit LOS measure can be used to help identify and prioritize origin‐destination patterns that may require more direct transit connections.
Corridor Master Plans/PD&E Studies Scoping of Transit Improvements In roadway corridor studies involving the preparation of a master plan or PD&E assessment, transit service frequency could have an impact on traffic operations if short frequencies and multiple services are provided. Service frequency should be considered when addressing the feasibility of instituting transit preferential treatment associated with roadway improvements, such as signal priority, 2queue jumps, exclusive transit lanes and curb extensions. Very frequent transit service provides an added warrant for transit preferential treatment, yet could impact general traffic operations. Corridor studies could also set goals as to a minimum desired level of transit service on a weekday and weekend. As for service frequency, goals for a minimum level of operating hours per day for new or improved fixed‐route transit service in a roadway corridor could be established associated with designated roadway improvements, in either an urban or rural area.
Service Coverage Considerations Service coverage for transit can be a useful assessment in roadway corridor studies in identifying the population and employment within walking distance of transit, and hence one indicator of potential transit demand associated with transit improvements in a corridor. A service coverage assessment can also identify the impact of alternate transit stop location and pedestrian facility connectivity improvements within the corridor on transit accessibility. In corridor planning, a transit passenger loading LOS standard can be applied in identifying a required service frequency to serve estimated passenger demand. This is useful in identifying total corridor person throughput, and estimation of transit mode share of trips along a corridor.
FDOT TQoS Applications Guide – Pilot Workshop Draft September 4, 2007
FDOT Public Transit Office 27
Transit Performance/Preferential Treatment Assessment Maintaining on‐time performance is the most widely applied criterion related to implementing conditional transit signal priority in a corridor (only issue a priority call if the transit vehicle is behind schedule). Alternately, if headway‐based scheduling is applied, signal priority can be implemented to maintain regularity in headways. In assessing the need for signal priority at a corridor or system level, a certain on‐time performance or headway adherence LOS standard can be applied to identify when signal priority would be appropriate. This would require either through Automatic Vehicle Location (AVL) data or field surveys identifying the on‐time percentage or standard deviation of headway (for headway adherence) of existing transit service in the corridor. Existing and projected transit travel time relative to auto travel time in a corridor is an important criterion in identifying the need for transit preferential treatments associated with roadway improvements along the corridor. In corridor planning, this measure relates to a door‐to‐door travel time between one or more origins and destinations within the corridor, and can be identified either using the regional travel forecasting model or through field survey. A model is typically applied where an exclusive transit guideway is being evaluated.
Premium Transit Alternatives Analysis Estimating Ridership and Service Levels When assessing premium transit feasibility and configuration in a corridor, the service frequency is a very important component of the service concept. High frequency service is a characteristic of premium transit service, whether bus or rail. In the new formal Alternatives Analysis procedures for Very Small Starts projects for the Federal Transit Administration, FTA requires a certain minimum service frequency (10 minutes during peak periods, and 15 minutes during off‐peak periods) to be eligible for federal capital funding. Transit passenger demand in a premium transit service corridor will be reflective of the type of transit mode, the frequency of service, and other attractiveness factors associated with a particular mode. Service frequency is a variable related to transit demand modeling applicable to larger projects, and when applying elasticity factors to assess the impact of smaller transit service and/or facility improvements. The service frequency will also have a direct impact on the number of transit vehicles required to provide the new or improved service, associated with a passenger loading standard. Premium transit services are typically associated with longer day operation, and thus hours of service is an important consideration in service specification. FTA in its new

FDOT TQoS Applications Guide – Pilot Workshop Draft September 4, 2007
FDOT Public Transit Office 28
Very Small Starts eligibility procedures requires that the premium service being considered be provided at least 14 hours per day (LOS “C”). Location of Transit Stations For premium transit assessments, a service coverage assessment and LOS determination can help identify the most appropriate locations for transit stations to maximize walk‐in accessibility. Street connectivity and patterns within and adjacent to the premium transit corridor can be integrated into the service coverage assessment, in helping identifying the most appropriate station locations. In comparing the applicability of different premium transit modes within a corridor, the capacity of different systems is important, reflective of an assumed passenger load standard. Also vehicle passenger loads for an assumed design level of service are used in identifying the configuration and circulation elements of transit stations, particularly larger bus transit centers rail stations. Again the pedestrian level of service analysis procedures identified in the TCQSM can be applied. Selection of Transit Mode and Preferential Treatments Existing transit on‐time performance or headway adherence in a corridor can also be applied in identifying the need for premium transit service in the corridor, in particular a mode with enhanced preferential treatment to allow for more reliable travel time through the corridor. A level of service associated with on‐time performance or headway adherence of existing transit service in the corridor can be applied in helping identify the most appropriate transit mode with associated running way and any supplemental preferential treatment. In corridor transit alternatives analysis, relative transit to auto travel time can be identified related to different potential transit modes in aiding in a decision as to what is the most appropriate premium transit mode to develop in a corridor. This measure again relates to a door‐to‐door travel time between identified origins and destinations in the assessment.
3.3 Demand-Responsive Transit One of the most common uses of demand‐responsive service is to provide complementary transportation to fixed‐route service under the Americans with Disabilities Act. ADA service is considered a civil right and operates under federal requirements that specify minimum service levels, particularly for the times and locations of service and the need to provide sufficient capacity to meet demand. Understandably, then, service providers focus on ensuring that those minimum requirements are met, and the cost of providing ADA service frequently precludes them from exceeding those requirements. Nevertheless, the LOS measures are useful for

FDOT TQoS Applications Guide – Pilot Workshop Draft September 4, 2007
FDOT Public Transit Office 29
assessing ADA service from the passenger perspective, particularly those aspects not directly regulated. Other types of demand‐responsive service, whether designed for specific user groups or open to the general public, require the same types of planning and operations monitoring activities as fixed‐route service. LOS measures are applicable to these activities, as well. Response Time Demand‐responsive service, by definition, typically doesn’t have set schedules but is supplied based on customer demand. Some specialized services that are scheduled infrequently, such as one trip per week, are considered as demand‐responsive because they are typically a specific point‐to‐point service and customers must make arrangements to be picked up. Because of this difference, LOS is not measured by the time between scheduled vehicles (headway), but by the time in advance of pick‐up that a customer must request a trip, or response time. Response time is the minimum amount of time a user needs for scheduling and accessing a trip or the minimum advance reservation time. This measure is most appropriate where most of the trips are scheduled each time that the customer wants to travel. In other works, it is less appropriate where customers are picked up on pre‐scheduled days at a pre‐scheduled times and do not need to call in advance for each trip. Nevertheless, the measure could be used where subscription service is provided. For such DRT services, response time could be calculated for the situation when a trip request is first made. The fast response time is not always practical or even needed for some trips. For example, a shopper shuttle may be provided between a senior care facilities and local grocery store, once a week or a local shopping center once a month. Advance notice would be required to let the operator know that a stop should be made at that facility and to ensure adequate seating capacity of the vehicle. Service Span Service span measures the number of hours during the day and days per week that DRT service is available in a particular area. Unlike the similar measure for fixed‐route service that measures hours per day of service, the service span measure for DRT incorporates days of service in addition to hours per day. This is done because in some rural areas DRT service may only be provided selected days per week, or even selected days per month. Incorporation of both hours per day and days per week provides a more complete perspective on the amount of DRT service that is available within a community or larger area.

FDOT TQoS Applications Guide – Pilot Workshop Draft September 4, 2007
FDOT Public Transit Office 30
The following example from TriMet shows how one agency has developed standards for hours of service for both ADA and non‐ADA trips. Although expressed as numeric values for hours and days, they could also be expressed in LOS terms if the intended usage was to describe service in terms of convenience to passengers, or when conducting a peer review, for example. Reliability Reliability of DRT is a critical issue from the user’s perspective. Users will want to know: “Will there be a trip for me when I call, or will all the rides be taken?”, “Once I book my ride, will the vehicle arrive at the scheduled time?”, or “Will the driver get me to my destination before my appointment time, or will my trip be too long?” There are two components involved with measuring reliability for DRT: on‐time performance and trips not served.
Table 6- Hours of Service Standards for ADA vs. Non-ADA Trips – Portland, OR
There is no passenger load performance measure for DRT service. Because DRT services are pre‐scheduled, over‐crowding should not occur. The effects of demand exceeding capacity are captured in the trips not served measure. This measure includes (1) trips turned down or denied when requested, because of a lack of capacity, as well as (2) missed trips, which are those booked and scheduled but no vehicle shows up. From a customer’s perspective, a DRT system is reliable when a customer can book a trip when needed and when the vehicle shows up when scheduled. Conversely, the DRT service is unreliable if the customer cannot obtain a trip—either because the trip is denied or because the vehicle never shows up for the scheduled trip. Some DRT providers try to

FDOT TQoS Applications Guide – Pilot Workshop Draft September 4, 2007
FDOT Public Transit Office 31
avoid denials by over‐accepting trips, which then results in missed trips as there is inadequate capacity. Other DRT providers may have a higher number of denials in order to guarantee capacity for those trips they do accept, with a resulting minimal number of missed trips. This composite measure captures both circumstances—denials and missed trips—which result in the same consequence for the users: a trip not served. On‐time performance measures the degree to which DRT vehicles arrive at the scheduled times. Many DRT systems, particularly those in urban areas, give customers a “window of time” that the vehicle will arrive. For example, if a customer requests a 10 a.m. pick‐up the scheduler or dispatcher might tell that customer that the vehicle can be expected between 9:45 and 10:15. If it arrives within that window it would be considered on‐time. For certain kinds of trips—for example, medical appointments—it is equally important that customers arrive at their destination on time. On‐time performance can also be used to measure reliability for those types of trips. Transit-Auto Travel Time Travel time is an important measure for DRT customers. Some may compare their DRT travel time to that for a comparable auto trip. Others may compare their DRT trip with a comparable trip on fixed‐route service. Still others may compare DRT travel time with some pre‐set length of time, for example 30 minutes or perhaps the “usual” travel time for their DRT trips. Customers should expect that travel times on DRT will be somewhat longer than on a private vehicle, due to the shared‐ride nature of the service, with deviations during the trip for other riders. However, users also expect that the deviations shouldn’t result in a trip that is too lengthy. Defining “too lengthy” will depend on the characteristics of the service area and the type of trip being taken. For example, a DRT trip in a rural area or a regional trip in an urban area may legitimately be 60 to 90 minutes long because of the long distances traveled in rural areas, or because of traffic congestion in urban areas. However, for short trips within the community, 60 minutes is excessively long, even with shared riding. Individual transit systems may set actual numerical values for travel time to assess the quality and performance of their DRT trip travel times (based on their average trip lengths, types of trips, and known service area characteristics). A more generic measure is used here that compares DRT travel times with auto travel times, in a similar way to that used for fixed‐route transit.
3.4 Transit Quality of Service Tools Matrix To aid the planning community in relating different transit quality of service applications to different transit planning applications, a tools matrix has been developed, which is presented in Appendix A. This matrix includes the following:
FDOT TQoS Applications Guide – Pilot Workshop Draft September 4, 2007
FDOT Public Transit Office 32
• Table A.1 – Relationship of Specific TQoS Applications to Transit Planning
Applications • Table A.2 – Direct vs. Secondary Applicability of LOS Measures to
TQoS Applications • Tables A.3 through A.8 – Relationship of TQoS Applications by Fixed‐Route
LOS Measure to Transit Planning Applications
3.5 Sample Applications Appendices B through H present sample applications for seven of the nine transit planning applications presented, applying to calculation procedures presented in Section 4. These applications provide a more in‐depth look at how transit level of service measurement can be applied in peer system comparison, the development and evaluation of service and facility improvement alternatives, and overall plan development. The applications addressed include:
• Long‐range Transportation Plans • Comprehensive Operation Analysis • Transit Development Plans • Corridor Master Plans • Premium Transit Alternatives Analysis • Demand‐Response Transit
Each application addresses particular questions a planner might ask when conducting a particular transit planning application, and how transit level of service measurement can be applied to provide answers. Each application is structured in the following format:
• Background • LOS Measures to be applied • Data Needs • Analysis Steps

FDOT TQoS Applications Guide – Pilot Workshop Draft September 4, 2007
FDOT Public Transit Office 33
Chapter 4 - CALCULATION PROCEDURES
The eleven Transit Quality of Service (TQOS) measures (6 for fixed‐route service and 5 for demand‐responsive transit) discussed in the Transit Capacity and Quality of Service Manual (TCQSM) are useful for many different transit planning applications, as discussed in Section 3 of this report. This section describes the different ways in which the TQOS measures can be calculated for use in the various planning applications. Example problems detailing the procedures outlined here are provided in Appendix A.
4.1 Fixed-Route Transit
Service Frequency Service frequency is a measure of transit availability indicating the need for passengers to plan trips around transit schedules (when headways are long) rather than at their convenience (when headways are short). Table 1 shows the TCQSM LOS standards for fixed‐route transit associated with different frequency ranges. Calculation of service frequency can be based on scheduled service as long as scheduled transit service hours closely reflect the amount of actual service provided.
Table 7- Service Frequency LOS Standards
LOS Headway (min) veh/h Comments A <10 >6 Passengers don’t need schedules B 10-14 5-6 Frequent service, passengers consult schedules C 15-20 3-4 Maximum desirable time to wait if bus/train
missed D 21-30 2 Service unattractive to choice riders E 31-60 1 Service available during the hour F >60 <1 Service unattractive to all riders
Source: TCQSM, 2nd Edition At a stop‐level, service frequency is applicable only where all buses serving a given stop travel to the same destination. Multiple routes that serve a single stop do not alter a passenger’s perspective of frequency if not all buses will take the passenger where he wants to go. Service frequency calculations are therefore most likely to be useful at a route or corridor level. Service frequency is simpler to calculate for routes than for corridors. When only one route serves a given corridor, service frequency is the same for both the route and the corridor. Multiple routes on a single corridor traveling to the same destination increase the effective service frequency along a corridor, however. This often

FDOT TQoS Applications Guide – Pilot Workshop Draft September 4, 2007
FDOT Public Transit Office 34
happens near major activity centers. In these cases, corridor service frequency may be a more appropriate measure. Calculation of service frequency should distinguish between different time periods, as transit headways generally vary considerably over the course of the day. LOS performance standards for service frequency may also be set differently by time‐of‐day. At a system‐wide level, it is not possible to calculate a single measure for service frequency, such as “average system headway,” that is meaningful from a customer perspective. However, measures such as “Percent of Routes with Midday LOS C Frequency” or “Route Miles of Peak‐Hour LOS B Service Frequency” may be used to measure and compare performance over time and between systems.
Hours of Service Hours of service measures the number of hours during the day for which transit is available and is an indicator of the ability of transit to meet a variety of trip purposes. Table 2 shows the TCQSM LOS standards for fixed‐route transit associated with daily hours of service.
Table 8- Hours of Service LOS Standards
LOS Hours of Service
Comments
A 19-24 Night or “owl” service provided B 17-18 Late evening service provided C 14-16 Early evening service provided D 12-13 Daytime service provided E 4-11 Peak hour service only or limited
midday service F 0-3 Very limited or no service
Source: TCQSM, 2nd Edition
Like service frequency, the hours of service measure is most useful at a route or corridor level. Hours of service is simplest to calculate for individual routes; however, hours of service may be more accurate when it considers corridors or origin‐destination pairs. Hours of service calculations should take into account services that run at different times of day, but connect the same origins and destinations. For instance, express bus service to downtown available only in peak hours may be supplemented by local bus service in off‐peak times. Calculation of hours of service to downtown should account for both services to acknowledge that from the passenger’s perspective transit service to downtown is available throughout the day. Hours of service can also be combined with service frequency to develop more custom LOS measures specific to needs. For example, an agency may be interested in extending the hours of service for high‐frequency routes. In that case, hours of service would only be calculated for routes/corridors with a service frequency exceeding a given LOS threshold.

FDOT TQoS Applications Guide – Pilot Workshop Draft September 4, 2007
FDOT Public Transit Office 35
At a system‐wide level, it is not possible to calculate a single measure for hours of service, such as “average system service span,” that is meaningful from a customer perspective. An agency may, however, capture aspects of overall hours of service by calculating the proportion of major origin‐destination pairs with a given hours of service LOS. Alternatively, hours of service could be used to create maps depicting routes by service span (e.g. differentiating “owl” or late evening service from daytime‐only service). Example Calculations Peak hour service only: A bus route operates peak hours only, with no alternative service available at other times. Trips are provided in each direction at 6:30 a.m., 7:30 a.m., 4:30 p.m. and 5:30 p.m. Service is provided during two hours in the morning and two hours in the evening, for a total of four hours. If service was provided in the peak direction only at the times given, the total hours of service for each direction would be two. Limited daytime service: A bus route operates hourly between 5:30 a.m. and 8:30 a.m., every two hours between 8:30 a.m. and 4:30 p.m., and hourly between 4:30 p.m. and 7:30 p.m. The total hours of service is eight: 8:30 minus 5:30 is three hours and add one hour; 7:30 minus 4:30 is three hours and add one hour; the total is eight hours. Although the bus route operates during the middle of the day, it does not operate at a minimum one‐hour frequency; therefore, this time is not counted. Early evening service: A bus route operates every half‐hour between 5:30 a.m. and 8:00 p.m. The total hours of service is 15 (20:00 minus 5:30 is 14.5, add one hour, and discard the fractional hour).
Service Coverage The service coverage TQOS measure describes the percent of transit supportive areas within a service area that are served by transit. Table 3 provides the TCQSM LOS standards for service coverage. Service coverage calculations make no distinction between the quality of transit service available; it is an all‐or‐nothing issue for transit riders—either service is available for a particular trip or it is not. As a result, there is no direct correlation between service coverage LOS and what a passenger would experience for a given trip. Rather, service coverage LOS reflects the number of potential trip origins and destinations available to potential passengers. At LOS “A”, 90% or more of the transit‐supportive area has transit service; at LOS “F”, less than half of the area best suited for transit has service.

FDOT TQoS Applications Guide – Pilot Workshop Draft September 4, 2007
FDOT Public Transit Office 36
This measure is not intended to encourage transit operators to deviate routes substantially simply to cover more area (and thus improve service coverage LOS); should they do so, transit‐auto travel time LOS will be negatively affected. Service coverage can be calculated through either a planning methodology or detailed methodology, both of which are described below. The planning methodology is easiest to calculate, but the detailed methodology includes adjustments for street connectivity, grade, and other factors.
Table 9- Service Coverage LOS Standards
LOS % TSA Covered
Comments
A 90.0-100.0% Most major origins & destinations served B 80.0-89.9% C 70.0-79.9% About ¾ of higher-density areas served D 60.0-69.9% E 50.0-59.9% F <50.0% Less than half of higher-density areas served
Transit‐Supportive Area (TSA): The portion of the area being analyzed that has a household density of at least 7.5 units per gross hectare (3 units per gross acre) or an employment density of at least 10 jobs per gross hectare (4 jobs per gross acre). Covered Area: The area within 0.4 km (0.25 mi) of local bus service or 0.8 km (0.5 mi) of a busway or rail station, where pedestrian connections to transit are available from the surrounding area.
Transit-Supportive Areas Pushkarev and Zupan(R1) suggest that a household density of 11 units per net hectare (4.5 units per net acre) is a typical minimum residential density for hourly transit service to be feasible. This equates to a density of approximately 7.5 units per gross hectare (3 units per gross acre).5 Hourly service corresponds to the minimum LOS “E” value for service frequency as well as the minimum frequency used for determining hours of service LOS. A TriMet long‐range service planning study(R2) found that an employment density of approximately 10 jobs per gross hectare (4 jobs per gross acre) produced the same level of ridership as a household density of 7.5 units per gross hectare (3 units per gross acre). These density values are used in this methodology as the minimum densities that are capable of supporting hourly transit service. Areas with a minimum density capable of supporting hourly service are referred to as transit‐supportive areas in this methodology. For policy reasons, or simply to provide a route connecting two higher‐density areas, an agency may choose to—and likely will—cover a larger area than that defined by its transit‐supportive areas.
5 Net acres are often referenced in zoning codes and consider only the area developed for housing or employment. Gross acres are total land areas, which may include streets, parks, water features, and other land not used for residential or employment-related development. Gross acres are easier to work with in calculations and therefore are used in this methodology.

FDOT TQoS Applications Guide – Pilot Workshop Draft September 4, 2007
FDOT Public Transit Office 37
Agencies may wish to provide different levels of transit service for areas with varying transit‐supportiveness. LOS E service, which the service coverage measure is based on, may be appropriate for the transit‐supportive densities suggested above. However, areas of much higher density are supportive of more premium transit service. The service coverage measure can be adjusted to meet these requirements by changing the definitions of both service areas and transit‐supportive areas. For instance, an agency may wish to provide LOS B peak‐hour service frequency to areas with 15 or more household units per gross acre. In this case, the service area would reflect only LOS B peak‐hour service and transit‐supportive areas would include only areas with greater than 15 households per gross acre. Service Coverage Area – Planning Methodology The planning methodology defines the area covered by a particular route as that area within walking distance of a transit stop. This area is defined as the air distance within 400 m (0.25 mi) of a bus stop or 800 m (0.5 mi) of a busway or rail station. Any location within 400 m (0.25 mi) of the area served by deviated fixed‐route bus service is also considered to be covered. The calculation of the transit service coverage area can be performed relatively easily by GIS software, using the software’s buffering feature to draw appropriately sized circles around transit stops. However, if GIS software or accurate bus stop data are not available, this area can be approximated by outlining on a map all of the area within 400 m (0.25 mi) of a bus route. This approximation assumes typical urban bus stop spacing (at least four per kilometer or six per mile). Sections of a route where pedestrian access from the area adjacent to the route is not possible (because of a barrier such as a wall, waterway, roadway, or railroad) should not be included. Example Calculation—GIS Method TriMet is the transit service provider for Portland, Oregon and many of its suburbs. This example shows how to calculate service coverage LOS for TriMet using the planning methodology in GIS. Data Required The following data are used for this calculation:
• Bus stop and light rail station locations, from the regional government’s GIS database.
• Transportation analysis zone (TAZ) data (households, jobs, and TAZ boundaries) from the regional transportation planning model. Alternatively, census blocks or similar relatively small areas could also have been used.
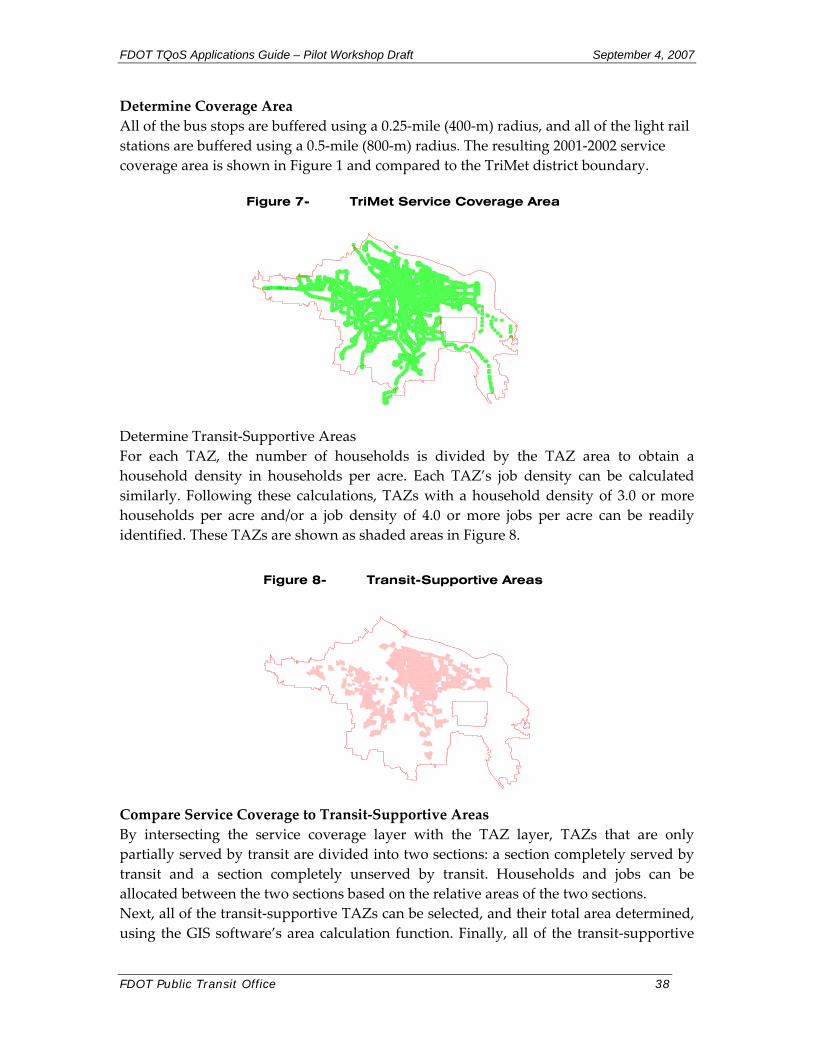
FDOT TQoS Applications Guide – Pilot Workshop Draft September 4, 2007
FDOT Public Transit Office 38
Determine Coverage Area All of the bus stops are buffered using a 0.25‐mile (400‐m) radius, and all of the light rail stations are buffered using a 0.5‐mile (800‐m) radius. The resulting 2001‐2002 service coverage area is shown in Figure 1 and compared to the TriMet district boundary.
Figure 7- TriMet Service Coverage Area
Determine Transit‐Supportive Areas For each TAZ, the number of households is divided by the TAZ area to obtain a household density in households per acre. Each TAZ’s job density can be calculated similarly. Following these calculations, TAZs with a household density of 3.0 or more households per acre and/or a job density of 4.0 or more jobs per acre can be readily identified. These TAZs are shown as shaded areas in Figure 8.
Figure 8- Transit-Supportive Areas
Compare Service Coverage to Transit‐Supportive Areas By intersecting the service coverage layer with the TAZ layer, TAZs that are only partially served by transit are divided into two sections: a section completely served by transit and a section completely unserved by transit. Households and jobs can be allocated between the two sections based on the relative areas of the two sections. Next, all of the transit‐supportive TAZs can be selected, and their total area determined, using the GIS software’s area calculation function. Finally, all of the transit‐supportive

FDOT TQoS Applications Guide – Pilot Workshop Draft September 4, 2007
FDOT Public Transit Office 39
Transit Supportive AreasNot servedServed
TAZ sections served by transit can be selected and their areas added up. Dividing the second area into the first area gives the percentage of the transit‐supportive area served. Table 4 presents numerical results; Figure 9 compares TriMet’s coverage area to its transit‐supportive area in the form of a map.
Table 10- Service Coverage Results
Analysis Area Area (km2) Households Jobs % Area Served LOS TriMet District 1,460.2 458,076 786,713 Coverage Area 629.7 345,260 664,684
Transit-Supportive Area
344.2 273,341 639,375
TSA Served 296.3 244,587 588,072 86.1% B Source: TCQSM, 2nd Edition
Figure 9- Transit-Supportive Areas Served
Example Calculation—Manual Method Required Data The items listed below are required for calculating service coverage manually:
• A printed map (to scale) of the transportation analysis zones (TAZs), census blocks, or other area type for which household and job data are available, that covers the area being analyzed. The remainder of this example assumes that TAZs are being used from a local regional transportation model.
• Data on the number of households and jobs within each TAZ, in either printed or spreadsheet form.
• A map showing bus routes, and busway and rail stations. Estimate TAZ Areas A transparent overlay with a printed grid helps in estimating areas. Alternatively, if the TAZ map is available electronically, the software used to develop the map may be able to calculate the area of each TAZ.

FDOT TQoS Applications Guide – Pilot Workshop Draft September 4, 2007
FDOT Public Transit Office 40
Identify Transit‐Supportive Areas Using a computer spreadsheet, or by hand, calculate household and job densities by dividing the number of households and jobs in each TAZ by the TAZ areas estimated in Step 2. Areas should be converted to hectares or acres as part of this calculation. Next, identify all TAZs where the household density is at least 7.5 units/gross hectare (3 units/gross acre) or the job density is at least 10 jobs/gross hectare (4 jobs/gross acre). Mark these TAZs on the map. Identify the Transit Service Area On the printed map, outline the areas within 0.4 km (0.25 mi) of bus routes that serve or pass near the transit‐supportive TAZs, the areas within 0.8 km (0.5 mi) of busway or rail stations within or near the transit‐supportive TAZs. The entire system does not need to be outlined, only the portions within and near transit‐supportive TAZs. Estimate the percentage (to the nearest 10%) of each transit‐supportive TAZ that is covered by transit. Do not include any areas that do not have transit access due to a barrier that blocks pedestrian access, such as a freeway, railroad track, waterway, or wall. Calculate Level of Service Add up the areas of the transit‐supportive TAZs, using the information developed earlier. This is the total area of the transit‐supportive area. Next, for each transit‐supportive TAZ, multiply its area by the percentage of its area served by transit. The sum of these adjusted areas is the total transit‐supportive area covered by transit. Finally, divide this result by the total transit‐supportive area to determine the percentage of the transit‐supportive area covered by transit. Use Table 3 to determine the level of service based on this percentage. Detailed Methodology The planning methodology represents a trade‐off between ease of calculation and the amount of factors included in the calculation. In particular, the following issues are not addressed by the planning methodology:
• The use of air distances overestimates the number of people within walking distance of transit service. A lack of pedestrian connectivity, whether due to topographic barriers or automobile‐oriented land use development reduces an area’s access to transit.
• The effect of grades on walking distances is not addressed. • The proportion of older adults in the population, who will generally not walk
as far as younger adults, is not addressed. • Transit stop accessibility is not addressed, in particular, the difficulty of
crossing the street with transit service.

FDOT TQoS Applications Guide – Pilot Workshop Draft September 4, 2007
FDOT Public Transit Office 41
The detailed methodology does not address the increased service coverage area provided by park‐and‐ride lots. However, means of addressing this issue is described in subsequent sections. The four bullets listed above are addressed in the detailed methodology. The general analysis procedure is similar to the planning methodology. However, instead of using a set service coverage radius for every stop, each stop’s service area is reduced in proportion to the additional time required to climb hills, cross busy streets, wind one’s way out of a subdivision, etc. Each stop ends up with an individual service radius that is in most cases smaller than the maximum 400‐800 m (0.25‐0.5 mi), and therefore serves a smaller number of people or jobs. This can be expressed mathematically as shown below:
pxpopgsc0 ffffrr =
where: r = transit stop service radius (m, mi); r0 = ideal transit stop service radius (m, mi),
= 400 m (0.25 mi) for bus stops, and 800 m (0.5 mi) for busway and rail stations;
fsc = street connectivity factor; fg = grade factor; fpop = population factor; and fpx = pedestrian crossing factor. Because of the number of factors involved in the detailed methodology, the methodology is best suited for analyzing small areas ranging from the vicinity of an individual stop to a neighborhood. If larger areas, up to the entire system, are desired to be analyzed, developing default values (e.g., a default hourly vehicle volume for an arterial street) for many of the factors is recommended. If the detailed methodology is used, it should be applied consistently throughout the area, and not mixed with the planning methodology. Street Connectivity Factor This factor reduces a stop’s service coverage area in relation to the amount of out‐of‐direction travel a pedestrian is forced to make to get to a transit stop from the surrounding land uses. In a traditional grid street layout system, there is very little out‐of‐direction walking required, whereas in a contemporary suburban neighborhood with limited entry points and dead‐end streets, a transit stop located only 200 meters (650 ft) away in a straight line might be a fifteen‐minute walk away using the subdivision’s street system. Three types of street patterns are defined:(R3)

FDOT TQoS Applications Guide – Pilot Workshop Draft September 4, 2007
FDOT Public Transit Office 42
• Type 1, a traditional grid system; • Type 3, a contemporary suburban street network with a large number of cul‐de‐sac streets; and • Type 2, a hybrid layout that incorporates elements of both traditional and contemporary street patterns.
Figure 10 illustrates the three types of street patterns. These sketches may be used to estimate the area type surrounding the bus stops under study.
Figure 10- Street Pattern Types
(a) Type 1—Grid (b) Type 2—Hybrid
(c) Type 3—Cul‐de‐Sac Source: TCQSM, 2nd Edition As can be seen from the above sketches, a grid street pattern provides the most direct pedestrian access to transit stops. However, walking distances to and from a transit stop can still be about 42% longer than the corresponding air distance. Stated another way, only about 64% of the area within 400 m (0.25 mi) air distance of a transit stop in a grid street pattern lies within 400 m walking distance of the stop. The amount of coverage provided by the other street patterns is even lower: 54% of the area within a 400 m radius of a transit stop in a typical hybrid street pattern lies within 400 m walking distance, and only 28% of the area in an average contemporary street pattern lies within 400 m walking distance. Using the grid street pattern as the best case, Table 10 provides street connectivity factors for the other street patterns. The factor is based on the ratio of each street pattern’s area covered to the area covered in a grid network.

FDOT TQoS Applications Guide – Pilot Workshop Draft September 4, 2007
FDOT Public Transit Office 43
Table 11- Street Connectivity Factors
Street Pattern Type
Street Connectivity Factor, fsc
Type 1—Grid 1.00 Type 2—Hybrid 0.85
Type 3—Contemporary
0.45
Source: TCQSM, 2nd Edition As an alternative to using the sketches, a measure of the network connectivity may be used instead to determine the area type. The network connectivity index is the number of links (i.e., street segments between intersections) divided by the number of nodes (i.e., intersections) in a roadway system.(R3) It is assumed for this application that all of the roadways provide for safe pedestrian travel. The index value ranges from about 1.7 for a well‐connected grid pattern to approximately 1.2 for a cul‐de‐sac based suburban pattern. Table 11 shows the relationship between the network connectivity index and the street pattern type.
Table 12- Relationship Between Network Connectivity Index and Street Pattern Type
Network Connectivity Index
Street Pattern Type
>1.55 Type 1—Grid 1.30-1.55 Type 2—Hybrid
<1.30 Type 3—Contemporary Source: TCQSM, 2nd Edition Grade Factor The horizontal distance that pedestrians are able to travel in a given period of time decreases as the vertical distance climbed increases, particularly when the grade exceeds 5%. The area located within a given walking time of a transit stop decreases in proportion to the square of the reduced horizontal distanced traveled. Table 7 gives reduction factors for the effect of average grades on a given stop’s service coverage area.
Table 13- Grade Factor
Average Grade Grade Factor, fg
0-5% 1.00 6-8% 0.95 9-11% 0.80 12-15% 0.65
Source: TCQSM, 2nd Edition This factor assumes that pedestrians will have to walk uphill either coming or going. If the transit route network provides service on parallel streets, such that a person could
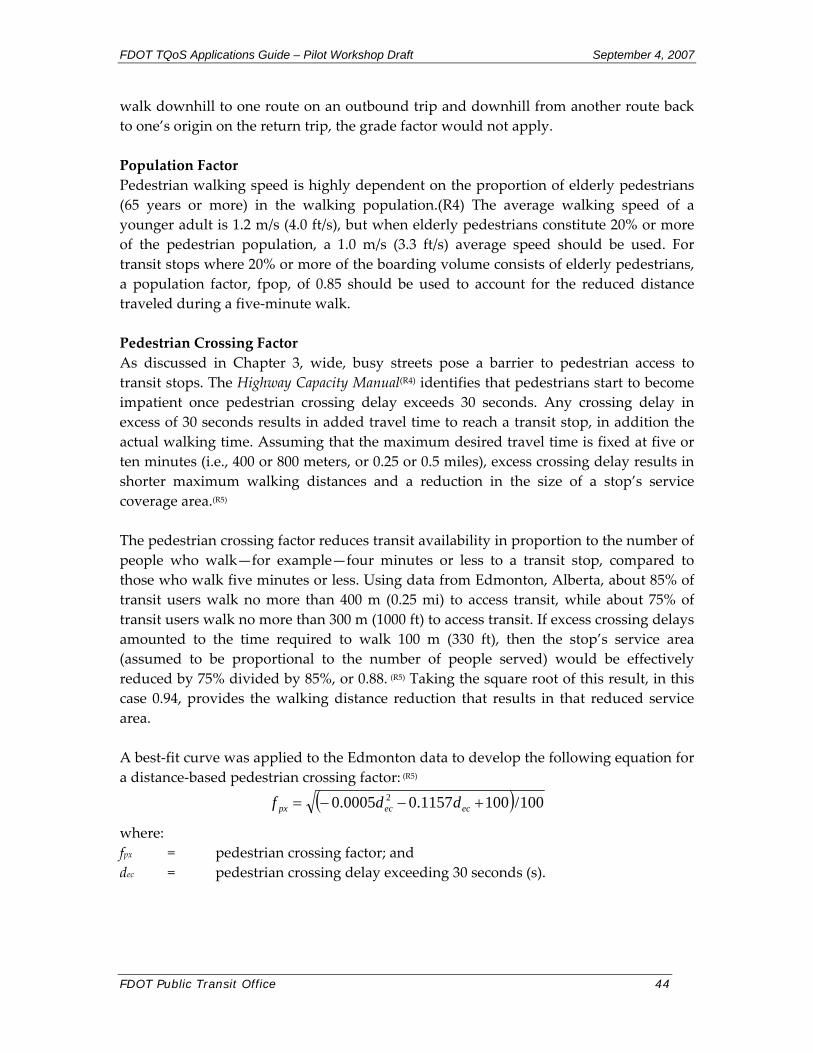
FDOT TQoS Applications Guide – Pilot Workshop Draft September 4, 2007
FDOT Public Transit Office 44
walk downhill to one route on an outbound trip and downhill from another route back to one’s origin on the return trip, the grade factor would not apply. Population Factor Pedestrian walking speed is highly dependent on the proportion of elderly pedestrians (65 years or more) in the walking population.(R4) The average walking speed of a younger adult is 1.2 m/s (4.0 ft/s), but when elderly pedestrians constitute 20% or more of the pedestrian population, a 1.0 m/s (3.3 ft/s) average speed should be used. For transit stops where 20% or more of the boarding volume consists of elderly pedestrians, a population factor, fpop, of 0.85 should be used to account for the reduced distance traveled during a five‐minute walk. Pedestrian Crossing Factor As discussed in Chapter 3, wide, busy streets pose a barrier to pedestrian access to transit stops. The Highway Capacity Manual(R4) identifies that pedestrians start to become impatient once pedestrian crossing delay exceeds 30 seconds. Any crossing delay in excess of 30 seconds results in added travel time to reach a transit stop, in addition the actual walking time. Assuming that the maximum desired travel time is fixed at five or ten minutes (i.e., 400 or 800 meters, or 0.25 or 0.5 miles), excess crossing delay results in shorter maximum walking distances and a reduction in the size of a stop’s service coverage area.(R5) The pedestrian crossing factor reduces transit availability in proportion to the number of people who walk—for example—four minutes or less to a transit stop, compared to those who walk five minutes or less. Using data from Edmonton, Alberta, about 85% of transit users walk no more than 400 m (0.25 mi) to access transit, while about 75% of transit users walk no more than 300 m (1000 ft) to access transit. If excess crossing delays amounted to the time required to walk 100 m (330 ft), then the stop’s service area (assumed to be proportional to the number of people served) would be effectively reduced by 75% divided by 85%, or 0.88. (R5) Taking the square root of this result, in this case 0.94, provides the walking distance reduction that results in that reduced service area. A best‐fit curve was applied to the Edmonton data to develop the following equation for a distance‐based pedestrian crossing factor: (R5)
( ) 100/1001157.00005.0 2 +−−= ececpx ddf
where: fpx = pedestrian crossing factor; and dec = pedestrian crossing delay exceeding 30 seconds (s).

FDOT TQoS Applications Guide – Pilot Workshop Draft September 4, 2007
FDOT Public Transit Office 45
0.00
0.10
0.20
0.30
0.40
0.50
0.60
0.70
0.80
0.90
1.00
0 50 100 150 200 250 300
Pedestrian Crossing Delay (s)
Ped
estr
ian
Cro
ssin
g F
acto
r
Figure 11 depicts this curve. The factor is 1.00 whenever pedestrian crossing delay on the street with transit service is less than or equal to 30 seconds.
Figure 11- Pedestrian Crossing Factor
Source: TCQSM, 2nd Edition Calculating Pedestrian Crossing Delay Signalized crossings: At signalized pedestrian crossings, average crossing delay is based on the cycle length and the amount of time available for pedestrians to begin crossing the street, as shown in the following equation:(R4)
Equation 3‐1
Error! Objects cannot be created from editing field codes.
where: dp = average pedestrian delay (s); C = traffic signal cycle length (s); and g = effective green time for pedestrians (WALK time + 4 s of flashing DON’T WALK) (s). Table 13 shows typical delays incurred by pedestrians when crossing streets at signalized locations, for various street widths and median types.

FDOT TQoS Applications Guide – Pilot Workshop Draft September 4, 2007
FDOT Public Transit Office 46
Table 14- Average Pedestrian Street Crossing Delay: Signalized Crossings
Transit Street Crossing Distance Lanes 1 2U 2D 3 4U 4D 5 6D
ft 15 24 28 36 48 54 60 78 m 4.6 7.3 8.5 11.0 14.6 16.5 18.3 23.8
Assumed cycle length (s) 60 60 60 90 90 120 140 180
Assumed Walk time (s) 7 7 7 7 7 7 7 9
Delay (s) 20 20 20 35 35 50 59 78 SOURCE: Calculated from Error! Reference source not found., using default cycle length and walk times shown. Walk time assumed to be the greater of 7 s or 5% of the cycle length. NOTE: U=undivided, D=divided (with raised median or other pedestrian refuge) Unsignalized Crossings: At unsignalized pedestrian crossings where pedestrians do not have the right‐of‐way (or where motorists do not grant pedestrians their legal right‐of‐way), average crossing delay is based on the crossing distance, average pedestrian walking speed, and traffic volumes (vehicle flow rates). Determining delay is a two‐step process. First, the pedestrians’ critical gap is determined, which is the shortest gap in traffic (in seconds) that pedestrians can safely use to cross the street. This can be determined from the following equation:
psp
xcg t
SLt +=
where: tcg = pedestrian critical gap (s); Sp = average pedestrian walking speed (ft/s, m/s); Lx = crossing distance (ft, m); and tps = pedestrian start‐up and end clearance time (s). Where elderly pedestrians make up 20% or less of the pedestrian population, a 4.0 ft/s (1.2 m/s) walking speed can be used; where elderly pedestrians are more numerous, a 3.3 ft/s (1.0 m/s) speed should be used. A default value of 3 seconds for pedestrian start‐up and end clearance time may be used.(R4) Once the critical gap is known, the following equation can be used to determine pedestrian delay at unsignalized crossings where pedestrians do not have the right‐of‐way:(R4)
( )11−−= cg
vtp vte
vd cg
where: dp = average pedestrian delay (s);

FDOT TQoS Applications Guide – Pilot Workshop Draft September 4, 2007
FDOT Public Transit Office 47
v = vehicular flow rate (veh/s); and tcg = pedestrian critical gap (s). In situations where a pedestrian refuge is provided in the middle of the street, and pedestrians tend to use that refuge to cross the street in two stages, delay should be determined individually for each direction of the street crossed, and then summed to determine the total delay. Table 9 shows typical values of delay at unsignalized intersections, based on various combinations of lane widths, median types, and traffic volumes. As with signalized intersections, pedestrians start becoming impatient and exhibit risk‐taking behavior when delay exceeds 30 seconds.(R4) Where pedestrians have the right‐of‐way at an unsignalized crossing, they will experience a minimal amount of delay waiting to make sure that traffic will stop for them before they start to cross the street. This delay is well below the 30‐second pedestrian impatience threshold used in Chapter 3 procedures.
Table 15- Average Pedestrian Crossing Delay: Unsignalized Crossing with no Pedestrian Right-of-Way
Delay exceeds 5 minutes, 30 seconds (typical maximum pedestrian walking time to bus stops, plus 30 second pedestrian‐impatience threshold). N/A: not applicable—unlikely to achieve volumes shown with one lane. SOURCE: TCQSM, 2nd Edition. Calculated from Equations 4‐4 and 4‐5, using a pedestrian walking speed of 4.0ft/s (1.2 m/s) and a pedestrian start‐up and end clearance time of 3 seconds.
Crossing Distance 1 lane 2 3 4 5 6
Volume Flow Rate 15 ft 24 36 48 60 72 (veh/h) (veh/s) 4.6 m 7.3 11.0 14.6 18.3 22.0
200 0.056 1 3 6 8 13 19 300 0.083 2 4 10 15 24 36 400 0.111 3 6 15 24 40 63 500 0.139 3 9 21 36 63 105 600 0.167 4 12 30 52 97 172 700 0.194 6 15 41 75 147 279 800 0.222 7 20 55 107 223 * 900 0.250 9 25 75 151 * *
1,000 0.278 11 31 100 214 * * 1,100 0.306 N/A 39 133 302 * * 1,200 0.333 N/A 48 178 * * * 1,300 0.361 N/A 60 237 * * * 1,400 0.389 N/A 74 317 * * * 1,500 0.417 N/A 91 * * * * 1,600 0.444 N/A 112 * * * * 1,700 0.472 N/A 137 * * * * 1,800 0.500 N/A 169 * * * * 1,900 0.528 N/A 208 * * * * 2,000 0.556 N/A 256 * * * *
FDOT TQoS Applications Guide – Pilot Workshop Draft September 4, 2007
FDOT Public Transit Office 48
Park-and-Ride Service Coverage This section presents guidelines for including park‐and‐ride service coverage as part of a system’s overall service coverage area. This procedure is not intended to serve as a tool for estimating potential park‐and‐ride demand. As discussed in the TCQSM, the area served by park‐and‐ride lots varies considerably by the type of lot, land uses within its market area, congestion on nearby roadways, and other factors specific to the metropolitan region where the lot is located. However, many of the studies are consistent in finding that approximately one‐half of a park‐and‐ride lot’s users start their trip within 2 to 3 miles (3 to 5 km) of the lot. This inner service area is a relatively compact area that can be used to assess a lot’s service coverage. The outer service area will provide a similar number of users, but they will be scattered over an area four or more times as large as the inner service area, with the result that park‐and‐ride users within the lot’s outer service area form a much smaller portion of the general population. This procedure is similar to how bus stop coverage is treated. Approximately 25 to 30% of a bus stop’s users will walk more than 0.25 mile (400 m) to a local bus stop, but these users will be spread over a large area and will form a much smaller portion of the general population in that area. For the purposes of assessing service coverage, a 2.5‐mile (4‐km) radius around larger (100 spaces or more) park‐and‐ride lots may be used. This area should be added to the walking coverage area determined through either the planning or detailed methodologies described earlier. Because park‐and‐ride lots usually serve the home end of a trip, and often are designed to serve passengers who do not live in higher‐density areas, percent persons served may be used as the park‐and‐ride lot performance measure, with the service area consisting of the transit agency’s service area (e.g., a defined county or metropolitan area). When this measure is used, it should be reported in combination with walking service coverage performance. The 2.5‐mile (4‐km) radius for urban area park‐and‐ride lots relates to larger facilities (typically 100 or more spaces), with enhanced transit service. For smaller lots (such as a 25‐space shared church lot with only local transit service), a smaller service coverage area might be appropriate. Of course, if a more detailed park‐and‐ride market assessment related to a particular study or project is conducted, then the results of that study should super cede the method described above.
Passenger Load
Passenger load LOS is based on two measures: load factor (passengers per seat), when all passengers can sit, and standing passenger area, when some passengers must stand, or when a vehicle is designed to accommodate more standees than seated passengers. Passenger load LOS can be measured by time of day (e.g., LOS “D” peak, LOS “B” off‐

FDOT TQoS Applications Guide – Pilot Workshop Draft September 4, 2007
FDOT Public Transit Office 49
peak) or by the amount of time a certain condition occurs (e.g., some passengers must stand for up to 10 minutes). When a substantial number of passengers wear or carry objects, such as daypacks or briefcases, that increase the space occupied by those passengers, analysts may wish to use the concept of equivalent passengers, based on the projected area values given in Table 10. For example, a passenger holding a briefcase takes up about twice as much space as a standing passenger not holding anything. If, on average, half of 10 standing passengers carry briefcases, then the space occupied is the equivalent of 15 standing passengers carrying nothing.
Table 16- Passenger Space Requirements
Situation Projected Area (ft2)
Projected Area (m2)
Standing 1.6-2.2 0.15-0.20 ... with briefcase 2.7-3.2 0.25-0.30 ... with daypack 3.2-3.8 0.30-0.35 ... with suitcases 3.8-5.9 0.35-0.55 ... with stroller 10.2-12.4 0.95-1.15
... with bicycle (horizontal) 17.2-20.4 1.60-1.90 Holding on to stanchion 2.7 0.25 Minimum seated space 2.7-3.2 0.25-0.30
Tight double seat 3.8 per person 0.35 per person Comfortable seating 5.9 per person 0.55 per person
Wheelchair space (ADA) 10.0 (30 in x 48 in)
0.93 (0.76 m x 1.22 m)
NOTE: Stroller and bicycle dimensions are based on a review of manufacturer specifications.
The standing passenger area can be measured using a typical vehicle, or estimated using the procedure described below. The area next to the vehicle operator, stepwells, interior steps, and wheel wells should not be included as part of the standing area. In addition, a 0.36‐m (14‐inch) buffer should be left in front of longitudinal seating to account for seated passenger foot room. When the standing passenger area is not known, it can be estimated as follows: 1. Calculate the gross interior floor area. Multiply the vehicle width by the interior vehicle length. For buses, the interior vehicle length can be estimated by subtracting 2.6 m (8.5 ft) from the total bus length, as an allowance for the engine compartment and operator area. 2. Calculate the area occupied by seats and other objects:
• Transverse seating: 0.5 m2 (5.4 ft2) per seat • Longitudinal seating: 0.4 m2 (4.3 ft2) per seat

FDOT TQoS Applications Guide – Pilot Workshop Draft September 4, 2007
FDOT Public Transit Office 50
• Wheelchair position: 0.95 m2 (10.0 ft2) per position (use when the wheelchair
• position is not created by fold‐up seats) • Rear door: 0.4 m2 (4.3 ft2) per door channel • Interior aisle stairs: 0.4 m2 (4.3 ft2) • Low‐floor bus wheel well: 0.95 m2 (10.0 ft2) each
3. Calculate the standing passenger area. Subtract the area calculated in step 2 from the gross interior floor area calculated in step 1. Table 16 provides the LOS thresholds for passenger loads.
Table 17- Passenger Load LOS
LOS
Load Factor
(p/seat)
Standing Passenger Area
(m2/p) (ft2/p)
Comments
A 0.00-0.50 >1.00† >10.8† No passenger need sit next to another
B 0.51-0.75 0.76-1.00† 8.2-10.8† Passenger can choose where to sit C 0.76-1.00 0.51-0.75† 5.5-8.1† All passengers can sit D 1.01-1.25* 0.36-0.50 3.9-5.4 Comfortable standee load for design E 1.26-1.50* 0.20-0.35 2.2-3.8 Maximum schedule load F >1.50* <0.20 <2.2 Crush load
*Approximate value for comparison, for vehicles designed to have most passengers seated. LOS is based on area. †Used for vehicles designed to have most passengers standing. At LOS “A” load levels, passengers are able to spread out and can use empty seats to store parcels, bags, etc. rather than carry them on their lap. At LOS “B”, some passengers will have to sit next to others, but others will not. All passengers can still sit at LOS “C”, although the choice of seats will be limited. Some passengers will be required to stand at LOS “D” load levels, while at LOS “E”, a transit vehicle will be as full as passengers will normally tolerate. LOS “F” represents crush loading levels.
Reliability Reliability, or on‐time performance, is a key indicator of the convenience of a transit service from the passenger’s point‐of‐view. The TCQSM on‐time performance LOS defines “on‐time” as being 0 to 5 minutes late. Whether arrivals or departures should be measured will depend on the situation: departures tend to be more important where passengers are mostly boarding, and arrivals where passengers are mostly disembarking. Early departures should not be considered on‐time in locations where passengers are boarding, but early arrivals may be considered on‐time at the end of a route or at other locations where passengers are only disembarking.
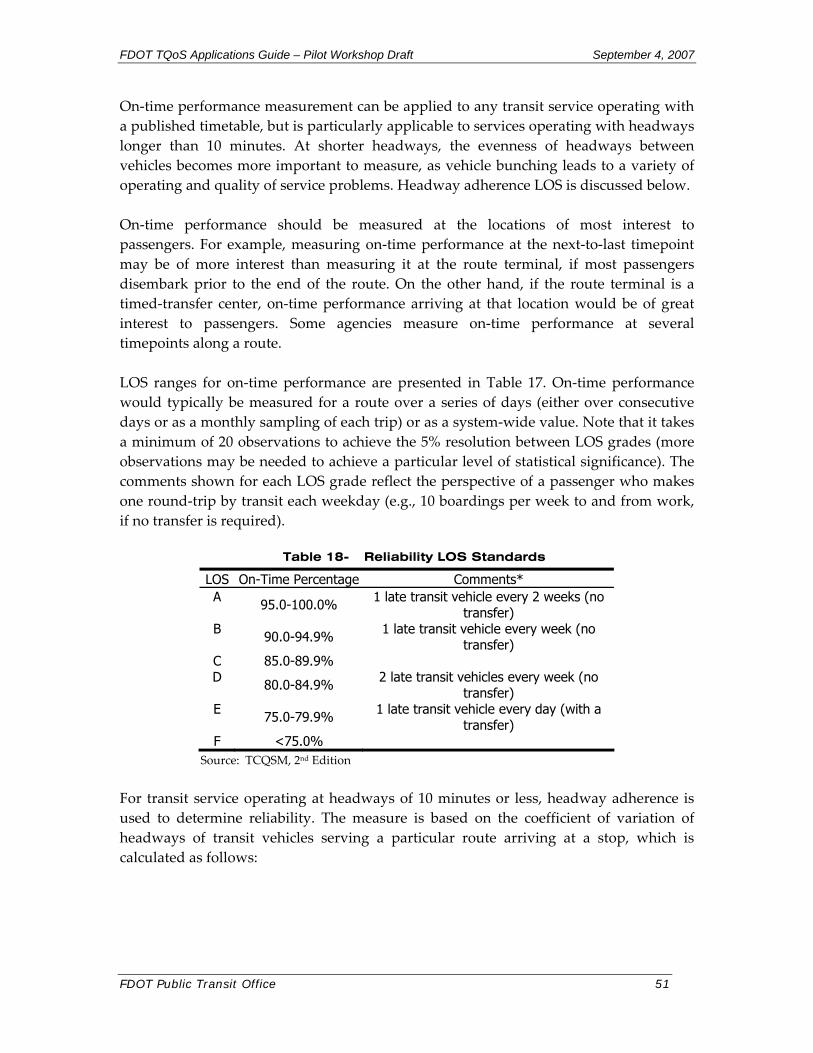
FDOT TQoS Applications Guide – Pilot Workshop Draft September 4, 2007
FDOT Public Transit Office 51
On‐time performance measurement can be applied to any transit service operating with a published timetable, but is particularly applicable to services operating with headways longer than 10 minutes. At shorter headways, the evenness of headways between vehicles becomes more important to measure, as vehicle bunching leads to a variety of operating and quality of service problems. Headway adherence LOS is discussed below. On‐time performance should be measured at the locations of most interest to passengers. For example, measuring on‐time performance at the next‐to‐last timepoint may be of more interest than measuring it at the route terminal, if most passengers disembark prior to the end of the route. On the other hand, if the route terminal is a timed‐transfer center, on‐time performance arriving at that location would be of great interest to passengers. Some agencies measure on‐time performance at several timepoints along a route. LOS ranges for on‐time performance are presented in Table 17. On‐time performance would typically be measured for a route over a series of days (either over consecutive days or as a monthly sampling of each trip) or as a system‐wide value. Note that it takes a minimum of 20 observations to achieve the 5% resolution between LOS grades (more observations may be needed to achieve a particular level of statistical significance). The comments shown for each LOS grade reflect the perspective of a passenger who makes one round‐trip by transit each weekday (e.g., 10 boardings per week to and from work, if no transfer is required).
Table 18- Reliability LOS Standards
LOS On-Time Percentage Comments* A 95.0-100.0% 1 late transit vehicle every 2 weeks (no
transfer) B 90.0-94.9% 1 late transit vehicle every week (no
transfer) C 85.0-89.9% D 80.0-84.9% 2 late transit vehicles every week (no
transfer) E 75.0-79.9% 1 late transit vehicle every day (with a
transfer) F <75.0%
Source: TCQSM, 2nd Edition For transit service operating at headways of 10 minutes or less, headway adherence is used to determine reliability. The measure is based on the coefficient of variation of headways of transit vehicles serving a particular route arriving at a stop, which is calculated as follows:
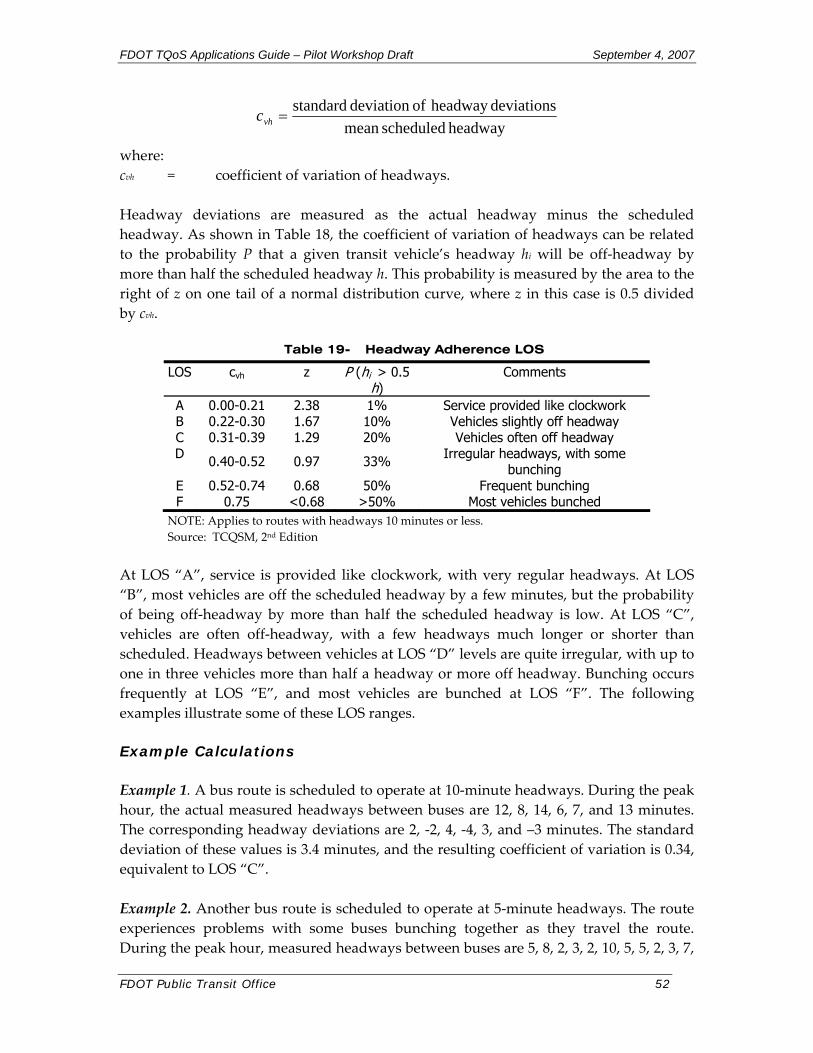
FDOT TQoS Applications Guide – Pilot Workshop Draft September 4, 2007
FDOT Public Transit Office 52
headway scheduledmean deviationsheadway ofdeviation standard
=vhc
where: cvh = coefficient of variation of headways. Headway deviations are measured as the actual headway minus the scheduled headway. As shown in Table 18, the coefficient of variation of headways can be related to the probability P that a given transit vehicle’s headway hi will be off‐headway by more than half the scheduled headway h. This probability is measured by the area to the right of z on one tail of a normal distribution curve, where z in this case is 0.5 divided by cvh.
Table 19- Headway Adherence LOS
LOS cvh z P (hi > 0.5 h)
Comments
A 0.00-0.21 2.38 1% Service provided like clockwork B 0.22-0.30 1.67 10% Vehicles slightly off headway C 0.31-0.39 1.29 20% Vehicles often off headway D 0.40-0.52 0.97 33% Irregular headways, with some
bunching E 0.52-0.74 0.68 50% Frequent bunching F 0.75 <0.68 >50% Most vehicles bunched
NOTE: Applies to routes with headways 10 minutes or less. Source: TCQSM, 2nd Edition
At LOS “A”, service is provided like clockwork, with very regular headways. At LOS “B”, most vehicles are off the scheduled headway by a few minutes, but the probability of being off‐headway by more than half the scheduled headway is low. At LOS “C”, vehicles are often off‐headway, with a few headways much longer or shorter than scheduled. Headways between vehicles at LOS “D” levels are quite irregular, with up to one in three vehicles more than half a headway or more off headway. Bunching occurs frequently at LOS “E”, and most vehicles are bunched at LOS “F”. The following examples illustrate some of these LOS ranges. Example Calculations Example 1. A bus route is scheduled to operate at 10‐minute headways. During the peak hour, the actual measured headways between buses are 12, 8, 14, 6, 7, and 13 minutes. The corresponding headway deviations are 2, ‐2, 4, ‐4, 3, and –3 minutes. The standard deviation of these values is 3.4 minutes, and the resulting coefficient of variation is 0.34, equivalent to LOS “C”. Example 2. Another bus route is scheduled to operate at 5‐minute headways. The route experiences problems with some buses bunching together as they travel the route. During the peak hour, measured headways between buses are 5, 8, 2, 3, 2, 10, 5, 5, 2, 3, 7,
FDOT TQoS Applications Guide – Pilot Workshop Draft September 4, 2007
FDOT Public Transit Office 53
and 8 minutes. The corresponding headway deviations are 0, 3, ‐3, ‐2, ‐3, 5, 0, 0, ‐3, ‐2, 2, and 3 minutes. The standard deviation of the headway deviations is 2.73 and the coefficient of variation is 0.55, equivalent to LOS “E”. Example 3. A third route running every 5 minutes does not have bunching problems. Peak hour headways are measured at 5, 6, 5, 4, 4, 5, 6, 5, 6, 4, 5, and 5 minutes. The standard deviation of the headway deviations is 0.74 and the coefficient of variation is 0.15, equivalent to LOS “A”.
Transit-Auto Travel Time An important factor in a potential transit user’s decision to use transit on a regular basis is how much longer the trip will take in comparison with the automobile. The level of service measure for this is transit‐auto travel time: the door‐to‐door difference between automobile and transit travel times, including walking, waiting, and transfer times (if applicable) for both modes. It is a measure of how much longer (or in some cases, shorter) a trip will take by transit. The trip length is not as important as the trip time—a 20‐mile trip that takes 1 hour longer by transit and a 5‐mile trip that takes 1 hour longer both require an extra hour out of one’s day—although longer trips have a greater potential for having a greater time differential. Travel time for transit includes walk time from one’s origin to transit (assumed to be an average of 3 minutes), wait time (5 minutes), travel time on‐board transit (varies), walk time from transit to one’s destination (3 minutes), and any transfer time required (varies). Travel time for automobiles includes travel time in the automobile and time required to park one’s car and walk to one’s destination (assumed to be an average of 3 minutes). Walk time is based on a maximum 0.25‐mile (400‐m) walk to transit at 3 mph (5 km/h), which will take about 5 minutes; not all transit users walk the maximum distance. Smaller cities may find it harder than large cities to achieve high levels of service for this measure. In the San Francisco Bay Area, for example, it is faster to travel between downtown Oakland and downtown San Francisco by BART during the a.m. rush hour than it is to drive alone over the Bay Bridge. On the other hand, for a city with a population less than 50,000, where it is possible to drive virtually anywhere in the city in 10 to 15 minutes, the walk and wait time for transit by itself is nearly as much as the total automobile travel time, and the calculated LOS will suffer as a result. In general, for small cities or for short trips, the total transit travel time will generally be significantly longer than the automobile travel time. Since transit‐auto travel time is a system measure, its data requirements are greater than those for transit stop and route segment measures. This section presents two methods

FDOT TQoS Applications Guide – Pilot Workshop Draft September 4, 2007
FDOT Public Transit Office 54
for calculating transit‐auto travel time LOS: one uses a transportation planning model and the other is done by hand. As with many of the other service measures, transit‐auto travel time can be measured at different times of the day, for example, at peak and off‐peak times. Because peak hour traffic congestion tends to lengthen automobile trip times, the calculated LOS will often be better during peak hours than during the rest of the day. Table 19 provides the transit‐auto travel time TCQSM LOS thresholds.
Table 20- Transit-Auto Travel Time LOS Standards
LOS Travel Time Difference (min)
Comments
A 0 Faster by transit than by automobile B 1-15 About as fast by transit as by automobile C 16-30 Tolerable for choice riders D 31-45 Round-trip at least an hour longer by transit E 46-60 Tedious for all riders; may be best possible in
small cities F >60 Unacceptable to most riders
Source: TCQSM, 2nd Edition Example Calculations Transportation Planning Model Method The advantage of using a transportation planning model is that all trips between all zones can be modeled, and different kinds of trip types can be compared. Since many urban areas only have a weekday p.m. peak hour model, though, travel times at other times of the day and week cannot be compared using this method. The transportation model used needs to include networks for both roadways and transit. Step 1: Calculate travel time differences between zones. Use the transportation planning model to generate (1) a table of automobile travel times between each pair of zones and (2) a table of transit travel times between each pair of zones. Subtract the values in the transit table from the values in the automobile table to obtain travel time differences between each pair of zones. Step 2: Calculate total person trips between zones. From the model, generate a table of total person trips (both automobile and transit) between each pair of zones. Step 3: Calculate the weighted average of travel time differences. For each pair of zones, multiply the travel time difference between the zones by the number of person trips between the zones. Sum all of the resulting values and divide by the total number of person trips that took place. The result is a systemwide weighted average travel time difference, which can then be used with Table 12 to calculate a systemwide LOS.
FDOT TQoS Applications Guide – Pilot Workshop Draft September 4, 2007
FDOT Public Transit Office 55
Manual Method The manual method is useful in areas without a transportation model or when a faster assessment of travel time LOS is desired. A sampling of about 10‐15 locations should be used for the analysis. If a metropolitan area is being studied, the CBD and 10‐15 suburbs should be used; if an individual city is being studied, the CBD and 10‐15 important trip generators should be used. Unless there is a heavy reverse direction volume during the analysis period, or the reverse volume is of interest to the analysis (for example, for welfare‐to‐work applications), estimating peak direction travel times is usually sufficient. Step 1: Estimate travel times between locations. Analysts may find it useful to sketch two simple network diagrams of the area being studied, one for transit and one for automobiles, and to indicate travel times on the links between locations. Analysts may also find it useful to create a spreadsheet of travel times between locations for use in subsequent steps. During Step 1, only travel times between locations and transfer times are considered; access and wait times are not considered. For an analysis of existing conditions, transit travel and transfer times can be derived from published schedules; automobile travel times can be determined by driving the main routes between locations. When a choice of transit routes is available, the fastest route (e.g., an express route) should be selected. Step 2: Estimate travel time differences between locations. For each pair of locations, subtract the auto travel time from the transit travel time; add transit access, wait, and transfer times; and subtract any auto access time (e.g., walks to or from parking garages). Step 3: Calculate the level of service. Average the travel time differences of each pair of locations and use the resulting system value with Table 12, or calculate point‐to‐point LOS directly from Table 12.
4.2 Demand-Responsive Transit This section describes calculation procedures for evaluating quality of service for demand‐responsive transportation (DRT). It can also be used for evaluating specialized transportation services, including ADA paratransit. However, it must be recognized that specialized services are, by definition, provided to specific user groups and are not available to the general public. ADA paratransit service, in particular, is heavily regulated, and transit systems must ensure compliance with the federal regulations or face potential legal ramifications. However, for an assessment of service quality from the same perspective of the DRT evaluation framework, the methodology described in this section could be used for ADA paratransit.

FDOT TQoS Applications Guide – Pilot Workshop Draft September 4, 2007
FDOT Public Transit Office 56
Response Time Response time is the minimum amount of time a user needs for scheduling and accessing a trip or the minimum advance reservation time. This measure is most appropriate where most of the trips are scheduled each time that the user wants to travel. In other words, it is less appropriate where most of the trips are provided on a standing‐order, subscription basis, where riders are picked up on pre‐scheduled days at pre‐scheduled times and do not need to call in advance for each trip. Nevertheless, the measure could be used where subscription service is provided. For such DRT services, response time could be calculated for the situation when a trip request is first made. Table 20 shows the response time associated with each LOS.
Table 21- DRT Response Time LOS
LOS Response Time Comments
1 Up to ½ hour Very prompt response; similar to exclusive-ride taxi service
2 More than ½ hour, and up to 2 hours
Prompt response; considered immediate response for DRT service
3 More than 2 hours, but still same day service
Requires planning, but one can still travel the day the trip is requested
4 24 hours in advance; next day service Requires some advance planning
5 48 hours in advance Requires more advance planning than next-day service
6 More than 48 hours in advance, and up to 1 week Requires advance planning
7 More than 1 week in advance, and up to 2
weeks
Requires considerable advance planning, but may still work for important trips needed soon
8 More than 2 weeks, or not able to accommodate trip
Requires significant advance planning, or service is not available at all
Source: TCQSM, 2nd Edition Assessment of response time should be based on actual operating experience. It should not be based solely on the stated policy of the DRT system. To calculate this measure, the DRT provider should look at the minimum amount of time that a user needs to schedule a trip in relation to the response time policy. For example, if the stated policy of the DRT system is that service is provided 24 hours in advance, then the provider should determine if users can systematically schedule a trip the day before the trip is desired. Some portion of users will schedule trips more than 24 hours in advance, but if the policy is 24 hours in advance, then a user should be able to reserve a trip the day before the desired trip. Information on response time can be obtained from DRT staff that book trips, typically telephone reservationists/schedulers or dispatchers. Another approach is to survey riders to obtain their input and experience with response time.
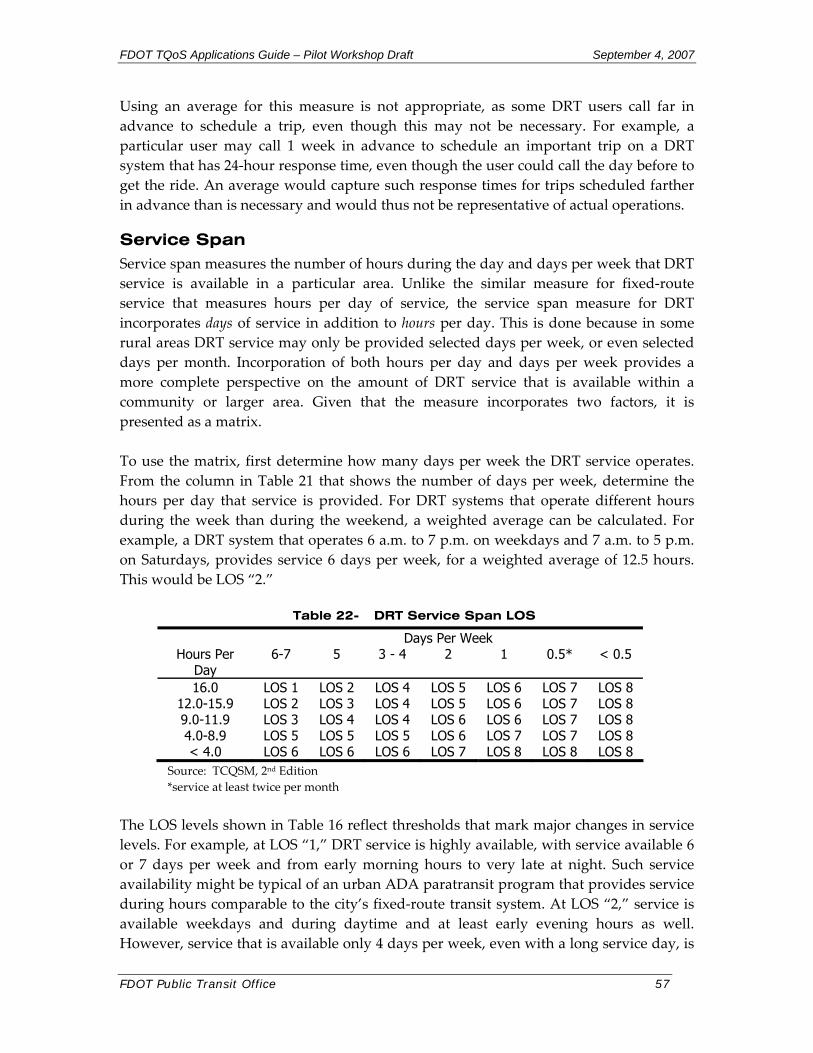
FDOT TQoS Applications Guide – Pilot Workshop Draft September 4, 2007
FDOT Public Transit Office 57
Using an average for this measure is not appropriate, as some DRT users call far in advance to schedule a trip, even though this may not be necessary. For example, a particular user may call 1 week in advance to schedule an important trip on a DRT system that has 24‐hour response time, even though the user could call the day before to get the ride. An average would capture such response times for trips scheduled farther in advance than is necessary and would thus not be representative of actual operations.
Service Span Service span measures the number of hours during the day and days per week that DRT service is available in a particular area. Unlike the similar measure for fixed‐route service that measures hours per day of service, the service span measure for DRT incorporates days of service in addition to hours per day. This is done because in some rural areas DRT service may only be provided selected days per week, or even selected days per month. Incorporation of both hours per day and days per week provides a more complete perspective on the amount of DRT service that is available within a community or larger area. Given that the measure incorporates two factors, it is presented as a matrix. To use the matrix, first determine how many days per week the DRT service operates. From the column in Table 21 that shows the number of days per week, determine the hours per day that service is provided. For DRT systems that operate different hours during the week than during the weekend, a weighted average can be calculated. For example, a DRT system that operates 6 a.m. to 7 p.m. on weekdays and 7 a.m. to 5 p.m. on Saturdays, provides service 6 days per week, for a weighted average of 12.5 hours. This would be LOS “2.”
Table 22- DRT Service Span LOS
Days Per Week Hours Per
Day 6-7 5 3 - 4 2 1 0.5* < 0.5
16.0 LOS 1 LOS 2 LOS 4 LOS 5 LOS 6 LOS 7 LOS 8 12.0-15.9 LOS 2 LOS 3 LOS 4 LOS 5 LOS 6 LOS 7 LOS 8 9.0-11.9 LOS 3 LOS 4 LOS 4 LOS 6 LOS 6 LOS 7 LOS 8 4.0-8.9 LOS 5 LOS 5 LOS 5 LOS 6 LOS 7 LOS 7 LOS 8 < 4.0 LOS 6 LOS 6 LOS 6 LOS 7 LOS 8 LOS 8 LOS 8
Source: TCQSM, 2nd Edition *service at least twice per month
The LOS levels shown in Table 16 reflect thresholds that mark major changes in service levels. For example, at LOS “1,” DRT service is highly available, with service available 6 or 7 days per week and from early morning hours to very late at night. Such service availability might be typical of an urban ADA paratransit program that provides service during hours comparable to the city’s fixed‐route transit system. At LOS “2,” service is available weekdays and during daytime and at least early evening hours as well. However, service that is available only 4 days per week, even with a long service day, is

FDOT TQoS Applications Guide – Pilot Workshop Draft September 4, 2007
FDOT Public Transit Office 58
LOS “4.” Service availability less than once per week is LOS “7” or “8.” While this amount of service may be the best that can be provided in a rural area given low population densities and limited funding, it is not desirable from the user’s perspective. This measure can also be used to assess any differences in service availability across a transit agency’s service area. For example, a transit agency serving a large county that includes several small communities may establish different service spans within different parts of the county. The communities in the county may receive DRT service on a more frequent basis than the outlying rural parts of the county. In such a case, the communities in the county would have a higher LOS on the service span measure than would the rural parts of the county. From the user’s perspective, DRT service in the communities is higher quality than that in the rural areas, as the service span is greater.
Reliability Reliability of DRT is a critical issue from the user’s perspective. Because of the nature of DRT, where a user must schedule individual trips, there is more variability in DRT operations than for fixed‐route service. For fixed‐route bus service, a rider simply walks out to a marked bus stop along the published route a few minutes before the published or estimated time that the vehicle will pass by. For DRT service, there are several steps involved in taking a trip, each with reliability issues. The user must call or contact the DRT office to request the particular trip. Depending on available capacity of the DRT system, the user may or may not be able to reserve a trip. If there is capacity, the trip may or may not be available at the exact time the user requests. Once the trip is booked, the user must wait for the vehicle and driver to arrive at the scheduled time (often this is a window of time rather than an exact time). The vehicle and driver may arrive on time (within the window) or late, or there may be times when the vehicle does not arrive at all. Once aboard the vehicle, the user then rides until arrival at the scheduled destination, which will take a varying amount of time depending upon other riders who might be sharing the vehicle and their trip characteristics. If everything goes as scheduled, the user arrives at his or her destination on time. Given the various steps involved within a DRT trip, reliability is assessed with two measures: on‐time performance and trips not served. On-Time Performance On‐time performance measures the degree to which DRT vehicles arrive at the scheduled times. The measure is calculated at the pick‐up location and, for time‐sensitive trips (e.g., medical appointments, work, school, etc.), at the drop‐off location as well.

FDOT TQoS Applications Guide – Pilot Workshop Draft September 4, 2007
FDOT Public Transit Office 59
Many DRT systems, particularly those in urban areas, give users a “window of time” that the vehicle will arrive. For example, if a user requests a 10 a.m. pick‐up, the scheduler or dispatcher might tell that user that the vehicle can be expected between 9:45 and 10:15 a.m. If the vehicle arrives any time within that 30‐minute window, it is considered on time. Calculating on‐time performance is done on a percentage basis for all trips during the defined time period or for a sample of trips over the time period. All trips should be assessed at the pick‐up end to determine whether they are within the on‐time window. Time‐sensitive trips would be assessed at the destination end to see if the vehicle arrived at or before the required time. The window of time can be determined by the local system. Particularly in larger DRT systems, the on‐time window is 30 minutes; however, some DRT systems use a shorter 20‐minute or 15‐minute window for scheduling trips and assessing timeliness. In some rural areas, DRT systems may have a much longer window—60 minutes, for example. Shorter windows provide a higher service quality to users, as the users’ waiting period for service is shorter. Those DRT systems that use a longer window should provide a higher percentage of trips on time, given the longer time frame allowed for arriving at the scheduled locations. Thus, the LOS thresholds given in Table 22 may need adjustment depending upon the definition of on‐time.
Table 23- DRT On-Time Performance LOS
LOS On-Time Percentage Comments* 1 97.5-100.0% 1 late trip/month 2 95.0-97.4% 2 late trips/month 3 90.0-94.9% 3-4 late trips/month 4 85.0-89.9% 5-6 late trips/month 5 80.0-84.9% 7-8 late trips/month 6 75.0-79.9% 9-10 late trips/month 7 70.0-74.9% 11-12 late trips/month 8 <70.0% More than 12 late
trips/month NOTE: Based on 30‐minute on‐time window. *Assumes user travels by DRT round trip each weekday for one month, with 20 weekdays/month. Source: TCQSM, 2nd Edition
Given the variability of DRT service operations on a day‐to‐day basis including the unpredictability of dwell times for individual DRT riders, the shared‐ride nature of the service, and the vagaries of traffic, particularly in urban areas, achievement of LOS “1” is very high quality service and certainly difficult to achieve in an urban area. In smaller communities, LOS “1” would be more achievable. For a user riding DRT round‐trip each weekday for 1 month, LOS “1” would mean no more than one late trip experienced by that user during the month. At LOS “2,” 95% of trips are on‐time, still high‐quality service. At LOS “3,” 90% of trips are on‐time. While this measure does not assess how

FDOT TQoS Applications Guide – Pilot Workshop Draft September 4, 2007
FDOT Public Transit Office 60
late the late trips are, assuming that they are not more than 15 to 30 minutes late, then the DRT service may still be relatively good from the user’s perspective. At LOS “4,” more trips are outside the on‐time window, resulting in less timeliness and reliability for users. For the remaining LOS thresholds, the percentage of trips arriving within the window decreases, until LOS “8,” where less than 70% of trips are on‐time. For a regular user, riding the DRT system on a daily basis to school, for example, this would mean that in a given month more than 12 trips would be late.
Trips Not Served: Trips Denied and Missed Trips Trips not served includes two components: (1) trips turned down or denied when requested because of a lack of capacity and (2) missed trips, which are those booked and scheduled but the vehicle does not show up. From a user’s perspective, a DRT system is reliable if that user can book a trip when needed and the vehicle shows up when scheduled—in other words, no (or very minimal) trips not served. Conversely, the DRT service is unreliable if the user cannot obtain a trip—either because the trip is denied or because the vehicle never shows up for the scheduled trip. Some DRT providers try to avoid denials by over‐accepting trips, which then results in missed trips, as there is inadequate capacity. Other DRT providers may have a higher number of denials in order to guarantee capacity to serve those trips that they do accept, with a resulting minimal number of missed trips. This composite measure of trips not served captures both circumstances—denials and missed trips—which result in the same consequence for the user: a trip not served. Table 18 provides the LOS thresholds for trips not served.
Table 24- DRT Trips Not Served LOS
LOS Percent Trips Not Served
Comments*
1 0-1% No trip denials or missed trips within month 2 >1%-2% 1 denial or missed trip within month 3 >2%-4% 1-2 denials or missed trips within month 4 >4%-6% 2 denials or missed trips within month 5 >6%-8% 3 denials or missed trips within month 6 >8%-10% 4 denials or missed trips within month 7 >10%-12% 5 denials or missed trips within month 8 >12% More than 5 denials or missed trips within
month NOTE: Trips not served include trip requests denied due to insufficient capacity, and missed trips. *Assumes user travels by DRT round trip each weekday for one month, with 20 weekdays/month. Source: TCQSM, 2nd Edition
At LOS “1,” DRT service is very reliable, with no or very isolated denials or missed trips. This is high‐quality service, where the DRT system is able to successfully provide capacity for the varying levels of demand throughout the day and ensure effective on–street operations with no or a minimal number of missed trips. LOS “2” service is still quite reliable. From the perspective of a user who travels by DRT each weekday without
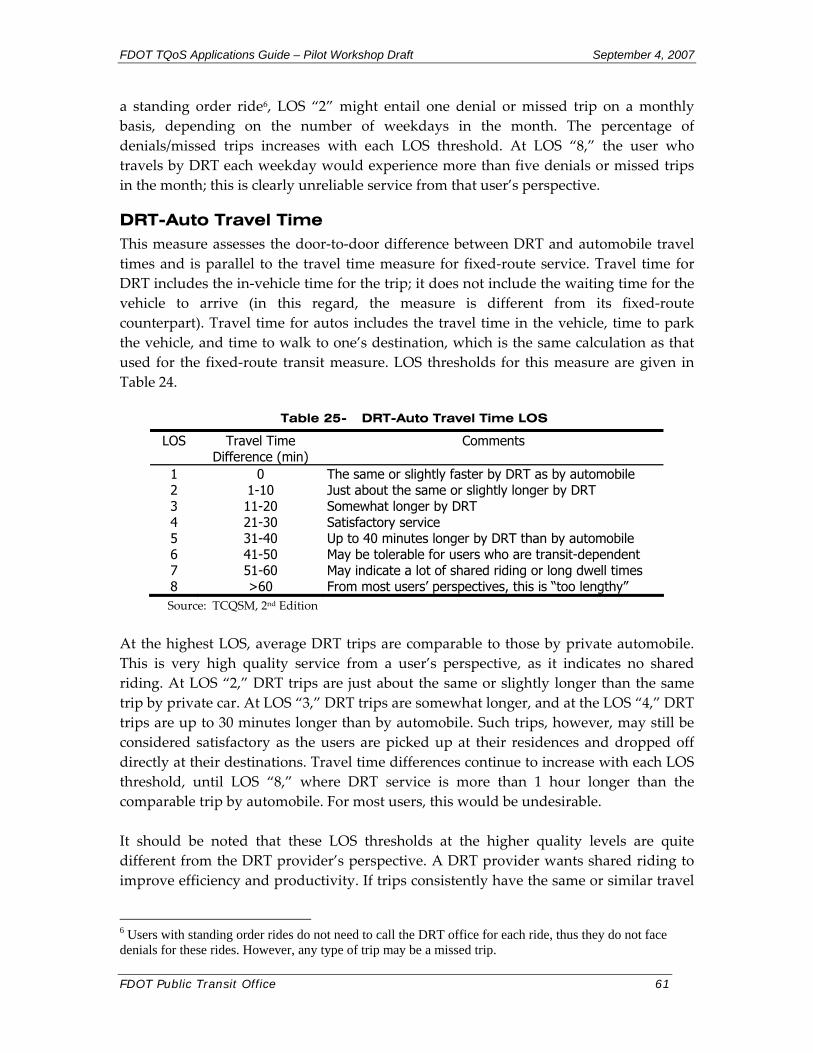
FDOT TQoS Applications Guide – Pilot Workshop Draft September 4, 2007
FDOT Public Transit Office 61
a standing order ride6, LOS “2” might entail one denial or missed trip on a monthly basis, depending on the number of weekdays in the month. The percentage of denials/missed trips increases with each LOS threshold. At LOS “8,” the user who travels by DRT each weekday would experience more than five denials or missed trips in the month; this is clearly unreliable service from that user’s perspective.
DRT-Auto Travel Time This measure assesses the door‐to‐door difference between DRT and automobile travel times and is parallel to the travel time measure for fixed‐route service. Travel time for DRT includes the in‐vehicle time for the trip; it does not include the waiting time for the vehicle to arrive (in this regard, the measure is different from its fixed‐route counterpart). Travel time for autos includes the travel time in the vehicle, time to park the vehicle, and time to walk to one’s destination, which is the same calculation as that used for the fixed‐route transit measure. LOS thresholds for this measure are given in Table 24.
Table 25- DRT-Auto Travel Time LOS
LOS Travel Time Difference (min)
Comments
1 0 The same or slightly faster by DRT as by automobile 2 1-10 Just about the same or slightly longer by DRT 3 11-20 Somewhat longer by DRT 4 21-30 Satisfactory service 5 31-40 Up to 40 minutes longer by DRT than by automobile 6 41-50 May be tolerable for users who are transit-dependent 7 51-60 May indicate a lot of shared riding or long dwell times 8 >60 From most users’ perspectives, this is “too lengthy” Source: TCQSM, 2nd Edition
At the highest LOS, average DRT trips are comparable to those by private automobile. This is very high quality service from a user’s perspective, as it indicates no shared riding. At LOS “2,” DRT trips are just about the same or slightly longer than the same trip by private car. At LOS “3,” DRT trips are somewhat longer, and at the LOS “4,” DRT trips are up to 30 minutes longer than by automobile. Such trips, however, may still be considered satisfactory as the users are picked up at their residences and dropped off directly at their destinations. Travel time differences continue to increase with each LOS threshold, until LOS “8,” where DRT service is more than 1 hour longer than the comparable trip by automobile. For most users, this would be undesirable. It should be noted that these LOS thresholds at the higher quality levels are quite different from the DRT provider’s perspective. A DRT provider wants shared riding to improve efficiency and productivity. If trips consistently have the same or similar travel
6 Users with standing order rides do not need to call the DRT office for each ride, thus they do not face denials for these rides. However, any type of trip may be a missed trip.
FDOT TQoS Applications Guide – Pilot Workshop Draft September 4, 2007
FDOT Public Transit Office 62
time as trips by auto, it indicates that the scheduling/dispatch function is failing to group rides. One of the skills for scheduling/dispatching is balancing the degree of shared riding with travel times for individual riders. Calculation of the measure is done in a similar way as that for fixed‐route transit as described in Chapter 3. To determine the difference in travel time, both the DRT travel time and auto travel time need to be calculated. To calculate DRT travel time, select a sample of about 10 to 15 origin and destination pairs, reflecting various neighborhoods throughout the community or service area and common destinations, perhaps a frequented shopping mall and major medical facility. With actual operating data on trip travel times from driver manifests, dispatcher records, or Mobile Data Terminals (MDTs) if available, calculate average travel times for a sample of users between the selected origin‐destination pairs. For auto travel time, it is suggested that the manual method described in Chapter 3 be employed. This straightforward method involves simply driving the main route between the selected origin‐destination pairs. Any auto access time at the origin or destination end must also be added into the auto travel time to ensure measurement of door‐to‐door travel time. This access time is assumed to be 3 minutes. With the average travel times for both DRT and auto between the selected locations, the next step involves calculating the time difference between the two modes for each origin‐destination pair. Then, average the travel time differences to compute the average travel time difference between DRT and private auto. Use this average time difference to determine the LOS as indicated in Table 24.
References Pushkarev, Boris and Jeffrey M. Zupan, Public Transportation and Land Use Policy, Indiana University Press, Bloomington, IN (1977). Nelson\Nygaard Consulting Associates, TriMet Primary Transit Network Phase II Report, Portland, OR (1997). Ewing, Reid, Best Development Practices, APA Planners Press, Chicago, IL (1996). Highway Capacity Manual. TRB, National Research Council, Washington, DC (2000). Kittelson & Associates, Inc. and URS, Inc., Transit Level of Service (TLOS) Software User’s Guide, Version 3.1, Florida Department of Transportation, Public Transit Office, Tallahassee, FL (2001). http://www.dot.state.fl.us/transit/Pages/TLOS%20Software%20Users%20Guide.pdf