Embed Size (px)
Citation preview

Intellimotion vol.7 no. 2 1998
continued on page 2
Research Updates inIntelligent TransportationSystems
Volume 7 No. 21998
Transit Research Issue
Page 1Automating Bus Docking to ImproveTransit Service
Page 4Improving Transit Access for the Blindand Vision Impaired
Page 6Control Strategies for Transit Priority
Page 8PATH Makes Big Splash atNetherlands Demo
Page 12PATH Presentations
Page 14PATH on Paper
Page 16PATH Welcomes Greg Larson asNew Caltrans Management Liaison
PATH – Partners for Advanced Transitand Highways – is a joint venture ofCaltrans, the University of California,other public and private academic insti-tutions, and private industry, with themission of applying advanced technol-ogy to increase highway capacity andsafety and to reduce traffic congestion,air pollution, and energy consumption.
The technology needed to build automated
buses has matured and been demonstrated,
but transit operators still need to determine
specific ways in which automating buses can im-
prove service. Improved service should result in
increased ridership, especially from people who
ride buses by choice rather than out of necessity.
For instance, service can be improved by increas-
ing accessibility and by integrating bus operation
with other modes of transportation, such as sub-
ways and light rail transit.
Low-floor buses were a major advance in improv-
ing bus accessibility. These buses, pioneered by the
German manufacturer NEOPLAN, permit passengers
to board and alight on the level, without stepping
up or down from the sidewalk at the bus stop dock-
ing platform. Level boarding also reduces dwell time
— the time a bus spends at a stop. However, if the
bus pulls up too far from the curb, and the hori-
zontal gap between bus door and curb is too wide,
passengers must first step down to the pavement,
rather than across to the bus. Even a small gap could
lead to a passenger’s falling between the bus and
platform, or tripping on the edge of the bus or curb.
For some transit users, such as the vision impaired,
children, the elderly, or people in wheelchairs, any
gap could be a hazard. By automating the docking
Automating Bus Docking to Improve Transit ServiceJ. Bret Michael, PATH/Naval Postgraduate School
process whereby a bus pulls up to a bus stop, buses
can be made to dock consistently at precisely the
desired distance to the curb. This article describes
two types of automated docking systems, and sum-
marizes the safety research on this topic conducted
by the California PATH Program.
Automated Docking SystemsTwo types of systems have been developed to elimi-
nate the horizontal gap between bus and docking
platform. One, a docking assistance system, tells
the driver where the bus is with respect to the dock-
ing point. For example, the French National Insti-
tute for Transportation and Safety Research (Institut
National de Recherche sur les Transports et leur
Sécurité — INRETS) has evaluated, as part of the
GIBUS (Guidage des autobus en station) project,
an electronic horizontal display mounted on the
dashboard of the bus. This display indicates the
lateral distance from bus to docking point, and has
been field tested in Grenoble.
The other type of docking system provides for full
or partial-authority automatic control of the bus
during docking: the bus driver lets the automated
system drive, or at least steer, the bus. The VISEE
system developed by Renault, for example, uses a
partial-authority, vision-based control system to
Intellimotion vol. 7 no. 2 19982
steer the bus into the desired docking position.
While the system steers, the driver controls the
throttle and brakes. Renault, in cooperation with
MATRA, is also working on a full-authority elec-
tronic-vision based system known as Civis, with
testing underway in Paris and other French cities.
Cegelec AEG has adapted the fully automated ve-
hicle technology it developed for Channel Tunnel
service vehicles for use by full-size transit buses.
The bus follows two electronic guide wires embed-
ded in the roadway. Speed is controlled either by
the system (using a pre-programmed profile) or the
driver. The Cegelec system has been field tested in
Newcastle, England, on a Mercedes-Benz bus.
PATH is experimenting with a precision docking sys-
tem, in which the vehicle follows magnets buried
in the pavement. PATH researchers have demon-
strated the ability to maneuver a passenger car
(Buick LeSabre) very accurately at low speeds, as a
kind of simulation of a docking maneuver. The car
follows an S-shaped trajectory, analogous to that of
a bus approaching a curbside bus stop, with a con-
sistency of better than 1 cm (Figure 1). Researchers
expect to be able to repeat this precision docking
with a bus as soon as one becomes available. PATH
is also investigating design alternatives for fully au-
tomated busways (automated highway system lanes
dedicated to carrying bus traffic).
The systems mentioned above are based on the con-
cept of electronic guidance, but mechanically based
bus guidance systems are still being refined. In the
1980s, the O-Bahn automated bus system, which
uses guide wheels with mechanical arms for lateral
control, drew the attention of the transit commu-
nity and was put into service in Essen, Germany,
and Adelaide, Australia. The system was not widely
deployed, primarily for nontechnical reasons. In
1997, Bombardier introduced a light transit vehicle
guided by a single central rail, instead of costly,
load bearing double tracks. The Bombardier GLT,
like the Civis system, can be operated under manual
steering control. Both systems compete with light-
rail systems (or trams). Scott McIntosh of London
Transport Planning has pointed out that although
trams have many appealing characteristics, such as
predictable paths of travel, electronically guided
rubber-tired buses can provide the same service at
less cost.
Safety ConcernsThe systems mentioned above are not considered
to be mature in terms of operational experience:
docking systems’ safety must still be evaluated in
the environment of their intended use. For ex-
ample: in the United Kingdom, the certification and
regulation of signaling systems for electronically
controlled rubber-tired buses falls under the juris-
diction of Her Majesty’s Railway Inspectorate
(HMRI), which bases its decisions about certifica-
tion and other safety matters on its evaluations of
“safety cases.” A safety case consists of recommen-
dations as to a system’s fitness for use in specific
operational contexts. The system’s fitness is pre-
sented in terms of arguments as to how well safety
issues have been assessed, and to what extent the
implementation of the system addresses safety con-
cerns. Each safety case also includes all evidence
supporting the arguments, such as a safety plan,
results from a preliminary safety analysis, and
records of safety reviews and incidents.
Safety CasesPATH has investigated ways to collect, manage, and
present safety information about automated dock-
ing systems to regulatory, certification, and other
decision-making bodies. The work to date has fo-
cused on French and British standards, practices,
techniques, and tools for constructing and main-
continued from page 1
Left to right:Figure 1–PATH automated test carfollows magnets in roadway tosimulate bus docking.Figure 2–Near-side bus zone withillegally parked car.Figure 3–Nub stop and queue-jumper lane (ahead of stop). Notetruck parked in bus zone.Figure 4–Passengers boarding busin street.Figure 5–Buses arriving in tandem.

vol. 7 no. 2 1998 Intellimotion 3
taining safety cases for driverless subway systems.
Key findings include:
• Because each safety case may need to be pre-
sented to different audiences, a “pre-safety case”
could be used to pre-plan the structuring of the
safety case to support the generation of different
views that could then be addressed in an effective
presentation tailored to a specific audience. The
Human Communication Research Centre at the
University of Edinburgh has done extensive re-
search on this topic.
• Each safety case is a “living” record: it must
document all changes to the system, all incidents,
and other safety-relevant information. Paper-
based safety cases have been difficult and tedious
to assemble and maintain over the lifetime of a
system, but computer-based tools have now been
introduced for constructing, storing, and man-
aging safety cases. The Safety Argument Manager
developed at the University of York (England)
consists of a suite of tools for inputting safety
analysis information and tracing this information
back to system requirements and designs.
• Partitioning system functions into different cat-
egories can be a useful way of focusing the safety
case on a system’s most critical functions. Safety
cases for French driverless subway systems center
on the automatic train protection system, which
is responsible for hazard monitoring, emergency
braking, and power shutdown, as opposed to au-
tomatic train operation and other functions.
• In France, system developers of fully automated
subways work directly with independent evalua-
tors appointed by the Ministry of Transportation,
who provide the developer with non-binding sug-
gestions for improving the safety case. After this
feedback process, the evaluators recommend that
the Ministry either approve or deny certification.
The Ministry does not dictate, via standards or other
means, the contents of the safety case or the man-
ner in which it is presented: this is left up to the
independent evaluators and system developers.
• In the United Kingdom, by contrast, there are
standing regulatory and certification authorities for
all rail-based systems, in addition to a large body of
industry standards and guidelines. However, stan-
dards for certain aspects of such novel systems as
automated buses do not exist. They are expected to
be developed as the systems are introduced.
Field ObservationsTo develop an initial set of safety considerations
upon which to build safety cases for automated bus
docking systems, field observations of manual bus
docking were made in downtown San Francisco. This
area has a high volume of transit bus and other traf-
fic, including pedestrians and bicyclists. Five sites
were chosen to observe bus docking for different
docking configuration-location pairs: near-side at
curb (Figure 2), far-side at curb (see cover photo), nub
with queue-jumper lane (Figure 3), and open bay.
Some hazardous conditions observed included: ve-
hicles parked illegally in the bus docking zone (Fig-
ure 2), bus drivers permitting passengers to board
and alight in the street (Figure 4), vehicles making
U-turns, construction barriers forcing drivers to ap-
proach a bus stop at a sharp angle, resulting in a
large gap between bus and curb, vehicles pulling
out of driveways that are partially screened from
the driver’s view, a truck stopped in front of a nub
stop (Figure 3), pedestrians jaywalking as a bus ap-
proaches a far-side stop (see cover photo), and buses
arriving in tandem with pedestrians standing at the
edge of the curb (Figure 5).
continued on page 15

Intellimotion vol. 7 no. 2 19984
Signs, both written and iconic, guide us
through unknown environments. We use
them to identify street intersections, build-
ings, transit stops, different transit vehicles, and
amenities such as telephones, fare, and information
booths. People who can’t read signs — the dyslexic,
the illiterate, the developmentally disabled, people
with brain trauma — experience difficulty travel-
ing through unknown territory. The 8-9 million
blind and visually impaired people in the United
States face greater problems. They do not get the
information embedded in signs, and receive few
other cues to the environment around them. They
are denied cues about pathways and traffic flows,
both vehicle and pedestrian. They can’t see buses
or other transit vehicles, can’t find doors, eleva-
tors, and other building amenities. This lack of
easy and safe access to urban travel and public
transit is certainly one reason why only 26 percent
of working-age people who can’t read newsprint
are employed.
How can we improve access for these groups? The
Americans with Disability Act of 1990 mandated
equal access for all to transit and public buildings.
Ramps, curb cuts, and lifts have replaced structural
barriers, such as stairs and curbs, for those in wheel-
chairs. But print-handicapped and vision-impaired
people still face functional barriers to equal access.
How do blind people find their way, facing these
problems of mobility, wayfinding, and exploration?
Long canes and guide dogs help a person avoid ob-
jects and danger within a few feet, but give no cues
to the more distant environment. If a person can’t
find a bus stop, identify a transit vehicle, or find a
building or its entrance, they are denied equal ac-
cess to transit and public buildings.
Our research identifies and evaluates a new tech-
nology to allow safe and easy access for the blind
and vision impaired, Remote Infrared Signage Sys-
tems (RISS), or Talking Signs®. Each of these signs
consists of an infrared transmitter that continuously
beams a signal. A hand-held receiver picks up the
beam and converts it into a spoken message that
can be heard when the receiver is pointed at the
Improving Transit Access for the Blindand Vision ImpairedJames R. Marston and Reginald G. Golledge, Geography, UC Santa Barbara
transmitter. This gives the user a directional beam
to the sign, as well as the sign’s content or name.
Test 1-AWe conducted two tests, using 10 blind subjects and
10 blindfolded sighted subjects. The first involved
walking around a simple geometric path, either a
60' x 60' (18m x 18m) square or a 60' x 30' (18m x
9m) rectangle. A 36" (1m) high stanchion marked
each corner of the shape. Subjects were led around
the path three times using sighted guide techniques.
Subjects swung a long cane ahead as they walked in
order to help find the stanchion. Subjects identified
the shape as they walked, and then were asked to
walk the path on their own. They were pointed at
the first stanchion, but received no further infor-
mation during each attempt. People in the baseline
condition made two attempts to recreate the path
in a forward direction and one attempt in the re-
verse direction. If the stanchion was not found
within 60 seconds, subjects were told to stop and
search for the next stanchion. Response times, angle,
and distance errors were recorded for all stanchions.
The blindfolded sighted subjects found 14 stan-
chions out of a possible 120 (10 subjects x 4 stan-
chions x 3 attempts). The blind subjects found 35
out of a possible 120 stanchions. Most successes
occurred on the first leg, after the subjects had been
pointed toward the first stanchion. We examined
the response time, distance and angle error, means,
and variance between the blindfolded sighted and
the blind, and found no significant differences, al-
though the means for the blind were often less than
the means for the sighted.
Test 1-BWe next tested our 20 subjects using a Remote In-
frared Signage System (Talking Signs®). After five
minutes of hands-on training, the subjects were led
around a different geometric shape one time and
identified the shape. They were then given the re-
ceiver and retraced their path on their own. After
one forward path retrace, they retraced the path in
the reverse direction. The results were very signifi-
cant: all 20 subjects found every stanchion. There
Our researchidentifies andevaluates a newtechnology toallow safe andeasy access for theblind and visionimpaired.

vol. 7 no. 2 1998 Intellimotion 5
was therefore no angle or distance error. Average
response times for retracing the rectangle were 205
seconds without Talking Signs (R) and fell to 71 sec-
onds with them, a difference of 134 seconds or 65%
less time to walk the same path. The results were
significant at the 0.0001 level.
Bus TestThe next day, our subjects were blindfolded and
taken to the university’s bus circle. This busy bus
stop is used by over 5000 riders per day and is
served by nine different bus lines, so there are of-
ten several buses waiting at the circle. Three RISS
transmitters were set up to guide subjects around
the test path, halfway around the circular sidewalk.
All subjects were walked around the half circle two
times for practice. This task was made more diffi-
cult because there were no straight lines, and a
planter and tree were in the middle of the path.
The subjects also had to cross two access drives.
Two buses on the Number 9 line were equipped
with RISS transmitters, which were installed on the
front and side window, directly to the rear of the
door. Subjects were told where on the bus the two
receivers were located, but were not given any prac-
tice in locating the door. In the first trial, subjects
waited at the start position, and as each bus was
heard coming into the circle they pointed the re-
ceiver at the sound. When their receiver picked up
the message from the Number 9 bus, they began
walking toward the transmitters that guided them
along the sidewalk. The verbal message broadcast
by those signs said “Sidewalk to Bus Stop.” When
the subjects got to the bus stop area, they began to
scan for the transmitter on the side of the bus. The
task ended when they reached the proper bus and
put their cane inside the doorway. Response times
from first identifying the bus to reaching the door-
way were recorded.
In the second bus trial, subjects used their normal
techniques, which meant asking a passerby (the re-
searcher) which bus was coming. Subjects then
walked from the start position to the bus stop. Here
they had to find the door and then ask the driver
which bus it was. If it was the proper bus, the trial
stopped. If it was the wrong bus, they walked to the
next bus in line and asked again for confirmation.
(This is what happens in real life at busy bus stops.
A blind person must approach each bus and ask the
driver which bus it is.)
The third bus trial was identical to the first. Table
1-A shows the number of people that found the
proper bus. The success rate when using the Remote
Infrared Signage System is clearly evident. A nomi-
nal logistic model (Table 1-B) comparing success rate
Table 1-ASuccess at Finding Proper Bus (Success / Attempts)
Blind Blindfolded
Trial 1 (RISS) 10/10 5/9Trial 2 (No RISS) 8/10 2/9Trial 3 (RISS) 10/10 7/9
Table 1-BNominal Logistic ModelSuccess by Vision (Blind/Sighted) and Aid (RISS/NoRISS)
Both DF =2 Chi Sq = 22.24 Sig=<0.0001Vision DF =1 Chi Sq = 10.08 Sig=0.0015Aid DF =1 Chi Sq = 6.80 Sig=0.0091
continued on page 11
Left: Bus test–TalkingSigns® transmitters wereinstalled on front and side ofbuses on the #9 line atUCSB. Blind or blindfoldedsubjects used receivers tofind the correct bus.Above: Prof. Golledge andPATH researcher Robert Tamdemonstrate Talking Signs®system.

Intellimotion vol. 7 no. 2 19986
New technological approaches for improv-
ing urban transportation systems are being
given considerable attention by trans-
portation managers because of limited funding
and concerns about the environmental effects of
constructing new highway facilities. One viable
approach is implementing advanced control strat-
egies on roads controlled by traffic signals to give
priority to transit vehicles. Transit, for the purposes
of this study, is defined as buses (and light rail)
that share the roadway with other vehicles. The
objectives of this study are to examine strategies
for transit priority in arterials and grid systems con-
trolled by traffic signals.
Giving priority to transit reduces unnecessary de-
lays and stops at traffic signals, improves transit
travel times, and cuts fuel consumption and emis-
sions. As a consequence, it would improve service
reliability, increase ridership, reduce transit agen-
cies’ operating costs, and maximize the passenger-
carrying capacity of urban arterials and networks.
Advanced control strategies could also improve the
ability of surface streets to serve as alternate routes
for freeways during major incidents.
Transit Priority StrategiesInfrastructure design for transit priority normally
involves exclusive lanes for transit on arterials, as
well as street designs to facilitate transit move-
ments. Examples include bus bays and bus bulbs
(widened sidewalks at bus stops) to facilitate safe
loading and reduce conflicts with other vehicles.
Control Strategies for Transit PriorityAlexander Skabardonis, Institute of Transportation Studies, UC Berkeley
On-street parking management must ensure the
availability of adequate curb space for buses. The
effectiveness of such measures is largely site spe-
cific. Bus bulbs, for example, can work well if there
is sufficient road capacity for other traffic to pass a
stopped bus, but can contribute to long queues and
delays if the bus blocks traffic.
Traffic signal timing for transit priority is coordinat-
ed using fixed-time timing plans prepared off-line
based on historical data. Transit priority is provided
in off-line systems by determining the signal set-
tings (cycle length, green times, and offsets) to fa-
vor bus movements. Figure 1a shows a time-space
diagram between successive signalized intersections
and the trajectories of both a vehicle platoon and
bus. To provide priority for buses, the offset be-
tween signals must be adjusted to account for the
slower speed of the bus and the midblock dwell
time. These strategies may also involve bus stop
relocation (Figure 1b). If possible, bus stop loca-
tions should alternate between the near side and
far side of the intersection at successive intersec-
tions, so that buses do not have to stop at both the
stopline (when the signal is red) and the bus stop.
Signal preemption, where the approach of a bus
changes the timing of a traffic signal, is imple-
mented by several methods: using strobe light
emitters on the transit vehicles and special light
detectors at the signal, radio control, or special
loop detectors that recognize bus signatures. Phase
extension holds the green until the bus clears the
intersection. Phase advance starts the green phase
for the bus early. Other options may include a phase
activated by the bus, or skipping a phase for traffic
in other lanes. Signal preemption has been widely
applied at isolated signals and for light rail, but
several operating agencies have resisted the imple-
mentation of bus preemption in coordinated sys-
tems because of the potential adverse impacts to
the rest of the traffic stream. For example, phase
skipping or red truncation could result in loss of
coordination and high delays to the traffic stream.
Changes in signal phasing during preemption may
potentially cause confusion to motorists. Another
issue is the assignment of priorities between inter-
secting transit lines in a grid network.
Proposed strategies wereevaluated through simulationon a test segment of SanPablo Avenue in Berkeley.

vol. 7 no. 2 1998 Intellimotion 7
Automatic Vehicle Location (AVL) provides the tran-
sit vehicle’s location and speed via transmissions
from on-board or off-board equipment. Interfacing
AVL with signal control systems theoretically per-
mits anticipation of preemption needs and real-time
signal control adjustments from the transporta-
tion management center (TMC). Currently, there
are a total of 64 AVL systems being implemented
in the United States. In Turin’s UTOPIA system,
the AVL system monitors the bus location and re-
quests signal priority from the TMC for buses that
are running late. Estimated bus arrival time at the
intersection is relayed to the controller and the
signal settings are adjusted on-line to provide tran-
sit priority. Reported benefits include a 20 percent
increase in bus speeds without disbenefits to the
rest of the traffic.
Proposed StrategiesIn developing transit priority strategies (as well as
techniques for their evaluation where appropriate)
for buses traveling along arterials, we assume that
there are no conflicting bus movements at the in-
tersection approaches (i. e., that buses share the
roadway with through traffic, and there are no
buses on the cross-streets).
Passive Priority Strategies. The generation of fixed-
time timing plans to favor transit vehicles can be
accomplished either by manually modifying the
background timing, or by using a signal timing
optimization algorithm. We used the TRANSYT-7F
model, which simulates the movement and inter-
actions of traffic platoons, and optimizes the sig-
nal settings to minimize a combination of delays
and stops in the network. TRANSYT-7F can be used
to develop timing plans for transit priority as fol-
lows: bus movements are coded as separate links.
Delay and stops weighting factors are then coded
for the bus links so that the signal optimizer favors
the transit vehicles. The weighting factors are de-
termined through an iterative process based on bus
frequency and network characteristics, subject to
minimum adverse impacts to the auto traffic.
Active Priority Strategies. Proposed strategies for
signal preemption and system-wide on-line ad-
justment of timing plans consist of a) criteria for
selecting specific intersections in the system to
provide transit priority, and b) procedures for
minimizing adverse impacts to the rest of the traf-
fic stream. The following criteria were used for
signal preemption:
• Spare green time: signal preemption should be
granted at an intersection if there is sufficient spare
green time in the system cycle to avoid congestion
or loss of coordination when extra green time is
allocated to buses.
• Bus route progression: The decision to grant pre-
emption at an intersection should consider predicted
continued on page 10
Figure 1. Trajectories of a vehicleplatoon and a bus betweensuccessive signalized intersections.1a–Bus stops at far side ofintersections.1b– Alternating near-side and far-side bus stops.

Intellimotion vol. 7 no. 2 19988
PATH’s automated Buick LeSabres com-
manded the spotlight at Demo ’98, held
from 15-19 June in Rijnwoude, the Neth-
erlands. From the time that the vehicles and PATH
researchers arrived through the full week of dem-
onstrations, they were the subject of intense in-
terest by the Dutch media and public. By the end
of Demo ’98, they may well have been the most
famous cars in the Netherlands. The country’s
major and local newspapers ran photos of the
LeSabres and PATH researchers, television crews
from several European countries clamored for
chances to tape the demonstration, and ordinary
citizens came by the hundreds to see the cars.
Dutch Minister of Transport, Public Works and
Water Management Mrs. Annemarie Jorritsma and
her entourage rode in the PATH platoon. Her com-
ment: “It’s better than my chauffeur!”
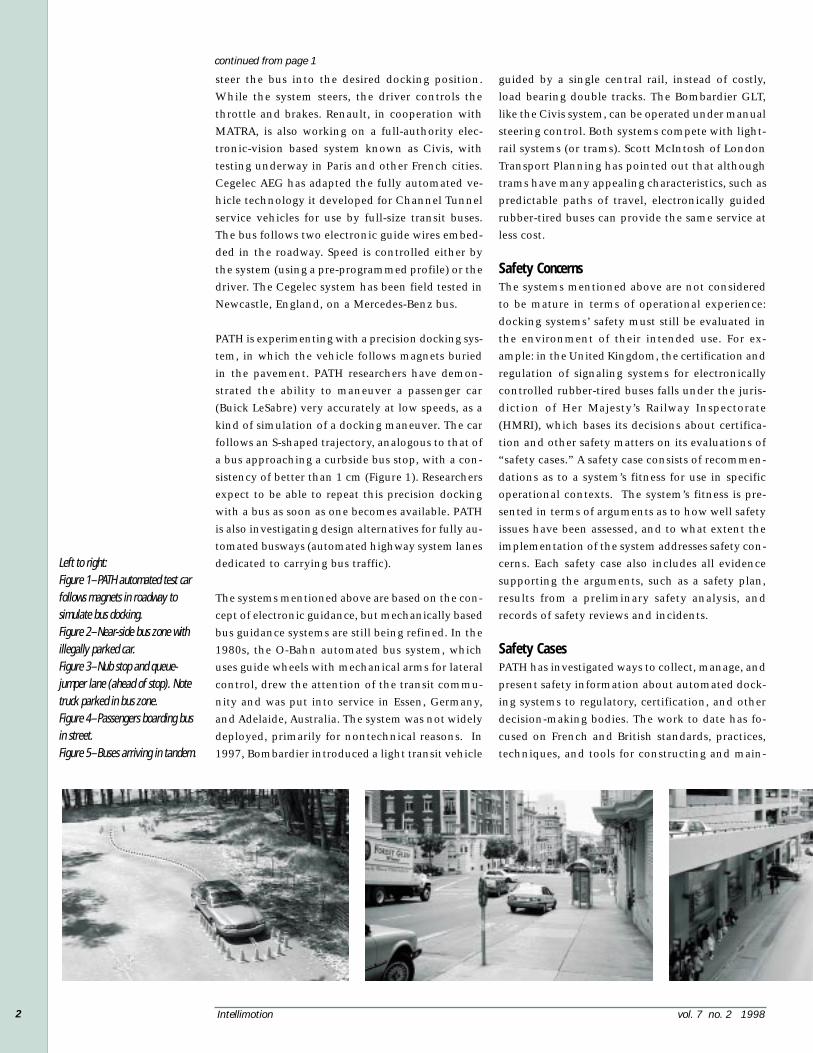
The star attraction was the three-car automated pla-
toon demonstration on the 5.5 km section of still-
under-construction Rijksweg 11. Over 800 people
rode in the cars, and even visitors who did not get a
ride were very impressed as the platoon whizzed past
them in the viewing area, with the cars maintain-
ing their 6 m separation at 90 km/h. The middle car
of the three split from its neighbors, changed lanes,
and decelerated until it was behind the other two,
then changed lanes again to join itself to the end of
the platoon, all under fully automatic control. This
demonstration was a microcosm of the NAHSC pla-
toon demonstration of Demo ’97, in San Diego, with
fewer cars and a slightly lower speed, based on the
limits appropriate for this different road.
Technically, a low-speed mini-demo on a half-kilo-
meter track was particularly challenging. The track
featured much sharper curves than these PATH cars
have steered through in the past, and the team had
less than two days between track completion and
media preview day to implement the demo. Nev-
ertheless, it provided a very smooth, precise, com-
pletely automated ride with high-g curves. PATH
researchers Han-Shue Tan and Benedicte Bougler
spent a full month in the Netherlands preparing
the demonstrations. They were joined at various
times by David Nelson, Wei-Bin Zhang, Rajesh
Above: PATH cars demonstrateAutomatische Voertuiggeleiding(Automated Vehicle Guidance) athighway speed.Counter-clockwise from left:entrance to Demo ‘98 exhibit hall;researcher Han-Shue Tan installscomputer hardware in trunk; AVCSSProgram Manager Steve Shladoverinterviewed in rain; researcher Wei-Bin Zhang demonstrates hands-offdriving on wet road; Rijksweg 11demo lanes; media day drawsEuropean press; precision lateralcontrol on mini-demo track.
vol. 7 no. 2 1998 Intellimotion 9
and the most polished presentation in terms of user
interfaces, packaging, and smoothness of ride. It was
also probably the most reliable and available of the
16 vehicle demonstrations. Demo ’98 certainly put
the concept of the truly automated highway sys-
tem, and PATH’s research, on the map in the minds
of the European transportation community, who
were well represented among the visitors.
Rajamani, Farokh Eskafi, Duke Lee, and Jay Sullivan,
all of whom worked long and hard to ensure suc-
cess. The challenges were considerable and the pres-
sure intense, since the demonstration site was still
under construction during most of the preparation
period, the weather was cold, windy, and wet (the
wettest spring on record in the Netherlands, thanks
to El Niño), and their colleagues and families were
nine time zones away.
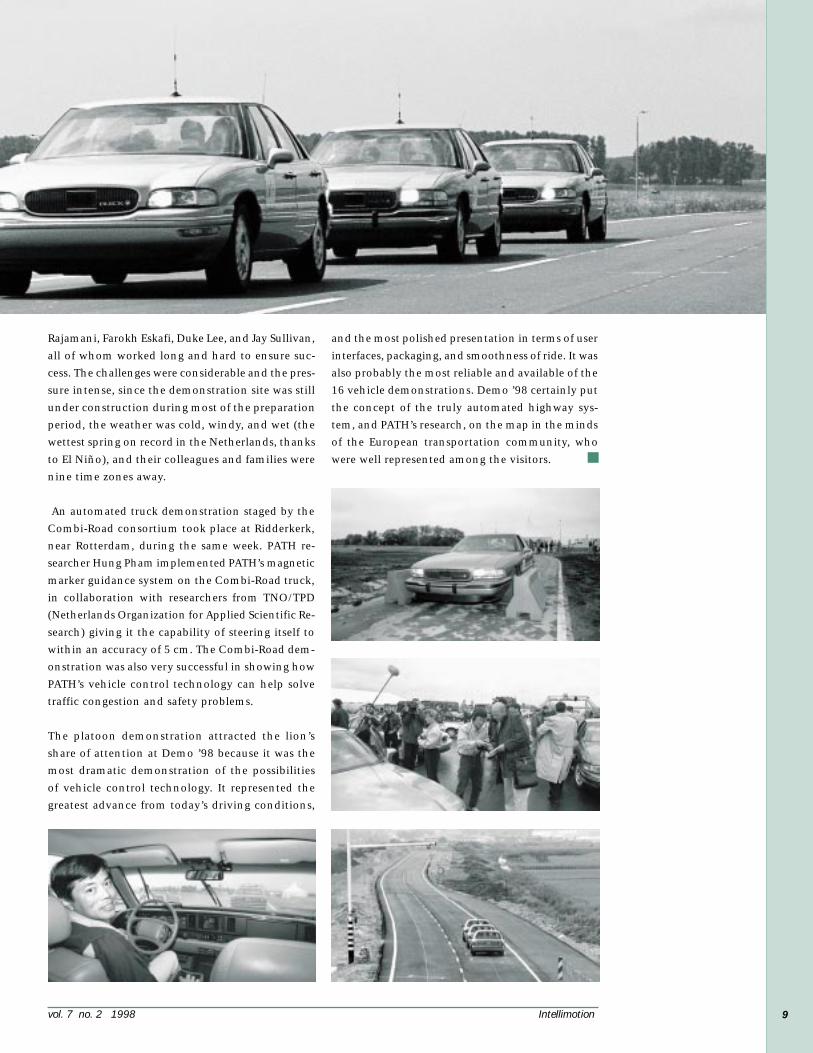
An automated truck demonstration staged by the
Combi-Road consortium took place at Ridderkerk,
near Rotterdam, during the same week. PATH re-
searcher Hung Pham implemented PATH’s magnetic
marker guidance system on the Combi-Road truck,
in collaboration with researchers from TNO/TPD
(Netherlands Organization for Applied Scientific Re-
search) giving it the capability of steering itself to
within an accuracy of 5 cm. The Combi-Road dem-
onstration was also very successful in showing how
PATH’s vehicle control technology can help solve
traffic congestion and safety problems.
The platoon demonstration attracted the lion’s
share of attention at Demo ’98 because it was the
most dramatic demonstration of the possibilities
of vehicle control technology. It represented the
greatest advance from today’s driving conditions,

Intellimotion vol. 7 no. 2 199810
arrival times of the bus at downstream intersections,
and their signal settings. If, for example, advancing
the green time at an upstream intersection results
in additional bus delay downstream, there is no
net benefit to the buses, but there is a disbenefit to
the rest of the traffic. This “wasted” preemption is
illustrated in Figure 2.
• Schedule adherence: transit priority should be
given only to buses that are behind schedule.
However, favoring a late-running bus may not be
beneficial if it is empty and near the end of a route,
with an out-of service period to follow. Using this
criterion requires either an AVL system or action
by the driver.
EvaluationOur proposed strategies were evaluated through
simulation on a segment of San Pablo Avenue, a
major urban/suburban arterial in the San Francisco
Bay Area. The test segment is 6.7 km (4.2 miles) long
Control Strategies for Transit Priority
and includes 21 signalized intersections. Basic data
on the study area and information about transit
service were assembled and verified through field
checks, and were coded into the TRANSYT and
CORSIM simulation models. Comparisons of simu-
lation runs with field measurements on critical in-
tersections along the study segment indicate that
the models reasonably represent existing operat-
ing conditions. The proposed strategies were then
simulated. Optimal timing plans to favor buses
along the arterial reduced the delay to buses by 14
percent and improved the average bus speed by 3.4
percent. This translates into delay savings of about
2 seconds/bus/intersection. The impacts on the rest
of the traffic stream were marginal (a 1 percent in-
crease in total delay). Sensitivity analyses showed
that the estimated transit improvements are insen-
sitive to a range of bus volumes up to 30 buses/hr.
Bus preemption at specific signals produced bus
time savings ranging from 0 to 6 seconds per inter-
section, with typical savings of 2 seconds. Over the
study area, the savings from preemption at the se-
lected intersections would be about two minutes,
without increase in delay to the rest of the traffic
stream. It should be noted that on the study corri-
dor, buses travel through on the cross streets as well
as along San Pablo Avenue, which offsets some of
the benefits of priority to the San Pablo Avenue
buses. Also, the analysis of sample field data on
individual arterial links showed that signal delay
was only about 20 percent of total bus delay. In
many cases, much of the bus delay would not have
been avoided by signal preemption.
ConclusionsThe proposed priority strategies placed major em-
phasis on systemwide improvements to the transit
movements, and on minimizing adverse impacts
to the rest of the traffic stream. Higher benefits from
preemption would result if buses would preempt
any of the intersections that are delayed. However,
tests of this approach showed that it produced ex-
cessive queues on several side streets, as well as
moving buses out of the front of one queue only
to deliver them to the back of the next queue.
The application of the proposed strategies on a
major arterial with 21 signalized intersections
showed modest improvements to the movement
continued from page 7
Figure 2. Wasted preemption.If advancing the green time atan intersection to give a buspriority results in delay to thebus downstream, there is nonet benefit.

vol. 7 no. 2 1998 Intellimotion 11
to vision (B/S) and aid (RISS/No RISS) was highly
significant. This model shows the significance of
the success rate compared to the person’s sight, the
use of the Talking Sign® aid, and the combination
of both of these variables.
Most of our blind subjects had been blind most or
all of their lives and were very experienced and in-
dependent travelers, with their own tested mobility
procedures. The blindfolded sighted subjects were
more like newly or untrained blind people. The
mean response time for the blindfolded sighted
without the aid was 243 seconds and 172 seconds
using the RISS.
The quantitative portion of the experiment showed
that there is a significant difference in response
times and performance when using a Remote In-
frared Signage System. The last part of our experi-
ment was to collect qualitative data from post-test
interviews. We first asked general questions about
how subjects felt about using the Talking Signs®
RISS. Using a five-point scale for agreement or dis-
agreement, we asked if the system relieved stress
or reduced cognitive load; if the signs were help-
ful when navigating known and unknown spaces,
identifying street corners, and finding bus stops
and buildings; and finally, if the subjects would
use such a system if installed. Ninety-five percent
(95%) indicated agreement. Next we asked about
the ease of understanding and finding the signs, if
the subjects would use them at bus stops, and if
finding unfamiliar bus stops was easier than by the
subjects’ usual method. We also asked if the bus
auditory messages were easy to pick up, if the mes-
sages made it easy to find the right bus, if the sub-
jects would use them on buses, and if it was easier
to find the right bus than by using their usual
method. On a five point scale from “strongly
agree” to “strongly disagree,” no subjects indicated
disagreement on any of these points.
We also asked open-ended questions. The first was
“Where would you like to see Talking Signs®
used?” One subject, an Orientation & Mobility
(travel techniques for the blind) instructor,
summed it up by saying, “Wherever visual signs
are used.” All subjects made many suggestions, in-
cluding all forms of transit, intersections, and
many kinds of buildings. We then asked, “What
was your opinion of Talking Signs®?” The results
were extremely positive. Subjects called the signs
great, superb, the best thing yet for the blind, and
so on. Many people mentioned how they gained
confidence and independence using them.
Our last question was “How does using Talking
Signs® differ from your regular method of mobil-
ity?” Responses to this question were also very
positive; many people said how much easier the
system was, that they felt less stress, and mostly
they mentioned how much more independent
they felt, not having to ask others for help.
Our quantitative results show strong significant
results when using a RISS. User feedback was over-
whelmingly positive. We conclude that Remote
Infrared Signage Systems should be adopted to
erase the functional barriers that the blind, dys-
lexic, developmentally disabled, illiterate and
others face daily when trying to access the built
environment.
Improving Transit Access for the Blind and Vision Impaired
of transit vehicles. Passive priority strategies im-
proved bus delay by 14 percent, and signal preemp-
tion reduced delay by up to 6 seconds/intersection/
bus, without adverse impacts to the auto traffic.
These results apply to the test segment, and could
be higher on routes with higher bus frequencies.
Improved capabilities in traffic control and transit
systems offer considerable potential in developing
effective control strategies for transit that outper-
form existing signal preemption techniques. There
is a need to develop improved algorithms to take
advantage of such technological advancements, to
develop comprehensive simulation tools for thor-
ough laboratory evaluation of proposed strategies,
and to perform field demonstrations.
For further reading:Skabardonis, Alexander. 1998. Control Strategies
for Transit Priority. University of California, Berke-
ley: Institute of Transportation Studies, California
PATH Program. UCB-ITS-PRR-98-2.
continued from page 5

Intellimotion vol. 7 no. 2 199812
Recent and Upcoming Presentations of PATH Sponsored ResearchPATH Presentations
ITS America 8th Annual Meeting, Detroit, Michigan, May4-7, 1998.• Datta N. Godbole, Raja Sengupta, “Rear-end CrashMitigation Benefits of an Automated Highway System”,presented by Datta Godbole.• Datta N. Godbole, Raja Sengupta, “A Method forDesign and Specification of Longitudinal Controllers forVehicle Automation”, presented by Datta Godbole.• Datta N. Godbole, “A Framework for the Analysis ofCrash Avoidance Systems”, invited presentation.• Thomas Horan, panelist “ITS and EnvironmentalSustainability: What’s Missing?”• Ronald Koo, Youngbin Yim, “Traveler Response toTraffic Information on an Incident”, presented byYoungbin Yim.• Mikhail A. Kourjanski, Jim Misener, “Modeling theDriver: A Microsimulation Approach”.• Raja Sengupta, panelist “Modeling to Determine theBenefits of Collision Avoidance Systems”.• Susan Shaheen, “Smart Car Linking in the San FranciscoBay Area: A Market Evaluation”.• Steven Shladover, panelist “Societal Issues: What theIntelligent Vehicle Initiative Has to Learn from the Ex-periences of the Automated Highway System”.• Steven Shladover, moderator “User and SocietalAcceptance of AVCSS”.• Steven Shladover, panelist “Industry Perspectives onthe Intelligent Vehicle Initiative”.• Youngbin Yim, Ronald Koo, Jean-Luc Ygnace, “TravInfoEvaluation: A Study of the TravInfo Transit InformationCallers”, presented by Youngbin Yim.• Youngbin Yim, Ronald Koo, “A Revealed PreferenceStudy of Automated Vehicle and Highway Systems”,presented by Youngbin Yim.
5th World Congress on Intelligent Transportation Systems,Seoul, Korea, October 12-16, 1998.• Youngbin Yim, Ronald Koo, “Automated HighwaySystems Evaluation: A Survey of AHS Demo Riders”,presented by Youngbin Yim.• Jean-Luc Ygnace, Youngbin Yim, “User Response to theTelephone Assisted Traveler Information System in the SanFrancisco Bay Area”, presented by Jean-Luc Ygnace.• Ryuichi Kitamura, Cynthia Chen, Jiayu Chen,“Multimodal Daily Travel Planner”.• Steven Shladover, “Future Directions for AutomatedHighway Systems”.• Seungmin Kang, Stephen G. Ritchie, “Freeway TrafficPrediction with an Adaptive Autoregressive and MovingAverage Model”.
1998 SAE FTT Future Transportation TechnologyConference, Costa Mesa, California, August 11-13, 1998.• Youngbin Yim, Ronald Koo, “The Benefits of AdvancedTraveler Information Systems”, presented by Ronald Koo.
ASCE 5th International Conference on Advanced Transpor-tation Engineering, Costa Mesa, California, April 29, 1998.• Jim Misener, panelist “Practical Issues Learned and theFuture of AHS”.
8th Chilean Transportation Engineering Conference,Santiago, Chile, December, 1997.• Carlos Daganzo, “La asignacion de trafico con alma-cenamiento limitado” (Traffic Assignment with LimitedStorage Space), plenary lecture given as a video-conference.
Center for Transportation Studies, NorthwesternUniversity, Chicago, Illinois, March 1998.• Carlos Daganzo, invited lecture “Traffic Assignmentwith Limited Storage Capacity”.
University of California, Berkeley, California, April 18,1998.• Carlos Daganzo, “Urban Traffic Gridlock and What todo About It”, featured presentation for the College ofEngineering, Cal Day.
3rd Symposium on Transportation Engineering, PolitechnicUniversity of Catalunya, Barcelona, Spain, June 16, 1998.• Carlos Daganzo, “Modern Methods of Highway TrafficNetwork Analysis, Design and Control”, (6 hourworkshop).
Car-Sharing Workshop, Seattle, Washington, May 29, 1998.• Susan Shaheen, “Smart CarLinking”.
Hybrid System Workshop, University of California,Berkeley, California, April 14, 1998.• Sergio Yovine, Tunc Simsek, Marco Zandonadi, “SHIFT,Smart-AHS and KronoSHIFT”.
Women’s Transportation Seminar (Sacramento, CaliforniaChapter) Afternoon Seminar, April 30, 1998.• Susan Shaheen, “Evolutions and Adaptations in Car-Sharing Markets in Europe and North America”.
ZEUS (Zero and Low Emission Vehicles in Urban Society)Project, Bremen, Germany, March 12, 1998.• Susan Shaheen, “Car-Sharing Research andImplementation in the USA” (expert seminar).
Aerospace Lighting Institute, Advanced Seminar, LosAngeles, California, February 1998.• Theodore E. Cohn, “Looking Beyond Photometry:What Can We Predict About the Effect of Light on theHuman Eye?”.
2nd IFAC Workshop on Advances in Automotive Control,Mohican State Park, Loudonville, Ohio, February 1998.• Ioannis Kanellakopoulos, “Intelligent Sensors andControl for Commercial Vehicle Automation”.• R. Rajamani, B. Law, S.B. Choi and J.K. Hedrick, “Designand Experimental Implementation of a FaultManagement System for Longitudinal Control ofAutomated Vehicles”.• H.-S. Tan, J. Guldner, S. Patwardhan, and C. Chen,"Changing Lanes on Automated Highways with Look-Down Reference Systems".

vol. 7 no. 2 1998 Intellimotion 13
1998 American Control Conference, Philadelphia,Pennsylvania, June 24-26, 1998.• L. Alvarez, R. Horowitz, S. Chao, “Optimal Traffic FlowPatterns”.• C. Chen (presenter), J. Guldner, I. Kanellakopoulos,M. Tomizuka, “Nonlinear Damping in Vehicle LateralControl: Theory and Experiment”.• K.-T. Feng, H.-S. Tan, and M. Tomizuka, "AutomaticSteering Control and Validation of Vehicle Lateral Motionwith the Effect of Roll Dynamics".• H.-S.Tan, R. Rajamani, and W.-B. Zhang, "Demonstrationof an Automated Highway Platoon System".
IEEE Conference on Decision and Control, San Diego,California, December 8-12, 1997.• L. Alvarez, R. Horowitz, “An Activity Based Traffic FlowController for AHS”.• J. Yi, L. Alvarez, R. Horowitz, “Design andImplementation of Fault Tolerant AHS Control Systems”.
8th IFAC/IFIP/IFORS Symposium on TransportationSystems, Chania, Greece, June 1997.• R. Horowitz, “Automated Highway Systems: The SmartWay to Go”, (plenary presentation).• L. Alvarez, R. Horowitz, P. Li, “Traffic Flow Control inAutomated Highway Systems”.
International Workshop on Fault Tolerance in AutonomousSystems, Denver, Colorado, August 11-12, 1998.• R. Rajamani, A. Howell, C. Chen. J.K. Hedrick, M.Tomizuka, “A Complete Fault Diagnostic System forAutomated Vehicles”.
Center for Autonomous Systems, Royal Institute ofTechnology, Stockholm, Sweden, January 1998.• Ioannis Kanellakopoulos, “Nonlinear and AdaptiveControl for Advanced Vehicles”. (invited seminar)
Institute for Nonlinear Science, University of California,San Diego, La Jolla, California, April 1998.• Ioannis Kanellakopoulos, “Nonlinear Control forAutonomous Vehicle Systems”.
ASME International Mechanical Engineering Congress,Symposium on Transportation Systems, Dallas, Texas,November 1997.• R. Rajamani, J.K. Hedrick, A. Howell, “A Complete FaultDiagnostic System for Longitudinal Control of AutomatedVehicles”.
Association for Research in Vision and Ophthalmology,(Annual Meeting Poster Session), Fort Lauderdale, Florida,May 1998.• Daniel Greenhouse, Theodore E. Cohn,“Ommatometry: an Evolutionary Extension of the Scienceof Photometry”.
ASME International Mechanical Engineering Congress,Symposium on Transportation Systems, Anaheim,California, November 1998.• R. Rajamani, S.B. Choi, J.K. Hedrick, B. Law, R. Prohaska,P. Kretz, “Design and Experimental Implementation ofControl for a Platoon of Automated Vehicles”.• C. Toy, K. Leung, L. Alvarez, R. Horowitz, “EmergencyVehicle Maneuvers and Control Laws for AutomatedHighways”.
Society for Disability Studies 11th Annual Meeting,Oakland, California, June 4, 1998.• Jim Marston, Reginald Golledge, “Toward an AccessibleCity: The Use of Auditory Signage for the Vision and PrintHandicapped”, presented by Jim Marston.
FISITA World Automotive Congress , Paris, September 27 -October 1, 1998.• Steven E. Shladover, “Intelligent Transportation Systemsand the Automobile: Recent History and Future Prospects”.
International Conference on Advances in Vehicle Controland Safety (AVCS), Amiens, France, July 1998.• J. Guldner, H.-S. Tan, C. Chen, and S. Patwardhan,"Robust Steering Control for Automated Highway Systems".
In the Dutch Combi-Roadproject, freight containerson semi-trailers are pulledby automatically controlledtractors powered by anelectric rail. Combi-Road isnow testing PATH’S Magnetic Marker Guidance System,which will do away with the need for a separateinfrastucture with guide rails.

Intellimotion vol. 7 no. 2 199814
A complete list of PATHpublications that includesresearch reports, workingpapers, technical memoranda,and technical notes can beobtained from the:
Institute ofTransportation StudiesPublications OfficeUniversity of California109 McLaughlin HallBerkeley, CA 94720
http://www.its.berkeley.edu/publications.html
510-642-3558,FAX: 510-642-1246
An increasing number of papersare available on-line at:http://www.path.berkeley.edu/Publications/index.html
An Updated List of Recent PATH Sponsored Research PublicationsPATH on Paper
Design of Fault Tolerant Control Systems for AHS,S. Sastry, R. Horowitz, K. Hedrick, April 1998, $15.00UCB-ITS-PRR-98-16
Intelligent Diagnosis Based on Validated and FusedData for Reliability and Safety Ehnancement ofAutomated Vehicles in an IVHS, Alice Agogino, SusanChao, Kai Goebel, Satnam Alag, Bradly Cammon, JiangxinWang, April 1998, $20.00UCB-ITS-PRR-98-17
Analysis, Design, and Evaluation of AVCS for Heavy-Duty Vehicles with Actuator Delays, Diana Yanakiev,Jennifer Eyre, Ioannis Kanellakopoulos, April 1998, $20.00UCB-ITS-PRR-98-18
Alternative Traffic Signal Illumination, Theodore E.Cohn, Daniel Greenhouse, Richard Knowles, April 1998,$5.00UCB-ITS-PRR-98-19
ITS Information and Services to Enhance the Mobilityof Disabled Travelers, Wan-Hui Chen, Rochelle Uwaine,Kelley Klaver, Ken Kurani, Paul P. Jovanis, May 1998, $5.00UCB-ITS-PRR-98-20
Advanced Information Techniques and ParatransitServices to Enhance Mobility of Elderly and DisabledTravelers, Wan-Hui Chen, Kelley Klaver, Rochelle Uwaine,Paul P. Jovanis, May 1998, UCB-ITS-PRR-98-21
The ISTEA/ITS Connection in California: The State ofthe Relationship and Opportunities for Productive andBeneficial Linkages, Mark A. Miller, Wenyu Jia, May 1998,$20.00UCB-ITS-PRR-98-22
Why ITS Projects Should be Small, Local and Private,Stein Weissenberger, June 1998, $15.00UCB-ITS-PRR-98-23
Definition and Measurement of TransportationSystem Performance, Joy Dahlgren, June 1998, $15.00UCB-ITS-PRR-98-24
Models of Vehicular Collision: Development andSimulation with Emphasis on Safety IV: An ImprovedAlgorithm for Detecting Contact Between Vehicles,Oliver M. O’Reilly, Panayiotis Papadopoulos, Gwo-JengLo, Peter C. Varadi, June 1998UCB-ITS-PRR-98-25
Implementation of the Regulation Layer Using SHIFT,David Gulick, Luis Alvarez, Roberto Horowitz, July 1998,UCB-ITS-PRR-98-26
A Review of the Optimized Policies for AdaptiveControl Strategy (OPAC), Lawrence C. Liao, April 1998,$5.00UCB-ITS-PWP-98-09
Videobased Vehicle Signature Analysis and TrackingPhase 1: Verification of Concept and PreliminaryTesting, Art MacCarley, May 1998, $10.00UCB-ITS-PWP-98-10
Impacts of Computer-Mediated Communication onTravel and Communication Patterns: The DavisCommunity Network Study, Prashant Narayan Balepur,May 1998, $20.00UCB-ITS-PWP-98-11
Estimation of Travel Time Distribution and Detectionof Incidents Based on Automatic Vehicle Classification,V. Anantharam, June 1998UCB-ITS-PWP-98-12
Decision Support Systems for Managing and ApplyingITS Research, Joy Dahlgren, Mohamed AlKadri, RosellaPicado, July 1998, UCB-ITS-PWP-98-13
Get on the Mailing List!FAX, mail, or e-mail us the following informationfor a free subscription to Intellimotion:
Name & TitleCompany, type of businessAddressPhone and FAXPrimary area of interest in ITS
Please mention the Intellimotion mailing list. Seeback page for our address and FAX number.
PATH DatabaseThe PATH Database, the world’s largest on IntelligentTransportation Systems, is now accessible at:
http://www.nas.edu/trb/about/path1.html
It currently lists over 13,000 bibliographic records withabstracts.

vol. 7 no. 2 1998 Intellimotion 15
For information about the other technologies showcasedat Demo ‘98, please visit the Netherlands Ministry ofTransport Automated Vehicle Guidance Web site:http://www.minvenw.nl/rws/wnt/avg/index-uk.html
Other features of bus stop design and location that
may affect automated docking were noted. At one
site, metered parking ran right up to the begin-
ning of the bus zone, but the bus zone was not
long enough to accommodate the bus. The cur-
rent design and location of the other sites would
necessitate extreme vigilance by the bus driver in a
partially automated system, and very effective and
reliable avoidance systems for detecting pedestri-
ans, bicyclists, and other obstacles. The necessary
dimensions of bus stops have been published by
the International Union of Public Transport (UITP),
including pull-in and pull-out angles as a function
of bus length and speed, but these guidelines are
sometimes not followed due to considerations such
as technical feasibility, cost, or acceptability (in
terms of public policy) of modifying the existing
infrastructure or vehicles. As a basis for recommend-
ing changes for the location and design of bus stops
to the Institute of Transportation Engineers and the
UITP, field studies based on formal protocols should
be conducted to identify special docking require-
ments for partially and fully automated docking.
Automating Bus Docking to Improve Transit Service
Unresolved IssuesOther aspects of automated bus docking than safety
remain to be investigated. The safety and techni-
cal constraints associated with obstacle avoidance
of an automated docking system could possibly
result in high development, operation, or main-
tenance costs. Will bus drivers in Germany, who
tend to be well-trained and very experienced, or
in London, where there is a high turnover of driv-
ers, accept partial or full automation? Can designs
of automated docking systems be developed that
will be usable on a wide range of bus chassis, and
result in operating costs that are lower than costs
for trams? How will automated docking systems
interact with collision warning and avoidance sys-
tems? These and other issues are fertile areas for
further research and development.
Dr. Michael, until recently a PATH researcher, is now
Visiting Associate Professor of Computer Science at the
Naval Postgraduate School in Monterey, California.
Email: [email protected]
continued from page 3

Intellimotion is a quarterly newsletter edited and designed by theCalifornia PATH Publications Department.
Publications Manager Bill StoneEditor Gerald StoneArt Director Esther KerkmannMultimedia Specialist Jay Sullivan
For more information or comments about this newsletter, pleasewrite, call, fax, or e-mail the address below.
Photographs by Jay Sullivan, Bret Michael, and Gerald Stone.Graphics by Esther Kerkmann.
©1998 by California PATH. All rights reserved. Unless permis-sion is granted, this material shall not be reproduced, stored ina retrieval system, or transmitted in any form or by any means,electronic, mechanical, photocopying, recording or otherwise.
ISSN-1061-4311
Printed on recycled paper
Primary funding provided by:
PATH Publications1357 South 46th Street, Bldg. 452
Richmond, CA 94804-4603Tel: 510/231-9495 FAX: 510/231-9565
e-mail: [email protected]://www.path.berkeley.edu
PRESORTEDFIRST CLASS MAILU.S. POSTAGE PAID
UNIVERSITY OF CALIFORNIA
VZ–41University of California
California PATH PublicationsInstitute of Transportation StudiesRichmond Field Station, Bldg. 4521357 South 46th StreetRichmond, CA 94804–4603
Director Karl HedrickDeputy Director, AVCSS Program Manager Steven ShladoverInterim ATMIS Program Manager Joy DahlgrenCaltrans Management Liaison Greg Larson
Partners for Advanced Transit and Highways
Member
I am pleased and excited to serve as the management liaison between Caltrans
and PATH. While working on the National Automated Highway System Con-
sortium, I had an opportunity to work side-by-side with many of the PATH
researchers, and I was always impressed by their dedication, knowledge, and
professionalism.
Although I already know many of the people at PATH, I have not previously
been directly involved with the PATH Program. As a result I’m still learning
about my duties as the management liaison. Fortunately, my predecessor
Hamed Benouar and PATH management have developed an effective pro-
cess for managing the unique research performed by PATH.
I received my Bachelor and Master of Science degrees in Electrical and Elec-
tronic Engineering from the California State University, Sacramento. I am a
registered professional Electrical Engineer in California and have worked in
the engineering field for 16 years, including over eight years with Caltrans.
I currently serve as the Acting Chief of the Office of Advanced Highway
Systems in the New Technology and Research Program.
I look forward to working with the PATH team to find solutions to our ever-
growing surface transportation problems.
PATH WelcomesGreg Larsonas New CaltransManagement Liaison