Embed Size (px)
Citation preview
UCB Center for Community Innovation & UCLA Lewis Center
Transit-Oriented Development & Commercial Gentrification:
Exploring the Linkages
Report prepared for UC CONNECT
Authors
Karen Chapple, UC Berkeley & Anastasia Loukaitou-Sideris, UC Los Angeles
with Silvia R. González, Dov Kadin & Joseph Poirier
Key Support
Statistical analysis by Zachary Popp, cartography and other editing by Matthew da Silva.
Geocoding support by Patty Frontiera. Editing by Miriam Zuk. This research was funded by the
California Department of Transportation via the University of California Transportation Center.
September 2017

1
The statements and conclusions in this Report are those of the contractor and not necessarily
those of UC CONNECT. The mention of commercial products, their source, or their use in
connection with material reported herein is not to be construed as actual or implied endorsement
of such products.

2
Acknowledgements
The authors are grateful for the research assistance of Anastasia Yip from UC Berkley, and from
UCLA, Katrina Braehmer, Mario Garcia, Delia Esmeralda Arriaga, Lucero Ramos, Liana Katz,
and Rafael Gonzalez. The authors would like to thank Paul M. Ong and Chhandara Pech from
the UCLA Center for Neighborhood Knowledge for helpful comments and feedback.

3
Table of Contents
I. Executive Summary ..................................................................................................................... 4
II. Introduction & Context for Research ......................................................................................... 6
III. Literature Review...................................................................................................................... 8
IV. Defining Commercial Gentrification ...................................................................................... 17
V. Predicting Commercial Gentrification ..................................................................................... 28
VI. Transit Ridership & Commercial Gentrification .................................................................... 42
VII. Predicting Traffic Crashes ..................................................................................................... 49
VIII. Case Studies ......................................................................................................................... 69
IX. Conclusion & Policy Implications .......................................................................................... 88
X. References ................................................................................................................................ 90
XI. Appendices ............................................................................................................................. 95

4
I. Executive Summary
As central cities in California continue their renaissance, commercial gentrification is
often identified by residents as a concern. For many, commercial gentrification means the
intrusion of new businesses that force out a favorite food shop or a longstanding retail store
because of higher rents. For others, it means an influx of hip cafés, trendy retail boutiques, and
gourmet fast food restaurants - places that change the fabric of their familiar neighborhood, for
better or for worse. For many merchants, commercial gentrification can have implications for
economic survival, as increased rents may lead to displacement and business closures.
This report was born out of these concerns, which we uncovered when interviewing
community stakeholders as part of our earlier research on residential gentrification in Los
Angeles and the Bay Area (See Chapple, Loukaitou-Sideris, Waddell, Chatman, & Ong, 2017).
Over the course of this past work, interviews with community members and planners revealed
rapidly-changing storefronts to be a recurring concern. As we looked deeper into this
phenomenon, we found that potential relationships between commercial gentrification and
transit-oriented development (TOD), transit ridership, and traffic safety were relatively
unexplored.
This report focuses on the San Francisco Bay and Los Angeles regions and addresses
gaps in our understanding of the relationship between commercial gentrification and TOD, rail
transit ridership, and traffic safety. The primary elements of this report are:
● A literature review of research on commercial gentrification.
● The development of a quantitative metric that defines commercial gentrification based on
four objective parameters.
● Statistical analyses that explore associations between commercial gentrification and rail
transit stations, changes in transit ridership, and traffic safety.
● Qualitative examinations of four case study neighborhoods: two in Los Angeles and two
in the Bay Area.
Using these methods, we produced the following research findings:
● Commercially gentrified stations are generally characterized by an influx of eateries,
cafés, and bars.
● Proximity to a transit station is likely not associated with commercial gentrification.
More important factors that may relate to commercial gentrification are the demographic
characteristics of a neighborhood, particularly the percent of non-Hispanic black, foreign-
born, and renter residents, as well as overall population density. In some contexts,
residential gentrification may lead to commercial gentrification.
● Commercial gentrification may contribute to increases in total, cyclist-involved, and
pedestrian-involved average annual crashes around rail transit stations. It is unclear if this
is directly due to the phenomenon of commercial gentrification or if it is related to an
increase in traffic that occurs in commercially gentrified areas.
● Commercial gentrification does not appear to have a significant effect on rail transit
ridership. Residential gentrification in Los Angeles, on the other hand, may lead to
reduced rates of transit ridership in the decade after the residential gentrification occurs.

5
● Merchants generally indicated that rising rent costs were the most prominent aspect of
neighborhood change putting pressure on their businesses’ bottom line.
Following these conclusions, we recommend the following as prudent municipal, state,
and regional policies to mitigate traffic crash impacts and empower transit-oriented
development:
● While our quantitative research does not find a significant relationship between a
neighborhood’s proximity to transit and commercial gentrification, this may not represent
a universal truth, and this issue certainly requires further probing. Policymakers should
not simply assume that transit neighborhoods are not susceptible to commercial
gentrification.
● The relationship between residential and commercial gentrification also needs further
exploration. The results of this study are rather mixed, and it is not clear when and where
one type of gentrification follows the other, or which comes first. We suspect that there
may not be a universal pattern, and this relationship may change from one neighborhood
to the other.
● Our findings indicate that commercial gentrification is context-specific. Policymakers,
therefore, should not only rely on aggregate data but also seek to identify what is
happening on the ground in specific commercial transit neighborhoods. Commercial
neighborhood stakeholders, such as merchants, property owners, and realtors can provide
good information about gentrification trends, business closures, relocations, rent
increases, etc.
● Commercial gentrification in a transit neighborhood is often accompanied by an
increased incidence of crashes involving pedestrians and cyclists. This may well be
because more pedestrians and cyclists are present in the neighborhood, increasing rates of
exposure. Regardless of cause, the increased occurrence of crashes tells us that
policymakers should focus resources towards traffic calming, safe streets infrastructure
provision, and other proven traffic safety improvements.

6
II. Introduction & Context for Research
As communities across California invest in transit-oriented development (TOD), they are
becoming increasingly cognizant of potential gentrification impacts. These impacts could
jeopardize local economic development, traffic safety, and greenhouse gas (GHG) reduction
goals. Ongoing research on TOD-related residential displacement has unearthed growing
concerns about commercial gentrification. Although researchers have begun to establish the
complicated relationship between residential and commercial change, surprisingly little is known
about transit access and commercial gentrification. Nevertheless, the growing concern over
residential displacement, especially as it relates to TOD investment, is motivating new research
initiatives (Chapple et al., 2017) and advocacy campaigns (Public Advocates, 2014).
The primary concerns regarding TOD’s potential displacement effects are both social and
environmental; in addition to the societal and economic costs that displacement incurs, TOD-
catalyzed gentrification and displacement may be resulting in more overall vehicle miles traveled
(VMT) and greater GHG emissions (California Housing Partnership Corporation, 2014; Chapple
et al., 2017). Commercial districts play a key role in the attainment of walkability and livability
goals of TODs, as well as in California’s quest to reduce VMT and GHGs, given that nearly
three-quarters of all auto trips are for non-work purposes (Santos, McGuckin, Nakamoto, Gray,
& Liss, 2011). The composition of these commercial districts is likely related to changes in
nearby residential areas, either stimulating or responding to residential demographic shifts
(Chapple & Jacobus, 2009). Details of these associations, particularly in the context of TOD, are
under-researched.
In theory, investments in TOD are expected to reduce transportation costs for residents,
thereby increasing land values and producing higher value land uses (Cervero, Murphy, Ferrell,
Goguts, & Tsai, 2004). Furthermore, the increased pedestrian traffic generated by transit riders
and other developments surrounding the station is thought to increase the number of customers,
sales, and employees in TOD commercial districts, leading to economic development (Litman,
2017). That being said, research is emerging that highlights the links between residential
gentrification and the decline in some areas of small, ethnically-owned businesses, calling into
question the market such development seeks to serve and who benefits from the economic
development (Meltzer & Schuetz, 2012; Ong, Pech, & Ray, 2014). Additionally, the rising land
values and subsequent higher rents associated with TOD could drive out locally-serving
businesses, resulting in an increase in retail stores that do not meet the budgets and/or cultural
preferences of existing residents, such as boutiques (Cranor et al., 2015).
This research uses Los Angeles and the San Francisco Bay Area to examine the
relationship between commercial gentrification and fixed rail transit, transit ridership, and traffic
crashes. The first section of this report is a literature review of existing research efforts to
characterize and model the relationship between transit access, commercial gentrification, and
displacement. Although the vast majority of the literature has focused on the impacts of transit
investments and planning on real estate value, scholars are beginning to investigate the
relationship between transit investments and the demographic shifts common in gentrifying
neighborhoods (Chapple & Jacobus, 2009; Dominie, 2012; Kahn, 2007; Jane Lin, 2002; Pollack,
Stephanie, Bluestone, & Billingham, 2010). Studies have found that real estate premiums
associated with rail investment can alter the demographic composition of surrounding
neighborhoods (Cervero & Duncan, 2004; Diaz, 1999; Jane Lin, 2002).

7
Next, using a longitudinal database of business establishments, we develop a quantitative
definition of commercial gentrification for Los Angeles and the Bay Area. We then use this
definition and employ regression analyses to explore commercial gentrification’s relationships
with transit access, changes in transit ridership, and traffic crashes. We ground-truth our
quantitative findings to deepen our understanding of these relationships through interviews and
field observations in two case studies in each study region. Finally, taking into account the
regression analyses and the case studies, we provide policy implications and recommendations
for future research.
This report builds off unique datasets we have constructed with support from a California
Air Resources Board-funded project on the relationship between rail transit neighborhoods and
residential displacement in Los Angeles and the Bay Area (Chapple et al., 2017). It seeks to
extend our understanding of gentrification and displacement into the commercial realm through
both macro and micro analyses. The macro-analysis extends our existing multi-level databases
for the nine-county Bay Area and Los Angeles County (which include establishment-level data,
real estate transactions, demographics, housing affordability, rail transit stations, joint
development, and other variables) with a new, more detailed analysis of retail change, including
business dynamics such as relocation and closure.
From this dataset, we investigate where commercial gentrification has occurred and its
relationship to fixed rail transit. We then link this information to rail transit ridership data to
assess the corresponding impact of commercial change on transit trips. We also analyze
additional data on traffic crashes to understand the links between commercial gentrification and
traffic safety.
Following these quantitative analyses, we identify four case study neighborhoods for in-
depth qualitative research. Case study areas consist of one matched pair in both Los Angeles and
the Bay Area: one transit-proximate neighborhood that has experienced commercial
gentrification and one that has not. In these case study areas, we use a qualitative approach to
assess the relationship between commercial gentrification, transit, and traffic crashes.
Figure 2.1: A small business in Oakland, CA that has closed down. Photo taken by authors, May 2017.

8
III. Literature Review
Gentrification and displacement are important concerns in many urban neighborhoods
and draw significant attention in research and policy circles. Most of this attention has focused
on residential gentrification: the transition of working-class, low-income neighborhoods because
of an influx of capital and new residents of higher income and educational attainment.
Gentrification, which transforms neighborhoods and can displace residents, has also been linked
to significant changes in commercial landscapes (Chapple & Jacobus, 2009). This phenomenon -
dubbed ‘commercial gentrification’ in this report - is largely understudied. This literature review
focuses especially on the relationship between transit access and commercial gentrification.
Although residential gentrification research has shown that the presence of a transit stop may
induce neighborhood residential gentrification (Chapple et al., 2017), we do not know if transit
investment relates to commercial gentrification.
Research on the nature of commercial change in gentrifying neighborhoods is scarce and
tackles various topics, ranging from where such gentrification may occur, what the impacts may
be, and to who benefits from it. The phenomenon of commercial gentrification has been
documented internationally including in Australia (Bridge & Dowling, 2001), Turkey (Istanbul)
(Ergun, 2004), China (Beijing (Zheng & Kahn, 2013) and Shanghai (Zukin, Sharon, Kasinitz, &
Chen, 2015)), South Korea (Seoul) (Lim, Kim, Potter, & Bae, 2013), the Netherlands (Doucet,
2014; Zukin, Sharon et al., 2015), Spain (Janoschka, Sequera, & Salinas, 2014), Latin America
(Janoschka et al., 2014; Schlack & Turnbull, 2015), Canada (Burnett, 2014; Zukin, Sharon et al.,
2015), and the U.K. (Davidson & Lees, 2005; Dines, 2009; Ferm, 2016; Hamnett & Whitelegg,
2007; Percival, 2009). This literature review focuses primarily on U.S. and Canadian research.
The following sections review the mechanisms of commercial gentrification, empirical
indicators of commercial gentrification, the different types of commercial gentrification, and
potential effects associated with commercial gentrification, with some emphasis on transit-
proximate neighborhoods.
Mechanisms of Commercial Gentrification
What mechanisms prompt gentrification? Hackworth and Rekers (2005) outline two
competing theories of gentrification: cultural and economic. In the cultural approach to
gentrification, the phenomenon is seen “as a spatial expression of critical class politics,” while
the economic perspective utilizes rent gap theory to argue that “the necessary condition for
gentrification to occur is the availability of inexpensive real estate” (Ibid., p. 213). Even
assuming that each of these theories has a basis in truth, it is difficult to unpack the mechanism
by which commercial gentrification relates to residential gentrification (if it does at all). Changes
in commercial districts have been noted as both a causal factor of and an outcome from
residential demographic change (Chapple & Jacobus, 2009). Setting aside the directionality of
residential and commercial gentrification, the literature identifies two market-driven mechanisms
related to increases in the price of urban land that influence commercial gentrification: changes
in the consumer base and increased cost of doing business.
Meltzer (2016) discusses how the process of commercial gentrification can occur through
changes in consumer demand, which result from changes in the consumer base itself. She
theorizes that changes in the consumer base brought about by residential gentrification may lead
to changes in both the business environment and local patrons (Ibid.). In an analysis of how retail

9
reinvestment might lead to neighborhood revitalization, Chapple and Jacobus (2009) show that
changes in the demographic composition of residential neighborhoods in the San Francisco Bay
Area resulted in significant shifts in the mix of commercial establishments. These changes may
negatively impact existing business, whose products and services become less tailored to
neighborhood demand. And while the changes can also result in the creation of new businesses,
potentially underwritten with greater capital investment, the process could also lead to stiffer
competition (which may, in turn, lead to lower prices for consumers - a potentially positive
result). This added competition could produce challenges that are further exacerbated by
increased startup and/or operating costs because of the appreciation of property values and rent
increases in a neighborhood (Meltzer 2016).
Increasing property values may halt new local business startups and put existing
establishments out of business, if appreciation is not accompanied by revenue gains to offset the
costs (Ibid.). Meltzer does note, however, that these pressures take a longer time to materialize
because commercial leases are typically longer than residential leases, allowing commercial rents
to remain stagnant while residential rents appreciate (Ibid.). Although there does not appear to be
research on the scale of and relationship between these mechanisms, both seem to be at play in
many commercially gentrifying districts.
The mechanisms of commercial gentrification documented by Meltzer are market-driven
but there is also a possibility that they are triggered by public investments that make a
neighborhood more accessible or appealing (Ibid.). These could include new transit lines, parks,
or street improvements.
Empirical Indicators of Commercial Gentrification
Although there is no academic consensus on how to define commercial gentrification, it
is clear that commercial gentrification is context-specific and can take different forms; certain
factors can be indicative of commercial gentrification in some areas but not in others. This
section reviews the most commonly identified indicators of commercial gentrification, while
recognizing that some aspects of this phenomenon are not measurable and are inherently
subjective and context-specific. These commonly identified indicators measure first a new
dynamic of change in establishments and second a new type of establishments. Dynamic
measures track (1) increased establishment turnover, churn, and decreased retention, and (2)
disproportionate impacts to minority-owned establishments. New types of establishments include
(1) the rise of establishments that ‘signal’ to particular consumer groups, and (2) the opening of
chain stores and simultaneous decline of small businesses.
Turnover, Churn & Retention
Commercial gentrification is characterized by an influx in capital that manifests itself in
changes to brick and mortar commercial establishments. These changes can be measured
quantitatively as changes in the number of business establishments and as the capacity of
existing businesses to survive changes in rents and operating costs. A 2016 study by Meltzer and
Capperis used longitudinal business data to examine the impact of business ‘churn’ on types of
business activity, commercial infrastructure, and the consumer profile of a neighborhood. The
study found that “consumer-related characteristics explain turnover more than those related to
the local commercial environment”, identifying consumers as those living within a neighborhood
census tract (Ibid., p. 2). This study defined retail business churn by taking the sum of all moves

10
into and out of a neighborhood and dividing by the midpoint number of retail establishments
over the time period. Low rates of business retention have also been suggested as a measure of
commercial gentrification, based on the notion that neighborhood businesses in commercially
gentrifying neighborhoods would have a more difficult time keeping up with rising rents and
may be forced to give way to newer, better-capitalized establishments. However, Meltzer (2016)
found, in New York City, that the retention rate was essentially the same across both gentrifying
and non-gentrifying neighborhoods. Commercial change has also been measured using density of
establishments, employment, and establishment diversity and size (Chapple & Jacobus, 2009;
Dalal & Goulias, 2014; Meltzer & Schuetz, 2012; Ong et al., 2014; Plowman, 2014; Schuetz,
2014; Schuetz, Kolko, & Meltzer, 2012), although not necessarily in the specific context of
commercial gentrification.
Disproportionate Impacts to Minority-Owned Establishments
Neighborhood-based small businesses are often referenced as an important
entrepreneurship vehicle for minority and immigrant populations (Sutton, 2010). Sometimes,
however, neighborhood change in the form of commercial gentrification harms these minority-
owned businesses, because of either a shifting market or rising rents. Recent research tracking
changes to Asian-owned establishments in Los Angeles supported the hypothesis that
commercial gentrification may be disproportionately harmful to minority-owned establishments
(Ong et al., 2014). Similarly, in the Mission district of San Francisco, a neighborhood
undergoing a commercial transformation that caters to a new, high-income demographic,
researchers found a higher rate of closure of Hispanic-owned businesses, relative to other
businesses in the Mission (Center for Community Innovation, 2014). Thus, a decline in minority-
owned establishments is likely an indication that commercial gentrification is occurring.
Signal Establishments
A somewhat subjective list of ‘signal’ establishments that may indicate commercial
gentrification is often defined in the literature using NAICS codes or other establishment-type
classification (Center for Community Innovation, 2014; Meltzer & Schuetz, 2012; Plowman,
2014; Schuetz, 2014). Meltzer and Capperis (2016) used NAICS codes to divide establishments
into buckets of “necessary”, “discretionary”, “frequent”, and “infrequent” types. Necessary
establishments are businesses that fulfill everyday, immediate needs of residents, and include
grocery stores, gas stations, and hardware stores. Discretionary establishments “provide more
luxury or recreational services or goods that are not considered basic, but certainly enhance
quality of life” (Ibid., p. 9). These include specialty food, wine, and home furnishing stores.
Frequent stores provide “frequently consumed and/or perishable goods, whereby short travel
times are essential to their appeal” (Ibid., p. 10). In addition to grocery stores and restaurants,
frequent establishments include banks, laundromats, and pharmacies. Infrequent establishments
are businesses that have market share outside local neighborhoods, offering items like furniture,
clothing, and recreational goods.
These four categories allowed Meltzer and Capperis to develop a “hierarchy of local
services,” whereby frequent and necessary establishments contribute to a neighborhood’s well-
being by serving a broad market that cuts across income classes, while infrequent and
discretionary goods offer “local luxuries” catering to only one, high-income group (Ibid.).
Frequent and necessary establishments were found to have higher retention rates than
discretionary and infrequent ones, suggesting that they are less susceptible to shocks and changes

11
in consumer demand. Although this study was more oriented towards the impact of signal
establishments on turnover and retention, the implication of these distinctions is that decreasing
shares of frequent and necessary establishments or increasing shares of discretionary and
infrequent establishments could indicate commercial gentrification.
Chains & Small Businesses
In addition to specific commercial uses corresponding to commercial gentrification, some
research suggests that establishment size and presence of chain stores could also differ between
commercially gentrifying and non-commercially gentrifying neighborhoods. Many have noted
that small businesses are vulnerable to being replaced by chain stores, a process seen as more
commonly occurring in gentrifying neighborhoods (Basker, 2005; Haltiwanger, Jarmin, &
Krizan, 2010; Neumark, Zhang, & Ciccarella, 2008). Meltzer and Capperis (2016) found that
organizational structures like chains are better capitalized than independent operators and more
likely to enter neighborhoods with lower housing prices and higher-income households. Zukin et
al. (2009) found that once gentrification processes kick in and population density increases,
“chain stores open, bidding up rents above the level many of the pioneers can afford” (p. 62).
The same study found that since the 1990s, New York’s gentrifying neighborhoods have seen the
share of small chain boutiques significantly increase, while the share of large corporate chain
stores has only increased somewhat. Using New York City micro-data on businesses, Meltzer
(2016) showed that gentrifying neighborhoods are more likely to attract chains to replace
displaced businesses than businesses in other neighborhoods. However, her definitions of small
business and chain stores were broad, as she defined small businesses as having fewer than 100
employees and chain stores as those “linked to at least one other establishment through a
common headquarters” (Ibid, p. 64).
It is worth discussing the limitations of using small business and chain business
classifications to measure commercial gentrification. This method, for one, discounts the
possibility that larger businesses and chain businesses, being better capitalized, may offer
improved working conditions, wages, or benefits (e.g. Starbucks may offer employees health
insurance whereby a local small coffee shop may not). It also presupposes that larger businesses
and chain businesses do not provide important goods and services for a neighborhood at low cost
to its residents (e.g. Walgreens may sell toothpaste and toilet paper at a lower cost than a corner
bodega). Thus, this metric focuses on a specific interpretation of ‘commercial gentrification’
(replacement of small individual businesses by larger businesses and chain stores) rather than
taking into account actual services, products, or employment opportunities provided to the
neighborhood.
Types of Commercial Gentrification
The following section synthesizes the common types of commercial gentrification
identified in the literature. While there is considerable overlap between types of commercial
gentrification, and the list is by no means exhaustive, we find at least four categories impacted by
the mechanisms identified in the previous section: retail upscaling, spaces of commodification,
art districts, and transit-oriented districts.

12
Retail Upscaling
The most commonly documented type of commercial gentrification is changes to the
retail composition of an area, or ‘upscaling.’ This includes the process of ‘boutiquing’ of
streetscapes (Zukin et al., 2009) and development of a particular selection of products and
services that appeal to higher-income consumers; for example, organic, gourmet, or
environmentally-friendly goods (Sullivan, 2014). Scholars such as Bridge and Dowling (2001) in
Sydney and Zukin et al. (2009) in New York City have shown that the upscaling of the retail
sector changes shopping opportunities for long-term residents by catering to the needs of new,
more affluent, and more mobile residents. These upscale products potentially represent an
inequitable distribution of retail access, as upscaling often translates to higher prices. In their
study of retail patterns from 1979 to 1990 in Harlem and Williamsburg, Zukin et al. (2009) argue
that the arrival of boutiques and other retail establishments to these areas did not serve the needs
of the existing, low-income residents.
Spaces of Commodification (Corporatized Commercial Gentrification)
Unlike retail upscaling, which is driven largely by changes in consumer tastes,
commodification implies that gentrification is created and marketed by business interests, public
entities, or public-private partnerships as a convenient tool to promote consumption. This form
of “corporatized gentrification” (Hackworth, 2002) has been documented in a number of ethnic
and low-income neighborhoods, where business interests seek to market ethnic cultures or
aestheticize poverty for cultural tourism purposes, (Burnett, 2014; Gotham, 2005; Hackworth &
Rekers, 2005).
In their exploration of ethnic neighborhoods in Toronto, Canada, Hackworth and Rekers
(2005) found that the use of business improvement areas to package the ethnicity of
neighborhoods for consumption by tourists and visitors - whether done deliberately or not -
added value to neighborhood properties. This valorization translated into changes in the local
commercial and residential real estate market that were associated with gentrification and
displacement, such as increased housing costs. In addition, the authors documented a decline in
the population that identified with the historical ethnicities of the neighborhoods, an increase in
the number of restaurants targeting tourists and newcomers, and a decrease in the number of
groceries that served the ethnic population (Terzano, 2014).
Also working in Canada, Burnett (2014) documented - through site visits and analysis of
public discourse - how Downtown Eastside of Vancouver became a dining destination. The
Downtown area was marked by a history of poverty and homelessness that led to significant
urban redevelopment. As a result, both new and revitalized restaurants, cafés, and bars created
new spaces of consumption and transformed the neighborhood into a dining destination (Ibid., p.
157). Burnett argued that “the presence of poor and marginalized residents has become a
competitive niche for the promotion of distinctive and authentic culinary adventures” or “poverty
tourism” (p. 157). The impact, however, of poverty tourism is the displacement of existing
residents and businesses as well as the commodification of the people themselves (Ibid., pp. 157-
158).
Tourism gentrification is another type of change that is mentioned in the literature as
occurring in both North America and abroad (Gladstone & Préau, 2008). Tourism gentrification
can be linked with the broader commercial hospitality industry, which “is becoming increasingly
important for the branding and promoting of cities” (Bell, 2007). In his study of eight
neighborhoods located within or bordering the major tourist zone in post-Katrina New Orleans,

13
Gotham (2005) referred to tourism gentrification in the Vieux Carré as “the transformation of a
middle-class neighborhood into a relatively affluent and exclusive enclave marked by a
proliferation of corporate entertainment and tourism venues” (Ibid., p. 1,099). Somewhere in
between tourism gentrification, commercial hospitality, and ethnic packaging is the case of Los
Angeles’ Chinatown. The area was considered a slum at the turn of the 20th century and has
undergone a revival since the 1960s, led primarily by a coalition of ethnic entrepreneurs and city
agencies (Lin, 2008). This revival slated the area as a cultural and tourist destination with a
dedicated Metro rail station. As a result, however, a discrepancy has emerged between the needs
of the existing senior population in Chinatown and the new commercial services that may not fit
their needs (Jan Lin, 2008).
As with ethnic packaging and other forms of space commodification, tourism
gentrification may be led not only by private development interests, but also by municipalities
hoping to attract tourism dollars by marketing a neighborhood’s ethnic identity. The result is a
commercial base that may not serve existing residents and may even create a sense of exclusion
through symbolic racial, class, or age boundaries (Burns, Lavoie, & Rose, 2012; Karsten, 2014).
Art Districts
A special type of commercial gentrification may occur through the designation of arts
districts. Arts districts often begin as locations where pioneering low-income artists find places
to live and work, but they often result in the commodification of art and culture by business
interests. Increases in rents and displacement of low-income residents and artists can follow.
Municipalities frequently support such arts district designations. In Los Angeles, for example, a
downtown Arts District was developed to attract tourist dollars, spark retail growth, and attract
other artists as residents or commercial stakeholders (Collins & Loukaitou-Sideris, 2016). In
Oakland, the City actively formalized an informal arts district in order to spur downtown
redevelopment (Chapple, Jackson, & Martin, 2010). Shkuda (2013) argues that government
funding for the arts and the art market are central to commercial gentrification in areas such as
New York’s SoHo neighborhood. Shkuda (Ibid.) also argues that it is the sweat equity of artists
themselves - the “artist as developer” (Shkuda, 2015) - which draws other artists, consumers, and
tourists, eventually producing “the customer base for area retail” and giving these places a
distinctive commercial landscape (Shkuda, 2013, p. 601).
Transit-Oriented Districts
Mixed land uses and retail opportunities are a key part of transit-oriented development
(TOD), but studies on the relationship between retail change and transit investments are only
now emerging. Most research to date has focused on the relationship between rail proximity and
commercial property values (Cervero & Duncan, 2002) or commercial building permit activity
(Guthrie & Fan, 2013). This research has found a positive association between rail proximity and
both property values and building permit activity, which suggests a possibility of a positive
association with retail gentrification (Cervero & Duncan, 2002; Guthrie & Fan, 2013). Schuetz
(2014) explored whether or not new rail stations in California resulted in changes in retail
employment, and found little support for such a relationship.
By looking more directly into the impacts of transit-induced commercial gentrification in
L.A. County, Ong et al. (2014) found that growth in Asian and small commercial establishments
located in transit neighborhoods lagged behind the county average, despite the fact that real
estate activity was higher in transit areas than in the county as a whole (Ibid.). In the Mission

14
district of San Francisco, researchers found a simultaneous rise in the number of regionally-
serving and decline in locally-serving establishments as well as a higher rate of closure of
Hispanic-owned businesses, when compared to other businesses in the Mission (Center for
Community Innovation, 2014). Studying six transit-proximate neighborhoods in Los Angeles, a
UCLA study found different degrees of commercial gentrification in them, suggesting that
commercial gentrification may occur in similar patterns to residential gentrification, appearing in
certain neighborhoods but not in others (Cranor et al., 2015). However, there is little knowledge
regarding which characteristics of transit-proximate neighborhoods may be conducive to
commercial gentrification.
Potential Effects of Commercial Gentrification
Gentrification pressures bring with them critical tradeoffs for both businesses and
residents. While gentrification is often described in negative terms because it can lead to
displacement, commercial changes can also be characterized as neighborhood or retail
revitalization (Chapple & Jacobus 2009). Indeed, the long-term effects of retail upgrading are
still unclear - who benefits and who loses? Does a neighborhood’s retail access increase? Does
local employment increase?
Only a few studies have explored the impacts of commercial gentrification and they have
produced mixed results. In a study of neighborhood retail change in residentially-gentrifying
neighborhoods of New York City, Meltzer and Schuetz (2012) found that retail access improved
at a notably higher rate in low-value neighborhoods that “experienced upgrading or
gentrification”, as “low-income neighborhoods have lower densities of both establishments and
employment, smaller average establishment size, and less diverse retail composition” and “fewer
chain stores and restaurants, somewhat contrary to conventional wisdom” (Ibid., p. 88).
Interviewing residents of changing New York neighborhoods, Freeman and Braconi (2004)
found that most lauded the return of supermarkets and drugstores, rather than lamenting the
invasion of restaurants and expensive boutiques. The authors argued that if this does not lead to
widespread displacement, gentrification can help to “increase socioeconomic, racial, and ethnic
integration” in both residential and commercial areas (Ibid., p. 39).
Some argue that under certain conditions, commercial changes associated with
gentrification may benefit local businesses. If transit investments, for example, result in
increased pedestrian traffic from transit riders and station-area development, this could lead to
more patrons for nearby businesses, higher sales, and more employees in commercial districts.
Commercial districts may also benefit from forces associated with residential gentrification. As a
neighborhood’s consumer income and population density increase, business sales may also
increase because of more customers and/or more disposable incomes (Meltzer, 2016).
However, even if changes to a local consumer base result in neighborhood economic
development, the benefits for businesses could be outweighed by the rising rents and operating
costs. In addition, different tastes and a different socio-demographic composition of a new
consumer base could result in stagnant or falling sales for certain existing businesses (Ibid.).
These realities beg the question of who benefits and who suffers from commercial
gentrification. After examining overall retail establishment growth in the San Francisco Bay
Area, Chapple and Jacobus (2009) observed that this growth was more associated with
neighborhoods becoming middle- or upper-income, as opposed to ‘bipolar’ (a bi-modal
distribution of high and low incomes). This process of growth was not necessarily tied to the

15
displacement of lower-income households. The authors called for more research to explore
“whether low-income residents face better outcomes living in middle-income or bipolar
neighborhoods” (Ibid., p. 61).
Some research has found links between residential gentrification and the decline of small,
ethnically-owned businesses (Meltzer & Schuetz, 2012; Ong et al., 2014). One study found that
the employment gains in gentrifying neighborhoods primarily benefited new, rather than
existing, businesses (Plowman, 2014), while Meltzer and Ghorbani (2017) found that
neighborhoods undergoing gentrification see an increase primarily in service-sector, low-wage
local jobs. After examining transit-proximate neighborhoods, a UCLA study found that the rising
land values and subsequent rents associated with TOD could displace locally-serving enterprises,
resulting in an increase in boutique retail stores that do not meet the budgets and cultural
preferences of existing residents (Cranor et al., 2015). In another study, Cheshire (2013) argued
that residents in changing neighborhoods are not actually benefitting from some of the new
amenities that commercial gentrification brings to the neighborhood because they have little use
for goods and services they cannot afford.
There is also no consensus in the literature regarding the relationship between the
environmental benefits of TODs and commercial gentrification. Nearly three-quarters of
automobile trips are made for non-work activities like shopping, errands, or entertainment
(Santos et al., 2011). Proponents of TOD argue that such developments support environmental
objectives because they create walkable nodes that integrate transit infrastructure, housing, and
retail, thus reducing automobile trips and greenhouse gas emissions (GHGs) (Arrington &
Cervero, 2008; Bartholomew & Ewing, 2011). It is also argued that investments around transit
stations that result in commercial development could reduce transportation costs for residents
(Cervero, Robert et al., 2004).
That being said, many of these potential benefits have been called into question and the
downsides of commercial gentrification are also documented. Some have suggested that
gentrification and displacement associated with TOD could result in more automobile trips and
greater GHG emissions (CHPC, 2014). This process could occur as lower-income residents, who
are more likely to make use of transit services, are displaced to areas where transit may not be as
reliable or provided at all, therefore shifting to auto transportation. If these residents are replaced
by higher-income residents who are more likely to drive - or by commercial uses that are more
likely to generate auto trips - it is possible the net effect could be an increase in regional
automobile trips. These outcomes may be avoided by increasing density around transit stations
(Chapple et al., 2017).
Lastly, there is no peer-reviewed literature examining the relationship between
commercial gentrification and traffic safety at transit stations. This research gap represents one
of the major questions this study addresses.
Summary
In short, the academic literature has only just begun to explore commercial gentrification.
Much about the phenomenon is not yet fully understood, including what kind of effects
commercial gentrification can be expected to have to area employees, consumers, and residents.
Commercial gentrification’s relationship with traffic crashes and transit ridership is similarly
unknown.

16
Though commercial gentrification manifests itself in many different forms, depending on
the local context, some aspects of commercial gentrification have been slowly uncovered
through qualitative and quantitative research. Theories of commercial gentrification rest largely
on either economic or cultural arguments, and leverage urban social understandings of race and
class. To measure commercial gentrification, scholars have examined the dynamics and types of
business transformation, looking at establishment turnover, churn, and retention, as well as the
presence (or absence of) ‘signal establishments’ and chain/non-chain establishments. Some
specific types of commercial gentrification have already been identified: retail upscaling, spaces
of commodification, art districts, and transit-oriented districts. The research presented in this
report fills some of the gaps in our understanding of commercial gentrification, with particular
respect to its relationship with transit ridership and traffic crashes.

17
IV. Defining Commercial Gentrification
Operationalizing the concept of commercial gentrification is challenging. As previously
discussed, very few past studies have attempted to develop a quantitative definition of
commercial gentrification. By drawing on key characteristics and features of commercial
gentrification (such as changes in consumer base and increased cost of doing business, which are
discussed in the literature review), this report develops a binary ‘commercially gentrified/not
commercially gentrified’ dummy variable that can be applied to metropolitan areas in California.
This variable makes use of data from the National Establishment Time-Series (NETS) dataset,
which the authors have purchased from Walls & Associates for the state of California from 1990
to 2013. Using NETS, we created a commercial gentrification variable applied to the 1990-2000
and 2000-2013 time periods.
Because commercial gentrification is defined by multiple characteristics, we created
definition parameters that measured infrequent establishment churn, discretionary establishment
churn, minority-owned establishment share, and non-chain small business share. Including these
measures of both business dynamics and type is the best way to encompass the many different
forms that commercial gentrification takes in different contexts, from low-income or ethnic
neighborhoods to established commercial strips. We then rescaled each parameter to a simple 0-
100 index, weighted the four indices according to our interpretation of commercial gentrification,
and summed them into a single, consolidated ‘commercial gentrification index’ for each census
tract.1 Because the focus of this research is commercial gentrification, we applied this index only
to tracts defined as ‘commercial’. Commercial tracts were defined based on employment density
and percentage of commercial lot area. We classified the top 20% of commercial gentrification
index tracts in each time period as commercially gentrified.
In short, a tract was considered commercially gentrified if it was a commercial tract and
was in the top 20% of an index combining:
• Infrequent establishment churn: the rate at which infrequently-patronized businesses
move into and out of a neighborhood.
• Discretionary establishment churn: the rate at which discretionary shopping businesses
move into and out of a neighborhood.
• Minority-owned establishment share difference: the change over time in the share of
businesses owned by minorities.
• Non-chain small business establishment share difference.
Using this definition, Figures 4.1-4.4 below show the census tracts in the Bay Area and
Los Angeles County that are considered commercially gentrifying in the 1990-2000 or 2000-
2013 time periods.
1 This report uses 2010 census tracts boundaries throughout.

18
Figure 4.1: Commercial Gentrification in Bay Area Census Tracts, 1990-2013

19
Figure 4.2: Commercial Gentrification in Bay Area Census Tracts, 1990-2013

20
Figure 4.3: Commercial Gentrification in Los Angeles Census Tracts, 1990-2013
Figures 4.4: Commercial Gentrification in Los Angeles Census Tracts, 1990-2013

21
This definition of commercial gentrification largely measures changes in the composition
of business establishments in a neighborhood and does not do as good a job in measuring the
increased costs of doing business in a neighborhood, which could be identified through
commercial rents or wages. Future research should incorporate these inputs where possible. An
overview of the data used to calculate these indicators and a detailed description of how the
indicators themselves were calculated is provided below.
Data Overview
NETS is a proprietary establishment dynamics database developed by Walls &
Associates. We used the NETS database to calculate the number of establishments in each
census tract in each study period year (1990-2013), as well as births, deaths, moves to, and
moves from each census tract in each year of the study period. In order to exclude potential
outliers of both extremely large and extremely small businesses, we dropped all establishments
with one or zero employees or over $50,000,000 in sales in the year for which a statistic was
calculated. The one-employee and $50,000,000-threshold were based on best practices culled
from past research, most notably Chapple and Jacobus (2009). Establishments were assumed to
be present in a given census tract by one of two methods: 1) if their given address was located in
that census tract and the establishment had never moved; or 2) if the establishment had moved
only once, then the year of establishment move was taken and the establishment's first address
was used to assume the establishment’s address prior to its move.
The moves, births, and death rate of establishments in a census tract were calculated
using a combination of the NETS establishment database and NETS Moves database, which
tracks establishment moves over time. For each census tract, we developed the following
statistics. Methodological details pertaining to these four statistics are explained below.
● Annual in-migration rate of new establishments.
● Annual out-migration rate of existing establishments.
● Establishment death rate per year.
● Establishment birth rate per year.
These statistics also excluded establishments that had one or zero employees or over
$50,000,000 of sales in the year of their move. The count of establishments that moved into the
tract in a given year was normalized over the total number of tract establishments plus the
number of establishments that in-migrated. The out-migrating establishments figure was likewise
calculated. For time periods such as 1990-2000 or 1990-1992, the rate of establishments that in-
migrated and out-migrated were both calculated by normalizing the total number of in- or out-
migrating establishments for the time period over the total number of establishments for the time
period plus the total number in- or out-migrating establishments for that period.
While 85% of the nine-county Bay Area NETS data had latitude/longitude geocoded to
the address level, 15% was only geocoded to a zip code centroid level. As such, additional
processing was required to acquire latitude/longitude pairs that could be tied to the census tracts
of the establishments. We geocoded these addresses using ESRI’s geocoding service.
Defining a Commercial District
To ensure that the census tracts yielded by our commercial gentrification index were
indeed commercial districts and not statistical anomalies (e.g., a few establishments in a

22
residential neighborhood), we developed a definition for commercial districts that can be applied
throughout California. To be a commercial district a census tract must have: a) an establishment
density greater than the regional median or b) a commercial lot area ratio greater than the
regional median - a definition that encompasses districts in different urban settings, from city to
suburb.2 Establishment density was calculated by dividing the total establishments in each tract
by the tract’s land area. Commercial lot area ratio was defined as the tract’s commercial lot area
divided by the tract’s total lot area. This was calculated using DataQuick assessor data, which
totals each tract’s lot area by use.
The resulting tracts selected by each of these two conditions for the Bay Area and Los
Angeles County are shown in Figures 4.5-4.7.
Figure 4.5: Los Angeles Commercial Census Tracts
2 The establishment density definition (a) seems to favor small lot, commercial corridors. A good example
of this is the Ventura Blvd. corridor in the San Fernando Valley. This corridor has high establishment density but
may not have as high commercial lot acreage relative to total lot acreage. Definition (a) picked up this whole
corridor while definition (b) did not. Definition (b) seems to favor large lot commercial development, like malls and
big box stores. This type of development has a high commercial footprint, but may not have as many establishments
per area. It is also worth noting that this definition seems to pick up a more dispersed set of tracts. In an effort to
provide an inclusive definition of commercial districts, we considered a tract as a commercial district if it satisfied
either of the two definitions described above.

23
Figure 4.6: San Francisco Commercial Census Tracts

24
Figure 4.7: San Francisco Commercial Census Tracts, SF-Oakland Region

25
Infrequent & Discretionary Establishment Churn
This indicator combines two concepts from Meltzer and Capperis (2016): establishment
churn and signal establishments. In order to measure establishment churn, Meltzer and Capperis
took the sum of establishment moves into and out of a neighborhood and divided it by the
midpoint number of establishments over the time period (Ibid.). They used North American
Industry Classification System (NAICS) codes to define infrequent (not shopped at often) and
discretionary (optional spending for consumers) business establishments (Ibid.). For our study,
we measured the churn of both infrequent and discretionary establishments, which we have
identified as signals of commercial gentrification. As with our other indicators, this signal
establishment churn was measured at the census tract level for both 1990-2000 and 2000-2013.
The formulas for these indicators are summarized in Figure 8 below.
Figure 4.8: Equations for Discretionary Establishment Churn (CDE) & Infrequent
Establishment Churn (CIE)
*At start of decade
BDE = Births of Discretionary Establishments
IMDE = In-Migration of Discretionary Establishments
DDE = Deaths of Discretionary Establishments
OMDE = Out-Migration of Discretionary Establishments
XIE = X of Infrequent Establishments
To calculate infrequent and discretionary establishment statistics for each census tract,
this research uses the NETS six-digit NAICS variables, which provide classifications for each
year of an establishment’s existence. Infrequent and discretionary establishments were defined
using the same NAICS codes used in Meltzer and Capperis (2016). We used these definitions to
create an inventory of the number of infrequent and discretionary establishments per tract per
year (Aee Table A1 in the appendix for a full list of NAICS codes included in this definition).
We then rescaled the signal establishment churn indicators on 0-100 indices and added them to
the composite gentrification index.3
Minority-Owned Establishment Share Difference
Because race is central to many theories of gentrification, we included a race-based
parameter in our definition of commercial gentrification. To calculate minority-owned
establishment share difference for each census tract, we used the NETS dummy variable for a
minority-owned establishment.4 To create a minority-owned establishment rate, counts of each
3 For example, the churn of discretionary establishments in the Bay Area from 1990-2000 was re-scaled to a 0-100
index with minimum value 0, maximum value 100, mean of 8.1, and standard deviation of 5.9. 4 The extent to which business respondents identify as a minority-owned business is not known. For example, it is
not know what percentage of white Latino business owners identify as a minority-owned business. This is one
problem with using this method.

26
census tract’s minority-owned businesses were normalized over the number of establishments in
the census tract. Next, the study period’s end year rate was subtracted from its start year rate. If
minority-owned establishments are disappearing at a greater rate in one tract than in others, then
this may indicate commercial gentrification. The formula we used is summarized in Figure 9
below.
Figure 4.9: Equation for Minority-Owned Establishment Share Difference (DiffMOE)
EDMOE = End of Decade Count of Minority-Owned Establishments
EDTE = End of Decade Count of Total Establishments
SDMOE = Start of Decade Count of Minority-Owned Establishments
SDTE = Start of Decade Count of Total Establishments
We next rescaled the minority-owned establishment share difference parameter on a 0-
100 index, with higher index values denoting a lower share change over time (the highest value
share change being given score 100, the lowest value change being given score 0). When adding
the indexed parameter to the composite gentrification index, we chose to weight it three times as
high as each of the signal establishment indicators, in order to stress the racial component of
commercial gentrification, which we feel is of elevated importance in the California metropolitan
context. This is supported by gentrification literature arguing on behalf of a salient racial element
in commercial neighborhood change (Center for Community Innovation, 2014; Ong et al., 2014;
Sutton, 2010).
Non-Chain Small Business Establishment Share Difference
To calculate non-chain small business establishments for each census tract, this research
used the number of employees and the NETS variable ‘related’, which provides a count of
associated establishments. An establishment was considered a non-chain small business if it had
fewer than 20 employees and fewer than five related establishments. This definition ensures a
small establishment size but allows for a handful of related businesses. We allowed small chains
to be included in this definition because regional businesses with multiple establishments are
sometimes characterized as local businesses and are not considered chains in the same way that a
larger corporate chain might be. The formula we used is summarized in Figure 10 below.
Figure 4.10: Equation for Non-Chain Small Business Establishment Share
Difference (DiffSB)
EDSB = End of Decade Count of Non-Chain Small Businesses
EDTE = End of Decade Count of Total Establishments
SDSB = Start of Decade Count of Non-Chain Small Businesses
SDTE = Start of Decade Count of Total Establishments
Once created, we rescaled the non-chain small businesses share difference indicator on a
0-100 index with higher index values denoting a lower share difference. When adding the
indexed indicator to the composite index, we chose to weight it three times as high as each of the
signal establishment indicators. This weighting was based on gentrification literature arguing on

27
behalf of the strong role that chain businesses play in both perceived and real commercial district
change (Basker, 2005; Haltiwanger et al., 2010; Meltzer, 2016b; Meltzer & Capperis, 2016;
Neumark et al., 2008; Zukin, 2009).
An example of the practical application of this definition is illustrated below for the
Oakland neighborhood of Temescal (census tract 4011), which, when measured from 2000-2013,
had an infrequent establishment churn5 rate of 3.79, a discretionary establishment churn rate of
2.83, a -.033 change in the share of minority-owned establishments, and a non-chain
establishment share difference of -0.12. This gives the Temescal neighborhood a total index
score – after weighting of individual parameters - of 216.93. Because we identify commercially
gentrified neighborhoods as the top 20% of tracts on our commercial gentrification index, this
tract is defined as commercially gentrifying (it is in the 80th percentile). Table 4.1 shows the
indexing and weighting scheme for Temescal.
Table 4.1: Creating Composite Commercial Gentrification Index for Temescal
Variable Raw Value Re-Scaled to 1-100 Index After Weighting
Infrequent Est. Churn 3.79 14.59 14.59 (x1)
Discretionary Est. Churn 2.83 10.87 10.87 (x1)
Minority-Owned Est. Diff. -0.033 46.17 138.51 (x3)
Non-Chain Est. Diff. -0.12 17.65 52.94 (x3)
Sum Total 216.93
Using this definition, we yielded 131 commercially gentrifying census tracts in each time
period for the Bay Area. These amounted to roughly eight percent of all tracts. For Los Angeles
County, this definition yielded 227 commercially gentrifying census tracts in each time period,
or approximately 10% of all tracts. This definition was used throughout this report to investigate
commercial gentrification’s relationship with transit proximity and ridership, traffic crashes, and
transit ridership.
Summary
In short, a census tract was considered commercially gentrifying if it was defined as a
commercial district and fell within the top 20% of a composite gentrification index scored on the
following weighted parameters:
● Infrequent Establishment Churn (higher churn is more gentrifying)
● Discretionary Establishment Churn (higher churn is more gentrifying)
● Minority-Owned Establishment Share Difference (lower difference is more gentrifying)
● Non-Chain Small Business Establishment Share Difference (lower difference is more
gentrifying)
5 Churn is defined as number of establishments that move into, move out of, die in, or are born in, a census tract,
divided by total number of establishments. Average churn for infrequent establishments in the Bay Area is 3.37.

28
V. Predicting Commercial Gentrification
Introduction
In an attempt to quantifiably predict commercial gentrification at the census tract level,
we performed probit regression analyses using our NETS-based definition of commercial
gentrification as the dependent variable, the presence of a rail transit station as an independent
variable and control variables gathered from a variety of sources. This portion of the report
describes our methodology for conducting the regression analyses and reviews the findings
produced by the models.
Two probit regressions were conducted: one for each study region (the Bay Area and Los
Angeles). The regressions used nearly identical independent variables, with adjustments to
reduce multicollinearity.. The dependent variable represents commercial gentrification that
occurred from 2000-2013 and is regressed upon demographic and built environment statistics for
the baseline year of the analysis (in this case, the year 2000).
Variable Construction
Our regression models use a dummy variable of commercial gentrification from 2000-
2013 as the dependent variable and a suite of general demographic and built environment
variables as independent variables. The dummy commercial gentrification variable (1 = tract
commercially gentrified, 0 = tract did not commercially gentrify) used an equivalent definition
for both Los Angeles and the Bay Area. The parameters that determine whether or not a census
tract commercially gentrified by this definition are laid out in Section IV of this report.
The remainder of the variables included in our regressions were sourced from the
decennial census, the Center for Community Innovation’s (CCI) residential gentrification work
(Chapple et al., 2017), the Environmental Protection Agency (EPA) Smart Location Database
(SLD), and NETS. Table 5.1 shows the variables included, their descriptions, and their sources.
Table 5.1: Variables Included in Commercial Gentrification Regressions
Variable Name Description Source
Transit-proximate (1/0)
Variable indicating the presence of high-quality
transit within ½-mile of the tract. High-quality
transit defined by the Strategic Growth Council as
having high frequencies and permanent
infrastructure as follows: (1) Frequency: high
quality transit must have peak period headway
frequency of every 15 minutes or less and service
seven days a week. (2) Permanent Infrastructure:
must operate on a railway or be transit service with
BRT features that either fully or partially operate
on a dedicated bus-only lane, or uses HOV or
HOT lanes.
Strategic
Growth
Council
Non-Hispanic black Percent of population identifying as non-Hispanic Decennial

29
black Census; 2000
Hispanic Percent of population identifying as Hispanic Ibid.
Foreign-born Percent of population that is foreign-born Ibid.
College-educated Percent of population 25 and older with a college
education or greater Ibid.
Median household
income Median household income Ibid.
Units built pre-1950 Percent of housing units built pre-1950 Ibid.
Population renting Percent of population renting Ibid.
Residentially gent. or
adjacent to residentially
gent. (1/0)
Dummy variable indicating tract residentially
gentrified from 1990-2000 or was adjacent to a
tract that residentially gentrified from 1990-2000
Chapple et al.;
2017
Employees per sq. mi.
Employees per sq. mi. for businesses with greater
than one employee and fewer than $50M in annual
sales
NETS; 2000
Population density Population per sq. mi. Decennial
Census; 2000
Road network density Total road network density EPA SLD;
2014
Street intersection
density
Street intersection density (weighted, auto-oriented
intersections eliminated)
EPA SLD;
2014
Commercial Gentrification & Residential Gentrification
Of particular interest to this research is the relationship between commercial
gentrification and residential gentrification. Intuition suggests that there should be a distinct
relationship between the two, with a commercially gentrified neighborhood following an influx
of new residents, or new residents flocking to a commercially gentrified commercial district. The
data analyzed in this report, however, do not bear out a clear consistent relationship between the
two.
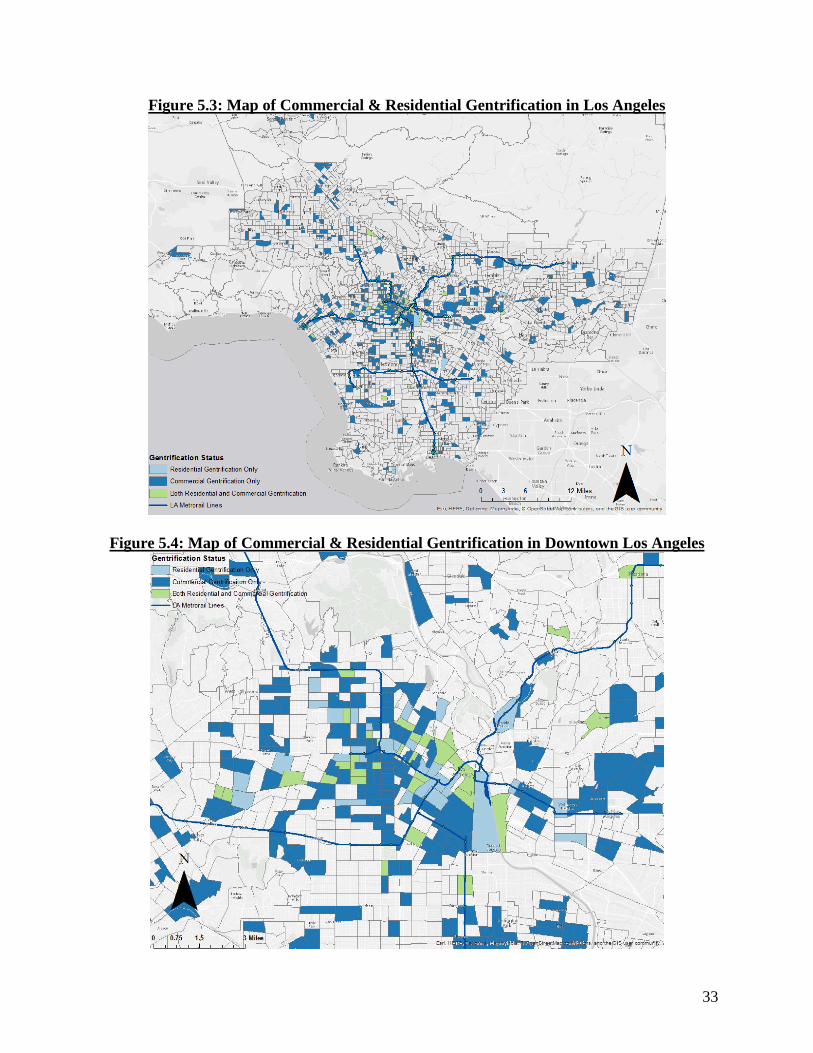
Tables 5.2 and 5.3, and the maps in Figures 5.1 and 5.2 below, show the overlap amongst
commercially and residentially gentrified tracts in both Los Angeles and the Bay Area. The
residentially gentrified designation is from Chapple et al. (2017), and the commercially
gentrified designation is from this report. The temporally dispersed nature of the two types of
gentrification suggests that commercial and residential gentrification do not follow a distinct
pattern, whereby one consistently precedes the other. The mixed results of a residential
gentrification variable in this report’s regression analysis corroborate hypotheses that
gentrification is highly context-specific.

30
Table 5.2: San Francisco Bay Area Commercial & Residential Gentrification Tracts
Commercial Gentrification (n = 262)
'90-'00 '00-'13
Residential Gentrification '90-'00 16 15
(n = 168) '00-'13 11 18
Table 5.3: Los Angeles Commercial & Residential Gentrification Tracts
Commercial Gentrification (n = 454)
'90-'00 '00-'13
Residential Gentrification '90-'00 9 17
(n = 163) '00-'13 13 15

31
Figure 5.1: Map of Commercial & Residential Gentrification in Bay Area

32
Figure 5.2: Map of Commercial & Residential Gentrification in Bay Area, SF-Oakland
Region
33
Figure 5.3: Map of Commercial & Residential Gentrification in Los Angeles
Figure 5.4: Map of Commercial & Residential Gentrification in Downtown Los Angeles

34
In an attempt to more accurately model the relationship between residential gentrification
and commercial gentrification, we incorporated a residential gentrification and adjacency
variable into our commercial gentrification regressions. This binary variable indicated if a tract
had residentially gentrified in the 1990-2000 period or it was adjacent to a tract that had
residentially gentrified in this period (adjacent tracts were identified using a combination of
ArcMap and Stata). The incorporation of adjacency into the model was meant to account for
neighborhood gentrification ‘spillover’, whereby a gentrified neighborhood begins to affect an
adjacent neighborhood by virtue of proximity.
Bay Area
In the Bay Area, a probit regression with commercial gentrification as the dependent
variable was conducted for all commercial districts, for a total of 628 census tracts. See Table 5.4
for descriptive statistics. Only six variables significantly influenced the commercial
gentrification dependent variable (See Table 5.5). The variable of primary interest, transit
proximity, was not significant. Another control variable of note - residential gentrification (or
adjacency to a residential gentrification tract) - was also not significant. This suggests that
residential and commercial gentrification may not necessarily be co-occurring phenomena in the
Bay Area.
The variables that were significant were the 2000 census tract percentage of non-Hispanic
black residents, percentage of foreign-born residents, percentage of college-educated residents,
percentage of renters, population density, and street intersection density.
Table 5.4: Descriptive Statistics for Bay Area Commercial Gentrification Probit Regression
Variable Obs. Mean Std. Dev. Min. Max.
Com. gent. ‘00-’13 (1/0) 628 0.209 0.407 0 1
Transit-proximate (1/0) 628 0.234 0.424 0 1
% non-Hispanic black (2000) 628 8% 12% 0% 73%
% Hispanic (2000) 628 19% 17% 1% 85%
% foreign-born (2000) 628 30% 15% 0% 82%
% w/ college degree (2000) 628 39% 20% 4% 84%
% units built pre-1950 (2000) 628 33% 28% 0% 90%
% pop. renting (2000) 628 55% 24% 4% 100%
Res. gent. or adjacent to res. gent. ‘90-’00 (1/0) 636 0.302 0.459 0 1
Employment density (2000)** 629 60 148 0 2,585
Pop. density (2000)*** 628 15 17 0 168
Street intersection density (2014)** 636 1 1 0 8
**In hundreds per sq. mi. ***In thousands per sq. mi.

35
Table 5.5: Average Marginal Effects, Bay Area Commercial Gentrification Probit
Regression
Dependent Variable Commercial Gentrification ‘00-’13 (1/0)
Independent Variables dy/dx P>|z| [95% Conf. Interval]
Built Environment
% units built pre-1950 (2000) 0.001 0.263 -0.001 0.002
Employment density (2000)** -0.0002 0.168 -0.0004 0.0001
Pop. density (2000)*** 0.002 0.042 0.0001 0.005
Street intersection density (2014)** 0.053 0.011 0.012 0.093
Socioeconomic
% w/ college degree (2000) 0.003 0.046 0.0001 0.005
% renting (2000) -0.003 0.002 -0.004 -0.001
% non-Hispanic black (2000) 0.006 0.000 0.004 0.009
% Hispanic (2000) 0.0004 0.716 -0.002 0.003
% foreign-born (2000) 0.009 0.000 0.007 0.011
Other
Transit-proximate (1/0) -0.006 0.882 -0.079 0.068
Res. gent. or adjacent to res. gent. '90-'00 (1/0) -0.021 0.548 -0.088 0.046
N 628
Pseudo R2 0.161
Correctly classified 79.46%
**In hundreds per sq. mi. ***In thousands per sq. mi.
Of the significant independent variables in the Bay Area regression model, we see that
the 2000 non-Hispanic black population, the 2000 foreign-born population, the 2000 college-
educated population, the 2000 population density, and the 2014 street intersection density are all
positively associated with an increase in the probability of commercial gentrification. We also
see that the 2000 renting population in a tract is associated with a slight decrease in the
probability of commercial gentrification. Street intersection density is by far the variable with the
strongest magnitude marginal effect, suggesting that the general walkability of a neighborhood
(an area with high intersection density can be assumed to be more walkable) may be an
important precondition for commercial gentrification. It is curious that population density is not
as strong a predictor (as this and street intersection density could both proxy for density of built
form) as street intersection density. This suggests that - in the Bay Area - a critical mass of
population is not necessarily associated with walkability, and that walkability is a more
important predictor of commercial gentrification.

36
Los Angeles
A probit regression analysis with commercial gentrification as the dependent variable
was also conducted for 1,066 commercial census tracts in Los Angeles, returning nine significant
variables. Table 5.6 presents the descriptive statistics for the variables in the model. As with the
Bay Area model, the variable indicating the presence of a transit station was not significant (See
Table 5.7). The residential gentrification (or adjacency to residential gentrification) variable,
however, was significant in the Los Angeles model, suggesting that - at least in this context -
residential gentrification may reliably precede commercial gentrification.
Amongst the nine significant variables, we see that employment density, street
intersection density, median household income, and percent renting negatively predict
commercial gentrification, while the percent of units built pre-1950, the population density, the
percent of non-Hispanic black residents, the percent of foreign-born residents, and preceding
residential gentrification (or adjacency to residential gentrification) positively predict
commercial gentrification. The strongest predictors are residential gentrification (or adjacency)
and street intersection density, which is negatively associated with commercial gentrification.
Table 5.6: Descriptive Statistics for Los Angeles Commercial Gentrification Probit
Regression
Variable Obs. Mean Std. Dev. Min. Max.
Com. gent. ‘00-’13 (1/0) 1,082 0.210 0.407 0 1
Transit-proximate (1/0) 1,082 0.095 0.294 0 1
% non-Hispanic black (2000) 1,078 9% 14% 0 94%
% Hispanic (2000) 1,078 45% 29% 3% 98%
% foreign-born (2000) 1,078 40% 17% 1% 79%
Median household income (2000) 1,082 $54,683 $24,565 $0 $219,824
% units built pre-1950 (2000) 1,078 27% 18% 0 90%
% renting (2000) 1,078 64% 24% 5% 100%
Res. gent. or adjacent to res. gent. ‘90-’00 (1/0) 1,082 0.172 0.377 0 1
Employment density (2000)** 1,068 56 77 0 822
Pop. density (2000)*** 1,081 16 14 0 125
Street intersection density (2014)** 1,082 1 1 0 7
**In hundreds per sq. mi. ***In thousands per sq. mi.

37
Table 5.7: Average Marginal Effects, Los Angeles Commercial Gentrification Probit
Regression
Dependent Variable Commercial Gentrification ‘00-’13 (1/0)
Independent Variables dy/dx P>|z| [95% Conf. Interval]
Built Environment
% units built pre-1950 (2000) 0.002 0.013 0.0004 0.003
Employment density (2000)** -0.0004 0.037 -0.001 -0.00003
Pop. density (2000)*** 0.003 0.009 0.001 0.005
Street intersection density (2014)** -0.058 0.033 -0.112 -0.005
Socioeconomic
Median household income (2000)* -0.004 0.013 -0.007 -0.001
% pop. renting (2000) -0.004 0.000 -0.006 -0.002
% pop. non-Hispanic black (2000) 0.004 0.000 0.002 0.006
% pop. Hispanic (2000) 0.0009 0.087 -0.0001 0.002
% pop. foreign-born (2000) 0.008 0.000 0.005 0.010
Other
Transit-proximate (1/0) 0.016 0.671 -0.059 0.091
Res. gent. or adjacent to res. gent. '90-'00 (1/0) 0.058 0.040 0.003 0.113
N 1,066
Pseudo R2 0.218
Correctly classified 80.77%
*In thousands of dollars. **In hundreds per sq. mi. ***In thousands per sq. mi.
Summary
In summary, probit regression models for both Los Angeles and the Bay Area find that
the presence of a rail transit station within a census tract is not a significant predictor of
commercial gentrification. We also find that residential gentrification only significantly predicts
commercial gentrification in Los Angeles, corroborating understandings of commercial and
residential gentrification as context-specific phenomena.6
Four baseline variables were significant in both the Los Angeles and Bay Area models:
percent population that is non-Hispanic black, percent population that is foreign-born, percent
population that is renting, and population density. Although the magnitude of effect was different
in the two regions, the direction of association was the same for all four variables, suggesting
6 It is important to note that definitions of residential gentrification are also context-specific and were developed to
reflect the phenomenon’s unique occurrence in both San Francisco and Los Angeles. It is unclear how this variation
in definition affects outcomes of analysis in this report but it is important to note. Methodology for defining
residential gentrification in Los Angeles and the Bay Area can be found in Chapple et al. 2017, pp. 64-67.

38
that these may be generalizable contributing factors to commercial gentrification, at least in high-
cost and demographically diverse U.S. metropolitan areas.
The primary difference in significant independent variables across the Bay Area and Los
Angeles regressions was street intersection density, which - although significant in both regions -
was a strong negative predictor of commercial gentrification in Los Angeles and a strong
positive predictor of commercial gentrification in the Bay Area. This marked difference reflects
the difficulty of measuring and analyzing commercial gentrification across regions with different
demographic and built environment characteristics, while also highlighting the context-
specificity of the phenomenon. Clearly, the built environment of the Bay Area has a very
different relationship with commercial gentrification than it does in Los Angeles.
These effects can be summed up as such: a neighborhood with a greater percentage of
non-Hispanic black residents, a greater percentage of foreign-born residents, a smaller
percentage of renters, and greater population density is more likely to become commercially
gentrified over the course of approximately one decade. This, of course, is suggested within the
context of a high-cost and diverse U.S. metro area, and from 2000-2013. It is unclear whether
these results can be generalizable outside of these geographic and temporal parameters. Table
5.8, below, reviews the direction and magnitude of these effects.
Table 5.8: Marginal Effects for Variables Significant in Same Direction for Los Angeles &
Bay Area
Marginal Effects
Variable Increase Unit Los Angeles Bay Area
Pop. density (2000) 1,000 per sq. mi. .003 .002
% renting (2000) One percent -.004 -.003
% non-Hispanic black (2000) One percent .004 .006
% foreign-born (2000) One percent .008 .009
Reversed Residential & Commercial Gentrification?
To model the potential for alternate roles of commercial and residential gentrification in
Los Angeles and Bay Area neighborhoods, we also conducted regression analyses that reversed
the roles of commercial and residential gentrification. These probit regressions, presented below
in Tables 5.9 and 5.10, suggest an opposite ordering of commercial gentrification and residential
gentrification. In Los Angeles, commercial gentrification (or adjacency to a commercially
gentrified tract) in 1990-2000 was not a significant independent variable predicting residential
gentrification in 2000-2013. In the Bay Area, on the other hand, commercial gentrification (or
adjacency to a commercially gentrified tract) in 1990-2000 was a significant positive predictor of
residential gentrification in 2000-2013.

39
Table 5.9: Los Angeles Probit Regression Including Commercial Gentrification (or
Adjacency) from ’90-’00
Dependent Variable Residential Gentrification '00-'13 (1/0)
Independent Variables dy/dx P>|z| [95% Conf. Interval]
Built Environment
% units built pre-1950 (2000) 0.001 0.000 0.0004 0.001
Employment density (2000)** 0.00001 0.758 -0.00007 0.0001
Pop. density (2000)*** -0.001 0.014 -0.002 -0.0002
Street intersection density (2014)** -0.001 0.828 -0.014 0.011
Socioeconomic
Median household income (2000)* -0.001 0.017 -0.002 -0.0002
% renting (2000) 0.001 0.105 -0.0001 0.001
% non-Hispanic black (2000) .000002 0.995 -0.0006 0.001
% Hispanic (2000) -0.00002 0.894 -0.0003 0.0003
% foreign-born (2000) 0.001 0.002 0.0005 0.002
Other
Transit-proximate (1/0) 0.013 0.257 -0.010 0.036
Com. gent. or adjacent to com. gent. '90-'00 (1/0) -0.008 0.324 -0.024 0.008
N 2,321
Pseudo R2 0.196
Correctly classified 96.55%
*In thousands of dollars. **In hundreds per sq. mi. ***In thousands per sq. mi.

40
Table 5.10: Bay Area Probit Regression Including Commercial Gentrification (or
Adjacency) from ’90-’00
Dependent Variable Residential Gentrification '00-'13 (1/0)
Independent Variables dy/dx P>|z| [95% Conf. Interval]
Built Environment
% units built pre-1950 (2000) 0.001 0.003 0.0002 0.001
Employment density (2000)** 0.00005 0.100 -.00001 0.0001
Pop. density (2000)*** -0.002 0.005 -0.003 -0.001
Street intersection density (2014)** 0.002 0.824 -0.013 0.016
Socioeconomic
% w/ college degree (2000) -0.0004 0.307 -0.001 0.0004
% renting (2000) 0.001 0.000 0.0004 0.001
% non-Hispanic black (2000) 0.002 0.000 0.001 0.003
% Hispanic (2000) 0.001 0.070 -0.0001 0.002
% foreign-born (2000) 0.001 0.012 0.0003 0.002
Other
Transit-proximate (1/0) 0.018 0.188 -0.009 0.044
Com. gent. or adjacent to com. gent. '90-'00 (1/0) 0.030 0.016 0.006 0.054
N 1,547
Pseudo R2 0.206
Correctly classified 94.54%
**In hundreds per sq. mi. ***In thousands per sq. mi.
Concluding Thoughts
Although our findings do not produce a significant and consistent direction of influence
regarding commercial and residential gentrification across our two study regions, we do uncover
region-specific patterns of influence. In the San Francisco Bay Area, it seems that commercial
gentrification may precede residential gentrification, while in the Los Angeles region, residential
gentrification may precede commercial gentrification.
This suggests an important difference between the Bay Area and Los Angeles regions
that contributes to a reversed ordering of commercial and residential gentrification. We
hypothesize that this may be due to a ‘hotter’ real estate market in the Bay Area, whereby
commercial retailers seek to preempt residential gentrification by moving to or near areas where
gentrification has already started to occur, thereby getting a jumpstart on future business. The
general walkability of neighborhoods in our study regions may also affect the ordering of
commercial and residential gentrification. In the Bay Area, our proxy for walkability (street
intersection density) showed a significant positive correlation with commercial gentrification,
while in Los Angeles, street intersection density produced a significant negative correlation with

41
commercial gentrification. To the extent that walkability affects commercial gentrification, it
clearly has a different, more positively associative effect in the Bay Area, suggesting that there is
something about the Bay Area built form that induces commercial gentrification differently.
Proximity to rail transit stations is not a significant predictor of commercial gentrification
in either region, which is an important finding suggesting that TOD may not be more likely than
other development to produce commercial displacement or other negative outcomes. The small
number of rail transit-proximate census tracts input into these regressions (182 in the Bay Area
and 143 in Los Angeles), however, may play a role in the lack of significance in the results. It is
certainly possible that a change in the number of transit stations (or a change in definition of a
transit-proximate tract) could affect the transit-proximate variables’ significance and magnitude.
All said, more research that addresses specific metro areas’ relationships with
commercial and residential gentrification is needed. This work should focus on understanding
what characteristics of the urban fabric in each metro region are most closely tied to the ordering
of commercial and residential gentrification.

42
VI. Transit Ridership & Commercial Gentrification
In a fashion similar to the previously discussed commercial gentrification regressions, we
conducted linear regressions to model the relationship between commercial gentrification and
transit ridership in the Bay Area and Los Angeles. These regressions were also of the ‘baseline
statistics’ type; most of the independent variables measure demographics and the built
environment in the year 2000, while modeling the change in total census tract transit ridership
from 2000 to 2013. Detailed information on variance inflation factors used to measure
multicollinearity can be found in the tables in Appendix B.
We conducted two linear regressions with robust standard errors - one for Los Angeles
and one for the Bay Area - with change over time in transit ridership from 2000 to 2013 as the
dependent variable. The regressions used baseline independent variables, including dummy
variables for residential and commercial gentrification from 1990 to 2000. Only census tracts
with transit stations present were used for these regression analyses; the Los Angeles regression
used 46 census tracts, and the Bay Area regression used 87 census tracts. A third linear
regression with robust standard error was conducted, combining the Bay Area and Los Angeles
census tracts. Only one of the regressions showed a significant relationship between
gentrification and transit ridership, suggesting that residential gentrification (at the 90%
significance level) may precede transit ridership reductions in the Los Angeles context.
However, we should note that we did not control for overall changes in transit system ridership,
which may account for some of the changes attributed to residential gentrification.
Although literature on the subject of neighborhood change and resultant changes in
transit ridership is scarce, there is some evidence for both increased and decreased transit use in
gentrifying neighborhoods. A 2007 examination of Canadian cities found that residents of
gentrified neighborhoods were less likely to be transit users, despite their “political support for
the notion” (Danyluk & Ley, 2007, p. 2,208). More recently, and in the California metro context,
it was found that gentrification and displacement will likely not increase vehicle miles traveled
for a neighborhood (Chapple et al., 2007, pp. 179-180). That being said, it has been noted that
more research on the subject would be helpful (Ibid., p. 179).
Variable Construction
To develop the dependent variable of total tract ridership change from 2000-2013, we
collected ridership data from various transit agencies, summing ridership figures in census tracts
where more than one station or service was located. In the Bay Area, we used Caltrain, Bay Area
Rapid Transit (BART) and the Santa Clara Valley Transportation Authority (VTA) light rail
ridership data. In Los Angeles, LA Metro was used to measure transit ridership.
After producing ridership figures per tract for each study year, we calculated the percent
change in tract ridership from 2000 to 2013 (2001 to 2013 for Los Angeles), producing our
dependent variable. This dependent variable was regressed with a number of independent
variables, which can be seen in Table 6.1.

43
Table 6.1: Variables Included in Ridership Regressions
Variable Description Data Source; Year
Commercial gent. ’00-’13 Dummy variable indicating tract
commercially gentrified from 2000-2013
Center for Community
Innovation
Non-Hispanic black Percent of population identifying as non-
Hispanic black Decennial Census; 2000
Hispanic Percent of population identifying as
Hispanic Ibid.
Foreign-born Percent of population foreign-born Ibid.
College degree or greater Percent of population 25 and older with
college education or greater Ibid.
Median household
income Median household income Ibid.
U% units built pre-1950 Percent of housing units built pre-1950 Ibid.
Renting Percent of population renting in 2000 Ibid.
Residential gent. ’90-’00 Dummy variable indicating tract
residentially gentrified from 1990-2000
Center for Community
Innovation
Residential gent. ’00-’13 Dummy variable indicating tract
residentially gentrified from 2000-2013
Center for Community
Innovation
Employees per sq. mi.
Employees per sq. mi. for businesses with
greater than one employee and fewer than
$50M in annual sales
NETS; 2000
Population density Population per sq. mi. Decennial Census; 2000
Road network density Total road network density EPA SLD; 2014
St. intersection density Street intersections per sq. mi. (weighted,
auto-oriented intersections eliminated) EPA SLD; 2014
Bay Area
Table 6.2 presents the descriptive statistics for the Bay Area model and Table 6.3
presents the linear regression results. In the Bay Area, none of the variables were significant,
including the variables of interest: commercial and residential gentrification for 1990-2000. This
greatly limits any conclusions that can be drawn regarding the influence of commercial
gentrification on transit ridership in the Bay Area.

44
Table 6.2: Descriptive Statistics for Bay Area Ridership Linear Regression
Variable Obs. Mean Std. Dev. Min. Max.
% change in ridership ’00-‘13 87 0.26 1.25 -0.80 10.97
Commercial gent. ’90-’00 (1/0) 87 0.16 0.37 0 1
Residential gent. ’90-’00 (1/0) 87 0.13 0.33 0 1
% non-Hispanic black (2000) 87 8% 10% 1% 52%
% Hispanic (2000) 87 24% 20% 2% 85%
% foreign-born (2000) 87 33% 14% 5% 79%
% w/ college degree or greater (2000) 87 35% 19% 2% 84%
Median household income (2000) 87 $76,612 $27,205 $17,694 $144,940
% units built pre-1950 (2000) 87 29% 23% 0% 78%
% renting (2000) 87 58% 22% 6% 99%
Employees per sq. mi. (2000) 87 9,613 29,326 7 258,492
Population per sq. mi. (2000) 87 8,571 7,349 23 42,323
Road network density (2014) 87 25 8 3 42
St. intersections per sq. mi. (2014) 87 128 75 7 546

45
Table 6.3: Results for Bay Area Ridership Linear Regression
Dependent Variable % change in ridership
Independent Variables Coeff. Sig. Beta
Built Environment
% of units built pre-1950 (2000) 1.039 0.111 0.192
Employment density (2000)** -0.071 0.195 -0.168
Pop. density (2000)** -0.319 0.157 -0.188
Road network density (2014) 3.628 0.139 0.222
Street intersection density (2014) -0.075 0.586 -0.045
Socioeconomic
Median household income (2000)* 1.988 0.175 0.433
% renting (2000) 2.830 0.161 0.504
% non-Hispanic black (2000) -2.232 0.392 -0.172
% Hispanic (2000) -2.245 0.225 -0.354
% foreign-born (2000) -0.248 0.717 -0.029
% w/ college degree or greater (2000) -3.098 0.315 -0.465
Gentrification
Commercial gentrification '90-'00 (1/0) -21.748 0.436 -0.064
Residential gentrification '90-'00 (1/0) -18.832 0.532 -0.050
N 87
Constant -169.056 0.04 .
R-squared 0.124
*In thousands of dollars. **In hundreds per sq. mi.
Los Angeles
The dependent variable for the Los Angeles model was measured as a percent change in
LA Metro ridership from 2001 to 2013, and included only the Blue, Red, and Green lines. Gold,
Orange, and Expo lines were not included, as they opened after 2001. Median household income
was excluded because of multicollinearity issues. There were 46 census tracts with ridership in
both 2001 and 2013, all of which were included in the regression. Descriptive statistics for the
variables in the Los Angeles model are shown in Table 6.4.
The Los Angeles regression with robust standard errors produced only one significant
result (albeit at a 90% confidence level), which is the dummy variable for residential
gentrification in 1990-2000. That being said, the F value for the model is a high .75, suggesting
that the overall model may not be significant and should be interpreted with caution.
Interpretation of the residential gentrification variable suggests that for census tracts where
residential gentrification occurred from 1990-2000, a decrease in 25 percentage points can be
expected in the change of ridership from 2001-2013. Table 6.5 presents the regression results.

46
Table 6.4: Descriptive Statistics for Los Angeles Ridership Linear Regression
Variable Obs. Mean Std. Dev. Min. Max.
% change in ridership ’01-‘13 46 0.39% 0.28% -0.11% 1.20%
Commercial gent. ’90-’00 (1/0) 46 0.11 0.31 0 1
Residential gent. ’90-’00 (1/0) 46 0.09 0.28 0 1
% non-Hispanic black (2000) 46 17% 15% 1% 54%
% foreign-born (2000) 46 42% 18% 16% 77%
% w/ college degree or greater (2000) 46 15% 14% 1% 55%
% housing built pre-1950 (2000) 46 31% 18% 0% 84%
% renting (2000) 46 71% 25% 10% 99%
Employees per sq. mi (2000) 46 10,880 16,961 46 82,196
Population per sq. mi. (2000) 46 15,676 12,699 7 45,246
Roads network density (2014) 46 25 7 9 45
St. intersections per sq. mi. (2014) 46 122 77 18 422
Table 6.5: Results for Los Angeles Ridership Linear Regression
Dependent Variable % change in ridership
Independent Variables Coeff. Sig. Beta
Built Environment
% of units built pre-1950 (2000) 0.150 0.471 0.097
Employment density (2000) 0.000 0.547 -0.159
Pop. density (2000) 0.000 0.340 0.288
Road network density (2014) 0.003 0.661 0.086
Street intersection density (2014) 0.000 0.727 -0.108
Socioeconomic
% renting (2000) 0.002 0.454 0.188
% non-Hispanic black (2000) -0.001 0.859 -0.036
% foreign-born (2000) -0.260 0.632 -0.168
% w/ college degree or greater (2000) 0.002 0.554 0.120
Gentrification
Commercial gentrification '90-'00 (1/0) -0.152 0.373 -0.172
Residential gentrification '90-'00 (1/0) -0.249 0.052 -0.256
N 46
Constant 0.214 0.469
R-squared 0.153

47
Combined Bay Area & Los Angeles
A linear regression with robust standard error was also performed for the combined Los
Angeles and San Francisco regions. By combining the regions into a single model, we achieved a
greater number of observations for the analysis, albeit by including a dummy variable for region
(1 = L.A., 0 = S.F.). Because the Los Angeles dependent variable measures percent change in
ridership from 2001 to 2013, the combined model was altered so that all tracts reflected change
over time from 2001 to 2013. Percent Hispanic and percent college-educated were dropped
because of multicollinearity issues. Table 6.6 presents the descriptive statistics for the combined
model and Table 6.7 the model results.
The results of the regression corroborated findings produced in earlier models, in that
there is not a great deal of significance. In this combined region model, only the baseline percent
of population renting was significant. The percent renter significance mirrors a finding from
earlier regressions modeling commercial gentrification, where percent renters was found to be a
significant predictor of commercial gentrification in both regions. Here, we find percent renters
to be a significant predictor of an increase in transit ridership, suggesting, perhaps, that renters
are more likely to use transit.
Table 6.6: Descriptive Statistics for Los Angeles & Bay Area Combined Ridership Linear
Regression
Variable Obs. Mean Std. Dev. Min. Max.
% change in ridership ’01-‘13 112 0.37% 1.23% -0.84% 9.76%
Commercial gent. ’90-’00 (1/0) 112 0.12 0.32 0 1
Residential gent. ’90-’00 (1/0) 112 0.11 0.31 0 1
% non-Hispanic black (2000) 112 12% 13% 39% 54%
% foreign-born (2000) 112 37% 17% 10% 79%
Median household income (2000) 112 $60,648 $28,950 $11,375 $144,940
% renting (2000) 112 64% 24% 6% 100%
Employees per sq. mi (2000) 112 11,267 27,775 7 258,492
Population per sq. mi. (2000) 112 12,006 10,539 7 45,246
% housing build pre-1950 (2000) 112 32% 21% 0% 84%
St. intersections per sq. mi. (2014) 112 126 66 7 422
Region (1=L.A.) 112 0.41 0.49 0 1

48
Table 6.7: Results for Los Angeles & Bay Area Combined Ridership Linear Regression
Dependent Variable % change in ridership
Independent Variables Coeff. Sig. Beta
Built Environment
% of units built pre-1950 (2000) 0.000 0.982 -0.002
Employment density (2000) 0.000 0.905 -0.008
Pop. density (2000) 0.000 0.419 -0.063
Street intersection density (2014) 0.000 0.669 -0.026
Region (1=L.A.) 0.251 0.105 0.101
Socioeconomic
Median household income (2000) 0.000 0.098 0.233
% renting (2000) 0.010 0.047 0.200
% non-Hispanic black (2000) 0.001 0.881 0.013
% foreign-born (2000) -0.001 0.904 -0.008
Gentrification
Commercial gentrification '90-'00 (1/0) 0.553 0.364 0.145
Residential gentrification '90-'00 (1/0) -0.160 0.359 -0.041
N 112
Constant -0.881 0.147
R-squared 0.052
Summary
Regressions attempting to model ridership in the San Francisco Bay Area and in Los
Angeles did not produce many significant results; only one independent variable in Los Angeles
produced a finding with a p-value under .1. This is likely partially due to the small sample size of
observations (46 for Los Angeles and 87 for the Bay Area). The one arguably significant
outcome from the regressions occurred in Los Angeles and suggests that a census tract that
residentially gentrified from 1990-2000 would likely see a 25-point reduction in percentage
change of ridership from 2000-2013.
Although a single significant result is grounds only for speculation, the result of
preceding residential gentrification leading to reduced ridership may be explained by the fact that
gentrified neighborhoods are generally home to wealthier residents, who may drive more and use
transit less than people with lower incomes (Pollack, Stephanie et al., 2010, p. 24). This would
match with recent displacement research findings indicating that transit proximity in Los
Angeles and the Bay Area is associated with a loss of low-income households (Chapple et al.,
2017).

49
VII. Predicting Traffic Crashes
This section of the report examines the safety impacts of commercial gentrification in the
Bay Area and Los Angeles. Crash data used are from the California Statewide Integrated Traffic
Records System (SWITRS) and the geocoded database of crashes established by SAFETREC at
UC Berkeley.
We gathered descriptive statistics about different types of crashes around commercial
stations in the Bay Area and Los Angeles. Next, we examined the impact of transit investment on
crashes by exploring the differences in crashes before and after a rail station opened. We also
analyzed the differences between pedestrian and cyclist crashes in commercially gentrified
station areas and non-commercially gentrified station areas. We explored the influence of
commercial and residential gentrification - as well as neighborhood socio-demographic and built
environment characteristics - on pedestrian and cyclist collisions using regression analyses.
Together, these analyses help identify preliminary associations between crashes and built-
environment characteristics that are later explored through qualitative case study analysis.
Variable Construction
In this section, we outline the methodology for constructing a station area-level database
and undertaking statistical analysis of collisions around transit stations.
For the purposes of analyzing crashes in transit station areas, we classified a transit
station area as a ‘commercial station’ if any part of a commercial census tract (see definition in
section IV) overlaps with a ½-mile circular buffer around the station. This same approach was
used to define commercially gentrified and residentially gentrified stations. A key challenge we
faced was reconciling differences in geographical and temporal scales in the various source
datasets. Geographical scales included x/y coordinate point data, census tracts aggregations, and
block group aggregations. The years for which various data are available was also not entirely
consistent across source datasets (See Table 7.1).
Table 7.1, below, shows the number of total stations, the number of stations that opened
between 1997 and 2015, and the number of commercial stations and commercially gentrified
stations in Los Angeles and the Bay Area.
Table 7.1: Number of Stations in Los Angeles & Bay Area
Los Angeles Bay Area
Total Opened
‘97-‘15 Commercial
Commercially
Gent. Total
Opened
‘97-‘15 Commercial
Commercially
Gent.
95
(100%)
38
(40%)
87
(92%)
36
(38%)
132
(100%)
60
(45%)
125
(95%)
69
(52%)
Crash Data
The collision data used from SWITRS are individual records of all incidents reported
within ½-mile of a transit station from January 1, 1997 to December 31, 2015. SWITRS includes

50
information on the location, date, day of the week, time, and type of roadway on which the
collision occurred. There is also information on the modes involved (pedestrian, bicyclist,
motorcycle, private automobile, or truck), and whether alcohol was involved. Our analysis is
limited to collisions that occurred within a ½-mile circular buffer of rail transit stations. Figures
7.1 and 7.2 show the distribution of these collisions for parts of the Bay and LA Area,
respectively.
Figure 7.1: Collisions and Commercially Gentrified Tracts, SF-Oakland

51
Figure 7.2: Collisions and Commercially Gentrified Tracts, Downtown Los Angeles
For collisions in the Bay Area, we included those that occurred within ½ mile of a the
following types of stations: Bay Area Rapid Transit (BART), MUNI light rail, Santa Clara
Valley Transportation Authority (VTA) light rail and for Los Angeles we included Metro rail.
We then coded collisions according to whether they had occurred before or after the station
opened. Stations that opened in the same location as an existing station were excluded from our
analysis.
To address the temporal difference between the years a station opened and the available
crash data, we created two variables that allowed us to examine the average number of crashes
across time: years the station has been in operation and years for which we have data. If no
specific opening date for a station could be found, the 15th day of the known opening month was
assumed; if no opening month was given, we assumed July 1 of the known opening year. Table
7.2, below, indicates the variables used in our crash analyses, along with their data sources.
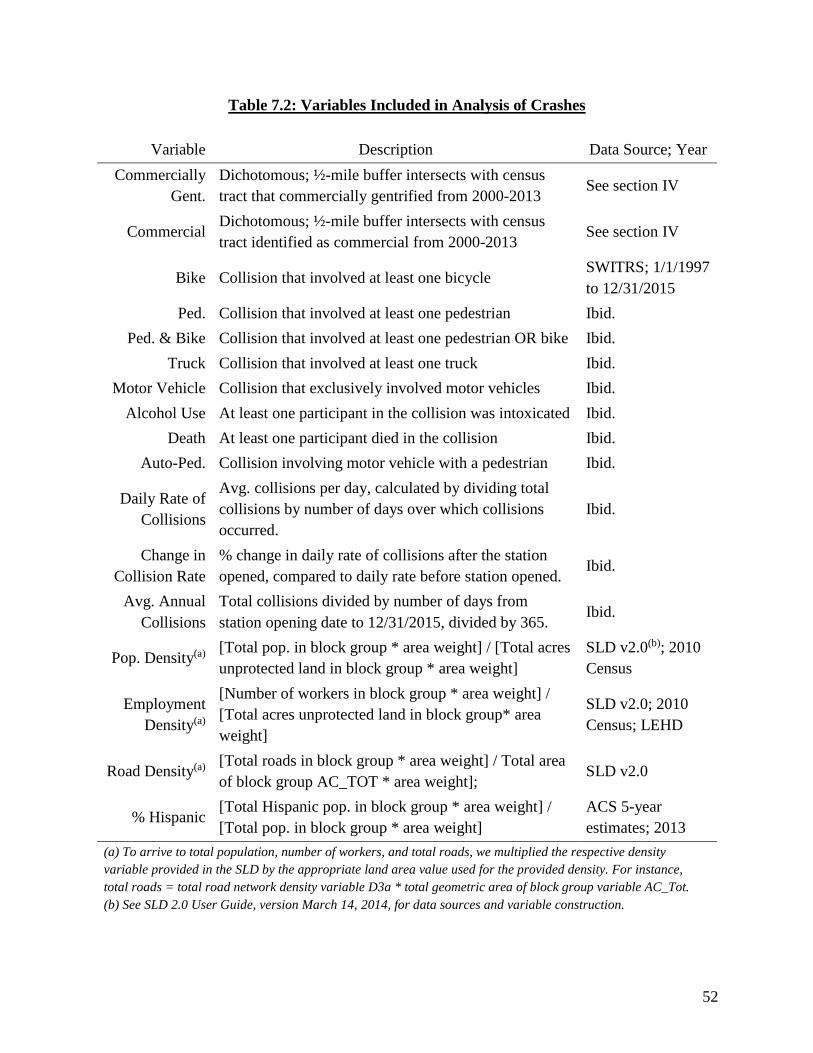
52
Table 7.2: Variables Included in Analysis of Crashes
Variable Description Data Source; Year
Commercially
Gent.
Dichotomous; ½-mile buffer intersects with census
tract that commercially gentrified from 2000-2013 See section IV
Commercial Dichotomous; ½-mile buffer intersects with census
tract identified as commercial from 2000-2013 See section IV
Bike Collision that involved at least one bicycle SWITRS; 1/1/1997
to 12/31/2015
Ped. Collision that involved at least one pedestrian Ibid.
Ped. & Bike Collision that involved at least one pedestrian OR bike Ibid.
Truck Collision that involved at least one truck Ibid.
Motor Vehicle Collision that exclusively involved motor vehicles Ibid.
Alcohol Use At least one participant in the collision was intoxicated Ibid.
Death At least one participant died in the collision Ibid.
Auto-Ped. Collision involving motor vehicle with a pedestrian Ibid.
Daily Rate of
Collisions
Avg. collisions per day, calculated by dividing total
collisions by number of days over which collisions
occurred.
Ibid.
Change in
Collision Rate
% change in daily rate of collisions after the station
opened, compared to daily rate before station opened. Ibid.
Avg. Annual
Collisions
Total collisions divided by number of days from
station opening date to 12/31/2015, divided by 365. Ibid.
Pop. Density(a) [Total pop. in block group * area weight] / [Total acres
unprotected land in block group * area weight]
SLD v2.0(b); 2010
Census
Employment
Density(a)
[Number of workers in block group * area weight] /
[Total acres unprotected land in block group* area
weight]
SLD v2.0; 2010
Census; LEHD
Road Density(a) [Total roads in block group * area weight] / Total area
of block group AC_TOT * area weight]; SLD v2.0
% Hispanic [Total Hispanic pop. in block group * area weight] /
[Total pop. in block group * area weight]
ACS 5-year
estimates; 2013
(a) To arrive to total population, number of workers, and total roads, we multiplied the respective density
variable provided in the SLD by the appropriate land area value used for the provided density. For instance,
total roads = total road network density variable D3a * total geometric area of block group variable AC_Tot.
(b) See SLD 2.0 User Guide, version March 14, 2014, for data sources and variable construction.

53
Findings
Descriptive Statistics: Frequency of Collisions
Tables 7.3 and 7.4 show the mean and median yearly averages of collisions around
commercial stations in the Bay Area and Los Angeles, respectively. We can see that collision
averages were higher in Los Angeles than in the Bay Area for all categories of collisions. In both
areas, the mean and median of collisions involving different modes were higher in the
commercially gentrified stations than in the commercial stations that have not gentrified. Almost
twice as many crashes were reported at commercially gentrified than at non-gentrified
commercial stations in the Bay Area (apprx. 102 compared to apprx. 50, respectively). Similarly,
in Los Angeles, the number of crashes reported in commercially gentrified stations was more
than twice as high as in non-gentrified commercial stations (apprx. 137 compared to apprx. 61
respectively).
Table 7.3: Bay Area, Mean & Median Annual Collisions
All Commercial
Station Areas
Commercially
Gentrified
Not Commercially
Gentrified
Mean Median Mean Median Mean Median
Bike 8.5 4.2 12.9 6.4 3.9 2.5
Truck 1.9 1.2 2.5 1.6 1.4 0.7
Motor Vehicle 56.6 48.2 71.7 59.8 41.3 31.2
Pedestrian 11.4 4 18.3 11.4 4.4 2.9
Alcohol Use 7.1 5.5 9.5 8 4.6 3.3
Total 76.2 55.7 102.3 82.3 49.6 36.8
Table 7.4: Bay Area, Mean & Median Percent Change in Collisions after Station Opening7
All Commercial
Station Areas
Commercially
Gentrified
Not Commercially
Gentrified
Mean Median Mean Median Mean Median
Bike 0.676 0.132 0.427 0.196 0.871 0.080
Truck -0.533 -0.630 -0.547 -0.555 -0.523 -0.647
Motor Vehicle -0.271 -0.344 -0.306 -0.342 -0.247 -0.359
Pedestrian -0.018 -0.128 -0.054 -0.202 0.013 -0.046
Alcohol Use -0.094 -0.146 -0.111 -0.148 -0.082 -0.139
Total -0.236 -0.281 -0.270 -0.288 -0.212 -0.275
7 Percentage expressed as decimal, i.e. “1.03”= 103% increase.

54
Tables 7.5 and 7.6 show the mean and median percentage change of collisions after
station opening in the Bay Area and Los Angeles respectively. We can see that for the Bay Area,
the percentage change of crashes increased after station opening only for crashes involving
cyclists, and decreased for all other types of crashes. For Los Angeles, the percentage change of
crashes increased after station opening for crashes involving cyclists or pedestrians, and
decreased for crashes involving only motor vehicles, trucks, or alcohol.
Table 7.5: Los Angeles, Mean & Median Annual Collisions
All Commercial
Station Areas
Commercially
Gentrified
Not Commercially
Gentrified
Mean Median Mean Median Mean Median
Bike 9 6.5 12.8 11.3 5.5 4.6
Truck 2.6 1.8 3.7 2.8 1.6 1.5
Motor Vehicle 75.2 50.3 105.1 85.6 47.6 44.3
Pedestrian 13.5 8.1 19.8 15 7.6 6.6
Alcohol Use 8.1 6 11.3 8.3 5.1 4.5
Total 97.5 65.5 137.4 111.9 60.7 54.7
Table 7.6: Los Angeles, Mean & Median Percent Change in Collisions after Station
Opening
All Commercial
Station Areas
Commercially
Gentrified
Not Commercially
Gentrified
Mean Median Mean Median Mean Median
Bike 0.831 0.859 1.157 1.170 0.632 0.558
Truck -0.048 -0.210 -0.288 -0.278 0.099 -0.104
Motor Vehicle -0.054 -0.059 -0.084 -0.130 -0.036 -0.036
Pedestrian 0.092 0.059 0.026 0.023 0.133 0.138
Alcohol Use -0.073 -0.137 -0.170 -0.176 -0.014 -0.056
Total 0.002 -0.013 -0.019 -0.017 0.014 0.016

55
Table 7.7, below, examines the overall collision trends in the Bay Area for commercial
station areas. It shows how many station areas have increasing or decreasing rates of collisions
after the station opened. We observe the following trends:
● Total collisions decreased around most stations in the Bay Area between 1997 and 2015
after the station opened, a trend that was more pronounced in commercially gentrified
station areas.
● Bike collisions generally increased after stations opened, especially in commercially
gentrified station areas.
● Pedestrian/automobile collisions decreased in most station areas after station opening.
● Collisions involving trucks decreased in the vast majority of commercial and
commercially gentrified station areas after station openings.
● Collisions involving use of alcohol decreased in most commercial and commercially
gentrified station areas after station openings.
●
Table 7.7: Number of Bay Area Stations with Increasing or Decreasing Collisions
Collision Type
# Station Areas
w/ Increasing
Crashes
# Station Areas
w/ Decreasing
Crashes
# Commercially
Gentrified Station Areas
w/ Increasing Crashes
# Commercially
Gentrified Station Areas
w/ Decreasing Crashes
Bike 37 20 20 5
Truck 5 54 1 24
Alcohol Use 16 43 7 17
Pedestrian 20 32 7 17
Motor Vehicles 5 55 1 24
Total 6 54 1 24
Table 7.8, below, examines the overall collision trends in Los Angeles for commercial
station areas. Trends of note include:
● Bicycle collision rates generally increased across all types of station areas in Los Angeles
after the opening of the station, with the only exception of two non-commercially
gentrified stations.
● Pedestrian collision rates increased at most station areas but decreased at most
commercially gentrified station areas.
● Truck collision rates decreased in all commercially gentrified station areas and in the
majority of non-gentrified ones (27 out of 37) after the opening of a station.
● The majority of station areas saw collision rates involving only motor vehicles decrease
after the opening of the station, in both all station areas and in commercially gentrified
station areas.
● Collisions involving alcohol decreased in most station areas after the opening of the
station; this decrease was especially notable in commercially gentrified station areas.

56
Table 7.8: Number of Los Angeles Stations with Increasing or Decreasing Collisions
Collision Type
# Station Areas
w/ Increasing
Crashes
# Station Areas
w/ Decreasing
Crashes
# Commercially
Gentrified Station Areas
w/ Increasing Crashes
# Commercially
Gentrified Station Areas
w/ Decreasing Crashes
Bike 35 2 14 0
Truck 10 27 0 14
Alcohol Use 12 25 1 13
Pedestrian 22 15 6 8
Motor Vehicles 11 26 3 11
Total 18 19 5 9
T-tests
We prepared two t-tests for each study region to examine the association of commercial
gentrification with the rate of collisions surrounding the stations. The first test examined whether
commercially gentrified stations had higher crash rates than non-commercially gentrified
stations. To do this, we utilized an independent samples t-test, comparing crash rates after each
station had opened. Because the t-test measures correlation, rather than causal impact, a second
test was performed to try to isolate the impact of the station opening on the collision rate at each
station. For this test, we calculated the percentage change in collision rate for each station after
the station opened. Only stations that opened between 1997 and 2015 were used for this analysis.
The test examined whether stations opening in commercially gentrified areas showed statistically
significant differences in their collision rates from non-commercially gentrified stations. We
again used an independent samples t-test.
To construct the rate of collision and identify changes in the rate, we first calculated the
number of collisions by station, identifying which had occurred before and which after a
station’s opening. Starting in 1997 (the first year of SWITRS data), we identified the rate of
collisions per day for each station area, before and after the station had opened, by dividing the
total number of collisions before and the total number of collisions after the station’s opening by
the total number of days from January 1, 1997 to the day of the station opening, and the total
number of days from the station opening until December 31, 2015, respectively. We produced
collision rates for pedestrian, bike, alcohol-involved, and motor vehicle crashes. We were unable
to examine the before and after effects for stations that had opened prior to 1997.

57
Table 7.9 shows the number of Bay Area stations included as part of the dataset. In this
case, all stations could be used for the first test (comparing the crash rates between commercially
gentrified and non-commercially gentrified stations), since all stations had opened prior to 2015.
Sixty of the 132 stations opened between 1997 and 2015, and thus could be included in the
second test.
Table 7.9: Number of Stations in Bay Area Dataset
Number of Stations
Total Station
in Dataset
Stations Opened
from 1997-2015
Commercial Stations 125 60
Commercially Gentrified from 2000-2013 69 35
Total 132 60
Table 7.10 shows the numbers of Los Angeles stations used in each of the t-tests. In Los
Angeles, there are a total of 94 stations, but only 38 stations opened between 1997 and 2015.
Thirty-seven of the 38 stations are in commercial areas, and 14 of these stations commercially
gentrified between 2000 and 2013. For the first t-test, we examined a total of 75 commercial
stations, comparing the post-opening crash rates at the 36 commercially gentrified stations to the
crash rates at the 39 (75-36) commercial stations that have not commercially gentrified.
Table 7.10: Number of Stations in Los Angeles Dataset
Number of Stations
Total Stations
in Dataset
Stations Opened
Pre-2015
Stations Opened
from 1997-2015
In Commercial Area 87 75 37
Commercially Gentrified from 2000-2013 36 36 14
Total 94 81 38
Table 7.11 shows the corresponding correlations from the first t-test for the Bay Area.
Again, we looked only at stations located in commercial areas. The Bay Area shows a strong
correlation between commercially gentrified stations and a higher rate of collisions across all
categories.

58
Table 7.11: First T-Test, Bay Area General Correlation for Crashes After Station Opening
Variable Correlation w/ Commercial Gentrification Significance
Bike .387 .000***
Truck .250 .005***
Alcohol Use .405 .000***
Pedestrian .371 .000***
Motor Vehicles .369 .000***
Total .406 .000***
***p ≤ 0.01; ** ≤ 0.05, * ≤ 0.1
Table 7.12 presents the results of the first t-test for Los Angeles, looking at the
correlation between commercial gentrification and the rate of collisions in the corresponding
station area after each station opened. All crash categories show a significant correlation (at the
99% level) between the rate of collisions and the status of the station area as commercially
gentrified. In other words, we found the rate of collisions in commercially gentrified station areas
was higher for all types of crashes than it was in non-commercially gentrified station areas. This
association, however, could easily be caused by a lurking variable. One hypothesis is that
commercial gentrification is more likely to occur at stations that receive more traffic and thus
have higher rates of collisions, irrespective of the degree of gentrification. Station areas that were
not located in commercial census tracts were not included as part of this test.
Table 7.12: First T-Test, Los Angeles General Correlation for Crashes After Station
Opening
Variable Correlation w/ Commercial Gentrification Significance
Bike .480 .000***
Truck .418 .000***
Alcohol Use .477 .000***
Pedestrian .460 .000***
Motor Vehicles .431 .000***
Total .473 .000***
***p ≤ 0.01; ** ≤ 0.05, * ≤ 0.1
Tables 7.13 and 7.14 show the results of the second t-test for the Bay Area. No crash
types were significant when looking at the percent change in the collision rate after a station
opened in the Bay Area, or when comparing commercially gentrified and non-commercially
gentrified stations. This analysis suggests that commercial gentrification is not a significant
explanation for shifts in the rate of collisions after station openings in the Bay Area.

59
Table 7.13: Second T-Test, Bay Area Correlations for Percent Change in Collisions
After Station Opening
Variable Correlation w/ Commercial Gentrification Significance
Bike -.077 .568
Truck -.031 .817
Alcohol Use -.040 .764
Pedestrian -.076 .594
Motor Vehicles -.147 .261
Ped. & Bike -.094 .481
Total -.150 .252
***p ≤ 0.01; ** ≤ 0.05, * ≤ 0.1
Table 7.14: T-Test for Crash Rates in Commercially Gentrified vs. Non-Commercially
Gentrified Bay Area Station Areas
Variable T-Statistic Significance
Bike .645 .523
Truck .258 .798
Alcohol Use .331 .742
Pedestrian .535 .595
Motor Vehicles 1.207 .232
Ped. & Bike .724 .472
Total 1.210 .231
***p ≤ 0.01; ** ≤ 0.05, * ≤ 0.1
Table 7.15 presents the results of the second t-test for Los Angeles, which examines the
correlation between percent change in crashes after opening and a station area’s commercial
gentrification status. The results show two variables as significant at the 99% confidence level
and one significant at the 90% confidence level. The percentage change in the bicycle-involved
collision rate after the station opened is likely to be greater at commercially gentrified stations
than at non-commercially gentrified stations. This may mean that commercially gentrified areas
attract more vehicular and bicycle traffic, and hence are likely to experience more collisions. The
other two significant variables – collisions involving trucks and those involving alcohol - showed
a negative association with commercial gentrification, meaning that the rate of change was likely
to be lower in stations that had not commercially gentrified than in stations that had. This trend
was significant at the 95% level for collisions involving alcohol and at the 90% level for
collisions involving trucks. Perhaps fewer trucks traveled to commercially gentrifying transit
areas (due to a loss of warehouse and/or industrial space) or perhaps improvements in traffic
control infrastructure reduced the rate of collisions for trucks. The association of gentrifying
transit areas with relatively lower rates of collisions involving alcohol use is somewhat

60
surprising, because the popular narrative (and interview-based data introduced later in this
report) associates commercial gentrification with an increasing number of bars and restaurants.
That being said, it is possible that patrons of establishments in commercially gentrified areas
have greater ability to afford taxis or ride-hailing services (Uber, Lyft, etc.), which reduce the
likelihood of alcohol-involved crashes. Indeed, a number of interviewees in the case studies of
commercially gentrified stations noted that they many of their patrons use ride-hailing services.
Table 7.15: Second T-Test, Los Angeles Correlations for Percent Change in
Collisions After Station Opening
Variable Correlation w/ Commercial Gentrification Significance
Bike .472 .003***
Truck -.281 .092*
Alcohol Use -.345 .004***
Pedestrian -.254 .129
Motor Vehicles -.148 .381
Total -.122 .471
***p ≤ 0.01; ** ≤ 0.05, * ≤ 0.1
For the t-test shown in Table 7.16, we compared post-opening crash rates in the 14
commercially gentrified station areas in Los Angeles to crash rates in 23 non-commercially
gentrified station areas. When we look at the corresponding t-test for these variables, we see that
there was a statistically significant difference in bicycle collisions (at the 95% significance level)
and in collisions involving trucks, pedestrians, and alcohol (at the 90% significance level)
between the two types of stations. The association is positive for bicycle collisions, indicating
that commercially gentrified station areas had higher rates of bicycle collisions than non-
commercially gentrified station areas. On the other hand, commercially gentrified station areas
had lower rates of collisions involving pedestrians, trucks or alcohol.
Table 7.16: T-Test for Crash Rates in Commercially Gentrified vs. Non-Commercially
Gentrified Los Angeles Station Areas, Equal Variances Not Assumed
Test T-Statistic Significance
Bike 3.161 .004***
Truck -2.208 .037**
Alcohol -2.403 .022**
Pedestrian -1.744 .090*
Motor Vehicles -.888 .381
Total -.729 .471
***p ≤ 0.01; ** ≤ 0.05, * ≤ 0.1

61
Regression Model Results
Regression Variables
To conduct regression analyses, we constructed three dependent variables and tested
three categories of independent variables with each dependent variable. The dependent variables
were the average annual:
• Total collisions at each station.
• Collisions at each station involving bikes or pedestrians.
• Collisions at each station involving autos and pedestrians.
To calculate the average annual collisions, we tabulated the total collisions that occurred
after a station opened using the same approach outlined for the descriptive statistical tests. We
then calculated the number of years the station had been operating by calculating the total
number of days from the station opening until December 31, 2015 and dividing by 365.
In our regression models, we used three categories of independent variables:
• Traffic level exposure related to the built environment (road intersection density and street
intersection density).
• Pedestrian exposure (population and employment density).
• Socioeconomic characteristics of the population (poverty rate, share of population
identifying as Hispanic, commercial gentrification, and residential gentrification).
There was considerable multicollinearity amongst the traffic and sociodemographic
factors, and as a result only one variable for each factor was included in the final regression
models. In addition, we controlled for three outlier8 stations in each area - BART Civic Center,
BART Powell, and Muni Metro Van Ness St. in the Bay; and Civic Center, Pico, and Metro
Center in Los Angeles. The outlier stations were controlled for by developing a dummy variable
representing outlier or non-outlier station. In general, the complete exclusion of the variables
does not change the relationships presented in the final models – neither the relative strength of
the predictors, nor their direction change. The only changes we noted are in the adjusted r-
squared values. For Los Angeles, adjusted r-squares decline for the first model on all collisions
but increase for the bike-pedestrian and auto-pedestrian models. For the Bay Area, adjusted r-
squared values decline in all three models when removing outliers. All variables in the regression
models, with the exception of road density, are not normally distributed. To examine the
robustness of our model given the non-normal distributions, we utilized various transformations
and a negative binomial approach; however, all models showed the same direction and
significance for most variables. For ease of interpretation, we present simple OLS regression
results.
Data on residential gentrification came from Chapple et al. (2017). Data for the traffic
and pedestrian exposure factors came from the EPA's Smart Location Database (SLD).
8 We identified outliers using DFFIT and Cook’s D statistics, both of which are very similar. A large DFFIT or
Cook’s D value indicates influential observations. The general cutoff of absolute two was used to identify influential
observations.

62
Socioeconomic data used were from the 2009-2013 5-year American Community Survey (ACS).
Data were originally collected at the census block group level and were area-weighted to the ½-
mile circular buffer around stations.9
One limitation of weighting by area is that it assumes the population and built
environment factors that contribute to crash exposure are evenly distributed across the
geography. This assumption may lead to under- or overestimation of exposure. The magnitude of
error introduced by this assumption should be assessed in future research, either using finer grain
data or in situ observations.
Findings
We used OLS regressions to explore the relationship between commercial gentrification
and all crash types, pedestrian-involved crashes, and auto-pedestrian crashes. The results of the
final models are shown in Table 7.18 for Los Angeles, Table 7.20 for the Bay Area, and Table
7.21 for both areas combined.
Los Angeles
Table 7.17 presents the descriptive statistics for the Los Angeles regression model. As
indicated in Table 7.18, commercial gentrification shows a significant positive relationship with
increases in the average number of collisions, a relationship that holds for all three models.
Residential gentrification is only significant in the model for all collisions. The percent Hispanic
population shows a negative relationship in all three models, which does not support the
assumption that collisions are more likely to happen in low-income, minority neighborhoods, a
relationship documented by Loukaitou-Sideris et al. (2007) for auto-pedestrian collisions in Los
Angeles. The measure of traffic level exposure is not significant in any of the three models.
Amongst the pedestrian exposure variables, only population density is significant and then only
for auto-pedestrian crashes and crashes involving pedestrians and cyclists. The average annual
number of collisions decreases with the length of time the station has been operating.
9 Transforming the data into a station area-level database required two steps: 1) Using ArcMap, we created area
weights for each block group that fell within the ½-mile circular buffer around each station. Shapefiles used to
create the weights are from Tigerline. 2) Total roads, total street intersections, total population, and total
employment are not provided in the EPA SLD (they are only provided as densities). In order to create area-weighted
densities, we first calculated totals by multiplying the respective density by area. The resulting totals were then
summarized and area-weighted with the census block group data in SAS 9.4. For ACS data, absolute numbers were
also area-weighted before calculating percentages for these populations.

63
Table 7.17: Los Angeles Traffic Crash Regression Descriptive Statistics (n=81)
Mean Median Min. Max. Std. Dev
Dependent Variables
Annual Avg., All 111.33 80.50 9.53 391.91 82.33
Annual Avg., Bike & Ped. 25.23 19.73 1.00 101.04 21.36
Annual Avg., Auto-Ped. 14.10 9.96 0.50 60.00 12.10
Independent Variables
Pedestrian Exposure
Population Density 24.16 22.12 0.05 80.10 15.17
Employment Density 28.11 12.35 1.03 306.99 46.95
Traffic Level Exposure
Road Density 25.42 24.75 11.45 40.43 6.18
Socioeconomic
% Hispanic Pop. 0.54 0.54 0.13 0.98 0.25
Other Controls
Years Operating 15.33 18.00 2.00 24.00 7.79

64
Table 7.18: Los Angeles Traffic Crash Regression Results (valid n=80)
Dependent Variable All Collisions Bike & Pedestrian Auto-Pedestrian
Independent Variables Coeff. Sig. Beta Coeff. Sig. Beta Coeff. Sig. Beta
Pedestrian Exposure
Population Density 0.863 0.056 0.158 0.589 <.0001 0.415 0.446 <.0001 0.554
Employment Density -0.156 0.416 -
0.090 0.042 0.403 0.094 0.042 0.108 0.166
Traffic Level
Exposure
Road Density 0.781 0.435 0.058 0.300 0.259 0.085 -0.135 0.325 -0.068
Socioeconomic
% Hispanic Pop. -107.553 0.001 -
0.322 -28.629 0.000 -0.330 -13.185 0.002 -0.268
Commercial Gent. (0/1) 57.898 <.0001 0.353 12.633 0.001 0.297 4.610 0.018 0.191
Residential Gent. (0/1) 39.576 0.005 0.240 3.788 0.303 0.088 3.425 0.074 0.141
Other Controls
Years Operating -3.327 <.0001 -
0.317 -0.807 <.0001 -0.296 -0.304 0.004 -0.197
Outliers (0/1) 185.714 <.0001 0.433 19.569 0.060 0.176 12.338 0.023 0.195
Constant 135.136 <.0001
22.080 0.008
13.425 0.002
Adjusted R2 0.638
0.625
0.6885
Bay Area
The descriptive statistics for the Bay Area model are show in Table 7.19 and the final
model results in Table 7.20. The models for the San Francisco Bay Area are very different from
those for Los Angeles, which may be indicative of the rich transit history in the Bay Area.
Neither commercial nor residential gentrification show a significant relationship with increases
in the average annual number of any type of collision. Unlike in Los Angeles, however, increases
in the share of the Hispanic population are positively related to increases in all crashes. Increases
in employment and road density are also significantly associated with increasing rates of
collision – factors that were not significant in LA. As with LA, population density is only
significant for auto-pedestrian and bike-pedestrian crashes. Further, similar to Los Angeles, the
average number of collisions decreases with the length of time the station has been operating.
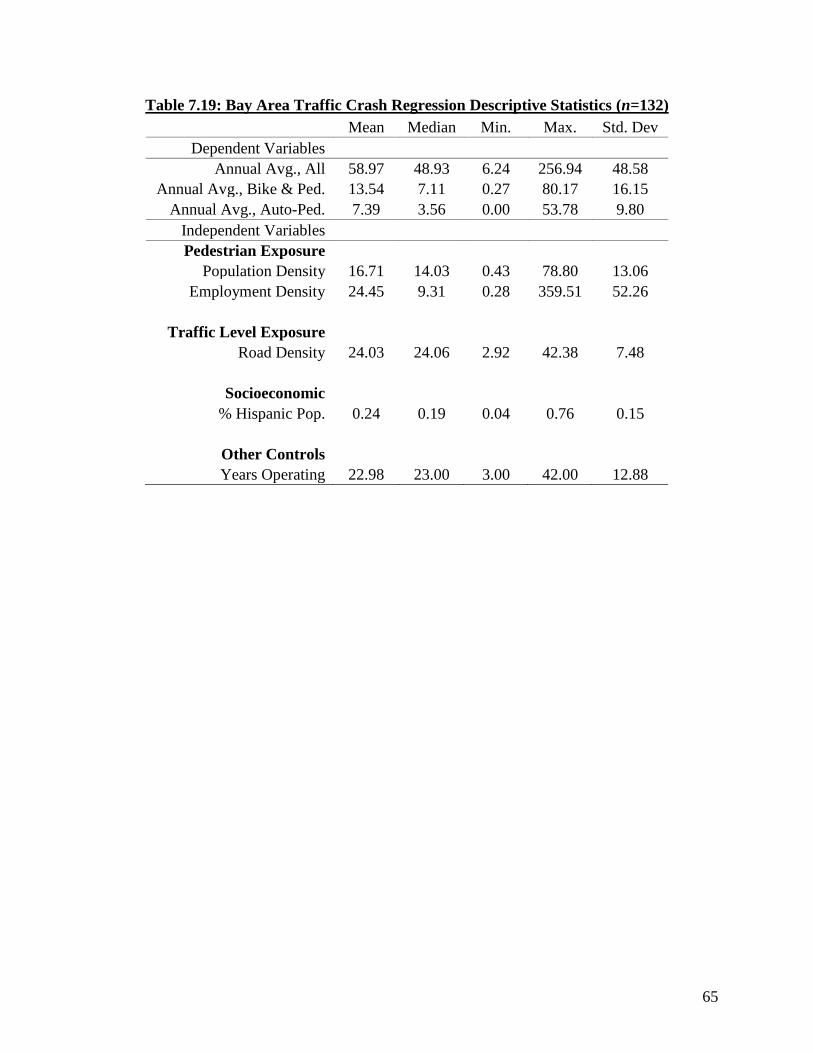
65
Table 7.19: Bay Area Traffic Crash Regression Descriptive Statistics (n=132)
Mean Median Min. Max. Std. Dev
Dependent Variables
Annual Avg., All 58.97 48.93 6.24 256.94 48.58
Annual Avg., Bike & Ped. 13.54 7.11 0.27 80.17 16.15
Annual Avg., Auto-Ped. 7.39 3.56 0.00 53.78 9.80
Independent Variables
Pedestrian Exposure
Population Density 16.71 14.03 0.43 78.80 13.06
Employment Density 24.45 9.31 0.28 359.51 52.26
Traffic Level Exposure
Road Density 24.03 24.06 2.92 42.38 7.48
Socioeconomic
% Hispanic Pop. 0.24 0.19 0.04 0.76 0.15
Other Controls
Years Operating 22.98 23.00 3.00 42.00 12.88

66
Table 7.20: Bay Area Traffic Crash Regression Results (n=132)
Dependent Variable All Collisions Bike & Pedestrian Auto-Pedestrian
Independent Variables Coeff. Sig. Beta Coeff. Sig. Beta Coeff. Sig. Beta
Pedestrian Exposure
Population Density 0.343 0.341 0.092 0.372 <.0001 0.301 0.311 <.0001 0.414
Employment Density 0.192 0.005 0.206 0.080 <.0001 0.259 0.060 <.0001 0.323
Traffic Level Exposure
Road Density 2.883 <.0001 0.444 0.686 <.0001 0.318 0.233 0.005 0.178
Socioeconomic
% Hispanic Pop 55.920 0.006 0.170 4.358 0.383 0.040 2.522 0.387 0.038
Commercial Gent. (0/1) 9.416 0.171 0.097 1.748 0.307 0.054 0.744 0.455 0.038
Residential Gent. (0/1) 0.292 0.965 0.003 1.283 0.440 0.040 1.009 0.299 0.052
Other Controls
Years Operating -1.700 <.0001 -0.451 -0.318 <.0001 -0.254 -0.188 <.0001 -0.248
Outliers (0/1) 55.717 0.025 0.172 29.672 <.0001 0.275 15.665 <.0001 0.239
Constant -1.148 0.924
-6.990 0.021
-2.352 0.180
Adjusted R2 0.558
0.752
0.770
Combined Los Angeles & Bay Area
The model presented in Table 7.21 combines all observations for both regions.
Residential gentrification is not included in these models because it was defined differently for
each of the two areas by Chapple et al. (2017) to account for variations in data availability by
region. This set of models indicates that both measures of pedestrian exposure (population and
employment density) are positively associated with increases in the average number all types of
crashes, and traffic level exposure (defined as road density) is only significant for all collisions
and bike- or pedestrian-involved crashes. The share of the Hispanic population also plays a
significant role for auto-pedestrian collisions and incidents involving cyclists and pedestrians.
Commercial gentrification plays a significant role for all crashes and for bike-pedestrian crashes,
but not for auto-pedestrian crashes. Length of station operation is associated with a drop in
crashes for all models.

67
Table 7.21: Regression Results, Combined Los Angeles & Bay Area Station Areas
Dependent Variable All Collisions Bike & Pedestrian Auto-Pedestrian
Independent Variables Coeff. Sig. Beta Coeff. Sig. Beta Coeff. Sig. Beta
Pedestrian Exposure
Population Density 0.682 0.016 0.143 0.570 <.0001 0.426 0.432 <.0001 0.552
Employment Density 0.212 0.010 0.156 0.088 <.0001 0.231 0.066 <.0001 0.296
Traffic Level Exposure
Road Density 2.019 0.000 0.207 0.461 0.001 0.169 0.060 0.397 0.037
Socioeconomic
% Hispanic Pop -32.885 0.069 -0.115 -12.564 0.004 -0.157 -6.088 0.009 -0.130
Commercial Gent. (0/1) 24.555 0.001 0.180 4.764 0.006 0.125 1.965 0.032 0.088
Other Controls
Years Operating -2.052 <.0001 -0.355 -0.429 <.0001 -0.266 -0.218 <.0001 -0.230
Outliers (0/1) 102.590 <.0001 0.250 19.981 0.000 0.174 11.207 <.0001 0.166
Region (1=LA) 37.672 <.0001 0.268 6.829 0.002 0.173 3.232 0.006 0.140
Constant 34.960 0.012
0.975 0.765
2.416 0.168
Adjusted R2 0.548
0.675
0.728
Summary
In both study regions, commercially gentrified station areas have higher rates of
collisions per year than those station areas that have not experienced commercial gentrification.
One possible explanation for this is that commercially gentrified station areas see more
vehicular, pedestrian, and bicycle traffic, and hence are likely to experience more collisions.
Future research should seek to identify and incorporate in the models traffic counts for study
areas; such traffic counts may represent an important independent variable but were not available
for the present study.
Only in Los Angeles was the percent change after station opening in bike-involved,
truck-involved, and alcohol-involved crashes significantly correlated with commercial
gentrification. In the Bay Area, there were no changes in any crash types that were significantly
associated with commercial gentrification.
Regressions conducted in this section show that, all else held equal, commercial
gentrification has a positive relationship with average annual collisions in the Los Angeles and
combined region models, and percent Hispanic population has a negative relationship with
average annual collisions in Los Angeles but a positive relationship in the Bay Area. Pedestrian-

68
and bicycle-involved crashes were only significantly predicted by commercial gentrification in
the combined region and Los Angeles regressions.
These regression results provide some support for a hypothesis that commercially
gentrified station areas pose additional risks to pedestrians and bicyclists. This may happen
because commercially gentrified stations may attract more vehicular, pedestrian, and bicyclist
traffic. The significant effect that commercial gentrification produces in Los Angeles (but not in
the Bay Area) begs the question of difference between Los Angeles and Bay Area transit
stations. Is there a significant difference in the streetscape and built environment around
commercially gentrified Los Angeles stations that contributes to the increased rate of crashes, or
are these figures purely a result of exposure? Further research on this subject is needed.

69
VIII. Case Studies
To produce a richer exploration of the subject matter at hand, we conducted interview-
and observation-based case studies in both Los Angeles and the Bay Area. This qualitative
research involved selecting two study areas for each region: one that commercially gentrified
from 2000-2013 and one that did not commercially gentrify during that time period. In the Bay
Area, adjacent census tracts were selected as study areas, whereas in Los Angeles, two non-
adjacent but proximate station areas, both along the Metro Red Line, were selected as study
areas.
For each case study area, we conducted in-person or phone interviews with merchants,
shop managers, and real estate professionals working in commercial corridors in the transit
neighborhoods. Long-time residents, shop employees, and a president of the board of a mixed-
use building in one station area were also interviewed. We conducted six or more interviews in
each tract or station area, as well as three or more interviews with real estate professionals for
each study region. Interviews lasted approximately 15 to 45 minutes. Establishment employees
and owners were asked questions about whether and how they felt the commercial district was
changing. They were also asked to provide details on if and how pedestrian, bicycle, and vehicle
traffic has changed over the last years, and what they believed might be causing those changes.
Most interviews were conducted in-person and some were conducted by telephone after notes
had been left for business owners. The full interview guide is provided in Appendix E.
Interviews were supplemented with structured field observations that involved
identifying certain built environment elements (e.g. sidewalk widths, traffic lights, marked
crosswalks, etc.) that may have an impact on crashes. Observation conducted along commercial
corridors was meant to identify the types of commercial storefronts that may characterize
commercial areas that are currently, prone to, or not experiencing commercial gentrification.
Observations were conducted by researchers who walked the length of the corridor once or more
during the daylight hours. Commercial establishment characteristics recorded included
standalone or strip mall establishments, presence of ethnic businesses, chain stores, and vacant or
evicted properties, etc. (See Appendix F for complete observation instrument).
The primary purpose of the case studies was to produce greater detail and complement
the results of the quantitative analyses. Data sources such as NETS, the ACS, and SWITRS are
valuable tools that help researchers objectively identify trends and outcomes over time. The
inflexibility of these statistics, however, can mask important human elements of city planning
analyses: How do people feel about these changes? How do they respond to them? Are the
changes a product of something that those affected can identify, but regression analysis cannot?
The value in qualitative case studies, therefore, is multifold: Qualitative research puts
human faces to the changes happening in transit-proximate neighborhoods; it allows for guided
speculation about the reasons, effects, and responses to these changes; and it produces rich
information that supplements secondary data analyses.
Ground-Truthing Gentrification
In both Los Angeles and the Bay Area, we interviewed shop owners, managers, and real
estate professionals about the changes (or lack thereof) occurring in our case study areas. We
were able to apply our qualitative findings to our NETS-based definition of commercial
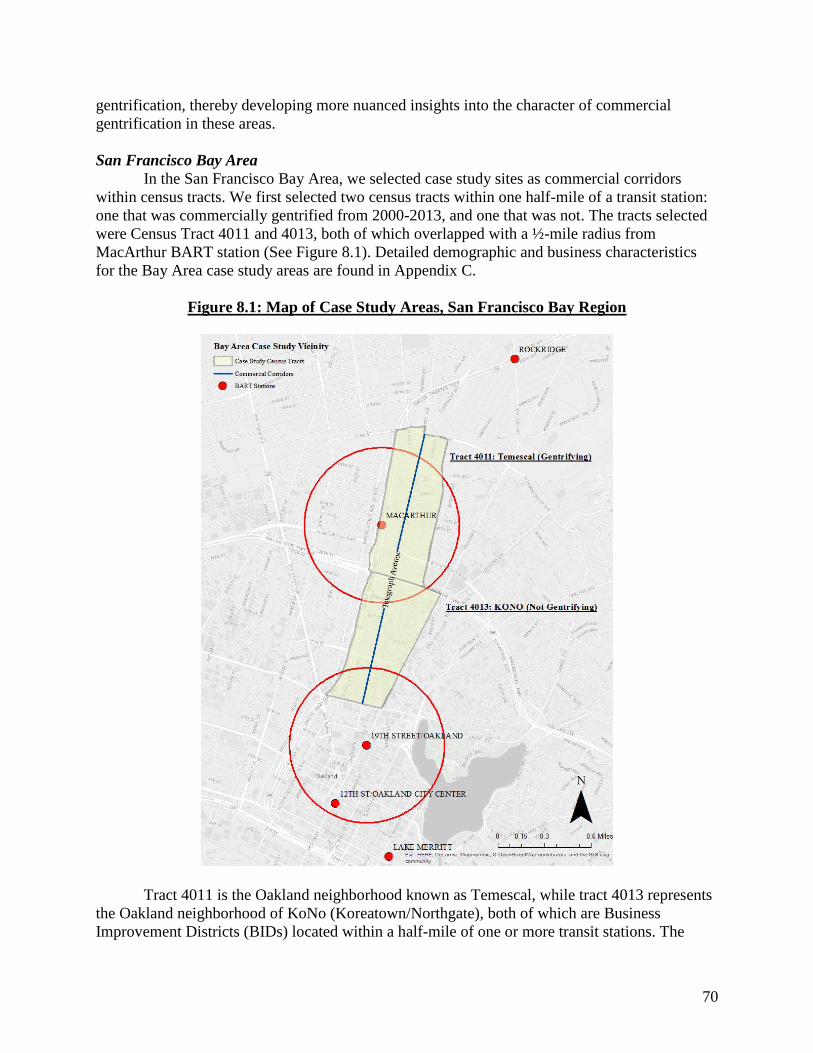
70
gentrification, thereby developing more nuanced insights into the character of commercial
gentrification in these areas.
San Francisco Bay Area
In the San Francisco Bay Area, we selected case study sites as commercial corridors
within census tracts. We first selected two census tracts within one half-mile of a transit station:
one that was commercially gentrified from 2000-2013, and one that was not. The tracts selected
were Census Tract 4011 and 4013, both of which overlapped with a ½-mile radius from
MacArthur BART station (See Figure 8.1). Detailed demographic and business characteristics
for the Bay Area case study areas are found in Appendix C.
Figure 8.1: Map of Case Study Areas, San Francisco Bay Region
Tract 4011 is the Oakland neighborhood known as Temescal, while tract 4013 represents
the Oakland neighborhood of KoNo (Koreatown/Northgate), both of which are Business
Improvement Districts (BIDs) located within a half-mile of one or more transit stations. The

71
MacArthur BART station, which sees an average of 8,826 station exits on a typical weekday
(“Ridership Reports,” 2017), is within a half-mile of both census tracts. A 2009 Center for
Community Innovation study classified both neighborhoods as highly susceptible to residential
gentrification (Chapple, 2009).
The commercial corridor in both census tracts was defined as Telegraph Avenue. In
Temescal, the commercial corridor was defined as Telegraph from 51st Street to West
MacArthur Boulevard, while in KoNo the commercial boulevard was defined from West Grand
Avenue to 32nd Street. Observation and interviews were then conducted on these two
commercial corridors.
The stretch of Telegraph Ave. in Temescal consists of a six-block strip of primarily
small, locally-owned businesses that run through some of the more affluent neighborhoods in the
MacArthur area, many of which have recently gentrified (Phillips, Flores, & Henderson, 2015).
With the support of the Temescal BID, the ‘hip’ and ‘cool’ strip now displays banner-signs
touting its restaurants, shopping, and ‘authentic local flavor’. The neighborhood was once home
to Italian, then African, and later Korean immigrants, but is now a predominantly white, middle-
to upper-middle class area. National media has described Temescal as “Oakland’s answer to San
Francisco’s Mission District and the city of Berkeley, drawing a mix of yuppies and plaid-
wearing hipsters” (Woo, 2009), and the “hippest part of Oakland” (Haber, 2014).
According to a UC Berkeley Center for Community Innovation study, of the 224
commercial parcels along the Temescal stretch of Telegraph Ave., 49% turned over between
2007 and 2014 (Montojo & McElvain, 2015, p. 12). Twenty-five percent of the businesses
replaced by 2014 were retail businesses, and another 17% were restaurants or food service
establishments (Ibid.). The greatest change in business type occurred amongst service
establishments, 35% of which were replaced by 2014 (Ibid.). Nearly all local-serving businesses
that have closed, have been replaced by new local-serving establishments, and NETS data show
that the ratio of regional to local-serving businesses has remained fairly consistent over time.
However, certain names of new businesses suggest that, while they may still be local-serving,
they cater to a new local demographic - one that differs from the clientele of replaced businesses.
For example, several African/African-American hair salons and barber shops are among the
replaced businesses, which reflects the decline in African-American residents throughout the
MacArthur BART station area.
Basic descriptive statistics from the area show a neighborhood in transition. By and large,
both census tracts have witnessed increases in population density and median household income
in the past decade (See Table 8.1). The demographics of the area have changed, as well: There
are fewer non-Hispanic blacks, more Latinos, and there has also been significant turnover in
Asian/Pacific Islanders, and whites (See Table 8.1).

72
Table 8.1: Change in Selected Demographic Characteristics from 2000-2013 – Bay Area
Bay
Area
San
Francisco
Alameda
County Oakland Temescal KoNo
Total Population 7.0% 5.2% 6.3% -0.6% 5.1% 43.0%
Population Density (per
sq. mi.) 7.2% 4.8% 6.1% -0.1% 0.5% 39.0%
Median Household
Income (2013 $) -10.4% -3.4% -7.8% -6.1% 15.7% 26.3%
% Renting Households 4.3% -2.5% 3.3% 1.8% -2.0% -8.7%
% Non-Hispanic White -16.0% -4.4% -17.6% 11.0% 28.5% -12.1%
% Black -14.1% -25.7% -19.2% -24.3% -29.5% -30.9%
% Asian/Pacific Islander 24.5% 7.7% 31.4% 8.8% -24.6% 83.1%
% Hispanic 21.6% 7.7% 18.7% 17.4% 23.8% 125.5%
% Native American/Other -10.6% 17.5% -16.3% 0.6% -86.1% -35.7%
% Two or More Races 5.8% 9.4% 1.0% 23.9% 9.7% -38.2%
Both study areas in the Bay Area have seen significant growth in the number and density
of business establishments, but have seen a decline in the average establishment size, as
measured by number of employees. As can be seen in Table 8.2, the changes mirror higher-level
regional trends in direction, but the magnitude of changes in the case study neighborhoods is less
than those at regional levels.
Table 8.2: Change in Selected Business Characteristics from 2000-2013 – Bay Area
Bay
Area
San
Francisco
Alameda
County Oakland
Temescal
Study Area
KoNo
Study Area
Total
Establishments 65.3% 57.5% 61.2% 56.0% 43.2% 24.5%
Establishments per
sq. mi. 65.3% 57.5% 61.2% 56.0% 43.2% 24.5%
Employees per
establishment -31.0% -26.9% -30.5% -29.6% -16.8% -13.0%
Field observations included counts of different business types along commercial corridors
in the case study areas, with the intent of better understanding built environment characteristics
in commercially gentrifying and non-commercially gentrifying areas. Figure 8.3, below, shows
the establishment types that were recorded by researchers. Some establishment types are not
mutually exclusive.

73
Table 8.2: Establishment Type Counts, Bay Area Case Study Station Areas
Temescal,
Commercially
Gentrified
KoNo,
Not Commercially
Gentrified
Difference for
Commercially
Gentrified Tract
Standalone 118 (88%) 75 (96%) -8%
Strip mall 16 (12%) 3 (4%) +8%
Ethnic (non-Anglo) 28 (21%) 28 (36%) -15%
Chain 5 (4%) 3 (4%) 0%
Vacant 7 (5%) 6 (8%) -3%
For sale 1 (1%) 0 (0%) +1%
For rent 5 (4%) 6 (8%) -4%
‘Trendy’ 11 (8%) 6 (8%) 0%
Total Establishments 134 78 +56
Comparing business establishment counts in the commercially gentrified corridor
(Temescal) and the non-commercially gentrified corridor (KoNo) yields some valuable insights
(although differences may not be statistically significant). In the commercially gentrified district,
we see significantly fewer ethnic establishments, which establishes some veracity for our
definition of commercial gentrification (see section IV), as well as for the accuracy of the NETS
data used in developing that definition (assuming there is significant overlap between ‘ethnic’
and minority-owned businesses). Also present in the commercially gentrified area are more strip
mall establishments. Many of these establishments are part of the Temescal Plaza and Koryo
Village shopping malls, which represent a significant amount of leasable commercial space.
There were only very slight differences in for sale or vacant properties in the two study
areas - one percent more ‘for sale’ properties and three percent less vacant properties in the
commercially gentrified area than in the non-gentrified area. These results, however, are close
enough to zero to be considered null. Some interviews corroborated these findings, suggesting
that the KoNo tract was less attractive to tenants but rapidly becoming more so. One real estate
broker working in the area described the northern Temescal and Southern KoNo areas as
“bookends - the best parts” of Telegraph and said that the KoNo tract had “done a 180” in the
past few years and now “retail is totally taking off.”
In the commercially gentrified Temescal neighborhood, many businesses noticed a
change in the type of establishments in the area. One business owner remarked on the changing
clientele in the neighborhood: “It would be amazing not to notice” the shift of businesses
“catering towards higher incomes”. Most interviewees - including real estate brokers - remarked
particularly upon the increase of restaurants. Many referenced higher turnover and an influx of
‘fancier’ establishments, providing a more ‘diverse’ set of products and services.
When asked why nearby businesses may have closed down or moved out, a store
operator replied: “Increased rent is the main reason”. Most interview respondents described
increasing rents in their leased space or at neighboring establishments. Two interviewees in the
commercially gentrified Temescal census tract said their rent had been doubled when their lease
was re-negotiated. One business manager said that a nearby fast food restaurant had gone out of
business because the rent was prohibitively high: “That place was very busy all the time. And

74
they still went out [of business].” These responses suggest that rent increases - more than
changing customer preferences - may be a factor driving displacement of businesses. Changing
customer preferences are likely also involved, however, as two Temescal merchants described
having to change their inventory. One minority-owned shoe store operator described now
“selling shoes that are not wanted for a cheap price.”
One real estate broker in the area described “classic retail dragging behind” other
commercial storefront uses, such as restaurant and café space. Another broker working in the
area agreed, and one clothing merchant in Temescal said that newer residents were not
purchasing as much as her longer-term customers. Real estate brokers considered this to be a part
of a macro-level trend in retail and not specific to the study area.
Although only some interviewees explicitly used the term “gentrification” to describe the
changes occurring in the neighborhood, a number of businesses referenced increases in wealthier
residents from San Francisco. One business operator speculated that “families are moving in
from San Francisco because of affordable housing.”10 Five interviewees explicitly mentioned
noticing area demographic shifts towards white customers.
When asked what was driving increased rents and
displacement pressures, most owners thought wealthier
residents and the increased popularity of the neighborhood
were to blame. One retailer said the increase in “more
‘namey’ restaurants” was bringing people in from out-of-
town, and the Temescal neighborhood had been marketed
by realtors as “lower Rockridge” in an attempt to associate
the area with a wealthier, more upscale nearby
neighborhood. A café owner described a similar
‘branding’ of the KoNo neighborhood: “They came down
here and put up flags that said KoNo on them. They tried
to pretend people called this neighborhood KoNo. And no
one really does.” Another food establishment owner
described the changes as happening because “restaurants
moved in and showed people how nice the street is - it’s
got nice trees - it’s a great neighborhood...it’s spreading
down from [northern] Telegraph”. Figure 8.2 shows a
photograph of a typical upscale eatery in Temescal.
Los Angeles
In Los Angeles, the Hollywood/Vine and Vermont/Sunset LA Metro station areas were
selected as case studies for a number of reasons, these are shown in Figure 8.3. Both stations are
located on the Red Line, have been operating for the same number of years, and are near - but
not adjacent - to one another. Despite these similarities, each station area has experienced
neighborhood change differently, and both are understudied. Between 1990 and 2000, both
stations commercially gentrified in at least one census tract within a ½-mile radius from the
station. After 2000, however, only Hollywood/Vine gentrified both commercially and
residentially. Detailed demographic and business characteristics for the Los Angeles case study
areas are found in Appendix D
10
Interviews were not recorded to preserve interviewee’s privacy. Therefore, quotations are paraphrased based upon
interview notes and for maximum clarity.
Figure 8.2: An upscale eatery in Temescal,
Oakland. Photo taken by authors, May 2017.

75
Figure 8.3: Map of Case Study Areas, Los Angeles Region
Table 8.3, below, presents selected demographic characteristics for our case study station
areas, as well as Los Angeles County from 1990-2013. All of the data presented are area-
weighted from census block group geographies. At a time of population growth (2000-2013) for
Los Angeles County, the data show a decline in the population in both station areas, with non-
commercially gentrifying station area Vermont/Sunset experiencing a greater loss. Mean
household income has increased the most in the commercially gentrifying Hollywood/Vine
station area, while the shares of renters and residents of color in this station area have shown a
more dramatic decrease. The Vermont/Sunset station area experienced a greater decline in the
Hispanic population in the last decade than the region (where Hispanic share grew) or the
Hollywood/Vine station area.
Table 8.3: Change in Selected Demographic Characteristics from 2000-2013 – Los Angeles
LA County Hollywood/Vine Vermont/Sunset

76
Total Population 3.9% -4.8% -13.6%
Population Density (per sq. mi.) 4.0% -4.8% -13.6%
Mean Household Income (2013 $) -4.6% 10.8% 7.4%
% Renting Households 1.92% -2.78% 2.01%
% Non-Hispanic White -11.29% 16.74% 27.96%
% Black -14.29% -51.32% 8.57%
% Asian/Pacific Islander 15.45% -18.99% 5.92%
% Hispanic 7.40% -6.23% -10.36%
% Native American/Other -16.46% 11.26% -4.93%
% Two or More Races -24.49% -43.33% -67.00%
Source: Tabulated by authors from 1990 and 2000 decennial census, and 2009-2013 5-year ACS. Station
area characteristics are block group data, area weighted for ½-mile radius from the station.
As with the Bay Area, both study areas in Los Angeles have seen growth in the number
and density of business establishments, but the magnitude of changes are less than those seen at
the regional levels (See Table 8.4). Likewise, both areas have seen a decline in the average
establishment size, as measured by number of employees.
Table 8.4: Change in Selected Business Characteristics from 2000-2013 – Los Angeles
L.A.
County
City of
L.A.
Hollywood/Vine
Study Area
Vermont/Sunset
Study Area
Total Establishments 76.48% 64.54% 42.08% 55.28%
Establishments per sq. mi. 76.48% 64.54% 42.08% 55.28%
Employees per establishment -39.90% -38.14% -30.03% -35.11%
Table 8.5, summarizes the types of business establishments observed along the main
commercial corridors within ½-mile of both case study station areas. A total of 87 establishments
were counted for Vermont/Sunset, 13 more than in the commercially gentrified Hollywood/Vine
area that had 74 commercial establishments. There was a slightly greater percentage of
standalone businesses in the non-commercially gentrified station area of Vermont/Sunset than at
commercially gentrified Hollywood/Vine, which had significantly more chain stores and slightly
more trendy establishments (boutiques, out-of-place, especially hip, etc.).
Table 8.5: Establishment Type Counts, Los Angeles Case Study Station Areas
Hollywood/Vine, Vermont/Sunset, Difference for

77
Commercially
Gentrified
Not Commercially
Gentrified
Commercially
Gentrified Station
Standalone 69 (93%) 85 (98%) -5%
Strip mall 5 (7%) 2 (2%) +5%
Ethnic (non-Anglo) 14 (19%) 14 (16%) +3%
Chain 35 (47%) 8 (9%) +38%
Vacant 8 (11%) 9 (10%) +1%
For sale 1 (1%) 0 (0%) +1%
For rent 6 (8%) 1 (1%) +7%
‘Trendy’ 4 (5%) 2 (2%) +3%
Total Establishments 74 87 -13
Local merchants described the length of their tenure in the commercially gentrified
Hollywood/Vine station area as ranging from nine months to 45 years. The newer businesses
tended to be upscale eateries and coffee shops, while the oldest businesses were a flower shop
that had been in the area for 45 years and an Indian gift shop that had been in the area for 30
years.
In the non-commercially gentrified Vermont/Sunset station area, merchants interviewed
had almost all been operating in their present locations for more than eight years, and a number
of them for 15-20 years. Many of these businesses are small establishments that seem to appeal
to a lower-income, primarily ethnic demographic (liquor stores, bars, beauty/hair salons,
discount stores, and chain stores such as Payless Shoes and Fallas Paredes discount store). The
vast majority of merchants interviewed in the Vermont/Sunset station area were Latino and
Filipino.
All merchants interviewed
in the Hollywood/Vine station
area, with the exception of one
who had arrived only 18 months
ago, indicated that they had
observed changes in the types of
businesses opening in the
neighborhood in recent years.
Almost unanimously, the
interviewees indicated that the
changes included “more upscale
restaurants,” “new hotels and
upscale clubs,” “more small
trendy stores,” and “more tech
companies.” This matches with
responses from the Bay Area
study region, where interviewees
reported upscale restaurants as a
sign of a changing neighborhood. One merchant emphasized the amount of new construction in
Figure 8.4: An upscale coffee shop in the Hollywood/Vine station area. Photo
taken by authors, May 2017.

78
the neighborhood and the number of tourists, while another talked about the redevelopment that
accompanied the construction of the Metro stop. Figure 8.4 shows a photo of a typical upscale
coffee shop at Hollywood/Vine.
Similarly, all three realtors interviewed about the Hollywood/Vine station area agreed that
there are new types of establishments and customers coming into the area. According to them:
● “The neighborhood is becoming more trendy; more artistic places are moving in” (realtor
1).
● “There are more restaurants than before; some are higher-end and have their own type of
clientele” (realtor 2).
● “There is more art culture and more small [boutique] type shops. There is now a skate
shop that caters to a younger crowd and also sells art from locals. More restaurants are
coming in, adding variety to the area” (realtor 3).
Merchants interviewed in the non-commercially gentrifying Vermont/Sunset station area,
on the other hand, largely perceived very little change in the type of businesses and customers in
the area, and only two noted more restaurants and coffee shops moving in. An ice cream store
manager mentioned that “five months ago [the shop] experimented with selling teas, smoothies,
and shakes - more healthier options. It was short-lived and abandoned.”
Nine of the 14 businesses interviewed in the Hollywood/Vine station area reported
changes in the kind of customers patronizing neighborhood stores. They talked about “more
upscale customers,” “more college and professional types,” “larger lunch crowds,” “more
tourists,” “higher-end spending folks, lots of Europeans, Australians, and Scientology people,”
and “more Metro users.” The realtors talked about more “hipsters” and more “art-influenced”
customers, who are attracted to the neighborhood’s new commercial establishments. On the other
hand, two business owners complained about “more homeless” people. It should be noted that
the small number of merchants who did not witness changes in their customers were mostly
establishments that had moved into the area in the past three-four years.
Vermont/Sunset, which did not commercially gentrify, is a low-income, primarily Latino
neighborhood. Some longstanding merchants there indicated that Latino customers have
increased over the past decade. This is interesting because the overall share of Hispanics in the
neighborhood decreased by ~10% from 2000-2013 (See Table 8.3). One hair salon estimated that
80% of their clientele are Latinas, 10% are white, and 10% are Asian. A beauty salon indicated
that in addition to Latinos, they have also seen an increase in Armenian and Filipino customers,
and a decrease in whites and African-Americans. Most of the Vermont/Sunset area businesses
described their customers as “regulars who live in the area,” and only two businesses (a shoe
store and a discount store) indicated that some of their clients are tourists. Only three businesses
revealed their rent - which ranged from $830 to $1,800 per month (a bit over $1.00 per square
foot) - while two others had experienced a rent increase in the last two years. None of the
merchants interviewed intend to relocate, a possible sign that business in this low-income and
ethnic neighborhood is stable and rents are still affordable.
One long-standing Indian gift store in the commercially gentrified Hollywood/Vine
station area lamented that business had suffered in recent years because not many people came
into the store. This response mirrored some of the findings in our Bay Area study region, where
interviewees described a cooling of the traditional “soft retail” market. Businesses that were

79
specifically identified as having been displaced were a small hamburger stand, a Korean grocery
store that was replaced by Starbucks, a hat shop that became a fancy eatery, a luggage store, a
nail salon, and a small camera store. Many respondents said these businesses could not make
ends meet because of higher rents, a different customer base, or the negative effects of
“prolonged construction”.
Although some retail churn is normal (average 2000-2012 churn for ‘infrequently
patronized establishments’ in a commercial census tract in Los Angeles is 4.33, representing the
number of businesses that moved into the area, out of the area, opened in the area, and closed in
the area, divided by the total number of businesses), realtors perceived a higher than normal
turnover of neighborhood commercial properties, a phenomenon that was borne out by our
observation (more storefronts were for sale/rent in the Hollywood/Vine station area). According
to one realtor: “Some small businesses have closed but it is hard to know if rents went up or if
their business was simply no longer attracting enough customers, or if it went out of style.” That
being said, all but two of the merchants interviewed indicated that they do not plan to relocate.
Most of these establishments, however, had moved into the neighborhood after the opening of
the Hollywood/Vine station.
In the non-commercially
gentrified Vermont/Sunset station
area, about half of the merchants
interviewed were not aware of any
stores that had closed or relocated,
while the other half named some
businesses that had closed. These
included a vitamin store, an art store,
a mobile phone store, and a beauty
salon. The first two types of
establishments may appeal to a more
upscale customer demographic,
which may not have been present in
sufficient quantity in this
neighborhood. Figure 8.5 shows a
strip mall of small businesses in the
Vermont/Sunset station area.
Only three merchants in the commercially gentrified Hollywood/Vine station area
volunteered their rental rates, which varied significantly. A retail food store indicated that it pays
$1.94 per sq. ft. per month and its rent was recently increased by $170 per month. A donut shop
indicated that it pays $3.50 per sq. ft. per month, while an ethnic food restaurant reported a rent
of $10.00 per sq. ft. per month. Most merchants had a five-year lease and a few had an eight- or
10-year lease. Realtors confirmed that the values of both residential and commercial properties in
the area have increased in recent years. One realtor noted: “Residential properties are increasing
in value because commercial properties are going up first. Development in commercial property
and investment draws higher-end amenities first…rents have increased for sure.” According to
another realtor: “Some people approach the neighborhood trying to buy or rent only to find that
everything is now beyond their price range.”
Figure 8.5: A strip mall of small businesses in the Vermont/Sunset station
area. Photo taken by authors, May 2017.
80
When asked what drives the observed changes in the neighborhood, some merchants
attributed it to the high demand for a centrally located neighborhood such as Hollywood/Vine.
Others reported it as demand by new residents “of the Silicon Valley type.” However, the
overwhelming response of merchants (9 out of 14) was that the change in the neighborhood
occurred because of the construction of high rises, renovated hotels, and the transit station.
Overall, our case study analysis of the Hollywood/Vine and Vermont/Sunset station area
substantiated our definition of commercial gentrification and provided a more nuanced
understanding of how these places did and did not experience commercial gentrification.
Changes in the commercially gentrified Hollywood/Vine station area included wealthier
customers, a more upscale built form, and dramatic increases in neighborhood traffic. In the non-
commercially gentrified Vermont/Sunset station area, interviews and urban observation revealed
less change over time and fewer chain stores, as well as fewer storefronts for sale/rent.
Transit & Commercial Gentrification
Our case studies also shined a light on commercial gentrification’s relationship with
transit in the Bay Area and Los Angeles. In both study regions, interviews with real estate
professionals and merchants provided useful information about these connections.
In the Bay Area, most merchants and real estate professionals considered transit to be
related to ongoing commercial gentrification pressures but not a primary driver of the
phenomenon. One business owner in the commercially gentrified Temescal area said “I don’t
think transit is wagging the dog here,” suggesting that proximity to MacArthur BART was not
the driving force behind the commercial gentrification of the neighborhood. Most shop owners
and real estate brokers suggested that the commercial gentrification was ‘spreading’ from other,
more successful nearby neighborhoods, rather than from any particular BART station. Only one
interviewee, a real estate broker, said that “transit access plays a huge role” in real estate market
values in the Temescal and KoNo neighborhoods. Another real estate broker interviewed said
that transit access was a part of rising property values “to a degree” but that the real driver was
that “you can get more bang for your buck in Oakland…[it’s] overflow from San Francisco...San
Francisco is the lynchpin.” A review of secondary literature shows community-based
organization Causa Justa :: Just Cause claiming that “the gentrifying pressures on this area rest
fundamentally on the neighborhood’s connectivity, its access to major freeways, a BART
transfer station, and the 1 and 57 bus lines. The transportation connections become even more
important as San Francisco’s workforce moves east, seeking cheaper rents” (collectivehistory,
2014).
When asked about how many of their customers used BART to access their stores, many
business owners in both Temescal and KoNo acknowledged that some of their patrons took
BART but few identified it as their customers’ primary mode of transportation. One nail salon
manager said that while many of his customers were BART riders, they didn’t take BART to
patronize his establishment specifically - they stopped in because it was located on their evening
commute. A food establishment owner similarly described some of his customers as BART
riders, but said that “not many people are taking BART just to get here.” In this respect, transit
access was perceived as playing a role in business success but was not identified by most
merchants or real estate professionals as a primary driver of neighborhood change.
In Los Angeles, merchants had similar responses. In the non-commercially gentrified
Vermont/Sunset station area, a number of shopkeepers perceived increases in pedestrians and

81
cyclists as a product of the Metro station but few brought up transit access as an important player
in the commercial real estate marketplace, otherwise.
In the commercially gentrifying Hollywood/Vine station area, some merchants connected
increased redevelopment and an increased number of tourists with the construction of the Metro
stop but seemed to identify an influx of upscale restaurants with the changing neighborhood
more than the improvement in transit access. Thirteen of the 14 interviewees knew of
neighborhood businesses that had been displaced because of Metro construction, and a number
of interviewees identified the Metro station as a contributing factor to the change in makeup of
area businesses.
In both study regions, interview respondents generally acknowledged the role transit
access plays in changing neighborhoods, but most merchants and real estate professionals
considered the primary catalyst of commercial gentrification as existing elsewhere. That being
said, a good deal of respondents connected new development and rising rents with displacement
of businesses and neighborhood change. It is possible that these rising rents and new
developments were catalyzed by improved transit access, thus creating a chain of causation from
improved transit access to commercial gentrification. Regression modeling in section V of this
report suggested that there is no significant connection between transit proximity and
commercial gentrification, however, bolstering merchant and real estate professional’s
perceptions that transit access is not the driving force behind commercial gentrification.
Traffic Safety & Commercial Gentrification
Case study examination of both Los Angeles and Bay Area regions involved interviewing
local shopkeepers and business community stakeholders in each region’s case study areas, as
well as observing certain high-crash intersections for characteristics that could be connected to
commercial gentrification phenomena. Traffic safety implications were then drawn from these
case study examinations.
Two to three intersections in each case study area were identified as high-crash
intersections for pedestrians and cyclists11, and were then observed for visual obstructions, built
environment features, and pedestrian counts. The goal of this observation was to identify
characteristics of high-crash intersections in both commercially gentrified and non-commercially
gentrified corridors.
San Francisco Bay Area
11
In the Bay Area, high-crash intersections were identified using SWITRS data, whereby pedestrian- and cyclist-
involved crashes were identified and geocoded to the nearest intersection. Intersections with the highest number of
crashes (not normalized by exposure) were then selected for observation. These intersections overlapped with some
of the corridors and intersections identified in the 2017 Draft Pedestrian Plan (Oakland Department of
Transportation). In Los Angeles, high-crash intersections were identified through visual analysis of crash maps.

82
Two high-crash intersections were
identified for observation in each Bay Area
study area. Both intersections were located on
the high-traffic Telegraph Ave. corridor in
Oakland, which was also the defined
commercial district for the purposes of this
study. Table 8.6 on the next page details the
observed characteristics of the high-crash
intersections. Figure 8.5 provides a view of a
section of the KoNo study area.
In the Bay Area, most interviewees in
both Temescal and KoNo noted increases in
traffic of all types and modes. Most merchants
in commercially gentrified Temescal described
increases in the number of bicyclists and
pedestrians. One food shop owner said “Our
bike racks always fill up.” This trend did not
appear to be reflected in the KoNo tract,
however, as only one of the merchants reported
an increase in cyclists. Many interviewees
described increased vehicle traffic and parking
congestion. Parking congestion was singled out
as a problem by a majority of the merchants,
with many expressing concerns that parking
congestion was getting worse. One longtime
resident noted that new protected bike lanes had made parking extremely difficult and affected
access to local businesses. While many interviewees said that built environment improvements
like new crosswalks, signage, and bike lanes had made the area safer, others noted that the
increased traffic had made the area less safe. Two merchants even relayed having witnessed
bicyclist collisions near their stores. In the non-commercially gentrified KoNo tract, a long-time
resident relayed having seen “Countless near-misses with bikes and pedestrians.”
Merchants seemed well-aware of streetscape changes on Telegraph Ave. but didn’t agree
on whether or not the changes made the area safer or not. Some merchants thought it was a
relatively safe street, while others thought the increase in cyclists resulted in more crashes.
Merchants also disagreed on the magnitude of changes in traffic, with some saying there is
“definitely more traffic” and others saying “vehicle traffic has gone up but not a lot”.
One of the striking similarities amongst the observed high-crash intersections on
Telegraph Ave. was the near-universal provision of what many planners would consider to be
adequate active transportation infrastructure. All four intersections are signalized, have bicycle
lanes, and three out of four feature pedestrian medians and marked crosswalks. At the same time,
the intersections also bear the hallmarks of high-density urban roadways: there are a number of
curb-cut driveways within 200’ of the intersections, visual impairment of intersections is
relatively prevalent, and most of the intersections have an average of more than two auto travel
lanes.
Figure 8.5: A green 'super sharrow' bike priority marking in
KoNo, Oakland.
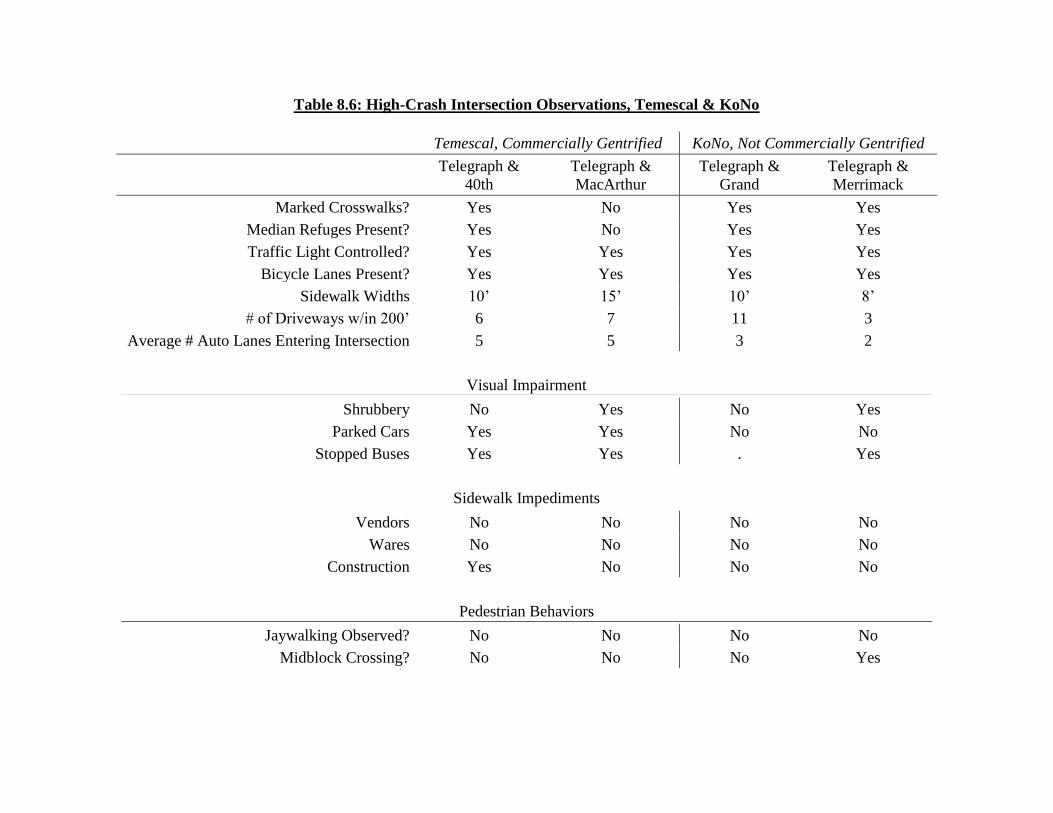
Table 8.6: High-Crash Intersection Observations, Temescal & KoNo
Temescal, Commercially Gentrified KoNo, Not Commercially Gentrified
Telegraph &
40th
Telegraph &
MacArthur
Telegraph &
Grand
Telegraph &
Merrimack
Marked Crosswalks? Yes No Yes Yes
Median Refuges Present? Yes No Yes Yes
Traffic Light Controlled? Yes Yes Yes Yes
Bicycle Lanes Present? Yes Yes Yes Yes
Sidewalk Widths 10’ 15’ 10’ 8’
# of Driveways w/in 200’ 6 7 11 3
Average # Auto Lanes Entering Intersection 5 5 3 2
Visual Impairment
Shrubbery No Yes No Yes
Parked Cars Yes Yes No No
Stopped Buses Yes Yes . Yes
Sidewalk Impediments
Vendors No No No No
Wares No No No No
Construction Yes No No No
Pedestrian Behaviors
Jaywalking Observed? No No No No
Midblock Crossing? No No No Yes

The greater percentage of strip mall-type establishments in commercially gentrified
Temescal, versus KoNo (See Table 8.6), suggests that more auto trips may be generated in
commercially gentrified areas, as strip mall establishments are probably more likely to be
patronized by auto-borne customers. This hypothesis presumes an association between a strip
mall-type built environment and commercial gentrification, which is corroborated somewhat by
our Los Angeles observations (See Table 8.6), which show a similar pattern of a commercially
gentrified neighborhood having more strip mall establishments. By this logic, a strip mall-type
built environment - being, perhaps, more auto-centric - could be associated with more auto trips,
which, in turn, could cause an increase in exposure of pedestrians and cyclists to crashes.
Los Angeles
In our Los Angeles study region, we selected three intersections in each case study area
with a high concentration of pedestrian and bicycle collisions. We conducted pedestrian counts
and observations of the built environment to complement our data and models and build a
qualitative understanding of factors that may contribute to higher crash incidences.
Table 8.7, below, summarizes the findings from the observed high-crash intersections.
The commercially gentrified Hollywood/Vine station area has a higher annual average number of
collisions than the Vermont/Sunset station area (208 compared to 128, respectively, for years
after the station opened) (SWITRS). However, both station areas have similar number of auto-
pedestrian collisions (30 at Hollywood/Vine and 26 at Vermont/Sunset) (Ibid.). The high-crash
intersections in the Vermont/Sunset station area have, on average, more auto lanes entering the
intersection. All station areas have marked crosswalks and traffic lights in their vicinity but lack,
however, pedestrian median refuges and bicycle lanes. All intersections at Hollywood/Vine had
parked cars serving as visual impairments, while two of the three intersections at
Vermont/Sunset had bus stops near the corner (there was only one at Hollywood/Vine).

Table 8.7: High-Crash Intersections Observations, Hollywood/Vine & Vermont/Sunset
Hollywood/Vine, Commercially Gentrified Vermont/Sunset, Not Commercially Gentrified
Hollywood
& Vine
Hollywood
& Cahuenga
Franklin &
Argyle
Vermont &
Sunset
Hollywood &
Vermont
Sunset, Hollywood
& Hillhurst
Marked Crosswalks? Yes Yes Yes Yes Yes Yes
Median Refuges Present? No No No No No No
Traffic Light Controlled? Yes Yes Yes Yes Yes Yes
Bicycle Lanes Present? No No No No No No
Sidewalk Widths 15’ 15’ 4-8’ 12’ 15’ 15’
# of Driveways w/in 200’ 0 0 0 4 7 4
Average # Auto Lanes Entering Intersection 5 4 6 6 6 4
Visual Impairment
Shrubbery No No No No Yes No
Parked Cars Yes Yes Yes No No No
Stopped Buses No No Yes Yes Yes No
Sidewalk Impediments
Vendors Yes No No No No No
Wares No No No No No No
Construction No No Yes No No No
Pedestrian Behaviors
Jaywalking Observed? No No No No Yes No
Midblock Crossing? No No No No Yes No

In the non-commercially gentrified Vermont/Sunset station area, we observed a number
of driveways interrupting the sidewalk at high-crash intersections. This was not the case at the
Hollywood/Vine station area intersections. In previous research, Loukaitou-Sideris et al. (2007)
found that many high-crash intersections in Los Angeles had driveways in their vicinity and that
some of the crashes at these intersections involved automobiles exiting the driveways and hitting
pedestrians, which suggests that the non-commercially gentrified station area may have a
streetscape element that poses greater risks for pedestrians than the commercially gentrified
station area. Construction and street vendors blocking the pedestrian right-of-way were observed
only at one Hollywood/Vine intersection. Jaywalking was more common at the Vermont/Sunset
intersections.
Nearly all interviewees in the commercially gentrified Hollywood/Vine area commented
on the increase in automobile, pedestrian, and bicycle traffic, and some merchants lamented a
significant lack of parking. One businessperson described the situation: “streets are congested
and people are flustered.” Some merchants surmised that much of the foot traffic comes from the
Metro station and the new higher-density residential apartments. Two interviewees said the
combination of increased bicycle and auto traffic makes it very dangerous for people on bikes,
and the majority of interviewees had witnessed traffic crashes in the neighborhood.
A number of respondents in the non-commercially gentrified Vermont/Sunset station area
also noted the increasing traffic congestion and many complained about “the busy and dangerous
intersections” and heavy traffic that often blocks streets, making parking challenging. Some also
noted the increased presence of pedestrians and bikers because of the Metro station. This co-
existence of heavy automobile traffic and increased pedestrian and bicycle traffic likely increases
exposure of pedestrians and cyclists to crashes. Many respondents in the Vermont/Sunset station
area had witnessed collisions and some wanted more traffic signals and bicycle lanes.
In the same station area, a number of merchants noted that the neighborhood has, in
recent years, seen “more foot traffic,” “more police activity,” “more dirty sidewalks”, and “more
homeless.” We observed a large homeless encampment near the Santa Monica and Vermont
intersection. Other shopkeepers in the area said “this neighborhood has always experienced
heavy automobile traffic and this hasn’t changed. But now there are more people walking on the
weekends.”
As in the Bay Area study region, our observation yielded little conclusive evidence that
one station area was seeing significantly more traffic than another. In both station areas,
interviewees perceived an increase in traffic, difficulty parking, and a streetscape that was
dangerous for people on bikes. That being said, observed high-crash intersections in Los Angeles
study areas seemed to lack some of the best-practice street design (pedestrian median refuges,
bicycle lanes, fewer travel lanes, etc.) that was present in Bay Area streets.
Case Study Conclusions
Interviews and urban observation in the Bay Area and Los Angeles returned some
important findings. For one, rising rents were identified as relevant displacement pressure
phenomena more often than were the changing preferences of customers, suggesting that
merchants are facing the most significant pressure from landlords who perceive greater value in
their properties. Pressure from changing demographics of customers that demand different
products does not seem to be as significant a concern. Merchants in the Bay Area seemed to
concur that high rents were spreading outward from northern Telegraph Ave., instead of outward

87
from the BART station, corroborating the findings of our regression analysis, which suggested
that transit was not significantly associated with commercial gentrification. In both the Bay Area
and Los Angeles, merchants also agreed that restaurants were the most visible sign - and perhaps
a catalyst - of commercial gentrification.
Transit access was generally acknowledged by interviewees as a significant factor in
market value of commercial property but few considered it to be the most important driving
force behind commercial gentrification. In all study regions, merchants acknowledged that some
of their customers used rail transit but none considered it a primary mode that their business
depended upon for success.
With respect to traffic safety, comparisons between commercially gentrified and non-
commercially gentrified study areas in the Bay Area and Los Angeles produce few conclusive
insights into the regression model findings in Section VII of this report, which indicate that
commercially gentrified areas see significantly more crashes per year than non-commercially
gentrified areas. Interviews in the Bay Area and Los Angeles’ commercially gentrified and non-
commercially gentrified study areas suggested that traffic was increasing in both areas, and
merchants in the Bay Area were in disagreement over changes in safety that may have occurred
in recent years. Little consensus was uncovered on whether increased exposure to automobile
traffic was responsible for the increased number of crashes in commercially gentrified areas.
Communicating in English was a challenge throughout the interview process in both case
study areas in the Bay Area. A number of business owners and managers did not speak English
as a second language, so interview questions were translated into both Korean and Spanish. The
language barrier was notable because it reflects upon merchants’ ability to communicate and
negotiate with landlords, planners, and other stakeholders shepherding neighborhood change. It
is extremely likely that the language barrier is to the merchants’ detriment in lease negotiations
and planning discussions. In the Los Angeles case studies, limited English proficiency was not a
challenge through the interview process, but some merchants expressed a preference for
speaking in a language other than English.

88
IX. Conclusion & Policy Implications
Conclusions
Through a literature review, statistical analysis, and qualitative case study analysis, we
uncovered important findings regarding the relationships amongst commercial gentrification,
transit access, transit ridership, and traffic crashes. The primary findings of this report are
presented below, with policy implications and research needs following.
● Proximity to a transit station is likely not associated with commercial gentrification.
More important factors that may induce commercial gentrification are the baseline
demographics of the neighborhood, particularly the percent of non-Hispanic black,
foreign-born, and renter residents, as well as the overall population density in the
neighborhood.
● Commercial gentrification may contribute to increases in total, cyclist-involved, and
pedestrian-involved average annual crashes around rail transit stations. It is unclear if this
is directly due to the phenomenon of commercial gentrification or if it is related to an
increase in pedestrian and cyclist traffic that occurs in commercially gentrified areas.
● Commercial gentrification does not appear to have a significant effect on rail transit
ridership.
● Merchants relayed facing more pressure from rising rents than from changing customer
demographics and demands. Most merchants do not see transit as the primary catalyst of
these rent increases.
● Restaurants, cafés, and bars were prominent in both commercially gentrified case studies.
● Merchants in areas facing gentrification and displacement pressures may see their
resilience to these pressures reduced by language barriers.
Policy Implications
We crafted specific policy recommendations that are derived from the findings in this
report. The primary emphasis of these recommendations is on mitigating likely crash rate
increases in commercially gentrified areas and informing transit-oriented development (TOD).
● While our quantitative research does not find a significant relationship between a
neighborhood’s proximity to transit and commercial gentrification, we believe that this
may not represent a universal truth and this issue requires further probing. Policymakers
should not assume that transit neighborhoods are not susceptible to commercial
gentrification.
● The relationship between residential and commercial gentrification also needs further
exploration. The results of this study are mixed, and it is not clear when and where one
type of gentrification follows the other, or which comes first. We suspect that there may
not be a universal pattern, and such relationships may change from one neighborhood to
another.
● Our findings indicate that commercial gentrification is context-specific. Policymakers,
therefore, should not only rely on aggregate data but also seek to identify what is
happening on the ground in specific commercial transit neighborhoods. Commercial

89
neighborhood stakeholders, such as merchants, property owners, and realtors can give
good information about gentrification trends, business closures or relocations, rent
increases, etc.
● Commercial gentrification in a transit neighborhood is often accompanied by an
increased incidence of crashes involving pedestrians and cyclists. This may well be
because more pedestrians and cyclists are present in the neighborhood, increasing rates of
exposure. Regardless of cause, the increased occurrence of crashes tells us that
policymakers should focus resources towards traffic calming, safe streets infrastructure
provision, and other proven traffic safety improvements.
Research Shortcomings & Next Steps
Research Shortcomings
This research has a number of significant shortcomings that should be addressed in future
work. The most important of these shortcomings are listed below.
● This research did not examine who is served by establishments in commercially
gentrified and transit proximate neighborhoods, nor were we able to assess changes in the
prices of goods and services. This is important for understanding the implications of
displacement and whether it affects important community service and product provision.
● This research includes no examination of the nature of employment provided by
businesses in commercially gentrified and transit proximate areas. It is important to
understand how employment access and demographics are affected by transit proximity
and commercial gentrification.
● The analysis of crashes did not take into account automobile traffic volumes because of a
lack of traffic count data.
● The surveys only targeted merchants who are currently operating along the commercial
streets of four transit neighborhoods. It does not cover the perspectives of merchants who
were displaced or closed because of commercial gentrification.
Research Next Steps
Future research should examine the following important questions, which are derived
from findings and research shortcomings in this report.
● What happens to establishments after they are displaced? Is there a significant negative
outcome for owners, employees, and the broader community? Or is this a more
innocuous geographic reorganization of markets?
● This research suggests that rising rents are more responsible for commercial displacement
than changing customer preferences, but falls short of producing conclusive evidence for
this hypothesis. Future research should examine this question in greater depth.
● How is commercial gentrification related to residential gentrification? Which comes first,
where? Future research should probe this association further.
● Implications of this research are inherently limited to the high-density, diverse
metropolitan areas in the United States. Further research in smaller or less-dense regions
of California, such as San Diego, Sacramento, and Fresno, should be pursued.

90
X. References
Arrington, A., G. B., & Cervero, R. (2008). Effects of TOD on Housing, Parking, and Travel
(Transit Cooperative Research Program No. 128). Retrieved from
http://www.reconnectingamerica.org/assets/Uploads/finalreporttcrp128.pdf
Bartholomew, K., & Ewing, R. (2011). Hedonic Price Effects of Pedestrian- and Transit-
Oriented Development. CPL Bibliography, 26(1), 18–34.
https://doi.org/10.1177/0885412210386540
Basker, E. (2005). Job creation or destruction? Labor market effects of Wal-Mart expansion.
Review of Economics and Statistics, 87(1), 174–183.
Bell, D. (2007). The hospitable city: social relations in commercial spaces. Progress in Human
Geography, 31(1), 7–22.
Bridge, G., & Dowling, R. (2001). Microgeographies of Retailing and Gentrification. Australian
Geographer, 32(1), 93–107.
Burnett, K. (2014). Commodifying poverty: gentrification and consumption in Vancouver’s
Downtown Eastside. Urban Geography, 35(2), 157–176.
https://doi.org/10.1080/02723638.2013.867669
Burns, V. F., Lavoie, J.-P., & Rose, D. (2012). Revisiting the Role of Neighbourhood Change in
Social Exclusion and Inclusion of Older People [Research article]. Retrieved July 3,
2017, from https://www.hindawi.com/journals/jar/2012/148287/abs/
California Housing Partnership Corporation. (2014). Why creating and preserving affordable
homes near transit is a highly effective climate protection strategy. Retrieved from
http://www.transformca.org/sites/default/files/CHPC%20TF%20Affordable%20TOD%2
0Climate%20Strategy%20BOOKLET%20FORMAT.pdf
Center for Community Innovation. (2014). The Mission District, San Francisco [DRAFT].
Berkeley, CA.
Cervero, R., & Duncan, M. (2002). Transit’s Value-Added Effects: Light and Commuter Rail
Services and Commercial Land Values. Transportation Research Record: Journal of the
Transportation Research Board, 1805, 8–15. https://doi.org/10.3141/1805-02
Cervero, R., & Duncan, M. (2004). Neighbourhood Composition and Residential Land Prices:
Does Exclusion Raise or Lower Values? Urban Studies, 41(2), 299–315.
https://doi.org/10.1080/0042098032000165262
Cervero, R., Murphy, S., Ferrell, C., Goguts, N., & Tsai, Y.-H. (2004). Transit-Oriented
Development in the United States: Experiences, Challenges, and Prospects (TCRP
Report No. 102). Berkeley, CA: Institute of Urban and Regional Development,
University of California at Berkeley.
Cervero, Robert, Murphy, S., Ferrell, C., Goguts, Natasha, G., Natasha, Tsai, T., Yu-Hsin,
Arrington, G. B., … Witenstein, N. (2004). Transit-Oriented Development in the United
States: Experiences, Challenges, and Prospects (Transit Cooperative Research Program
No. 102). Washington, D.C.: Transportation Research Board. Retrieved from
http://www.valleymetro.org/images/uploads/general_publications/TCRP-Report-
102_TOD-in-the-US-Experiences-Challenges-and-Prospects_10-04.pdf
Chapple, K. (2009). Mapping Susceptibility to Gentrification: The Early Warning Toolkit.
Berkeley, CA: Center for Community Innovation. Retrieved from
https://communityinnovation.berkeley.edu/reports/Gentrification-Report.pdf

91
Chapple, K., Jackson, S., & Martin, A. J. (2010). Concentrating creativity: The planning of
formal and informal arts districts. City, Culture and Society, 1(4), 225–234.
https://doi.org/10.1016/j.ccs.2011.01.007
Chapple, K., & Jacobus, R. (2009). Retail Trade as a Route to Neighborhood Revitalization. In
M. A. Turner, H. Wial, & H. Wolman (Eds.), Urban and Regional Policy and its Effects
(Vol. II, pp. 19–68). Washington, D.C.: Brookings Institutions Press.
Chapple, K., Loukaitou-Sideris, A., Waddell, P., Chatman, D., & Ong, P. (2017). Developing a
New Methodology for Analyzing Potential Displacement. Retrieved from
http://www.urbandisplacement.org/sites/default/files/images/arb_tod_report_13-310.pdf
Cheshire, P. (2013). Why do birds of a feather flock togther? In G. Bridge, T. Butler, & L. Lees
(Eds.), Mixed Communities: Gentrification by Stealth? (pp. 17–24). Policy Press.
collectivehistory. (2014, March 10). Rethinking Gentrification In Temescal–Oakland. Retrieved
July 4, 2017, from https://collectivehistory.wordpress.com/2014/03/10/rethinking-
gentrification-in-oakland/
Collins, B., & Loukaitou-Sideris, A. (2016). Skid Row, Gallery Row and the space in between:
cultural revitalisation and its impacts on two Los Angeles neighbourhoods. Town
Planning Review, 87(4), 401–427. https://doi.org/10.3828/tpr.2016.27
Cranor, J., Dang, C., Friedlander, M., Hom, M., Herta Jones, M., Krawczyk, L., … Yip, D.
(2015). Oriented for Whom? The Impact of TOD on Six Los Angeles Neighborhoods. Los
Angeles, CA: UCLA. Retrieved from
http://www.urbandisplacement.org/sites/default/files/images/uclatodreportfinal_-
_abridge.pdf
Dalal, P., & Goulias, K. G. (2014). An Analysis of Jobs, Business Establishments, Housing, and
Commuting Travel in the Smart Growth Centers of the Puget Sound Region
(GEOTRANS). Santa Barbara, CA.
Danyluk, M., & Ley, D. (2007). Modalities of the New Middle Class: Ideology and Behaviour in
the Journey to Work from Gentrified Neighbourhoods in Canada. Urban Studies, 44(11),
2195–2210. https://doi.org/10.1080/00420980701520277
Davidson, M., & Lees, L. (2005). New-Build “Gentrification” and London’s Riverside
Renaissance. Environment and Planning A, 37(7), 1165–1190.
https://doi.org/10.1068/a3739
Diaz, R. B. (1999). Impacts of Rail Transit On Property Values. Mclean, VA: Reconnecting
America. Retrieved from
http://www.reconnectingamerica.org/assets/Uploads/bestpractice083.pdf
Dines, N. (2009). The disputed place of ethnic diversity: an ethnography of the redevelopment of
a street market in East London. In R. Imrie, L. Lees, & M. Raco (Eds.), Regenerating
London: Governance, Sustainability and Community in a Global City (pp. 254–272).
Routledge.
Dominie, W. (2012). Is Just Growth Smarter Growth? The Effects of Gentrification on Transit
Ridership and Driving in Los Angeles’ Transit Station Area Neighborhoods. Los
Angeles, CA: UCLA.
Doucet, B. (2014). A Process of Change and a Changing Process: Introduction to the Special
Issue on Contemporary Gentrification. Tijdschrift Voor Economische En Sociale
Geografie, 105(2), 125–139. https://doi.org/10.1111/tesg.12075
Ergun, N. (2004). Gentrification in Istanbul. Cities, 21(5), 391–405.
https://doi.org/10.1016/j.cities.2004.07.004

92
Ferm, J. (2016). Preventing the displacement of small businesses through commercial
gentrification: are affordable workspace policies the solution? Planning Practice &
Research, 31(4), 402–419. https://doi.org/10.1080/02697459.2016.1198546
Freeman, L., & Braconi, F. (2004). Gentrification and Displacement New York City in the
1990s. Journal of the American Planning Association, 70(1), 39–52.
https://doi.org/10.1080/01944360408976337
Gladstone, D., & Préau, J. (2008). Gentrification in tourist cities: Evidence from New Orleans
before and after Hurricane Katrina. Housing Policy Debate, 19(1), 137–175.
https://doi.org/10.1080/10511482.2008.9521629
Gotham, K. F. (2005). Tourism Gentrification: The Case of New Orleans’ Vieux Carre (French
Quarter). Urban Studies, 42(7), 1099–1121. https://doi.org/10.1080/00420980500120881
Guthrie, A., & Fan, Y. (2013). Streetcars and Recovery: An Analysis of Post-Katrina Building
Permits around New Orleans Streetcar Lines. Journal of Planning Education and
Research, 33(4), 381–394. https://doi.org/10.1177/0739456X13504300
Haber, M. (2014, May 2). Oakland: Brooklyn by the Bay. The New York Times. Retrieved from
https://www.nytimes.com/2014/05/04/fashion/oakland-california-brooklyn-by-the-
bay.html
Hackworth, J. (2002). Postrecession Gentrification in New York City. Urban Affairs Review,
37(6), 815–843. https://doi.org/10.1177/107874037006003
Hackworth, J., & Rekers, J. (2005). Ethnic Packaging and Gentrification: The Case of Four
Neighborhoods in Toronto. Urban Affairs Review, 41, 211–236.
https://doi.org/10.1177/1078087405280859
Haltiwanger, J., Jarmin, R., & Krizan, C. J. (2010). Mom-and-Pop meet Big-Box: Complements
or substitutes? Journal of Urban Economics, 67(1), 116–134.
https://doi.org/10.1016/j.jue.2009.09.003
Hamnett, C., & Whitelegg, D. (2007). Loft Conversion and Gentrification in London: From
Industrial to Postindustrial Land Use. Environment and Planning A, 39(1), 106–124.
https://doi.org/10.1068/a38474
Janoschka, M., Sequera, J., & Salinas, L. (2014). Gentrification in Spain and Latin America — a
Critical Dialogue. International Journal of Urban and Regional Research, 38(4), 1234–
1265. https://doi.org/10.1111/1468-2427.12030
Kahn, M. E. (2007). Gentrification Trends in New Transit-Oriented Communities: Evidence
from 14 Cities That Expanded and Built Rail Transit Systems. Real Estate Economics,
35(2), 155–182. https://doi.org/10.1111/j.1540-6229.2007.00186.x
Karsten, L. (2014). From Yuppies to Yupps: Family Gentrifiers Consuming Spaces and Re-
inventing Cities. Tijdschrift Voor Economische En Sociale Geografie, 105(2), 175–188.
https://doi.org/10.1111/tesg.12055
Lim, H., Kim, J., Potter, C., & Bae, W. (2013). Urban regeneration and gentrification: Land use
impacts of the Cheonggye Stream Restoration Project on the Seoul’s central business
district. Habitat International, 39, 192–200.
https://doi.org/10.1016/j.habitatint.2012.12.004
Lin, J. (2002). Gentrification and transit in Northwest Chicago. Journal of the Transportation
Research Forum, 56(4). Retrieved from https://trid.trb.org/view.aspx?id=728134
Lin, J. (2008). Los Angeles Chinatown: Tourism, Gentrification, and the Rise of an Ethnic
Growth Machine. Amerasia Journal, 34(3), 110–125.
https://doi.org/10.17953/amer.34.3.v545v63lpj1535p7

93
Litman, T. A. (2017). Economic Value of Walkability. Victoria Transport Policy Institute.
Retrieved from http://www.vtpi.org/walkability.pdf
Loukaitou-Sideris, A., Liggett, R., & Sung, H.-G. (2007). Death on the Crosswalk: A Study of
Pedestrian-Automobile Collisions in Los Angeles. Journal of Planning Education and
Research, 26(3), 338–351. https://doi.org/10.1177/0739456X06297008
Meltzer, R. (2016). Gentrification and small business: Threat or opportunity? Cityscape, 18(3),
57–85.
Meltzer, R., & Capperis, S. (2016). Neighbourhood differences in retail turnover: Evidence from
New York City. Urban Studies, 0042098016661268.
https://doi.org/10.1177/0042098016661268
Meltzer, R., & Ghorbani, P. (2017). Does gentrification increase employment opportunities in
low-income neighborhoods? Regional Science and Urban Economics, 66, 52–73.
https://doi.org/10.1016/j.regsciurbeco.2017.06.002
Meltzer, R., & Schuetz, J. (2012). Bodegas or Bagel Shops? Neighborhood Differences in Retail
and Household Services. Economic Development Quarterly, 26(1), 73–94.
https://doi.org/10.1177/0891242411430328
Montojo, N., & McElvain, B. (2015). MacArthur Accessibility and Investment in North Oakland.
Berkeley, CA: Center for Community Innovation. Retrieved from
http://iurd.berkeley.edu/uploads/MacArthur_Final.pdf
Neumark, D., Zhang, J., & Ciccarella, S. (2008). The effects of Wal-Mart on local labor markets.
Journal of Urban Economics, 63(2), 405–430. https://doi.org/10.1016/j.jue.2007.07.004
Ong, P. M., Pech, C., & Ray, R. (2014). TOD Impacts on Businesses in Four Asian American
Neighborhoods (UCLA TOD Study). Los Angeles, CA: UCLA Center for the Study of
Inequality.
Percival, T. (2009). Commercial Gentrification in a Global City: The Changing Nature of Retail
Markets in East London. School of Geography, University of Leeds, Leeds, UK.
Phillips, D., Flores, L. J., & Henderson, J. (2015). Development without Displacement. Causa
Justa :: Just Cause. Retrieved from https://cjjc.org/wp-
content/uploads/2015/11/development-without-displacement.pdf
Plowman, J. (2014, Spring). What Happens to Retail When Neighborhoods Gentrify? Evidence
from California Metro Areas (Professional Report). University of California, Berkeley,
Berkeley, CA.
Pollack, Stephanie, Bluestone, B., & Billingham, C. (2010). Maintaining Diversity In America’s
Transit-Rich Neighborhoods: Tools for Equitable Neighborhood Change. Boston, MA:
Dukakis Center for Urban and Regional Policy at Northeastern University. Retrieved
from http://nuweb9.neu.edu/dukakiscenter/wp-content/uploads/TRN_Equity_final.pdf
Public Advocates. (2014). California Equitable Development and Anti- Displacement Project.
Retrieved from https://www.rockefellerfoundation.org/annual-report-2014-grantees/
Ridership Reports. (2017). Retrieved July 5, 2017, from
https://www.bart.gov/about/reports/ridership
Santos, A., McGuckin, N., Nakamoto, H. Y., Gray, D., & Liss, S. (2011). Summary of Travel
Trends: 2009 National Household Travel Survey. Retrieved from
https://trid.trb.org/view.aspx?id=1107370
Schlack, E., & Turnbull, N. (2015). Emerging retail gentrification in Santiago de Chile: The case
of Italia-Caupolicán. In Lees, Loretta, H. B. Shin, & E. Lopez-Morales (Eds.), Global
Gentrifications: Uneven Development and Displacement. Policy Press.

94
Schuetz, J. (2014). Do rail transit stations encourage neighbourhood retail activity? Urban
Studies, 1–25. https://doi.org/10.1177/0042098014549128
Schuetz, J., Kolko, J., & Meltzer, R. (2012). Are poor neighborhoods “retail deserts”? Regional
Science and Urban Economics, 42, 269–285.
https://doi.org/10.1016/j.regsciurbeco.2011.09.005
Shkuda, A. (2013). The Art Market, Arts Funding, and Sweat Equity: The Origins of Gentrified
Retail. Journal of Urban History, 39(4), 601–619.
https://doi.org/10.1177/0096144212443134
Shkuda, A. (2015). The Artist as Developer and Advocate: Real Estate and Public Policy in
SoHo, New York. Journal of Urban History, 41(6), 999–1016.
https://doi.org/10.1177/0096144215602008
Sullivan, D. (2014). From Food Desert to Food Mirage: Race, Social Class, and Food Shopping
in a Gentrifying Neighborhood. Advances in Applied Sociology.
https://doi.org/10.4236/aasoci.2014.41006
Sutton, S. A. (2010). Rethinking Commercial Revitalization: A Neighborhood Small Business
Perspective. Economic Development Quarterly, 24(4), 352–371.
https://doi.org/10.1177/0891242410370679
Terzano, K. (2014). Commodification of Transitioning Ethnic Enclaves. Behavioral Sciences,
4(4), 341–351. https://doi.org/10.3390/bs4040341
Woo, S. (2009, December 3). Oakland’s Temescal Goes From Rundown to Reborn. The Wall
Street Journal. Retrieved from https://www.wsj.com/articles/SB125856546008953817
Zheng, S., & Kahn, M. E. (2013). Does Government Investment in Local Public Goods Spur
Gentrification? Evidence from Beijing. Real Estate Economics, 41(1), 1–28.
https://doi.org/10.1111/j.1540-6229.2012.00339.x
Zukin, S. (2009). New Retail Capital and Neighborhood Change: Boutiques and Gentrification in
New York City. City & Community, 8(1), 47–64.
Zukin, Sharon, Kasinitz, P., & Chen, X. (2015). Global Cities, Local Streets: Everyday Diversity
from New York to Shanghai. Routledge. Retrieved from
https://www.amazon.com/Global-Cities-Local-Streets-Diversity/dp/1138023930
Zukin, S., Trujillo, V., Frase, P., Jackson, D., Recuber, T., & Walker, A. (2009). New Retail
Capital and Neighborhood Change: Boutiques and Gentrification in New York City. City
& Community, 8(1), 47–64. https://doi.org/10.1111/j.1540-6040.2009.01269.x

95
XI. Appendices Appendix A
Table A1: Classification for Bay Area Commercial Gentrification Probit Regression
True
Classified D ~D Total
+ 25 23 48
- 106 474 580
Total 131 497 628
Classified + if predicted Pr(D) >= .5
True D defined as com_gen_00_13 != 0
Sensitivity Pr( +| D) 19.08%
Specificity Pr( -|~D) 95.37%
Positive predictive value Pr( D| +) 52.08%
Negative predictive value Pr(~D| -) 81.72%
False + rate for true ~D Pr( +| D) 4.63%
False – rate for true D Pr( -|~D) 80.92%
False + rate for classified + Pr( D| +) 47.92%
False – rate for classified - Pr(~D| -) 18.28%
Correctly classified 79.46%
Table A.2: Classifications for Los Angeles Commercial Gentrification Probit Regression
True
Classified D ~D Total
+ 56 35 91
- 170 805 975
Total 226 840 1,066
Classified + if predicted Pr(D) >= .5
True D defined as com_gen_00_13 != 0
Sensitivity Pr( +| D) 24.78%
Specificity Pr( -|~D) 95.83%
Positive predictive value Pr( D| +) 61.54%
Negative predictive value Pr(~D| -) 82.56%
False + rate for true ~D Pr( +| D) 4.17%
False – rate for true D Pr( -|~D) 75.22%
False + rate for classified + Pr( D| +) 38.46%
False – rate for classified - Pr(~D| -) 17.44%
Correctly classified 80.77%

96
Table A.3: Classifications for Bay Area Residential Gentrification Probit Regression
True
Classified D ~D Total
+ 1 2 3
- 84 1,487 1,571
Total 85 1,489 1,574
Classified + if predicted Pr(D) >= .5
True D defined as gent00_13 != 0
Sensitivity Pr( +| D) 1.18%
Specificity Pr( -|~D) 99.87%
Positive predictive value Pr( D| +) 33.33%
Negative predictive value Pr(~D| -) 94.65%
False + rate for true ~D Pr( +| D) 0.13%
False – rate for true D Pr( -|~D) 98.82%
False + rate for classified + Pr( D| +) 66.67%
False – rate for classified - Pr(~D| -) 5.35%
Correctly classified 94.54%
Table A.4: Classifications for Los Angeles Residential Gentrification Probit Regression
True
Classified D ~D Total
+ 2 0 2
- 80 2,239 2,319
Total 82 2,239 2,321
Classified + if predicted Pr(D) >= .5
True D defined as com_gen_00_13 != 0
Sensitivity Pr( +| D) 2.44%
Specificity Pr( -|~D) 100.00%
Positive predictive value Pr( D| +) 100.00%
Negative predictive value Pr(~D| -) 96.55%
False + rate for true ~D Pr( +| D) 0.00%
False – rate for true D Pr( -|~D) 97.56%
False + rate for classified + Pr( D| +) 0.00%
False – rate for classified - Pr(~D| -) 3.45%
Correctly classified 96.55%

97
Table A.5: NAICS Codes Used for Identifying Infrequent Establishments
NAICS Code Business Type
441110 New Car Dealers
441120 Used Car Dealers
441210 Recreational Vehicle Dealers
441221 Motorcycle, ATV, and Personal Watercraft Dealers
441222 Boat Dealers
441229 All Other Motor Vehicle Dealers
441310 Automotive Parts and Accessories Stores
441320 Tire Dealers
442110 Furniture Stores
442210 Floor Covering Stores
442291 Window Treatment Stores
442299 All Other Home Furnishing Stores
443111 Household Appliance Stores
443112 Radio, Television, and Other Electronics Stores
443120 Computer and Software Stores
443130 Camera and Photographic Supplies Stores
444110 Home Centers
444120 Paint and Wallpaper Stores
444130 Hardware Stores
444190 Other Building Material Dealers
444210 Outdoor Power Equipment Stores
444220 Nursery, Garden Center, and Farm Supply Stores
446199 All Other Health and Personal Care Stores
447190 Other Gasoline Stations
448310 Jewelry Stores
448320 Luggage and Leather Goods Stores
451110 Sporting Goods Stores
451120 Hobby, Toy and Game Stores
451130 Sewing, Needlework, and Piece Goods Stores
451140 Musical Instrument and Supplies Stores

98
453310 Used Merchandise Stores
453920 Art Dealers
453930 Manufactured (Mobile) Home Dealers
453991 Tobacco Stores
453998 All Other Miscellaneous Store Retailers (except Tobacco Stores)
541940 Veterinary Services
713120 Amusement Arcades
713950 Bowling Centers
812910 Pet Care (except Veterinary) Services
Table A.6: NAICS Codes Used for Identifying Discretionary Establishments
NAICS Code Business Type
441110 New Car Dealers
441120 Used Car Dealers
441210 Recreational Vehicle Dealers
441221 Motorcycle, ATV, and Personal Watercraft Dealers
441222 Boat Dealers
441229 All Other Motor Vehicle Dealers
441310 Automotive Parts and Accessories Stores
441320 Tire Dealers
442110 Furniture Stores
442210 Floor Covering Stores
442291 Window Treatment Stores
442299 All Other Home Furnishing Stores
443120 Computer and Software Stores
443130 Camera and Photographic Supplies Stores
444110 Home Centers
444120 Paint and Wallpaper Stores
444130 Hardware Stores
444190 Other Building Material Dealers
444210 Outdoor Power Equipment Stores
444220 Nursery, Garden Center, and Farm Supply Stores
445291 Baked Goods Stores
445292 Confectionery and Nut Stores

99
445299 All Other Specialty Food Stores
445310 Beer, Wine, and Liquor Stores
446120 Cosmetics, Beauty Supplies, and Perfume Stores
446191 Food (Health) Supplement Stores
447190 Other Gasoline Stations
448310 Jewelry Stores
448320 Luggage and Leather Goods Stores
451110 Sporting Goods Stores
451120 Hobby, Toy, and Game Stores
451130 Sewing, Needlework, and Piece Goods Stores
451140 Musical Instrument and Supplies Stores
451211 Book Stores
451212 News Dealers and Newsstands
451220 Prerecorded Tape, Compact Disc, and Record Stores
452111 Department Stores (Except Discount Department Stores)
452112 Discount Department Stores
453110 Florists
453210 Office Supplies and Stationery Stores
453220 Gift, Novelty, and Souvenir Stores
453310 Used Merchandise Stores
453910 Pet and Pet Supplies Stores
453920 Art Dealers
453930 Manufactured (Mobile) Home Dealers
453991 Tobacco Stores
453998 All Other Miscellaneous Store Retailers (Except Tobacco Stores)
532230 Video Tape and Disc Rental
541940 Veterinary Services
713120 Amusement Arcades
713940 Fitness and Recreational Sports Centers
713950 Bowling Centers
722110 Full-Service Restaurants
722211 Limited-Service Restaurants
722212 Cafeterias, Grill Buffets, and Buffets
722213 Snack and Nonalcoholic Beverage Bars

100
722410 Drinking Places (Alcoholic Beverages)
812113 Nail Salons
812199 Other Personal Care Services
812910 Pet Care (except Veterinary) Services

101
Appendix B
Table B1: Variance Inflation Factor, Bay Area Ridership Linear Regression
Variable VIF 1/VIF
Household income (2000) 5.36 0.186458
% college-educated (2000) 4.78 0.209004
Road network density (2014) 3.67 0.272605
% renting (2000) 3.26 0.306924
% Hispanic (2000) 3.12 0.320637
Street intersection density (2014) 2.49 0.402164
Population density (2000) 2.28 0.437920
% units built pre-1950 (2000) 1.82 0.549992
% foreign-born 1.71 0.585275
% non-Hispanic black 1.71 0.586136
Employees per sq. mi. (2000) 1.55 0.646252
Res. gent. ’90-‘00 1.18 0.844490
Com. gent. ’90-‘00 1.16 0.861573
Mean VIF 2.62
Table B2: Variance Inflation Factor, Los Angeles Ridership Linear Regression
Variable VIF 1/VIF
% foreign-born (2000) 3.28 0.305343
Street intersection density (2014) 3.03 0.330462
% renting (2000) 2.90 0.344542
Road network density (2014) 2.90 0.344979
Population density (2000) 2.89 0.346169
Employees per sq. mi. (2000) 2.25 0.444301
% non-Hispanic black (2000) 2.01 0.498109
% college educated (2000) 1.79 0.557833
Com. gent. ’90-‘00 1.64 0.608441
% units built pre-1950 (2000) 1.62 0.617279
Res. gent. ’90-‘00 1.14 0.876913
Mean VIF 2.31

102
Table B3: Variance Inflation Factor, Combined Bay Area & Los Angeles Ridership Linear
Regression
Variable VIF 1/VIF
Median household income (2000) 4.30 0.232433
% renting (2000) 2.65 0.376779
% foreign-born (2000) 2.37 0.422118
Population density (2000) 2.15 0.465231
% non-Hispanic black (2000) 1.84 0.543517
Region 1.68 0.594473
Employees per sq. mi. (2000) 1.40 0.712082
% units built pre-1950 (2000) 1.40 0.712203
Street intersection density (2014) 1.32 0.757978
Com. gent. ’90-‘00 1.18 0.845828
Res. gent. ’90-‘00 1.11 0.904749
Mean VIF 1.95

103
Appendix C
Detailed Characteristics of Bay Area Case Study Areas
Table C.1: Change in Selected Demographic Characteristics from 2000-2013 – Bay Area
Bay Area
San
Francisco
Alameda
County Oakland Temescal KoNo
Population
1990 6,023,577 723,959 1,279,182 372,242 3,922 2,472
2000 6,783,760 776,733 1,443,741 399,484 4,007 2,810
2013 7,257,501 817,501 1,535,248 397,011 4,210 4,018
Change 2000-2013 7.0% 5.2% 6.3% -0.6% 5.1% 43.0%
Population Density (per sq. mi.)
1990 870 15502 1735 6640 11609 7613
2000 980 16634 1957 7127 11787 8672
2013 1051 17441 2077 7117 11846 12057
Change 2000-2013 7.2% 4.8% 6.1% -0.1% 0.5% 39.0%
Median Household Income (2013 $)
1990 $78,083 $62,786 $70,546 $50,912 $39,450 $23,571
2000 $87,449 $77,230 $78,244 $56,019 $46,200 $27,725
2013 $78,388 $74,604 $72,112 $52,583 $53,438 $35,030
Change 2000-2013 -10.4% -3.4% -7.8% -6.1% 15.7% 26.3%
% Renting Households
1990 43.6% 65.5% 46.7% 58.3% 81.8% 94.2%
2000 42.3% 65.0% 45.3% 58.6% 81.7% 96.1%
2013 44.1% 63.4% 46.8% 59.6% 80.1% 87.8%
Change 2000-2013 4.3% -2.5% 3.3% 1.8% -2.0% -8.7%
% Non-Hispanic White
1990 60.7% 46.6% 53.2% 28.3% 36.4% 27.9%
2000 50.0% 43.6% 40.9% 23.5% 36.9% 24.1%
2013 42.0% 41.7% 33.7% 26.1% 47.5% 21.2%
Change 2000-2013 -16.0% -4.4% -17.6% 11.0% 28.5% -12.1%

104
% Black
1990 8.6% 10.6% 17.4% 42.8% 41.7% 47.7%
2000 7.3% 7.6% 14.6% 35.1% 32.2% 49.0%
2013 6.3% 5.6% 11.8% 26.5% 22.7% 33.8%
Change 2000-2013 -14.1% -25.7% -19.2% -24.3% -29.5% -30.9%
% Asian/Pacific Islander
1990 14.7% 28.4% 14.5% 14.2% 11.6% 16.2%
2000 19.3% 31.1% 20.9% 15.6% 12.6% 11.4%
2013 24.1% 33.5% 27.4% 17.0% 9.5% 20.8%
Change 2000-2013 24.5% 7.7% 31.4% 8.8% -24.6% 83.1%
% Hispanic
1990 15.3% 13.9% 14.2% 13.9% 9.0% 7.4%
2000 19.4% 14.1% 19.0% 21.9% 11.8% 8.9%
2013 23.6% 15.2% 22.5% 25.7% 14.6% 20.0%
Change 2000-2013 21.6% 7.7% 18.7% 17.4% 23.8% 125.5%
% Native American/Other
1990 0.7% 0.6% 0.7% 0.8% 1.3% 0.7%
2000 0.6% 0.6% 0.7% 0.7% 1.4% 1.2%
2013 0.6% 0.7% 0.6% 0.7% 0.2% 0.8%
Change 2000-2013 -10.6% 17.5% -16.3% 0.6% -86.1% -35.7%
% Two or More Races
1990 - - - - - -
2000 3.3% 3.0% 3.9% 3.2% 5.0% 5.5%
2013 3.5% 3.3% 4.0% 4.0% 5.5% 3.4%
Change 2000-2013 5.8% 9.4% 1.0% 23.9% 9.7% -38.2%

105
Table C.2: Change in Selected Business Characteristics from 2000-2013 – Bay Area
Bay Area San Francisco
Alameda
County Oakland
Temescal
Study Area
KoNo
Study Area
Establishments
1990-1992 604,654 95,166 121,493 34,754 595 1,358
2000-2002 740,690 114,677 142,966 39,410 581 1,480
2011-2013 1,224,480 180,670 230,438 61,471 832 1,842
Change 2000-2013 65.3% 57.5% 61.2% 56.0% 43.2% 24.5%
Establishment density per sq. mi.
1990-1992 87.5 2036.4 164.4 621.8 1744.7 4097.1
2000-2002 107.2 2453.9 193.4 705.1 1703.6 4465.2
2011-2013 177.2 3866.1 311.8 1099.8 2439.6 5557.4
Change 2000-2013 65.3% 57.5% 61.2% 56.0% 43.2% 24.5%
Employees per establishment
1990-1992 10.1 10.5 10.6 10.2 6.9 7.6
2000-2002 10.5 10.9 11.2 10.4 7.4 7.8
2011-2013 7.2 8.0 7.8 7.3 6.2 6.8
Change 2000-2013 -31.0% -26.9% -30.5% -29.6% -16.8% -13.0%

106
Appendix D
Detailed Characteristics of Los Angeles Case Study Areas
Table D.1: Change in Selected Demographic Characteristics from 2000-2013 – Los Angeles
LA County Hollywood/Vine Vermont/Sunset
Population
1990 8,863,164 15,006 18,805
2000 9,519,338 13,032 18,428
2013 9,893,481 12,409 15,929
Change 2000-2013 +3.9% -4.8% -13.6%
Population Density (per sq. mi.)
1990 2,183 19,106 23,943
2000 2,344 16,593 23,464
2013 2,438 15,800 20,281
Change 2000-2013 4.0% -4.8% -13.6%
Mean Household Income (2013 $)
1990 $85,710 $43,863 $51,995
2000 $86,415 $46,678 $44,360
2013 $81,416 $51,696 $47,621
Change 2000-2013 -4.6% +10.8% +7.4%
% Renting Households
1990 51.8% 93.8% 89.5%
2000 52.1% 93.6% 91.1%
2013 53.1% 91.0% 91.3%
Change 2000-2013 1.92% -2.78% +2.01%
% Non-Hispanic White
1990 40.8% 40.7% 35.4%
2000 31.0% 43.6% 32.9%
2013 27.5% 50.9% 42.1%
Change 2000-2013 -11.29% +16.74% +27.96%

107
% Black
1990 11.2% 6.8% 4.5%
2000 9.8% 7.6% 3.5%
2013 8.4% 3.7% 3.8%
Change 2000-2013 -14.29% -51.32% +8.57%
% Asian/Pacific Islander
1990 10.8% 5.3% 17.8%
2000 12.3% 7.9% 15.2%
2013 14.2% 6.4% 16.1%
Change 2000-2013 +15.45% -18.99% +5.92%
% Hispanic
1990 37.8% 47.7% 43.3%
2000 44.6% 36.9% 41.5%
2013 47.9% 34.6% 37.2%
Change 2000-2013 +7.40% -6.23% -10.36%
% Native American/Other
1990 21.2% 18.3% 17.8%
2000 24.3% 22.2% 22.3%
2013 20.3% 24.7% 21.2%
Change 2000-2013 -16.46% +11.26% -4.93%
% Two or More Races
1990 - - -
2000 4.9% 6% 10%
2013 3.7% 3.4% 3.3%
Change 2000-2013 -24.49% -43.33% -67.00%
Source: Tabulated by authors from 1990 and 2000 decennial census, and 2009-2013 5-year
ACS. Station area characteristics are block group data, area weighted for ½-mile radius from
the station. Hispanics may be of any race.

108
Table D.2: Change in Selected Business Characteristics from 2000-2013 – Los Angeles
L.A. County City of L.A.
Hollywood/Vine
Study Area
Vermont/Sunset
Study Area
Establishments
1990-1992 365,976 85,460 1,534 757
2000-2002 460,706 116,166 1,732 943
2011-2013 813,047 191,140 2,461 1,464
Change 2000-2013 76.48% 64.54% 42.08% 55.28%
Establishment density per sq. mi.
1990-1992 90.2 182.3 1953.1 963.4
2000-2002 113.5 247.9 2205.7 1200.7
2011-2013 200.4 407.8 3133.9 1864.4
Change 2000-2013 76.48% 64.54% 42.08% 55.28%
Employees per establishment
1990-1992 11.5 14.3 12.8 18.6
2000-2002 10.0 10.7 10.2 17.9
2011-2013 6.0 6.6 7.1 11.6
Change 2000-2013 -39.90% -38.14% -30.03% -35.11%

109
Appendix E:
Case Study Interview Tool
Instructions
1. Wear university gear
2. Introduce yourself
a. If manager/owner does not agree to interview, move on to next business
b. If manager/owner agrees to interview:
i. Read informed consent
ii. Provide copy of informed consent
iii. Administer interview
3. Give thanks to interviewee
4. Record interview information AFTER conducting interview (below)
---------------------------------------------------------------------------------------------------------------------
To be completed after interview
Interviewer Name:
Date of Interview:___________
Time Interview Began: ___:____AM / PM (circle one)
Type of Business: 󠄀 Standalone 󠄀 Strip mall
Ethnic (non-anglo) (describe):___________________________________
‘Trendy’ (describe):___________________________________________
Adjacent to: 󠄀 Vacant 󠄀 For Rent 󠄀 For Sale 󠄀 Eviction
Comments here:
______________________________________________________________________________
______________________________________________________________________________
______________________________________________________________________________
Guide for interview to be administered to business establishment manager or owner.
Interview is not to be recorded.
1. How long has your business been at this location?
2. Have you noticed changes in the types of businesses that are located in your
neighborhood in recent years? Please describe them.
3. Have you noticed changes in the kind of customer who shops here in recent years? If so,
have you changed the types of products/services that you offer?
4. In recent years, have you noticed changes in the number of pedestrians/bicyclists in the
area?
5. Have you noticed changes in the transport mode by which customers access your
business?
6. Do you know your rent per sq. ft.? How many years is your lease? Has your rent changed
in recent years?

110
7. Have you ever considered relocating and if so, why?
8. Do we know of neighborhood businesses that have closed down or relocated? Why did
they?
9. Have you noticed changes in the amount of vehicle traffic or parking congestion in recent
years?
10. What do you think might be causing these changes? Do you have any thoughts as to what
the contributing factors are?
11. Have you witnessed or heard of any crashes near your business that involved pedestrians
or people on bikes? What happened?
12. Are there any changes in the neighborhood that you think have changed safety for people
on bikes or walking?

111
Appendix F
Case Study Observation Tool
Observation checklist to be completed for the following intersections:
_______________________ _______________________ _______________________
Intersection #1 Intersection #2 Intersection #3
Observer Name:
Date of Observation:___________ Day of Week of Observation: ____________________
Time of Observation: ___:____AM / PM (circle one)
Comments here:
Business establishment counts to be completed for commercial corridors in the following census
tracts: _______________________ _______________________
Tract #1 Tract #2
Establishment Type Count in Tract 1 Count in Tract 2
Standalone
establishments
Strip mall
establishments
Ethnic businesses
(non-anglo)
Chain stores
Vacant
For sale
For rent
Eviction notice
Trendy stores
(boutique, out of place,
high end, etc.)
Observer Name:
Date of Observation:___________
Comments here: