Embed Size (px)
Citation preview
A POLICY IMPLEMENTATION STRATEGY
ANGELA BRINKLOW
SUPERVISED RESEARCH PROJECTMCGILL UNIVERSITY
SEPTEMBER 2010
TRANSITORIENTEDDEVELOPMENT

Transit-Oriented Development:A Policy Implementation Strategy
Supervised Research Project submitted in partial fulfillment of the Masters of Urban Planning degree
23 September 2010
Angela Brinklow
School of Urban PlanningMcGill UniversityMontréal, Québec

All figures in this report are ownership of the author, unless specifiedTypeset in Frutiger LT Std.
iii
ACKNOWLEDGEMENTS
I would like to thank Professor Ahmed El-Geneidy for his invaluable contribution
throughout the production of this research paper. I would also like to thank Pro-
fessor Raphäel Fischler, who provided thorough suggestions which contributed
to the overall quality of this work.
I am grateful to Ken Greenberg for suggesting this research topic and
directing the focus of this project. This real-world problem allowed me to step
outside of my academic comfort zone and learn about an important and current
planning issue.
A special acknowledgement goes out to the Master of Urban Planning
Class of 2010, who challenged me academically and created the most pleasur-
able work environment of which I have ever been a part. In particular, I could
not have survived the most trying parts of this program without Ashley Parks,
who never left me to work alone.
The completion of this degree would not have been possible without the
love and support of my family, who strove to provide me with the best opportu-
nities in life.
Finally, I owe a debt of gratitude to Alexandre de Lorimier, who challenged
me to be a stronger person and a better planner. Merci de m'avoir donné amour
et soutien même dans les moments où ils étaient les moins mérités. Ta patience
et tes encouragements sont sans pareil.

v
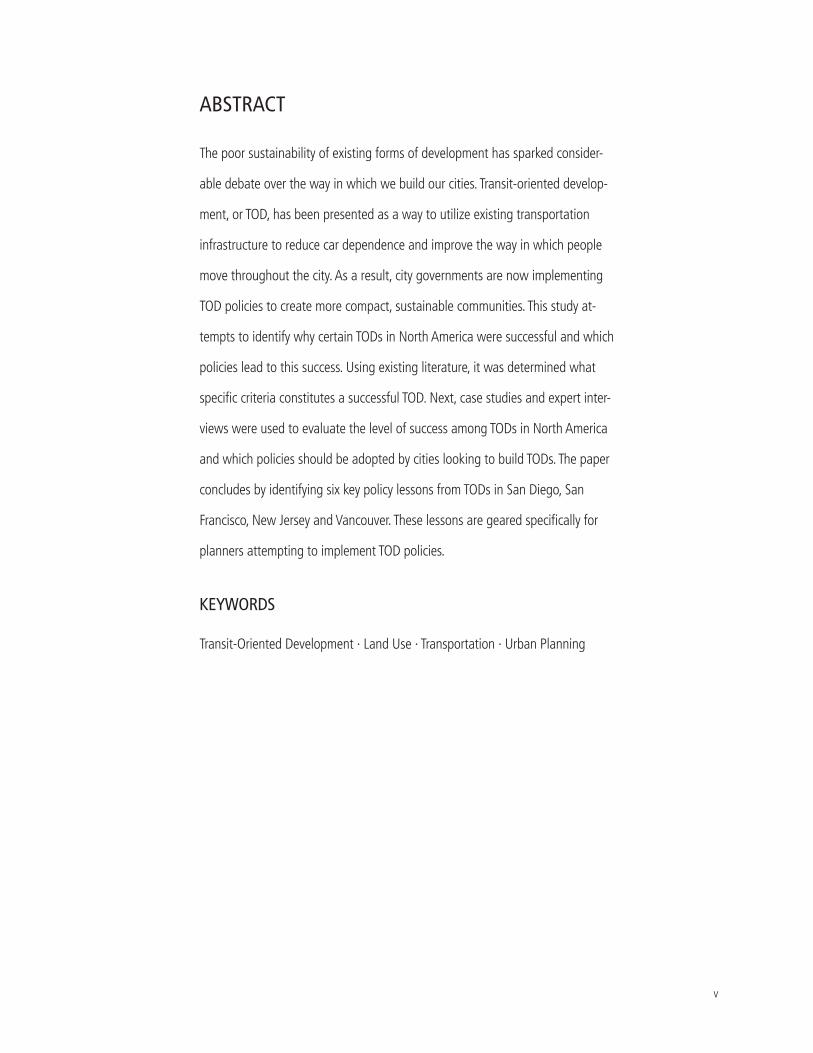
ABSTRACT
The poor sustainability of existing forms of development has sparked consider-
able debate over the way in which we build our cities. Transit-oriented develop-
ment, or TOD, has been presented as a way to utilize existing transportation
infrastructure to reduce car dependence and improve the way in which people
move throughout the city. As a result, city governments are now implementing
TOD policies to create more compact, sustainable communities. This study at-
tempts to identify why certain TODs in North America were successful and which
policies lead to this success. Using existing literature, it was determined what
specific criteria constitutes a successful TOD. Next, case studies and expert inter-
views were used to evaluate the level of success among TODs in North America
and which policies should be adopted by cities looking to build TODs. The paper
concludes by identifying six key policy lessons from TODs in San Diego, San
Francisco, New Jersey and Vancouver. These lessons are geared specifically for
planners attempting to implement TOD policies.
KEYWORDS
Transit-Oriented Development · Land Use · Transportation · Urban Planning

vii
ABRÉGÉ
La faible durabilité des formes courantes de développement urbain a provo-
qué de nombreux débats sur notre façon de bâtir la ville. Les aménagements
axés sur le transport en commun, ou AATC, sont présentés comme une façon
d'utiliser les infrastructures de transport existantes pour réduire notre dépen-
dance envers les véhicules individuels et pour améliorer la mobilité urbaine. Petit
à petit, les gouvernements ont donc intégré des politiques AATC pour créer les
communautés plus compactes et durables. Cette étude cherche à identifier les
raisons du succès de certains AATC nord-américains et les politiques publiques
qui ont favorisé leur réalisation. Les critères spécifiques qui constituent un AATC
à succès ont été analysés parmi la documentation scientifique et profession-
nelle. Par la suite, des études de cas ainsi que des entrevues avec des experts
ont permis d'évaluer le niveau de succès des AATC nord-américains et quelles
politiques devraient être adoptées par des villes qui souhaitent créer des AATC.
Le mémoire est complété avec l'identification de six politiques clé dans des
AATC de San Diego, de San Francisco, au New Jersey et à Vancouver. Ces leçons
sont orientées spécifiquement pour des urbanistes qui cherchent à mettre en
place une politique AATC dans leur communauté.
MOTS-CLÉ
Aménagements axés sur le transport en commun · Aménagement du territoire ·
Transport · Urbanisme

ix
TABLE OF CONTENTS
01 INTRODUCTION ......................................................................................................................................... 1
02 TRANSIT-ORIENTED DEVELOPMENT ..................................................................................................... 3
2.1 WHAT IS TRANSIT-ORIENTED DEVELOPMENT? .................................................................................. 3
2.2 BENEFITS OF TRANSIT-ORIENTED DEVELOPMENT ............................................................................. 4
2.3 THE IMPACT OF DENSITY, DIVERSITY AND DESIGN ON TRAVEL BEHAVIOR ....................................... 5
2.3.1 Density
2.3.2 Diversity
2.3.3 Design
03 EVALUATION OF TRANSIT-ORIENTED DEVELOPMENT ...................................................................... 9
3.1 REGIONAL AND LOCAL PRIORITIES ................................................................................................... 9
3.2 TRANSIT-ADJACENT DEVELOPMENT ............................................................................................... 10
3.3 CRITERIA TO MEASURE SUCCESS .................................................................................................... 11
3.3.1 Transportation Success
3.3.2 Economic Success
3.3.3 Social Success
3.3.4 Physical Design Success
04 RESEARCH DESIGN ................................................................................................................................. 17
4.1 PART 1: CASE STUDIES .................................................................................................................... 17
4.1.1 Selection of Indicators
4.1.2 Selection of Case Studies
4.1.3 Evaluation of TODs
4.1.4 Data Sources
4.2 PART 2: EXPERT INTERVIEWS .......................................................................................................... 20
05 ANALYSIS OF SELECTED TRANSIT-ORIENTED DEVELOPMENTS .................................................... 21
5.1 SAN FRANCISCO, CALIFORNIA: HAYWARD, FREMONT AND BERKELEY ........................................... 21
5.2 SAN DIEGO, CALIFORNIA: UPTOWN DISTRICT, AMERICAN PLAZA AND RIO VISTA WEST ................. 28
5.3 PORTLAND, OREGON: ORENCO STATION ........................................................................................ 31
5.4 VANCOUVER, BRITISH COLUMBIA: JOYCE/COLLINGWOOD VILLAGE............................................... 35
5.5 NEW JERSEY STATE: MORRISTOWN, RAHWAY, AND SOUTH ORANGE ............................................. 39
5.6 ARLINGTON, VIRGINIA: ROSSLYN, CLARENDON AND BALLSTON ..................................................... 44
5.7 EVALUATION OF ALL TODS .............................................................................................................. 48
x
06 LESSONS LEARNED ................................................................................................................................. 51
6.1 LESSON 1: THINK REGIONALLY ........................................................................................................ 51
6.2 LESSON 2: PROVIDE FINANCIAL INCENTIVES .................................................................................. 52
6.3 LESSON 3: WORK TOGETHER........................................................................................................... 52
6.4 LESSON 4: ESTABLISH GUIDELINES ................................................................................................. 52
6.5 LESSON 5: CREATE COMPLETE COMMUNITIES ............................................................................... 53
6.6 LESSON 6: PUT WALKING FIRST ...................................................................................................... 54
07 FURTHER RESEARCH ............................................................................................................................... 55
08 REFERENCES ............................................................................................................................................. 57
09 APPENDIX 1: ETHICS REVIEW ............................................................................................................... 63
xi
LIST OF TABLES
TABLE 1: TOD SUCCESS INDICATORS ......................................................................................................................... 12
TABLE 2: DESCRIPTION OF TOD SUCCESS INDICATORS ............................................................................................. 18
TABLE 3: SELECTED TOD CASE STUDIES ..................................................................................................................... 19
TABLE 4: TRAVEL BEHAVIOUR IN HAYWARD, FREMONT AND BERKELEY TODS.......................................................... 23
TABLE 5: ECONOMIC SUCCESS IN HAYWARD, FREMONT AND BERKELEY TODS ........................................................ 24
TABLE 6: POVERTY IN HAYWARD, FREMONT AND BERKELEY TODS ........................................................................... 25
TABLE 7: SIZE OF DWELLINGS IN HAYWARD, FREMONT AND BERKELEY TODS .......................................................... 25
TABLE 8: TYPES OF DWELLINGS IN HAYWARD, FREMONT AND BERKELEY TODS ....................................................... 26
TABLE 9: LAND USE IN HAYWARD, FREMONT AND BERKELEY TODS ......................................................................... 27
TABLE 10: STREET DESIGN & SUCCESS IN HAYWARD, FREMONT AND BERKELEY TODS ............................................ 27
TABLE 11: TRAVEL BEHAVIOUR IN UPTOWN DISTRICT, AMERICAN PLAZA AND RIO VISTA WEST TODS ..................... 29
TABLE 12: TYPES OF DWELLINGS IN UPTOWN DISTRICT, AMERICAN PLAZA AND RIO VISTA WEST TODS .................. 31
TABLE 13: COST OF HOUSING IN ORENCO STATION TOD .......................................................................................... 33
TABLE 14: TRAVEL BEHAVIOUR IN JOYCE/COLLINGWOOD VILLAGE TOD .................................................................. 36
TABLE 15: COST & SIZE OF DWELLINGS IN JOYCE/COLLINGWOOD TOD .................................................................... 38
TABLE 16: TRAVEL BEHAVIOUR IN MORRISTOWN, RAHWAY AND SOUTH ORANGE TODS ......................................... 41
TABLE 17: ECONOMIC SUCCESS IN MORRISTOWN, RAHWAY AND SOUTH ORANGE TODS ....................................... 42
TABLE 18: POVERTY IN MORRISTOWN, RAHWAY AND SOUTH ORANGE TODS .......................................................... 42
TABLE 19: TYPES OF DWELLINGS IN MORRISTOWN, RAHWAY AND SOUTH ORANGE TODS ...................................... 43
TABLE 20: TRAVEL BEHAVIOUR IN ROSSLYN, CLARENDON AND BALLSTON TODS ..................................................... 45
TABLE 21: EVALUATION OF TOD CASE STUDIES ........................................................................................................ 50

xiii
LIST OF FIGURES
FIGURE 1: TRANSIT-ORIENTED DEVELOPMENT .........................................................................................................3
FIGURE 2: SUBURBAN VERSUS GRID STREETS ..........................................................................................................7
FIGURE 3: FREMONT STATION PARKING LOT ..........................................................................................................10
FIGURE 4: LOCATION OF HAYWARD, FREMONT AND BERKELEY STATIONS .............................................................21
FIGURE 5: LOCATION OF UPTOWN DISTRICT AMERICAN PLAZA AND RIO VISTA WEST STATIONS ...........................28
FIGURE 6: LOCATION OF ORENCO STATION ............................................................................................................32
FIGURE 7: MIXED-USE BUILDINGS IN ORENCO STATION .........................................................................................33
FIGURE 8: PEDESTRIAN-FRIENDLY STREET DESIGN IN ORENCO STATION ................................................................35
FIGURE 9: LOCATION OF JOYCE/COLLINGWOOD VILLAGE STATION ........................................................................36
FIGURE 10: PEDESTRIAN-FRIENDLY STREET DESIGN IN JOYCE/COLLINGWOOD VILLAGE ........................................38
FIGURE 11: LOCATION OF MORRISTOWN, RAHWAY AND RIO VISTA WEST STATIONS .............................................39
FIGURE 12: INTEGRATION OF TRANSIT AND LAND USE AT SOUTH ORANGE STATION ............................................40
FIGURE 13: LOCATION OF ROSSLYN, CLARENDON AND BALLSTON STATIONS ........................................................44
FIGURE 14: MARKET COMMONS MIXED-USE CENTRE IN CLARENDON ..................................................................46

BRINKLOW
1
01 INTRODUCTION
The rise of environmental awareness and concerns with budget deficits has sparked debate over the sustainability of
current development practices in many North American cities. After the Second World War, sprawling residential develop-
ment dominated city landscapes and the now-affordable automobile facilitated this pattern of growth. By the 1970s and
1980s, low land values and abundant space attracted employers who were previously in the downtown core. The com-
bined decentralization of housing and employment required larger amounts of land and infrastructure to accommodate
this car-dependent development. In addition, since public transit was limited and uneconomical in low-density areas, res-
idents relied heavily on their cars, resulting in longer commuting times and increased congestion on regional highways
(Badoe & Miller, 2000; Dunphy, 2005; Easley, 1992). Today, the high proportion of car trips has led to increased pollution
from greenhouse gases, frustration from highway gridlock and significant spending on expanding infrastructure.
One way to reduce the negative effects of sprawl is to decrease reliance on the automobile. Reducing automo-
bile dependence would yield significant benefits for cities throughout North America, as well as improve the social and
economic prosperity of its communities. However, with much of the city already built, the challenge will be for planners
to promote developments that increase density and capitalize on existing transportation infrastructure. Transit-oriented
development, or TOD, has been presented as a paradigm that integrates traditional neighbourhood design and transit.
This emerging design concept may help to alleviate the economic, social and environmental consequences of sprawl.
This study begins by examining the relevant literature related to TOD and explores many of its benefits and
impacts on travel behaviour. The paper then examines many of the issues involved with implementing TOD and provides
a list of criteria for measuring successful TOD in North America. Next, the research methodology used in this study is
described, followed by an evaluation of selected successful TODs in North America. The final sections outline lessons
learned from personal interviews with experts working for TODs identified in this report, and concludes with a discussion
of the need for future research.

BRINKLOW
3
02 TRANSIT-ORIENTED DEVELOPMENT
2.1 What is Transit-Oriented Development?
Transit-oriented development lies within the concept of New Urbanism. New Urbanist theory suggests that compact,
mixed-use communities are the answer to the suburban problem. Currently, no single definition exists for TOD, although
several academics have adopted their own explanations of this new paradigm. One of the original and most popular
definitions of the transit-oriented concept came from Peter Calthorpe, an architect and proclaimed New Urbanist. Ac-
cording to Calthorpe (1993), TODs are:
Mixed-use communit[ies] within an average 2,000-foot walking distance of a transit stop
and a core commercial area. TODs mix residential, retail, office, open space, and public uses
in a walkable environment, making it convenient for residents and employees to travel by
transit, bicycle, foot or car (p. 56).
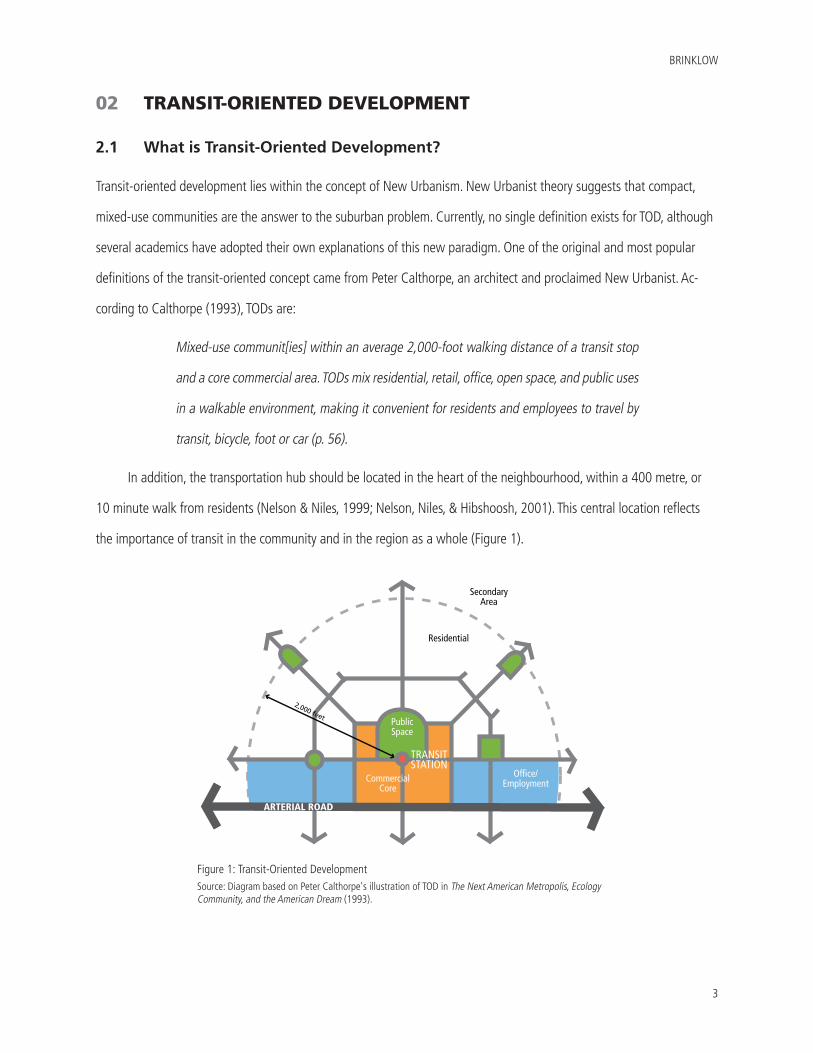
In addition, the transportation hub should be located in the heart of the neighbourhood, within a 400 metre, or
10 minute walk from residents (Nelson & Niles, 1999; Nelson, Niles, & Hibshoosh, 2001). This central location reflects
the importance of transit in the community and in the region as a whole (Figure 1).
Public Space
TRANSIT STATION
Residential
2,000 feet
Commercial Core
Of�ce/Employment
Secondary Area
ARTERIAL ROAD
Figure 1: Transit-Oriented DevelopmentSource: Diagram based on Peter Calthorpe's illustration of TOD in The Next American Metropolis, Ecology Community, and the American Dream (1993).
TRANSIT-ORIENTED DEVELOPMENT: A POLICY IMPLEMENTATION STRATEGY
4
In essence, the ideas expressed by Calthorpe call for better integration between land use and transportation policy
(Renne & Wells, 2004). This integration is what differentiates TODs from every other development. TOD takes traditional
neighbourhood design one step further by coordinating transportation infrastructure and the density, diversity and
design needed to support transit use.
2.2 Benefits of Transit-Oriented Development
The rewards of TOD begin with the modal shift away from private automobiles towards more environmentally sustain-
able forms of travel, such as transit, walking or cycling. In theory, residents who have access to high-quality transit are
more likely to take transit than those living without the same access. In California, for example, residents living in TODs
were five times more likely to commute via transit compared to residents in suburban-style neighbourhoods (Cervero,
1994; Lund, Cervero, & Wilson, 2004). It should be noted, however, that self-selection accounts for some of this transit
use. For example, residents who typically take transit are more likely to live in transit-supportive neighbourhoods because
they require or already prefer commuting by transit (Boarnet & Crane, 2001; Cervero & Duncan, 2002; Crane, 1996;
Krizek, 2000, 2003). In Vancouver's Joyce/Collingwood Village, 50% of residents took transit to work, but only 13% of
riders used it more since moving to the neighbourhood (Canada Mortgage and Housing Corporation, 2009). According
to Cervero and Duncan (2002), self-selection accounts for 40% of commute decisions, indicating that access to transit
had a positive effect on the remaining 60% of transit riders. Therefore, it appears that TOD encourages higher transit
use, thus also reducing the number of vehicle miles travelled, or VMT. When people drive less, the economic, social and
environmental well-being of the city is improved.
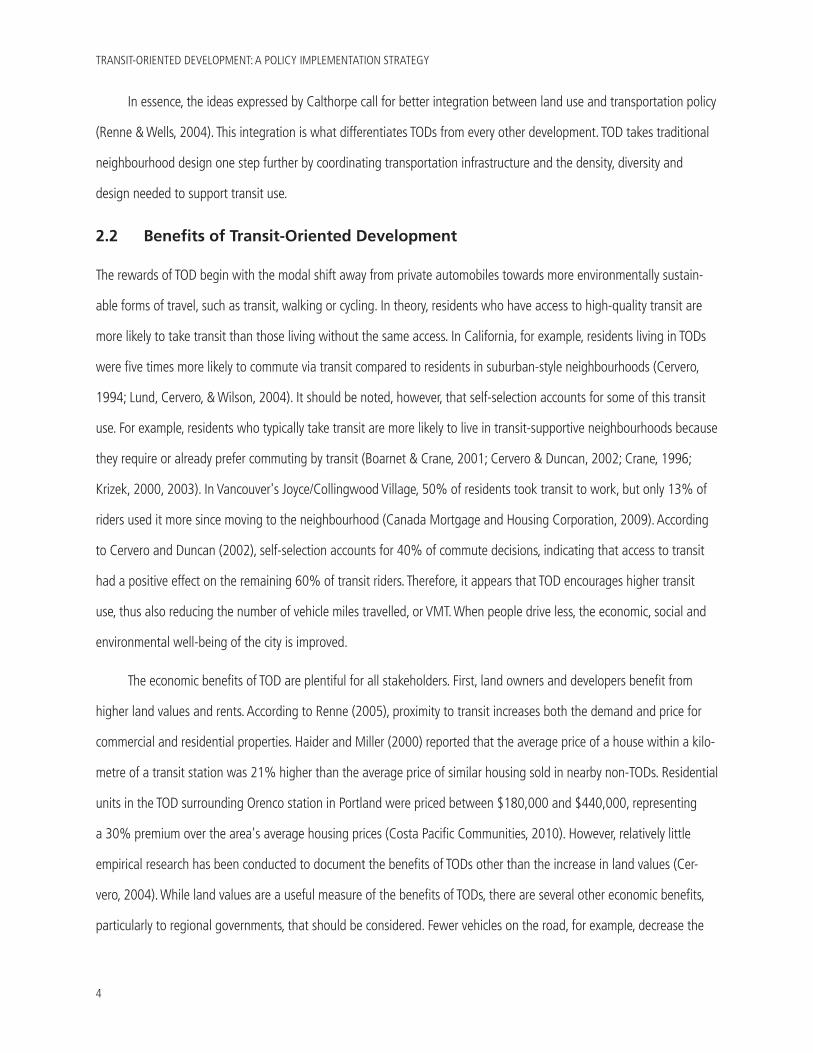
The economic benefits of TOD are plentiful for all stakeholders. First, land owners and developers benefit from
higher land values and rents. According to Renne (2005), proximity to transit increases both the demand and price for
commercial and residential properties. Haider and Miller (2000) reported that the average price of a house within a kilo-
metre of a transit station was 21% higher than the average price of similar housing sold in nearby non-TODs. Residential
units in the TOD surrounding Orenco station in Portland were priced between $180,000 and $440,000, representing
a 30% premium over the area's average housing prices (Costa Pacific Communities, 2010). However, relatively little
empirical research has been conducted to document the benefits of TODs other than the increase in land values (Cer-
vero, 2004). While land values are a useful measure of the benefits of TODs, there are several other economic benefits,
particularly to regional governments, that should be considered. Fewer vehicles on the road, for example, decrease the
BRINKLOW
5
need for expensive infrastructure. According to Renne and Wells (2005), TODs can reduce infrastructure costs for local
governments by up to 25% through the use of compact or infill development. TODs also provide significant savings to
residents and employees who benefit from low-cost public transit. In San Francisco, for example, the cost of a round trip
fare between Fremont and San Francisco's downtown Montgomery Station is $10 and takes 46 minutes. The same trip
by car takes 40 free flow minutes, nearly $10 in fuel costs, and a $3 one-way charge for the Bay Bridge during peak
hours (Renne, 2009). When considering the actual travel time during rush hour, plus parking and annual costs incurred
from vehicle ownership, a trip on the Bay Area Rapid Transit, or BART, is significantly more economical than driving
alone.
In addition to the environmental and economic benefits of TOD mentioned above, there are several social advan-
tages for residents living in TODs. Like traditional neighbourhoods in urban areas of the city, a TOD should bring people
from diverse social backgrounds into one vibrant community (Bernick & Cervero, 1997). This diversity of people trans-
lates into a diversity of needs that should be met with pleasant streets, public spaces and community centres. For ex-
ample, public spaces are filled by employees during lunch hour, retired residents throughout the day, and families on the
weekend. According to Gehl (1987), there should be three types of activities that take place in public spaces: necessary
activities, optional activities, and social activities. The TOD's mix of housing, employment, retail and recreation supports
these activities by diversifying the types of movement in one area. In addition, when these needs are met within the
community, the neighbourhood has more pedestrian traffic, creating a safe public realm (Jacobs, 1989). By diversifying
the activities that occur on the street, streets are busy throughout the day and maintain a level of vibrancy that people
enjoy (Renne & Wells, 2002). Rosslyn station in Arlington, Virginia, is arguably one of the best examples of TOD in North
America. The community is known for its walkability and is a destination for many residents and employees. As a result,
ridership at Rosslyn station is not only high, but is balanced throughout the day. This balance represents the area's ability
to capture people at all times of the day for a variety of reasons (Washington Metropolitan Area Transit Authority, 2010).
While TOD is not a panacea for community development, if done correctly, this form of development can create vibrant
places and boost social interaction, instill a sense of community, and provide safe public spaces.
2.3 The Impact of Density, Diversity and Design on Travel Behavior
The relationship between the built environment and travel behaviour has been studied extensively. Previous research
(Boarnet & Crane, 2001; Frank & Pivo, 1994; Moudon, Hess, Snyder, & Stanilov, 1997; Tumlin & Millard-Ball, 2003) looks
TRANSIT-ORIENTED DEVELOPMENT: A POLICY IMPLEMENTATION STRATEGY
6
specifically at the effects of density on travel demand, arguing that higher residential and employment densities have
a positive relationship with transit ridership. Cervero and Kockelman (1997) added diversity and design to the list of
ingredients for how urban form affects travel behaviour, resulting in the 3Ds: density, diversity and design. These three
physical principles are the key physical ingredients that create ideal TODs.
2.3.1 Density
High density and compact developments induce more pedestrian and transit trips, reducing both the length and
frequency of household trips (Calthorpe, 1993; Ewing, Pendall, & Chen, 2002; Freilich, 1998; Kuzmyak & Pratt, 2003;
Moudon, et al., 1997; Nelson, et al., 2001; Renne & Wells, 2004). Employment densities are equally as important as
residential densities, since workers access services during the day. Cervero (1988) found that by integrating services into
office parks, midday travel and overall automobile use could be significantly reduced. In California, for example, BART
ridership increased significantly as population and employment densities within two miles of a station increased (Bernick
& Cervero, 1997). However, according to Pushkarev and Zupan (1977), employment density has more of an effect on
transit ridership than residential density. They estimate that increased employment density is likely to have three times
the effect on ridership than an equal increase in residential density would cause. Since the TOD incorporates a diversity
of land uses, including employment centres, the benefits of high density are numerous.
2.3.2 Diversity
Cervero and Kockelman's (1997) second 'D,' diversity, plays an important role in influencing transit ridership. While resi-
dential and employment uses account for peak-hour transit use, a diversity of other uses can encourage higher transit
use during off-peak hours. Entertainment venues, restaurants, and shops foster greater transit use, especially during
off-peak times which better utilizes transportation infrastructure (Cervero, 2004). The presence of shopping, recreation
and school facilities in 83 of the largest metropolitan areas in the United States, for example, significantly lowered
vehicle hours travelled per capita (Ewing, et al., 2002). Bernick and Cervero (1997) present similar findings in their study
of 11 American cities. Automobile commuting was greatly reduced when retail stores and non-residential uses were
located within 100 metres of one's residence. Local shopping is particularly important in encouraging pedestrian activity,
especially when stores are within 400 metres, or a 10 minute walk, of residential areas (Handy & Clifton, 2001). Typical
suburban neighbourhoods, in contrast, are dominated by chain stores that draw from passing automobile traffic rather
than pedestrian traffic or transit use. However, the existence of local shopping alone is not enough to draw customers
BRINKLOW
7
from the residential and employment population in the area. Consumers are often unsatisfied by local shops and still
travel outside of the community for their daily needs. Therefore, the community must contain a wide array of activities to
support the vibrant characteristics of many traditional-style neighbourhoods.
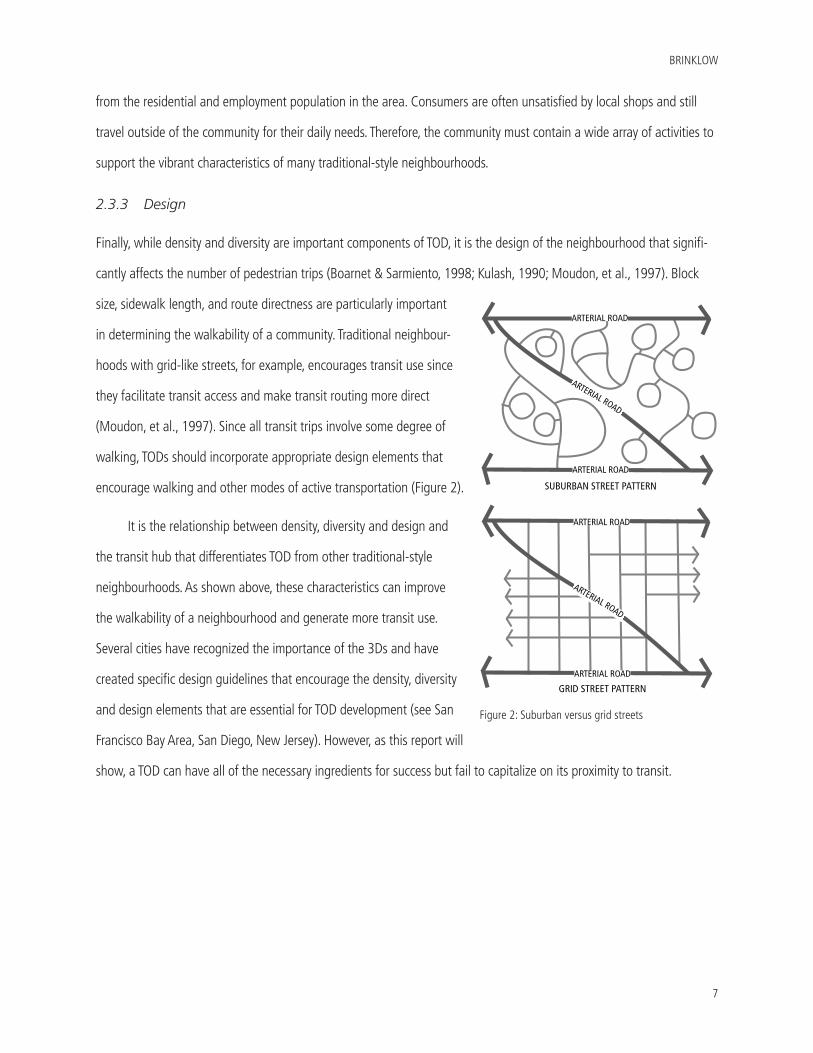
2.3.3 Design
Finally, while density and diversity are important components of TOD, it is the design of the neighbourhood that signifi-
cantly affects the number of pedestrian trips (Boarnet & Sarmiento, 1998; Kulash, 1990; Moudon, et al., 1997). Block
size, sidewalk length, and route directness are particularly important
in determining the walkability of a community. Traditional neighbour-
hoods with grid-like streets, for example, encourages transit use since
they facilitate transit access and make transit routing more direct
(Moudon, et al., 1997). Since all transit trips involve some degree of
walking, TODs should incorporate appropriate design elements that
encourage walking and other modes of active transportation (Figure 2).
It is the relationship between density, diversity and design and
the transit hub that differentiates TOD from other traditional-style
neighbourhoods. As shown above, these characteristics can improve
the walkability of a neighbourhood and generate more transit use.
Several cities have recognized the importance of the 3Ds and have
created specific design guidelines that encourage the density, diversity
and design elements that are essential for TOD development (see San
Francisco Bay Area, San Diego, New Jersey). However, as this report will
show, a TOD can have all of the necessary ingredients for success but fail to capitalize on its proximity to transit.
Figure 2: Suburban versus grid streets
ARTERIAL ROAD
ARTERIAL ROAD
ARTERIAL ROAD
ARTERIAL ROAD
ARTERIAL ROAD
ARTERIAL ROAD
SUBURBAN STREET PATTERN
GRID STREET PATTERN

BRINKLOW
9
03 EVALUATION OF TRANSIT-ORIENTED DEVELOPMENT
3.1 Regional and Local Priorities
TOD is a relatively new concept that is becoming a popular tool to create neighbourhoods with a strong connection to
transit. While there are several benefits of TOD, the success of these developments depends on the city's ability to inte-
grate land use and transportation policies into a coherent neighbourhood plan. Several cities in the United States and
Canada have attempted to integrate these policies and are considered successful examples of TOD. However, the success
of TOD does not come without its challenges. One of the main challenges in achieving a synergy between land use and
transportation lies in the TOD's regional role as a 'node' and its local role as a 'place' (Belzer & Autler, 2002; Renne,
2005). On a regional scale, a TOD serves as a single node in the region; the station is one of several stations along a
rail artery. At the neighbourhood level, the TOD must perform as a place and offer its residents interesting destinations,
comfortable public spaces and a variety of housing options.
The main reason for the disparity between transportation policy and community design lies in the policy frame-
work set by different levels of government. Transportation policy in Canada is set by the provincial government, which
aims to provide transit service to a wide pool of its population and connect satellite cities to the core. Cities throughout
Canada must adhere to the region's land use and transportation plan (e.g. the Growth Plan for the Greater Golden
Horseshoe (Government of Ontario, 2006) or the Metro Vancouver Regional Growth Strategy (Greater Vancouver
Regional District, 2009)) which control and structure growth in the province. At the local level, however, cities have the
power to implement specific design objectives in neighbourhoods, such as appropriate setbacks, preservation of open
space, or pedestrian lighting (Renne & Wells, 2002). These local objectives create public streets and spaces that are
enjoyable and contribute to the overall design of the city.
These regional and local objectives often clash, requiring a careful compromise to accommodate everyone's needs.
Parking lots, for example, are often placed next to the station to encourage people to take transit. However, a surface
parking lot may interfere with the community's desire for attractive streets and a pedestrian-friendly environment
(Cervero, 2004). Without a careful balance between local and regional goals, communities are built as transit-adjacent
neighbourhoods rather than TODs.
TRANSIT-ORIENTED DEVELOPMENT: A POLICY IMPLEMENTATION STRATEGY
10
3.2 Transit-Adjacent Development
TODs that do not reap benefits on both a local and regional scale are referred to as 'transit-adjacent developments.'
These communities may be near transit, but they fail to capitalize on this proximity (Renne, 2005, 2009). Instead, these
near-transit communities have garnered the name 'transit-adjacent development,' or 'TAD' (Cervero, Ferrell, & Murphy,
2002). Some of the most progressive TOD cities, such as San Francisco and Portland, contain TADs.
Hayward Station, located along the BART line serving San Francisco, is one example of TAD. The station is sur-
rounded by parking lots and the design of the community caters to drivers. As a result, more than half of BART riders
drive alone to the station (Renne, 2009). The automobile-oriented design of Hayward lends credibility to Cervero and
Kockelman's (1997) argument that TOD requires more than just locating transit in the geographic centre of a neighbour-
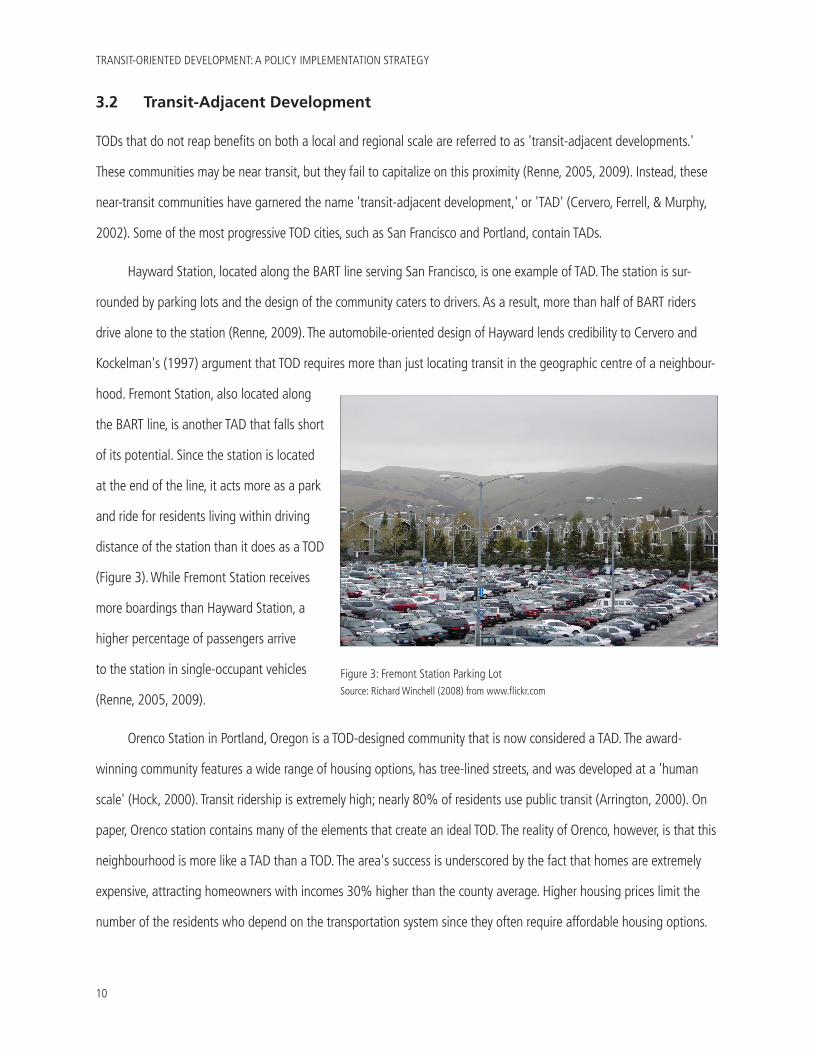
hood. Fremont Station, also located along
the BART line, is another TAD that falls short
of its potential. Since the station is located
at the end of the line, it acts more as a park
and ride for residents living within driving
distance of the station than it does as a TOD
(Figure 3). While Fremont Station receives
more boardings than Hayward Station, a
higher percentage of passengers arrive
to the station in single-occupant vehicles
(Renne, 2005, 2009).
Orenco Station in Portland, Oregon is a TOD-designed community that is now considered a TAD. The award-
winning community features a wide range of housing options, has tree-lined streets, and was developed at a 'human
scale' (Hock, 2000). Transit ridership is extremely high; nearly 80% of residents use public transit (Arrington, 2000). On
paper, Orenco station contains many of the elements that create an ideal TOD. The reality of Orenco, however, is that this
neighbourhood is more like a TAD than a TOD. The area's success is underscored by the fact that homes are extremely
expensive, attracting homeowners with incomes 30% higher than the county average. Higher housing prices limit the
number of the residents who depend on the transportation system since they often require affordable housing options.
Figure 3: Fremont Station Parking LotSource: Richard Winchell (2008) from www.flickr.com
BRINKLOW
11
In addition, the majority of transit users arrive to the station by car, creating a car-dependent environment directly adja-
cent to the station (Cascade Policy Institute, 2003).
Finally, Brickell Station in Miami, Florida, is one of two stations that connects the Metrorail line to the city's
downtown Metromover system. The station experienced considerable construction of residential and office development
over the past several years, enjoying some of the highest residential and commercial rates in Miami. However, despite
growing residential and employment populations, transit ridership remains low. The lack of comfortable sidewalks, safe
crossings, and significant physical barriers for pedestrians create an urban design failure for the area. As a result, the
neighbourhood lacks the important integration of land use and transportation and is considered transit-adjacent (Cer-
vero, 2004).
The above TADs are unsuccessful for a variety of reasons. Some stations lack the specific physical design elements
that are necessary to encourage active modes of transportation and transit use, such as high density, a mix of uses, and
pedestrian-oriented streets, while others remain suburban-style developments which happen to be located around a
transit station. Pedestrian barriers, automobile-dependence and large parking lots deter residents from walking to the
station and within the community. However, as the Orenco Station example shows, TODs can contain all of the neces-
sary physical elements outlined in the literature and still fail to capture high transit ridership. Therefore, it is important to
evaluate TODs based on its post-development performance, including its transportation patterns, economic and social
success, and the area's physical design.
3.3 Criteria to Measure Success
Many TODs in North America are considered 'successful' examples of transit-supportive developments because they
contain the ideal density, diversity and design elements outlined in the literature. However, as the above discussion has
shown, several of these TODs actually fall short of their potential, failing to capitalize on their proximity to high-quality
transit. Rather than emulating TODs based on their physical elements alone, this study aims to look at post-development
TOD performance through the use of case studies. Several performance indicators were selected based on similar evalu-
ations already conducted (Niles & Nelson, 1999; Renne & Wells, 2005). These success indicators were broken down into
four categories: transportation, economic, social, and physical design. In addition, these indicators play varying roles in
regional and local TOD success (Table 1).
TRANSIT-ORIENTED DEVELOPMENT: A POLICY IMPLEMENTATION STRATEGY
12
3.3.1 Transportation Success
The main indicator used in most TOD evaluations is the increase in transit ridership (Cervero, Murphy, Ferrell, Goguts, &
Tsai, 2004; Renne & Wells, 2002, 2005). One caveat to using transit ridership alone is that many residents in transit-
supportive communities chose to live there primarily because of its proximity to transportation (Nelson, et al., 2001).
Several studies (Cervero & Duncan, 2002; Renne, 2005) claim that higher ridership in TODs is largely due to the fact that
many of the residents of the development used transit prior to moving to the TOD. Therefore, the TOD did not convert
non-transit users into users and was not as influential in changing travel behavior as once thought. As stated earlier,
Cervero (2004) found that 40% of the ridership increase in San Francisco Bay Area, or SFBA, TODs was due to self-
selection. Isolating self-selection is difficult since it involves comparing trips made prior to moving and those made in the
TOD. However, the issue of self-selection does not diminish the importance of building vibrant communities linked with
high-functioning public transit. Moreover, high transit use is a regional goal since the transportation system belongs to
a metropolitan network, funded by state or provincial governments. Therefore, despite high ridership in a TOD, residents
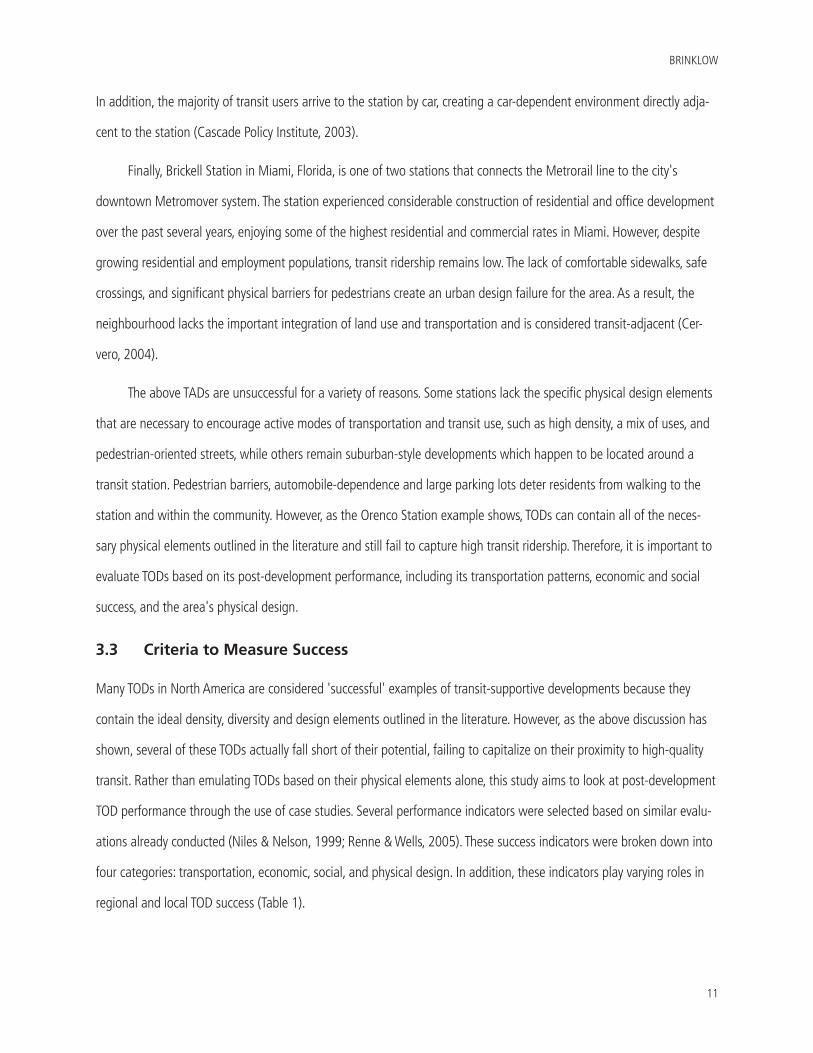
Table 1: TOD Success Indicators
Regional Success
Local SuccessTransportation
Transit Ridership •
VMT • •
Vehicle Ownership • •
Station Area Parking & Access • •
Economic
Success of Residential Space • •
Success of Commercial Space • •
Success of Retail Space • •
Social
Affordable Housing • •
Diversity of Housing Types & Sizes • •
Sense of Community •
Physical Design
Residential/Employment Density • •
Mix of Uses •
Pedestrian Experience •
BRINKLOW
13
may move around the neighbourhood by car, resulting in failure at the local level. VMT and car ownership can therefore
help evaluate the TOD at the local level.
VMT and vehicle ownership provide some insight into the travel behaviour of residents. If, for example, residents
take transit to work but drive everywhere else, the TOD has not replicated the urban village environment that it was
intended to create (Calthorpe, 1993). Measuring the number of VMT is therefore important since it includes all work and
non-work trips. In addition, car ownership provides another indication of how reliant residents are on their cars. If resi-
dents are reluctant to get rid of their cars, there is some evidence that people living in the TOD still feel that they cannot
access everything they need by transit. Therefore, fewer VMT and lower car ownership indicate local and regional suc-
cess, as they are important for the overall health of cities and demonstrate the level of car dependency in a community.
Finally, station area parking and access is both a measure of regional and local transportation success. In terms
of parking, regional success translates to local failure, and vice versa. Regional governments are primarily interested in
a sufficient amount of station area parking because they view the TOD as a node (Belzer & Autler, 2002). The station is
meant to attract as many riders as possible, including those who live outside of the TOD and require car travel to access
the station. To encourage hinterland residents to use transit, the station must provide ample parking. At the local scale,
however, stations surrounded by concrete seas of parking are often seen as TADs (e.g. Hayward Station in San Fran-
cisco, California or Orenco Station in Portland, Oregon). The oversupply of parking has been a major obstacle to create
vibrant, pedestrian-friendly neighbourhoods and goes against the fundamental criteria for a successful TOD. Therefore,
the amount of parking, particularly surface parking, as well as pedestrian and bicycle access to the station area, helps
measure the TOD's success or failure.
3.3.2 Economic Success
The economic success of a TOD can be measured by the demand for residential, retail and commercial development. On
a regional scale, the development of land translates directly into tax revenue for the city (Belzer & Autler, 2002). At the
local scale, a high demand for housing, employment and retail spaces translates into a vibrant community. Since higher
demand is positively related to price, a higher price of these units represents a successful TOD.
Residential prices are often higher in TODs because of the myriad of benefits for residents living near transit sta-
tions. First, living near transit can result in significant personal savings, including reduced VMT, shorter commuting times,
and lower vehicle operating costs. Furthermore, residents benefit from the vibrant character and compact built form of
TRANSIT-ORIENTED DEVELOPMENT: A POLICY IMPLEMENTATION STRATEGY
14
the neighbourhood (Lewis-Workman & Brod, 1997). These advantages translate into demand for the TOD and increase
residential prices to reflect this market. In a study of land sales in Washington County, Oregon, parcels located with a
half mile of planned stations sold for 31% more than elsewhere in the study area and 10% higher within one mile of
the station (Knaap, Ding, & Hopkins, 2001). The average home price in San Francisco's Pleasant-Hill neighbourhood was
almost $23,000 greater (a 9% premium) than houses outside of the TOD (Lewis-Workman & Brod, 1997). Therefore,
higher than average residential prices indicate TOD success.
Commercial properties are purchased based on the investor's expected future returns. In TODs, proximity to transit
increases the consumer base and the labour supply. Therefore, since investors can expect to receive more earnings from
locating closer to transit, they are willing to pay more for a property. In a study conducted by the Federal Transit Ad-
ministration (2000), a 1,000-foot, or three-block, reduction in distance to transit raised commercial property values by
$2.3 per square foot. Given an average commercial property of 30,630 square feet, a 1,000-foot reduction in distance
from the transit hub increased average property values by $70,139, or 2%. Retail units are particularly sensitive to the
location of transit stations. In Englewood, Colorado, retail units in the TOD were twice as expensive as comparable units
outside of the TOD. Average rents ranged between $18 and $20 per square foot compared to only $8 to $14 per square
foot in the rest of the city (Cervero, 2004). However, rental data is not always available so retail sales per capita can be
used to evaluate the success of retail space. If, for example, retail sales per capita are high, this provides some indication
that stores are doing well in the TOD.
3.3.3 Social Success
Affordability of housing, a diversity of housing types, and a sense of community are all ingredients for a successful
neighbourhood (Calthorpe, 1993; Renne & Wells, 2002). While these factors are not specific to TODs, they are necessary
components of creating an enjoyable place where residents feel comfortable and safe.
Affordable housing is particularly important in a TOD because lower-income residents often represent the major-
ity of transit users (Dunphy, Myerson, & Pawlukiewicz, 2003; Tumlin & Millard-Ball, 2003). While high residential prices
are an indicator of TOD success, as previously discussed, these developments must also include some affordable units to
provide housing for those who most require access to transit. The availability of affordable housing is important in a re-
gional and local context. Affordable housing policy is driven by provincial and federal jurisdictions, but the development
of affordable units are important to create inclusive, socio-economically mixed communities. As a result, several public
BRINKLOW
15
policies recognize the importance of providing low-income housing near transit stations. In California, for example, state-
wide policy requires that subsidies can only be spent on affordable housing if it is located near a transit station (Renne,
2005). Several states even provide incentive programs, such as California's Housing Incentive Program, which provides
$500 for affordable units built within 500 metres of a transit station (Cervero, et al., 2004; Renne, 2005). Therefore,
TODs must include affordable units, which are a clear necessity for both regional and local governments.
An array of housing types creates and welcomes the mix of incomes and family structure that makes a neighbour-
hood interesting and diverse. A complete community should include a diverse mix of people, including young profes-
sionals, families with children and the elderly. Currently, TODs tend to appeal to young professionals living alone or with
another young professional (Bernick & Cervero, 1997; Cervero, Bernick, & Gilbert, 1994). However, as driving becomes
more expensive, it is possible that the demand for housing near transit will affect all residents, particularly low-income
families and seniors. As a result, TOD must accommodate this demand and provide a variety of household sizes and
composition, which are both regionally and locally important.
Finally, a sense of community is needed at the local level to ensure that the neighbourhood is a desirable place
to live. According to Dunphy et al. (2003), a TOD should not only encourage transit, but transform the surrounding area
into a "place that is so special and irresistible that people will invest there, live there, and visit again and again" (p. viii).
In particular, the TOD should be a community where residents feel safe and comfortable on its streets (Belzer & Autler,
2002; Bernick & Cervero, 1997; Renne & Wells, 2002, 2005).
3.3.4 Physical Design Success
While much of the literature focuses on transit ridership and travel behavior, the quality of the built environment and the
pedestrian experience is another important success indicator (Renne & Wells, 2005). The success of a TOD's design can
be measured in terms of the 3Ds discussed earlier: Density, Diversity and Design. While these factors are often difficult to
measure, they remain an important indicator of TOD success.
The density of residential and non-residential uses is vital to the success of a TOD. In medium- and high-density
neighbourhoods, people are more likely to walk or use transit (Bernick & Cervero, 1997; Ewing, et al., 2002; Frank &
Pivo, 1994; Kuzmyak & Pratt, 2003; Litman, 2005; Moudon, et al., 1997; Newman & Kenworthy, 1999, 2006). In a
study by Tumlin and Millard-Ball (2003), a 10% increase in population density resulted in a 5% increase in the number
of boardings. In San Francisco, for example, an increase of 10 workers per acre within three kilometres from a transit
TRANSIT-ORIENTED DEVELOPMENT: A POLICY IMPLEMENTATION STRATEGY
16
station increased turnstile counts by 6.5 per 1,000 catchment population (Bernick & Cervero, 1997). Density also greatly
impacts the likelihood that residents will walk. According to Frank and Pivo (1994), population densities must exceed 13
residents per acre for changes in mode choice to be significant. This suggestion is consistent with several other studies
that claim residential densities must be between 10 and 30 dwelling units per acre (Boarnet & Compin, 1999; Calthor-
pe, 1993; Cervero, 2004). Many of the best performing TODs, such as those in Arlington County, Virginia, encourage high
density immediately around the station. Since residential and employment density create a more efficient use of land,
higher densities produce regional benefits, as well as the local benefit of a more walkable neighbourhood.
The variety and vitality of a neighbourhood is attributable to the mix, or diversity, of land uses. According to Jane
Jacobs (1989), a healthy city is "an intricate and close-grained diversity of uses that give each other constant mutual
support, both economically and socially" (p. 14). A mixed-use neighbourhood should therefore include residential and
employment destinations that are mixed both vertically and horizontally. The mix of uses is designed to encourage active
modes of transportation by placing several origins and destinations within walking distance of each other. Unlike many
suburban-style neighbourhoods, where trains and buses are full only during peak hours, transit use is more balanced in
a TOD. Transit along the Rosslyn-Ballston corridor, for example, is used at off-peak hours because there are a diversity
of uses that generate activity throughout the day (Cervero, 2004). As a result, Arlington County is arguably home to the
most successful TODs in the country.
For a TOD to work, the design of the street must create a pleasant walking environment. Streets that are barren
and uninviting will discourage residents from walking, regardless of how dense they are (Moudon, et al., 1997). There-
fore, the pedestrian experience is a key component in determining the success of a TOD. Parking, for example, should
be located behind the building, allowing the site to prioritize pedestrian traffic instead of automobile traffic (Calthorpe,
1993). Failure to provide pleasant, safe connections between origins and destinations can deter residents from walking
to the station and encourage them to drive instead. At Hayward station in San Francisco, for example, the majority of
passengers drive to the station because the area lacks adequate pedestrian and cycling access (Renne, 2009). Instead,
large surface parking lots dominate the front of the station, reaching a regional goal of creating ample parking for riders.
These transportation, economic, social, and physical design indicators provide some insight into the success of the
TOD, after the development is complete. While this list is not exhaustive, it covers many of the most common success
indicators used in other similar studies (Dunphy, et al., 2003; Niles & Nelson, 1999; Renne & Wells, 2005).
BRINKLOW
17
04 RESEARCH DESIGN
The purpose of this report is to gain knowledge about the key policies that were successful in TODs throughout North
America. However, as Niles and Nelson (1999) and Renne and Wells (2005) have found, little has been done to evalu-
ate the success of TODs in the United States and Canada. Therefore, the evaluation of TODs has been largely based on
pre-development physical elements. Before borrowing TOD policies from other municipalities, it is important to evaluate
TODs based on their post-development performance. In order to achieve this goal, this study was divided into two steps:
an assessment of many of the 'successful' TODs from the literature based on a set of criteria, and expert interviews of
these TODs to understand which post-development policies were successful.
4.1 Part 1: Case Studies
Case studies involve the detailed and intensive analysis of a single case, often determined by its location. Currently, the
number of TODs in North America is abundant, and an analysis of all developments would require more time than was
allotted for this research project. Therefore, an analysis was done on a select few, based on TODs deemed 'successful' in
the literature.
The existing literature measures TOD success based on the number of design elements that are present in the
community, such as high density and a mix of uses. However, as discussed above, a TOD can contain most or all of these
elements but fail to capitalize on its proximity to transit (e.g. Orenco Station). Therefore, this study looks specifically at
post-development TODs, and which policies were effective in encouraging the integration of land use and transportation.
Before this analysis could be done, it was important to determine which TODs were actually successful, determined by a
list of unbiased indicators.
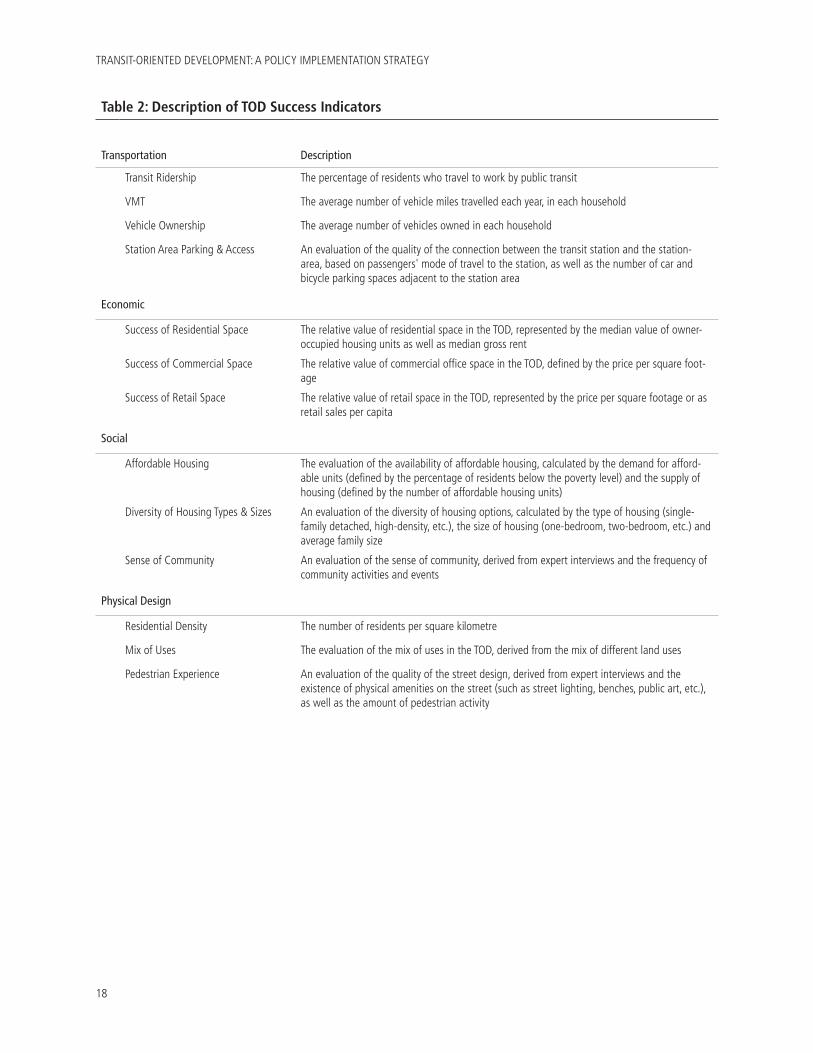
4.1.1 Selection of Indicators
The first part of the study focused on selecting appropriate criteria for evaluating TODs. These quantitative and qualita-
tive indicators were based on the limited literature that looked specifically at how to measure post-development TOD
success (Renne and Wells (2005), Bae (2002), and Niles and Nelson (1999)). The most commonly used indicators from
this literature were selected and classified into four categories: transportation, economic, social and physical design
(Table 2).
TRANSIT-ORIENTED DEVELOPMENT: A POLICY IMPLEMENTATION STRATEGY
18
Table 2: Description of TOD Success Indicators
Transportation Description
Transit Ridership The percentage of residents who travel to work by public transit
VMT The average number of vehicle miles travelled each year, in each household
Vehicle Ownership The average number of vehicles owned in each household
Station Area Parking & Access An evaluation of the quality of the connection between the transit station and the station-area, based on passengers' mode of travel to the station, as well as the number of car and bicycle parking spaces adjacent to the station area
Economic
Success of Residential Space The relative value of residential space in the TOD, represented by the median value of owner-occupied housing units as well as median gross rent
Success of Commercial Space The relative value of commercial office space in the TOD, defined by the price per square foot-age
Success of Retail Space The relative value of retail space in the TOD, represented by the price per square footage or as retail sales per capita
Social
Affordable Housing The evaluation of the availability of affordable housing, calculated by the demand for afford-able units (defined by the percentage of residents below the poverty level) and the supply of housing (defined by the number of affordable housing units)
Diversity of Housing Types & Sizes An evaluation of the diversity of housing options, calculated by the type of housing (single-family detached, high-density, etc.), the size of housing (one-bedroom, two-bedroom, etc.) and average family size
Sense of Community An evaluation of the sense of community, derived from expert interviews and the frequency of community activities and events
Physical Design
Residential Density The number of residents per square kilometre
Mix of Uses The evaluation of the mix of uses in the TOD, derived from the mix of different land uses
Pedestrian Experience An evaluation of the quality of the street design, derived from expert interviews and the existence of physical amenities on the street (such as street lighting, benches, public art, etc.), as well as the amount of pedestrian activity
BRINKLOW
19
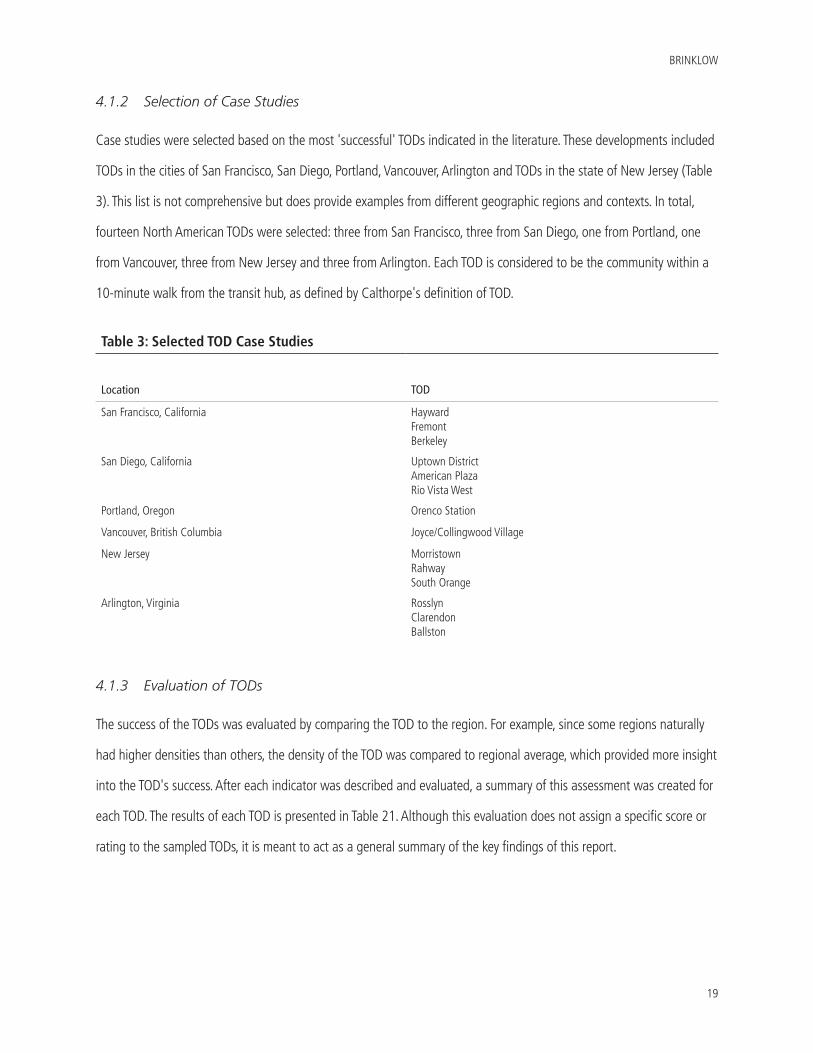
4.1.2 Selection of Case Studies
Case studies were selected based on the most 'successful' TODs indicated in the literature. These developments included
TODs in the cities of San Francisco, San Diego, Portland, Vancouver, Arlington and TODs in the state of New Jersey (Table
3). This list is not comprehensive but does provide examples from different geographic regions and contexts. In total,
fourteen North American TODs were selected: three from San Francisco, three from San Diego, one from Portland, one
from Vancouver, three from New Jersey and three from Arlington. Each TOD is considered to be the community within a
10-minute walk from the transit hub, as defined by Calthorpe's definition of TOD.
4.1.3 Evaluation of TODs
The success of the TODs was evaluated by comparing the TOD to the region. For example, since some regions naturally
had higher densities than others, the density of the TOD was compared to regional average, which provided more insight
into the TOD's success. After each indicator was described and evaluated, a summary of this assessment was created for
each TOD. The results of each TOD is presented in Table 21. Although this evaluation does not assign a specific score or
rating to the sampled TODs, it is meant to act as a general summary of the key findings of this report.
Table 3: Selected TOD Case Studies
Location TOD
San Francisco, California HaywardFremontBerkeley
San Diego, California Uptown DistrictAmerican PlazaRio Vista West
Portland, Oregon Orenco Station
Vancouver, British Columbia Joyce/Collingwood Village
New Jersey MorristownRahwaySouth Orange
Arlington, Virginia RosslynClarendonBallston
TRANSIT-ORIENTED DEVELOPMENT: A POLICY IMPLEMENTATION STRATEGY
20
4.1.4 Data Sources
The data used in this report was retrieved from several sources. First, much of the indicator data was taken from the
United States Census' State and County QuickFacts website. While the most recent census data were collected in 2000,
the American Community Survey provides census data estimates on a 3-year basis. These estimates provide average
characteristics of population and housing between 2006 and 2008 for geographic areas with populations of 20,000 or
more. For many of the TODs evaluated in this report, populations exceeded this threshold. For those with populations
smaller than 20,000 (Morristown, South Orange), Census data from 2000 was used. In this case, data from these TODs
were compared to regional data in the same year. For the Canadian case study, information was retrieved from the
Canadian 2006 Census, provided on the City of Vancouver website.
The majority of station-area information on TODs in California was obtained from the California Transit-Oriented
Development Searchable Database, funded by the California Department of Transportation. This database was used to
collect information on several indicators, including station area population, median household income, affordable hous-
ing, station area car and bike parking statistics, land use, mode of travel to work, average annual household VMT, vehicle
ownership per household, and the mode of travel to the transit station.
City websites and reports provided information on a key number of indicators, including employment density, the
price of commercial and retail space, affordable housing, land use, station area car and bike parking and mode of travel
to the transit station. Any other information that was not retrieved online was asked during the expert interviews.
4.2 Part 2: Expert Interviews
Expert telephone interviews were conducted concurrently with the evaluation of the sampled TODs. Interview questions
were drafted as a guide, but interviewees were encouraged to speak openly about their experience with TOD policy in
their region. The prepared questions included information about the origin of TOD, which policies were most effective
and which were not, and what lessons can be learned from their experience. In addition, where data was not available,
interviewees were asked to provide information about the TOD for the purpose of completing Table 21. Interview times
ranged from 30 to 60 minutes and an Ethics Review was granted prior to the start of the interviews (Appendix 1).
BRINKLOW
21
05 ANALYSIS OF SELECTED TRANSIT-ORIENTED DEVELOPMENTS
The data presented in this section provides insight into how well each TOD is functioning as a complete, transit-friendly
community. Given similar planning context and transportation network, the results have been organized geographically,
followed by a final analysis of the region's TODs.
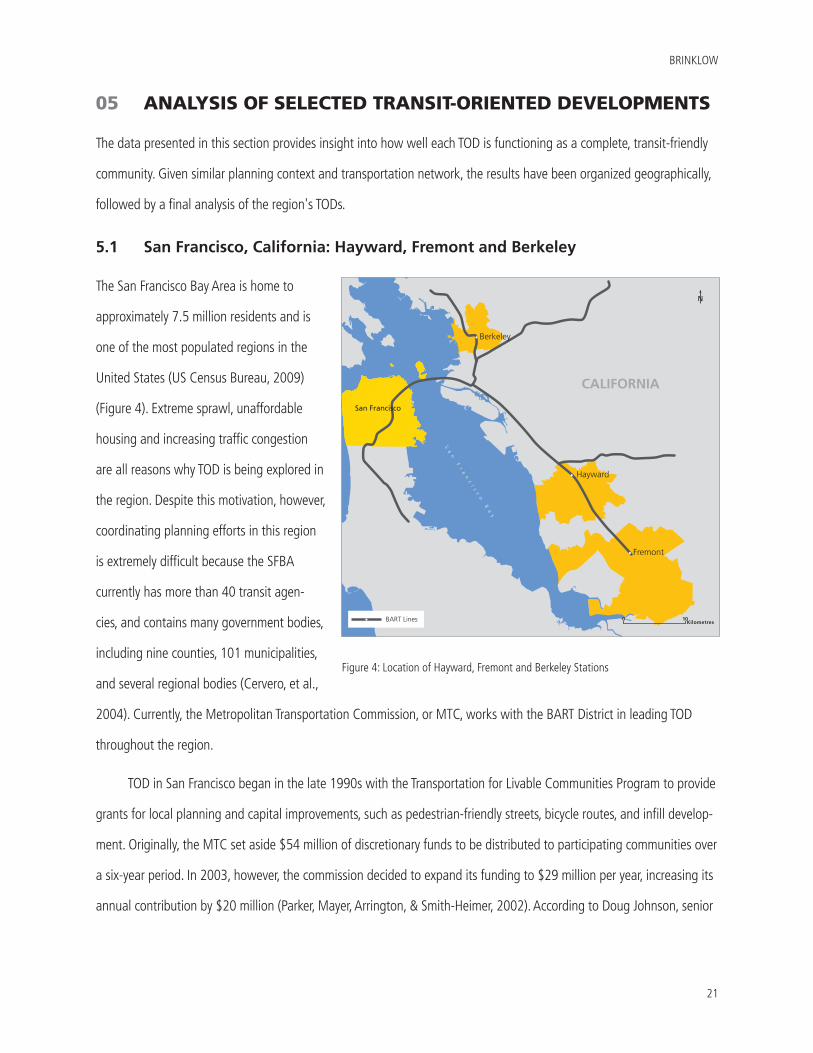
5.1 San Francisco, California: Hayward, Fremont and Berkeley
The San Francisco Bay Area is home to
approximately 7.5 million residents and is
one of the most populated regions in the
United States (US Census Bureau, 2009)
(Figure 4). Extreme sprawl, unaffordable
housing and increasing traffic congestion
are all reasons why TOD is being explored in
the region. Despite this motivation, however,
coordinating planning efforts in this region
is extremely difficult because the SFBA
currently has more than 40 transit agen-
cies, and contains many government bodies,
including nine counties, 101 municipalities,
and several regional bodies (Cervero, et al.,
2004). Currently, the Metropolitan Transportation Commission, or MTC, works with the BART District in leading TOD
throughout the region.
TOD in San Francisco began in the late 1990s with the Transportation for Livable Communities Program to provide
grants for local planning and capital improvements, such as pedestrian-friendly streets, bicycle routes, and infill develop-
ment. Originally, the MTC set aside $54 million of discretionary funds to be distributed to participating communities over
a six-year period. In 2003, however, the commission decided to expand its funding to $29 million per year, increasing its
annual contribution by $20 million (Parker, Mayer, Arrington, & Smith-Heimer, 2002). According to Doug Johnson, senior
N
0Kilometres
10
CALIFORNIAS
an
F
ra
nc
is
co
B
ay
Berkeley
Hayward
Fremont
San Francisco
BART Lines
Figure 4: Location of Hayward, Fremont and Berkeley Stations
TRANSIT-ORIENTED DEVELOPMENT: A POLICY IMPLEMENTATION STRATEGY
22
planner with MTC, more than $200 million has been spent on SFBA municipalities since the program was implemented
(personal communication, 16 July 2010).
In 2005, the MTC adopted another policy entitled the Housing Incentive Program. The program led to $15 billion
in funds for developments near transit over a 25-year period. The policy focuses solely on the development of housing
near a transit station, and requires cities along a transit corridor expansion to create a land use plan that sets minimum
zoning standards. According to Doug Johnson (16 July 2010), housing remains a focus of this policy strategy because
municipalities are often eager to plan for employment uses, which are better for the city's financial health, but not
necessarily for residents. The policy requires cities to develop a specific density and type of housing, but these require-
ments span the entire corridor. Therefore, as long as the average density of all station areas meets these requirements,
the area satisfies the policy requirements. This means, however, that some station areas may remain significantly below
the minimum requirements, while others reach higher standards. The benefit of such a policy is that where infill and high
density development is not possible, this requirement can be passed on to other station areas.
This report looks at three Californian TODs that have been viewed in the literature as successful: Hayward, Fre-
mont and Berkeley Stations (Figure 4). The stations opened for service in 1973, but developed in unique ways. Hayward
Station is a downtown-like neighbourhood, but contains many surface parking lots with few businesses. Fremont Sta-
tion, located at the end of the line, developed primarily into a commuter hub, where residents living beyond the neigh-
bourhood drive to the station and take BART to San Francisco. Finally, Berkeley is located close to the region's core and
is only a 23 minute transit ride to Montgomery Street BART station in downtown San Francisco (Renne, 2009).
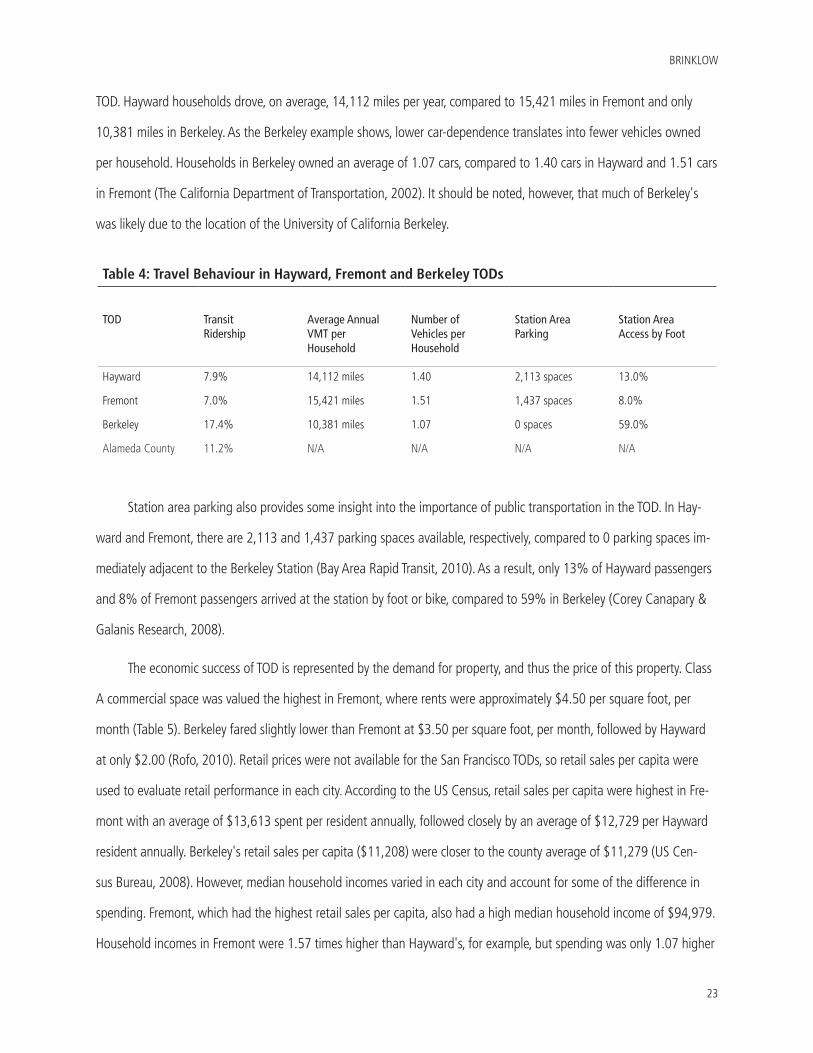
As mentioned in the literature, one of the main indicators of TOD success is transit ridership. For Hayward, Fremont
and Berkeley, travel characteristics were compared to the county average to gain some understanding of travel behav-
iour in each city. Berkeley had the highest level of transit ridership, with 17.4% of residents taking public transportation
to work (Table 4). Interestingly, Hayward and Fremont TODs had significantly less transit ridership, with only 7.9% and
7%, respectively. These values were even lower than the county average, in which 11.2% of all residents took public
transit to work. Residents in Hayward and Fremont also drove more, with 69.1% and 75.2% of residents driving to work
alone. In Berkeley, however, only 41.8% of residents drove to work and an impressive 16.6% walked, compared to only
0.9% in Hayward and 1.0% in Fremont (US Census Bureau, 2008). These statistics provide great insight into the travel
characteristics of each of the TODs, as Hayward and Fremont residents were more likely to drive and much less likely to
walk or take transit. This fact is proven by the average annual vehicle miles travelled per year by each household in the
BRINKLOW
23
TOD. Hayward households drove, on average, 14,112 miles per year, compared to 15,421 miles in Fremont and only
10,381 miles in Berkeley. As the Berkeley example shows, lower car-dependence translates into fewer vehicles owned
per household. Households in Berkeley owned an average of 1.07 cars, compared to 1.40 cars in Hayward and 1.51 cars
in Fremont (The California Department of Transportation, 2002). It should be noted, however, that much of Berkeley's
was likely due to the location of the University of California Berkeley.
Station area parking also provides some insight into the importance of public transportation in the TOD. In Hay-
ward and Fremont, there are 2,113 and 1,437 parking spaces available, respectively, compared to 0 parking spaces im-
mediately adjacent to the Berkeley Station (Bay Area Rapid Transit, 2010). As a result, only 13% of Hayward passengers
and 8% of Fremont passengers arrived at the station by foot or bike, compared to 59% in Berkeley (Corey Canapary &
Galanis Research, 2008).
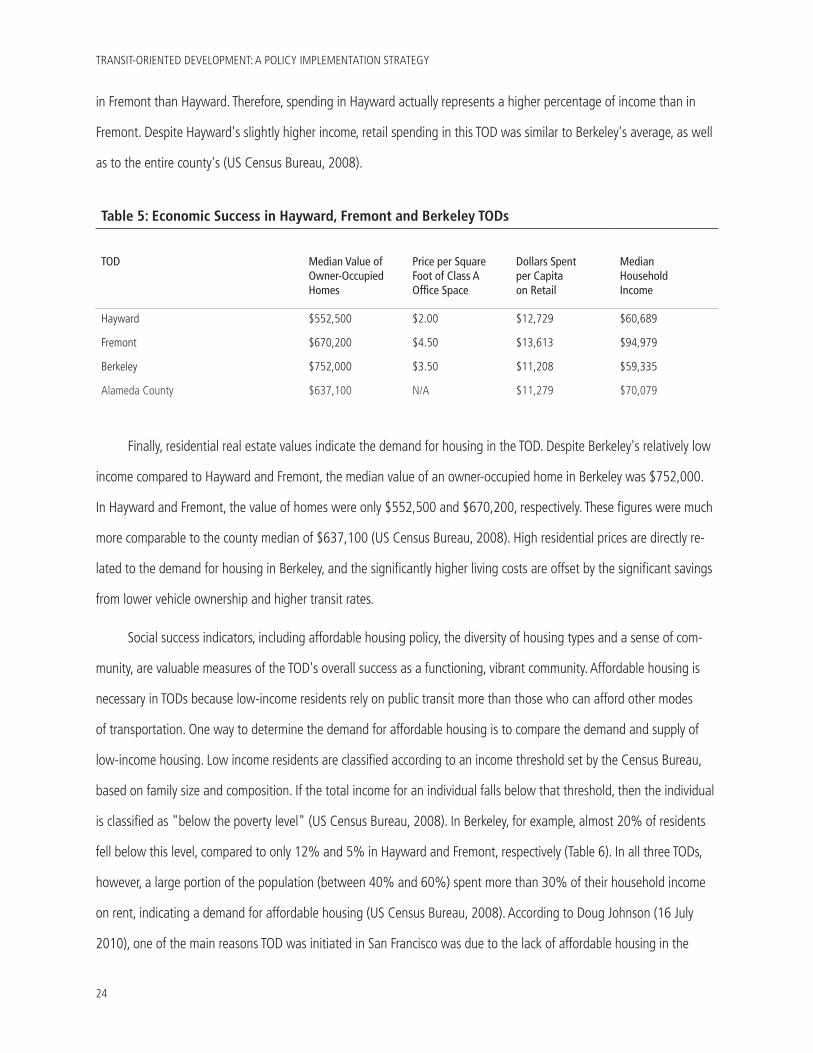
The economic success of TOD is represented by the demand for property, and thus the price of this property. Class
A commercial space was valued the highest in Fremont, where rents were approximately $4.50 per square foot, per
month (Table 5). Berkeley fared slightly lower than Fremont at $3.50 per square foot, per month, followed by Hayward
at only $2.00 (Rofo, 2010). Retail prices were not available for the San Francisco TODs, so retail sales per capita were
used to evaluate retail performance in each city. According to the US Census, retail sales per capita were highest in Fre-
mont with an average of $13,613 spent per resident annually, followed closely by an average of $12,729 per Hayward
resident annually. Berkeley's retail sales per capita ($11,208) were closer to the county average of $11,279 (US Cen-
sus Bureau, 2008). However, median household incomes varied in each city and account for some of the difference in
spending. Fremont, which had the highest retail sales per capita, also had a high median household income of $94,979.
Household incomes in Fremont were 1.57 times higher than Hayward's, for example, but spending was only 1.07 higher
Table 4: Travel Behaviour in Hayward, Fremont and Berkeley TODs
TOD Transit Ridership
Average Annual VMT per Household
Number of Vehicles per Household
Station Area Parking
Station Area Access by Foot
Hayward 7.9% 14,112 miles 1.40 2,113 spaces 13.0%
Fremont 7.0% 15,421 miles 1.51 1,437 spaces 8.0%
Berkeley 17.4% 10,381 miles 1.07 0 spaces 59.0%
Alameda County 11.2% N/A N/A N/A N/A
TRANSIT-ORIENTED DEVELOPMENT: A POLICY IMPLEMENTATION STRATEGY
24
in Fremont than Hayward. Therefore, spending in Hayward actually represents a higher percentage of income than in
Fremont. Despite Hayward's slightly higher income, retail spending in this TOD was similar to Berkeley's average, as well
as to the entire county's (US Census Bureau, 2008).
Finally, residential real estate values indicate the demand for housing in the TOD. Despite Berkeley's relatively low
income compared to Hayward and Fremont, the median value of an owner-occupied home in Berkeley was $752,000.
In Hayward and Fremont, the value of homes were only $552,500 and $670,200, respectively. These figures were much
more comparable to the county median of $637,100 (US Census Bureau, 2008). High residential prices are directly re-
lated to the demand for housing in Berkeley, and the significantly higher living costs are offset by the significant savings
from lower vehicle ownership and higher transit rates.
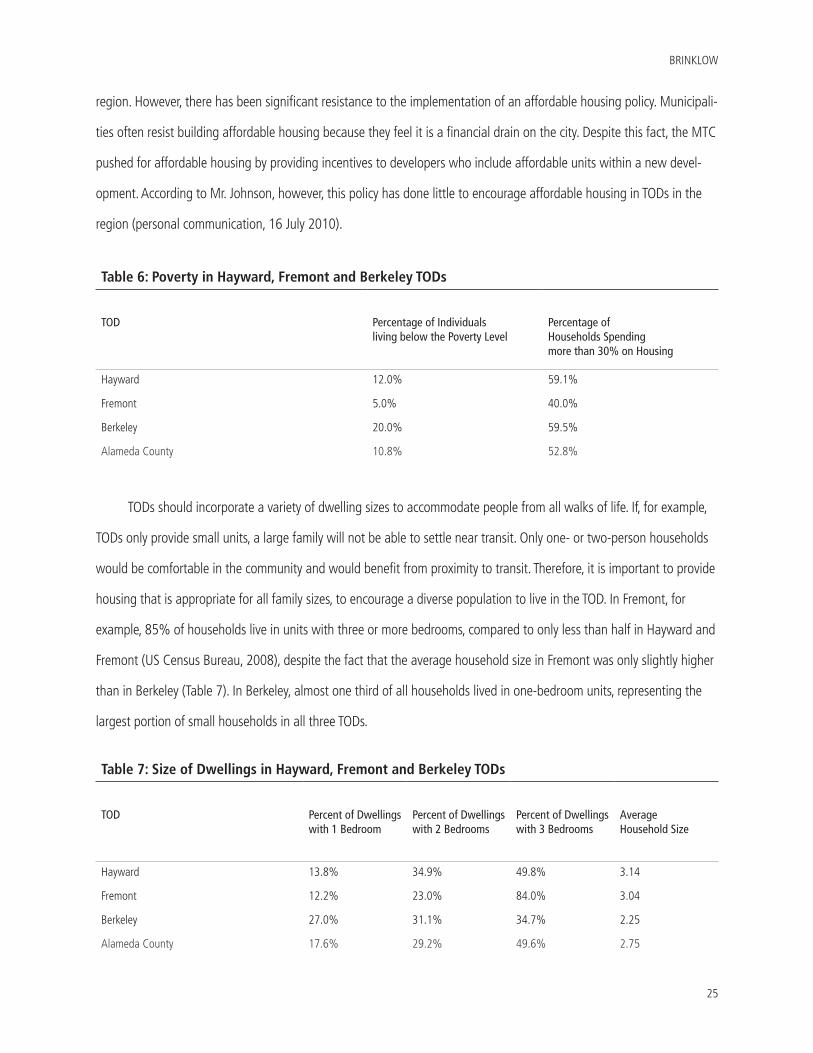
Social success indicators, including affordable housing policy, the diversity of housing types and a sense of com-
munity, are valuable measures of the TOD's overall success as a functioning, vibrant community. Affordable housing is
necessary in TODs because low-income residents rely on public transit more than those who can afford other modes
of transportation. One way to determine the demand for affordable housing is to compare the demand and supply of
low-income housing. Low income residents are classified according to an income threshold set by the Census Bureau,
based on family size and composition. If the total income for an individual falls below that threshold, then the individual
is classified as "below the poverty level" (US Census Bureau, 2008). In Berkeley, for example, almost 20% of residents
fell below this level, compared to only 12% and 5% in Hayward and Fremont, respectively (Table 6). In all three TODs,
however, a large portion of the population (between 40% and 60%) spent more than 30% of their household income
on rent, indicating a demand for affordable housing (US Census Bureau, 2008). According to Doug Johnson (16 July
2010), one of the main reasons TOD was initiated in San Francisco was due to the lack of affordable housing in the
Table 5: Economic Success in Hayward, Fremont and Berkeley TODs
TOD Median Value of Owner-Occupied Homes
Price per Square Foot of Class A Office Space
Dollars Spent per Capita on Retail
Median Household Income
Hayward $552,500 $2.00 $12,729 $60,689
Fremont $670,200 $4.50 $13,613 $94,979
Berkeley $752,000 $3.50 $11,208 $59,335
Alameda County $637,100 N/A $11,279 $70,079
BRINKLOW
25
region. However, there has been significant resistance to the implementation of an affordable housing policy. Municipali-
ties often resist building affordable housing because they feel it is a financial drain on the city. Despite this fact, the MTC
pushed for affordable housing by providing incentives to developers who include affordable units within a new devel-
opment. According to Mr. Johnson, however, this policy has done little to encourage affordable housing in TODs in the
region (personal communication, 16 July 2010).
TODs should incorporate a variety of dwelling sizes to accommodate people from all walks of life. If, for example,
TODs only provide small units, a large family will not be able to settle near transit. Only one- or two-person households
would be comfortable in the community and would benefit from proximity to transit. Therefore, it is important to provide
housing that is appropriate for all family sizes, to encourage a diverse population to live in the TOD. In Fremont, for
example, 85% of households live in units with three or more bedrooms, compared to only less than half in Hayward and
Fremont (US Census Bureau, 2008), despite the fact that the average household size in Fremont was only slightly higher
than in Berkeley (Table 7). In Berkeley, almost one third of all households lived in one-bedroom units, representing the
largest portion of small households in all three TODs.
Table 6: Poverty in Hayward, Fremont and Berkeley TODs
TOD Percentage of Individuals living below the Poverty Level
Percentage of Households Spending more than 30% on Housing
Hayward 12.0% 59.1%
Fremont 5.0% 40.0%
Berkeley 20.0% 59.5%
Alameda County 10.8% 52.8%
Table 7: Size of Dwellings in Hayward, Fremont and Berkeley TODs
TOD Percent of Dwellings with 1 Bedroom
Percent of Dwellings with 2 Bedrooms
Percent of Dwellings with 3 Bedrooms
Average Household Size
Hayward 13.8% 34.9% 49.8% 3.14
Fremont 12.2% 23.0% 84.0% 3.04
Berkeley 27.0% 31.1% 34.7% 2.25
Alameda County 17.6% 29.2% 49.6% 2.75
TRANSIT-ORIENTED DEVELOPMENT: A POLICY IMPLEMENTATION STRATEGY
26
A sense of community is the final social indicator of TOD success. However, little to no information was available
on the feeling of community or identity in the San Francisco TODs. In addition, the interviewee was unable to comment
on the sense of community in the Hayward, Fremont or Berkeley TODs.
Finally, the physical design of TODs is extremely important for creating interesting places where residents can walk,
bike or spend time on the street. There are several indicators that help measure the quality of the built environment,
including employment and residential density, mixed-use and the quality of the pedestrian experience. Density and hous-
ing types are two indicators that show how the TOD feels as a complete community. Both density and housing types
are closely related, as low-density neighbourhoods often contain single-family homes and high-density areas generally
contain large apartment complexes. While not all high-rise developments are within high density neighbourhoods, there
is a relationship between dwelling type and density. Therefore, these elements will be discussed in tandem. Berkeley was
the only city to have a significantly higher population density than the county average (Table 8). At more than 10,000
persons per square mile, Berkeley had a density more than three times that of Hayward and Fremont, and five times
higher than the county (US Census Bureau, 2008). Not surprisingly, the majority of homes in these lower-density cities
were single-family houses.
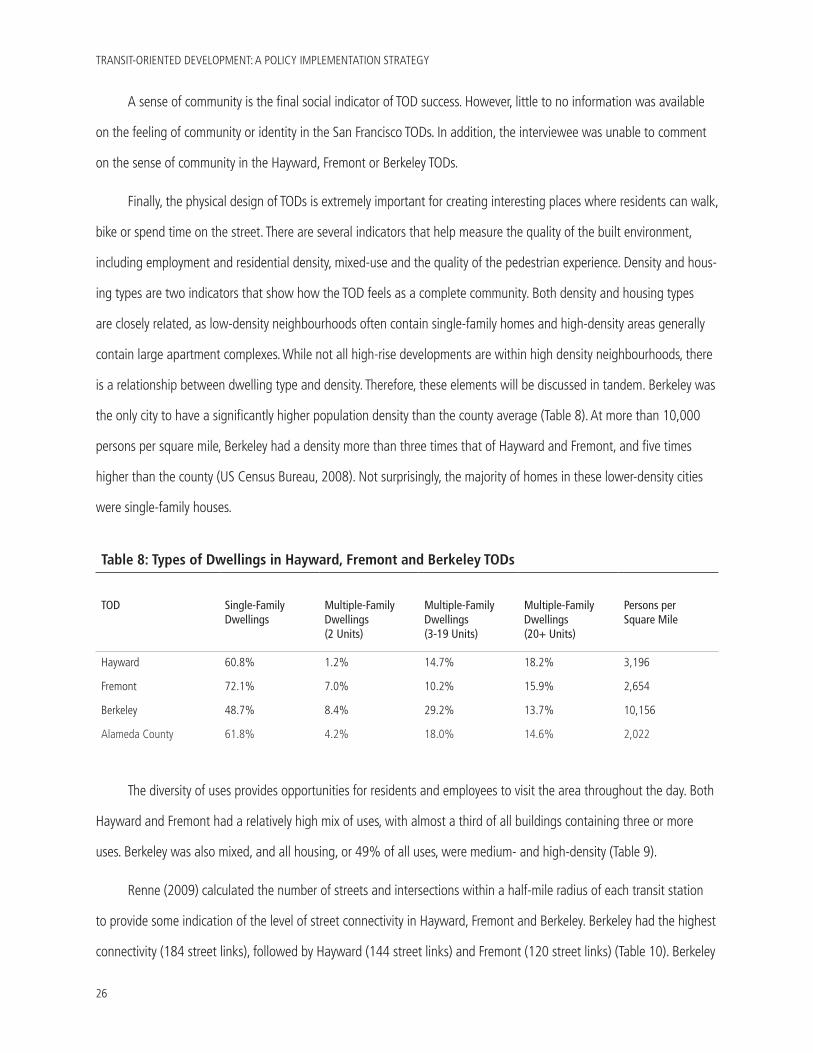
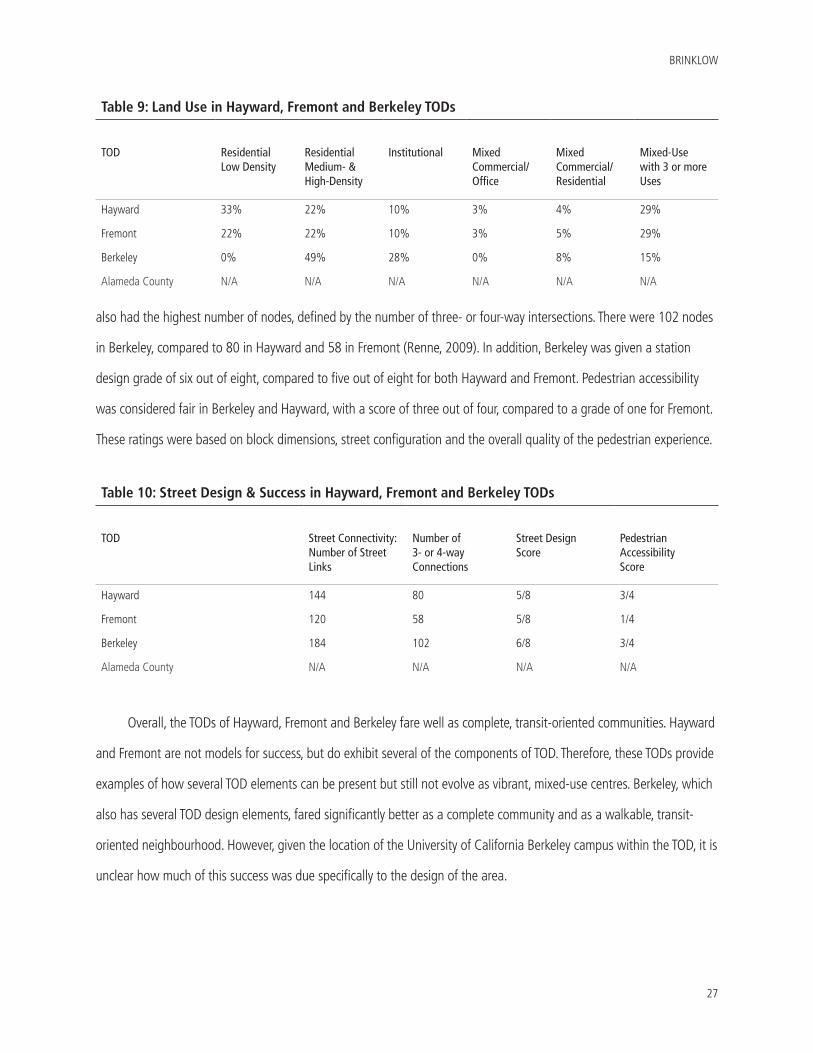
The diversity of uses provides opportunities for residents and employees to visit the area throughout the day. Both
Hayward and Fremont had a relatively high mix of uses, with almost a third of all buildings containing three or more
uses. Berkeley was also mixed, and all housing, or 49% of all uses, were medium- and high-density (Table 9).
Renne (2009) calculated the number of streets and intersections within a half-mile radius of each transit station
to provide some indication of the level of street connectivity in Hayward, Fremont and Berkeley. Berkeley had the highest
connectivity (184 street links), followed by Hayward (144 street links) and Fremont (120 street links) (Table 10). Berkeley
Table 8: Types of Dwellings in Hayward, Fremont and Berkeley TODs
TOD Single-Family Dwellings
Multiple-FamilyDwellings(2 Units)
Multiple-Family Dwellings (3-19 Units)
Multiple-FamilyDwellings (20+ Units)
Persons per Square Mile
Hayward 60.8% 1.2% 14.7% 18.2% 3,196
Fremont 72.1% 7.0% 10.2% 15.9% 2,654
Berkeley 48.7% 8.4% 29.2% 13.7% 10,156
Alameda County 61.8% 4.2% 18.0% 14.6% 2,022
BRINKLOW
27
also had the highest number of nodes, defined by the number of three- or four-way intersections. There were 102 nodes
in Berkeley, compared to 80 in Hayward and 58 in Fremont (Renne, 2009). In addition, Berkeley was given a station
design grade of six out of eight, compared to five out of eight for both Hayward and Fremont. Pedestrian accessibility
was considered fair in Berkeley and Hayward, with a score of three out of four, compared to a grade of one for Fremont.
These ratings were based on block dimensions, street configuration and the overall quality of the pedestrian experience.
Overall, the TODs of Hayward, Fremont and Berkeley fare well as complete, transit-oriented communities. Hayward
and Fremont are not models for success, but do exhibit several of the components of TOD. Therefore, these TODs provide
examples of how several TOD elements can be present but still not evolve as vibrant, mixed-use centres. Berkeley, which
also has several TOD design elements, fared significantly better as a complete community and as a walkable, transit-
oriented neighbourhood. However, given the location of the University of California Berkeley campus within the TOD, it is
unclear how much of this success was due specifically to the design of the area.
Table 9: Land Use in Hayward, Fremont and Berkeley TODs
TOD Residential Low Density
Residential Medium- & High-Density
Institutional Mixed Commercial/Office
Mixed Commercial/Residential
Mixed-Use with 3 or more Uses
Hayward 33% 22% 10% 3% 4% 29%
Fremont 22% 22% 10% 3% 5% 29%
Berkeley 0% 49% 28% 0% 8% 15%
Alameda County N/A N/A N/A N/A N/A N/A
Table 10: Street Design & Success in Hayward, Fremont and Berkeley TODs
TOD Street Connectivity: Number of Street Links
Number of 3- or 4-wayConnections
Street Design Score
Pedestrian Accessibility Score
Hayward 144 80 5/8 3/4
Fremont 120 58 5/8 1/4
Berkeley 184 102 6/8 3/4
Alameda County N/A N/A N/A N/A
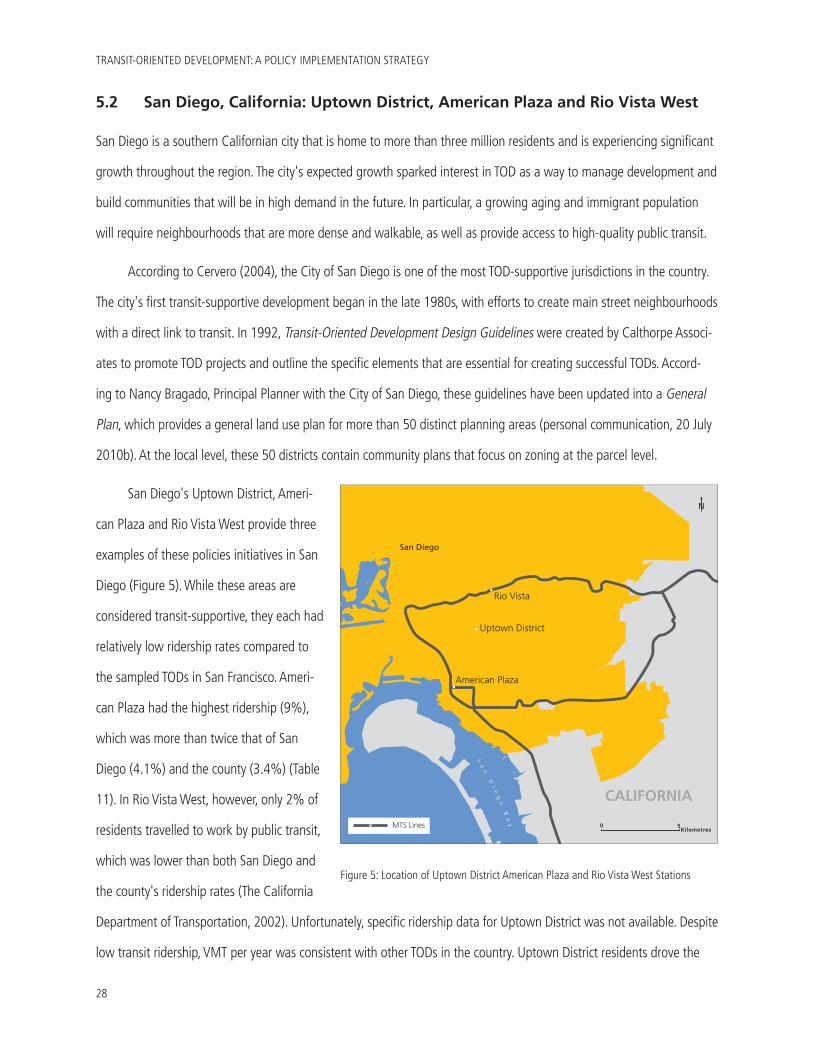
TRANSIT-ORIENTED DEVELOPMENT: A POLICY IMPLEMENTATION STRATEGY
28
5.2 San Diego, California: Uptown District, American Plaza and Rio Vista West
San Diego is a southern Californian city that is home to more than three million residents and is experiencing significant
growth throughout the region. The city's expected growth sparked interest in TOD as a way to manage development and
build communities that will be in high demand in the future. In particular, a growing aging and immigrant population
will require neighbourhoods that are more dense and walkable, as well as provide access to high-quality public transit.
According to Cervero (2004), the City of San Diego is one of the most TOD-supportive jurisdictions in the country.
The city's first transit-supportive development began in the late 1980s, with efforts to create main street neighbourhoods
with a direct link to transit. In 1992, Transit-Oriented Development Design Guidelines were created by Calthorpe Associ-
ates to promote TOD projects and outline the specific elements that are essential for creating successful TODs. Accord-
ing to Nancy Bragado, Principal Planner with the City of San Diego, these guidelines have been updated into a General
Plan, which provides a general land use plan for more than 50 distinct planning areas (personal communication, 20 July
2010b). At the local level, these 50 districts contain community plans that focus on zoning at the parcel level.
San Diego's Uptown District, Ameri-
can Plaza and Rio Vista West provide three
examples of these policies initiatives in San
Diego (Figure 5). While these areas are
considered transit-supportive, they each had
relatively low ridership rates compared to
the sampled TODs in San Francisco. Ameri-
can Plaza had the highest ridership (9%),
which was more than twice that of San
Diego (4.1%) and the county (3.4%) (Table
11). In Rio Vista West, however, only 2% of
residents travelled to work by public transit,
which was lower than both San Diego and
the county's ridership rates (The California
Department of Transportation, 2002). Unfortunately, specific ridership data for Uptown District was not available. Despite
low transit ridership, VMT per year was consistent with other TODs in the country. Uptown District residents drove the
Uptown District
American Plaza
Rio Vista
San Diego
CALIFORNIA
N
MTS Line
Sa
n
Di
eg
o
Ba
y 0Kilometres
5MTS Lines
Figure 5: Location of Uptown District American Plaza and Rio Vista West Stations
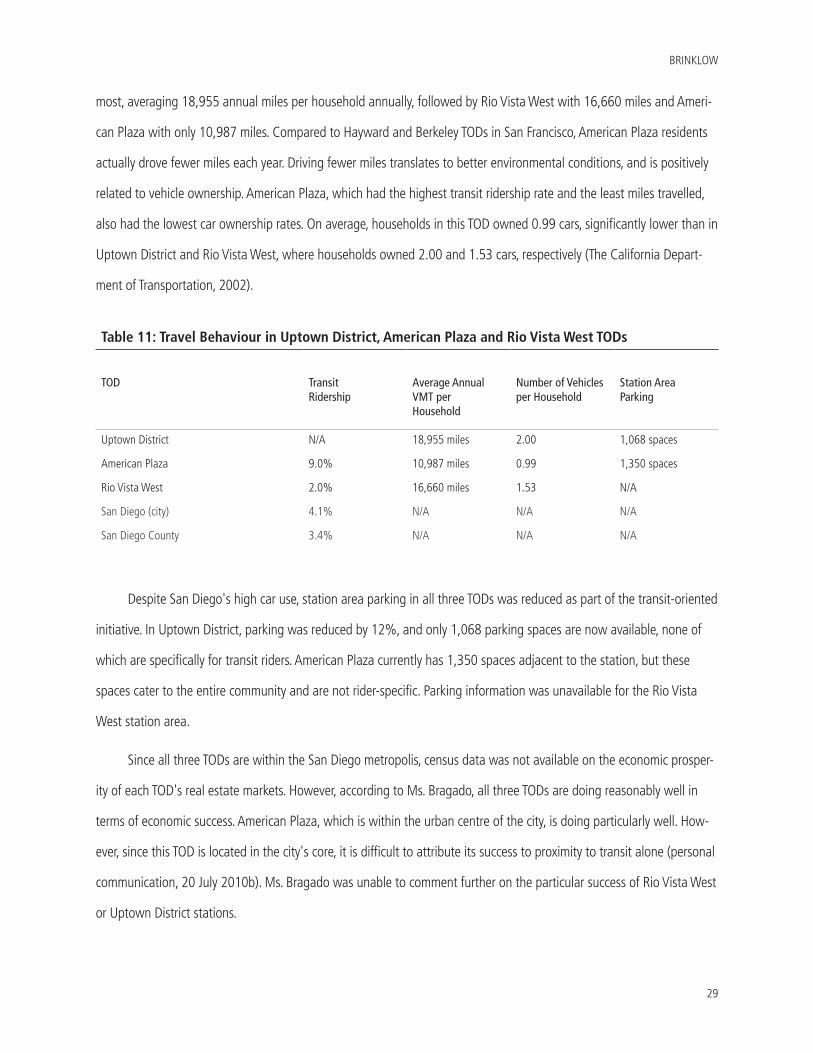
BRINKLOW
29
most, averaging 18,955 annual miles per household annually, followed by Rio Vista West with 16,660 miles and Ameri-
can Plaza with only 10,987 miles. Compared to Hayward and Berkeley TODs in San Francisco, American Plaza residents
actually drove fewer miles each year. Driving fewer miles translates to better environmental conditions, and is positively
related to vehicle ownership. American Plaza, which had the highest transit ridership rate and the least miles travelled,
also had the lowest car ownership rates. On average, households in this TOD owned 0.99 cars, significantly lower than in
Uptown District and Rio Vista West, where households owned 2.00 and 1.53 cars, respectively (The California Depart-
ment of Transportation, 2002).
Despite San Diego's high car use, station area parking in all three TODs was reduced as part of the transit-oriented
initiative. In Uptown District, parking was reduced by 12%, and only 1,068 parking spaces are now available, none of
which are specifically for transit riders. American Plaza currently has 1,350 spaces adjacent to the station, but these
spaces cater to the entire community and are not rider-specific. Parking information was unavailable for the Rio Vista
West station area.
Since all three TODs are within the San Diego metropolis, census data was not available on the economic prosper-
ity of each TOD's real estate markets. However, according to Ms. Bragado, all three TODs are doing reasonably well in
terms of economic success. American Plaza, which is within the urban centre of the city, is doing particularly well. How-
ever, since this TOD is located in the city's core, it is difficult to attribute its success to proximity to transit alone (personal
communication, 20 July 2010b). Ms. Bragado was unable to comment further on the particular success of Rio Vista West
or Uptown District stations.
Table 11: Travel Behaviour in Uptown District, American Plaza and Rio Vista West TODs
TOD Transit Ridership
Average Annual VMT per Household
Number of Vehicles per Household
Station Area Parking
Uptown District N/A 18,955 miles 2.00 1,068 spaces
American Plaza 9.0% 10,987 miles 0.99 1,350 spaces
Rio Vista West 2.0% 16,660 miles 1.53 N/A
San Diego (city) 4.1% N/A N/A N/A
San Diego County 3.4% N/A N/A N/A
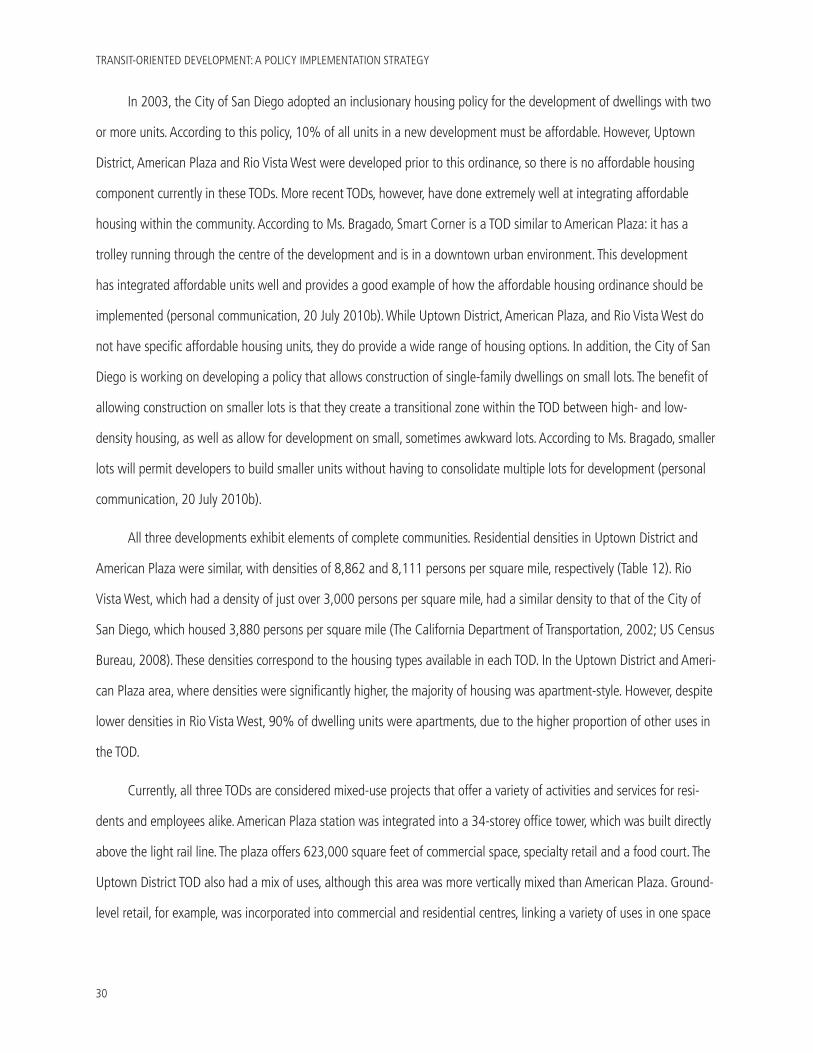
TRANSIT-ORIENTED DEVELOPMENT: A POLICY IMPLEMENTATION STRATEGY
30
In 2003, the City of San Diego adopted an inclusionary housing policy for the development of dwellings with two
or more units. According to this policy, 10% of all units in a new development must be affordable. However, Uptown
District, American Plaza and Rio Vista West were developed prior to this ordinance, so there is no affordable housing
component currently in these TODs. More recent TODs, however, have done extremely well at integrating affordable
housing within the community. According to Ms. Bragado, Smart Corner is a TOD similar to American Plaza: it has a
trolley running through the centre of the development and is in a downtown urban environment. This development
has integrated affordable units well and provides a good example of how the affordable housing ordinance should be
implemented (personal communication, 20 July 2010b). While Uptown District, American Plaza, and Rio Vista West do
not have specific affordable housing units, they do provide a wide range of housing options. In addition, the City of San
Diego is working on developing a policy that allows construction of single-family dwellings on small lots. The benefit of
allowing construction on smaller lots is that they create a transitional zone within the TOD between high- and low-
density housing, as well as allow for development on small, sometimes awkward lots. According to Ms. Bragado, smaller
lots will permit developers to build smaller units without having to consolidate multiple lots for development (personal
communication, 20 July 2010b).
All three developments exhibit elements of complete communities. Residential densities in Uptown District and
American Plaza were similar, with densities of 8,862 and 8,111 persons per square mile, respectively (Table 12). Rio
Vista West, which had a density of just over 3,000 persons per square mile, had a similar density to that of the City of
San Diego, which housed 3,880 persons per square mile (The California Department of Transportation, 2002; US Census
Bureau, 2008). These densities correspond to the housing types available in each TOD. In the Uptown District and Ameri-
can Plaza area, where densities were significantly higher, the majority of housing was apartment-style. However, despite
lower densities in Rio Vista West, 90% of dwelling units were apartments, due to the higher proportion of other uses in
the TOD.
Currently, all three TODs are considered mixed-use projects that offer a variety of activities and services for resi-
dents and employees alike. American Plaza station was integrated into a 34-storey office tower, which was built directly
above the light rail line. The plaza offers 623,000 square feet of commercial space, specialty retail and a food court. The
Uptown District TOD also had a mix of uses, although this area was more vertically mixed than American Plaza. Ground-
level retail, for example, was incorporated into commercial and residential centres, linking a variety of uses in one space
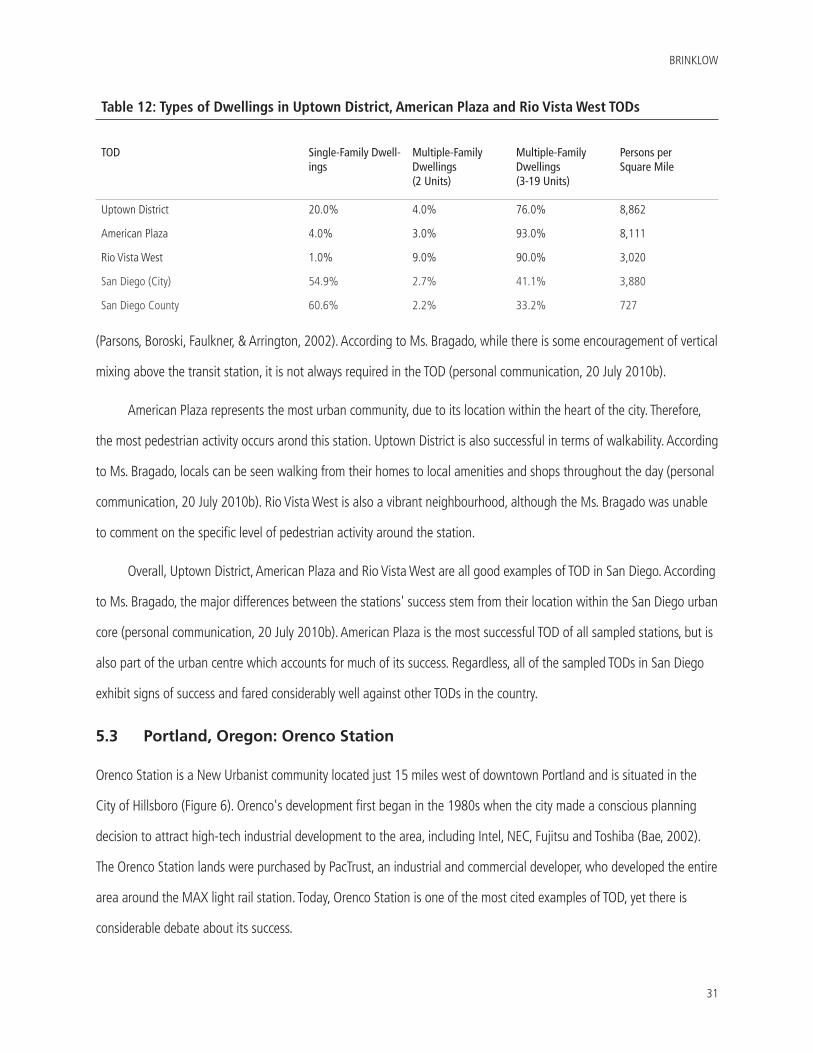
BRINKLOW
31
(Parsons, Boroski, Faulkner, & Arrington, 2002). According to Ms. Bragado, while there is some encouragement of vertical
mixing above the transit station, it is not always required in the TOD (personal communication, 20 July 2010b).
American Plaza represents the most urban community, due to its location within the heart of the city. Therefore,
the most pedestrian activity occurs arond this station. Uptown District is also successful in terms of walkability. According
to Ms. Bragado, locals can be seen walking from their homes to local amenities and shops throughout the day (personal
communication, 20 July 2010b). Rio Vista West is also a vibrant neighbourhood, although the Ms. Bragado was unable
to comment on the specific level of pedestrian activity around the station.
Overall, Uptown District, American Plaza and Rio Vista West are all good examples of TOD in San Diego. According
to Ms. Bragado, the major differences between the stations' success stem from their location within the San Diego urban
core (personal communication, 20 July 2010b). American Plaza is the most successful TOD of all sampled stations, but is
also part of the urban centre which accounts for much of its success. Regardless, all of the sampled TODs in San Diego
exhibit signs of success and fared considerably well against other TODs in the country.
5.3 Portland, Oregon: Orenco Station
Orenco Station is a New Urbanist community located just 15 miles west of downtown Portland and is situated in the
City of Hillsboro (Figure 6). Orenco's development first began in the 1980s when the city made a conscious planning
decision to attract high-tech industrial development to the area, including Intel, NEC, Fujitsu and Toshiba (Bae, 2002).
The Orenco Station lands were purchased by PacTrust, an industrial and commercial developer, who developed the entire
area around the MAX light rail station. Today, Orenco Station is one of the most cited examples of TOD, yet there is
considerable debate about its success.
Table 12: Types of Dwellings in Uptown District, American Plaza and Rio Vista West TODs
TOD Single-Family Dwell-ings
Multiple-Family Dwellings (2 Units)
Multiple-Family Dwellings (3-19 Units)
Persons per Square Mile
Uptown District 20.0% 4.0% 76.0% 8,862
American Plaza 4.0% 3.0% 93.0% 8,111
Rio Vista West 1.0% 9.0% 90.0% 3,020
San Diego (City) 54.9% 2.7% 41.1% 3,880
San Diego County 60.6% 2.2% 33.2% 727
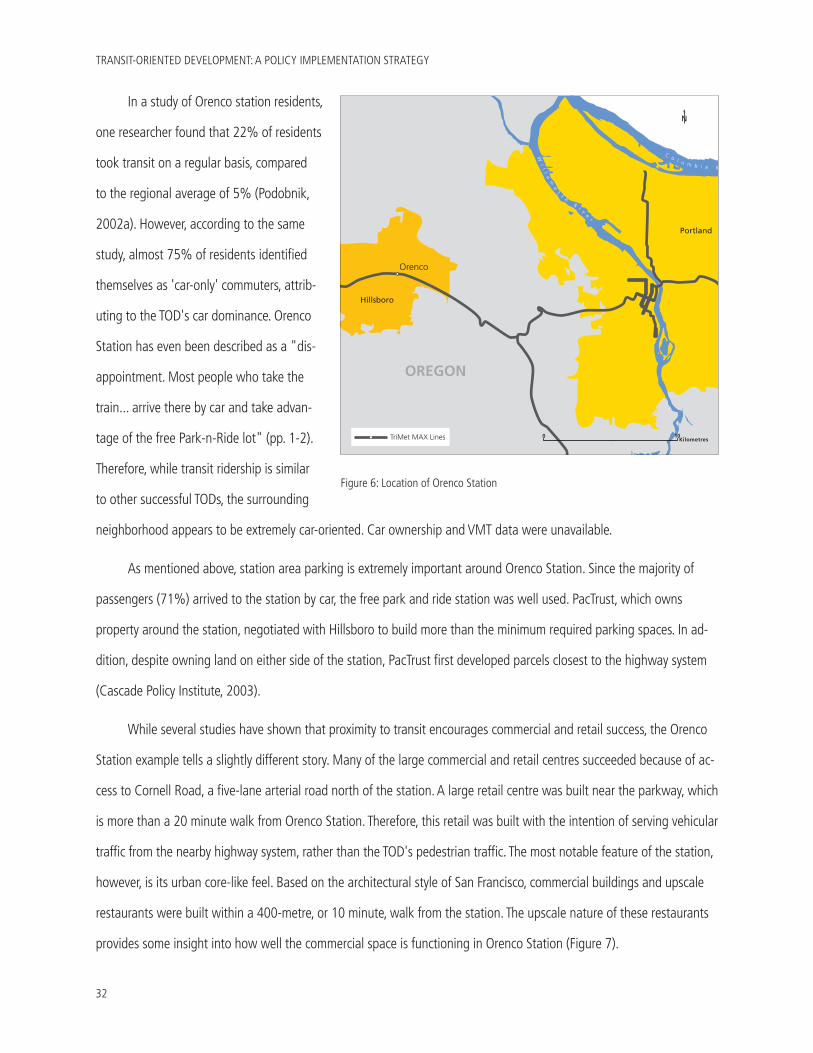
TRANSIT-ORIENTED DEVELOPMENT: A POLICY IMPLEMENTATION STRATEGY
32
In a study of Orenco station residents,
one researcher found that 22% of residents
took transit on a regular basis, compared
to the regional average of 5% (Podobnik,
2002a). However, according to the same
study, almost 75% of residents identified
themselves as 'car-only' commuters, attrib-
uting to the TOD's car dominance. Orenco
Station has even been described as a "dis-
appointment. Most people who take the
train... arrive there by car and take advan-
tage of the free Park-n-Ride lot" (pp. 1-2).
Therefore, while transit ridership is similar
to other successful TODs, the surrounding
neighborhood appears to be extremely car-oriented. Car ownership and VMT data were unavailable.
As mentioned above, station area parking is extremely important around Orenco Station. Since the majority of
passengers (71%) arrived to the station by car, the free park and ride station was well used. PacTrust, which owns
property around the station, negotiated with Hillsboro to build more than the minimum required parking spaces. In ad-
dition, despite owning land on either side of the station, PacTrust first developed parcels closest to the highway system
(Cascade Policy Institute, 2003).
While several studies have shown that proximity to transit encourages commercial and retail success, the Orenco
Station example tells a slightly different story. Many of the large commercial and retail centres succeeded because of ac-
cess to Cornell Road, a five-lane arterial road north of the station. A large retail centre was built near the parkway, which
is more than a 20 minute walk from Orenco Station. Therefore, this retail was built with the intention of serving vehicular
traffic from the nearby highway system, rather than the TOD's pedestrian traffic. The most notable feature of the station,
however, is its urban core-like feel. Based on the architectural style of San Francisco, commercial buildings and upscale
restaurants were built within a 400-metre, or 10 minute, walk from the station. The upscale nature of these restaurants
provides some insight into how well the commercial space is functioning in Orenco Station (Figure 7).
N
Wi
ll
am
et
te
Ri v
er
Co l u m b i a R i v e r
OREGON
Hillsboro
Portland
Orenco
0Kilometres
10TriMet MAX Lines
Figure 6: Location of Orenco Station
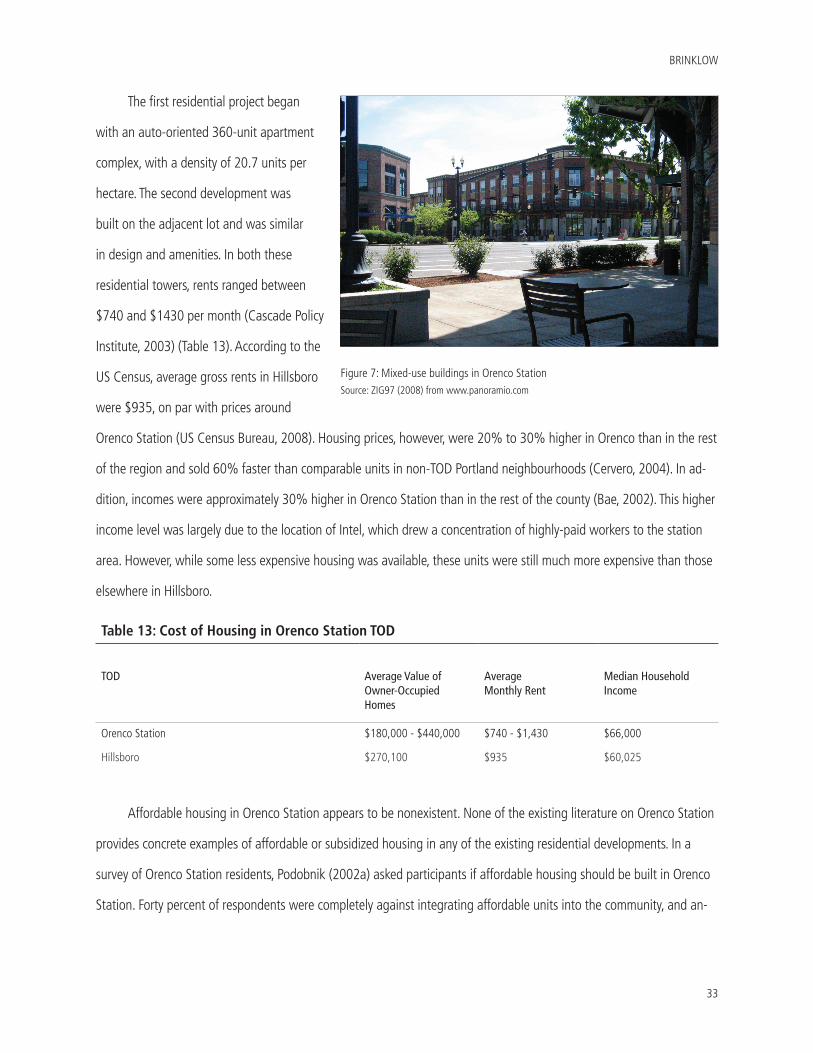
BRINKLOW
33
The first residential project began
with an auto-oriented 360-unit apartment
complex, with a density of 20.7 units per
hectare. The second development was
built on the adjacent lot and was similar
in design and amenities. In both these
residential towers, rents ranged between
$740 and $1430 per month (Cascade Policy
Institute, 2003) (Table 13). According to the
US Census, average gross rents in Hillsboro
were $935, on par with prices around
Orenco Station (US Census Bureau, 2008). Housing prices, however, were 20% to 30% higher in Orenco than in the rest
of the region and sold 60% faster than comparable units in non-TOD Portland neighbourhoods (Cervero, 2004). In ad-
dition, incomes were approximately 30% higher in Orenco Station than in the rest of the county (Bae, 2002). This higher
income level was largely due to the location of Intel, which drew a concentration of highly-paid workers to the station
area. However, while some less expensive housing was available, these units were still much more expensive than those
elsewhere in Hillsboro.
Affordable housing in Orenco Station appears to be nonexistent. None of the existing literature on Orenco Station
provides concrete examples of affordable or subsidized housing in any of the existing residential developments. In a
survey of Orenco Station residents, Podobnik (2002a) asked participants if affordable housing should be built in Orenco
Station. Forty percent of respondents were completely against integrating affordable units into the community, and an-
Figure 7: Mixed-use buildings in Orenco StationSource: ZIG97 (2008) from www.panoramio.com
Table 13: Cost of Housing in Orenco Station TOD
TOD Average Value of Owner-Occupied Homes
Average Monthly Rent
Median Household Income
Orenco Station $180,000 - $440,000 $740 - $1,430 $66,000
Hillsboro $270,100 $935 $60,025
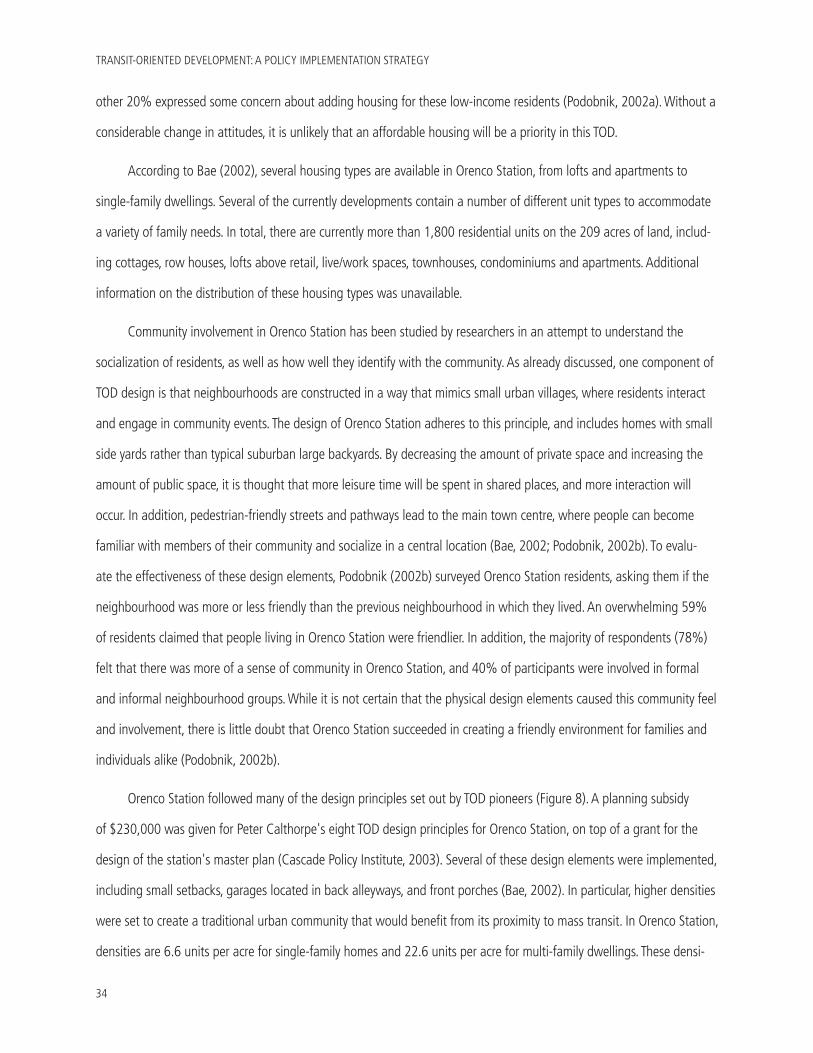
TRANSIT-ORIENTED DEVELOPMENT: A POLICY IMPLEMENTATION STRATEGY
34
other 20% expressed some concern about adding housing for these low-income residents (Podobnik, 2002a). Without a
considerable change in attitudes, it is unlikely that an affordable housing will be a priority in this TOD.
According to Bae (2002), several housing types are available in Orenco Station, from lofts and apartments to
single-family dwellings. Several of the currently developments contain a number of different unit types to accommodate
a variety of family needs. In total, there are currently more than 1,800 residential units on the 209 acres of land, includ-
ing cottages, row houses, lofts above retail, live/work spaces, townhouses, condominiums and apartments. Additional
information on the distribution of these housing types was unavailable.
Community involvement in Orenco Station has been studied by researchers in an attempt to understand the
socialization of residents, as well as how well they identify with the community. As already discussed, one component of
TOD design is that neighbourhoods are constructed in a way that mimics small urban villages, where residents interact
and engage in community events. The design of Orenco Station adheres to this principle, and includes homes with small
side yards rather than typical suburban large backyards. By decreasing the amount of private space and increasing the
amount of public space, it is thought that more leisure time will be spent in shared places, and more interaction will
occur. In addition, pedestrian-friendly streets and pathways lead to the main town centre, where people can become
familiar with members of their community and socialize in a central location (Bae, 2002; Podobnik, 2002b). To evalu-
ate the effectiveness of these design elements, Podobnik (2002b) surveyed Orenco Station residents, asking them if the
neighbourhood was more or less friendly than the previous neighbourhood in which they lived. An overwhelming 59%
of residents claimed that people living in Orenco Station were friendlier. In addition, the majority of respondents (78%)
felt that there was more of a sense of community in Orenco Station, and 40% of participants were involved in formal
and informal neighbourhood groups. While it is not certain that the physical design elements caused this community feel
and involvement, there is little doubt that Orenco Station succeeded in creating a friendly environment for families and
individuals alike (Podobnik, 2002b).
Orenco Station followed many of the design principles set out by TOD pioneers (Figure 8). A planning subsidy
of $230,000 was given for Peter Calthorpe's eight TOD design principles for Orenco Station, on top of a grant for the
design of the station's master plan (Cascade Policy Institute, 2003). Several of these design elements were implemented,
including small setbacks, garages located in back alleyways, and front porches (Bae, 2002). In particular, higher densities
were set to create a traditional urban community that would benefit from its proximity to mass transit. In Orenco Station,
densities are 6.6 units per acre for single-family homes and 22.6 units per acre for multi-family dwellings. These densi-
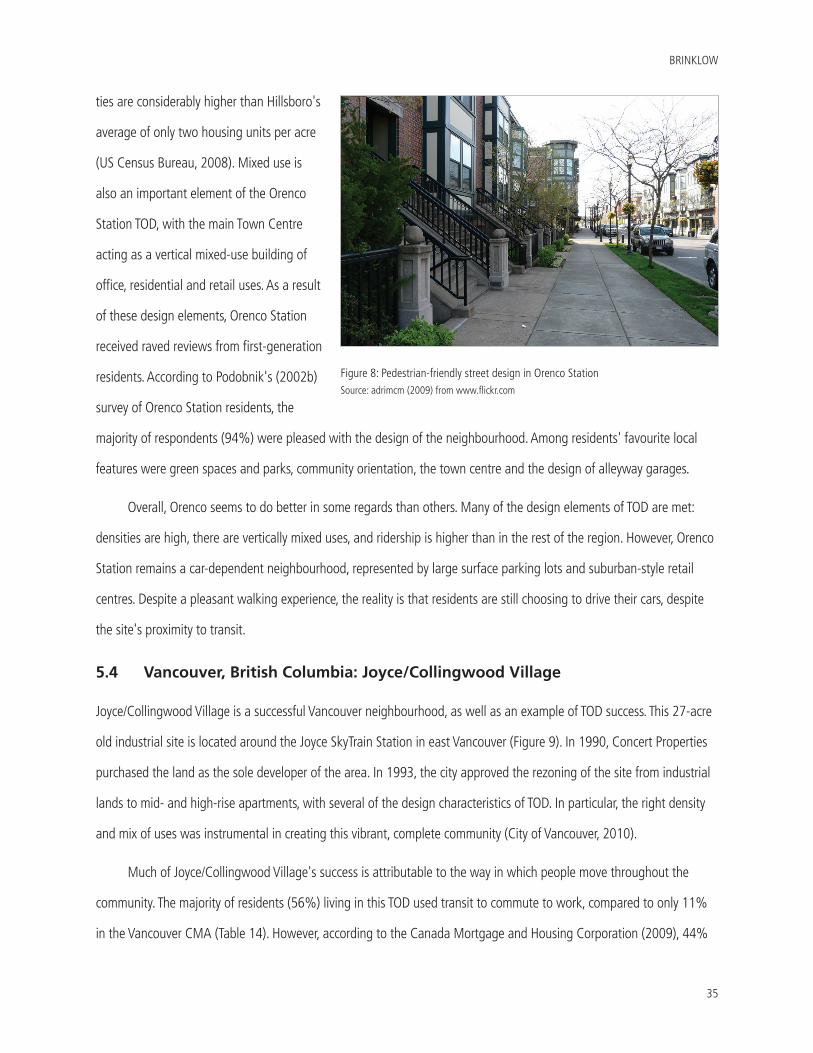
BRINKLOW
35
ties are considerably higher than Hillsboro's
average of only two housing units per acre
(US Census Bureau, 2008). Mixed use is
also an important element of the Orenco
Station TOD, with the main Town Centre
acting as a vertical mixed-use building of
office, residential and retail uses. As a result
of these design elements, Orenco Station
received raved reviews from first-generation
residents. According to Podobnik's (2002b)
survey of Orenco Station residents, the
majority of respondents (94%) were pleased with the design of the neighbourhood. Among residents' favourite local
features were green spaces and parks, community orientation, the town centre and the design of alleyway garages.
Overall, Orenco seems to do better in some regards than others. Many of the design elements of TOD are met:
densities are high, there are vertically mixed uses, and ridership is higher than in the rest of the region. However, Orenco
Station remains a car-dependent neighbourhood, represented by large surface parking lots and suburban-style retail
centres. Despite a pleasant walking experience, the reality is that residents are still choosing to drive their cars, despite
the site's proximity to transit.
5.4 Vancouver, British Columbia: Joyce/Collingwood Village
Joyce/Collingwood Village is a successful Vancouver neighbourhood, as well as an example of TOD success. This 27-acre
old industrial site is located around the Joyce SkyTrain Station in east Vancouver (Figure 9). In 1990, Concert Properties
purchased the land as the sole developer of the area. In 1993, the city approved the rezoning of the site from industrial
lands to mid- and high-rise apartments, with several of the design characteristics of TOD. In particular, the right density
and mix of uses was instrumental in creating this vibrant, complete community (City of Vancouver, 2010).
Much of Joyce/Collingwood Village's success is attributable to the way in which people move throughout the
community. The majority of residents (56%) living in this TOD used transit to commute to work, compared to only 11%
in the Vancouver CMA (Table 14). However, according to the Canada Mortgage and Housing Corporation (2009), 44%
Figure 8: Pedestrian-friendly street design in Orenco StationSource: adrimcm (2009) from www.flickr.com
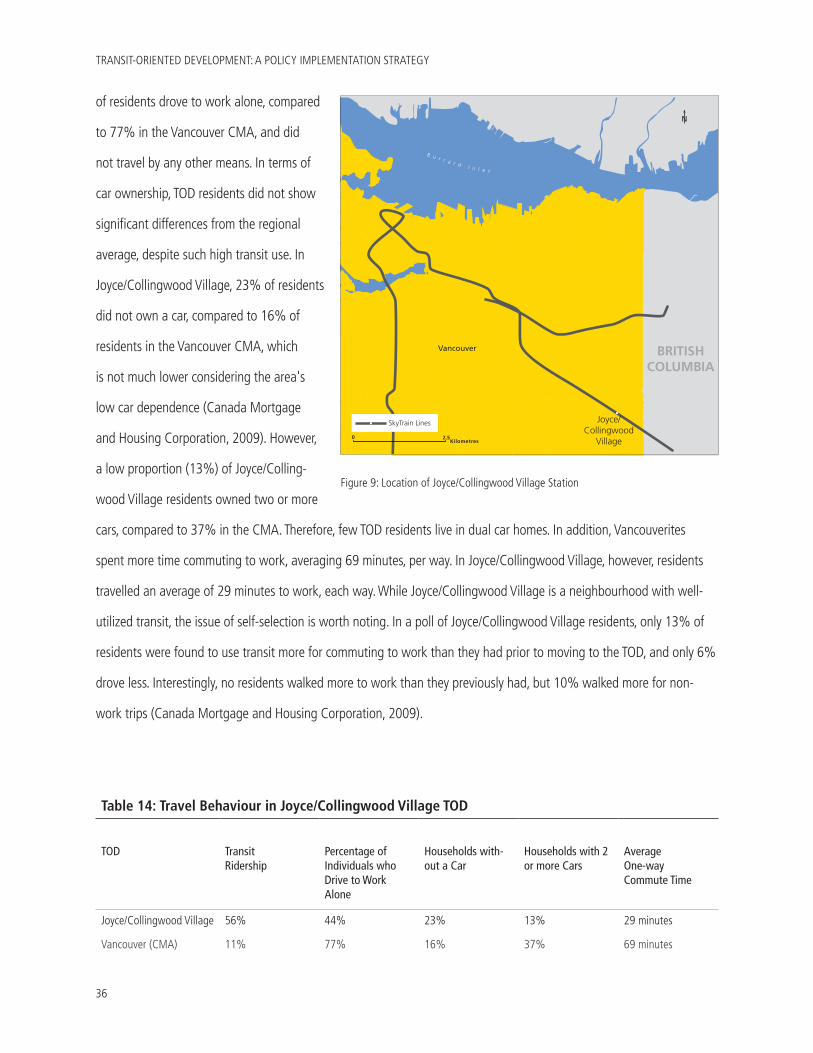
TRANSIT-ORIENTED DEVELOPMENT: A POLICY IMPLEMENTATION STRATEGY
36
of residents drove to work alone, compared
to 77% in the Vancouver CMA, and did
not travel by any other means. In terms of
car ownership, TOD residents did not show
significant differences from the regional
average, despite such high transit use. In
Joyce/Collingwood Village, 23% of residents
did not own a car, compared to 16% of
residents in the Vancouver CMA, which
is not much lower considering the area's
low car dependence (Canada Mortgage
and Housing Corporation, 2009). However,
a low proportion (13%) of Joyce/Colling-
wood Village residents owned two or more
cars, compared to 37% in the CMA. Therefore, few TOD residents live in dual car homes. In addition, Vancouverites
spent more time commuting to work, averaging 69 minutes, per way. In Joyce/Collingwood Village, however, residents
travelled an average of 29 minutes to work, each way. While Joyce/Collingwood Village is a neighbourhood with well-
utilized transit, the issue of self-selection is worth noting. In a poll of Joyce/Collingwood Village residents, only 13% of
residents were found to use transit more for commuting to work than they had prior to moving to the TOD, and only 6%
drove less. Interestingly, no residents walked more to work than they previously had, but 10% walked more for non-
work trips (Canada Mortgage and Housing Corporation, 2009).
Table 14: Travel Behaviour in Joyce/Collingwood Village TOD
TOD Transit Ridership
Percentage of Individuals who Drive to Work Alone
Households with-out a Car
Households with 2 or more Cars
Average One-way Commute Time
Joyce/Collingwood Village 56% 44% 23% 13% 29 minutes
Vancouver (CMA) 11% 77% 16% 37% 69 minutes
B u r r a r d I n l e t
BRITISH COLUMBIA
Joyce/Collingwood
Village
Vancouver
N
SkyTrain Lines
0Kilometres
2.5
Figure 9: Location of Joyce/Collingwood Village Station
BRINKLOW
37
Parking ratios were lowered in the Joyce/Collingwood Village from 1.75 to 1.35 spaces per residential unit, as re-
quested by the developer. Following the first phase of construction, the developer requested an even lower parking ratio
to reflect local needs, reducing the ratio to 1.04 spaces per unit. In addition, bicycle parking is available in all buildings,
totaling 2,408 spaces. Office buildings and community centres provide change rooms and showers, in addition to below-
grade parking for cyclists (Canada Mortgage and Housing Corporation, 2009).
The real estate market in Joyce/Collingwood Village has done extremely well since its construction. The commercial
and retail uses in the area mainly serve local residents, with 6,500 square metres of non-residential space, including a
grocery store, drug store, and small-scale boutiques. In addition, several community facilities were located in the commu-
nity, including a 200-pupil elementary school, a 930 square metre community centre, a 650 square metre daycare, and a
neighbourhood policing centre (Canada Mortgage and Housing Corporation, 2009).
According to Concert Properties, condominium sales exceeded expectations. In 2004, the average condo sell-
ing price was $339,948, compared to $326,284 in the Vancouver CMA (Canada Mortgage and Housing Corporation,
2009) (Table 15). In addition, residents living in this area had higher incomes than those living in the CMA. Only 36% of
households had an income under $50,000, compared to 50% in the region. While the proportion of wealthy households
(those making more than $100,000) was lower in the TOD (7% compared to 16% in Vancouver), there was a greater
percentage of households in the middle range (56% compared to 34% in the CMA) (Canada Mortgage and Housing
Corporation, 2009). Despite the affluent nature of the community, affordable housing is an important component of all
transit-oriented communities in Vancouver, and Joyce/Collingwood Village is no exception. Twenty percent of housing
was designated as affordable units to accommodate those in need of cheaper housing near transit (Roewe, 6 February
2010). These affordable units were mixed in and around the existing six towers on the site. The towers range in size
from four- and six-storey mid-rises to a 20-storey tower. There are 2,700 suites in total, 783 of which are rental units,
and unit sizes range from 34 to 123 square metres (Canada Mortgage and Housing Corporation, 2009). Despite these
smaller unit sizes, 84% of residents were satisfied or somewhat satisfied with their unit size. Household size was smaller
(1.9 compared to 2.6 people per household in the CMA), yet 65% did not live in high-rises prior to moving to the TOD.
Therefore, the high level of satisfaction shows that residents were willing to change their lifestyle and were happy with
this choice. In addition, 20% of homes were specifically designed for families with children, and a large portion of units
were ground-oriented to reflect this market (Canada Mortgage and Housing Corporation, 2009). As a result, densities
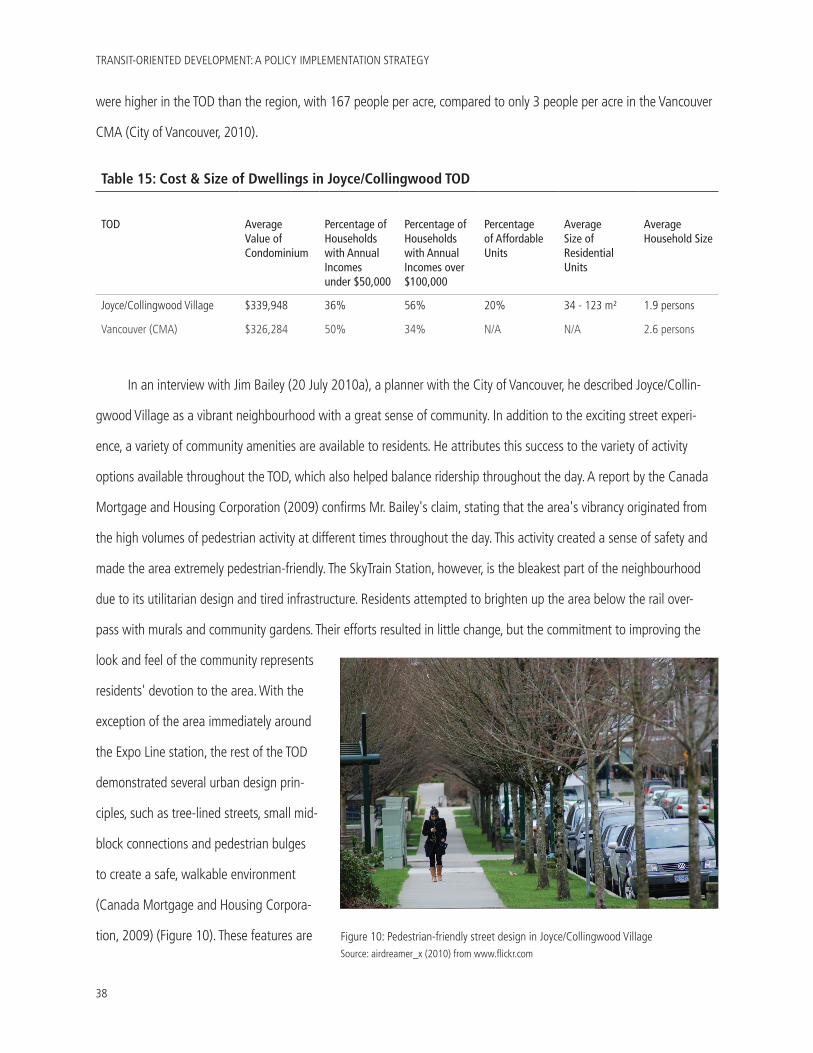
TRANSIT-ORIENTED DEVELOPMENT: A POLICY IMPLEMENTATION STRATEGY
38
were higher in the TOD than the region, with 167 people per acre, compared to only 3 people per acre in the Vancouver
CMA (City of Vancouver, 2010).
In an interview with Jim Bailey (20 July 2010a), a planner with the City of Vancouver, he described Joyce/Collin-
gwood Village as a vibrant neighbourhood with a great sense of community. In addition to the exciting street experi-
ence, a variety of community amenities are available to residents. He attributes this success to the variety of activity
options available throughout the TOD, which also helped balance ridership throughout the day. A report by the Canada
Mortgage and Housing Corporation (2009) confirms Mr. Bailey's claim, stating that the area's vibrancy originated from
the high volumes of pedestrian activity at different times throughout the day. This activity created a sense of safety and
made the area extremely pedestrian-friendly. The SkyTrain Station, however, is the bleakest part of the neighbourhood
due to its utilitarian design and tired infrastructure. Residents attempted to brighten up the area below the rail over-
pass with murals and community gardens. Their efforts resulted in little change, but the commitment to improving the
look and feel of the community represents
residents' devotion to the area. With the
exception of the area immediately around
the Expo Line station, the rest of the TOD
demonstrated several urban design prin-
ciples, such as tree-lined streets, small mid-
block connections and pedestrian bulges
to create a safe, walkable environment
(Canada Mortgage and Housing Corpora-
tion, 2009) (Figure 10). These features are
Table 15: Cost & Size of Dwellings in Joyce/Collingwood TOD
TOD Average Value of Condominium
Percentage of Households with Annual Incomes under $50,000
Percentage of Households with Annual Incomes over $100,000
Percentage of Affordable Units
Average Size of Residential Units
Average Household Size
Joyce/Collingwood Village $339,948 36% 56% 20% 34 - 123 m² 1.9 persons
Vancouver (CMA) $326,284 50% 34% N/A N/A 2.6 persons
Figure 10: Pedestrian-friendly street design in Joyce/Collingwood VillageSource: airdreamer_x (2010) from www.flickr.com
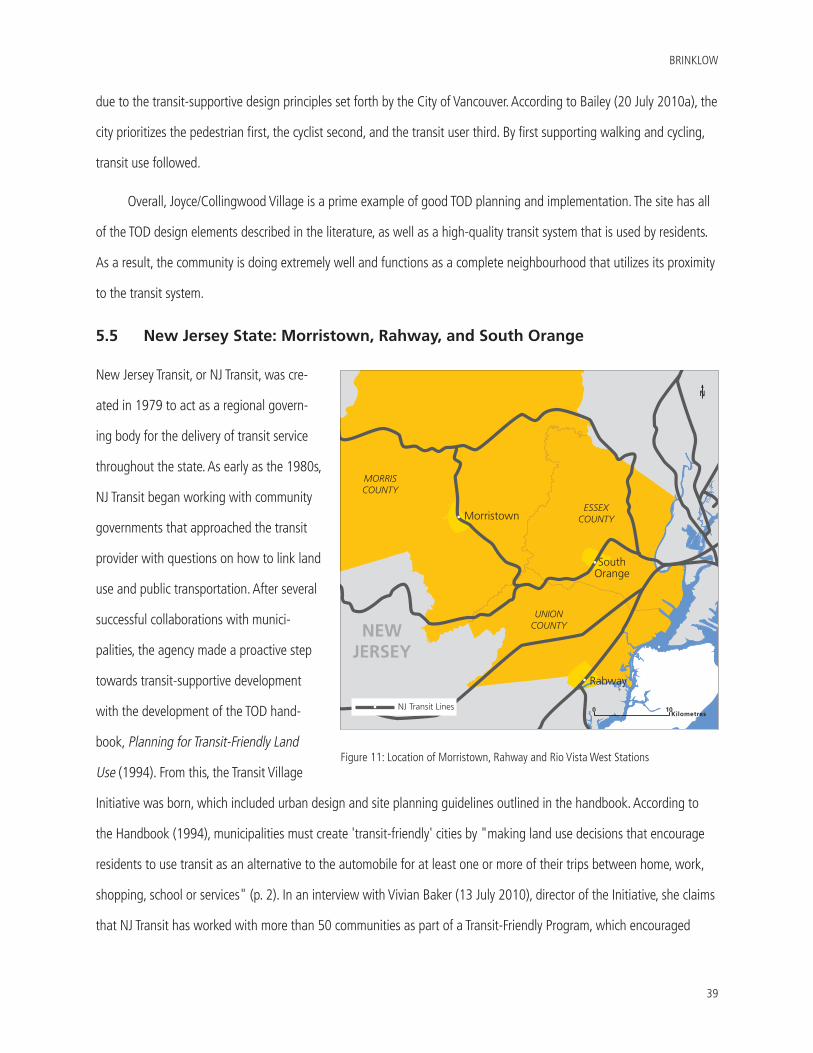
BRINKLOW
39
due to the transit-supportive design principles set forth by the City of Vancouver. According to Bailey (20 July 2010a), the
city prioritizes the pedestrian first, the cyclist second, and the transit user third. By first supporting walking and cycling,
transit use followed.
Overall, Joyce/Collingwood Village is a prime example of good TOD planning and implementation. The site has all
of the TOD design elements described in the literature, as well as a high-quality transit system that is used by residents.
As a result, the community is doing extremely well and functions as a complete neighbourhood that utilizes its proximity
to the transit system.
5.5 New Jersey State: Morristown, Rahway, and South Orange
New Jersey Transit, or NJ Transit, was cre-
ated in 1979 to act as a regional govern-
ing body for the delivery of transit service
throughout the state. As early as the 1980s,
NJ Transit began working with community
governments that approached the transit
provider with questions on how to link land
use and public transportation. After several
successful collaborations with munici-
palities, the agency made a proactive step
towards transit-supportive development
with the development of the TOD hand-
book, Planning for Transit-Friendly Land
Use (1994). From this, the Transit Village
Initiative was born, which included urban design and site planning guidelines outlined in the handbook. According to
the Handbook (1994), municipalities must create 'transit-friendly' cities by "making land use decisions that encourage
residents to use transit as an alternative to the automobile for at least one or more of their trips between home, work,
shopping, school or services" (p. 2). In an interview with Vivian Baker (13 July 2010), director of the Initiative, she claims
that NJ Transit has worked with more than 50 communities as part of a Transit-Friendly Program, which encouraged
MORRIS COUNTY
ESSEX COUNTY
UNION COUNTYNEW
JERSEY
Morristown
South Orange
Rahway
N
0Kilometres
10NJ Transit Lines
Figure 11: Location of Morristown, Rahway and Rio Vista West Stations
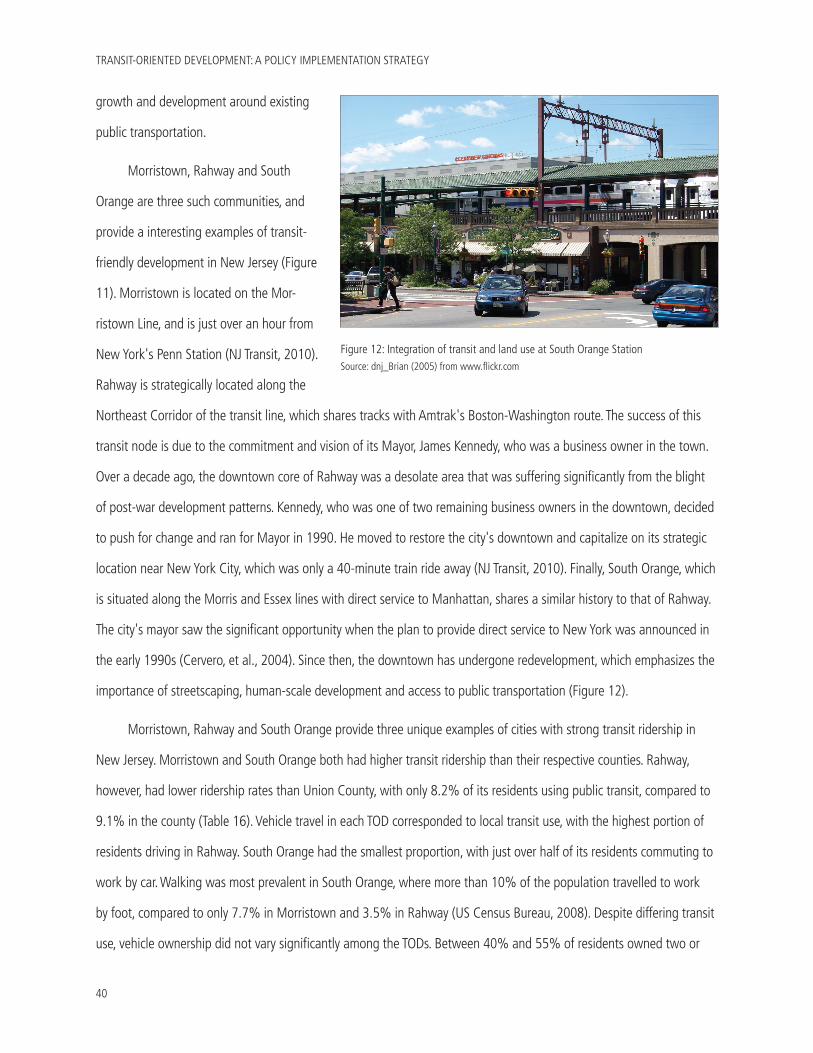
TRANSIT-ORIENTED DEVELOPMENT: A POLICY IMPLEMENTATION STRATEGY
40
growth and development around existing
public transportation.
Morristown, Rahway and South
Orange are three such communities, and
provide a interesting examples of transit-
friendly development in New Jersey (Figure
11). Morristown is located on the Mor-
ristown Line, and is just over an hour from
New York's Penn Station (NJ Transit, 2010).
Rahway is strategically located along the
Northeast Corridor of the transit line, which shares tracks with Amtrak's Boston-Washington route. The success of this
transit node is due to the commitment and vision of its Mayor, James Kennedy, who was a business owner in the town.
Over a decade ago, the downtown core of Rahway was a desolate area that was suffering significantly from the blight
of post-war development patterns. Kennedy, who was one of two remaining business owners in the downtown, decided
to push for change and ran for Mayor in 1990. He moved to restore the city's downtown and capitalize on its strategic
location near New York City, which was only a 40-minute train ride away (NJ Transit, 2010). Finally, South Orange, which
is situated along the Morris and Essex lines with direct service to Manhattan, shares a similar history to that of Rahway.
The city's mayor saw the significant opportunity when the plan to provide direct service to New York was announced in
the early 1990s (Cervero, et al., 2004). Since then, the downtown has undergone redevelopment, which emphasizes the
importance of streetscaping, human-scale development and access to public transportation (Figure 12).
Morristown, Rahway and South Orange provide three unique examples of cities with strong transit ridership in
New Jersey. Morristown and South Orange both had higher transit ridership than their respective counties. Rahway,
however, had lower ridership rates than Union County, with only 8.2% of its residents using public transit, compared to
9.1% in the county (Table 16). Vehicle travel in each TOD corresponded to local transit use, with the highest portion of
residents driving in Rahway. South Orange had the smallest proportion, with just over half of its residents commuting to
work by car. Walking was most prevalent in South Orange, where more than 10% of the population travelled to work
by foot, compared to only 7.7% in Morristown and 3.5% in Rahway (US Census Bureau, 2008). Despite differing transit
use, vehicle ownership did not vary significantly among the TODs. Between 40% and 55% of residents owned two or
Figure 12: Integration of transit and land use at South Orange StationSource: dnj_Brian (2005) from www.flickr.com
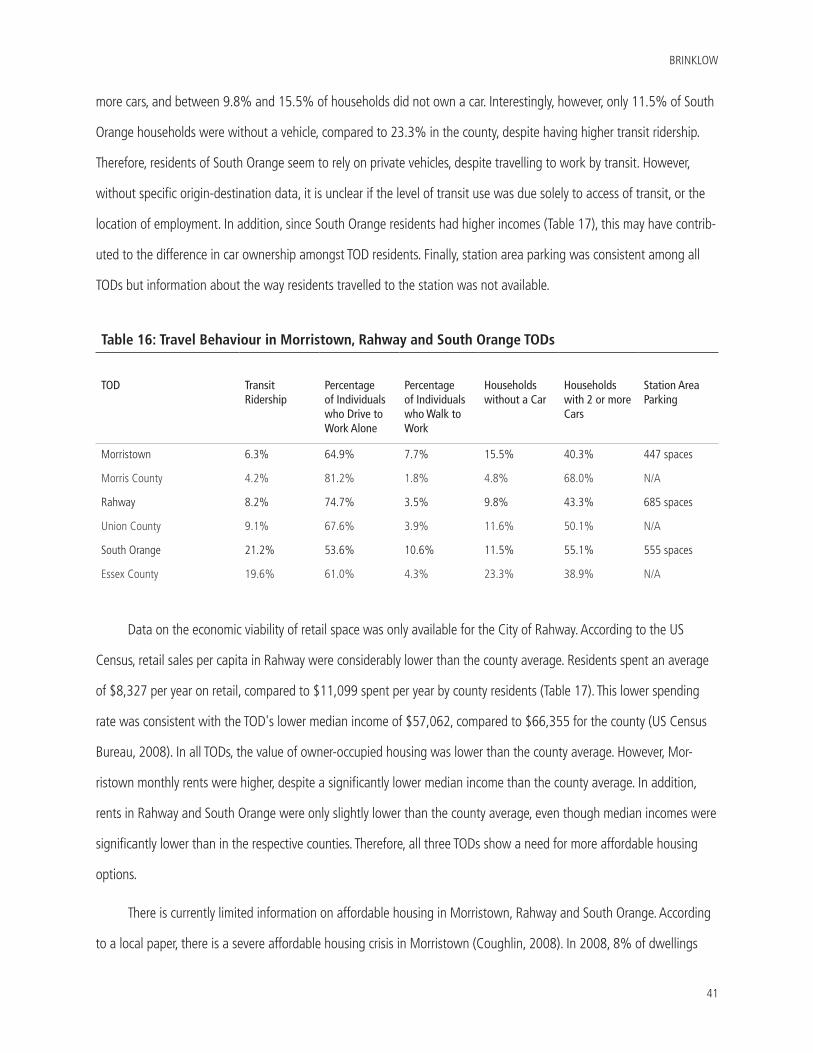
BRINKLOW
41
more cars, and between 9.8% and 15.5% of households did not own a car. Interestingly, however, only 11.5% of South
Orange households were without a vehicle, compared to 23.3% in the county, despite having higher transit ridership.
Therefore, residents of South Orange seem to rely on private vehicles, despite travelling to work by transit. However,
without specific origin-destination data, it is unclear if the level of transit use was due solely to access of transit, or the
location of employment. In addition, since South Orange residents had higher incomes (Table 17), this may have contrib-
uted to the difference in car ownership amongst TOD residents. Finally, station area parking was consistent among all
TODs but information about the way residents travelled to the station was not available.
Data on the economic viability of retail space was only available for the City of Rahway. According to the US
Census, retail sales per capita in Rahway were considerably lower than the county average. Residents spent an average
of $8,327 per year on retail, compared to $11,099 spent per year by county residents (Table 17). This lower spending
rate was consistent with the TOD's lower median income of $57,062, compared to $66,355 for the county (US Census
Bureau, 2008). In all TODs, the value of owner-occupied housing was lower than the county average. However, Mor-
ristown monthly rents were higher, despite a significantly lower median income than the county average. In addition,
rents in Rahway and South Orange were only slightly lower than the county average, even though median incomes were
significantly lower than in the respective counties. Therefore, all three TODs show a need for more affordable housing
options.
There is currently limited information on affordable housing in Morristown, Rahway and South Orange. According
to a local paper, there is a severe affordable housing crisis in Morristown (Coughlin, 2008). In 2008, 8% of dwellings
Table 16: Travel Behaviour in Morristown, Rahway and South Orange TODs
TOD Transit Ridership
Percentage of Individuals who Drive to Work Alone
Percentage of Individuals who Walk to Work
Households without a Car
Households with 2 or more Cars
Station Area Parking
Morristown 6.3% 64.9% 7.7% 15.5% 40.3% 447 spaces
Morris County 4.2% 81.2% 1.8% 4.8% 68.0% N/A
Rahway 8.2% 74.7% 3.5% 9.8% 43.3% 685 spaces
Union County 9.1% 67.6% 3.9% 11.6% 50.1% N/A
South Orange 21.2% 53.6% 10.6% 11.5% 55.1% 555 spaces
Essex County 19.6% 61.0% 4.3% 23.3% 38.9% N/A
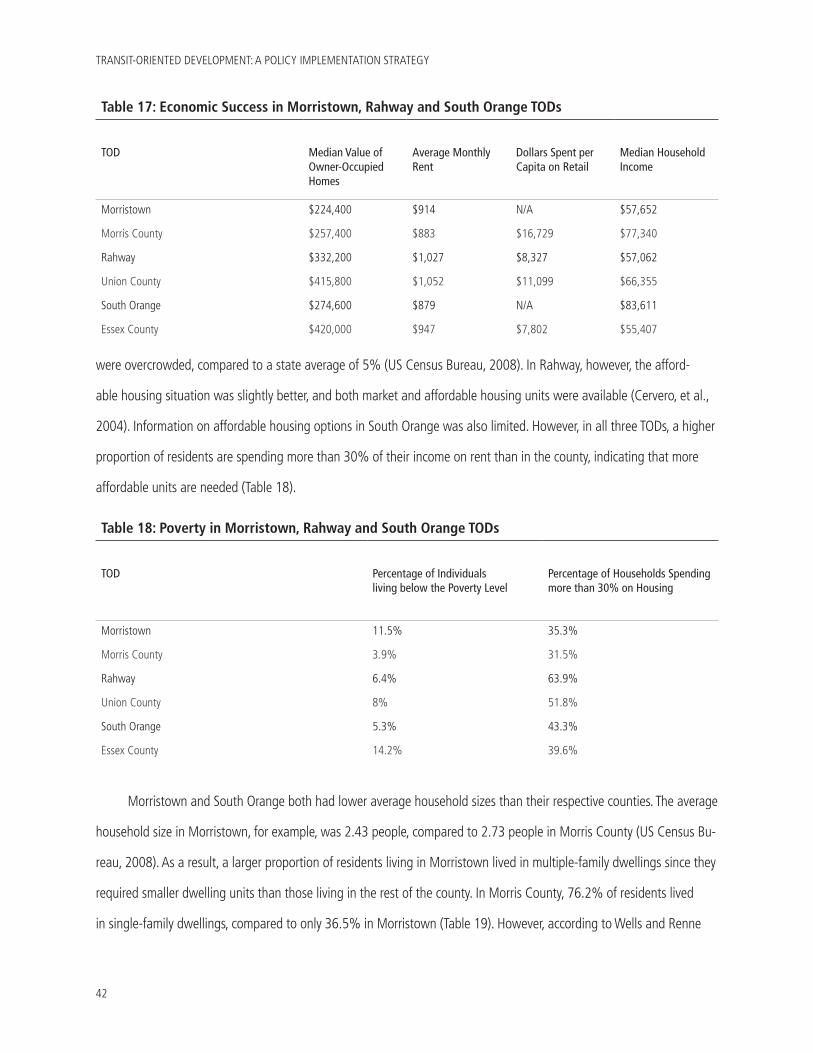
TRANSIT-ORIENTED DEVELOPMENT: A POLICY IMPLEMENTATION STRATEGY
42
were overcrowded, compared to a state average of 5% (US Census Bureau, 2008). In Rahway, however, the afford-
able housing situation was slightly better, and both market and affordable housing units were available (Cervero, et al.,
2004). Information on affordable housing options in South Orange was also limited. However, in all three TODs, a higher
proportion of residents are spending more than 30% of their income on rent than in the county, indicating that more
affordable units are needed (Table 18).
Morristown and South Orange both had lower average household sizes than their respective counties. The average
household size in Morristown, for example, was 2.43 people, compared to 2.73 people in Morris County (US Census Bu-
reau, 2008). As a result, a larger proportion of residents living in Morristown lived in multiple-family dwellings since they
required smaller dwelling units than those living in the rest of the county. In Morris County, 76.2% of residents lived
in single-family dwellings, compared to only 36.5% in Morristown (Table 19). However, according to Wells and Renne
Table 18: Poverty in Morristown, Rahway and South Orange TODs
TOD Percentage of Individuals living below the Poverty Level
Percentage of Households Spending more than 30% on Housing
Morristown 11.5% 35.3%
Morris County 3.9% 31.5%
Rahway 6.4% 63.9%
Union County 8% 51.8%
South Orange 5.3% 43.3%
Essex County 14.2% 39.6%
Table 17: Economic Success in Morristown, Rahway and South Orange TODs
TOD Median Value of Owner-Occupied Homes
Average Monthly Rent
Dollars Spent per Capita on Retail
Median Household Income
Morristown $224,400 $914 N/A $57,652
Morris County $257,400 $883 $16,729 $77,340
Rahway $332,200 $1,027 $8,327 $57,062
Union County $415,800 $1,052 $11,099 $66,355
South Orange $274,600 $879 N/A $83,611
Essex County $420,000 $947 $7,802 $55,407
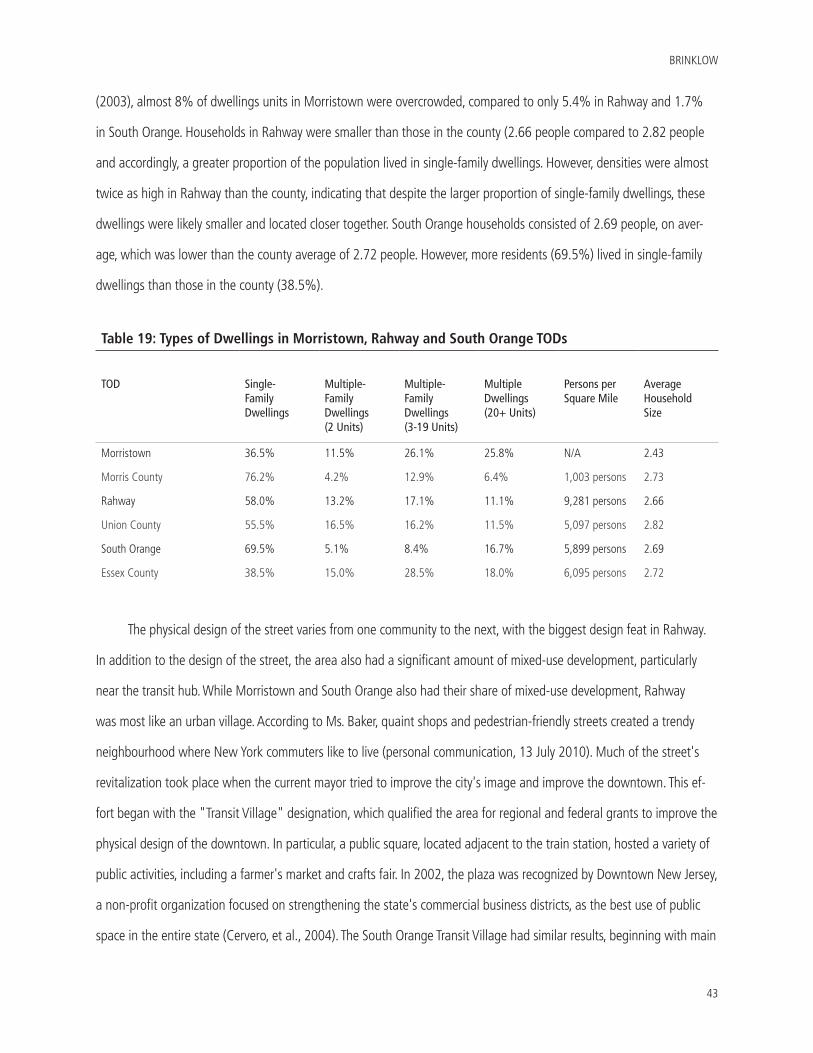
BRINKLOW
43
(2003), almost 8% of dwellings units in Morristown were overcrowded, compared to only 5.4% in Rahway and 1.7%
in South Orange. Households in Rahway were smaller than those in the county (2.66 people compared to 2.82 people
and accordingly, a greater proportion of the population lived in single-family dwellings. However, densities were almost
twice as high in Rahway than the county, indicating that despite the larger proportion of single-family dwellings, these
dwellings were likely smaller and located closer together. South Orange households consisted of 2.69 people, on aver-
age, which was lower than the county average of 2.72 people. However, more residents (69.5%) lived in single-family
dwellings than those in the county (38.5%).
The physical design of the street varies from one community to the next, with the biggest design feat in Rahway.
In addition to the design of the street, the area also had a significant amount of mixed-use development, particularly
near the transit hub. While Morristown and South Orange also had their share of mixed-use development, Rahway
was most like an urban village. According to Ms. Baker, quaint shops and pedestrian-friendly streets created a trendy
neighbourhood where New York commuters like to live (personal communication, 13 July 2010). Much of the street's
revitalization took place when the current mayor tried to improve the city's image and improve the downtown. This ef-
fort began with the "Transit Village" designation, which qualified the area for regional and federal grants to improve the
physical design of the downtown. In particular, a public square, located adjacent to the train station, hosted a variety of
public activities, including a farmer's market and crafts fair. In 2002, the plaza was recognized by Downtown New Jersey,
a non-profit organization focused on strengthening the state's commercial business districts, as the best use of public
space in the entire state (Cervero, et al., 2004). The South Orange Transit Village had similar results, beginning with main
Table 19: Types of Dwellings in Morristown, Rahway and South Orange TODs
TOD Single-Family Dwellings
Multiple-FamilyDwellings(2 Units)
Multiple-Family Dwellings (3-19 Units)
Multiple Dwellings (20+ Units)
Persons per Square Mile
Average Household Size
Morristown 36.5% 11.5% 26.1% 25.8% N/A 2.43
Morris County 76.2% 4.2% 12.9% 6.4% 1,003 persons 2.73
Rahway 58.0% 13.2% 17.1% 11.1% 9,281 persons 2.66
Union County 55.5% 16.5% 16.2% 11.5% 5,097 persons 2.82
South Orange 69.5% 5.1% 8.4% 16.7% 5,899 persons 2.69
Essex County 38.5% 15.0% 28.5% 18.0% 6,095 persons 2.72
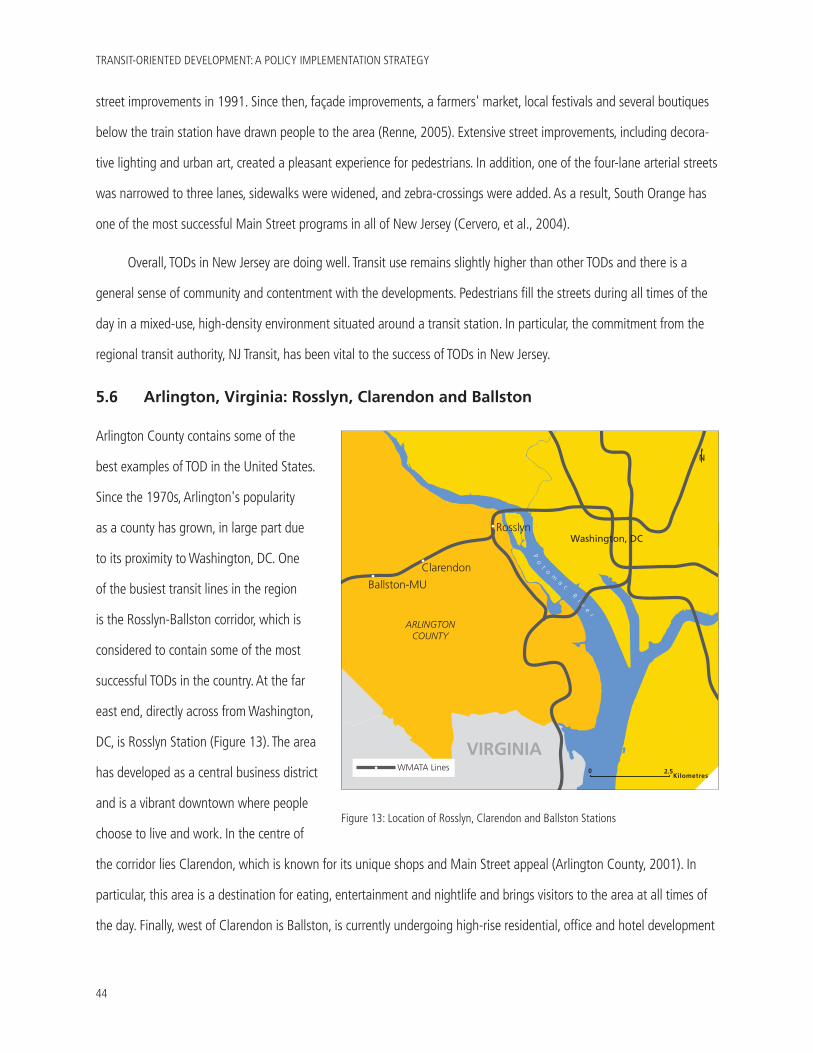
TRANSIT-ORIENTED DEVELOPMENT: A POLICY IMPLEMENTATION STRATEGY
44
street improvements in 1991. Since then, façade improvements, a farmers' market, local festivals and several boutiques
below the train station have drawn people to the area (Renne, 2005). Extensive street improvements, including decora-
tive lighting and urban art, created a pleasant experience for pedestrians. In addition, one of the four-lane arterial streets
was narrowed to three lanes, sidewalks were widened, and zebra-crossings were added. As a result, South Orange has
one of the most successful Main Street programs in all of New Jersey (Cervero, et al., 2004).
Overall, TODs in New Jersey are doing well. Transit use remains slightly higher than other TODs and there is a
general sense of community and contentment with the developments. Pedestrians fill the streets during all times of the
day in a mixed-use, high-density environment situated around a transit station. In particular, the commitment from the
regional transit authority, NJ Transit, has been vital to the success of TODs in New Jersey.
5.6 Arlington, Virginia: Rosslyn, Clarendon and Ballston
Arlington County contains some of the
best examples of TOD in the United States.
Since the 1970s, Arlington's popularity
as a county has grown, in large part due
to its proximity to Washington, DC. One
of the busiest transit lines in the region
is the Rosslyn-Ballston corridor, which is
considered to contain some of the most
successful TODs in the country. At the far
east end, directly across from Washington,
DC, is Rosslyn Station (Figure 13). The area
has developed as a central business district
and is a vibrant downtown where people
choose to live and work. In the centre of
the corridor lies Clarendon, which is known for its unique shops and Main Street appeal (Arlington County, 2001). In
particular, this area is a destination for eating, entertainment and nightlife and brings visitors to the area at all times of
the day. Finally, west of Clarendon is Ballston, is currently undergoing high-rise residential, office and hotel development
Ballston-MU
Clarendon
Rosslyn
ARLINGTON COUNTY
Washington, DC
Po
t
om
ac
R
iv
er
VIRGINIA0
Kilometres2.5
N
WMATA Lines
Figure 13: Location of Rosslyn, Clarendon and Ballston Stations
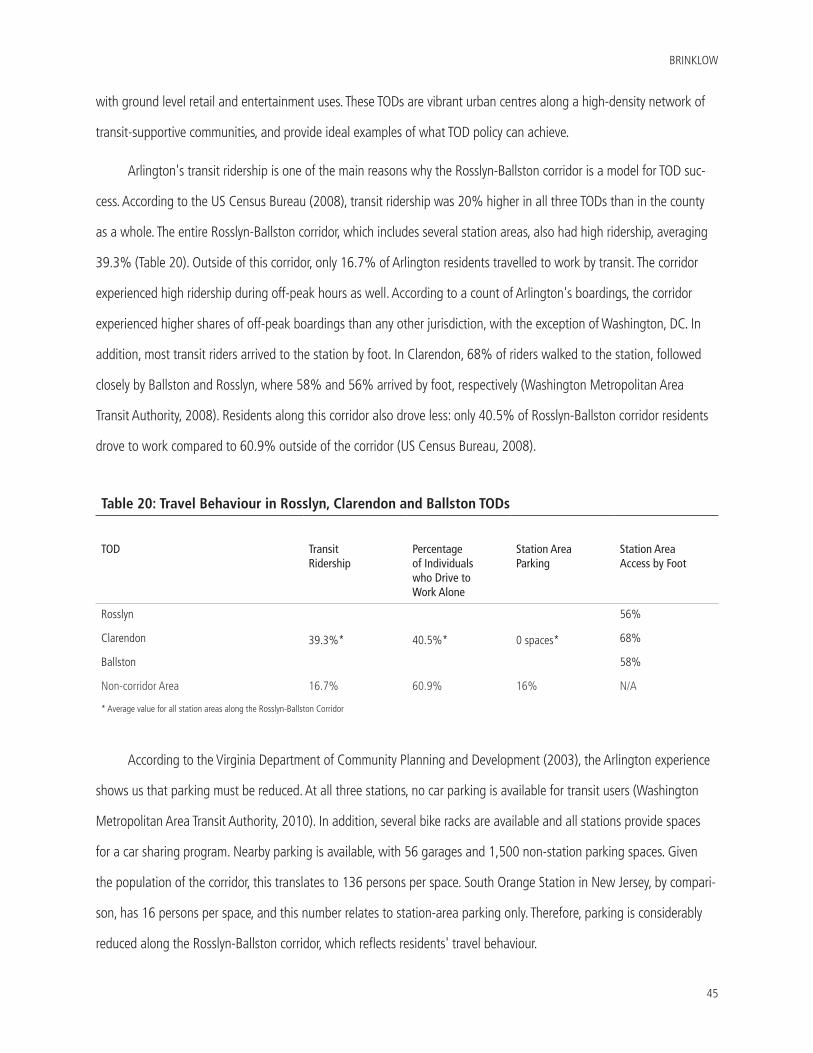
BRINKLOW
45
with ground level retail and entertainment uses. These TODs are vibrant urban centres along a high-density network of
transit-supportive communities, and provide ideal examples of what TOD policy can achieve.
Arlington's transit ridership is one of the main reasons why the Rosslyn-Ballston corridor is a model for TOD suc-
cess. According to the US Census Bureau (2008), transit ridership was 20% higher in all three TODs than in the county
as a whole. The entire Rosslyn-Ballston corridor, which includes several station areas, also had high ridership, averaging
39.3% (Table 20). Outside of this corridor, only 16.7% of Arlington residents travelled to work by transit. The corridor
experienced high ridership during off-peak hours as well. According to a count of Arlington's boardings, the corridor
experienced higher shares of off-peak boardings than any other jurisdiction, with the exception of Washington, DC. In
addition, most transit riders arrived to the station by foot. In Clarendon, 68% of riders walked to the station, followed
closely by Ballston and Rosslyn, where 58% and 56% arrived by foot, respectively (Washington Metropolitan Area
Transit Authority, 2008). Residents along this corridor also drove less: only 40.5% of Rosslyn-Ballston corridor residents
drove to work compared to 60.9% outside of the corridor (US Census Bureau, 2008).
According to the Virginia Department of Community Planning and Development (2003), the Arlington experience
shows us that parking must be reduced. At all three stations, no car parking is available for transit users (Washington
Metropolitan Area Transit Authority, 2010). In addition, several bike racks are available and all stations provide spaces
for a car sharing program. Nearby parking is available, with 56 garages and 1,500 non-station parking spaces. Given
the population of the corridor, this translates to 136 persons per space. South Orange Station in New Jersey, by compari-
son, has 16 persons per space, and this number relates to station-area parking only. Therefore, parking is considerably
reduced along the Rosslyn-Ballston corridor, which reflects residents' travel behaviour.
Table 20: Travel Behaviour in Rosslyn, Clarendon and Ballston TODs
TOD Transit Ridership
Percentage of Individuals who Drive to Work Alone
Station Area Parking
Station Area Access by Foot
Rosslyn
39.3%* 40.5%* 0 spaces*
56%
Clarendon 68%
Ballston 58%
Non-corridor Area 16.7% 60.9% 16% N/A
* Average value for all station areas along the Rosslyn-Ballston Corridor
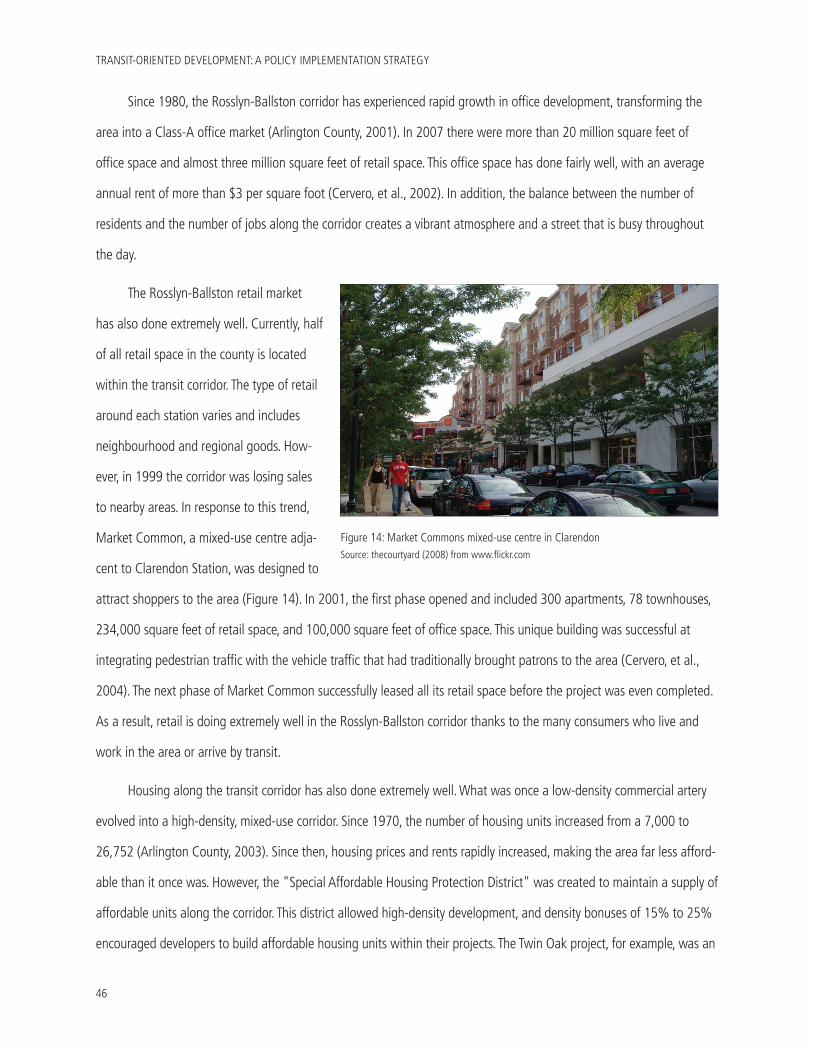
TRANSIT-ORIENTED DEVELOPMENT: A POLICY IMPLEMENTATION STRATEGY
46
Since 1980, the Rosslyn-Ballston corridor has experienced rapid growth in office development, transforming the
area into a Class-A office market (Arlington County, 2001). In 2007 there were more than 20 million square feet of
office space and almost three million square feet of retail space. This office space has done fairly well, with an average
annual rent of more than $3 per square foot (Cervero, et al., 2002). In addition, the balance between the number of
residents and the number of jobs along the corridor creates a vibrant atmosphere and a street that is busy throughout
the day.
The Rosslyn-Ballston retail market
has also done extremely well. Currently, half
of all retail space in the county is located
within the transit corridor. The type of retail
around each station varies and includes
neighbourhood and regional goods. How-
ever, in 1999 the corridor was losing sales
to nearby areas. In response to this trend,
Market Common, a mixed-use centre adja-
cent to Clarendon Station, was designed to
attract shoppers to the area (Figure 14). In 2001, the first phase opened and included 300 apartments, 78 townhouses,
234,000 square feet of retail space, and 100,000 square feet of office space. This unique building was successful at
integrating pedestrian traffic with the vehicle traffic that had traditionally brought patrons to the area (Cervero, et al.,
2004). The next phase of Market Common successfully leased all its retail space before the project was even completed.
As a result, retail is doing extremely well in the Rosslyn-Ballston corridor thanks to the many consumers who live and
work in the area or arrive by transit.
Housing along the transit corridor has also done extremely well. What was once a low-density commercial artery
evolved into a high-density, mixed-use corridor. Since 1970, the number of housing units increased from a 7,000 to
26,752 (Arlington County, 2003). Since then, housing prices and rents rapidly increased, making the area far less afford-
able than it once was. However, the "Special Affordable Housing Protection District" was created to maintain a supply of
affordable units along the corridor. This district allowed high-density development, and density bonuses of 15% to 25%
encouraged developers to build affordable housing units within their projects. The Twin Oak project, for example, was an
Figure 14: Market Commons mixed-use centre in ClarendonSource: thecourtyard (2008) from www.flickr.com
BRINKLOW
47
18-storey building that contained 320 residential units and was built directly beside Rosslyn Station. The developer was
given a 100-unit density bonus to provide market-rate and affordable units within the same building (Cervero, et al.,
2004).
Rosslyn, Ballston and Clarendon are all neighbourhoods that have a strong sense of community. Clarendon Alli-
ance, for example, is a community organization that unites residents with business owners to discuss community issues
and market the community to neighbouring areas. Events promoted by the Alliance include a farmers' market, a Mardi
Gras celebration and the Clarendon Day festival each fall. The neighbourhood is also known for its ethnic restaurants
and vibrant nightlife, which draws outside residents to the area (Arlington County, 2010b). The Ballston-Virginia Square
Civic Association has also advocated for public participation in the community by distributing surveys about important
issues, organizing debates, and hosting meetings for proposed development plans in the community.
All three sampled TODs along the Rosslyn-Ballston corridor are high-density, mixed-use centres. In accordance
with the General Land Use Plan, all station development must include dense, mixed-use projects to ensure that each
station has a unique sense of community. The Rosslyn Station area, for example, was designated as the "Rosslyn Coor-
dinated Redevelopment District" to encourage physical and economic development around the station. Within this zone,
densities were increased and developers were given bonuses for projects that included a mix of uses, had entertainment
venues within them, or enhanced the pedestrian experience. In Clarendon, a "Special Coordinated Mixed-Use District"
was created to control the redevelopment of large sites around the station area. Ballston Station was designated a "Co-
ordinated Mixed-Use Development District" to create a balance between new residential development and employment
centres (Arlington County, 2010a). While the number of mixed-use units varied, each station had a substantial amount
of diversity between office, retail and residential uses. As a result, each station area was busy throughout the day, as
illustrated by the high number of boardings at off-peak hours.
The pedestrian experience is a vital part of the Rosslyn-Ballston corridor. WALKArlington was initiated by Arlington
County to improve residents' quality of life and make walking a pleasurable and efficient way of moving around the
city. The initiative called for a hierarchy of routes: major walkways, special pedestrian walks, lateral connections, special
neighbourhood walks, and special public places. A better pedestrian experience was not only achieved through design
improvements, but also through safer crossings, and better maintained infrastructure (McGregor & Bressi, 2001). In addi-
tion to the proposed routes, the initiative involved collaboration with the General Land Use Plan to set specific goals for
ground-floor activity, building materials and setbacks.
TRANSIT-ORIENTED DEVELOPMENT: A POLICY IMPLEMENTATION STRATEGY
48
Not only are the Arlington TODs prime examples of TOD, they also function as complete, urban communities. High-
quality transit, in conjunction with balanced uses and activities, make the Rosslyn-Ballston corridor stations ideal TODs.
These centres are busy throughout the day and act as origins and destinations for residents in Arlington County, as well
as those travelling to and from Washington, DC.
5.7 Evaluation of All TODs
The above case studies were evaluated based on the success criteria described in Chapter 3.3. Each TOD received a
grade for its transportation, economic, social and physical design performance, based on the data provided in Tables 4
through 20. If the TOD performed well, it was given a positive grade. If the TOD did not perform well in a category, it
was given a negative grade. For those which neither succeeded or failed, a neutral grade was assigned. Where data or
information was unavailable, no grade was given and the category was not considered in the final scoring. TODs deemed
'successful' were those which had the most positive scores. The scores are summarized in Table 21 and are be discussed
in this section, beginning with the transit-oriented communities deemed to be most successful.
According to the analysis in this report, the most successful TODs are those along the Rosslyn-Ballston corridor in
Arlington, Virginia. These station areas are high-density, mixed-use centres that utilize the existing transit line that runs
through them. Much of their success stems from the fact that they were built with all the necessary ingredients of an
ideal TOD: vertically mixed-use, affordable housing, and a strong pedestrian realm. Despite these elements, the success
of Rosslyn, Clarendon and Ballston is likely attributable to the construction of a commuter trolley at the end of the 19th
Century. For decades, these areas functioned as complete communities with access to transportation. As a result, not
only are the neighbourhoods close to transit, but it also functions as a 'place.' In addition to the coordinated efforts of
regional and local agencies, the success of these Arlington TODs stems from a long-lasting effort to integrate land use
and transportation.
Joyce/Collingwood Village in Vancouver is another example of a successful TOD. Unlike the TODs in Arlington,
Joyce/Collingwood Village was an old industrial town that was redeveloped as a new transit-oriented community. Many
residents use transit and walk to and from neighbourhood amenities, which is why the TOD is considered to be doing
well in terms of transportation behaviour. In particular, the city's commitment to the pedestrian and cycling experience
is unique from any other city sampled in this study. By encouraging walking and cycling, the City of Vancouver created a
neighbourhood where transit ridership naturally followed. The TOD is now a desirable place to live in Vancouver.
BRINKLOW
49
TODs in San Francisco and San Diego had mixed results. Berkeley, California, for example, fared well in terms of
ridership and the design of the neighbourhood, but failed to provide adequate affordable housing for low-income resi-
dents. Hayward and Fremont were considered unsuccessful according to the standards set in this study, largely due to
low transit use. These findings were consistent with the literature, which found the Berkeley TOD to be more successful
than the Hayward and Fremont TODs. In San Diego, American Plaza was the most successful TOD among Uptown District
and Rio Vista West, mainly due to transit ridership, economic success and the physical design of the area. In particular,
American Plaza was successful due to its high-density, compact character, which is attributable to its location within the
heart of San Diego. As these examples show, the most successful TODs (e.g. American Plaza, Berkeley) were areas that
already functioned as complete communities prior to the implementation of transit-oriented design.
New Jersey has some of the most transit-supportive policies in the country, thanks to the efforts of NJ Transit
which encouraged responsible development around transit stations. However, despite adequate transit ridership and
pedestrian-friendly design, the economic and social analysis in this report produced mixed results. Rahway, for example,
contained affordable housing units but Morristown and South Orange did not. In addition, the economic success of
these TODs remained inconclusive. However, several elements from the literature are evident in each TOD and the region-
al policy which drives these communities is the basis for many of the lessons learned in this report.
Orenco Station, which is considered one of the most successful TODs in the literature, did not fare well accord-
ing to the criteria set in this study. In particular, while transit ridership was high, the automobile-dependent nature of
the area made this TOD less successful. In addition, while housing was in high demand, few affordable housing options
were available for residents, making this area unattainable to the residents who need transit most. Finally, the physical
design of the area was consistent with the guidelines set out in the literature, yet residents still drove to the station and
in and around the community. The likely cause of this travel pattern is due to the fact that Orenco Station was a com-
munity that was designed and planned as a suburban neighbourhood around transit. Therefore, despite the fact that
development around the station is near transit, it failed to perform as a complete community.
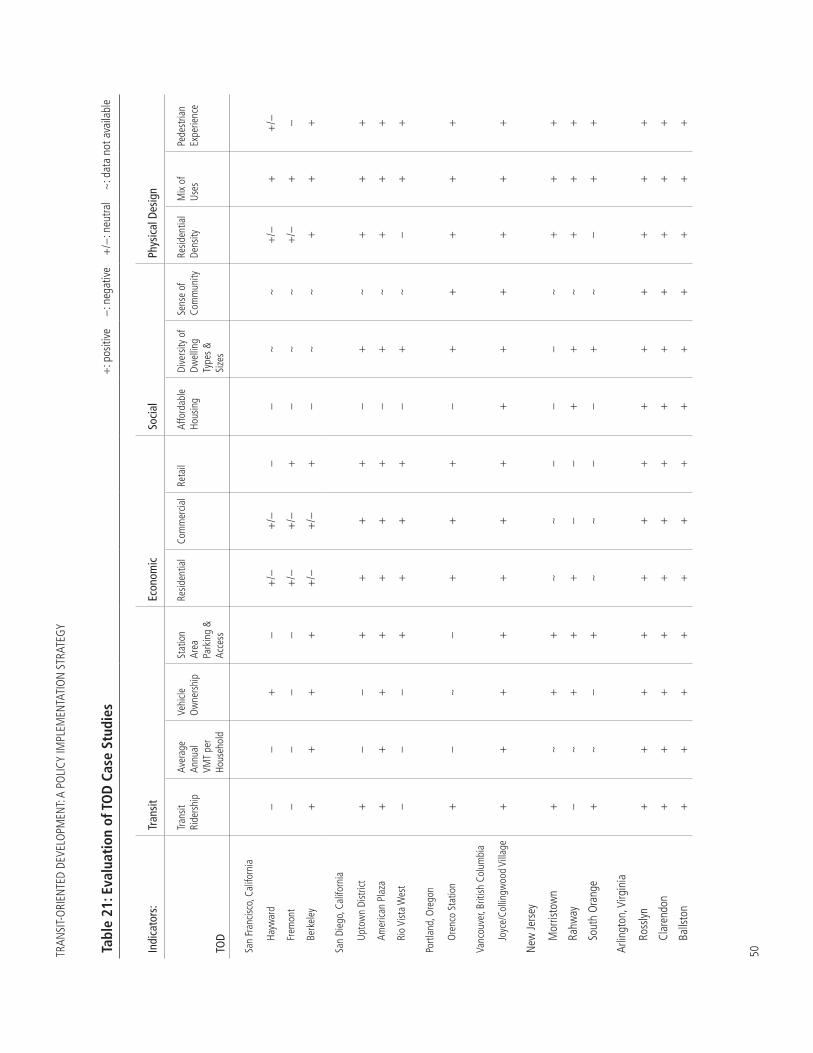
TRAN
SIT-
ORI
ENTE
D DE
VELO
PMEN
T: A
POLI
CY IM
PLEM
ENTA
TIO
N S
TRAT
EGY
50Tabl
e 21
: Eva
luat
ion
of T
OD
Cas
e St
udie
s+
: pos
itive
−
: neg
ativ
e +
/−: n
eutra
l ~
: dat
a no
t ava
ilabl
e
Indi
cato
rs:
Tran
sit
Econ
omic
Soci
alPh
ysic
al D
esig
n
TOD
Tran
sit
Ride
rshi
pAv
erag
e An
nual
VM
T pe
r Ho
useh
old
Vehi
cle
Ow
ners
hip
Stat
ion
Area
Pa
rkin
g &
Acce
ss
Resid
entia
lCo
mm
ercia
lRe
tail
Affo
rdab
le
Hous
ing
Dive
rsity
of
Dwel
ling
Type
s &
Size
s
Sens
e of
Co
mm
unity
Resid
entia
l De
nsity
Mix
of
Uses
Pede
stria
n Ex
perie
nce
San
Fran
cisco
, Cal
iforn
ia
Hayw
ard
−−
+−
+/−
+/−
−−
~~
+/−
++
/−
Frem
ont
−−
−−
+/−
+/−
+−
~~
+/−
+−
Berk
eley
++
++
+/−
+/−
+−
~~
++
+
San
Dieg
o, C
alifo
rnia
Upto
wn
Dist
rict
+−
−+
++
+−
+~
++
+
Amer
ican
Plaz
a+
++
++
++
−+
~+
++
Rio
Vist
a W
est
−−
−+
++
+−
+~
−+
+
Portl
and,
Ore
gon
Ore
nco
Stat
ion
+−
~−
++
+−
++
++
+
Vanc
ouve
r, Br
itish
Col
umbi
a
Joyc
e/Co
lling
woo
d Vi
llage
++
++
++
++
++
++
+
New
Jers
ey
Mor
risto
wn
+~
++
~~
−−
−~
++
+
Rahw
ay−
~+
++
−−
++
~+
++
Sout
h O
rang
e+
~−
+~
~−
−+
~−
++
Arlin
gton
, Virg
inia
Ross
lyn+
++
++
++
++
++
++
Clar
endo
n+
++
++
++
++
++
++
Balls
ton
++
++
++
++
++
++
+
BRINKLOW
51
06 LESSONS LEARNED
Whether it is called transit-oriented, transit-supportive, or transit-friendly, the integration of land use and transportation
is a concept being adopted by municipal and regional governments throughout North America. As the previous analysis
has shown, TOD can present itself in many shapes and sizes and can also exhibit varying results. TODs differ because the
policies and visions that originate from different government agencies also differ. This section explores the different les-
sons learned through expert interviews with some of the key players involved in TOD implementation, and summarizes
these findings into six lessons.
6.1 Lesson 1: Think Regionally
Transportation systems are rarely contained within the borders of one municipality. Roads, streets and highways connect
people and places with a seamless stream of infrastructure; never are you on a road that suddenly ends. Public trans-
portation, on the other hand, can provide challenging and sometimes frustrating experiences for travelers. Multi-modal
connections can be difficult to achieve and bus lines can suddenly end where the population or municipal jurisdiction no
longer supports the service. It is therefore extremely important to think of transit regionally and link all forms of transit
together in one coherent system. Connections across different transit authorities, across different modes, and across
different municipal boundaries should be made with the same flow and ease as our road infrastructure. Therefore, just as
our roads are governed at a regional level, so should the transit system.
In New Jersey, for example, one governing body is responsible for transit service throughout the entire state. NJ
Transit is a single entity that manages 566 municipalities and 21 counties. In addition, the agency has taken on the
responsibility of promoting specific development that capitalizes on the infrastructure that currently serves its popula-
tion. Therefore, there must be one vision that drives development in the region to ensure that all station areas are fully
capitalizing on their access to high-quality transit.
Since TOD is both a regional and local issue, regional transportation authorities must provide municipalities with
the polices and guidelines necessary to achieve the goals of both the region and the community. Planning for Transit-
Friendly Land Use: A Handbook for New Jersey Communities was created to plan communities in ways that create
vibrant pedestrian-friendly streetscapes that utilize the NJ Transit system. If transportation agencies desire efficient use
of the transit system, they must provide municipalities and local governments with the tools and resources necessary to
create successful TODs.
TRANSIT-ORIENTED DEVELOPMENT: A POLICY IMPLEMENTATION STRATEGY
52
6.2 Lesson 2: Provide Financial Incentives
Regional policies are often visionary documents based on best practices from model cities. Without funding, however,
municipalities are unable to meet the (often) expensive redevelopment schemes outlined in these plans. Some of the
most successful transit cities can attribute their success to the funding opportunities they received. In San Francisco,
for example, much of the region's TOD success was due to a livable communities grant provided by the transportation
commission to help finance streetscaping improvements and redevelopment. According to Mr. Johnson, infrastructure in
San Francisco is extremely expensive, sometimes costing up to $1 million for a one-block street improvement (personal
communication, 16 July 2010). Without regional funding, municipalities may not be able to afford the necessary street
improvements.
During an economic downturn, when every department's budget is being cut, it is difficult to think about finding
money to support transit-support design changes. However, the regional transportation agency benefits significantly
from growth around transit stations; more riders translates into a more efficient use of the infrastructure and savings
from not constructing new roads. Municipalities should be made to compete for funding opportunities to ensure that
there is commitment at the local level to integrate land use and the transportation system.
6.3 Lesson 3: Work Together
The basic theory behind TOD is that land use and transportation are both considered when developing a community
near a transit station. Therefore, the municipalities that determine and control land use policies must cooperate with
the agency in charge of the transit system. Since the agencies responsible for land use and transportation often differ,
coordination can be challenging. However, never before have policies been so comprehensive as to include a myriad
of issues that all interconnect with each other. Environmental, social, and economic issues are all considered when de-
veloping transportation policies. Therefore, governments must work together to ensure that policies and consistent and
comprehensive.
6.4 Lesson 4: Establish Guidelines
Among all TODs considered in this study, very little differed in terms of design guidelines. Each city's policies remained
true to the literature, encouraging high-density, mixed-use development around transit stations. Specific requirements
varied slightly from region to region, but the underlying principles remained the same. Peter Calthorpe's TOD design
BRINKLOW
53
guidelines, which were developed almost two decades ago, still provide a basis for TOD guidelines today. These design
guidelines provide an outline of what specific features a community should have to qualify as transit-oriented. Many re-
gional agencies require local areas to meet specific transit-oriented design criteria before funding or support is provided.
San Francisco, for example, developed TOD guidelines for property owners, developers and local government officials.
These guidelines aimed to promote vibrant and livable station areas that benefit both riders and the surrounding com-
munity, as well as encourage the use of the transit system. In New Jersey, a set of criteria was established and com-
munities are required to achieve a minimum score to qualify as a "Transit Village." Once this designation is obtained,
the municipality is eligible for assistance from the agencies that make up the Transit Village Task Force. In particular, the
Task Force provides technical and design guidelines for local neighbourhoods who would like to prioritize transit in their
communities.
6.5 Lesson 5: Create Complete Communities
TOD should be implemented in a way that creates a complete community. Several of the studied TODs in this report were
considered less successful because they did not demonstrate several of the fundamental elements of a complete com-
munity: local shopping, pleasant sidewalks or neighbourhood character. The most successful TODs, on the other hand,
were those that fared extremely well in terms of community and vibrant street activity. While these factors are often dif-
ficult to quantify, when we walk through lackluster cities, we can feel it. Vibrant places are therefore an essential part of
any TOD plan, as the only difference between a TOD and a lively urban centre should be the integration of high-quality
transit.
The City of Vancouver understands this concept and has worked to create policies that ensure that TODs are
just another part of an exciting, walkable city, instead of of an isolated neighbourhood around a transit station. As in
any complete community, there should be a balance of uses, respect for the area's history, and the densities required
to support an active community. Employment centres, for example, create significant ridership, but restrict ridership to
peak hours. The integration of other uses, such as housing and entertainment, transforms the area into an activity node
and ensures that the community and the transit system are used throughout the day. As in any community, residents
must have access to a variety of housing types that are affordable and meet their needs. A share of non-market housing
should be integrated into every development to ensure a sufficient supply of housing in the community. Municipalities
TRANSIT-ORIENTED DEVELOPMENT: A POLICY IMPLEMENTATION STRATEGY
54
should implement zoning and design requirements to ensure that the appropriate mix of uses and street infrastructure
exists to support a complete community.
6.6 Lesson 6: Put Walking First
The final lesson in this report is to prioritize the pedestrian. Regardless of our modal choice, every trip begins and ends
on foot. Many policy documents include pedestrian-friendly designs, such as tree-lined streets or zebra-crossings. How-
ever, suburban-style developments with these design elements remain car-dependent communities because they are still
designed for the car. If a TOD is to act as a true urban village, it must put walking first; streets must be welcoming to the
pedestrian and the streets must be appealing and safe. If neighbourhoods are built in a way that encourages people to
walk, transit use will naturally follow.
BRINKLOW
55
07 FURTHER RESEARCH
This report provides insight into the current TOD practices of selected regional and municipal governments. Much of the
existing literature has focused on what specific design elements are important in creating ideal TODs. However, what
these studies lack is an examination of how to make TOD succeed once the development is complete. This study has
attempted to assess some of the best examples of TODs based on their post-development performance, and outline the
lessons learned from these TODs. However, this study is not without its limitations. First, this report includes a limited
number of case studies which are clustered in two regional locations. Secondly, the indicators used to evaluate the
success of the case studies do not consider the relative importance of some factors over others. Thirdly, interviews were
limited to those who responded to interview requests. As a results, Arlington's policy lessons were not considered in
this report, despite its important contribution to TOD success. Finally, the case studies selected varied significantly: some
TODs were urban centres and contained several of the elements necessary for successful TOD (high-density, mixed-use,
etc.), while others were suburban areas transformed into TODs. In the suburban case, municipalities must create TODs
from scratch and implement many of the specific guidelines outlined in the literature. However, they run the risk of creat-
ing TODs like Orenco Station, which lacks the pedestrian-friendly environment of a traditional urban neighbourhood.
The challenge of creating successful TOD is different for every municipality and policy makers must fully understand the
context in which they are working.
TOD is not a panacea to post-war development. Even with access to transit, it is often more convenient for
residents in suburban neighbourhoods to drive. Curvilinear streets, wide boulevards and large parking lots create an
intimidating environment for pedestrians, and if residents do take transit, they often arrive to the station by car. However,
as cities continue to grow, municipalities must create transit-supportive policies that encourage residents to take transit
and begin thinking about transportation in different ways. TOD is therefore one way to encourage a shift away from
the private automobile and create more sustainable, attractive cities. However, in creating TODs, particularly those from
scratch, planners must challenge many of the suburban-style development practices that are currently ingrained in the
urban planning process. If done correctly, this generation of planners can be a part of a new era in city buildings.

BRINKLOW
57
08 REFERENCESArlington County. (2001). Rosslyn-Ballston Metro Corridor: Retail Action Plan.
Arlington County. (2003). 30 Years of Smart Growth: Arlington County's Experience with Transit-Oriented Development in the Rosslyn-Ballston Metro Corridor (PowerPoint Presentation). Arlington, VA.
Arlington County. (2010a). Special Planning Areas, Retrieved 19 July 2010, from http://www.co.arlington.va.us/Depart-ments/CPHD/planning/docs/CPHDPlanningDocsGLUP_metrocorridors.aspx
Arlington County. (2010b). Arlington's Urban Villages: About Clarendon, Retrieved 19 July 2010, from http://www.com-muterpage.com/
Arrington, G. B. (2000). Reinventing the American Dream of a Livable Community: Light Rail and Smart Growth in Portland, Washington, DC. Paper presented at the 8th Joint Conference on Light Rail Transit Investment for the Future.
Badoe, D. A., & Miller, E. J. (2000). Transportation Land-Use Interaction: Empirical Findings in North America, and their Implications for Modeling. Transportation Research Part D, 5(4), 235-263.
Bae, C. (2002). Orenco Station, Portland, Oregon: A Successful Transit-Oriented Development Experiment? Transportation Quarterly, 56(3), 9-18.
Bay Area Rapid Transit. (2010). Stations, Retrieved June 2010, from http://www.bart.gov/stations
Belzer, D., & Autler, G. (2002). Transit-Oriented Development: Moving from Rhetoric to Reality. Washington, DC: Brook-ings Institution Center on Urban and Metropolitan Policy.
Bernick, M., & Cervero, R. (1997). Transit Villages in the 21st Century. New York, NY: McGraw-Hill.
Boarnet, M. G., & Compin, N. S. (1999). Transit-Oriented Development in San Diego County: The Incremental Implemen-tation of a Planning Idea. Journal of the American Planning Association, 65(1), 80-95.
Boarnet, M. G., & Crane, R. (2001). Travel by Design: The Influence of Urban Form on Travel. New York, NY: Oxford University Press.
Boarnet, M. G., & Sarmiento, S. (1998). Can Land-Use Policy Really Affect Travel Behavior? A Study of the Link between Non-Work Travel and Land-Use Characteristics. Urban Studies, 35(7), 1155-1169.
California Department of Transportation. (2002). California Transit-Oriented Development Database, Retrieved May - June 2010, from http://transitorienteddevelopment.dot.ca.gov/miscellaneous/NewHome.jsp
Calthorpe, P. (1993). The Next American Metropolis: Ecology, Community, and the American Dream. New York, NY: Princeton Architectural Press.
Canada Mortgage and Housing Corporation. (2009). Transit-Oriented Development Case Study: Collingwood Village, Vancouver, BC.
Cascade Policy Institute. (2003). The Mythical World of Transit-Oriented Development: Light Rail and the Orenco Neigh-borhood, Hillsboro, Oregon. Portland, OR.
TRANSIT-ORIENTED DEVELOPMENT: A POLICY IMPLEMENTATION STRATEGY
58
Cervero, R. (1988). Land Use Mixing and Suburban Mobility. Transportation Quarterly, 42(3), 429-446.
Cervero, R. (1994). Transit-Based Housing in California: Evidence on Ridership Impacts. Transport Policy, 1(3), 174-183.
Cervero, R. (2004). Transit-Oriented Development in America: Contemporary Practices, Impacts and Policy Directions. Paper presented at the International Planning Symposium on Incentives, Regulations, and Plans - The Role of States and Nation-States in Smart Growth Planning.
Cervero, R., Bernick, M., & Gilbert, J. (1994). Market Opportunities and Barriers to Transit-Based Development in Califor-nia. Berkeley, CA: University of California Transportation Center.
Cervero, R., & Duncan, M. (2002). Benefits of Proximity to Rail on Housing Markets. Journal of Public Transportation, 5(1), 1-18.
Cervero, R., Ferrell, C., & Murphy, S. (2002). Transit-Oriented Development and Joint Development in the United States: A Literature Review.
Cervero, R., & Kockelman, K. (1997). Travel Demand and the 3 Ds: Density, Diversity and Design. Transportation Research Part D, 2(3), 199-219.
Cervero, R., Murphy, S., Ferrell, C., Goguts, N., & Tsai, Y. (2004). Transit-Oriented Development in the United States: Expe-riences, Challenges, and Prospects. Washington, DC: Transportation Research Board.
City of Vancouver. (2010). Understanding Vancouver: Information Sheets, Retrieved 20 July 2010
Corey Canapary & Galanis Research. (2008). 2008 BART Station Profile Study.
Costa Pacific Communities. (2010). Costa Pacific. Communities, Retrieved 9 June 2010
Coughlin, K. (2008, 14 September 2008). Motown Agency Provides Affordable Housing. NJ.com.
Crane, R. (1996). Cars and Drivers in the New Suburbs: Linking Access to Travel in Neotraditional Planning. Journal of the American Planning Association, 62, 51-65.
Dunphy, R. T. (2005). Shaping Land Use as if Transportation Mattered. Paper presented at the UDP Annual Symposium on "Rethinking Growth Management", Washington, DC.
Dunphy, R. T., Myerson, D. L., & Pawlukiewicz, M. (2003). Ten Principles for Successful Development Around Transit. Washington, DC: Urban Land Institute.
Easley, G. V. (1992). Staying Inside the Lines: Urban Growth Boundaries. Chicago, IL: American Planning Association.
Ewing, R., Pendall, R., & Chen, D. (2002). Measuring Sprawl and its Impacts. Washington, DC: Smart Growth America.
Federal Transit Administration. (2000). Transit Benefits 2000 Working Papers: A Public Choice Policy Analysis.
Frank, L. D., & Pivo, G. (1994). Impacts of Mixed-Use and Density on Utilization of Three Modes of Travel: Single-Occu-pant Vehicle, Transit, and Walking. Transportation Research Record(1466), 44-52.
Freilich, R. H. (1998). The Land-Use Implications of Transit-Oriented Development: Controlling the Demand Side of Trans-portation Congestion and Urban Sprawl. The Urban Lawyer, 30(3), 547-572.
BRINKLOW
59
Gehl, J. (1987). Life Between Buildings: Using Public Space. New York, NY: Van Nostrand Reinhold.
Government of Ontario. (2006). Growth Plan for the Greater Golden Horseshoe.
Greater Vancouver Regional District. (2009). Metro Vancouver 2040: Shaping our Future.
Haider, M., & Miller, E. J. (2000). Effects of Transportation Infrastructure and Location on Residential Real Estate Values: Application of Spatial Autoregressive Techniques. Transportation Research Record(1772), 1-8.
Handy, S. L., & Clifton, C. J. (2001). Local Shopping as a Strategy for Reducing Automobile Travel. Transportation, 28, 317-346.
Hock, J. (2000). Practice Theory Project Place: Fairview Village and Orenco Station. Places, 13(2), 16-25.
Jacobs, J. (1989). The Death and Life of Great American Cities. New York, NY: Random House.
Knaap, G. J., Ding, C., & Hopkins, L. D. (2001). Do Plans Matter?: The Effects of Light Rail Plans on Land Values in Station Areas. Journal of Planning Education and Research, 21, 32-39.
Krizek, K. J. (2000). Pretest-Posttest Strategy for Researching Neighborhood-Scale Urban Form and Travel Behavior. Transportation Research Record(1772), 48-55.
Krizek, K. J. (2003). Changes in Urban Travel: Does Neighborhood-Scale Urban Form Matter? Journal of the American Planning Association, 69(3), 265-281.
Kulash, W. M. (1990). Traditional Neighborhood Development: Will the Traffic Work? Paper presented at the 11th Annual Pedestrian Conference, Bellevue, WA.
Kuzmyak, R., & Pratt, R. (2003). Transit Cooperative Research Program Report 95. Washington, DC: Transportation Research Board.
Lewis-Workman, S., & Brod, D. (1997). Measuring the Neighborhood Benefits of Rail Transit Accessibility. Transportation Research Record(1576), 147-153.
Litman, T. (2005). Land Use Impacts on Transport: How Land Use Patterns Affect Travel Behavior. Victoria, BC: Victoria Transport Policy Institute.
Lund, H. M., Cervero, R., & Wilson, R. W. (2004). Travel Characteristics of Transit-Oriented Development in California. California, CA: California State Polytechnic University Pomona.
McGregor, J., & Bressi, T. W. (2001). WALKArlington: Places for Walking in the Rosslyn-Ballston Corridor. Arlington, VA.
Moudon, A. V., Hess, P. M., Snyder, M. C., & Stanilov, K. (1997). Effects of Site Design on Pedestrian Travel in Mixed-Use, Medium-Density Environments. Transportation Research Record(1578), 48-55.
Nelson, D., & Niles, J. (1999). Market Dynamics and Nonwork Travel Patterns: Obstacles to Transit-Oriented Develop-ment? Transportation Research Record(1669), 13-21.
Nelson, D., Niles, J., & Hibshoosh, A. (2001). A New Planning Template for Transit-Oriented Development. San José, CA: Mineta Transportation Institute College of Business, San José State University.
TRANSIT-ORIENTED DEVELOPMENT: A POLICY IMPLEMENTATION STRATEGY
60
Newman, P., & Kenworthy, P. (1999). Sustainability and Cities: Overcoming Automobile Dependence. Washington, DC: Island Press.
Newman, P., & Kenworthy, P. (2006). Urban Design to Reduce Automobile Dependence. Opolis, 2(1), 35-51.
Niles, J., & Nelson, D. (1999). Measuring the Success of Transit-Oriented Development: Retail Market Dynamics and Other Key Determinants. Paper presented at the APA National Planning Conference, Seattle, WA.
NJ Transit. (1994). Building a Transit-Friendly Community.
NJ Transit. (2010). Schedule & Fares: Trip Planner, Retrieved 10 July 2010
Parker, T., Mayer, D., Arrington, G. B., & Smith-Heimer, J. (2002). Statewide Transit-Oriented Development Study Factors for Success in California: Final Report.
Parsons, B., Boroski, J., Faulkner, T., & Arrington, G. B. (2002). Statewide Transit-Oriented Development (TOD) Study: Fac-tors for Success in California. Parking and TOD: Challenges and Opportunities (Special Report).
Personal Communication. (13 July 2010). Baker, V E. Newark NJ.
Personal Communication. (16 July 2010). Johnson, D. Oakland, CA.
Personal Communication. (20 July 2010a). Bailey, J. Vancouver, BC.
Personal Communication. (20 July 2010b). Bragado, N. San Diego, CA.
Podobnik, B. (2002a). Portland Neighborhood Survey, Report on Findings from Zone 2: Orenco Station. Portland, OR: Lewis & Clark College.
Podobnik, B. (2002b). The Social and Environmental Achievements of New Urbanism: Evidence from Orenco Station. Portland, OR: Department of Sociology, Lewis & Clark College.
Pushkarev, B. S., & Zupan, J. M. (1977). Public Transportation and Land Use Policy. Bloomington, IN: Indiana University Press.
Renne, J. L. (2005). Transit-Oriented Development: Measuring Benefits, Analyzing Trends, and Evaluating Policy. The State University of New Jersey, New Brunswick, NJ.
Renne, J. L. (2009). From Transit-Adjacent to Transit-Oriented Development. Local Environment, 14(1), 1-15.
Renne, J. L., & Wells, J. S. (2002). State of the Literature: Transit-Oriented Development, Assessing the Impacts of the New Jersey Transit Village Initiative. New Brunswick, NJ: Alan M Voorhees Transportation Centre, Edward J Bloustein School of Planning and Public Policy, Rutgers University.
Renne, J. L., & Wells, J. S. (2004). Emerging European-Style Planning in the USA: Transit-Oriented Development. World Transport Policy & Practice, 10(2), 12-24.
Renne, J. L., & Wells, J. S. (2005). Transit-Oriented Development: Developing a Strategy to Measure Success. Washington, DC: Transportation Research Board.
BRINKLOW
61
Roewe, M. (6 February 2010). Transit Station Areas Shaping Vancouver, BC. Vancouver, BC: New Partners for Smart Growth Conference.
Rofo. (2010). Office Space Search, Retrieved 10 June 2010, from http://www.rofo.com
Tumlin, J., & Millard-Ball, A. (2003). How to Make Transit-Oriented Development Work. Planning, 69, 14-19.
US Census Bureau. (2008). State & County QuickFacts, Retrieved June 2010, from http://quickfacts.censusus.gov
US Census Bureau. (2009). Annual Estimates of the Population of CSAs: April 1, 2000 to July 1, 2009.
Washington Metropolitan Area Transit Authority. (2008). Metrorail Station Access & Capacity Study.
Washington Metropolitan Area Transit Authority. (2010). Metrorail: Daily Parking, 19 July 2010, from http://www.wmata.com/rail/station_detail.cfm?station_id=41
Wells, J. S., & Renne, J. L. (2003). Demographics of the New Jersey Transit Villages. New Brunswick, NJ: Alan M Voorhees Transportation Center, Edward J Bloustein School of Planning and Public Policy, Rutgers University.

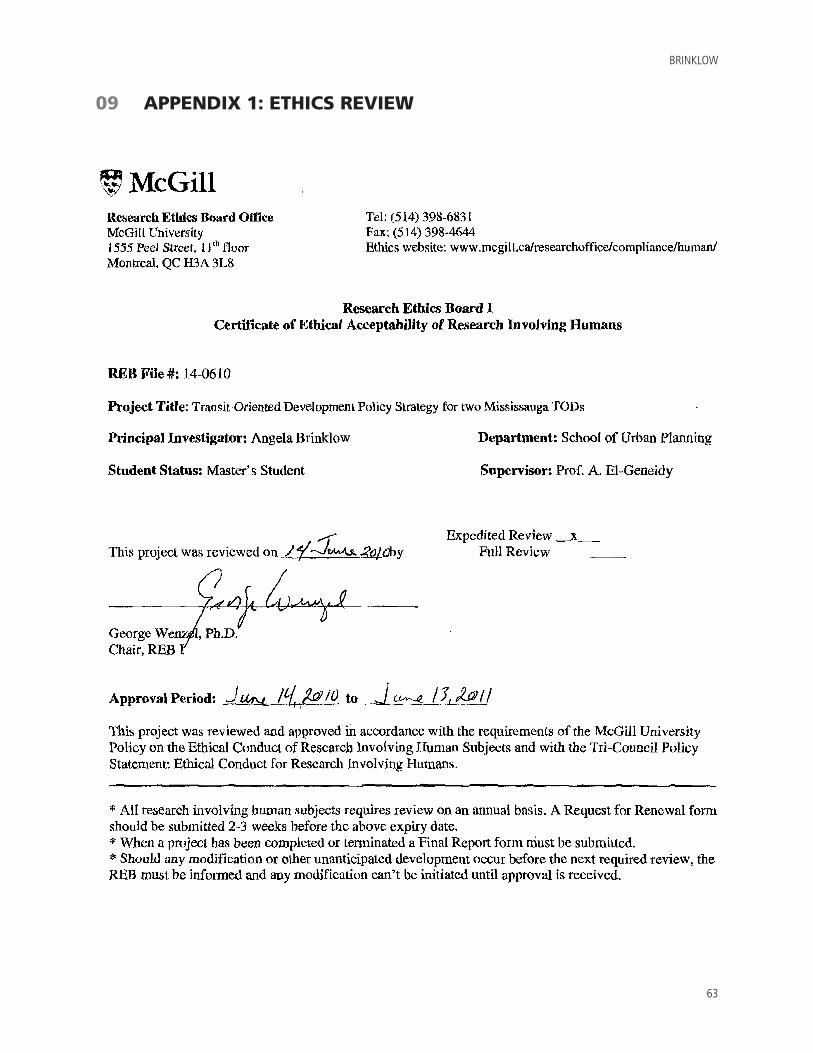
BRINKLOW
63
09 APPENDIX 1: ETHICS REVIEW