Embed Size (px)
Citation preview
tters 245 (2006) 232–244www.elsevier.com/locate/epsl
Earth and Planetary Science Le
Transient formation fluid pressures and temperatures in theCosta Rica forearc prism and subducting oceanic basement:
CORK monitoring at ODP Sites 1253 and 1255
Earl E. Davis a,⁎, Heinrich W. Villinger b
a Pacific Geoscience Centre, Geological Survey of Canada, Sidney, BC, Canada V8L 4B2b Fachbereich Geowissenschaften, University of Bremen, 28334 Bremen, Germany
Received 11 July 2005; received in revised form 23 February 2006; accepted 24 February 2006Available online 17 April 2006
Editor: H. Elderfield
Abstract
Seafloor and formation-fluid pressure data from two Ocean Drilling Program (ODP) borehole hydrologic observatories installedat the toe of the subduction-zone prism off Costa Rica provide new information about the average and transient state of this non-accretionary prism. Data collected to date span a 16-month period from the time of installation during ODP Leg 205 in late 2002 tothe most recent submersible site visit in March 2004. Pressure monitoring is part of a larger coordinated effort involvingtemperature monitoring and continuous fluid sampling within the formation and at the seafloor. The holes are positioned 800mapart and monitoring points include two in igneous basement just seaward of the prism toe, one in the decollement that separatesthe underthrust sediments of the incoming Cocos plate from the Costa Rica prism, and one in the overthrust-prism sediments.Response of formation-fluid pressure to oceanographic loading at the seafloor constrains the framework compressibility ofbasement (ca. 1.1–1.3×10⁻¹⁰ Pa− 1) and the prism and decollement sediments (ca. 4–7×10− 9 Pa− 1). Values are equivalent to onesdetermined elsewhere in similar sections. Once effects of seafloor loading are removed, pressures at both basement levels are seento be steady, nearly identical, and less than but very close to hydrostatic (−6kPa). This state probably reflects the localhydrothermal regime of the oceanic crust, not the hydrologic regime of the consolidating subduction complex, and is consistentwith basement being highly permeable and hydrologically well connected to distant igneous outcrops where free exchange of waterbetween the crust and the ocean can occur. To what depth in the subduction zone high basement permeability persists is not known,but until permeability is reduced by alteration or mechanical fracture closure, basement must serve to provide a drainage path forwater expelled from the consolidating underthrust sedimentary section. The decollement and overlying prism are observed to besuperhydrostatic, although not highly so during this phase of observation. Pressures (expressed as the pore pressure ratio) rangefrom λ⁎≈0.25 at the decollement early in the monitoring period to ≈0.1 in the overlying prism at the end of the monitoring period.The cause of the initially elevated pressures is not known. If generated by contractional strain, elevated pressures appear not to bemaintained for long periods of time at these lithologic/structural levels. The cause of the decline in pressure is also not known; itmay be the consequence of strain relaxation or hydrologic drainage. No observations were made in the underthrust sediments,where greater hydrologic isolation may allow higher average pressures and transient pressures of greater amplitude and persistence.Two minor transients were observed at the decollement- and prism-monitoring levels that correlate with deformational events thatoccurred during a GPS monitoring experiment on the Nicoya Peninsula. One of these is inferred by Protti et al. [M. Protti, T.
⁎ Corresponding author. Fax: +1 250 363 6565.E-mail address: [email protected] (E.E. Davis).
0012-821X/$ - see front matter © 2006 Elsevier B.V. All rights reserved.doi:10.1016/j.epsl.2006.02.042
233E.E. Davis, H.W. Villinger / Earth and Planetary Science Letters 245 (2006) 232–244
Gonzalez, T. Kato, T. Iinuma, S. Miyazaki, K. Obana, Y. Kaneda, P. LaFemina, T. Dixon, S. Schwartz, A creep event on theshallow interface of the Nicoya Peninsula, Costa Rica seismogenic zone, EOS, Trans. Am. Geophys. Union, Fall Meeting Programwith Abstracts, 85 (2004) F1378; M. Protti, P. LaFemina, V. Gonzalez, T.H. Dixon, S.Y. Schwartz, T. Kato, T. Iinuma, S. Miyazaki,K. Obana, Y. Kaneda, A possible slow slip event within the seismogenic zone, Nicoya peninsula, Costa Rica, Geophys. Res. Lett.(submitted for publication)] to have propagated some 60km to the northeast across the peninsula over the course of 2–3weeks. Thepressure transients at the ODP drill sites, located roughly 60km offshore, began on May 24 and October 12, 2003, also 2–3weeksafter the initiation of the GPS-recorded Nicoya strain events at the coast. Propagation of dislocations updip (offshore) as well asdowndip along the subduction thrust may be the cause of these transients.© 2006 Elsevier B.V. All rights reserved.
Keywords: ODP Leg 205; non-accretionary prisms; formation fluid pressure; Costa Rica prism
1. Background and site description
Ocean Drilling Program (ODP) Leg 205 was devotedto the study of mass and geochemical fluxes, and tectonicand hydrological processes at the Central Americansubduction zone off the Nicoya Peninsula, Costa Rica,where all of the incoming sediment section resting on theoceanic crust of the Cocos plate is initially subductedbeneath the adjacent continental margin [3,4]. The depth
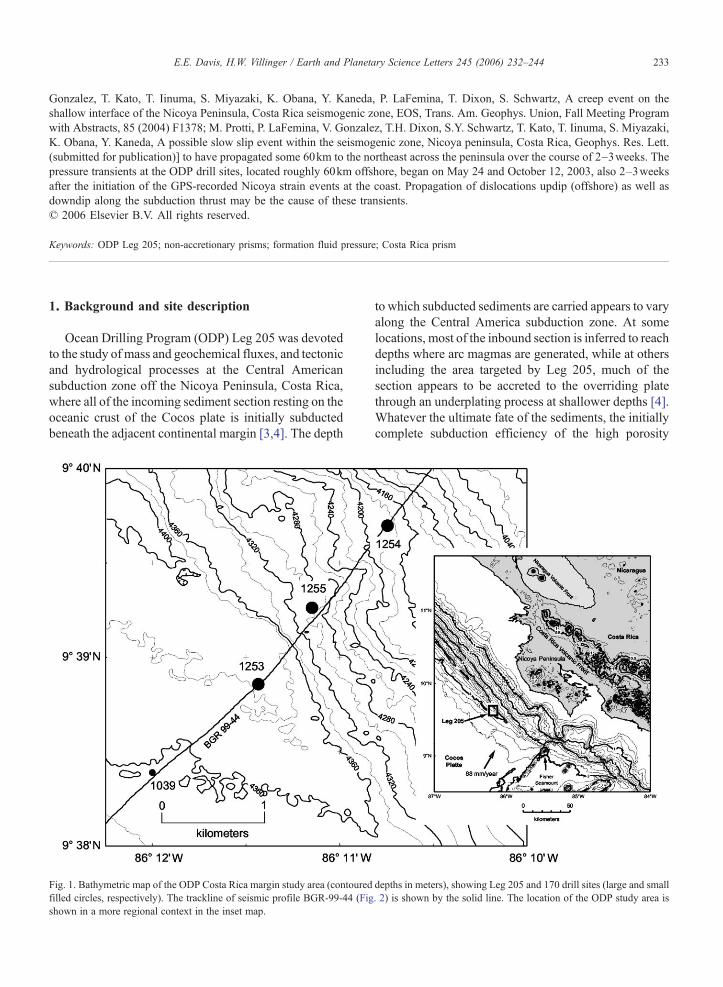
Fig. 1. Bathymetric map of the ODP Costa Rica margin study area (contouredfilled circles, respectively). The trackline of seismic profile BGR-99-44 (Figshown in a more regional context in the inset map.
to which subducted sediments are carried appears to varyalong the Central America subduction zone. At somelocations, most of the inbound section is inferred to reachdepths where arc magmas are generated, while at othersincluding the area targeted by Leg 205, much of thesection appears to be accreted to the overriding platethrough an underplating process at shallower depths [4].Whatever the ultimate fate of the sediments, the initiallycomplete subduction efficiency of the high porosity
depths in meters), showing Leg 205 and 170 drill sites (large and small. 2) is shown by the solid line. The location of the ODP study area is
234 E.E. Davis, H.W. Villinger / Earth and Planetary Science Letters 245 (2006) 232–244
sediments creates a situation in which large volumes ofpore water must be expelled from the underthrust sectionas subduction proceeds and sediments consolidate.Many of the goals of Leg 205 were directed to definingrates and routes of water expulsion, the chemicalinfluence of the flow, and the state of pressure and itsinfluence on mechanical properties, deformation, andseismogenic failure of the formation [4].
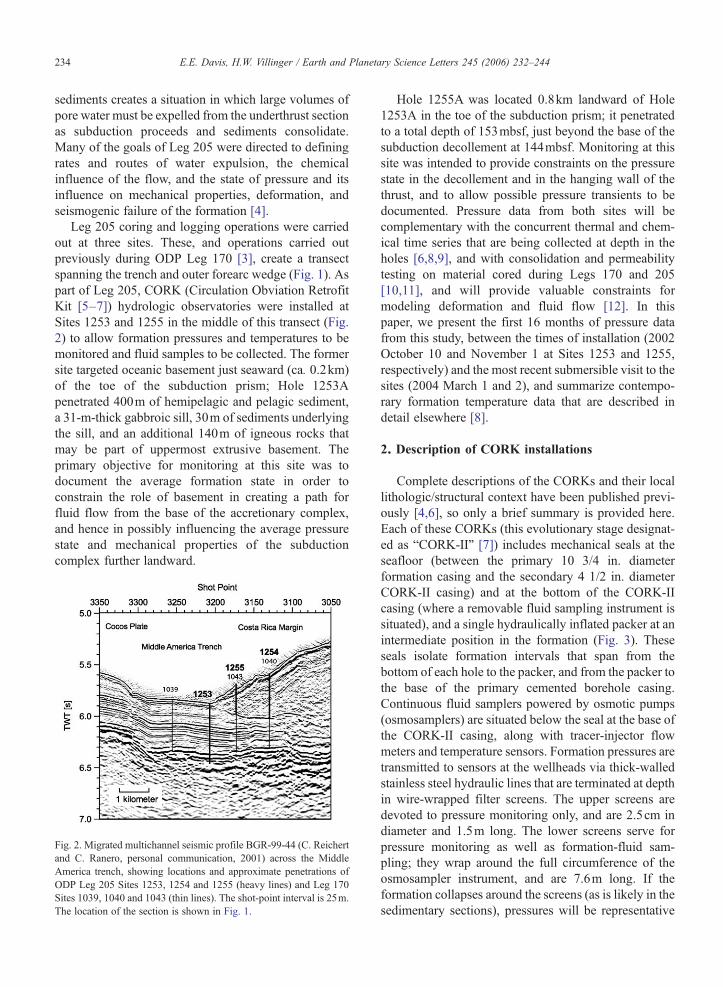
Leg 205 coring and logging operations were carriedout at three sites. These, and operations carried outpreviously during ODP Leg 170 [3], create a transectspanning the trench and outer forearc wedge (Fig. 1). Aspart of Leg 205, CORK (Circulation Obviation RetrofitKit [5–7]) hydrologic observatories were installed atSites 1253 and 1255 in the middle of this transect (Fig.2) to allow formation pressures and temperatures to bemonitored and fluid samples to be collected. The formersite targeted oceanic basement just seaward (ca. 0.2km)of the toe of the subduction prism; Hole 1253Apenetrated 400m of hemipelagic and pelagic sediment,a 31-m-thick gabbroic sill, 30m of sediments underlyingthe sill, and an additional 140m of igneous rocks thatmay be part of uppermost extrusive basement. Theprimary objective for monitoring at this site was todocument the average formation state in order toconstrain the role of basement in creating a path forfluid flow from the base of the accretionary complex,and hence in possibly influencing the average pressurestate and mechanical properties of the subductioncomplex further landward.
Fig. 2. Migrated multichannel seismic profile BGR-99-44 (C. Reichertand C. Ranero, personal communication, 2001) across the MiddleAmerica trench, showing locations and approximate penetrations ofODP Leg 205 Sites 1253, 1254 and 1255 (heavy lines) and Leg 170Sites 1039, 1040 and 1043 (thin lines). The shot-point interval is 25m.The location of the section is shown in Fig. 1.
Hole 1255A was located 0.8km landward of Hole1253A in the toe of the subduction prism; it penetratedto a total depth of 153mbsf, just beyond the base of thesubduction decollement at 144mbsf. Monitoring at thissite was intended to provide constraints on the pressurestate in the decollement and in the hanging wall of thethrust, and to allow possible pressure transients to bedocumented. Pressure data from both sites will becomplementary with the concurrent thermal and chem-ical time series that are being collected at depth in theholes [6,8,9], and with consolidation and permeabilitytesting on material cored during Legs 170 and 205[10,11], and will provide valuable constraints formodeling deformation and fluid flow [12]. In thispaper, we present the first 16 months of pressure datafrom this study, between the times of installation (2002October 10 and November 1 at Sites 1253 and 1255,respectively) and the most recent submersible visit to thesites (2004 March 1 and 2), and summarize contempo-rary formation temperature data that are described indetail elsewhere [8].
2. Description of CORK installations
Complete descriptions of the CORKs and their locallithologic/structural context have been published previ-ously [4,6], so only a brief summary is provided here.Each of these CORKs (this evolutionary stage designat-ed as “CORK-II” [7]) includes mechanical seals at theseafloor (between the primary 10 3/4 in. diameterformation casing and the secondary 4 1/2 in. diameterCORK-II casing) and at the bottom of the CORK-IIcasing (where a removable fluid sampling instrument issituated), and a single hydraulically inflated packer at anintermediate position in the formation (Fig. 3). Theseseals isolate formation intervals that span from thebottom of each hole to the packer, and from the packer tothe base of the primary cemented borehole casing.Continuous fluid samplers powered by osmotic pumps(osmosamplers) are situated below the seal at the base ofthe CORK-II casing, along with tracer-injector flowmeters and temperature sensors. Formation pressures aretransmitted to sensors at the wellheads via thick-walledstainless steel hydraulic lines that are terminated at depthin wire-wrapped filter screens. The upper screens aredevoted to pressure monitoring only, and are 2.5cm indiameter and 1.5m long. The lower screens serve forpressure monitoring as well as formation-fluid sam-pling; they wrap around the full circumference of theosmosampler instrument, and are 7.6m long. If theformation collapses around the screens (as is likely in thesedimentary sections), pressures will be representative
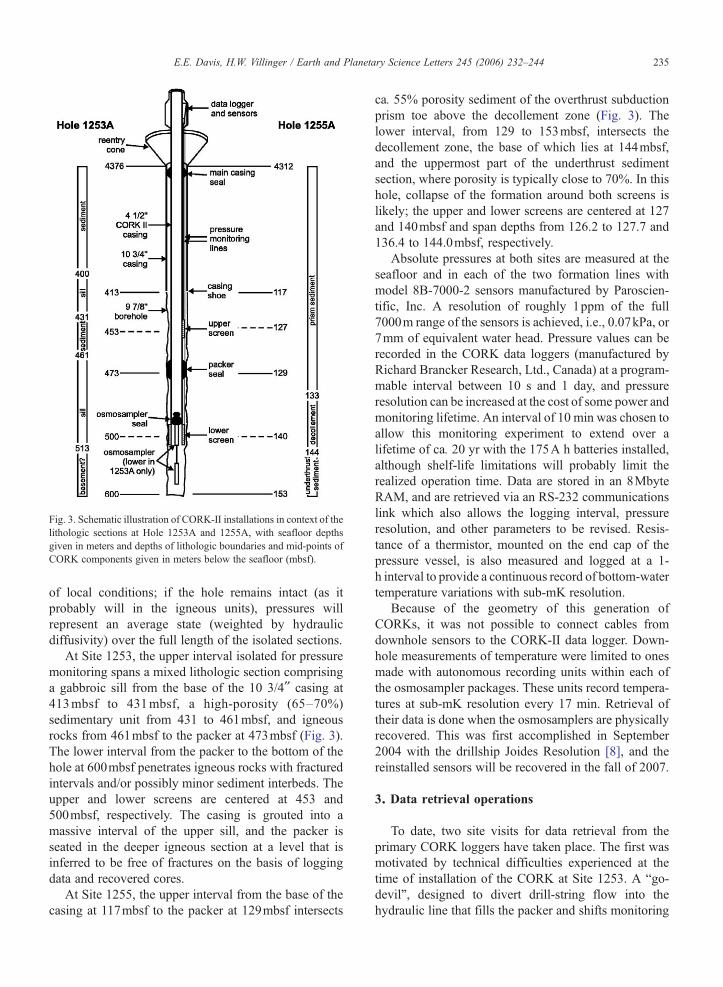
Fig. 3. Schematic illustration of CORK-II installations in context of thelithologic sections at Hole 1253A and 1255A, with seafloor depthsgiven in meters and depths of lithologic boundaries and mid-points ofCORK components given in meters below the seafloor (mbsf).
235E.E. Davis, H.W. Villinger / Earth and Planetary Science Letters 245 (2006) 232–244
of local conditions; if the hole remains intact (as itprobably will in the igneous units), pressures willrepresent an average state (weighted by hydraulicdiffusivity) over the full length of the isolated sections.
At Site 1253, the upper interval isolated for pressuremonitoring spans a mixed lithologic section comprisinga gabbroic sill from the base of the 10 3/4ʺ casing at413mbsf to 431mbsf, a high-porosity (65–70%)sedimentary unit from 431 to 461mbsf, and igneousrocks from 461mbsf to the packer at 473mbsf (Fig. 3).The lower interval from the packer to the bottom of thehole at 600mbsf penetrates igneous rocks with fracturedintervals and/or possibly minor sediment interbeds. Theupper and lower screens are centered at 453 and500mbsf, respectively. The casing is grouted into amassive interval of the upper sill, and the packer isseated in the deeper igneous section at a level that isinferred to be free of fractures on the basis of loggingdata and recovered cores.
At Site 1255, the upper interval from the base of thecasing at 117mbsf to the packer at 129mbsf intersects
ca. 55% porosity sediment of the overthrust subductionprism toe above the decollement zone (Fig. 3). Thelower interval, from 129 to 153mbsf, intersects thedecollement zone, the base of which lies at 144mbsf,and the uppermost part of the underthrust sedimentsection, where porosity is typically close to 70%. In thishole, collapse of the formation around both screens islikely; the upper and lower screens are centered at 127and 140mbsf and span depths from 126.2 to 127.7 and136.4 to 144.0mbsf, respectively.
Absolute pressures at both sites are measured at theseafloor and in each of the two formation lines withmodel 8B-7000-2 sensors manufactured by Paroscien-tific, Inc. A resolution of roughly 1ppm of the full7000m range of the sensors is achieved, i.e., 0.07kPa, or7mm of equivalent water head. Pressure values can berecorded in the CORK data loggers (manufactured byRichard Brancker Research, Ltd., Canada) at a program-mable interval between 10 s and 1 day, and pressureresolution can be increased at the cost of some power andmonitoring lifetime. An interval of 10 min was chosen toallow this monitoring experiment to extend over alifetime of ca. 20 yr with the 175A h batteries installed,although shelf-life limitations will probably limit therealized operation time. Data are stored in an 8MbyteRAM, and are retrieved via an RS-232 communicationslink which also allows the logging interval, pressureresolution, and other parameters to be revised. Resis-tance of a thermistor, mounted on the end cap of thepressure vessel, is also measured and logged at a 1-h interval to provide a continuous record of bottom-watertemperature variations with sub-mK resolution.
Because of the geometry of this generation ofCORKs, it was not possible to connect cables fromdownhole sensors to the CORK-II data logger. Down-hole measurements of temperature were limited to onesmade with autonomous recording units within each ofthe osmosampler packages. These units record tempera-tures at sub-mK resolution every 17 min. Retrieval oftheir data is done when the osmosamplers are physicallyrecovered. This was first accomplished in September2004 with the drillship Joides Resolution [8], and thereinstalled sensors will be recovered in the fall of 2007.
3. Data retrieval operations
To date, two site visits for data retrieval from theprimary CORK loggers have taken place. The first wasmotivated by technical difficulties experienced at thetime of installation of the CORK at Site 1253. A “go-devil”, designed to divert drill-string flow into thehydraulic line that fills the packer and shifts monitoring
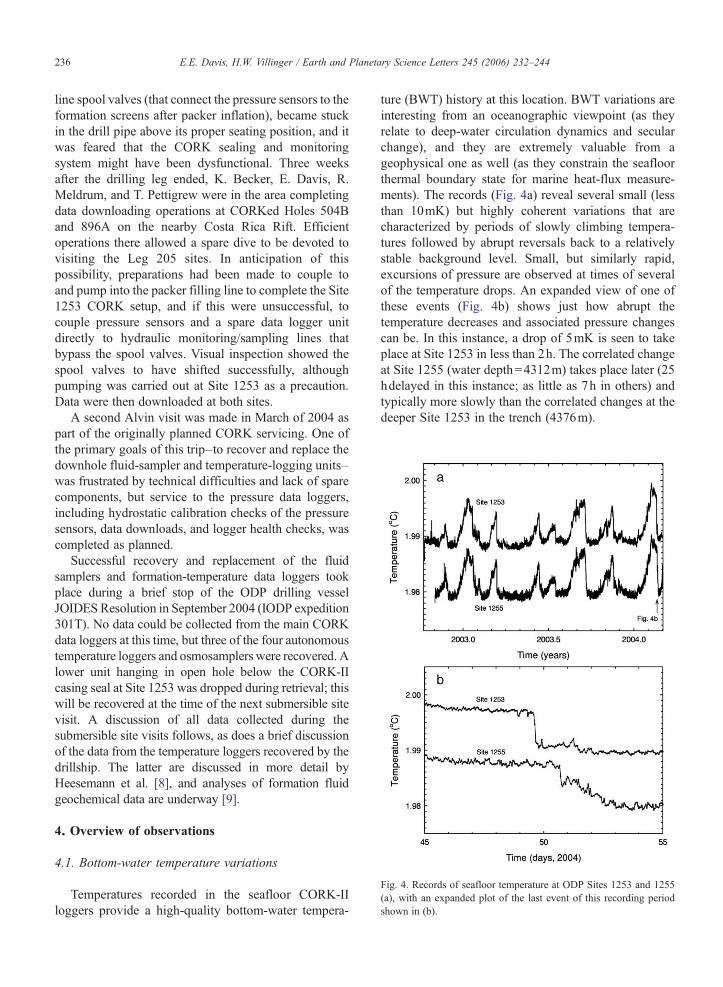
Fig. 4. Records of seafloor temperature at ODP Sites 1253 and 1255(a), with an expanded plot of the last event of this recording periodshown in (b).
236 E.E. Davis, H.W. Villinger / Earth and Planetary Science Letters 245 (2006) 232–244
line spool valves (that connect the pressure sensors to theformation screens after packer inflation), became stuckin the drill pipe above its proper seating position, and itwas feared that the CORK sealing and monitoringsystem might have been dysfunctional. Three weeksafter the drilling leg ended, K. Becker, E. Davis, R.Meldrum, and T. Pettigrew were in the area completingdata downloading operations at CORKed Holes 504Band 896A on the nearby Costa Rica Rift. Efficientoperations there allowed a spare dive to be devoted tovisiting the Leg 205 sites. In anticipation of thispossibility, preparations had been made to couple toand pump into the packer filling line to complete the Site1253 CORK setup, and if this were unsuccessful, tocouple pressure sensors and a spare data logger unitdirectly to hydraulic monitoring/sampling lines thatbypass the spool valves. Visual inspection showed thespool valves to have shifted successfully, althoughpumping was carried out at Site 1253 as a precaution.Data were then downloaded at both sites.
A second Alvin visit was made in March of 2004 aspart of the originally planned CORK servicing. One ofthe primary goals of this trip–to recover and replace thedownhole fluid-sampler and temperature-logging units–was frustrated by technical difficulties and lack of sparecomponents, but service to the pressure data loggers,including hydrostatic calibration checks of the pressuresensors, data downloads, and logger health checks, wascompleted as planned.
Successful recovery and replacement of the fluidsamplers and formation-temperature data loggers tookplace during a brief stop of the ODP drilling vesselJOIDES Resolution in September 2004 (IODP expedition301T). No data could be collected from the main CORKdata loggers at this time, but three of the four autonomoustemperature loggers and osmosamplers were recovered. Alower unit hanging in open hole below the CORK-IIcasing seal at Site 1253 was dropped during retrieval; thiswill be recovered at the time of the next submersible sitevisit. A discussion of all data collected during thesubmersible site visits follows, as does a brief discussionof the data from the temperature loggers recovered by thedrillship. The latter are discussed in more detail byHeesemann et al. [8], and analyses of formation fluidgeochemical data are underway [9].
4. Overview of observations
4.1. Bottom-water temperature variations
Temperatures recorded in the seafloor CORK-IIloggers provide a high-quality bottom-water tempera-
ture (BWT) history at this location. BWT variations areinteresting from an oceanographic viewpoint (as theyrelate to deep-water circulation dynamics and secularchange), and they are extremely valuable from ageophysical one as well (as they constrain the seafloorthermal boundary state for marine heat-flux measure-ments). The records (Fig. 4a) reveal several small (lessthan 10mK) but highly coherent variations that arecharacterized by periods of slowly climbing tempera-tures followed by abrupt reversals back to a relativelystable background level. Small, but similarly rapid,excursions of pressure are observed at times of severalof the temperature drops. An expanded view of one ofthese events (Fig. 4b) shows just how abrupt thetemperature decreases and associated pressure changescan be. In this instance, a drop of 5mK is seen to takeplace at Site 1253 in less than 2h. The correlated changeat Site 1255 (water depth=4312m) takes place later (25hdelayed in this instance; as little as 7h in others) andtypically more slowly than the correlated changes at thedeeper Site 1253 in the trench (4376m).
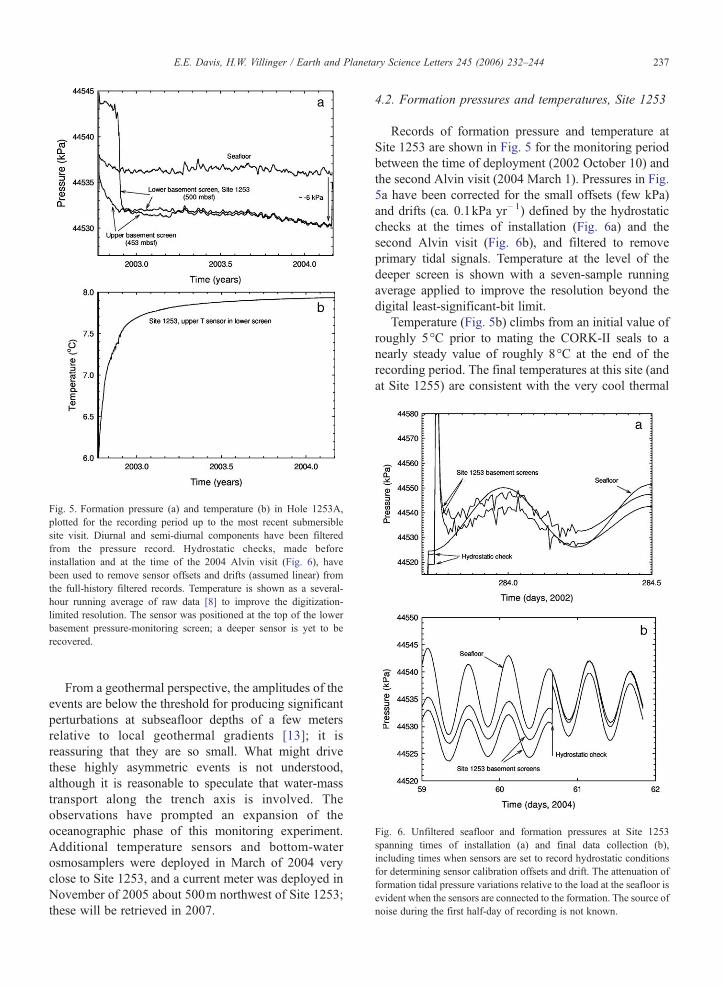
Fig. 5. Formation pressure (a) and temperature (b) in Hole 1253A,plotted for the recording period up to the most recent submersiblesite visit. Diurnal and semi-diurnal components have been filteredfrom the pressure record. Hydrostatic checks, made beforeinstallation and at the time of the 2004 Alvin visit (Fig. 6), havebeen used to remove sensor offsets and drifts (assumed linear) fromthe full-history filtered records. Temperature is shown as a several-hour running average of raw data [8] to improve the digitization-limited resolution. The sensor was positioned at the top of the lowerbasement pressure-monitoring screen; a deeper sensor is yet to berecovered.
Fig. 6. Unfiltered seafloor and formation pressures at Site 1253spanning times of installation (a) and final data collection (b),including times when sensors are set to record hydrostatic conditionsfor determining sensor calibration offsets and drift. The attenuation offormation tidal pressure variations relative to the load at the seafloor isevident when the sensors are connected to the formation. The source ofnoise during the first half-day of recording is not known.
237E.E. Davis, H.W. Villinger / Earth and Planetary Science Letters 245 (2006) 232–244
From a geothermal perspective, the amplitudes of theevents are below the threshold for producing significantperturbations at subseafloor depths of a few metersrelative to local geothermal gradients [13]; it isreassuring that they are so small. What might drivethese highly asymmetric events is not understood,although it is reasonable to speculate that water-masstransport along the trench axis is involved. Theobservations have prompted an expansion of theoceanographic phase of this monitoring experiment.Additional temperature sensors and bottom-waterosmosamplers were deployed in March of 2004 veryclose to Site 1253, and a current meter was deployed inNovember of 2005 about 500m northwest of Site 1253;these will be retrieved in 2007.
4.2. Formation pressures and temperatures, Site 1253
Records of formation pressure and temperature atSite 1253 are shown in Fig. 5 for the monitoring periodbetween the time of deployment (2002 October 10) andthe second Alvin visit (2004 March 1). Pressures in Fig.5a have been corrected for the small offsets (few kPa)and drifts (ca. 0.1kPa yr− 1) defined by the hydrostaticchecks at the times of installation (Fig. 6a) and thesecond Alvin visit (Fig. 6b), and filtered to removeprimary tidal signals. Temperature at the level of thedeeper screen is shown with a seven-sample runningaverage applied to improve the resolution beyond thedigital least-significant-bit limit.
Temperature (Fig. 5b) climbs from an initial value ofroughly 5°C prior to mating the CORK-II seals to anearly steady value of roughly 8°C at the end of therecording period. The final temperatures at this site (andat Site 1255) are consistent with the very cool thermal

238 E.E. Davis, H.W. Villinger / Earth and Planetary Science Letters 245 (2006) 232–244
state of the prism and the incoming Cocos platedetermined previously from seafloor heat flux anddrilling observations [3,14,15]. The low conductive heatflux through the sediments (<10mW m− 2) relative tothat from the 24-Ma lithosphere beneath (ca. 100mWm− 2) is attributed to the combination of efficientadvective heat exchange between the igneous crustand ocean via ventilation at distant basement outcropsand rapid lateral advective mixing or flow in the crustbeneath the low-permeability sediment cover. The coolinitial conditions in the hole and long recovery time areprobably consequences of flow of cold seawater downthe hole and into the formation prior to CORK sealing.Preliminary results from the first phase of fluid samplingin Site 1253 support this inference (G. Wheat and M.Kastner, personal communication, 2005). Initial coolingand long recovery times are common in holes completedin underpressured permeable formations. They resultfrom the large volumes of seawater that invade theformation via the hydraulic short circuits through thelow permeability sediment cover created by the bore-holes prior to sealing [16–19].
Several aspects of the pressure record are currentlywithout explanation. These include the 5kPa super-hydrostatic pressure recorded at the deeper screenduring the first 6weeks of recording, and the slowdecline of pressure from −4kPa in early 2003 to −6kPaat the end of the record. Sensor drift is typically an orderof magnitude less than the slow decline observed, andthis has been accounted for by the hydrostatic checks atthe beginning and end of the records (Fig. 6). A changein the formation thermal state during post-sealingrecovery would produce a perturbation of the oppositesign. Thus it is possible that the decline reflects a realchange in formation pressure. The early anomaly seenby the lower screen is more puzzling. It ends roughly atthe time of packer-line pumping by Alvin (2002November 21), but the timing is not exact; the dropbegins more than 1 day after the pumping episode, andcontinues over a span of roughly 4 days. This and thelack of any signal at the upper screen attest to theintegrity of the packer seal, both at the time of pumpingand at the time of the pressure drop at the lower screen.Other signals are correlated with the lower screenpressure drop, however, and suggest that the initial 6weeks of pressure at the lower screen was perturbed by aleak where the osmosampler package seals into itslanding seat at the bottom of the CORK-II casing. Thesesignals include: (1) an inflection in the thermal recoverycurve, with the rate of temperature rise increasing at thetime of the pressure drop, (2) a growing presence, thendisappearance, of broad-band pressure noise (at the
lower screen only) prior to and after the drop in lower-screen pressure, (3) an elimination of noise in thetemperature record at the time pressure fell, and (4)changes in water composition recorded by the osmo-sampler [9]. The magnitude of the pressure change is fartoo large to be accounted for by any thermal effect; apossible explanation is that the early elevated pressurewas maintained dynamically by flow past the osmo-sampler seals.
While questions remain about the early part of therecord, it is reasonable to conclude that the latter partreflects in situ conditions accurately. The slightly sub-hydrostatic pressure of −6kPa probably reflects thelocal convective regime in the upper oceanic crust,where pressures vary spatially above and below ahydrostatic state by a few kPa according to thermally-derived buoyancy forces [17,18,20]. The virtuallyidentical values at the upper and lower screens couldreflect leakage past the packer, but it is also possible thatthe equality simply reflects the hydrologically homoge-neous state of a locally high-permeability upperbasement: Basement levels above and below the packerare probably naturally well-connected. High permeabil-ity is also suggested over a much larger scale by thesmall absolute values of pressure: Just as in the case ofthe inference based on the cool thermal and seawater-dominated geochemical state, it can be argued thatbasement must be well connected laterally to distantbasement outcrops, much like the situation inferred forother locally sediment-sealed but permeable oceancrustal sites where CORK and related observationshave been made [16,17,21–23]. Pressures of a magni-tude suggested by Silver et al. [24] are not present.Clearly this has important implications for the hydro-logic state of the prism and for related fluid-flow anddeformational processes. Fluids slowly squeezed fromthe subducting sediments can have little effect on thepressure regime in the underlying basement, and towhatever depth beneath the prism it remains permeable,basement will serve as an efficient hydrostatic-statedrainage pathway.
Another signal of interest in the pressure data is theresponse of the formation to seafloor loading, evident inthe expanded plot of the end of the record (Fig. 6b)which includes tidal pressure variations at the seafloorand within the formation. The phase and attenuation ofthese and other temporal variations (e.g., fortnightlytides and long-period barometric and oceanographicvariations seen in the filtered records in Fig. 5a) provideconstraints on hydraulic and mechanical properties ofthe formation. In this instance, the tidal signals in theshallow and deep intervals are attenuated to 0.52 and

Fig. 7. Formation pressure (a) and temperature (b) in Hole 1255A,plotted for the recording period up to the most recent submersible sitevisit. Diurnal and semi-diurnal components have been filtered from thepressure record. Hydrostatic checks, made before installation and atthe time of the 2004 Alvin visit (as in Fig. 6, but not shown for thishole), have been used to remove sensor offsets and drifts from the full-history filtered pressure records. Detailed plots of events indicated byarrows are shown in Fig. 8. Temperature is shown as a several-hourrunning average of raw data (from Heesemann et al., in press) toimprove the digitization-limited resolution. A detailed plot ofunfiltered pressures (c) shows the non-coincident excursions ofpressure above and below the packer near the times of the firstAlvin visit and when the osmosampler seal is inferred to have set.
239E.E. Davis, H.W. Villinger / Earth and Planetary Science Letters 245 (2006) 232–244
0.58 of the amplitude of the seafloor loading signal,respectively, and there is little shift in phase. In theabsence of diffusion, the ratio of the formation andseafloor signals is equal to the 1-dimensional elasticloading efficiency, γ′, which provides a direct constrainton the compressibility of the rock matrix, β [25]. Theseloading efficiencies and the inferred compressibilities(β=1.1×10− 10 and 1.3×10− 10 Pa− 1 at the shallow anddeep intervals, calculated using the method summarizedin Wang and Davis [25] and Wang [26] with an assumedporosity of 10% and Poisson's ratio of 0.3) are similar tovalues observed and estimated at ODP Sites 1024 and1025 on the Juan de Fuca Ridge, where γ′=0.62 [23]and β≈1.4×10− 10 Pa− 1 (using the same values forporosity and Poisson's ratio). These values differ fromvalues determined at other crustal sites: Smaller loadingefficiencies of 0.35, 0.30 and 0.34 have been observed atSite 504 on the Costa Rica Rift flank and Sites 1026 and1027 on the Juan de Fuca Ridge flank, respectively, andcorrespondingly lower compressibilities have beeninferred. A factor that may set Sites 1024, 1025 and1253 apart from the other sites is low basementtemperature. The fractured igneous rock matrix atthese latter sites may not be mechanically affected yetby hydrothermal cementation. High loading efficiencyof compressible sediment interbeds at Site 1253 isprobably not a significant contributing factor. Signalsfrom the low-permeability sediments cannot diffuse intothe borehole rapidly enough to overcome the contribu-tion from the far more permeable igneous layers.
4.3. Formation pressures and temperatures, Site 1255
The early parts of the pressure records from Site 1255(Fig. 7a) also appear to be compromised by CORK-system-related anomalies. Immediately following de-ployment on 2002 November 1, there was an 18-dayperiod of near-hydrostatic pressure at the lower screen.As in the case of the lower interval at Site 1253, this wasprobably the consequence of leakage past the osmo-sampler seals. Temperature records (Fig. 7b) againprovide a sensitive diagnostic indicator for leakage;slow discharge from the overpressured formation up thehole and past the osmosampler seal is indicated by theanomalously high temperature early in the record at140mbsf. Proper mating of this seal probably took placeat the time of the temperature reversal at that level andthe contemporary inflection in the temperature recoverycurve at 135mbsf (18 days into the recording period andabout 2 days before the first Alvin visit; Fig. 7c). Thisallowed pressure at the deep screen to begin to riserapidly towards what is probably the true formation state
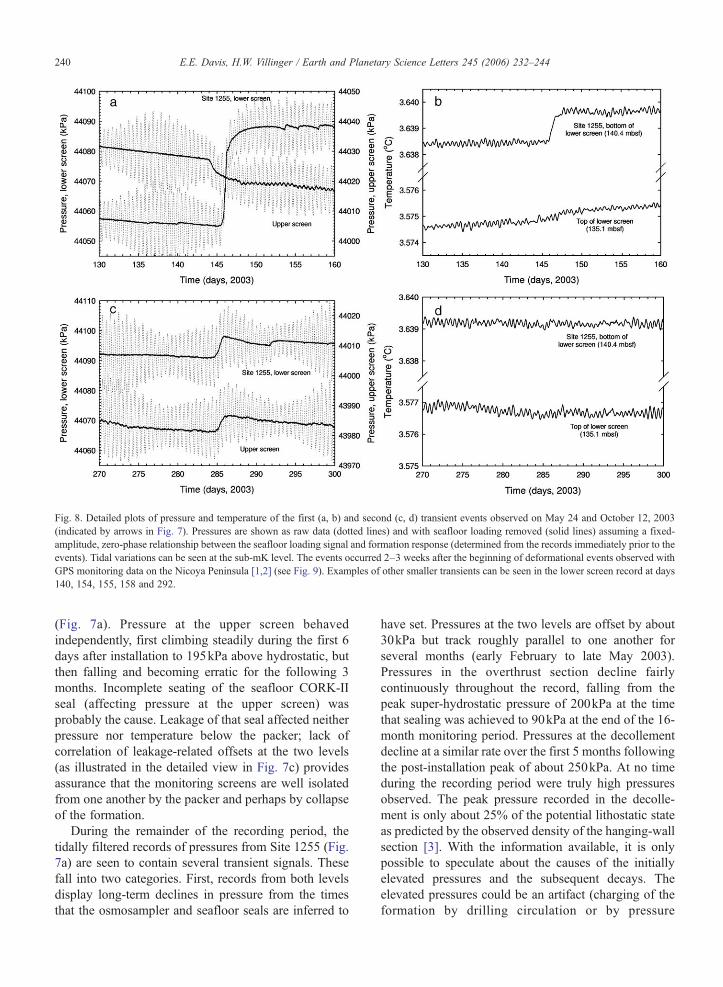
Fig. 8. Detailed plots of pressure and temperature of the first (a, b) and second (c, d) transient events observed on May 24 and October 12, 2003(indicated by arrows in Fig. 7). Pressures are shown as raw data (dotted lines) and with seafloor loading removed (solid lines) assuming a fixed-amplitude, zero-phase relationship between the seafloor loading signal and formation response (determined from the records immediately prior to theevents). Tidal variations can be seen at the sub-mK level. The events occurred 2–3 weeks after the beginning of deformational events observed withGPS monitoring data on the Nicoya Peninsula [1,2] (see Fig. 9). Examples of other smaller transients can be seen in the lower screen record at days140, 154, 155, 158 and 292.
240 E.E. Davis, H.W. Villinger / Earth and Planetary Science Letters 245 (2006) 232–244
(Fig. 7a). Pressure at the upper screen behavedindependently, first climbing steadily during the first 6days after installation to 195kPa above hydrostatic, butthen falling and becoming erratic for the following 3months. Incomplete seating of the seafloor CORK-IIseal (affecting pressure at the upper screen) wasprobably the cause. Leakage of that seal affected neitherpressure nor temperature below the packer; lack ofcorrelation of leakage-related offsets at the two levels(as illustrated in the detailed view in Fig. 7c) providesassurance that the monitoring screens are well isolatedfrom one another by the packer and perhaps by collapseof the formation.
During the remainder of the recording period, thetidally filtered records of pressures from Site 1255 (Fig.7a) are seen to contain several transient signals. Thesefall into two categories. First, records from both levelsdisplay long-term declines in pressure from the timesthat the osmosampler and seafloor seals are inferred to
have set. Pressures at the two levels are offset by about30kPa but track roughly parallel to one another forseveral months (early February to late May 2003).Pressures in the overthrust section decline fairlycontinuously throughout the record, falling from thepeak super-hydrostatic pressure of 200kPa at the timethat sealing was achieved to 90kPa at the end of the 16-month monitoring period. Pressures at the decollementdecline at a similar rate over the first 5 months followingthe post-installation peak of about 250kPa. At no timeduring the recording period were truly high pressuresobserved. The peak pressure recorded in the decolle-ment is only about 25% of the potential lithostatic stateas predicted by the observed density of the hanging-wallsection [3]. With the information available, it is onlypossible to speculate about the causes of the initiallyelevated pressures and the subsequent decays. Theelevated pressures could be an artifact (charging of theformation by drilling circulation or by pressure
241E.E. Davis, H.W. Villinger / Earth and Planetary Science Letters 245 (2006) 232–244
transmitted from the underthrust section at the bottom ofthe hole) or the product of a contractional strain event atsome earlier time. The decays could reflect post-contractional relaxation, natural drainage of the prism,or very slow leakage through the CORK-II system.
Superimposed on the generally smooth pressuredecays are two secondary transients that correlatebetween the upper and lower screens, and a number ofminor transients that do not. The first of the correlatedtransients is characterized by opposite signs andcontrasting magnitudes at the two screens; in the secondcase, the same signs and similar magnitudes are seen.Expanded views (Fig. 8a,c) show the first event to beless sharp in the upper interval than in the lower, and toappear earlier. There is also a subtle change in theresponse to tidal loading in the upper interval; this isevident in the change in the pressure residual after thetidal component has been subtracted (using the relativeamplitude of the response determined prior to the event).There are also small temperature anomalies resolved atthe time of both events (Fig. 8b,d), as well asgeochemical anomalies and changes in the inferredrate of fluid flow through the formation [9]. All aspectsof both events–the phasing of the “arrivals” at the twolevels; the opposite signs of the first event and the samesigns of the second; the apparently coincident change intidal response; in the case of the lower interval, thesudden disappearance of the long-term transient decline;and the contemporary temperature, geochemical, andflow rate signals–are presently without a clear explana-tion, although a correlation of both events withdeformational episodes observed during a GPS contin-uous monitoring experiment on the Nicoya Peninsula[1,2] suggests they reflect strain. This is discussed inSection 5.4.
As at Site 1253, the unfiltered pressure records revealthe response of the formation to seafloor tidal loading(e.g., Fig. 8), although at this site, γ′ is expectably muchgreater, 0.86 in the upper interval and 0.92 at thedecollement at the end of the recording period. Thesevalues are reasonable for relatively high-porositysediment. Assuming a Poisson's ratio for the sedimentframework of 0.1 and other properties appropriate forthe lithology, estimated framework compressibilities forthe sediments at the prism and decollement screens areroughly 4×10− 9 and 7×10− 9 Pa− 1, respectively.
5. Summary and discussion
From the observations made to date, severalpreliminary conclusions can be drawn. Some of thesemust be regarded as tentative because the recording
history is short relative to the characteristic time scalesof the transient behavior witnessed at Site 1255.
5.1. Near-hydrostatic pressure conditions in basement
Basement at the toe of the Costa Rica forearc wedgeis observed to be in a near-hydrostatic state despite theproximity to the consolidating subduction complex.This suggests that it is probably highly permeable andwell ventilated to the ocean. This is consistent withinferences from thermal observations made across theprism and incoming plate [4,14,15] that show theseafloor heat flux to be only a small fraction (as little as10%) of that expected from the underlying lithosphere.High basement permeability and efficient ventilation atdistant basement outcrops are suggested also bygeochemical observations made in sediments abovethe basement contact that show basement watercomposition to be very similar to seawater [24,27].Rapid hydrothermal flow within the sediment-buriedoceanic crust and efficient advective exchange with theocean are implied.
Given its ability to maintain a low-pressure state,basement must serve as an efficient hydrologic “drain”,channeling fluids expelled from the prism and sub-ducted sediments. Limitations on consolidation andfluid loss must be set by the permeability of thesediment section itself, or perhaps of the massive sills inthis area. As with pressure and temperature, effects ofventilated crustal circulation must strongly dilute anygeochemical signature from sediment consolidation anddehydration, with basement fluid composition beinginfluenced little by the very slow influx of water fromthe subduction complex. To what distance beneath theprism the upper oceanic crust remains permeable andserves as a hydrologic conduit is not possible to say, butits potential role as a drain must certainly be consideredin models of accretionary prism hydrology anddeformation, and any apparent inconsistencies withinterferences from sediment consolidation state andpore-fluid composition must be reconciled [24,28–30].
5.2. Modest pressures in the decollement and overthrustprism
Pressures in the overthrust prism section and at thedecollement at Site 1255 are superhydrostatic, but onlymoderately so. Even the maximum pressure observedearly in the observation period, 250kPa above hydro-static, was only about 25% of a lithostatic level(λ⁎≈0.25). As discussed below, this may be the typicalstate of the seaward part of subduction zone prisms.

242 E.E. Davis, H.W. Villinger / Earth and Planetary Science Letters 245 (2006) 232–244
High pressures may occur at the time of major thrustearthquakes or other large deformational events, but atshallow levels these transients may last only briefly.
Except at the base of the sediments (which mustremain at a near-hydrostatic state for some distancelandward of the prism toe), no constraints are providedabout levels of overpressure in the underthrust section,where greater overpressures are expected (given theirgreater hydrologic isolation) and inferred (on the basisof consolidation test results). Targeting the underthrustsediment section for monitoring was prohibited duringLeg 205 because of the difficulty to install instrumen-tation with the technology employed. Consolidationtests [28,30] suggest the presence of relatively highpressures (maximum pore pressure ratio λ⁎=0.7), butthey provide only indirect estimates and provide noinformation about temporal variations. An obvious goalfor future monitoring efforts must be to document theaverage and transient pressure state of this structuralunit, the lateral gradients across the subduction zonewithin the unit, and the vertical gradients near its top andbottom boundaries, where reasonably and very welldrained conditions exist (in the decollement andbasement, respectively).
5.3. Long-term pressure transients
Long-term transient decays are observed at bothmonitoring levels in Hole 1255A. The origin of theinitially elevated pressures can only be speculated about.The last major thrust earthquake that occurred in thisregion in 1950 is an unlikely candidate; some othermore recent deformational event, either aseismic (likethose witnessed by Protti et al. [1,2] and discussedbelow), or with associated seismicity (as in the case of anearby Mw=6.4 earthquake in July 2000 [31]), could beresponsible.
The cause for the decline in pressure can also only bespeculated about. The simplest explanation is that itsimply reflects hydrologic drainage of the formation.Vertical drainage following a step-wise increase inpressure would be characterized by a time constantτ=h2/η′, where h is the thickness of the section abovethe observation level, η′=k/μζ is the one-dimensionalhydraulic diffusivity, k is permeability, μ is fluidviscosity, and ζ is the one-dimensional storage com-pressibility which can be estimated in the manneroutlined by Wang and Davis [25] and Wang [26] usingthe one-dimensional tidal loading efficiency, γ′, andestimates of porosity, n, and the Poisson's ratio for thesediment framework, ν. Assuming h=130m, μ=10− 3
Pa s, n=55%, ν=0.1, and γ′=0.86yields ζ=1.8×10− 9
Pa− 1. If k were 10− 15 m2, a value that falls at the upperlimit of the range measured on sediments sampled fromthe underthrust section (10− 15 to 10− 18 m2) [11,12] thecharacteristic drainage time constant would be roughly 1yr, i.e., of the same order as that observed. Channelizedflow within the prism and along the decollement mightaid drainage, and the annulus between the formation andthe 10 3/4ʺ casing offers another possible drainage paththat cannot be excluded.
It is also possible that the pressure decline is aconsequence of extensional strain. It is noteworthy thata decrease in pressure with time has also beenobserved in Hole 808I in the toe of the Nankaiaccretionary prism [32]. The rate of change at that siteis much slower (a few vs. ca. 100kPa yr− 1), but thecause might be the same: relaxation of the outer prismfollowing a contractional strain event, either aseismicor seismic, prior to the recording period. Themagnitude of the volumetric strain that would producethe declining pressures (and the pressure stepsdiscussed next) can be estimated using elasticparameters constrained by the observed loadingefficiencies [26,32,33]. Using parameters outlined inSection 5.5 yields an estimated strain-to-pressureconversion efficiency of 4kPa μstrain− 1, and thiswould suggest a volumetric strain rate associated withthe general decline in pressure observed during thisrecording period of the order of 25μstrain yr− 1.
In the case of the Nankai trough experiment, anopposite secular trend was observed at Site 1173 in theincoming Philippine Sea plate, and this has beenattributed to interseismic contraction [32]. Consistentobservations were made at multiple levels in thesediment section, and in basement which at that site isinferred to be hydrologically confined or to have lowpermeability. Given the permeable and highly uncon-fined hydrologic condition of basement at Site 1253, wewould not expect slowly changing strain-related pres-sure to be maintained, although the possibility that theslow decrease in pressure observed in both basementintervals (Fig. 5a) is related to strain cannot be excluded.
5.4. Pressure transients correlated with onshore strain
Two small stepwise pressure offsets occurred duringthe observation period at Site 1255. Detailed aspects ofthese (including inconsistent signs and offsets in timing;an ending of decreasing pressure at the decollement atthe time of the first step; correlative temperature andgeochemical transients) do not lead to any obviousexplanation regarding their origin, although there is aclear association between these pressure steps and two

243E.E. Davis, H.W. Villinger / Earth and Planetary Science Letters 245 (2006) 232–244
deformational events observed during a GPS strainmonitoring experiment that was fortuitously underwayon the Nicoya Peninsula, directly onshore from theborehole sites, during much of the CORK monitoringepoch described here [1,2]. In both cases, the prismpressure offsets (May 24 and October 12, 2003)occurred 2–3 weeks after the initiation of the onshorestrain events (Fig. 9). If their origin is local strain, nothydrologically transmitted pressure, the magnitude ofvolumetric strain suggested would be somewhat greaterthan 10− 6. It is possible that the onshore deformationand offshore pressure events are related in a mannersimilar to the way by which strain-induced transientpressure signals at and seaward of the toe of the Nankaitrough accretionary prism were linked to deformationassociated with a seismic swarm observed furthertowards the coast of Japan [32]. The Nicoya PeninsulaGPS data suggest that in the case of the Septemberevent, a slip dislocation on the subduction thrustinitiated near the coast and propagated inland over aperiod of 2–3 weeks with no associated detectableearthquakes [1,2]. The Site 1255 CORK pressure datasuggest that a mirrored dislocation may also havepropagated seaward at a similar rate.
Fig. 9. Plots of pressure in Hole 1255A, from the time CORK-II sealsare inferred to have seated to the time of the most recent hydrostaticcalibration and data recovery (a), and the northward component ofdisplacement (daily and 14-day averages shown in (b) by points and aline, respectively) observed at a GPS monitoring site (site INDI ofProtti et al. [1,2]) near the coast of the Nicoya Peninsula (see Fig. 1).
In the instance of the strain/swarm event at Nankai, acontemporary offset of opposite sign to that in the prism(indicating elastic relaxation) was recorded in the incomingPhilippine Sea plate section. No analogous transient wasseen in the pressure data from the Cocos plate Site 1253,possibly for the same reason that no secular strainaccumulation is detected: basement is too well ventilated.
5.5. Framework compressibilities
Tidal loading efficiencies and inferred formationcompressibilities are generally consistent with thelithologies where monitoring screens are imbedded.Values in the oceanic crust at Site 1253 (γ′=0.52–0.58and β≈1.1–1.3×10− 10 Pa− 1) are similar to valuesdetermined on the Juan de Fuca Ridge flank wheresimilarly low crustal temperatures are present, buthigher than values determined elsewhere. Limitedhydrothermal alteration may be responsible for therelatively high values. The sediments of the overthrustprism display a loading efficiency of 0.86 and acorresponding compressibility of 4×10− 9 Pa− 1; at thelevel of the decollement, γ′ and β are slightly higher(0.92, 7×10− 9 Pa− 1). These values are similar to onesdetermined elsewhere in sediments of equivalentporosity (e.g., a loading efficiency of 0.85 was observedin the Barbados accretionary prism [34]).
Acknowledgments
Engineering and technical expertise for the design,construction, installation, and service phases of theCORK-II project have been provided by T. Pettigrewand the engineering and shipboard personnel of theJOIDES Resolution, and R. Macdonald, and R.Meldrum of the Geological Survey of Canada. Fundingfor the project has been provided by the U.S. NationalScience foundation through support to the OceanDrilling Program and a grant to M. Kastner, as well asthe Deutsche Forschungsgemeinschaft and the Geolog-ical Survey of Canada. Submersible support wasprovided by the Alvin group at Woods Hole Oceano-graphic Institution under the leadership of P. Hickey.GPS data included in Fig. 9 were kindly provided byPeter LaFemina and Tim Dixon.
References
[1] M. Protti, T. Gonzalez, T. Kato, T. Iinuma, S. Miyazaki, K.Obana, Y. Kaneda, P. LaFemina, T. Dixon, S. Schwartz, A creepevent on the shallow interface of the Nicoya Peninsula, CostaRica seismogenic zone, EOS, Trans. Am. Geophys. Union, FallMeet. Program Abstr. 85 (2004) F1378.
244 E.E. Davis, H.W. Villinger / Earth and Planetary Science Letters 245 (2006) 232–244
[2] M. Protti, P. LaFemina, V. Gonzalez, T.H. Dixon, S.Y. Schwartz,T. Kato, T. Iinuma, S. Miyazaki, K. Obana, Y. Kaneda, Apossible slow slip event within the seismogenic zone, Nicoyapeninsula, Costa Rica, Geophys. Res. Lett. (submitted forpublication).
[3] G. Kimura, E. Silver, P. Blum, et al., Proc. ODP, Init. Repts., vol.170, Ocean Drilling Program, College Station, TX, USA, 1997,458 pp.
[4] J. Morris, H. Villinger, A. Klaus, Proc. ODP, Init. Repts., vol.205, Ocean Drilling Program, College Station, TX, USA, 2003,75 pp.
[5] E.E. Davis, K. Becker, T. Pettigrew, B. Carson, R. MacDonald,CORK: a hydrologic seal and downhole observatory for deepocean boreholes, Proc. ODP, Initial Rep. 139 (1992) 43–53.
[6] H.W. Jannasch, E. Davis, M. Kastner, J. Morris, T. Pettigrew, J.Plant, E. Solomon, H. Villinger, C. Wheat, CORK II: long-termmonitoring of fluid chemistry, fluxes, and hydrology ininstrumented boreholes at the Costa Rica subduction zone,Proc. ODP, Initial Rep. 205 (2003) (CD-ROM).
[7] K. Becker, E.E. Davis, A review of CORK designs andoperations during the Ocean Drilling Program, Proc. IODP,Initial Rep., 301 (CD-ROM, in press).
[8] M. Heesemann, H. Villinger, H.W. Jannasch, M. Kastner, andthe Leg 301T Scientific Party, Data Report: long-termtemperature measurements at ODP Holes 1253A and 1255Aoff Costa Rica, ODP Leg 205, Proc. IODP, Initial Rep., 301T(CD-ROM, in press).
[9] M. Kastner, E. Solomon, G. Wheat, H. Jannasch, E. Davis, H.Villinger, M. Heesemann, G. Robertson, J. Morris, Continuouschemical and fluid flux monitoring in two distinct fluid flowsystems at the Costa Rica subduction zone, EOS, Trans. Am.Geophys. Union, Fall Meet. Program Abstr. 86 (2005).
[10] A. McKiernan, D. Saffer, Permeability and consolidationproperties of sediments incoming to the Costa Ricansubduction zone, collected on Leg 205, Proc. ODP, Sci.Results, 205 (in press).
[11] E. Screaton, T. Hays, K. Gamage, J. Martin, Data report:permeabilities of Costa Rica subduction zone sediments, Proc.ODP, Sci. Results 205 (in press).
[12] E.J. Screaton, D.M. Saffer, Fluid expulsion and overpressuredevelopment during initial subduction at the Costa Ricaconvergent margin, Earth Planet. Sci. Lett. 233 (2005) 361–374.
[13] E.E. Davis, K. Wang, K. Becker, R.E. Thomson, I. Yashayaev,Deep-ocean temperature variations and implications for errors inseafloor heat-flow determinations, J. Geophys. Res. 108 (2003)B1, doi:10.1029/2001JB001695.
[14] M.G. Langseth, E. Silver, The Nicoya convergent margin: aregion of exceptionally low heat flow, Geophys. Res. Lett. 23(1996) 891–894.
[15] A.T. Fisher, C. Stein, R. Harris, K. Wang, E. Silver, M. Pfender,M. Hutnak, A. Cherkaoui, R. Bodzin, H. Villinger, Abruptthermal transition reveals hydrothermal boundary and role ofseamounts with the Cocos plate, Geophys. Res. Lett. 30 (2003),doi:10.1029/2002GL016766.
[16] K. Becker, A. Bartetzko, E. Davis, Leg 174B synopsis: revisitingHole 395A for logging and long-term monitoring of off-axishydrothermal processes in young oceanic crust, Proc. ODP, Sci.Results 174B (2001) 1–12.
[17] E.E. Davis, K. Becker, Observations of natural-state fluidpressures and temperatures in young oceanic crust and inferencesregarding hydrothermal circulation, Earth Planet. Sci. Lett. 204(2002) 231–248.
[18] E.E. Davis, K. Becker, Observations of temperature and pressure:constraints on ocean crustal hydrologic state, properties, and flow,in: E. Davis, H. Elderfield (Eds.), Hydrogeology of the OceanicLithosphere, Cambridge University Press, 2004, pp. 225–271.
[19] K. Becker, E. Davis, F. Spiess, C. deMoustier, Temperature andvideo logs from the upper oceanic crust, Holes 504B and 896A,Costa Rica Rift flank: implications for the permeability of upperoceanic crust, Earth Planet. Sci. Lett. 222 (2004) 881–896.
[20] E.E. Davis, K. Becker, J. He, Costa Rica Rift revisited: constraintson shallow and deep hydrothermal circulation in young oceaniccrust, Earth Planet. Sci. Lett. 222 (2004) 879–893.
[21] K. Becker, E. Davis, New evidence for age variation and scaleeffects of permeabilities of young oceanic crust from boreholethermal and pressure measurements, Earth Planet. Sci. Lett. 210(2003) 499–508.
[22] K. Becker, E. Davis, In situ determinations of the permeability ofthe igneous oceanic crust, in: E. Davis, H. Elderfield (Eds.),Hydrogeology of the Oceanic Lithosphere, Cambridge Univer-sity Press, Cambridge, UK, 2004, pp. 189–225.
[23] E.E. Davis, K. Wang, K. Becker, R. Thomson, Formation-scalehydraulic and mechanical properties of oceanic crust inferredfrom pore-pressure response to periodic seafloor loading, J.Geophys. Res. 105 (2000) 13,423–13,435.
[24] E. Silver, M. Kaster, A. Fisher, J. Morris, K. McIntosh, D. Saffer,Fluid flow paths in the Middle America trench and Costa Ricamargin, Geology 28 (2000) 679–682.
[25] K. Wang, E. Davis, Theory for the propagation of tidally inducedpore pressure variations in layered subseafloor formations, J.Geophys. Res. 101 (1996) 11483–11495.
[26] K. Wang, Applying fundamental principles and mathemat-ical models to understand processes and estimate para-meters, in: E. Davis, H. Elderfield (Eds.), Hydrogeology ofthe Oceanic Lithosphere, Cambridge University Press, UK,2004, pp. 376–413.
[27] M. Kastner, J. Morris, L. Chan, O. Saether, A. Lueckge, Threedistinct fluid systems at the Costa Rica subduction zone:chemistry, hydrology, and fluxes, Goldschmidt 2000, J. Conf.Abstr., vol. 5, 2000, p. 572.
[28] D.M. Saffer, Pore pressure development and progressive dewater-ing in underthrust sediments at the Costa Rican subductionmargin: comparison with northern Barbados and Nankai, J.Geophys. Res. 108 (2003), doi:10.1029/2002/JB001787.
[29] B.A. Bekins, A. McCaffrey, S. Dreiss, Episodic and constantflow models for the origin of low-chloride waters in a modernaccretionary complex, Water Resour. Res. 31 (1995) 3205–3215.
[30] D.M. Saffer, E. Silver, A. Fisher, H. Tobin, K. Moran, Inferredpore pressures at the Costa Rica subduction zone: implicationsfor dewatering processes, Earth Planet. Sci. Lett. 177 (2000)193–207.
[31] USGS earthquake data base http://eqint.cr.usgs.gov/neic.[32] Davis, E.E., Becker, K., Wang, K., Obara, K., Ito, Y., A discrete
episode of seismic and aseismic deformation of the Nankaisubduction zone accretionary prism and incoming Philippine Seaplate, Earth Planet. Sci. Lett. (in press).
[33] E.E. Davis, K. Wang, R. Thomson, K. Becker, J. Cassidy, Anepisode of seafloor spreading and associated plate deformationinferred from crustal fluid pressure transients, J. Geophys. Res.105 (2001) 21953–21963.
[34] K. Becker, A. Fisher, E. Davis, The CORK experiment in Hole949C: long-term observations of pressure and temperature in theBarbados accretionary prism, Proc. ODP, Sci. Results 156 (1997)247–252.