Embed Size (px)
Citation preview
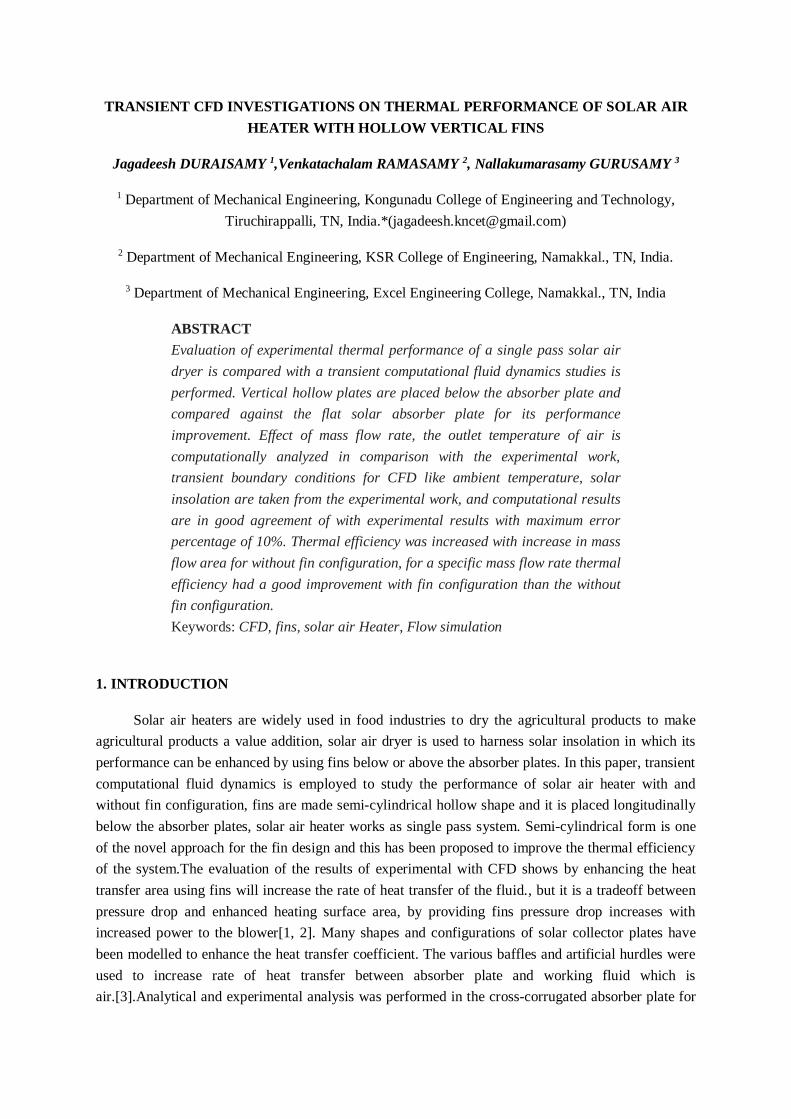
TRANSIENT CFD INVESTIGATIONS ON THERMAL PERFORMANCE OF SOLAR AIR
HEATER WITH HOLLOW VERTICAL FINS
Jagadeesh DURAISAMY 1,Venkatachalam RAMASAMY 2, Nallakumarasamy GURUSAMY 3
1 Department of Mechanical Engineering, Kongunadu College of Engineering and Technology,
Tiruchirappalli, TN, India.*([email protected])
2 Department of Mechanical Engineering, KSR College of Engineering, Namakkal., TN, India.
3 Department of Mechanical Engineering, Excel Engineering College, Namakkal., TN, India
ABSTRACT
Evaluation of experimental thermal performance of a single pass solar air
dryer is compared with a transient computational fluid dynamics studies is
performed. Vertical hollow plates are placed below the absorber plate and
compared against the flat solar absorber plate for its performance
improvement. Effect of mass flow rate, the outlet temperature of air is
computationally analyzed in comparison with the experimental work,
transient boundary conditions for CFD like ambient temperature, solar
insolation are taken from the experimental work, and computational results
are in good agreement of with experimental results with maximum error
percentage of 10%. Thermal efficiency was increased with increase in mass
flow area for without fin configuration, for a specific mass flow rate thermal
efficiency had a good improvement with fin configuration than the without
fin configuration.
Keywords: CFD, fins, solar air Heater, Flow simulation
1. INTRODUCTION
Solar air heaters are widely used in food industries to dry the agricultural products to make
agricultural products a value addition, solar air dryer is used to harness solar insolation in which its
performance can be enhanced by using fins below or above the absorber plates. In this paper, transient
computational fluid dynamics is employed to study the performance of solar air heater with and
without fin configuration, fins are made semi-cylindrical hollow shape and it is placed longitudinally
below the absorber plates, solar air heater works as single pass system. Semi-cylindrical form is one
of the novel approach for the fin design and this has been proposed to improve the thermal efficiency
of the system.The evaluation of the results of experimental with CFD shows by enhancing the heat
transfer area using fins will increase the rate of heat transfer of the fluid., but it is a tradeoff between
pressure drop and enhanced heating surface area, by providing fins pressure drop increases with
increased power to the blower[1, 2]. Many shapes and configurations of solar collector plates have
been modelled to enhance the heat transfer coefficient. The various baffles and artificial hurdles were
used to increase rate of heat transfer between absorber plate and working fluid which is
air.[3].Analytical and experimental analysis was performed in the cross-corrugated absorber plate for
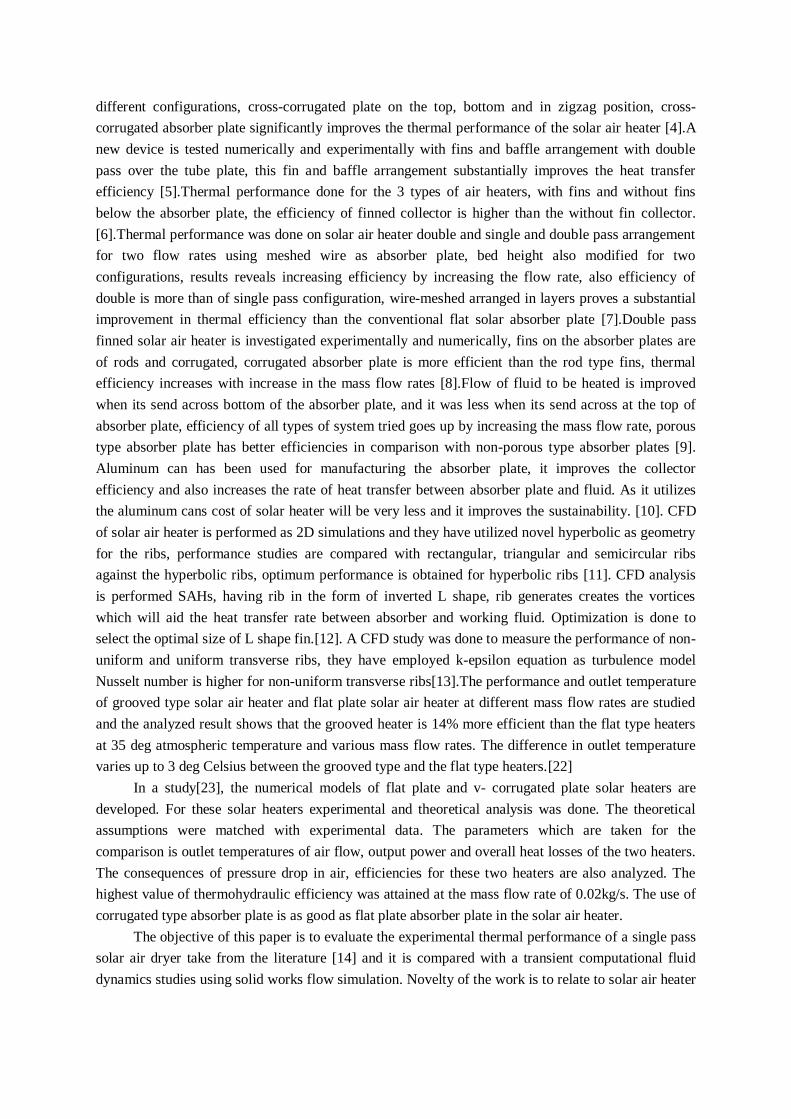
different configurations, cross-corrugated plate on the top, bottom and in zigzag position, cross-
corrugated absorber plate significantly improves the thermal performance of the solar air heater [4].A
new device is tested numerically and experimentally with fins and baffle arrangement with double
pass over the tube plate, this fin and baffle arrangement substantially improves the heat transfer
efficiency [5].Thermal performance done for the 3 types of air heaters, with fins and without fins
below the absorber plate, the efficiency of finned collector is higher than the without fin collector.
[6].Thermal performance was done on solar air heater double and single and double pass arrangement
for two flow rates using meshed wire as absorber plate, bed height also modified for two
configurations, results reveals increasing efficiency by increasing the flow rate, also efficiency of
double is more than of single pass configuration, wire-meshed arranged in layers proves a substantial
improvement in thermal efficiency than the conventional flat solar absorber plate [7].Double pass
finned solar air heater is investigated experimentally and numerically, fins on the absorber plates are
of rods and corrugated, corrugated absorber plate is more efficient than the rod type fins, thermal
efficiency increases with increase in the mass flow rates [8].Flow of fluid to be heated is improved
when its send across bottom of the absorber plate, and it was less when its send across at the top of
absorber plate, efficiency of all types of system tried goes up by increasing the mass flow rate, porous
type absorber plate has better efficiencies in comparison with non-porous type absorber plates [9].
Aluminum can has been used for manufacturing the absorber plate, it improves the collector
efficiency and also increases the rate of heat transfer between absorber plate and fluid. As it utilizes
the aluminum cans cost of solar heater will be very less and it improves the sustainability. [10]. CFD
of solar air heater is performed as 2D simulations and they have utilized novel hyperbolic as geometry
for the ribs, performance studies are compared with rectangular, triangular and semicircular ribs
against the hyperbolic ribs, optimum performance is obtained for hyperbolic ribs [11]. CFD analysis
is performed SAHs, having rib in the form of inverted L shape, rib generates creates the vortices
which will aid the heat transfer rate between absorber and working fluid. Optimization is done to
select the optimal size of L shape fin.[12]. A CFD study was done to measure the performance of non-
uniform and uniform transverse ribs, they have employed k-epsilon equation as turbulence model
Nusselt number is higher for non-uniform transverse ribs[13].The performance and outlet temperature
of grooved type solar air heater and flat plate solar air heater at different mass flow rates are studied
and the analyzed result shows that the grooved heater is 14% more efficient than the flat type heaters
at 35 deg atmospheric temperature and various mass flow rates. The difference in outlet temperature
varies up to 3 deg Celsius between the grooved type and the flat type heaters.[22]
In a study[23], the numerical models of flat plate and v- corrugated plate solar heaters are
developed. For these solar heaters experimental and theoretical analysis was done. The theoretical
assumptions were matched with experimental data. The parameters which are taken for the
comparison is outlet temperatures of air flow, output power and overall heat losses of the two heaters.
The consequences of pressure drop in air, efficiencies for these two heaters are also analyzed. The
highest value of thermohydraulic efficiency was attained at the mass flow rate of 0.02kg/s. The use of
corrugated type absorber plate is as good as flat plate absorber plate in the solar air heater.
The objective of this paper is to evaluate the experimental thermal performance of a single pass
solar air dryer take from the literature [14] and it is compared with a transient computational fluid
dynamics studies using solid works flow simulation. Novelty of the work is to relate to solar air heater
using fins and evaluating the same using CFD using conjugate heat transfer with transient boundary
conditions
2. COMPUTATIONAL METHODS
Software used in this study is called Solid WorksFlow Simulation, it has advantage of the
conventional CFD software, which allows the conjugate heat transfer without any complex methods
for meshing and preparing shadows and interfaces for the fluid domain
2.1. Governing Equations - General
The conservation laws for mass, angular momentum and energy in the Cartesian coordinate
system rotating with angular velocity Ω about an axis passing through the coordinate system's origin
can be written in the conservation form as follows:
𝝏𝝆
𝝏𝒕+
𝝏
𝝏𝒙𝒊(𝝆𝒖𝒊) = 𝟎 (1)
𝝏𝝆𝒖𝒊
𝝏𝒕+
𝝏
𝝏𝒙𝒊(𝝆𝒖𝒊𝒖𝒋) +
𝝏𝒑
𝝏𝒙𝒊=
𝝏
𝝏𝒙𝒋(𝝉𝒊𝒋 + 𝝉𝒊𝒋
𝑹 ) + 𝑺𝒊 𝒊 = 𝟏, 𝟐, 𝟑 - (2)
𝝏𝝆𝑯
𝝏𝒕+
𝝏𝝆𝒖𝒊𝑯
𝝏𝒙𝒊=
𝝏
𝝏𝒙𝒊(𝒖𝒋(𝝉𝒊𝒋 + 𝝉𝒊𝒋
𝑹 ) + 𝒒𝒊) +𝝏𝒑
𝝏𝒕− 𝝉𝒊𝒋
𝑹 𝝏𝒖𝒊
𝝏𝒙𝒋+ 𝝆𝜺 + 𝑺𝒊𝒖𝒊 + 𝑸𝑯, (3)
𝑯 = 𝒉 +𝒖𝟐
𝟐, (4)
where u is the fluid velocity, ρ is the fluid density, is a mass-distributed external force per unit
mass due to a porous media resistance (Si porous), a buoyancy (Sigravity= - ρgi, where gi is the
gravitational acceleration component along the i-th coordinate direction), and the coordinate system’s
rotation(Sirotation), i.e., Si= Si
porous + Sigravity + Si
rotation, h is the thermal enthalpy, QH is a heat source or
sink per unit volume, τik is the viscous shear stress tensor, qiis the diffusive heat flux. The subscripts
are used to denote summation over the three coordinate directions.
2.2. Governing Equations – Conjugate
Flow Simulation allows predicting simultaneous heat transfer in solid and fluid media with
energy exchange between them. Heat transfer in fluids is described by the energy conservation
equation where the heat flux is defined by the conservation equation. The phenomenon of anisotropic
heat conductivity in solid media is described by the following equation:
𝝏𝝆𝒆
𝝏𝒕=
𝝏
𝝏𝒙𝒊(𝝀𝒊
𝝏𝑻
𝝏𝒙𝒊) + 𝑸𝑯 (5)
where eis the specific internal energy,e = c·T, cis specific heat, QH is specific heat release (or
absorption) per unit volume, and λiare the eigenvalues of the thermal conductivity tensor. It is
supposed that the heat conductivity tensor is diagonal in the considered coordinate system. For
isotropic medium λ1= λ2= λ3= λ4.
2.3. Environment and Solar Radiation models
Environmental and solar radiation can be applied to the internal problems. In fact, the
environment radiation is the non-directional energy flux generated by the walls of an imaginary huge
"room" that surrounds the body. This flux has predefined radiation parameters. In contrast to the
environment radiation, the solar radiation is modeled by the directional energy flux. Therefore, the
solar radiation is defined via its power flow (intensity) and its directional vector. In addition to the
solar radiation from the computational domain boundaries, a solar radiation source emitting
directional radiation can be specified.
The Sun directional vector can be calculated using the following formula:
𝑆 = [ . sin ∅𝑠+ .cos ∅𝑠 ]. cos 𝜃𝑠 + .sin 𝜃𝑠 (6)
Where
is the zenith direction, is the north direction, = x is the east direction;
𝜃𝑠is the solar elevation angle. That is, the angle between the direction of the geometric center of
the sun’s apparent disk and the (idealized) horizon;
𝜃𝑠is the solar azimuth angle. That is, the angle from due north in a clockwise direction.
The solar elevation angle 𝜃𝑠can be calculated, to a good approximation, using the following
formula:
sin 𝜃𝑠 = cos ℎ cos 𝛿 cos ∅ + sin 𝛿 sin ∅ (7)[23]
Where ∅ is the local latitude, 𝛿 is the current Sun declination,
𝒉 = 𝒕/𝟖𝟔𝟒𝟎𝟎 (𝟐𝝅 − 𝝅) is the hour angle of the present time t[s](for example, at solar noon
12.00AM, t= 43200 s and h = 0).
2.4. Mesh Details
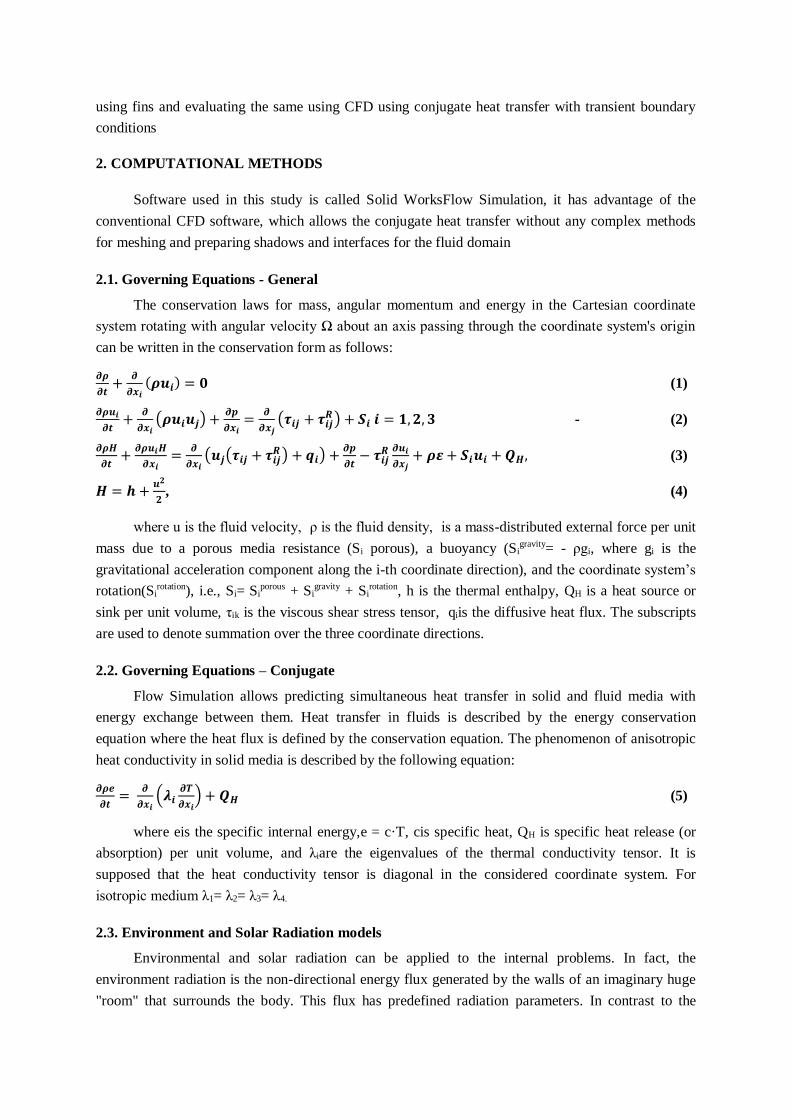
Fig 1 shows the mesh details of the computational domain with and without lids and table 1
provides the data about the no of fluid, solid and total cells for with and without fin computational
domain
Fig 1: Mesh solid and fluid domain for with and without fins
Without Fin With Fin
Total Cell
count
243948 Total Cell
count
262406
Fluid Cells 107536 Fluid Cells 109102
Solid Cells 136412 Solid Cells 153304
Partial Cells 63128 Partial Cells 75668
Table 1: Mesh details for with and without fins
2.5. Boundary Conditions
Inlet Mass flow rate
Outlet Environment
Pressure
Solar radiation Transient for 7
hours
Refer Fig 1
Time Step 0.0166 seconds
Iterations per time step 20
Table 2: Boundary Conditions
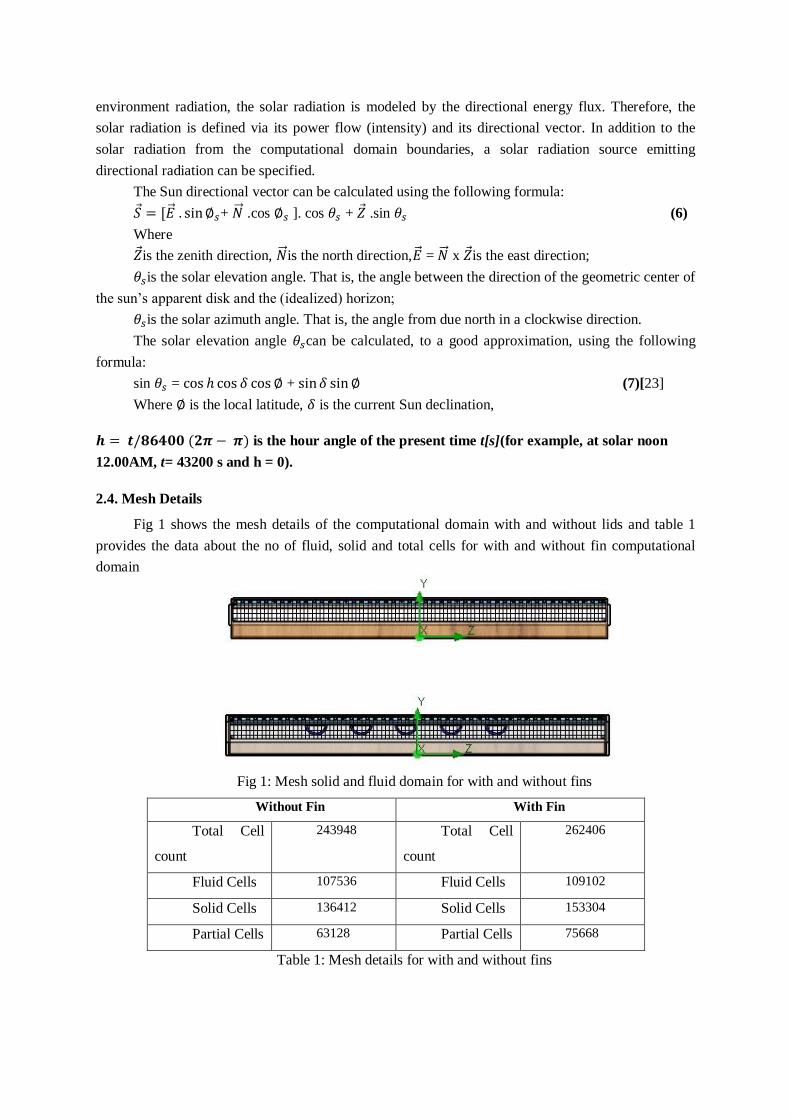
Boundary conditions were taken as mass flow rate for the inlet and pressure outlet for the outlet
of solar air heater, transient solar radiation, and ambient temperature were given as input as shown in
the Fig.. 1a. it’s a transient analysis done for 7 hours with results time step of every 15 minutes, time
step for analysis is 0.01666 seconds, and 20 iterations are given for solving one-time step, a high end
computational with 128 GB ram and xenon processor is employed for the analysis of this domain.
Turbulence model used for this analysis is k-epsilon. Solid works flow simulations software is used
for transient analysis
Fig.1a: Solar Radiation vs Ambient Temperature boundary condition
2.6. Experimental setup of solar air heater [14]
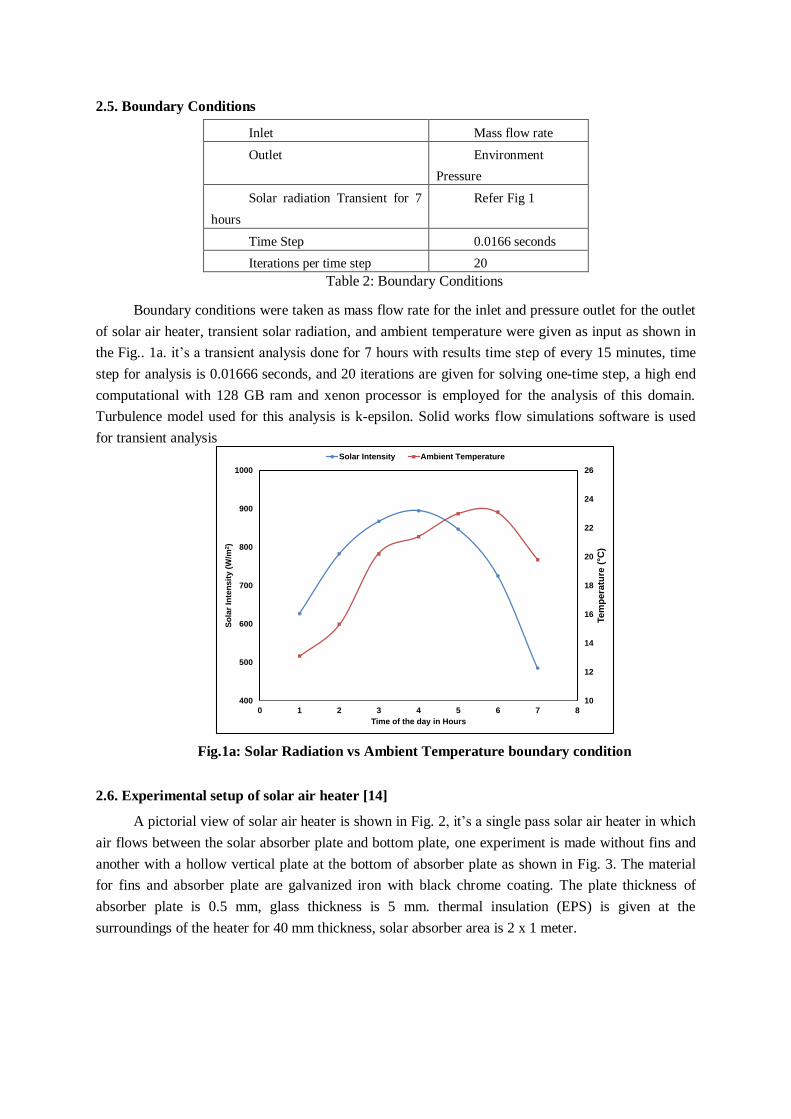
A pictorial view of solar air heater is shown in Fig. 2, it’s a single pass solar air heater in which
air flows between the solar absorber plate and bottom plate, one experiment is made without fins and
another with a hollow vertical plate at the bottom of absorber plate as shown in Fig. 3. The material
for fins and absorber plate are galvanized iron with black chrome coating. The plate thickness of
absorber plate is 0.5 mm, glass thickness is 5 mm. thermal insulation (EPS) is given at the
surroundings of the heater for 40 mm thickness, solar absorber area is 2 x 1 meter.
10
12
14
16
18
20
22
24
26
400
500
600
700
800
900
1000
0 1 2 3 4 5 6 7 8
Tem
pera
ture
( C
)
So
lar
Inte
ns
ity (
W/m
2)
Time of the day in Hours
Solar Intensity Ambient Temperature
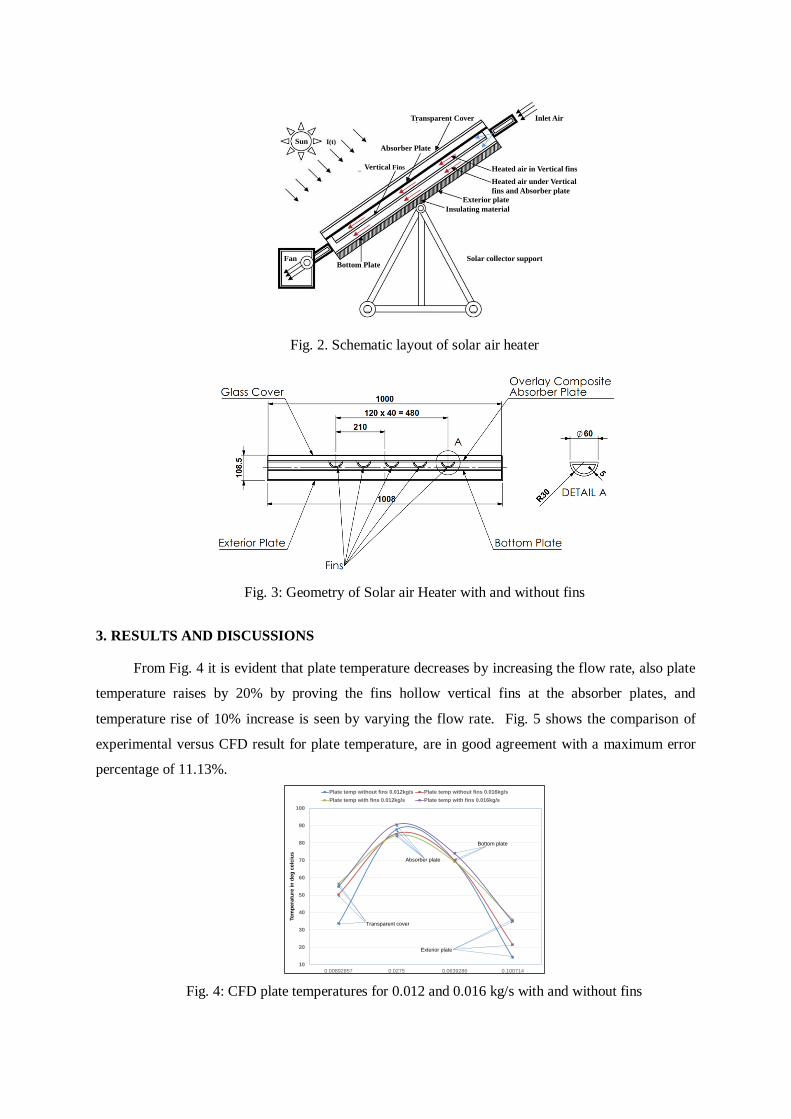
Fig. 2. Schematic layout of solar air heater
Fig. 3: Geometry of Solar air Heater with and without fins
3. RESULTS AND DISCUSSIONS
From Fig. 4 it is evident that plate temperature decreases by increasing the flow rate, also plate
temperature raises by 20% by proving the fins hollow vertical fins at the absorber plates, and
temperature rise of 10% increase is seen by varying the flow rate. Fig. 5 shows the comparison of
experimental versus CFD result for plate temperature, are in good agreement with a maximum error
percentage of 11.13%.
Fig. 4: CFD plate temperatures for 0.012 and 0.016 kg/s with and without fins
Fan
Sun I(t)
Vertical Fins
Bottom Plate
Absorber Plate
Transparent Cover Inlet Air
Heated air in Vertical fins
Heated air under Vertical
fins and Absorber plate
Exterior plate
Insulating material
Solar collector support
10
20
30
40
50
60
70
80
90
100
0.00892857 0.0275 0.0639286 0.100714
Tem
pera
ture
in
deg
celc
ius
Plate temp without fins 0.012kg/s Plate temp without fins 0.016kg/s
Plate temp with fins 0.012kg/s Plate temp with fins 0.016kg/s
Transparent cover
Absorber plate
Bottom plate
Exterior plate
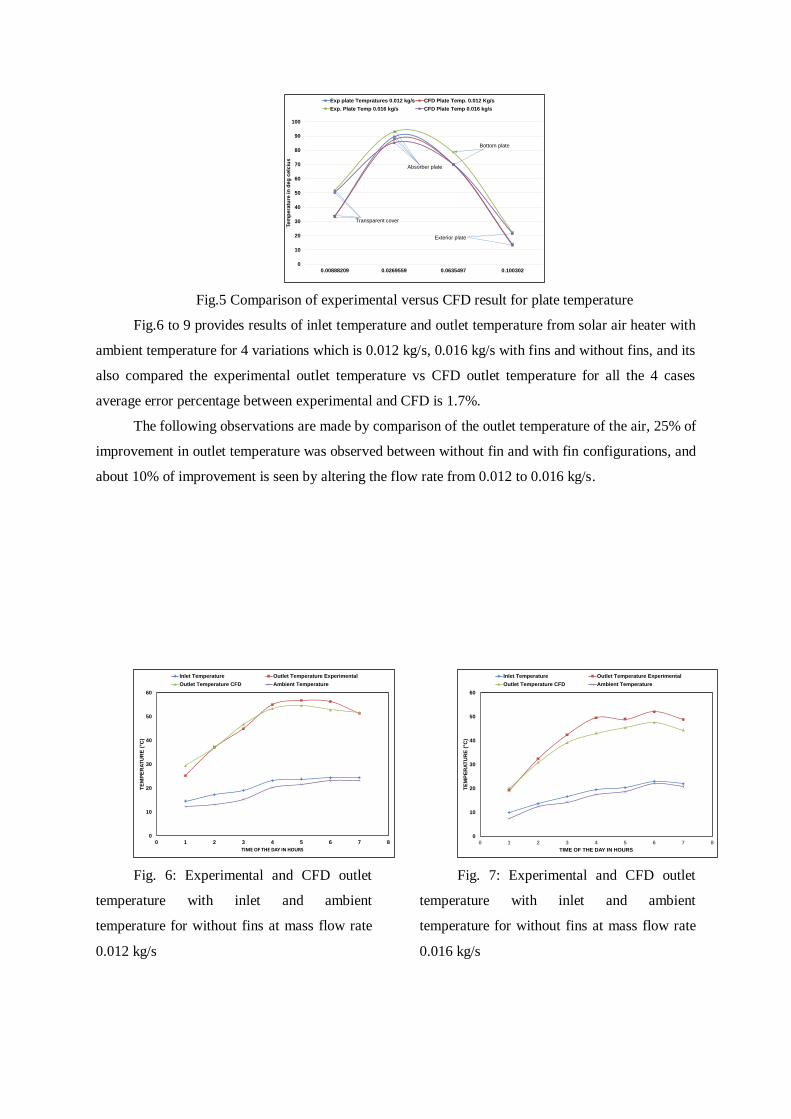
Fig.5 Comparison of experimental versus CFD result for plate temperature
Fig.6 to 9 provides results of inlet temperature and outlet temperature from solar air heater with
ambient temperature for 4 variations which is 0.012 kg/s, 0.016 kg/s with fins and without fins, and its
also compared the experimental outlet temperature vs CFD outlet temperature for all the 4 cases
average error percentage between experimental and CFD is 1.7%.
The following observations are made by comparison of the outlet temperature of the air, 25% of
improvement in outlet temperature was observed between without fin and with fin configurations, and
about 10% of improvement is seen by altering the flow rate from 0.012 to 0.016 kg/s.
Fig. 6: Experimental and CFD outlet
temperature with inlet and ambient
temperature for without fins at mass flow rate
0.012 kg/s
Fig. 7: Experimental and CFD outlet
temperature with inlet and ambient
temperature for without fins at mass flow rate
0.016 kg/s
0
10
20
30
40
50
60
70
80
90
100
0.00888209 0.0269559 0.0635497 0.100302
Tem
pera
ture
in
deg
celc
ius
Exp plate Tempratures 0.012 kg/s CFD Plate Temp. 0.012 Kg/s
Exp. Plate Temp 0.016 kg/s CFD Plate Temp 0.016 kg/s
Transparent cover
Absorber plate
Bottom plate
Exterior plate
0
10
20
30
40
50
60
0 1 2 3 4 5 6 7 8
TE
MP
ER
AT
UR
E ( C
)
TIME OF THE DAY IN HOURS
Inlet Temperature Outlet Temperature Experimental
Outlet Temperature CFD Ambient Temperature
0
10
20
30
40
50
60
0 1 2 3 4 5 6 7 8
TE
MP
ER
AT
UR
E ( C
)
TIME OF THE DAY IN HOURS
Inlet Temperature Outlet Temperature Experimental
Outlet Temperature CFD Ambient Temperature
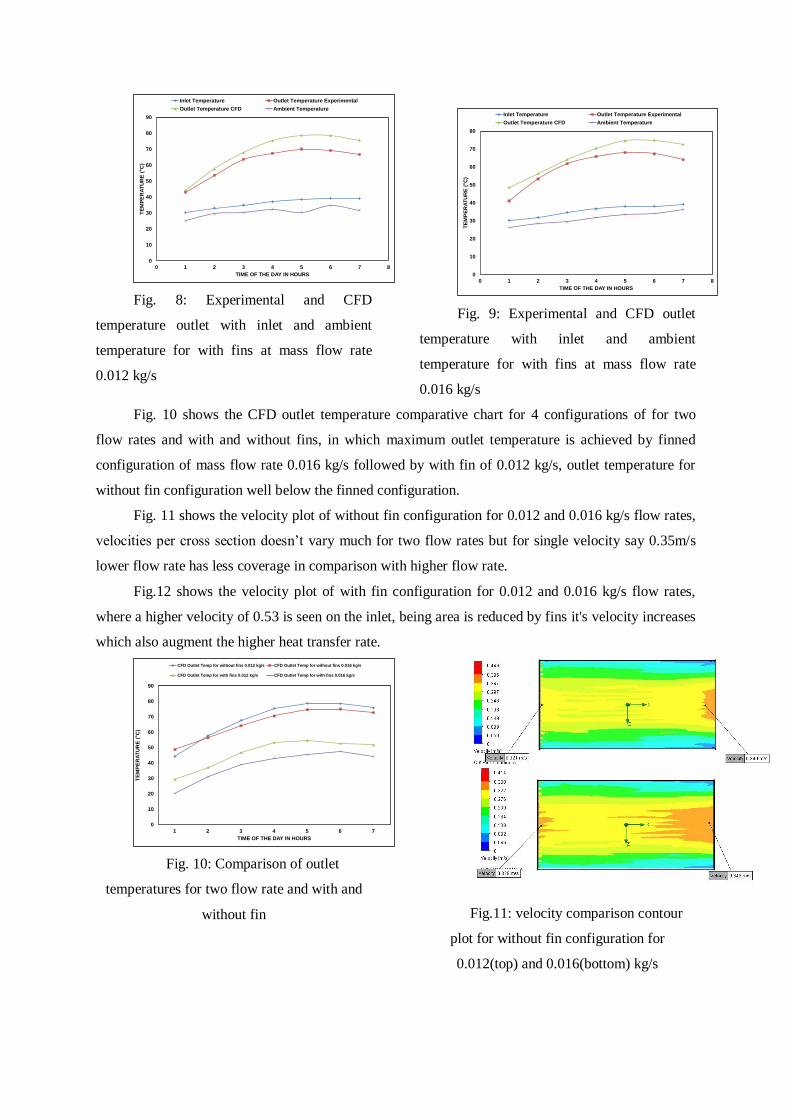
Fig. 8: Experimental and CFD
temperature outlet with inlet and ambient
temperature for with fins at mass flow rate
0.012 kg/s
Fig. 9: Experimental and CFD outlet
temperature with inlet and ambient
temperature for with fins at mass flow rate
0.016 kg/s
Fig. 10 shows the CFD outlet temperature comparative chart for 4 configurations of for two
flow rates and with and without fins, in which maximum outlet temperature is achieved by finned
configuration of mass flow rate 0.016 kg/s followed by with fin of 0.012 kg/s, outlet temperature for
without fin configuration well below the finned configuration.
Fig. 11 shows the velocity plot of without fin configuration for 0.012 and 0.016 kg/s flow rates,
velocities per cross section doesn’t vary much for two flow rates but for single velocity say 0.35m/s
lower flow rate has less coverage in comparison with higher flow rate.
Fig.12 shows the velocity plot of with fin configuration for 0.012 and 0.016 kg/s flow rates,
where a higher velocity of 0.53 is seen on the inlet, being area is reduced by fins it's velocity increases
which also augment the higher heat transfer rate.
Fig. 10: Comparison of outlet
temperatures for two flow rate and with and
without fin
Fig.11: velocity comparison contour
plot for without fin configuration for
0.012(top) and 0.016(bottom) kg/s
0
10
20
30
40
50
60
70
80
90
0 1 2 3 4 5 6 7 8
TE
MP
ER
AT
UR
E ( C
)
TIME OF THE DAY IN HOURS
Inlet Temperature Outlet Temperature Experimental
Outlet Temperature CFD Ambient Temperature
0
10
20
30
40
50
60
70
80
0 1 2 3 4 5 6 7 8
TE
MP
ER
AT
UR
E ( C
)
TIME OF THE DAY IN HOURS
Inlet Temperature Outlet Temperature Experimental
Outlet Temperature CFD Ambient Temperature
0
10
20
30
40
50
60
70
80
90
1 2 3 4 5 6 7
TE
MP
ER
AT
UR
E ( C
)
TIME OF THE DAY IN HOURS
CFD Outlet Temp for without fins 0.012 kg/s CFD Outlet Temp for without fins 0.016 kg/s
CFD Outlet Temp for with fins 0.012 kg/s CFD Outlet Temp for with fins 0.016 kg/s
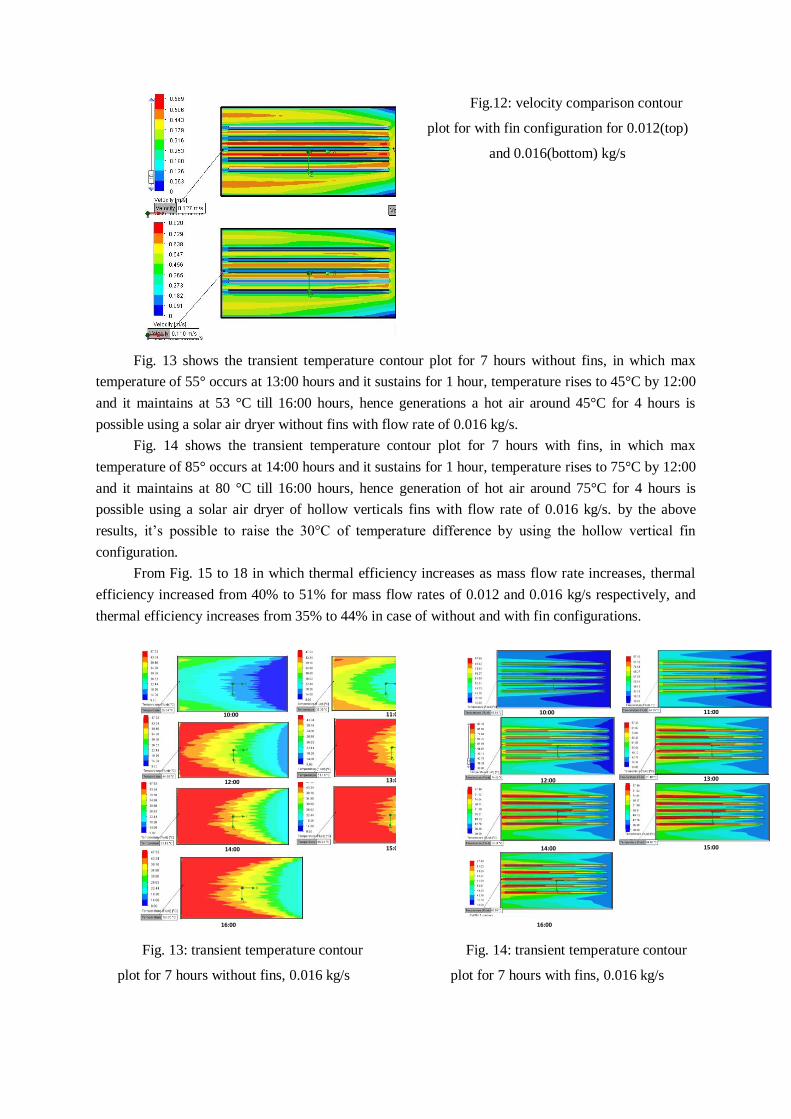
Fig.12: velocity comparison contour
plot for with fin configuration for 0.012(top)
and 0.016(bottom) kg/s
Fig. 13 shows the transient temperature contour plot for 7 hours without fins, in which max
temperature of 55° occurs at 13:00 hours and it sustains for 1 hour, temperature rises to 45°C by 12:00
and it maintains at 53 °C till 16:00 hours, hence generations a hot air around 45°C for 4 hours is
possible using a solar air dryer without fins with flow rate of 0.016 kg/s.
Fig. 14 shows the transient temperature contour plot for 7 hours with fins, in which max
temperature of 85° occurs at 14:00 hours and it sustains for 1 hour, temperature rises to 75°C by 12:00
and it maintains at 80 °C till 16:00 hours, hence generation of hot air around 75°C for 4 hours is
possible using a solar air dryer of hollow verticals fins with flow rate of 0.016 kg/s. by the above
results, it’s possible to raise the 30°C of temperature difference by using the hollow vertical fin
configuration.
From Fig. 15 to 18 in which thermal efficiency increases as mass flow rate increases, thermal
efficiency increased from 40% to 51% for mass flow rates of 0.012 and 0.016 kg/s respectively, and
thermal efficiency increases from 35% to 44% in case of without and with fin configurations.
Fig. 13: transient temperature contour
plot for 7 hours without fins, 0.016 kg/s
Fig. 14: transient temperature contour
plot for 7 hours with fins, 0.016 kg/s
10:00 11:00
12:00 13:00
14:00 15:00
16:00
10:00 11:00
12:00 13:00
14:00 15:00
16:00
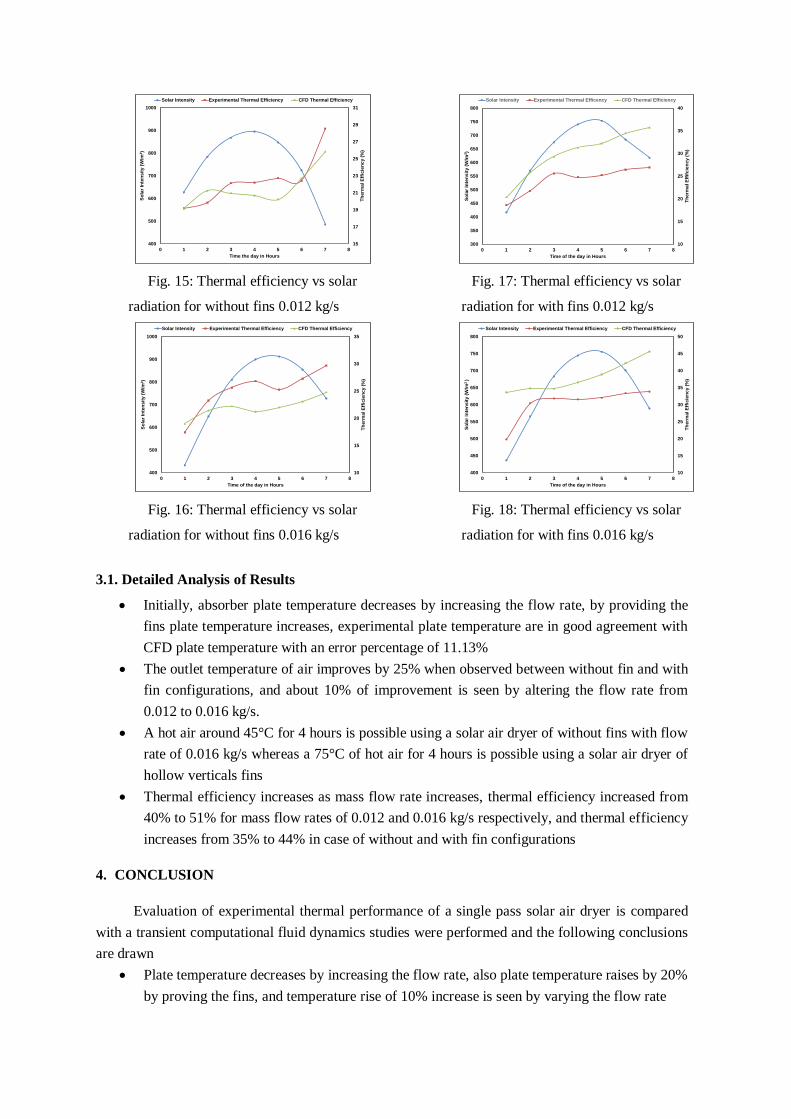
Fig. 15: Thermal efficiency vs solar
radiation for without fins 0.012 kg/s
Fig. 16: Thermal efficiency vs solar
radiation for without fins 0.016 kg/s
Fig. 17: Thermal efficiency vs solar
radiation for with fins 0.012 kg/s
Fig. 18: Thermal efficiency vs solar
radiation for with fins 0.016 kg/s
3.1. Detailed Analysis of Results
Initially, absorber plate temperature decreases by increasing the flow rate, by providing the
fins plate temperature increases, experimental plate temperature are in good agreement with
CFD plate temperature with an error percentage of 11.13%
The outlet temperature of air improves by 25% when observed between without fin and with
fin configurations, and about 10% of improvement is seen by altering the flow rate from
0.012 to 0.016 kg/s.
A hot air around 45°C for 4 hours is possible using a solar air dryer of without fins with flow
rate of 0.016 kg/s whereas a 75°C of hot air for 4 hours is possible using a solar air dryer of
hollow verticals fins
Thermal efficiency increases as mass flow rate increases, thermal efficiency increased from
40% to 51% for mass flow rates of 0.012 and 0.016 kg/s respectively, and thermal efficiency
increases from 35% to 44% in case of without and with fin configurations
4. CONCLUSION
Evaluation of experimental thermal performance of a single pass solar air dryer is compared
with a transient computational fluid dynamics studies were performed and the following conclusions
are drawn
Plate temperature decreases by increasing the flow rate, also plate temperature raises by 20%
by proving the fins, and temperature rise of 10% increase is seen by varying the flow rate
15
17
19
21
23
25
27
29
31
400
500
600
700
800
900
1000
0 1 2 3 4 5 6 7 8
Th
erm
al E
ffic
ien
cy (
%)
So
lar
Inte
nsit
y (
W/m
2)
Time the day in Hours
Solar Intensity Experimental Thermal Efficiency CFD Thermal Efficiency
10
15
20
25
30
35
400
500
600
700
800
900
1000
0 1 2 3 4 5 6 7 8
Th
erm
al E
ffic
ien
cy (
%)
So
lar
Inte
nsit
y (
W/m
2)
Time of the day in Hours
Solar Intensity Experimental Thermal Efficiency CFD Thermal Efficiency
10
15
20
25
30
35
40
300
350
400
450
500
550
600
650
700
750
800
0 1 2 3 4 5 6 7 8
Th
erm
al E
ffif
cie
ncy (
%)
So
lar
Inte
nsit
y (
W/m
2)
Time of the day in Hours
Solar Intensity Experimental Thermal Efficency CFD Thermal Efficiency
10
15
20
25
30
35
40
45
50
400
450
500
550
600
650
700
750
800
0 1 2 3 4 5 6 7 8
Th
erm
al E
ffic
ien
cy (
%)
So
lar
Inte
nsit
y (
W/m
2 )
Time of the day in Hours
Solar Intensity Experimental Thermal Efficiency CFD Thermal Efficiency
Experimental versus CFD result for plate temperature is in good agreement with a maximum
error percentage of 11.13%.
Outlet temperature for 4 cases two flow rates, with fin and without fin are in good agreement
with experimental results with maximum error percentage 12%
25% of improvement in outlet temperature was observed between without fin and with fin
configurations, and about 10% of improvement is seen by altering the flow rate from 0.012
to 0.016 kg/s.
Hot air generation of around 75°C for 4 hours is possible using a solar air dryer of hollow
verticals fins with a flow rate of 0.016 kg/s.
It is possible to raise 30°C of temperature difference by using the hollow vertical fin
configuration
Thermal efficiency is increased from 40% to 51% for mass flow rates of 0.012 and 0.016
kg/s respectively, and thermal efficiency increases from 35% to 44% in case of without and
with fin configurations.
To conclude in a general point of view, solar air heater with fins will be beneficial in
improving thermal efficiency, generate of hot air for 4 hours at 75°C
References
[1.] Akpinar EK., et al., Experimental investigation of the thermal performance of
solar air heater having different obstacles on absorber plates. International communication
on Heat Mass Transfer 2010;37(4):416–21.
[2.] Karsli S., et al., Performance analysis of new-design solar air collectors for
drying applications. Renewable Energy 2007;32(10):1645–60.
[3.] Romdhane BS., et al., The air solar collectors: comparative study, introduction of
baffles to favor the heat transfer. Solar Energy 2007;81(1):139–49.
[4.] Wenfeng Gao., et al.,Wenxian Lin. Analytical and experimental studies on
the thermal performance of cross-corrugated and flat-plate solar air heaters.Applied Energy
84 (2007) 425–441.
[5.] H.M. Yeh, T.W. Cheng., et al., The influences of recycle on performance
of baffled double-pass flat-plate solar air heaters with internal fins attached.Applied Energy
86 (2009) 1470–1478.
[6.] EminBilgili b., et al., Experimental investigation of three different solar air
heaters: Energy and exergy analyses.Applied Energy 87 (2010) 2953–2973.
[7.] L.B.Y. Aldabbagh., et al., Experimental performance of single and double
pass solar air heater with fins and steel wire mesh as absorber.Applied Energy 87 (2010)
3759–3765.
[8.] S. Aboul-Enein., et al., Thermal performance investigation of double pass-
finned plate solar air heater.Applied Energy 88 (2011) 1727–1739.
[9.] Singh D, Bansal NK., et al., Analysis of a glass solar air heater. Energy
Conversion mgnt 1983;23(4):231–6.
[10.] Ozgen F, Esen M, Esen H., et al., Experimental of an investigation of thermal
performance double-flow solar air heater having aluminium cans. Renewable Energy 2009;
34:2391–8.
[11.] Deep Singh Thakur., et al., Performance evaluation of solar air heater with novel
hyperbolic rib geometry, Renewable Energy Volume 105, May 2017, Pages 786–797
[12.] Vipin B. Gawande., et al., Experimental and CFD investigation of convection
heat transfer in solar air heater with reverse L-shaped ribs, Solar Energy Volume 131, June
2016, Pages 275–295
[13.] Yadav AS, Bhagoria JL., et al., A numerical investigation of square sectioned
transverse rib roughened solar air heater. Int J ThermSci2014;79:111–31.
[14.] FouedChabanea,b., et al.,Experimental study of heat transfer and thermal
performance with longitudinal fins of solar air heater, Journal of advanced research, 2013; 1-10
[15.] AniketShrikantAmbekar., et al., CFD simulation study of shell and tube heat
exchangers with different baffle segment configurations, Applied Thermal Energy, 2016;108 –
Pg.No. 999-1007
[16.] Debayan Das., et al., Role of distributed/discrete solar heaters during natural
convection in the square and triangular cavities: CFD and heatline simulations, Solar Energy
135 (2016) 130–153
[17.] Boulemtafes–boakudoum., et al.,Cfd based analysis of heat transfer enhancement in
solar air heater provided with transfer rectangular ribs, Energy Procedia 50 ( 2014 ) 761 –
772.
[18.] Anil Singh Yadav., et al.,A CFD (computationalfluid dynamics) based heat transfer
and fluid flow analysis of a solar air heater provided with circular transverse wire rib roughness
on the absorber plate, Energy 55 (2013) 1127e1142.
[19.] Anil Singh Yadav., et al., A CFD based thermo-hydraulic performance analysis of
an artificially roughened solar air heater having equilateral triangular sectioned rib roughness on
the absorber plate, International Journal of Heat and Mass Transfer 70 (2014) 1016–1039.
[20.] Keguang Yao, Tong Li., et al., Performance evaluation of all-glass evacuated tube
solar water heater with twist tape inserts using CFD,Energy Procedia 70 ( 2015 ) 332 – 339.
[21.] Vipin B. Gawande., et al., Experimental and CFD investigation of convection heat
transfer in solar air heater with reverse L-shaped ribs, Solar Energy 131 (2016) 275–295.
[22.] Alsanossi M., et al., Performance analysis of solar air heater with jet impingement
on corrugated absorber plate’, Case Studies in Thermal Engineering 10 (2017) 111–120.
[23.] Solid works flow simulations software manual