Embed Size (px)
Citation preview
LA-UR-99-1O55
Appmvadforpubfic release;dskibut,bni.sunlimi fad
7it/e: LASER HELD IMAGING THROUGH FOURIERTRANSFORM HETERODYNE
AuIhor(s): Bradly J. Cooke, Amy E. Galbraith, Bryan E. Laubscher, Charlie E.Strauss, Nicholas L. Olivas, and Andrew C. Grubler -
Submit!ed to: SPIE AeroSenSe, Laser Radar Technology and Applications IV, 5-9April 1999, Marriot World Center, Orlando FL
Los AlamosNATIONAL LABORATORY
Los Alamos National Laboratory, an affirmative actiorrlequal opportunity employer, is operated by ttre University of California for the U.S.Department of Enargy under canfract W-7405-ENG-36.f3y acceptance of this artffle, the pubfisher recognizes that the U.S. Governmentretains a nonexduslve, royalty-free ficense to pubffsh or reproduce the pubtished form of this contribution, or to allow olhera to do so, for U.S.Government purposes. Los Afamos National Laboratory requests that the pubfisher identify this article as work performed under theausplcas of the U.S. Department of Energy. Los Alamos National laboratory strongly supports academic freedom and a researcher’s right topublish: as an institution, however, the Uboratory does not endorse the viewpoint of a pubffcation or guarantee its technical correctness.
Form 836 (10/96)
-.— . . ... . .,. r.. .-7-T. , .:. ..,-n .?@ ,:n<-- - --,.. -,’- =T-—r -- =— ‘-- -—-

DISCLAIMER
This report was,.prepared as an account of work sponsoredby an agency of the United States Government. Neitherthe United States Government nor any agency thereof, norany of their employees, make any warranty, express orimplied, or assumes any legal liability or responsibility forthe accuracy, completeness, or usefulness of anyinformation, apparatus, product, or process disclosed, orrepresents that its use would not infringe privately ownedrights. Reference herein to any specific commercialproduct, process, or service by trade name, trademark,manufacturer, or otherwise does not necessarily constituteor imply its endorsement, recommendation, or favoring bythe United States Government or any agency thereof. Theviews and opinions of authors expressed herein do notnecessarily state or reflect those of the United StatesGovernment or any agency thereof.

DISCLAIMER
Portions of this document may be illegiblein electronic image products. Images areproduced from the best available originaldocument.
.
Laser Field Imaging Through Fourier Transform Heterodyne
Bradly J. Cooke, Amy E. Galbraith+, Bryan E. Laubscher, Charlie E. Strauss,Nicholas L. Olivas, and Andrew C. Gruble~
LcIsAkunosNationalLaboratoryP.O. BOX 1663, MS-IM48
LQS AkUIIOS, NM 87545 4‘e
(?
Jj)) @/&
Q Q+ @&ABSTRACT 6?> @
(’We present a detection”process capable of directly imaging the transverse amplitud , phase,and Doppler shift of coherent electromagnetic fields. Based on coherent detection principlesgoverning conventional heterodyned RADANLADAR systems, Fourier Transform Heterodyneincorporates transverse spatial encoding of the reference local oscillator for image capture.Appropriate selection of spatia[ encoding finctions allows image retrieval by Way ofclassicFourier manipulations. Of practical interest: (i) imaging maybe accomplished with a singleelement detector/sensor requiring no additional scanning or moving components, (ii) as detectionis governed by heterodyne principles, near quantum limited petiormance is achievable, (iii) awide variety of appropriate spatial encoding fimctions exist that may be adaptively configured inreal-time for applications requiring optimal detection, and (iv) the concept is general with theapplicable electromagnetic spectrum encompassing the RF through optical.,. -
Key Words: Coherent Field Imaging, Laser Imaging, Laser Radar, Heterodyne Detection.
1.0 INTRODUCTION
Central to Fourier Transform Heterodyne (FTH) field imaging is the concept of a Fourierprojection operator through which the image field is decomposed into Fourier states via adetection process employing familiar heterodyne detection principles. The ability to spatiallyimage and manipulate both amplitude and phase of optical coherent electromagnetic fieldsenables important adaptations of current Laser Radar (LADAR) systems. Candidate LADARfi.mctions, potentially enhanced through exploitation of spatial field imaging, include targetclassification and identification, Doppler field imaging, optimized target discrimination andclutter suppression through spatial filtering, and deployment of coherently phased optical arrays.Additionally, phase imaging permits the measuring, and hence correction of phase-frontdistortion imposed by atmosphere and receiver optics. A coherent receiver capable ofunobtrusively tracking and correcting atmospheric induced phase-front error may permit therealization of large aperture, long-range communication systems, 1while the direct andunambiguous measurement of wavefront distortion may be applied to the development oflightweight, space-borne deployable optical apertures.
+E1cclricaI and ComputerEngineeringDepartnmM,Universityof Arizona‘ Unilcd S(atcs Naval Academy, P.O. Box 12939, Annapolis,MD21412
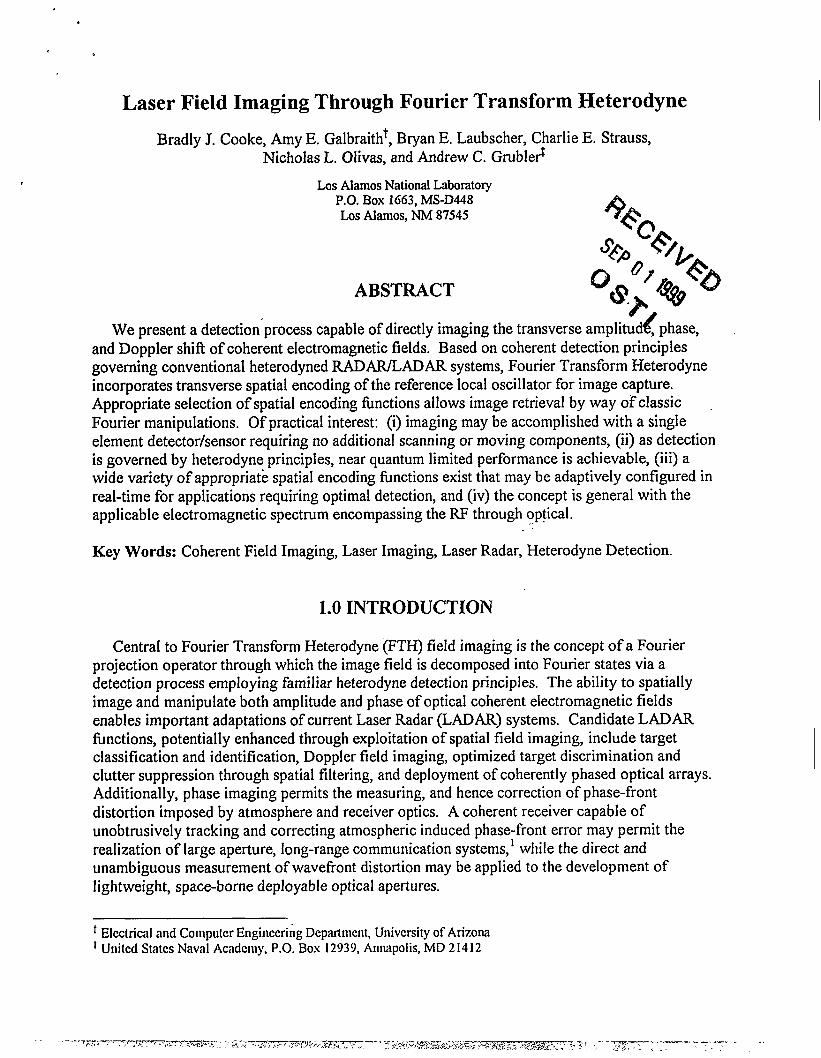
Y Transverse Field (Co-Phasal Surface)
z, t
Figure 1. Transverseand longitudinalcomponentsofpropagatingelectromagneticfield.
L1. Field Imaging
The transverse and longitudinalcomponents of a propagating coherentelectromagnetic field are shown in Figure 1.The spatial amplitude and phase distributionscomprising the transverse field lie in a two-dimensional surface normal to thelongitudinal direction of propagation withconstant phase surfaces spaced a wavelengthapart2. The propagating field conveys imageinformation to an observer at z through thetemporal variations in the spatial amplitudeand phase distribution. Observing (imaging)the field with eyes, film, CCD camera or other
photosensitive device subjects the transverse field to a process referred to as squared modulus orsquare-law detection.3 The square-law imaging of a complex field composed of a spatialamplitude and phase distribution, d%ag,, results in the observer imaging the field’s iniensity4
Ii ~ Q,moge2, . [1]
whereby all spatial phase information lost. Preservation of both spatial amplitude and phaseprompts a detection process that sidesteps the limitations imposed by the square-law operation.
The goal of this paper is the introduction of a detection process that circumvents the square-law limitations, and therefore, is capable of directly imaging the transverse amplitude and phaseof coherent electromagnetic fields. Section 2 introduces the underlying principles governingFTH field detection through the calculus of Fourier spatial projection operators, while Section 3demonstrates Fourier projection concepts and field imaging via a simple experimental setupbased on a HeNe laser and a 69 element spatial phase modulator. Finally, practicalconsiderations followed by several LADAR examples exploiting spatial field imaging aredescribed in Section 4. It should be noted that while the emphasis of this paper is on systemsoperating in sub-millimeter through optical wavelengths (i.e. physical-optics approximationswhere the transverse dimensions of the field, aperture, and other sutiace curvatures are largecompared to wavelength), the theory is relatively general and in many cases is readily extendedto longer wavelength systems.
2.0 FOURIER TRANSFORM HETERODYNE
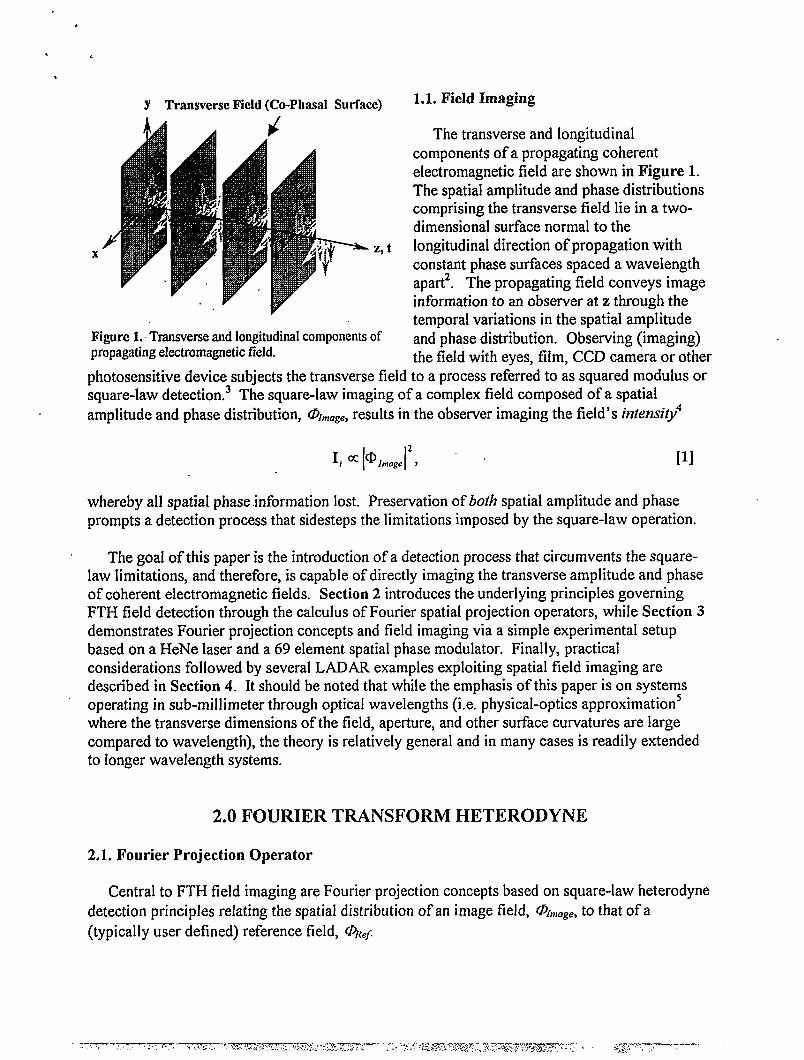
2.1. Fourier Projection Operator
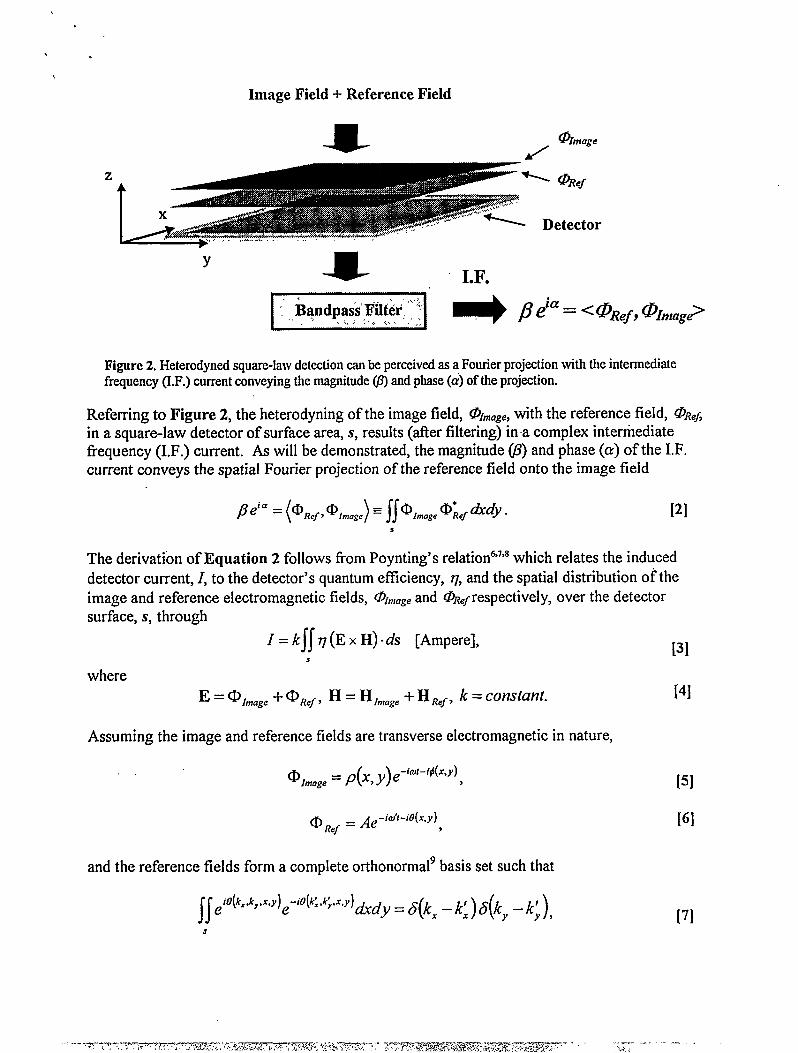
Central to FTH field imaging are Fourier projection concepts based on square-law heterodynedetection principles relating the spatial distribution of an image field, @%,,~~~,to that of a(typically user defined) reference field, @R~~
.
Image Field + Reference Field
mz fief
etector
mY
I.F.
Gmage
A/
Figure 2. Heterodynedsquare-law detection em be pereeived as a Fourier projection with the intermediatefrequency (1.F.) current conveying the magnitude (JI)and phase (i) of the projection.
Referring to Figure 2, the heterodyning of the image field, @I~~~~,with the reference field, Q%?Jin a square-law detector of surface area,s, results (after filtering) in a complex intermediatefrequency (1.F.) current. As will be demonstrated, the magnitude@) and phase (a) of the I.F.current conveys the spatial Fourier projection of the reference field onto the image field
P“” =(@[email protected]) = ~~alm.g.‘Lf&dY - [2]s
The derivation of Equation 2 follows fi-omPoynting’s relationa’g which relates the induceddetector current, 1, to the detector’s quantum efilciency, q, and the spatial distribution of theimage and reference electromagnetic fields, @rouge and dk~respectively,overthedetectorsurface,s, through
1 = k~~ q (E x H) “ds [Ampere], [3]s
whereE = CD,~O~.+ CD~eJ,H = H,..~. + H~eJ,k = constant. [4]
Assuming the image and reference fields are transverse electromagnetic in nature,
,.@ ,mage = p(x,y)e-faf-’+(x’y),
@ ~e~= ~e-id-if%f.y),
and the reference fields form a complete orthonormalg basis set such that
1!iO(k=,ky.x,y)e-iO(k:,k;,x,y)e dxdy = c$(kx-k;)~(k, -k;),s
[5]
[6]
[7]
then the detector current at the intermediate frequency, ZIO= o-o< reduces to
I(kx, kY,A@)=2kAqfRe[Jf@,m~g6(x,y)eia’t+’’’kJyxY’dxdy]s
[8]
= 2kA[
‘fl(kx,kY)coS(A@~ +a(kx,k,)) [Ampere]. , [9]P
Complex Fourier coefficients, C(kX,kY)a~k.,k,) e’a(kx’~’),can then be formed from the I.F.
current’s complex phase and magnitude, resulting in the following transform pair relating theimage field, complex Fourier coefficient and reference basis set:
(x )e/o(k..k,,x.y)&dy ~ @]mage4%%)=JpfmageYY (x,Y)= f~C(kx,kY)e-i’(k’JJx’Y)dkxdky. [10]s s
In general, spatial variations maybe present in both the reference beam and detection quantumefficiency. Taking these variations into account, Equation 8 would be rewritten as
~Re[~~~(x,y)@,m.ge(xY)@..f(x,yydxdy],I(kx,kY,Aa)= 2k ,
( )= p’(~,y)e-’@’f-iO(x,y) .with CD~.~ x, Y
[11]
[12]
Finally, if the image field is heterodyned with a discrete set of reference fields (~e{k~) + Q,n),
then Equation 11 reduces to the following Fourier expansion pair
@,m.g.(x,Y,Acoi) = @,m.ge(~,y,~) = ~~Ci,m..@m,.(x,Y),mn
ci,m.n ( )( ) J= CDm.n, CD,n,age , CDm.n, Q,mage = @,m~ge@;,#rdy.
[13]
[14]s
The bracket operator notation of Equation 2 has been introduced to simplify notation andconvey the field projection nature of the operation. Additionally, the index/, representing the ~hI.F. bandpass frequency (zla$ has been included to account for Doppler shifts.
Of practical interest in the development of synthetic apertures and multi-element detectors(such as focal plane arrays and phased array’” receivers), the detecting sutiace, S, can bepartitioned into multiple detection surfaces and coherently summed in the following manner
Jq..geq.nd@Y = xjp,mag.%d@Y . [15]s JI s,
.
@
SourceTarget
:JJ~F;3:=lVCn,n............................
nl,tJ
Aperture ~2-D Spatial Modulator
K~..................
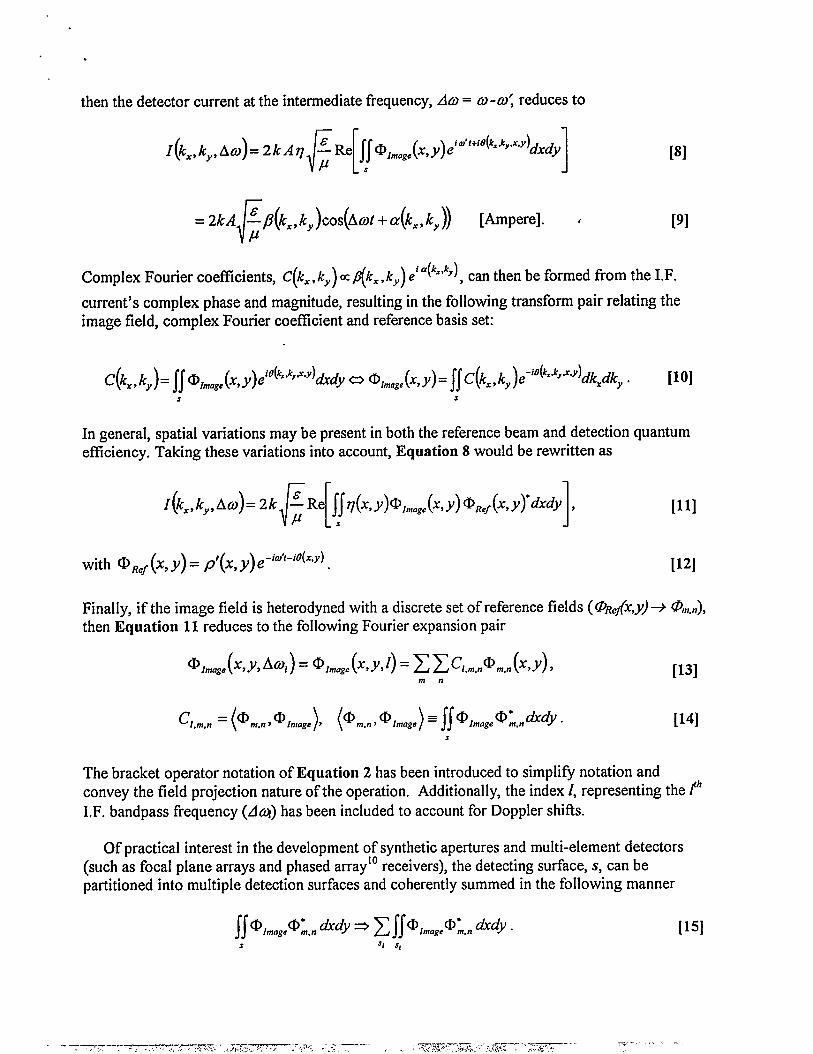
Figure 3. Fourier Transform Heterodyne field imaging. Based on coherent deteetion principles, FITIapplies Fourier projection concepts through the transverse spatial encoding (@~J of the local oscillator forelectromagnetic field capture. FTH presetves both spatial amplitude and phase information.
Finally, generalized to three-dimensional (3-D) surfaces, the Fourier projection oPeratorconveys the degree of correlation between image and reference fields,
[16]
s s
where J is the induced current density, / the time variable, p the field polarization and A thewavelength. The projection is maximized when image and reference field states are matched(matched filter condition). Field states may be tailored to introduce signal uniqueness, and/ornoise and clutter suppression for the design of optimal detection processes. Spatial and temporalfield states include time, frequency, polarization, and spatial amplitude and phase.
2.2. FTH Field Imaging
Applying Equations 13-14, and referring to Figure 3, the basic steps involved in imagefield capture follow:
●
●
●
Heterodyne the image field, @l~d~e,with the local oscillator (I.e.) whose transverse amplitudeand phase is sequential y modulated with a known set of reference spatial phase finctions,@~.f= @~,n,that span a valid basis set.
Measure the projected detector current’s magnitude and phase and form the complex Fouriercoefficient, CM,~,for each spatial function, @m,n.
Through Equation 13, reconstruct the image field from the basis functions, @~,n,and the
O,mag.(x,y)=~~L,[email protected](%Y)mn
While a single element system is demonstrated in Figure 3, image capture rates maybe improvedthrough reference field partitioning, multi-element detection, and frequency multiplexing.
. .
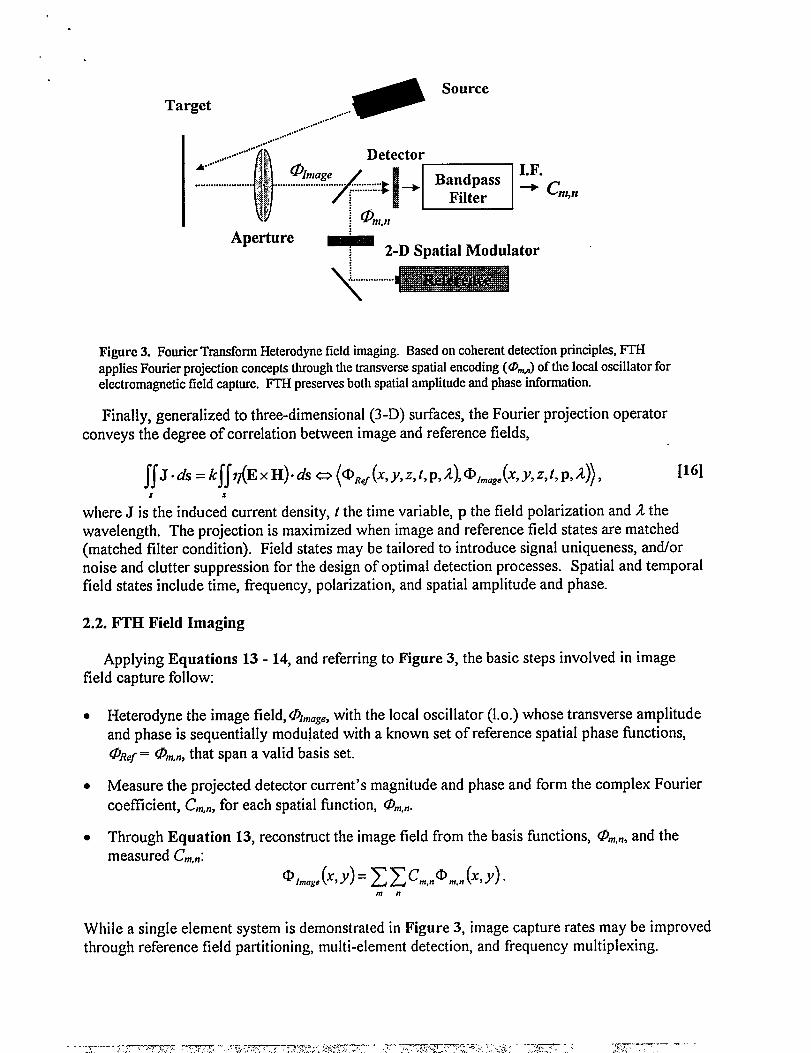
3.0 EXPERIMENT
A simple experiment demonstrating the FTH concept has been constructed. Illustrated inFigure 4 with photographed apparatus in Figure 5, the experiment implements a Zeeman split.HeNe laser (~= 250 kHz) for source and local-oscillator lines, and a 69 element spatial phasemodulator to encode the 36 term basis used in the experiment. A description of the experimentalprocedure follows:
●
●
●
●
●
The two orthogonally polarized laser lines (Al= 250 kHz) at the output of the HeNe laser areseparated with the polarizing beam splitter into two beams paths.
,The first beam illuminates the target forming the image, @I~a~.,while the second beampasses through the 69-element spatial modulator generating the n’hreference term, d%,n =0,1,...,35.
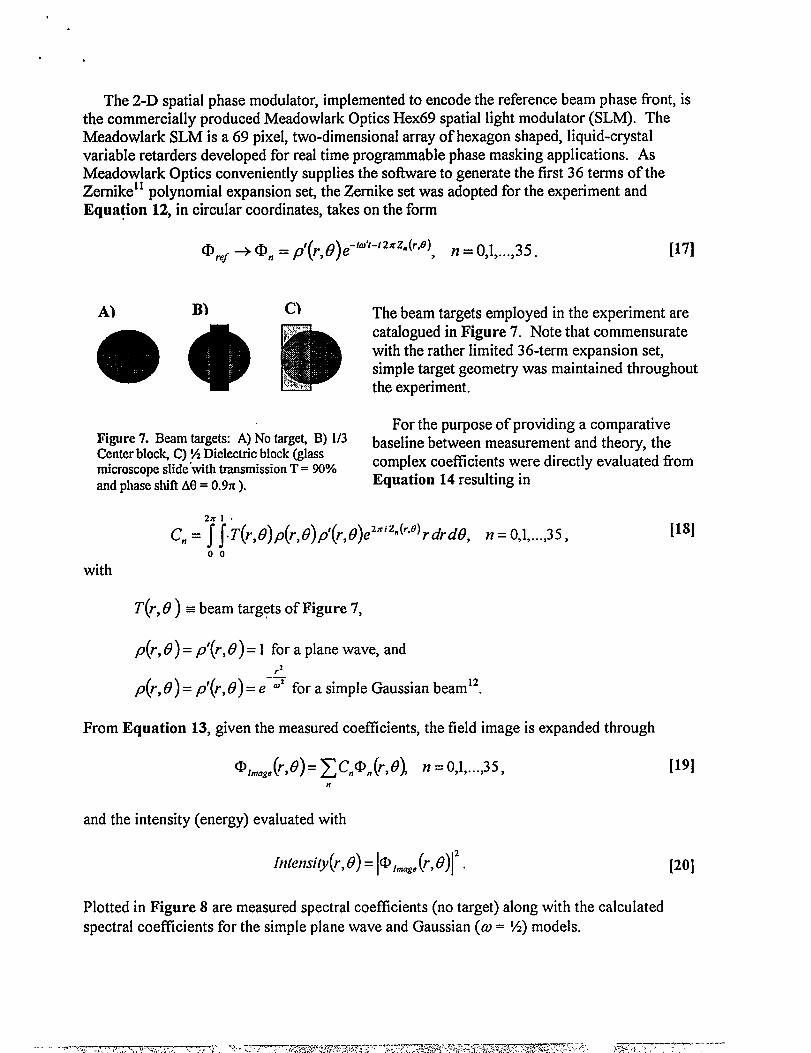
The two beams are recombined and heterodyned at the single-element silicon detectorgenerating a 250 kHz intermediate frequency current 1..
A digital oscilloscope measures the 250 kHz I.F. current’s phase and magnitude from whichthe Fourier coefficients, C., are formed (see Figure 6).
Once all 36 basis coefficients, C., n = 0,1,...,35, are sequentially measured, the resultingmagnitude and phase of the detected image, @,~*~;,are displayed on the computer screen...’..-,
Polarized
Zccman Beam Expander m
t
Half-Wave u*
Laseru
w Plate (45°) mJAf= 250 kHz 2-D Phase
m“m m
Modulator
T“
Elk(SLM) a
t
mam @,,
Beam Reducer J; @IntageDetector w s
I,,(1.F.=250 kHz) J
...... ,
.......... .. .........:
Computer
Figure 4. Schematic diagram of FTH experiment.
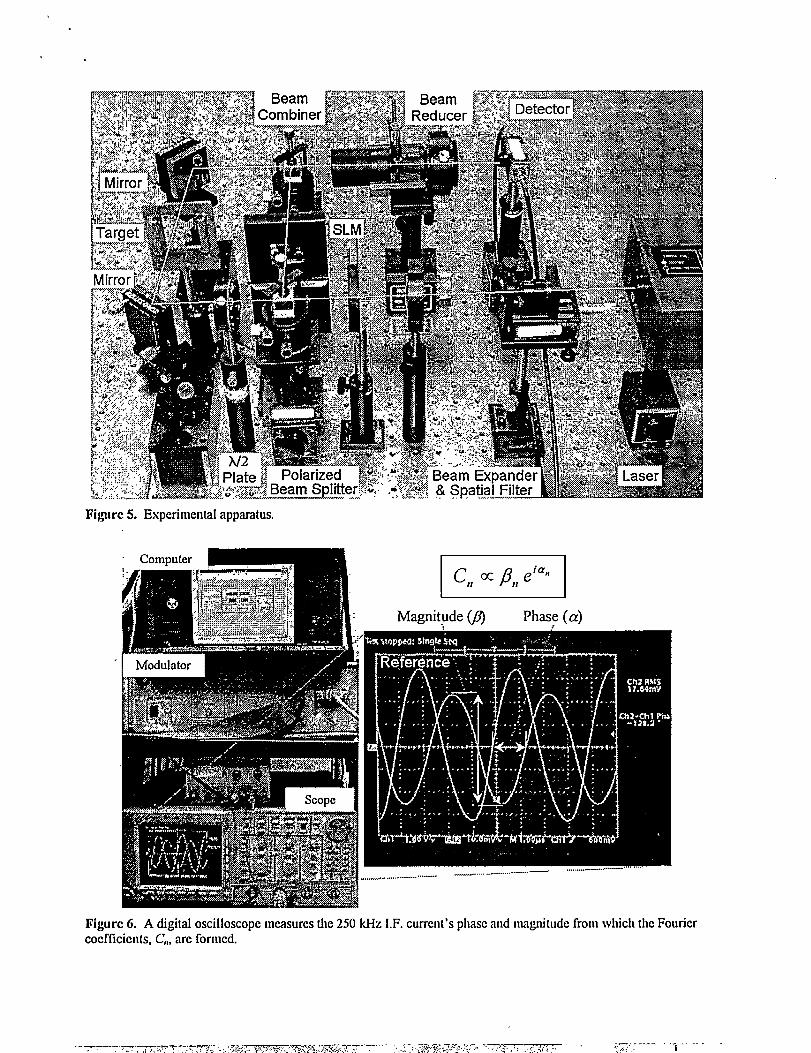
Figwe 5. Experimental apparatus.
C,, cc ~,, eia” IMagnitude @) Phase (a)
Figure 6. A digital oscilloscope measures the 250 Wz I.F. current’s phase and magnkdc from which the Fouriercocfficicnk, C., arc formed.
;,-,--- —-- - ----. -.,4. . . I
The 2-D spatial phase modulator, implemented to encode the reference beam phase front, isthe commercially produced Meadowlark Optics Hex69 spatial light modulator (SLM). TheMeadowlark SLM is a 69 pixel, two-dimensional array of hexagon shaped, liquid-crystalvariable retarders developed for real time programmable phase masking applications. AsMeadowlark Optics conveniently supplies the soflware to generate the first 36 terms of theZemikell polynomial expansion set, the Zemike set was adopted for the experiment andEquation 12, in circular coordinates, takes on the form
@,6f + O. = #(r,8)e-’0’’-’2zz”(r*o), n = 0,1,...,35. [17]
Figure 7. Beam targets: A) No targel B) 1/3Center block C)% Dielectric block (glassmicroscope slide ”withtransmission T = 90°/0
and phase shift AEI= 0.97c).
The beam targets employed in the experiment arecataloged in Figure 7. Note that commensuratewith the rather limited 36-term expansion set,simple target geometry was maintained throughoutthe experiment.
For the purpose of providing a comparativebaseline between measurement and theory, thecomplex coefilcients were directly evaluated fromEquation 14 resulting in
2JCI.
C.= f ~“T(r,0)p(r,0)p’(r,0)e2 *izn(r$e)rdrd0, n =01 3S [18]9 7.-., >
00
with
T(r, O) =beam targets of Figure 7,
p(r, 8) =p’(r, 8) =1 for a plane wave, and
p(r,d) =p’(r,e) =e-$ for a simple Gaussian beam12.
From Equation 13, given the measured coefficients, the field image is expanded through
@,mag,(r,t9)=~Cn@n(r,6j n= 0,1,...,35, [19]n
and the intensity (energy) evaluated with
lnfemify(r,d) = l@,mog,(r,8)12. [20]
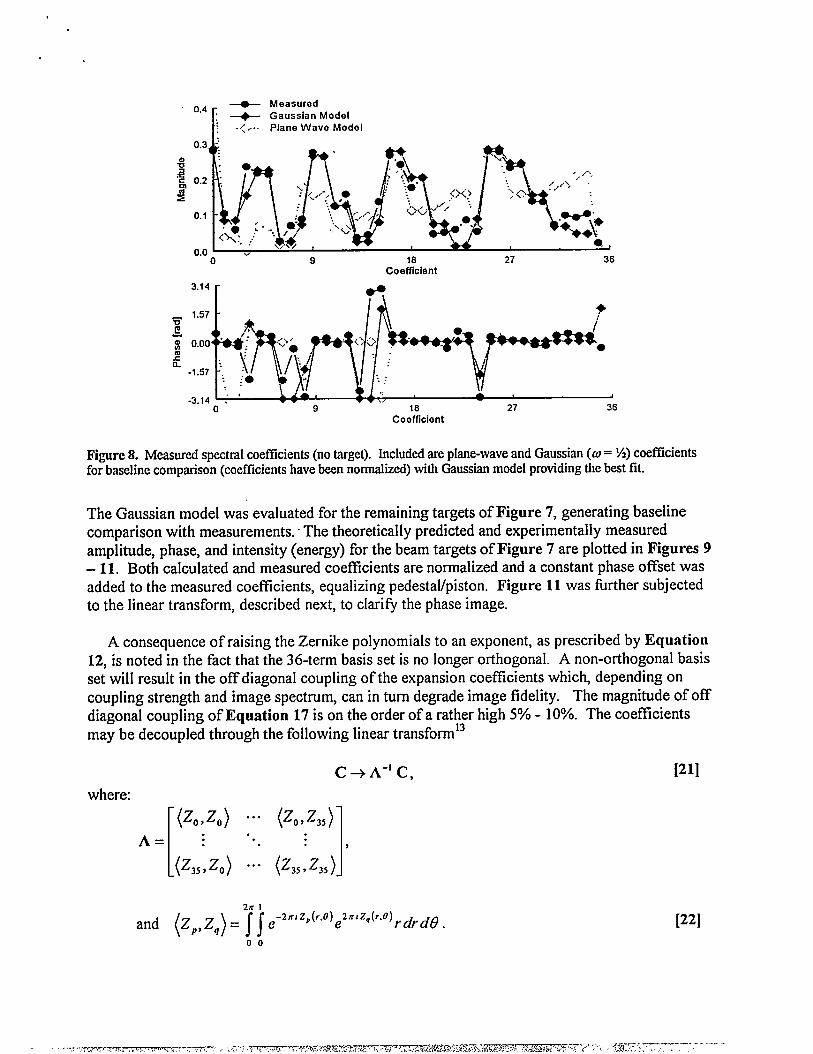
Plotted in Figure 8 are measured spectral coefllcients (no target) along with the calculatedspectral coefficients for the simple plane wave and Gaussian (O= %) models.
----- Measured-4- Gaussian Model
.<,.. Plane Wave Model
-...0 ‘“ 9 18 27 36
Coefficient
3.14 -#
1.57
:q~[~, y,
?6g$ 0.00 “; .<\ , . <><’ .’-O
x?
●
2
J
.. ,.
n -1.57 ~,/
;* ‘.. :.
-3.14 <,,./
o’ 9 18 27 36Coefficient
Figure 8. Measured spectral coefficients (no target). Included are plane-wave and Gaussian (O = %) coefficientsfor baseline comparison (coefficients have been normalized) with Gaussian model providing the best fit.
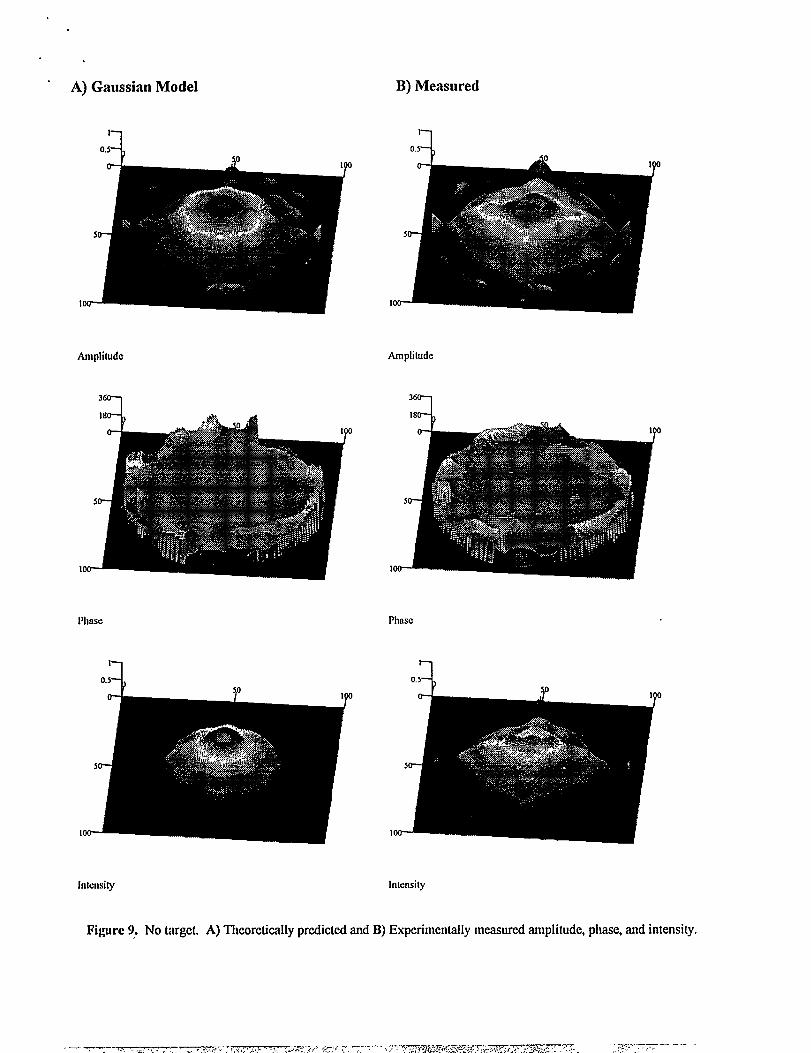
The Gaussian model was evaluated for the remaining targets of Figure 7, generating baselinecomparison with measurements. ~The theoretically predicted and experimentally measuredamplitude, phase, and intensity (energy) for the beam targets of Figure 7 are plotted in Figures 9-11. Both calculated and measured coefficients are normalized and a constant phase offset wasadded to the measured coefficients, equalizing pedestal/piston. Figure 11 was fhrther subjectedto the linear transform, described next, to clarify the phase image.
A consequence of raising the Zernike polynomials to an exponent, as prescribed by Equation12, is noted in the fact that the 36-term basis set is no longer orthogonal. A non-orthogonal basisset will result in the off diagonal coupling of the expansion coefllcients which, depending oncoupling strength and image spectrum, can in turn degrade image fidelity. The magnitude of offdiagonal coupling of Equation 17 is on the order of a rather high 5% - 10VO.The coefficientsmay be decoupled through the following linear transform13
C+ A-’C, [21]
where:
[
(20>20) ..” (%23,)
1
A= ; .“. ; ,
(%20) ..- (L>’Q
2X 1
) Hand (ZP, Z~ = e‘2n’z’(r”0)e2n’zq(r”O)rdrdQ.
00
[22]
.
“ A) Gaussian Model B) Measured
1
J0,5 .
100
Amplitude
3-1
5
1oo-
20.5
Amplitude
3
218
Iml
Phase Phase
20.5
Inknsity [ntcnsily
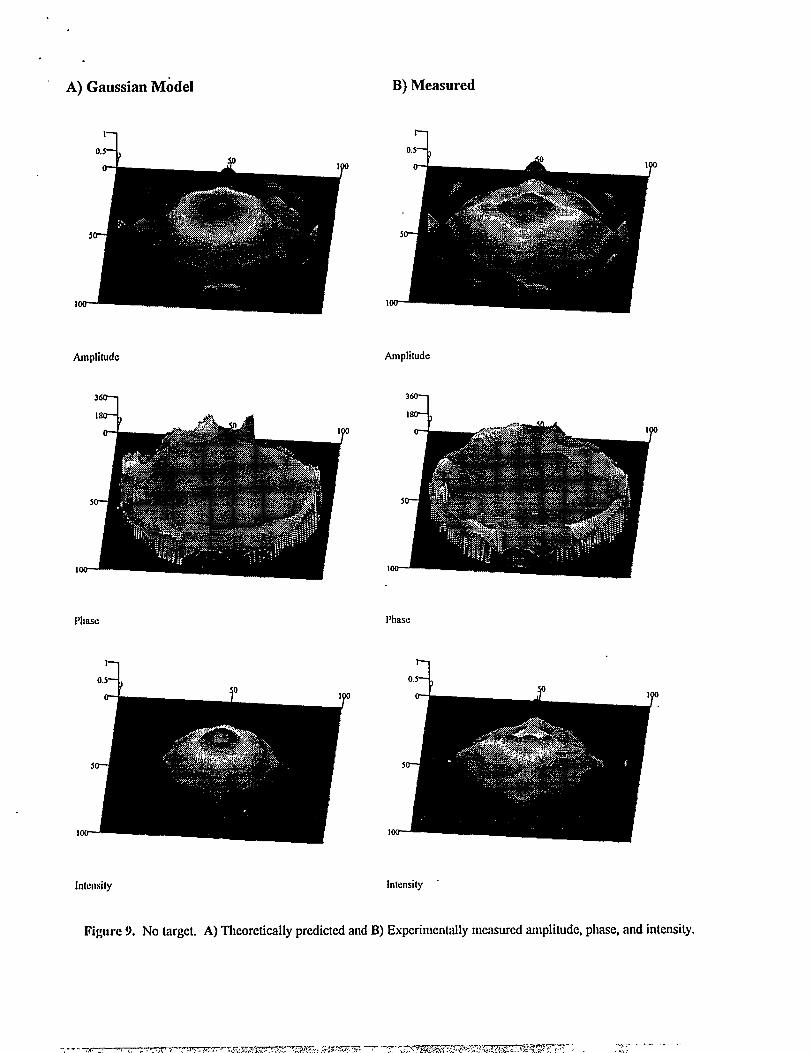
Figure 9: No Iargct. A) Theoreticallypredicted and B) Experimentally measured amplitude, phase, and intensity.
.
A) Gaussian Model
100
Amplitude
B) Measured
2.0.5
Asnplitudc
3
218
Phase Phase
20.s
Inlensily Inlensity “
Figure 9. No target. A) Theoretically predicted and B) Experimentally mcmurcd amplitude, phase, and intensity.
A) Gaussian Model B) Measured
5
Ice
Amplitude Amplitude
10+3
3
218
Phase Pha.sc
o-
m-
1oo-
o-
m-
1oo-
Phase Phase(Top View) (Top View)
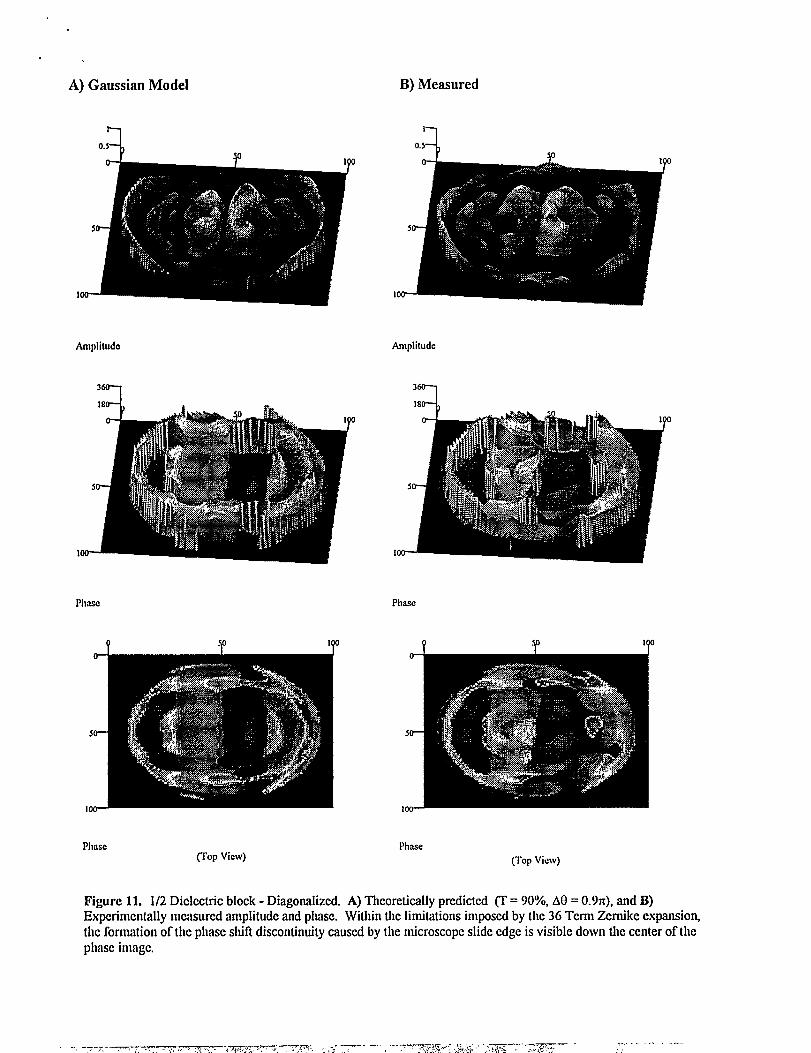
Figure 11. 1/2 Dielectric block - Diagonrdizcd. A) Theoretically predicted (T= 90%, Af3= 0.91r),and B)Experimentally measured amplitude and phase. Within the limitations imposed by the 36 Term Zcrnike cxpansionjthe formation of the phase shift discontinuity caused by [he microscope slide edge is visible down the center of thephase image.
The transform is sensitive to systematic errors including source coherence, pixel distribution andgeometry, and SLM phase drift that introduce deviations from the ideal basis finctions (a strongendorsement for the use of orthogonal basis sets), and hence difficult to apply in practice.However, the transform was successful in bringing out the phase structure of Figure 11. Withinthe limitations imposed by the 36-term expansion, the formation of the phase shift discontinuitycaused by the microscope slide edge is visible down the center of the phase image.
The primary purpose of the experiment is the demonstration of the underlying principlesgoverning FTH imaging. Images shown in Figures 9–11 do indeed indicate that the basicmechanisms expected, such as Fourier projection, are present and valid. However, care shouldbe taken when interpreting image content as the actual image essentially is filtered through therelatively low-resolution 36-term expansion window. Sharp amplitude and phase structure in theimaged field tends to excite energy into higher spatial modes that will fall outside of the 36-termwindow and result in image distortion.
4.0 CONSIDERATIONS & EXAMPLE APPLICATIONS
/
..\ i::~‘. ..> ,:’ : i
,.!
&:,:
B’-a_:::’i!:?’=~5:l-”’-’f ‘pa’ia’MOdu’atOr..“.. . . .
Expander ‘.. ...... ..
b
SM=.\ -..... ‘. Controller‘ ... ...
‘.Phase-Front Generation
.-/
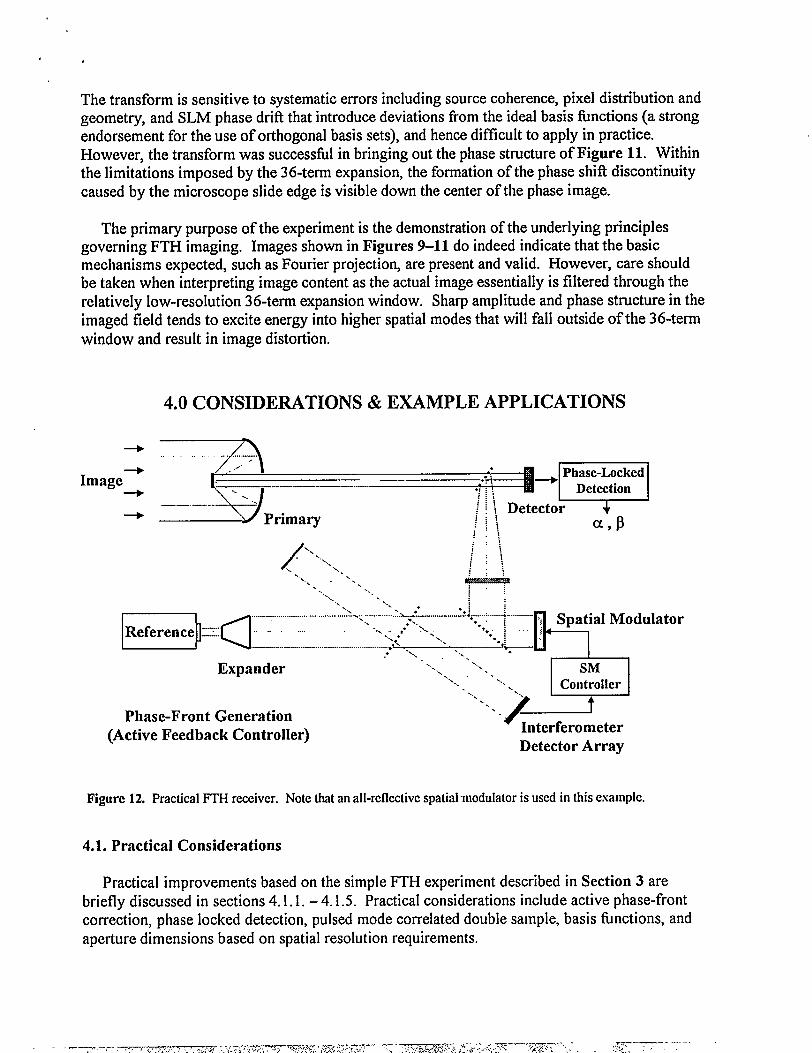
(Active Feedback Controller) ‘ Interferometer
Figure 12. Practical IWH reeeivcr.
.Detector Array
Note that an all-rcflcctivc spatial modulator is used in this example.
4.1. Practical Considerations
Practical improvements based on the simple FTH experiment described in Section 3 arebriefly discussed in sections 4.1.1. – 4.1.5. Practical considerations include active phase-frontcorrection, phase locked detection, pulsed mode correlated double sample, basis finctions, andaperture dimensions based on spatial resolution requirements.
4,1.1. Active Phase-Front Correction
The subsystem generating the spatial phase-fronts will require systematic monitoring andcalibration for the removal of phase distortion introduced, for example, by alignment error ormodulator drift. Inserting an interferometer into the phase-front beam path is one approach todirect wavefront monitoring of short-wavelength sub-mm through optical systems. Referring tothe phase-front generation subsystem of Figure 12, as the spatial modulator (SM) scans throughpre-programmed phase Iinctions, the interferometer array monitors the phase-front interferencedistribution and provides corrective feedback through the SM controller. Note that each SMelement must be programmable within a spatial phase-shift of at least ~ z (for the wavelength ofinterest) or larger depending on the feedback algorithm implemented.
4.1.2, Phase Locked Detection. .
Detection of coefficients requires the precision measurement of the I.F. phase and magnitude.Unlike the simple technique applied in the experiment of Section 3, precision high-speedacquisition is accomplished through techniques employing multi-pulse and I.F. phase-locking14for measurement of magnitude and phase (a and fl.
SourceTarget
~~#/{/-+\+‘......-...........s.... ........... 17/2 ............................... .̀.......................................F
+ +1== rg
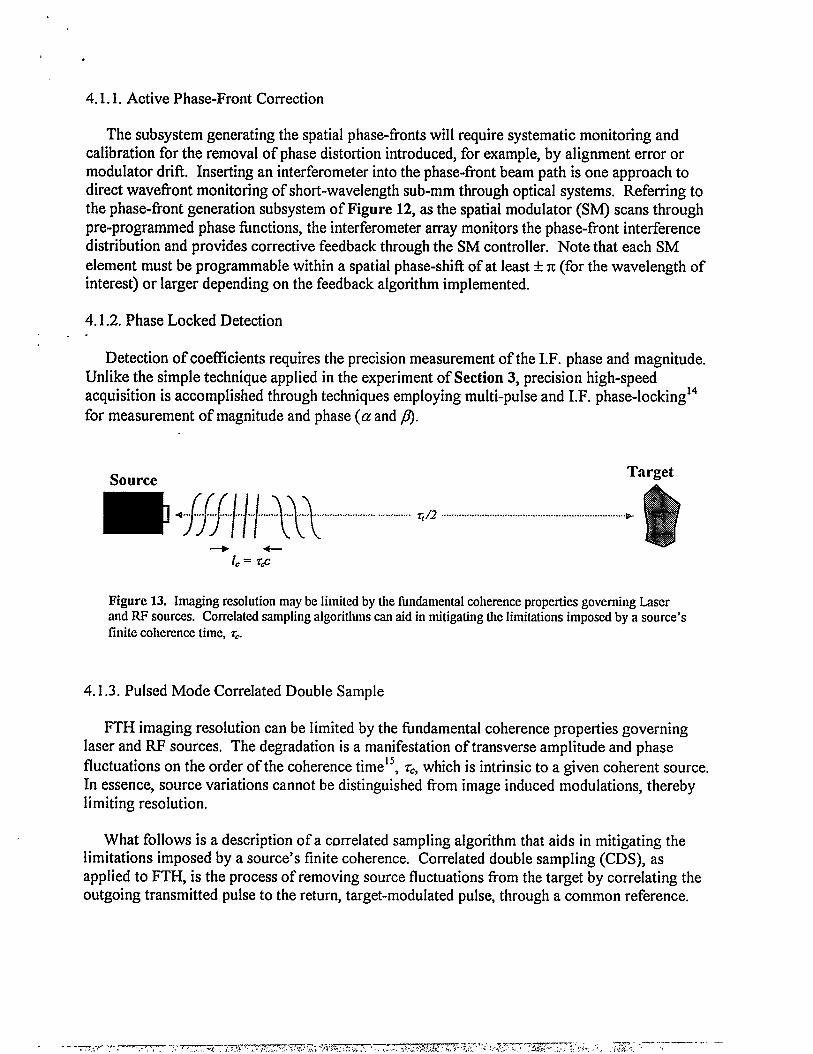
Figure 13. Imaging resolution may be Iimikxi by the fundamental coherence properties governing Laserand RF sources. Correlated sampling algorithms can aid in mitigating the limitations imposed by a source’sfinite coherence time, r=.
4.1.3. Pulsed Mode Correlated Double Sample
FTH imaging resolution can be limited by the fundamental coherence properties governinglaser and RF sources. The degradation is a manifestation of transverse amplitude and phasefluctuations on the order of the coherence timels, ~C,which is intrinsic to a given coherent source.In essence, source variations cannot be distinguished from image induced modulations, therebylimiting resolution.
What follows is a description of a cm-related sampling algorithm that aids in mitigating thelimitations imposed by a source’s finite coherence. Correlated double sampling (CDS), asapplied to FTH, is the process of removing source fluctuations from the target by correlating theoutgoing transmitted pulse to the return, target-modulated pulse, through a common reference.
.
For example, a pulsed transmitter-receiver system acquiring one coefficient C,n,nper pulsewould implement the following algorithm.
●
●
●
Measure the Fourier projection coefficient, Cx~,n,from the basis fhnction @,.,nof theoutgoing transmitted pulse. The measurement must be pefiormed within the sourcescoherence time r=.
Measure the Fourier projection coefficient, cRm,n, from the basis finction @,~,~of thetarget-modulated return pulse (after a transit time G).
Subtract the common transverse amplitude and phase error:ctn,n~m,n= (CR,.,.- cxm,~@m,n+ Cm,n= CRm,n- C’xm,n.
As both the outgoing and return pulses are compared to a common reference, it is essential thatthe reference field is properly conditioned (for example, spatially filtered) and stationary over thetransit time ti.. Note that as an additional benefit to employing CDS, any stationary spatial phaseor amplitude structure in the reference field will be subtracted out.
4.1.4. Basis Functions
FTH receivers, in general, may implement basis fi.mctions in which both amplitude and phaseare modulated. Complex modulators are practical only if they can achieve sufficiently highmodulation rates and are readily calibrated. Systems in which the phase is modulated through arefractive/reflective element or a RF phased array are referred to as pure phase modulators.From Equation 12, pure phase modulation requires the phase finction argument
[
O(x, y)=iln , 1)
@R4(x,y) ,p (x, y)
[23]
remain real for synthesis with a refractive or reflective spatial modulator. For example, thefamiliar two-dimensional Cartesian exponential Fourier series (x,y normalized to a unit square)
~,.-..
~~,~ (x,y) = e-’’~x+my),my), [24]
possesses the real phase flmction
d(x,y)=2m(mx+ny). [25]
Implementation of Equation 25 suggests a spatial phase modulator generating an x,y phasepattern across the modulator with slope proportional to m,n respectively. Furthermore, ascoherent fields are longitudinally periodic, the spatial phase “wraps around” every 27c, limiting
the dynamic modulation requirements to+ m
4.1.5. Aperture Diameter
Field imaging, as does any other electromagnetic imaging technology, requires theappropriate matching of the receiver aperture diameter to a given set of resolution requirements.To resolve a target feature size, ~ at range R and wavelength A will require a minimum aperturediameter of 16
DO=2.44R; [m] - [26]
4.2. Example Applications
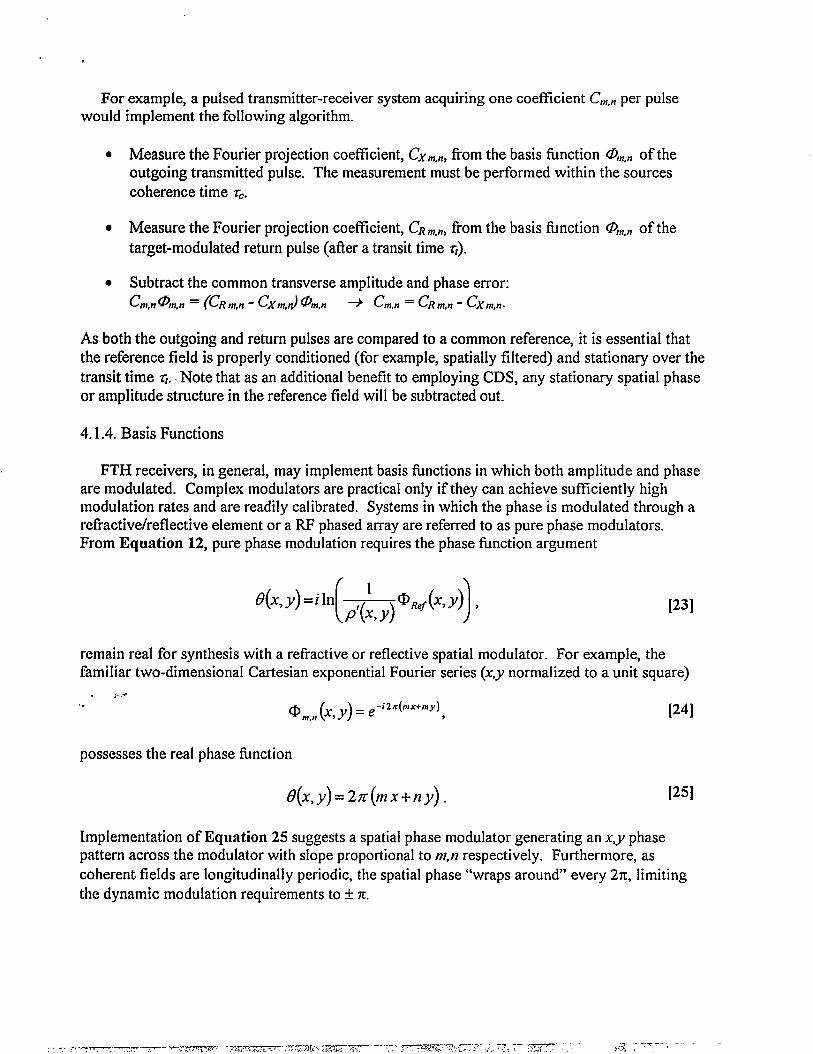
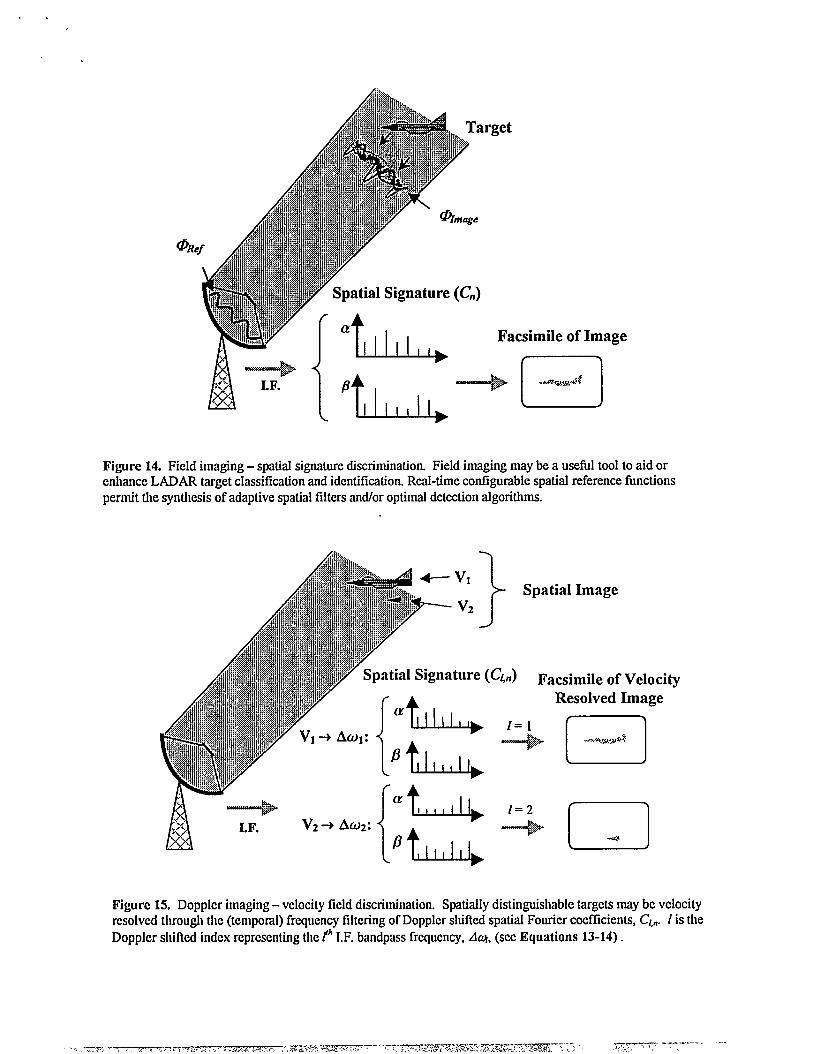
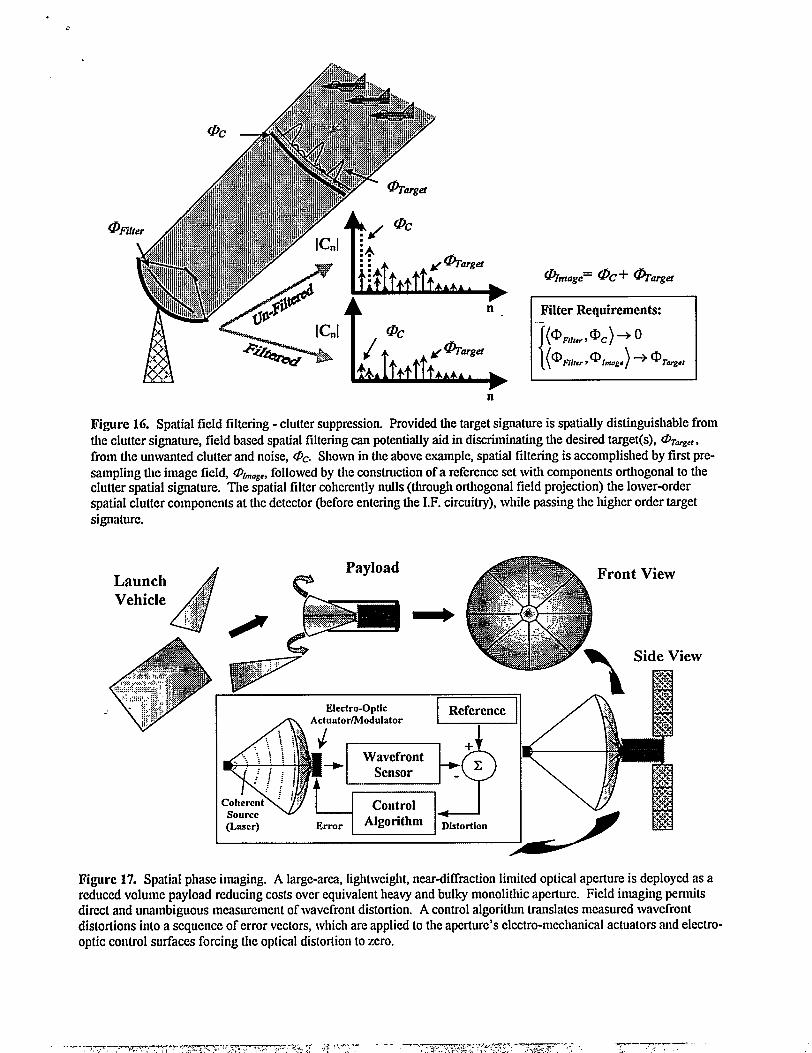
Several example LADAR applications exploiting spatial field imaging are presented inFigures 14-16. Figures 14 and 15 illustrate spatial and Doppler imaging concepts that enableoptimal target discrimination and/or signature detection. Figure 16 provides an example ofclutter suppression through spatial field filtering. Field based spatial filtering can potentially aidin discriminating a desired target signature from the unwanted background clutter and noise,provided, target and clutter signatures are spatially distinguishable. The optical cluttersuppression principles of Figure 16 are similar to techniques already practiced in current RFM.DAR systems deploying phased array receivers. 17s*8
Figure 17 demonstrates the utility of spatial phase imaging. Direct and unambiguousmeasurement of wavefiont distortion may be applied to the development of self-correcting,deployable optical apertures. Motivating Figure 17, is the recognition that large-area,lightweight, near-diffraction limited optical apertures deployed as a reduced volume payloadrepresents an important ingredient to fiture low-cost space-borne applications - i.e. largemonolithic apertures are excessively heavy and bulky, and prohibitively expensive to launch.
As a practical note, the reflected phase fronts of examples Figure 14-17 may exceed awavelength in depth, leading to * z phase ambiguities in the retrieved images. For applicationsrequiring preservation of phase depth, the ambiguities may be resolved through multiplewavelength intetierometrylg where the target is illuminated and imaged, preferablysimultaneously, with two or more wavelengths resulting in the two-dimensional synthetic phaseimage:
[27]
The technique may also be used to reduce image phase sensitivity due to fluctuations resultingfrom moving target dynamics (target scintillation).
5.0 Summary
We have presented the concept of a spatial Fourier projection operator and how it appliesfield imaging via Fourier decomposition using familiar heterodyne detection principles. Asimple experimental setup, based on a HeNe laser and a 69 element spatial phase modulator,demonstrated the underlying principles governing field projection theory and FTH imaging.
to
,rget
W Spatial Signature (C.). .
{
(2L Facsimile of Image
‘f,,,l,;l,+B
Figure 14. Field imaging – spatial sigmturc discrimination. Field imaging maybe a usefhl tool to aid orenhance LADAR target classification and identification. Real-time conf&urable spatial reference functionspermit the synthesis of adaptive spatial filters and/or optimal detection algorithms.
Ah<. -1
. -. .-.
Ml+A
Ai..% I.F. V2-) IAW2; >
A I I. A.. . Jau 1=3 n
m ‘--- “Ls--J
F@rc 15. DoppIcr imaging-velocity field discrimination. Spatially distinguishable targets maybe velocityresolved through the (tcmpoml) frequency tihcring of Doppler shilkd spatial Fourier cocftlcients, CI,n. I is theDoppler shifted index rcprcscnting the I’hI.F. bandpass frequency, AQ, (SCCEquations 13-14).
.
B:>.;#,..‘..
X.*
%i.g.= @C+ @’argel
Filter Requirements:
{
‘-(@F,,,cr,cbc)+ o
( )@ @,mog,+ O,q,,Filter Y
n
F@ure16. Spatial field filtering - clutter suppression. Provided the target signature is spatially distinguishable fromthe clutter sig&ture, field based spatird filtering can potentially aid in discriminating tile desired Wget(s), @~urget,
from the unwanted clutter and noise, @c. Shown in the above example, spatial filtering is accomplished by first pre-sampling the image tieldj cll~~~.,followed by the construction of a referenw set wi~l com~nen~ orthogon~ to tileclutter spatial signature. The spatialfilter coherentlynulls (through orthogonal field projection) the loweraderspatial clutter components at the detector (before entering the I.F.circuitry),while passingthe higher order targetsignature.
APayload
Launch . - t View
Side View
~
-&mR.\k
e’..::.,~
::!... :. , ~.. .. . . 1--o* Wavcfront ‘~.!,. .,, \;’ ;’ :
Coherentc------- ‘; ’b+=ll
+
+-..
.
.,,,%JG.>’ $’-
>\’
0 ,,Iauurcc —(Lo9cr) ““r L!!YE!J=”” I A
1 1
Fi~.yme17. Spatial phase imaging. A large-area, lightweight, neardiffraction limited optical aperture is deployed as areduced volume payload reducing costs over equivalent heavy and bulky monolithic aperlure. Field imaging pennitsdired and unambiguous measurement of wavefront distortion. A control algorithm translates measured wavefrontdistortions into a sequence of error vectors, which are applied to the aperture’s elcctro-mechrmical actuators and electro-optic control surfaces forcing the optical distortion to zero.
6
Summary (Cont.) Of fitiher research interest isthedevelopment of thegeneralized fieldprojection operator (Equation 16). As the projection maybe employed in a matched filterconfiguration, reference and image field states may be tailored to introduce detection uniqueness.Important research issues to be addressed include speckle mitigation, coherent imaging systemsbased on “off the shelf’ lasers and focal plane arrays, and heterodyne systems maintaining 100%detection efficiencies in the presence of random and systematic spatial phase distortion.
REFERENCES
‘ M. C. Roggemann and B. Welsh, Imaging Through Turbulence, CRC Press, 1996.
2 M. Born and E. Wolf, Principles of Opfics, Cambridge University Press, 6ti Ed., 1980.
3 J. W. Goodmaq Introduction to Fourier Optics, McGraw-Hill, 1968.
4 G. O. Reynolds, J. B. DcVlles, G. B. Parrent and Brian J. Thompsom Physics/ Opfics Notebook Tutorials ZnFourier Opfics, SPIE and Amcriean Institute of Physics, pp. 94-96, 1989.
5 C. A. Balanis, Anfenna Theory Analysis and Design, pp. 797-801, John Wiley & Sons, 2* Ed., 1997.
6 J. D. Jackson, Classical Elec[rodynatnics, John Wiley & Sons, 2ti Ed., 1975.
7 S. C. Cohe~ “Heterodyne Detection: Phase Front A1ignmen4 Beam Spot Size, and Detector Uniformity,” AppliedOptics, Vol. 14, No. 8, pp. 9153-1958, Aug. 1975.
8S. Fowler,G. W. KamermaL and G. Lawson,“Analysisof HeterodyneEfficiency for Coherent Laser Radars,”SPIEAppliedLaser Radar Technology, Vol. 1936, pp. 137-146, 1993.
9 F. B. Hildebrand, Advanced CalculusforApp/ications, pp. 203-209, Prentice-Hall, 2ti Ed., 1976.
10C. A. Balanis, Anfenna Theory Analysis and Design, pp. 309-324, John Wiley & Sons, 2ti Ed., 1997.
11J. Y. Wang and D. E. Silva, “Wave-Front Interpretation With Zcmikc Polynomials,” Applied Optics, Vol. 19, No.9, pp. 1510-1513, May 1980.
‘2 K. Chang, Handbook ofkficrowave and Optical Conlponenfs Vol. 3, pp. 28-32, John Wiley& Sons, 1990.
130. K. Ersoy, Fourier-Relaled Transform, Fast Algorithms andApplications, Pnmticc Hall, 1997.
‘4 F. M. Gardner, Phaselock Techniques, John Wiley & Sons, 1979.
15J. W. Goodman, Statistical Optics, John Wiley& Sons, 1985.
16B. J. Cooke, B. E. Laubscher, M. Cafferty, N. L. Olivas, M. J. Schmitt, K. R. Fuller, R. M. Gocllcr, D. E. Mietz,J. J. Tiec, R. K. Sander, J. L. Vampola, S. L. Price, and I. Kasai, “Analysis and Design Methodology for theDcvclopmcnt of Optimized, Direct-Detection C@ DIAL Reecivcrs,” SPIf31nfrared lns(rwnentation Vll, 1997.
‘7 M. 1, Skolnilq Jntroduclion IORadar Systen/s, pp. 547-553, McGraw-Hill, 1980.
‘x K. Chang, Hondbook ofblicrowave and Op[ical Conlponents Vol. 1, pp. 675-702, John Wiley & Sons, 1989.
19L, McMacki~ D. G. Voctz, and M. P. Fctrow, “MuItiplc Wavelength Hctcrodync Array Intcrfcromctry,” Opf.Express 1., 1997.