Embed Size (px)
Citation preview
BULLETIN OF MATHEMATICAL BIOPHYSICS VOLUME 34, 1972
TRANSFER TIMES ACROSS THE HUMAN BODY*
�9 CHRISTINE WATERHOUSE Department of Medicine, University of Rochester, School of Medicine and Dentistry, Rochester, New York
�9 J u H ~ KEILSO~ Department of Statistics, University of Rochester, College of Arts and Sciences, Rochester, New York
The radioactivi ty disappearance curves of glucose-6-14C albumin-1131 after a single in- jection of tracer into a human subject have been determined in detail, particularly at early t ime intervals. The curves, expressed as sums of exponentials, have been analyzed as the infinite sum of convolutions of single passage t ime densities. The resultant transfer time distribution of a single circulatory pass allows examination of all delays in the system no mat te r how long they take. The structural detail evident by this means and the long mean t ime of a single pass of glucose ( > 5 rain) supports the thesis that factors other than rapid and uniform diffusion play a role in the extravascular movements of glucose molecules.
Following a single injection of a trace substance into the vascular system, the disappearance of the material from blood is usually continuous and can be resolved into the sum of exponentials. Attempts to ascribe physiological meaning to such data led to compartmental analysis with a finite number of states and transition rates (Robertson, 1957; Berman et al., 1962; and Water-
* This study was supported by Public Health Service Grants CA 07123 from the National Cancer Institute and RR 00044 from the Division of Research Facilities and Resources, N.I.H.
33
34 CHRISTINE WATERHOUSE AND JULIAN KEILSON
house et al., 1969a). Definition of the states and proof of the validity of a model has seldom been possible.
Using glucose-l~C as an example, normal people have a characteristic dis- appearance of labeled glucose from the arterial blood after an overnight fast (Waterhouse and Kemperman, 1966). I f the first one or two minutes after the time of instantaneous injection of tracer are disregarded, this can usually be described as the sum of three exponentials. Traditionally the early disap- pearance, unchanged by high glucose or insulin levels, is considered as distri- bution into spaces which may exchange their glucose content with that of blood (e.g. interstitial fluid and liver cells). Such an interpretation, coupled with physiological information, has led to the concept of volumes of distribution of glucose and association of different parts of the curve with different processes (Segal et al., 1961). For example, the initial exponential disappearance rate seen from about 2 to 5 minutes may be extrapolated back to t = 0 and the ini- tial volume of distribution of the tracer calculated as I D / ( D P M / c c at t = 0). Such volumes are usually about 15% greater than blood volume and we usually have resolved this by adding the freely diffusable liver cell space to that of blood (Waterhouse and Keilson, 1969b). Exclusion of the first rapid exponen- tial from the curve gives, by similar methods, a volume of distribution about 3-4 liters larger than the initial volume of distribution. This is smaller than extracellular fluid volume as measured by other methods and furthermore leaves no other well defined space for glucose which might exchange with blood to account for the second exponential. Thus, this view of volumes and spaces of distribution runs into problems. To overcome these difficulties we have developed what we believe to be a more consistent and accurate approach to the interpretation of tracer experiments.
At any single point in time there are only two processes which can change the measured concentration of tracer in the blood which leaves an organ from that which entered. These are the delays of tracer material within the organ and the loss of tracer into the organ. The delays could include interstitial wander- ing or even cellular membrane penetration should this be reversible. The model does not necessitate the concept of a uniform diffusion rate between plasma and interstitial fluid, but allows totally random movement. I f one could introduce a unit bolus of tracer at the arterial entrance to the organ and observe the exit without the interference of recirculation, one could describe uniquely the transfer function of the organ and one could calculate precisely the loss within the system and all other transfer characteristics. In practice such an approach cannot be used in vivo since multiple recirculations of material occur prior to the full transfer of the bolus. I t is possible, however, to view the full disappearance curve as the sum of repetitive circulatory passes or in
T R A N S F E R TIMES ACROSS THE HUMAN BODY 35
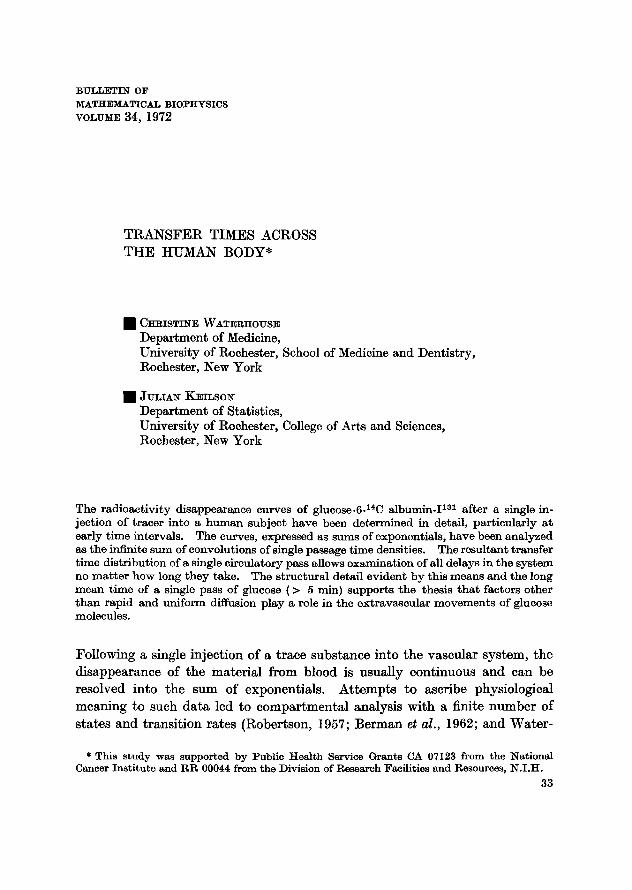
terms of a renewal function. This concept and its mathematical characteri- zation have been described abstractly by Zierler (1962). The computations to apply our data to this theory have utilized linear systems techniques for dealing with Volterra integral equations of the first and second kind. These have also been employed by others such as Stephenson (1960) and Hart (1967) in relation to biological systems. To our knowledge, however, this work is the first attempt to apply such techniques in conjunction with the formalism of renewal theory to the analysis of tracer disappearance curves in human subjects. Our curves have been evaluated as the infinite sum of convolutions and the fine detail of single passage time densities t have been determined. The network flow-type representation we have used permits physiological phenomena, such as differences in rates of flow both spatially and temporally, to be realisitically accepted, an advantage not enjoyed by certain other analytical modes com- monly used (Sheppard, 1962).
i H-L'H i
C2
A
F i g u r e 1. Schema t i c r e p r e s e n t a t i o n of t he c i r cu la to ry s y s t e m
;I EV v
V
t The t e rm "single passage t ime dens i ty" when used to describe glucose movement will include those tagged molecules which leave the circulation as glucose, undergo glycolysis within cells, be- come reconsti tuted to glucose within the liver cells, and then are released back into the circulation and seen at EA. Note t h a t such molecules may make m a n y passes th rough the circulatory system before completir~g their "single passage" by reappearing a t EA as glucose.
The circulatory model. The distribution of glucose via the circulatory system is shown schematically in Figure 1. The direction of flow through the system is indicated by arrows. Channels C1, C2 . . . . . CN represent the organs such as extremities, the brain, the kidneys, etc. and the flow through these is from the arterial side designated by A to the venous side, V, of the system. Return flow through the heart-lung-heart is indicated in the top line of the diagram. The channels C1, C 2 . . . . . C N are all in parallel and the aggregate channel will be
36 CHRISTINE WATERHOUSE AND JULIAN KEILSON
(r, r + dr). ral
called Cs. The net flow through all body channels (Cs) is in series with the heart-lung-heart flow, which we shall call the return channel Ca. Permanent losses from the system may occur from the body channels. A tagged particle which enters CB will be assumed to spend an amount of time rs in body channels described by a transfer time density Ss(r) such that Ss(r) dr is the fraction of a unit amount of glucose entering channel Ca at T = 0 which emerges in
Since losses may occur within the channels, we will have in gene-
f0 ~ S s ( r ) = a s ( ] ) dr _< 1,
where as is the fraction of the unit amount of glucose entering which sub- sequently leaves the channel.
I t is important to distinguish between the coronary and brachial channels nourishing the heart and lungs and the flow through the return channel. The former channels are part of the body channels and are included in the set C1, C2, �9 �9 CN. With this distinction in mind, it is clear that for substances of interest the return channel is lossless, i.e. that
aa = 1. (2)
Channel transfer and IA(t ). A bolus of tagged glucose will be described as ideal, if the time required to inject the bolus is negligible and taken to be zero. When an ideal unit bolus is injected at Ev, the entrance to the heat-lung-heart channel (Figure 1), the resulting flow rate IA(t) at E A may be expressed in terms of the transfer time densities SB(r ) across the body channels and SR(r) across the heart
First let us consider the transfer time density S(T) for a single passage of a glucose molecule from EA through the body channels and the heart channel back to EA. I f an ideal unit bolus is at EA at r = 0, the quanti ty of glucose flowing by E v in (r', r ' + dr') is Ss(-r') dr'. Hence the first return flow rate at E~ at time r will be
S(r) = f [ S , ( r ' )Sa(r - T')dr ' . (3)
The transfer time density obtained from SB(r) and Sa(r ) in the manner indi- cated on the right-hand side of (3) is called the convolution OfSB(T ) and S~(r), and such convolution will be designated by Ss(r) * Sa(r). Clearly the attenua- tion a in a complete circulation is the product of the attenuation through the body channels a s and that through the return channel aa. As we have seen, a~ = 1 and hence
a = a s . ( 4 )
T R A N S F E R TIMES ACROSS T H E H U M A N B O D Y 37
The mean circulation time ~ is a - t S rS(T) dr and we find from (3) that
= ~B + ~R. (5)
Consider now an ideal unit bolus injected at E A at T = 0, and let us observe the total flow rate h(r) going by E a subsequently at time T. This will consist of the sum of the glucose flow going by the first time, that going by for the second time, etc. The flow rate for the first time around glucose is just S(r), that for second time around is S(T) �9 S(r) which we designate by S(2)(r). The flow rate for third time around is S(r) �9 S(r) * S(r) = S(3)(~), etc. Hence we have
cO
= ( 6 ) 1
In experimental study, the bolus is injected at E v and the total flow rate is observed at EA. For an ideM unit bolus injected at E v at T = 0, the flow rate Ia(t) observed at EA consists of the first flow from E v given by Sa(T), plus S~(T) * S(v), plus SR(v) * S(a)(~), etc. We have therefore
IA(t ) = SR(t) + SR(t) . h(t). (7)
The expression y.~o S(k)(r) in (6) has the structure of the renewal density for positive random variables studied in probability theory (Cox and Miller, 1965). I t differs from renewal density structure in that losses are present and one has in general a = ~o S(r) dr < 1.
In typical renewal theory where a = 1, h(~) has a positive limiting value as ~--> oo. When a < 1, our case, h(~) goes to zero and is a positive in- tegrable function. Since the Laplace transform of (6) reads
h * ( s ) =
we have for s = 0, from (7) and (8)
~(s) 1 - , , ( s )
( 8 )
o~ h ( t ) d t 1 - a = - - =- I a ( t ) dt - 1 . ( 9 )
Structure o f d isappearance curves. We wish now to examine our experimental curves in the context of this analysis. We have used not only the tracer of primary interest, glucose-6-14C but also albumin-I TM in this s tudy since we wished to differentiate the vascular component of the passage time density of glucose from the other events of interest. The tracers were injected by a single bolus into an anteeubital vein (estimated injection time ~. 1 see.).
38 C H R I S T I N E W A T E R H O U S E A N D J U L I A N K E I L S O N
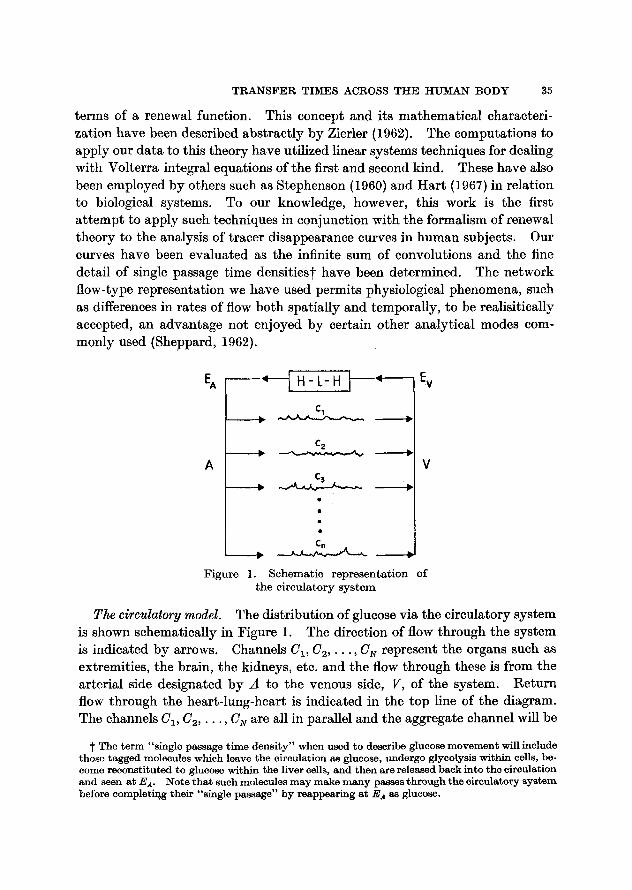
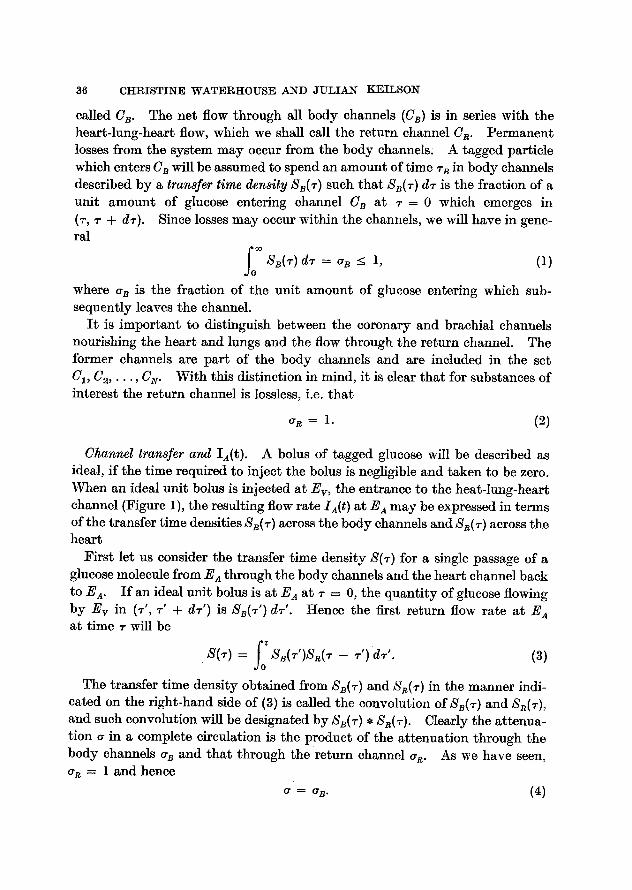
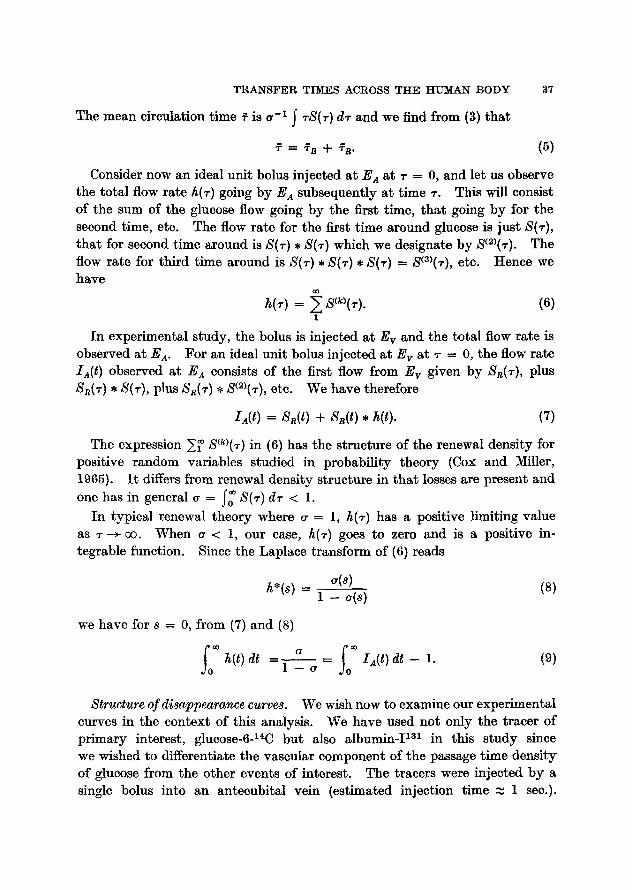
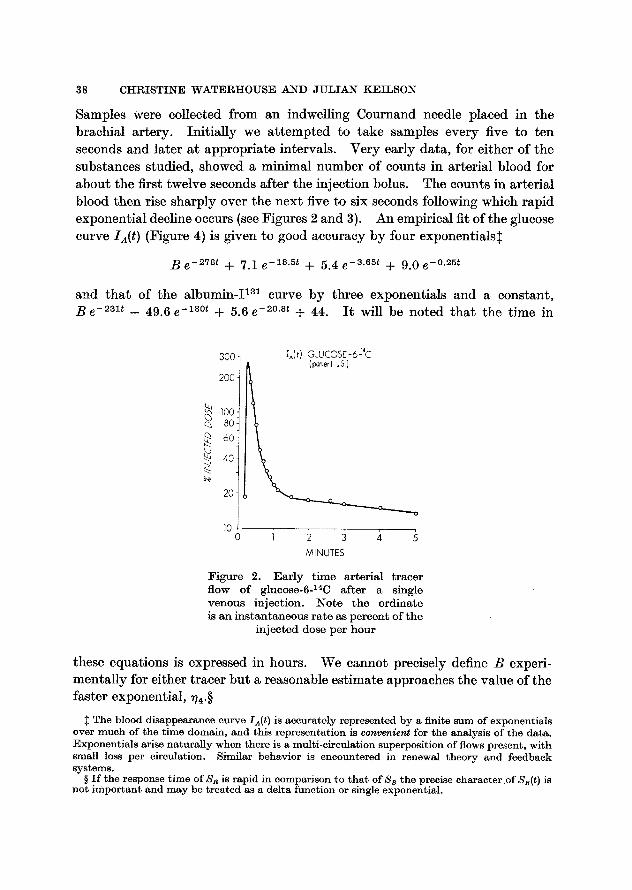
Samples were collected from an indwelling Cournand needle placed in the brachial artery. Initially we attempted to take samples every five to ten seconds and later at appropriate intervals. Very early data, for either of the substances studied, showed a minimal number of counts in arterial blood for about the first twelve seconds after the injection bolus. The counts in arterial blood then rise sharply over the next five to six seconds following which rapid exponential decline occurs (see Figures 2 and 3). An empirical fit of the glucose curve IA(t ) (Figure 4) is given to good accuracy by four exponentials$
B e -278t + 7.1 e -~8'5~ + 5.4 e -3.65t + 9.0 e -~
and that of the albumin-I T M curve by three exponentials and a constant, B e -231~ - 49.6 e -18~ + 5.6 e -2~ + 44. It will be noted that the time in
300
200
100 80: 6oi.
20-
10
IA(t) GLUCOSE-62~C (patient J,S.)
1 2 3 4 5
MINUTES
Figure 2. Ear ly t ime arterial tracer f low o f glueose-6-14C after a single venous inject ion. N o t e the ordinate is an ins tantaneous rate as percent of the
injected dose per hour
these equations is expressed in hours. We cannot precisely define B experi- mentally for either tracer but a reasonable estimate approaches the value of the faster exponential, V~.w
The blood disappearance curve IA($ ) is accurately represented by a finite sum of exponentials over much of the t ime domain , and th is represen ta t ion is convenient for the analysis of the data. Exponentials arise naturally when there is a mult i -c i rculat ion superposition of flows present, with small loss per circulation. Similar behavior is encountered in renewal theory and feedback sys tems.
w I f the response time of S~ is rapid in comparison to that of Ss the precise character of SR(t) is not important and may be treated as a delta function or single exponential.
T R A N S F E R TIMES ACROSS THE HUMAN BODY 39
%
300
200
100 80; 60-
40
10 0
]A(t) ALBUMIN ~3~I (l~alient J.S.)
1 2 3 4 5 MINUTES
F i g u r e 3. E a r l y t i m e a r t e r i a l t r a c e r flow of a l b u m i n - I T M a f t e r a s ingle v e n o u s in jec t ion . N o t e t h e o r d i n a t e is a n in- s t a n t a n e o u s r a t e as p e r c e n t of t h e i n j ec t ed
dose pe r h o u r
3 14 0.0 1 IA(t ) GLUCOSE-6- C ,k (,~,,e.t j.s.} 20.0 :~k
10.0' < ~ 8 . o : ~
6.0
4.0..
2.0 . . . . . 0 0.5 t.0 1.5 2.0 2.5 310
HOURS
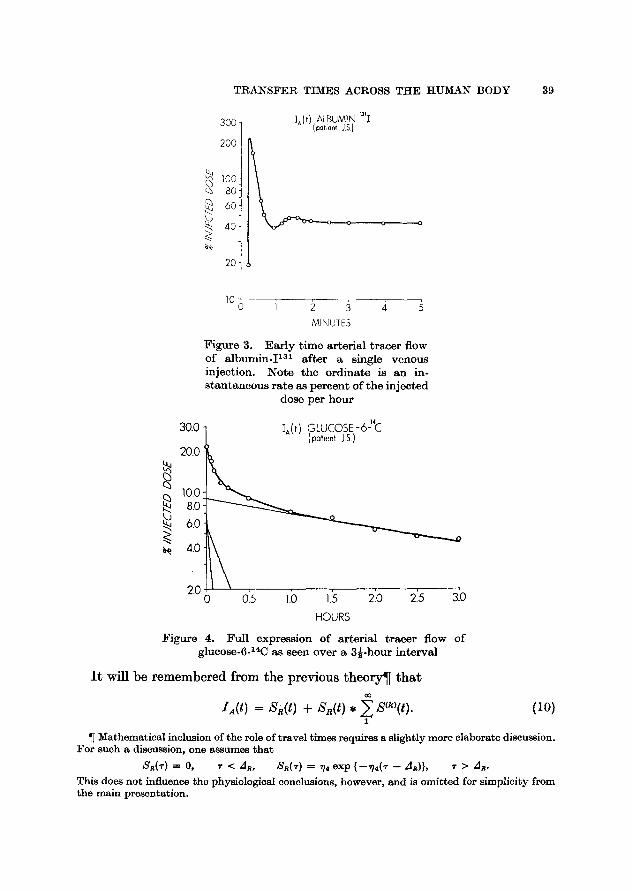
F i g u r e 4. Fu l l express ion of a r t e r i a l t r a c e r flow of glucose-6-14C as seen ove r a 3~-hour i n t e r v a l
I t will be remembered from the previous theory�82 that co
IA(t) = sR(t) + sR(t), ~ s(~,(t). (10) l
�82 Mathematical inclusion of the role of t ravel t imes requires a slightly more elaborate discussion. For such a discussion, one assumes t h a t
Sa(~) = O, ~ < ~a, ~a(~) = ';4 exp {--~/4(~ -- 4a)}, �9 > /IR.
This does not influence the physiological conclusions, however, and is omit ted for simplicity from the main presentation.
40 C H R I S T I N E W A T E R H O U S E A N D J U L I A N K E I L S O N
With
this becomes
S.(T) = 7~ e- ' . ' ,
IA(t) -- 7 t e-"'~ = 7i e-"'~ * ~ SCk)(t) ( l l ) 1
and the expression on the r ight vanishes a t t = 0, so t h a t IA(0 ) = 74. Since
3
IA(t) = ]3 e-~, t + ~, Ct e-n, t, (12) 1
3
1,4(0) = 7 4 and B = ~ 4 - ~ C t . 1
From ( l l ) and (12)
o r
co
~_, S(k)(t) = (1 + 1/74 dldt){SA(~') - ~74 e- '~} 1
3 3 ~ S(k)(t) = (1 + 1/7 , dldt) ~. C, e-", t = ~ C'* e - ' , t (]3) 1 1
where
C * - - ( 1 - ~hl7~)C,, Laplace t ransformat ion of (13) gives
so t h a t
i = 1, 2, 3. (14)
3
.(8)/(1 - .@)) = ~ 0*/(8 + v,) 1
a(s) = ~ C*I(s + 7,) 1 + C~*i(s -t- "qi) �9 (15) 1
We note t h a t a(s) is finite and differentiable a t the values s = -71 , -V2, -V3 and has value one there. Only a t the zeros of the denominator of a(s) will a(s) have singular behavior. A plot of the denominator , D(s) = 1 + 7~ C*l(s + 7~), against s is shown in Figure 5. The funct ion D(s) is monotonic decreasing for all 8 other t h a n 71, V2, 73. Since i t changes sign a t these values there will be exact ly three zeros of D(s) at - ~1, - ~2, - ~8 where
~3 < 73 < ~2 < 72 < ~1 < Vl < 0
and these zeros are simple because D(s) is monotonic. I f we mul t ip ly the nume- ra tor and denominator of (15) by (8 + 71)(s + 72)(s + 73) we see t ha t a(8) has
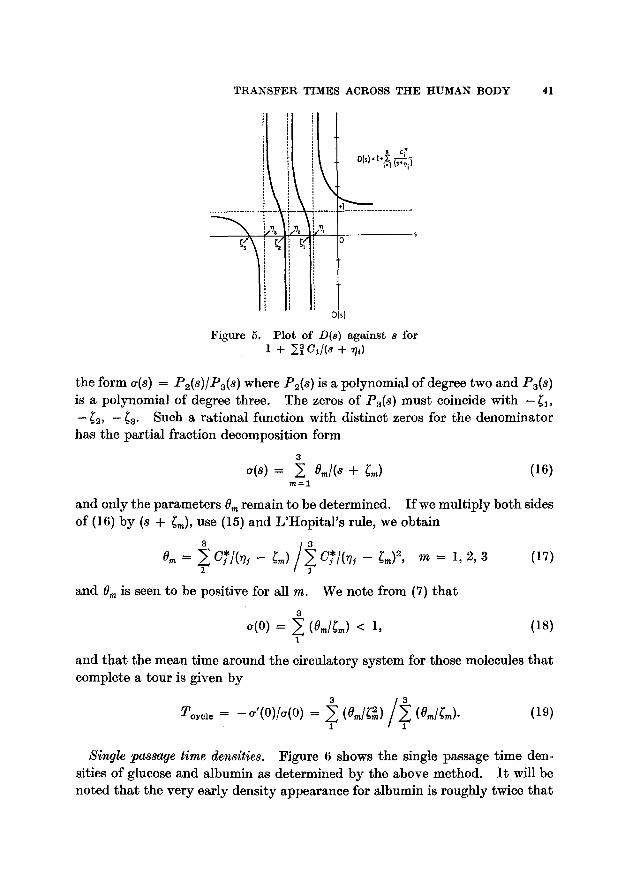
TRANSFER TIMES ACROSS THE HUMAN BODY 41
J
O(s):l*~- i=l Is~'/i J
s
Figure 5.
D(s)
Plo t of D(8) agains t s for 1 + ~ 01/(8 + W)
the form a(s) = Pu(s)/P3(s ) where Pc(s) is a polynomial of degree two and P3(s) is a polynomial of degree three. The zeros of P3(s) must coincide with -~1, -if2, -~8. Such a rational function with distinct zeros for the denominator has the partial fraction decomposition form
3 0(8) = ~ Oral(8 "4- ~m) (16)
m=l
and only the parameters #m remain to be determined. I f we multiply both sides of (16) by (s + ~m), use (15) and L'Hopital 's rule, we obtain
0m = .~ c * / ( ~ j - Cm) c*/(~s - Cm) ~, m = 1, 2, 3 (17) 1
and 0 m is seen to be positive for all m. We note from (7) that
3 a(O) = ~ (Ora/~m) < l , (18)
1
and that the mean time around the circulatory system for those molecules that complete a tour is given by
Teyele ---- - ( r ' ( 0 ) / ( r ( 0 ) -- ~1 (Om/~2m)/~1 (Om/~m)* (19)
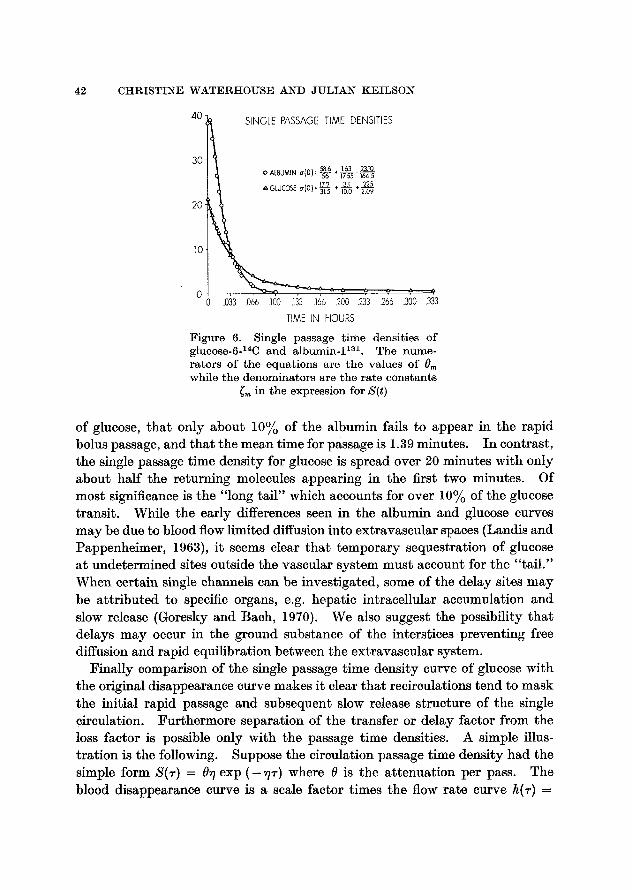
Single passage time densities. Figure 6 shows the single passage time den- sities of glucose and albumin as determined by the above method. I t will be noted that the very early density appearance for albumin is roughly twice that
42 CHRISTINE WATERt tOUSE AND J U L I A N KEILSON
40I~-- SINGLE PASSAGE TIME DENSITIES
30 58.6 .~ 1.63 23.t0
O ALBUMIN a l0 ) : ~ ~ 167.5
A 179 + 3.1 + ,225 : - - ~ --?2.0
2 0 : ~ ~
10"
0 + -" 4* 0 .033 .066 .100 .133 .166 .200 233 266 .300 .333
TIME IN HOURS Figure 6. Single passage t ime densit ies of glueose-6-14C and a lbumin- I TM. The nume- ra tors of t he equat ions are t he values of 9m while the denomina tors are the ra te cons tants
~m in the expression for S(t)
of glucose, that only about 10% of the albumin fails to appear in the rapid bolus passage, and that the mean time for passage is 1.39 minutes. In contrast, the single passage time density for glucose is spread over 20 minutes with only about half the returning molecules appearing in the first two minutes. Of most significance is the "long tail" which accounts for over 10% of the glucose transit. While the early differences seen in the albumin and glucose curves may be due to blood flow limited diffusion into extravascular spaces (Landis and Pappenheimer, 1963), it seems clear that temporary sequestration of glucose at undetermined sites outside the vascular system must account for the "tail." When certain single channels can be investigated, some of the delay sites may be attr ibuted to specific organs, e.g. hepatic intracellular accumulation and slow release (Goresky and Bach, 1970). We also suggest the possibility that delays may occur in the ground substance of the interstices preventing free diffusion and rapid equilibration between the extravascular system.
Finally comparison of the single passage time density curve of glucose with the original disappearance curve makes it clear that recirculations tend to mask the initial rapid passage and subsequent slow release structure of the single circulation. Furthermore separation of the transfer or delay factor from the loss factor is possible only with the passage time densities. A simple illus- tration is the following. Suppose the circulation passage time density had the simple form S(r) = ~ exp ( - ~ 7 ) where ~ is the attenuation per pass. The blood disappearance curve is a scale factor times the flow rate curve h(r) =
TRANSFER TIMES ACROSS THE HUMAN BODY 43
~. S(k)(r) w h i c h is a s u p e r p o s i t i o n o f a l l m u l t i p a s s f low c o n t r i b u t i o n s S(k)(T).
A s i m p l e c a l c u l a t i o n shows t h a t
0 - - ~* e-n *~, h(T) = I -- 0
w h e r e V* = V(1 - 0). T h e d e c a y r a t e V* for t h e f low r a t e c u r v e is t h e r e f o r e
t h e p r o d u c t o f V a n d t h e loss f a c t o r (1 - O) a n d t h e r e is no w a y o f i n f e r r i n g
a n d 0 f r o m V* a lone . F o r p a s s a g e t i m e d e n s i t y S (z ) o f m o r e c o m p l e x s t r u c t u r e
s u c h as h a s b e e n f o u n d in ou r s t ud i e s , s i m i l a r i n s i g h t i n t o u n d e r l y i n g m e t a b o l i c
m e c h a n i s m s b e c o m e s poss ib le .
A P P E N D I X
INCLUSION OF NON-RANDOM TRAVEL TIMES
To include the role of non-random travel times which we will designate by A R and ,4 8 one may assume tha t SR(T) ----- 0, ~ < ZJ R, and
Ss(r) = ~/4 exp {-74(~ - An)}, T _> As. (A1)
A similar t ravel t imeA s may be present in SB(z), and for S(r) = Ss(z) * Ss(T), one will have a t ravel t ime A = As + As, so tha t A _ An. The transverse paths may have small or no travel times, and A n may be much smaller than A s .
LetlA*(t ) = In(t ) - -Ss ( t ) = S s ( t ) * h ( t ) from 10. ThenI* ( t ) = 0 for 0_< t _<A n + A. F rom an(s) = { e x p (--sAR)}{*/4/(s + */4)} we have
i * ( s ) = e-8~R 74 ~ ( s ) s + */4 1 -- a(s)'
so tha t
a ( s ) _ s + */4 eS4Ri,s). 1 - - a(s) 74
Hence, as in the main exposition, 00 1 d I*(t AR) ~ S ( k ) ( t ) = ( 1 + ~ ) +
( = I + "~4 ~ {In(t + As) -- Sn(t + An)}. (A2)
A good empirical representation of In(t), compatible with travel time requirements is given by
IA(t ) = U( t -- zJn)B e-'74(t-~R ) + U( t - A n - A ) Cq e - n # - a R -~)
-- ( ~ C,) e-~4(~-~R-~)}, (A3)
where U(t) = O, t < O, U(t) = 1, t >_ O. The requirement t h a t / * ( A s ) be 0 in (A3) implies t ha t B = */4. Hence we find from (A2) as in the main exposition
3
-- U(t - .4) ~. C* e- ' , " -~) . (A4) 1
44 CHRISTINE WATERHOUSE AND JULIAN KEILSON
The delay represented by the factor U(t - A) in (A4) does not alter the value of a obtained from (13). Moreover, since A ~ 12 seconds and all ~?lA will be small, the shape of S(v) is modified slightly only within the first two minutes. One has effectively
3
S(~) = U(t - A) ~ 0~ e : ~ - ~ ~ (AS) 1
with 0m and ~m as given in the main presentation.
L I T E R A T U R E
Berm~n, M., E. Shanan and M. F. Weiss. 1962. "The Routine Fi t t ing of Kinetic Data to Models: A Mathematical Formalism for Digital Computers." Biophysical J., 2, 275-287.
Cox, D. and H. Miller. 1965. The Theory o/Stochastic Processes. New York: Wiley and Sons.
Goresky, C. A. and G. G. Bach. 1970. "Membrane Transport and the Hepatic Circula- t ion." Ann. N.Y. Academy Science, 17@, 18-47.
Hart , H. E. 1967. "Analysis of Tracer Experiments: VII I . Integro-differential Equat ion Treatment of Part ly Accessible, Par t ly Injectable Multicompartment Sys- tems." Bull. Math. Biophysics, 29, 319-333.
Landis, E. M. and J. R. Pappenheimer. 1963. "Exchange of Substances Through the Capillary Walls." I n Handbook of Physiology, Cir., 2, 961-1034.
Robertson, J . S . 1957. "Theory and Use of Tracers in Determining Transfer Rates in Biological Systems." Physiological Reviews, 37, 133-154.
Segal, S., M. Berman and A. Blair. 1961. "The Metabolism of Variously Cl~-labeled Glucose in Man and an Estimation of the Extent of Glucose Metabolism by the Hexose Monophosphate Pathway." J. Glin. Invest., 49, 1263-1279.
Sheppard, C . W . 1962. "Basic Principles of the Tracer Method." :New York: Wiley and Sons.
Stephenson, J . L . 1960. "Theory of Transport in Linear Biological Systems: I. Funda- mental Integral Equation." Bull. Math. Biophysics, 22, 1-138.
Waterhouse, C. and J. Kemperman. 1966. "Changes in Oxidative Metabolism with Glucose Ingestion." J. Lab. Clin. Med., 68, 250-264.
, N. Baker and H. Rostami. 1969a. "Effect of Glucose Ingestion on the Meta- bolism of Free Fa t ty Acids in Human Subjects." J. Lipid. Res., 10, 487-494.
~ - , and ft. Keilson, J. 1969b. "Cori Cycle Activity in Man." J. Clin. Invest., 48, 2359-2366.
Zierler, K. 1962. "Circulation Times and the Theory of Indicator-Dilution Methods for Determining Blood Flow and Volume." In Handbook of Physiology, Cir. 1, 585-615.
Rv.CErVED 9-12-70


![MORC: A Manycore-Oriented Compressed Cacheclass.ece.iastate.edu/tyagi/cpre581/papers/Micro15MORC.pdf64b transfer across 15mm on-chip [15] 375pJ 185x 64b transfer across main-board](https://img.pdfslide.us/doc/110x75/604c8e8aaff19c5393617be0/morc-a-manycore-oriented-compressed-64b-transfer-across-15mm-on-chip-15-375pj.jpg)