Embed Size (px)
Citation preview
A
TransCore
ApplicationFor Certification
RF Module, Model IT2611
FCC ID: FIH2611SS
March 11, 2002Revision 3
All services undertaken are subject to the following general policy: Reports are submitted for exclusive use of the client to whom they areaddressed. Their significance is subject to the adequacy and representative character of the samples and to the comprehensiveness of thetests, examinations or surveys made. No quotations from reports or use of Intertek Testing Services name is permitted except as expresslyauthorized by Intertek Testing Services in writing. The report must not be used by the client to claim product endorsement by NVLAP orany agency of the U.S. Government. The NVLAP logo is applicable for testing to I EC/CISPR 22:1993 and FCC-47 CFR part 15 only.

ATABLE OF CONTENTS
1.0 General Description...............................................................................................................11.1 Related Submittal(s) Grants..........................................................................................11.2 Product Description.....................................................................................................11.3 Test Methodology .......................................................................................................21.4 Test Facility................................................................................................................2
2.0 System Test Configuration ....................................................................................................32.1 Justification.................................................................................................................32.2 EUT Exercising Software.............................................................................................32.3 Special Accessories......................................................................................................32.4 Equipment Modification...............................................................................................32.5 Support Equipment List and Description........................................................................32.6 Test Configuration Block Diagram................................................................................4
3.0 Test Results ...........................................................................................................................53.1 RF Power Output........................................................................................................63.2 Occupied Bandwidth ................................................................................................. 173.3 Spurious Emissions at Antenna Terminal..................................................................... 283.4 Out of Band Spurious Emissions at Antenna Terminal.................................................. 303.5 Field Strength of Spurious Emissions........................................................................... 383.6 Frequency Stability.................................................................................................... 413.7 Field Strength Calculation........................................................................................... 48
4.0 Test Equipment ................................................................................................................... 44
EXHIBIT ITest Set Up Photographs ....................................................................................................... 45
EXHIBIT IIFCC ID Label Location ......................................................................................................... 50
EXHIBIT IIIExternal Photographs............................................................................................................. 51
EXHIBIT IVInternal Photographs.............................................................................................................. 54
EXHIBIT VElectrical Schematics and Block Diagram ................................................................................ 62
EXHIBIT VIUser Manual and Operational Description................................................................................ 63

A
FCC ID: FIH2611SS Report No:3011655 Rev. 3 – March, 2002 Page 1 of 63
1.0 GENERAL DESCRIPTION
1.1 Related Submittals Grants
This is single application of the IT2611RF Module for Certification under FCC Part 90, Subpart M.There are no other simultaneous applications.
1.2 Product Description
Purpose of the IT2611 RF Module
The IT2611 RF Module is a part of the non-multiratelation Location and Monitoring Service (LMS)System. The IT2611 RF Module is mounted with antennas. The intended use of the IT2611 RF Moduleunit is to generate a RF signal upon command from a reader, and deliver the signal to one of the antennasfor transmission and receive the reflected modulated tag signal returned through the antenna(s). ThenIT2611 RF Module demodulates, amplifies, and filters the received tag signal, and forwards the digital datato the reader for processing. The IT2611 RF Module powered at 120VAC/60Hz through the external poweradapter manufactured by TransCore.
The IT2611 RF Module Transmitter
The IT2611 RF Module Transmitter operates in frequency ranges with type of modulation:
Uplink Mode (CW only):From 902.25 to 903.75MHz (Continuous Wave, N0N Emission Modulation Designator) andFrom 910.00 to 921.75MHz (Continuous Wave, N0N Emission Modulation Designator),adjustable in 0.25MHz step.
Down link Mode (Digital modulation only):From 912.75 to 918.75MHz (Manchester encode 300kbps Modulated Signal, L1D Emission ModulationDesignator), adjustable in 0.25MHz step.
Operating Power Level:
1 Watt maximum (30dBm) and may be attenuated up to 15dB with 1dB step

A
FCC ID: FIH2611SS Report No:3011655 Rev. 3 – March, 2002 Page 2 of 63
The IT2611 RF Module Antennas
Two different antennas could be used to transmit RF signal from the IT2611 RF Module:
AA3152 Universal Toll Antenna (UTA)
Frequency range: 902 to 928MHzGain: 13dBiImpedance: 50Ohms
AA3153 Toll Antenna
Frequency range: 902 to 928MHzGain: 10.5dBiImpedance: 50Ohms
The IT2611 RF Module Receiver
The IT2611 RF Module Receiver is a three-channel differential receiver with pre-amplifier. The power at thereceiving antenna terminal is not exceed 2.0 nanowatts.
1.3 Test Methodology
Emission measurements were performed according to the procedures in specified by ANSI/TIA/EIA-603-1992.All field strength radiated emissions measurements were performed in the semi-anechoic chamber using asubstitution antenna method. All field strength radiated tests were performed at an antenna to EUT distanceof 3 meters, unless stated otherwise in the "Justification Section" of this Application.
1.4 Test Facility
The test site facility used to collect the radiated and conducted measurement data is located at 7250 HudsonBlvd., Suite 100, Oakdale, Minnesota. This test facility has been fully described in a report dated on January2000 submitted to your office. Please reference the site registration number: 90706, dated May 19, 2000.

A
FCC ID: FIH2611SS Report No:3011655 Rev. 3 – March, 2002 Page 3 of 63
2.0 SYSTEM TEST CONFIGURATION
2.1 Justification
FCC Part 90.210(k)(4) specifies measurements at LMS Sub-Band edges FCC Part 90.210(k)(6) for a non-multilateration transmitter using 100kHz RBW. However, based on the rules interpretations provided byTransCore in reference to the FCC Letter dated on June 9, 1997 (uploaded with application) measurements ofthe Out-of-Band emissions with center frequencies within 1MHz from the band edges were taken using 300HzRBW (See Section 3.4).
2.2 EUT Exercising Software
The IT2611 RF Module was tested in the continuous transmission mode.
2.3 Special Accessories
There are no special accessories necessary for compliance of these products.
2.4 Equipment Modification
No modifications were installed during the testing.
2.5 Support Equipment List and Description
BSI Computer, s/n BSI1023175Data Interface unit manufactured by TransCore1611A BK Precision DC Power Supply, s/n 241-00988
A
FCC ID: FIH2611SS Report No:3011655 Rev. 3 – March, 2002 Page 4 of 63
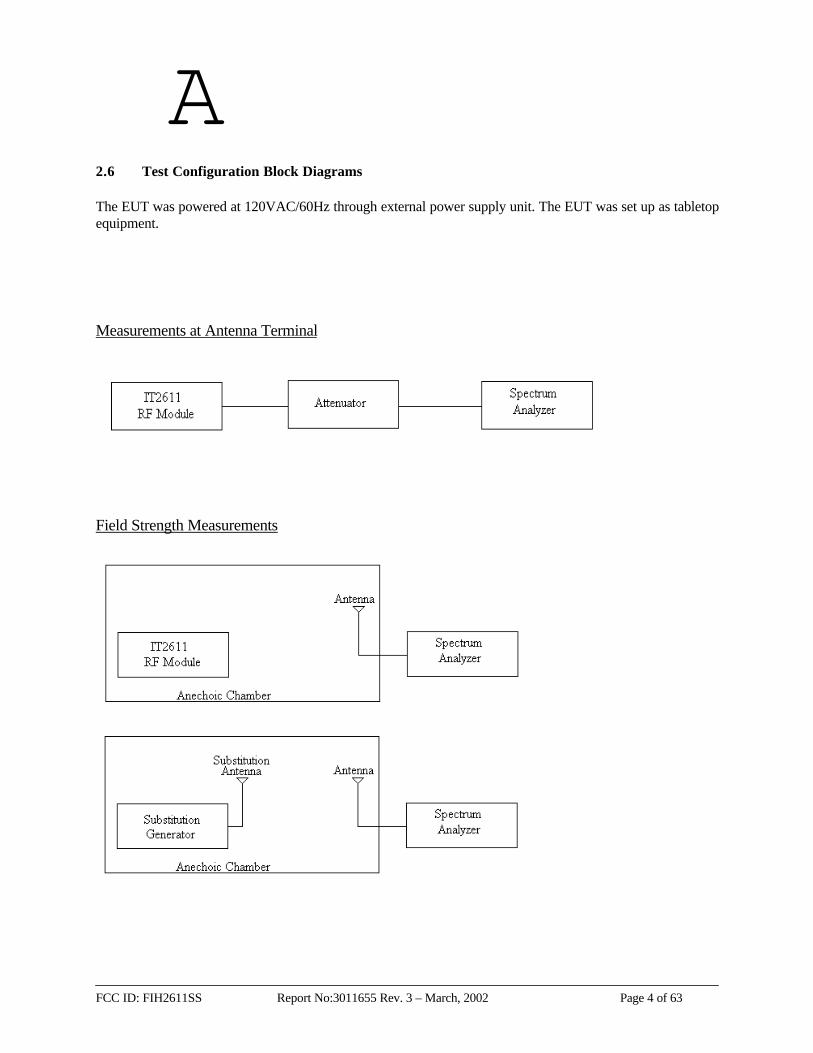
2.6 Test Configuration Block Diagrams
The EUT was powered at 120VAC/60Hz through external power supply unit. The EUT was set up as tabletopequipment.
Measurements at Antenna Terminal
Field Strength Measurements

A
FCC ID: FIH2611SS Report No:3011655 Rev. 3 – March, 2002 Page 5 of 63
3.0 TEST RESULTS
Data is included of the worst case configuration (the configuration which resulted in the highest emission levels). A sample calculation, configuration photographs, data tables and graphical representations of the emissions areincluded.
The EUT is intended for operation under the requirements of Part 90 (Subpart I and M), Part 15 (Subpart B).Specific test requirements include the following:
47 CFR 90.205(j), 2.1046 RF Power Output47 CFR 90.209(b)(5), 2.1049 Occupied Bandwidth47 CFR 90.210(k)(3)(ii), 2.1051 Spurious Emissions at Antenna Terminal47 CFR 90.210(k)(3)(ii), 2.1051 Out of Band Spurious Emissions at Antenna Terminals47 CFR 90.210(k)(3)(ii), 2.1053 Field Strength of Spurious Radiation47 CFR 90.213(a), 2.1055 Frequency Stability
The EUT does not re-modulate or re-key the signal. Based on the lack of re-keying/re-modulation circuitry, thefollowing test was not performed:
47 CFR 90.211, 2.1047 RF Modulation Characteristics

A
FCC ID: FIH2611SS Report No:3011655 Rev. 3 – March, 2002 Page 6 of 63
3.1 RF Power Output, FCC 90.205(j), 2.1046
RF Output measurements were made in the start, center, and end frequency of each frequency range withappropriate type of modulation for these frequency ranges. The follow frequency ranges are used in theEUT:
Uplink Mode:From 902.25 to 903.75MHz (Continuous Wave Emission Designator)From 910.00 to 921.75MHz (Continuous Wave Emission Designator),
Downlink ModeFrom 912.75 to 918.75MHz (Modulated Signal Emission Designator, digital modulation, 300kbps,Manchester code).
So, RF Output measurements were made for frequencies:902.25MHz, CW903.00MHz, CW903.75MHz, CW910.00MHz, CW915.75MHz, CW921.50MHz, CW912.75MHz, Modulated915.75MHz, Modulated918.75MHz, Modulated
Test Procedure
The RF Power Output for the device was measured at the maximum power transmission condition. Thetransmitter antenna port was connected to the Spectrum analyzer via the attenuator.
Total Power was calculated from Measured Power adding 6.2dB factor of the external-of-analyzerattenuator.
Maximum Output Power at Antenna Terminal calculationAccording to the FCC 90.205(j), the maximum ERP output power is 30 Watts (44.77dBm).Maximum output power at antenna terminal = Max ERP Power – Antenna Gain = 44.77dBm – 13dBiMaximum output power at antenna terminal = 31.77dBmAccording to the client specification, the maximum output power at antenna terminal is 1 Watt, or 30dBm.As a worse case, 30dBm output power at antenna terminal is chosen as a reference level of the MaximumOutput Power at antenna terminal.
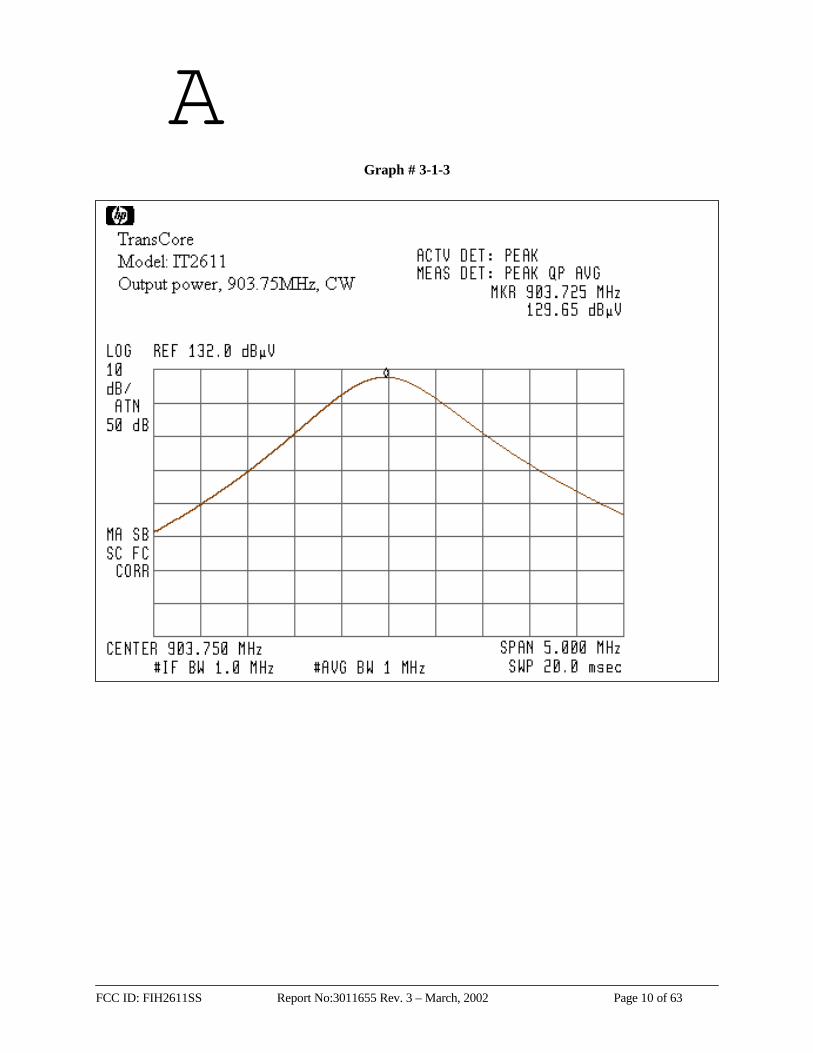
Table and graphs below show the RF Power Output at antenna terminal.Note: Emission level shown in the Graphs does not include 6.2dB attenuation factor of the attenuator.

A
FCC ID: FIH2611SS Report No:3011655 Rev. 3 – March, 2002 Page 7 of 63
RF Power Output Date: 01-03-2002
Company: TransCoreModel: IT2611
Test Engineer: Norman ShpilsherSpecial Config. Info: The EUT antenna terminal was connected to the Spectrum
Analyzer through the attenuator 6.2dB (including cable loss).Standard: FCC Part 90.205(j) and Part 2.1046
Table # 3-1-1
Output Measured Total Total Maximum MarginFreq. Power Power Power Power CommentsMHz dBmV dBmV dBm dBm dB
902.25 (CW) 129.8 136.0 29.0 30.0 -1.0903.00 (CW) 129.4 135.6 28.6 30.0 -1.4903.75 (CW) 129.7 135.9 28.9 30.0 -1.2
910.00 (CW) 129.7 135.9 28.9 30.0 -1.1915.75 (CW) 130.2 136.4 29.4 30.0 -0.6921.50 (CW) 130.3 136.5 29.5 30.0 -0.5
912.75 (Mod) 129.6 135.8 28.8 30.0 -1.2915.75 (Mod) 129.5 135.7 28.7 30.0 -1.3918.75 (Mod) 129.7 135.9 28.9 30.0 -1.1

A
FCC ID: FIH2611SS Report No:3011655 Rev. 3 – March, 2002 Page 8 of 63
Graph # 3-1-1

A
FCC ID: FIH2611SS Report No:3011655 Rev. 3 – March, 2002 Page 9 of 63
Graph # 3-1-2
A
FCC ID: FIH2611SS Report No:3011655 Rev. 3 – March, 2002 Page 10 of 63
Graph # 3-1-3

A
FCC ID: FIH2611SS Report No:3011655 Rev. 3 – March, 2002 Page 11 of 63
Graph # 3-1-4

A
FCC ID: FIH2611SS Report No:3011655 Rev. 3 – March, 2002 Page 12 of 63
Graph # 3-1-5

A
FCC ID: FIH2611SS Report No:3011655 Rev. 3 – March, 2002 Page 13 of 63
Graph # 3-1-6

A
FCC ID: FIH2611SS Report No:3011655 Rev. 3 – March, 2002 Page 14 of 63
Graph # 3-1-7

A
FCC ID: FIH2611SS Report No:3011655 Rev. 3 – March, 2002 Page 15 of 63
Graph # 3-1-8

A
FCC ID: FIH2611SS Report No:3011655 Rev. 3 – March, 2002 Page 16 of 63
Graph # 3-1-9

A
FCC ID: FIH2611SS Report No:3011655 Rev. 3 – March, 2002 Page 17 of 63
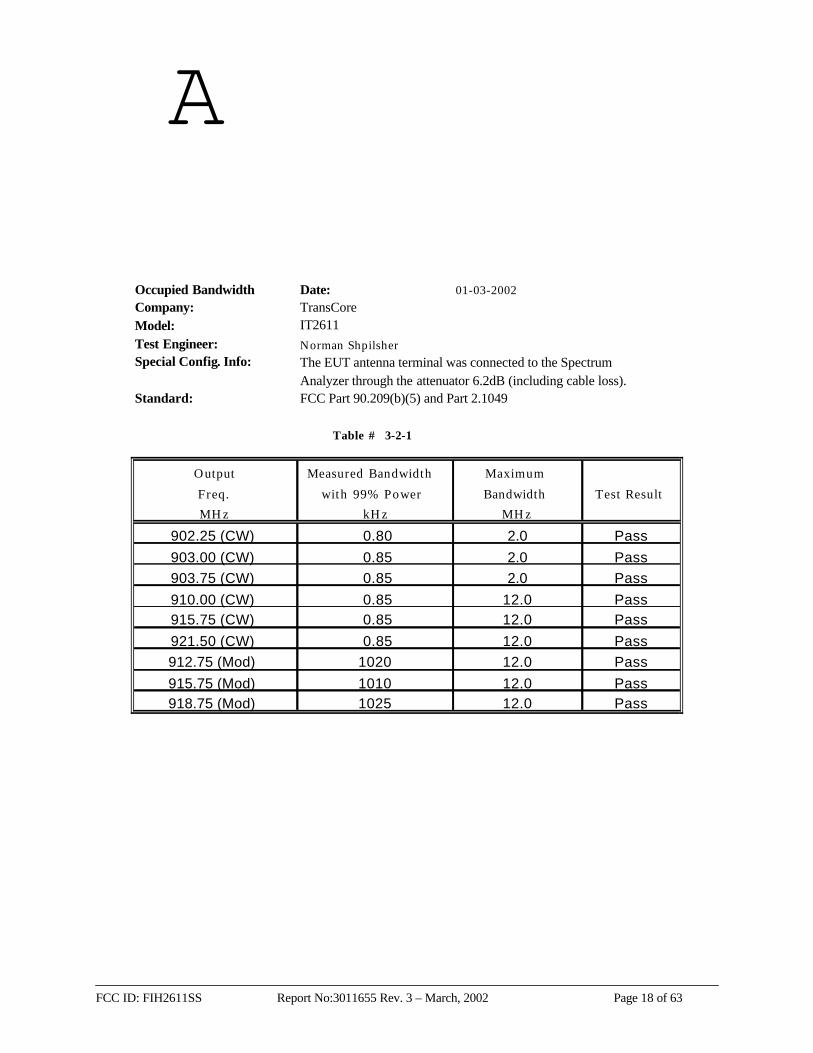
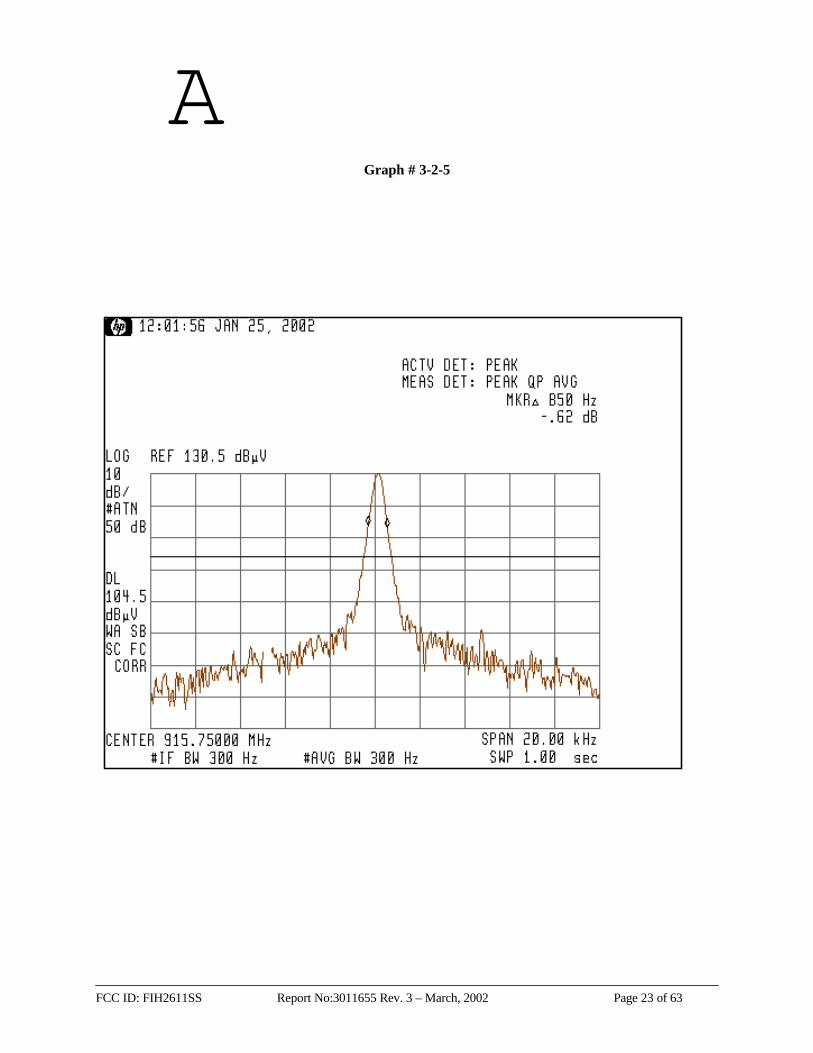
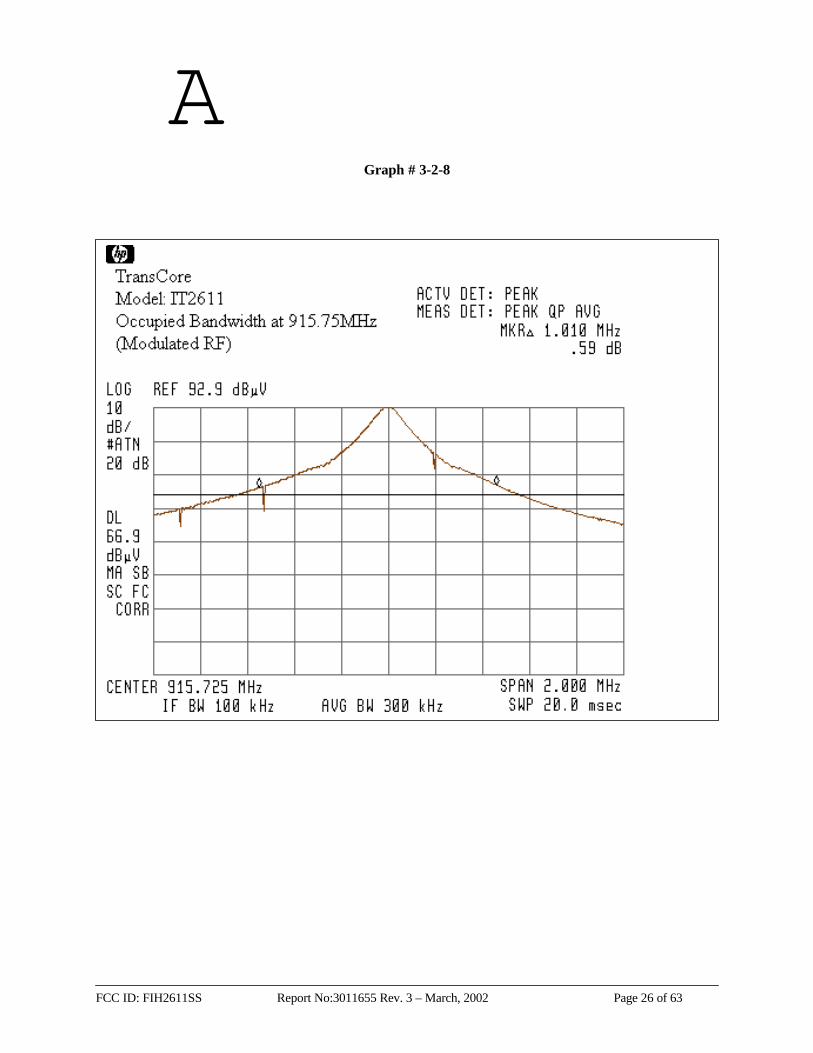
3.2 Occupied Bandwidth, FCC 90.209(b)(5), 2.1049
Occupied Bandwidth measurements were made for frequencies 902.25MHz, 903.0MHz, 903.75MHz,910.0MHz, 915.75MHz, and 921.5MHz with unmodulated signal (CW) and for frequencies 912.75MHz,915.75MHz, and 918.75MHz with modulated RF signal.
Test Procedure
The Occupied Bandwidth for the device was measured at the maximum power transmission condition. Thetransmitter antenna port was connected to the Spectrum analyzer via the attenuator. The OccupiedBandwidth was measured based on the analyzer 99% power measurement option.
The measured Occupied Bandwidth was compared with the maximum allowed bandwidth of 2MHz infrequency range from 902 to 904MHz and 12MHz in frequency range 909.75 to 921.75MHz according toFCC 90.209(b)(5).
Table and graphs below show the Occupied Bandwidth test result.Note: Emission level shown in the Graphs does not include 6.2dB attenuation factor of the attenuator.
According to FCC 2.202 and type of modulation, the Necessary Bandwidth was determined from theOccupied Bandwidth measurements (See Table # 3-2-1).
The Necessary Bandwidth is:
850Hz - for unmodulated signal (240KN0N Emissions Designator)
1.025MHz – for modulated signal (1M03L1D Emissions Designator)
A
FCC ID: FIH2611SS Report No:3011655 Rev. 3 – March, 2002 Page 18 of 63
Occupied Bandwidth Date: 01-03-2002
Company: TransCoreModel: IT2611
Test Engineer: Norman Shpilsher
Special Config. Info: The EUT antenna terminal was connected to the SpectrumAnalyzer through the attenuator 6.2dB (including cable loss).
Standard: FCC Part 90.209(b)(5) and Part 2.1049
Table # 3-2-1
Output Measured Bandwidth Maximum
Freq. with 99% Power Bandwidth Test Result
MHz kHz MHz
902.25 (CW) 0.80 2.0 Pass
903.00 (CW) 0.85 2.0 Pass
903.75 (CW) 0.85 2.0 Pass
910.00 (CW) 0.85 12.0 Pass915.75 (CW) 0.85 12.0 Pass
921.50 (CW) 0.85 12.0 Pass
912.75 (Mod) 1020 12.0 Pass
915.75 (Mod) 1010 12.0 Pass918.75 (Mod) 1025 12.0 Pass

A
FCC ID: FIH2611SS Report No:3011655 Rev. 3 – March, 2002 Page 19 of 63
Graph # 3-2-1

A
FCC ID: FIH2611SS Report No:3011655 Rev. 3 – March, 2002 Page 20 of 63
Graph # 3-2-2

A
FCC ID: FIH2611SS Report No:3011655 Rev. 3 – March, 2002 Page 21 of 63
Graph # 3-2-3

A
FCC ID: FIH2611SS Report No:3011655 Rev. 3 – March, 2002 Page 22 of 63
Graph # 3-2-4
A
FCC ID: FIH2611SS Report No:3011655 Rev. 3 – March, 2002 Page 23 of 63
Graph # 3-2-5

A
FCC ID: FIH2611SS Report No:3011655 Rev. 3 – March, 2002 Page 24 of 63
Graph # 3-2-6

A
FCC ID: FIH2611SS Report No:3011655 Rev. 3 – March, 2002 Page 25 of 63
Graph # 3-2-7
A
FCC ID: FIH2611SS Report No:3011655 Rev. 3 – March, 2002 Page 26 of 63
Graph # 3-2-8

A
FCC ID: FIH2611SS Report No:3011655 Rev. 3 – March, 2002 Page 27 of 63
Graph # 3-2-9

A
FCC ID: FIH2611SS Report No:3011655 Rev. 3 – March, 2002 Page 28 of 63
3.3 Spurious Emissions at Antenna Terminal, FCC 90.210(k)(3)(ii), 2.1051
Spurious Emissions at antenna terminal was measured in frequency range up to 10 GHz (10th harmonic).
Test Procedure
The Spurious Emissions at Antenna Terminal for the device was measured at the maximum powertransmission condition. The transmitter antenna port was connected to the Spectrum analyzer via theattenuator.
Total Emissions level was calculated from Measured Power adding 6.2dB of the external-of-analyzerattenuator.
The Minimum Emission Attenuation calculationThe minimum emissions attenuation was calculated using the maximum output power P (Watt):Minimum Attenuation = 55 + 10log (P)The maximum measured output power in Section 3.1 is 29.5dBm, or 0.891 WattAccording to the client specification, the maximum output power at antenna terminal is 1 Watt, or 30dBm.As a worse case, the Minimum Attenuation based on 1Watt maximum output power is chosen as areference level:Minimum Attenuation = 55 + 10log (P) = 55 + 10log(1Watt) = 55dB
No spurious or harmonics emissions were observed at antenna terminal in frequency range up to 10GHz(10th harmonic).
Graph below shows the spurious emissions at antenna terminal.Note: Emission level shown in the Graphs does not include 6.2dB attenuation factor of the attenuator.

A
FCC ID: FIH2611SS Report No:3011655 Rev. 3 – March, 2002 Page 29 of 63
Graph # 3-3-1
Radiated Emissions at Antenna Terminal, FCC 90.210(k)
Peak @ 915.75MHz = 130.5dBuVResolution Bandwidth 100kHz, Video Bandwidth 100kHz
Minimum attenuation 55dB (Line at 75.5dBuV)
100.0M 1.0G 10.0G
Frequency
40.0
50.0
60.0
70.0
80.0
90.0
100.0
110.0
120.0
130.0
140.0
Am
plitu
de d
Bu
V
Operator: Norman Shpilsher
Job # - 3011655Serial # -Model Number - IT2611
Company - TransCore
Line_1Line_1_t12FCC90.201k3

A
FCC ID: FIH2611SS Report No:3011655 Rev. 3 – March, 2002 Page 30 of 63
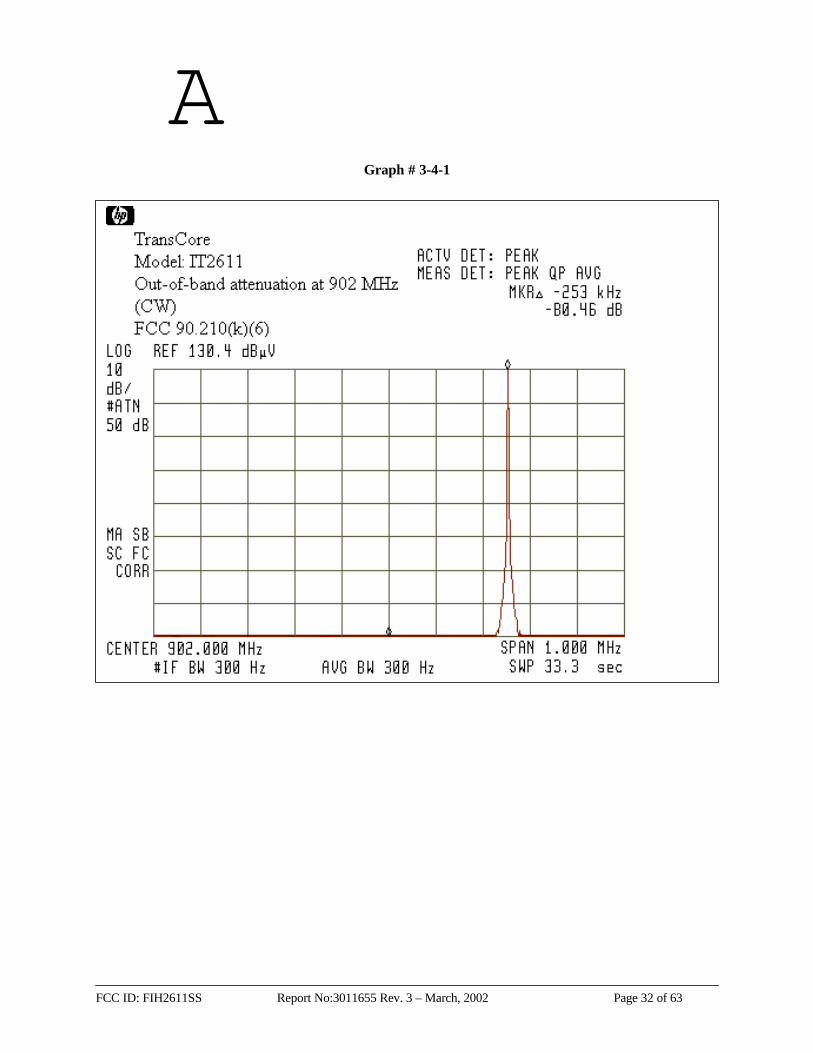
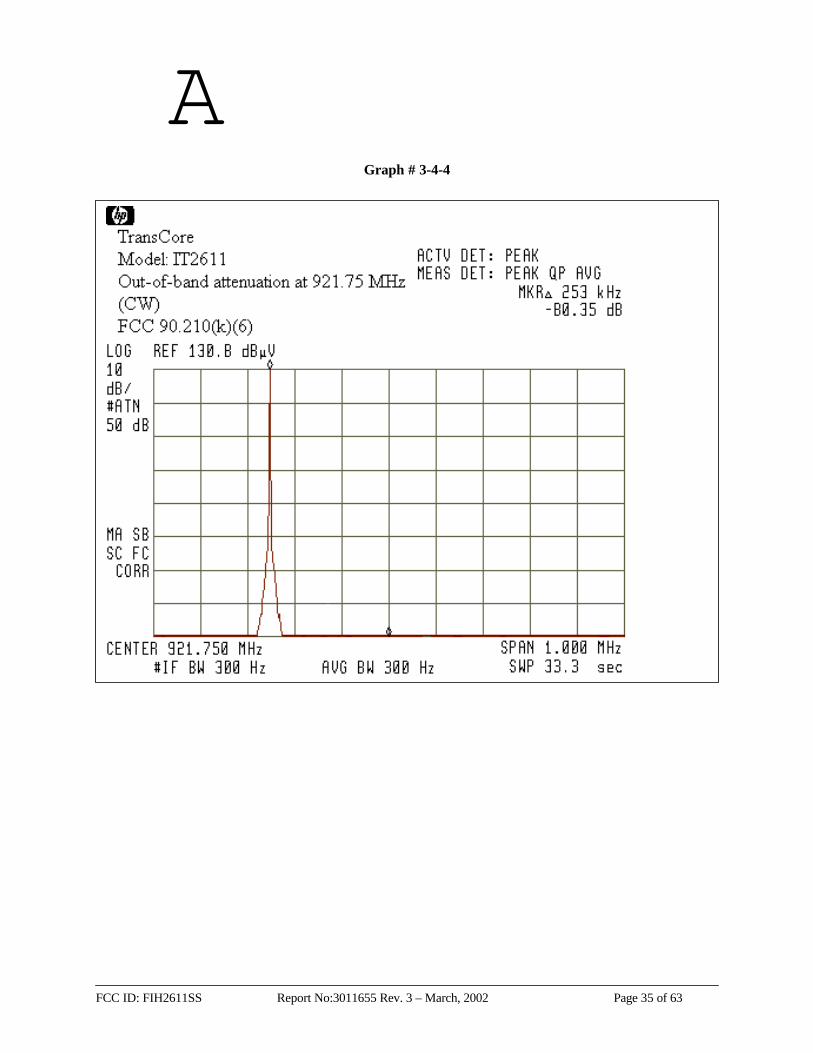
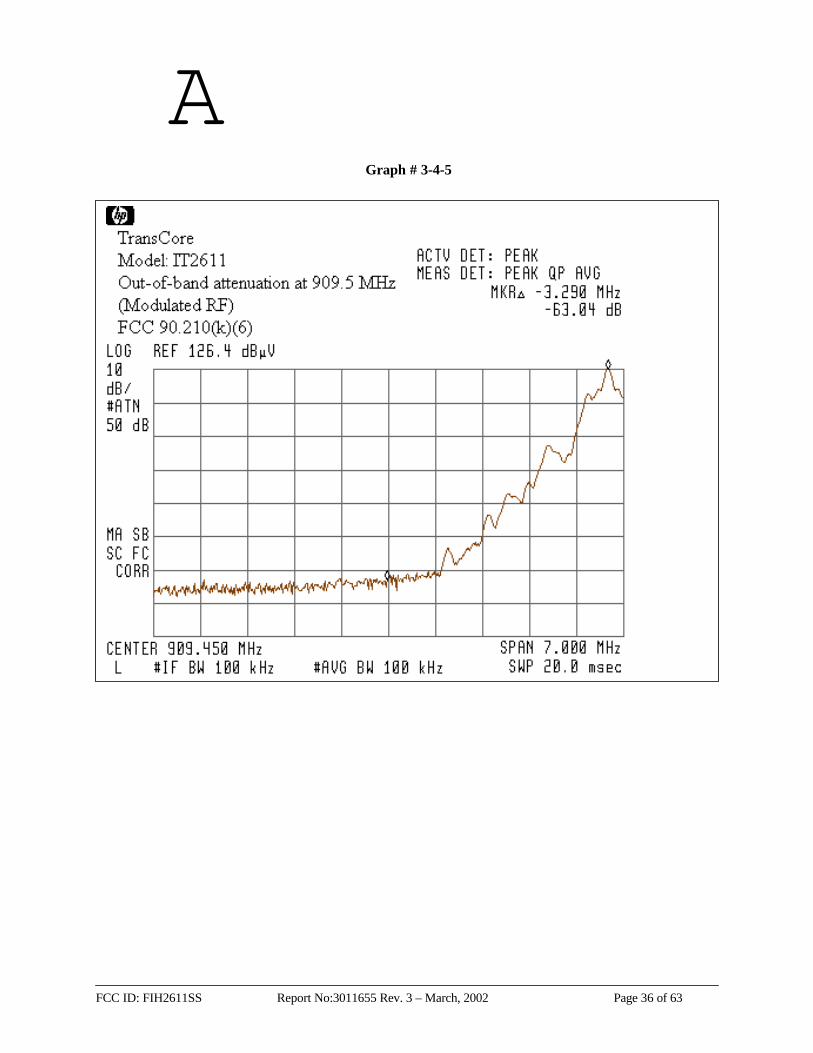
3.4 Out of Band Spurious Emissions at Antenna Terminal, FCC 90.210(k)(3)(ii), 2.1051
Out-of-band measurements were made for frequencies:- 902MHz- 904MHz- 909.5MHz- 921.75MHz.
Output frequencies of the EUT was set to:- 902.25MHz (CW)- 903.75MHz (CW)- 910.00MHz (CW)- 921.50MHz (CW)- 912.75MHz (Modulated RF)- 918.75MHz (Modulated RF)
Test Procedure
The Spurious Emissions at Antenna Terminal for the device was measured at the maximum powertransmission condition. The transmitter antenna port was connected to the Spectrum analyzer via theattenuator.
Total Emissions level was calculated from Measured Power adding 6.2dB of the external-of-analyzerattenuator.
The Minimum Emission Attenuation calculationThe minimum emissions attenuation was calculated using the maximum output power P (Watt):Minimum Attenuation = 55 + 10log (P)The maximum measured output power in Section 3.1 is 29.5dBm, or 0.891 WattAccording to the client specification, the maximum output power at antenna terminal is 1 Watt, or 30dBm.As a worse case, the Minimum Attenuation based on 1Watt maximum output power is chosen as areference level:Minimum Attenuation = 55 + 10log (P) = 55 + 10log(1Watt) = 55dB
Measurements were taken using 100kHz Resolution Bandwidth (RBW) of the Analyzer, for frequencieswithin 1MHz of the Bandedge 300Hz RBW was used.
Table and graphs below show the out-of-band spurious emissions at antenna terminalNote: Emission level shown in the Graphs does not include 6.2dB attenuation factor of the attenuator.

A
FCC ID: FIH2611SS Report No:3011655 Rev. 3 – March, 2002 Page 31 of 63
Out-of-band Spurious Emissions at Antenna Terminal Date: 01-14-2001
Company: TransCoreModel: IT2611
Test Engineer: Norman Shpilsher
Special Config. Info: The EUT antenna terminal was connected to the SpectrumAnalyzer through the attenuator 6.2dB (including cable loss).
Standard: FCC Part 90.210(k)(3)( i i ) and Part 2.1051Note: Measurements were taken using 100kHz Resolution Bandwidth (RBW) of the Analyzer,
for frequencies within 1MHz of the Bandedge 300Hz RBW was used (indicated in the Table).
Table # 3-4-1
Output Edge Max imum Minimum MeasuredFreq. Freq. Output Power Atten. Atten. Marg in CommentsMHz MHz Watt dB dB
902.25 (CW) 902.00 1.0 55.0 80.5 -25.5 RBW 300Hz
903.75 (CW) 904.00 1.0 55.0 79.8 -24.8 RBW 300Hz
910.00 (CW) 909.50 1.0 55.0 82.4 -27.4 RBW 300Hz
921.50 (CW) 921.75 1.0 55.0 80.4 -25.4 RBW 300Hz
912.75 (Mod) 909.50 1.0 55.0 63.0 -8.0918.75 (Mod) 921.75 1.0 55.0 59.3 -4.3
A
FCC ID: FIH2611SS Report No:3011655 Rev. 3 – March, 2002 Page 32 of 63
Graph # 3-4-1

A
FCC ID: FIH2611SS Report No:3011655 Rev. 3 – March, 2002 Page 33 of 63
Graph # 3-4-2

A
FCC ID: FIH2611SS Report No:3011655 Rev. 3 – March, 2002 Page 34 of 63
Graph # 3-4-3
A
FCC ID: FIH2611SS Report No:3011655 Rev. 3 – March, 2002 Page 35 of 63
Graph # 3-4-4
A
FCC ID: FIH2611SS Report No:3011655 Rev. 3 – March, 2002 Page 36 of 63
Graph # 3-4-5

A
FCC ID: FIH2611SS Report No:3011655 Rev. 3 – March, 2002 Page 37 of 63
Graph # 3-4-6

A
FCC ID: FIH2611SS Report No:3011655 Rev. 3 – March, 2002 Page 38 of 63
3.5 Field Strength of Spurious Emissions, FCC 90.210(k)(3)(ii), 2.1053
Field Strength of Spurious Emissions was measured in the Anechoic Chamber in the frequency range up to10 GHz (10th harmonic).The substitution method of measurement was used for emissions with the level of field strength above thegeneral limits for unintentional radiation for unlicensed devices (FCC 15.109, Class A).The substitution method of measurement is based on the calculation of the minimum attenuation of theoutput ERP of the EUT.
Calculation of the minimum attenuation for antenna AA3152 Universal Toll AntennaOutput ERP = Pmax-at –antenna-terminal + Gantenna-gainThe measured in Section 3.1 maximum emission at antenna terminal Pmax-at –antenna-terminal is29.5dBm, as a worse case 30dBm (according to the manufacturer specification) is chosen.Output ERP = Pmax-at –antenna-terminal + Gantenna-gain = 30dBm + 13dBi = 43dbm = 20WMinimum Attenuation = 55 + 10log (P) = 55 + 10log(20Watt) = 68dBMaximum Spurious Emissions = Output ERP – Minimum Attenuation = 43dBm –68dB = -25dBm
Calculation of the minimum attenuation for antenna AA3153 Toll AntennaOutput ERP = Pmax-at –antenna-terminal + Gantenna-gainThe measured in Section 3.1 maximum emission at antenna terminal Pmax-at –antenna-terminal is29.5dBm, as a worse case 30dBm (according to the manufacturer specification) is chosen.Output ERP = Pmax-at –antenna-terminal + Gantenna-gain = 30dBm + 10.5dBi = 40.5dbmOutput ERP = 11.22WMinimum Attenuation = 55 + 10log (P) = 55 + 10log(11.22Watt) = 65.5dBMaximum Spurious Emissions = Output ERP – Minimum Attenuation = 40.5dBm – 65.5dBMaximum Spurious Emissions = -25dBm
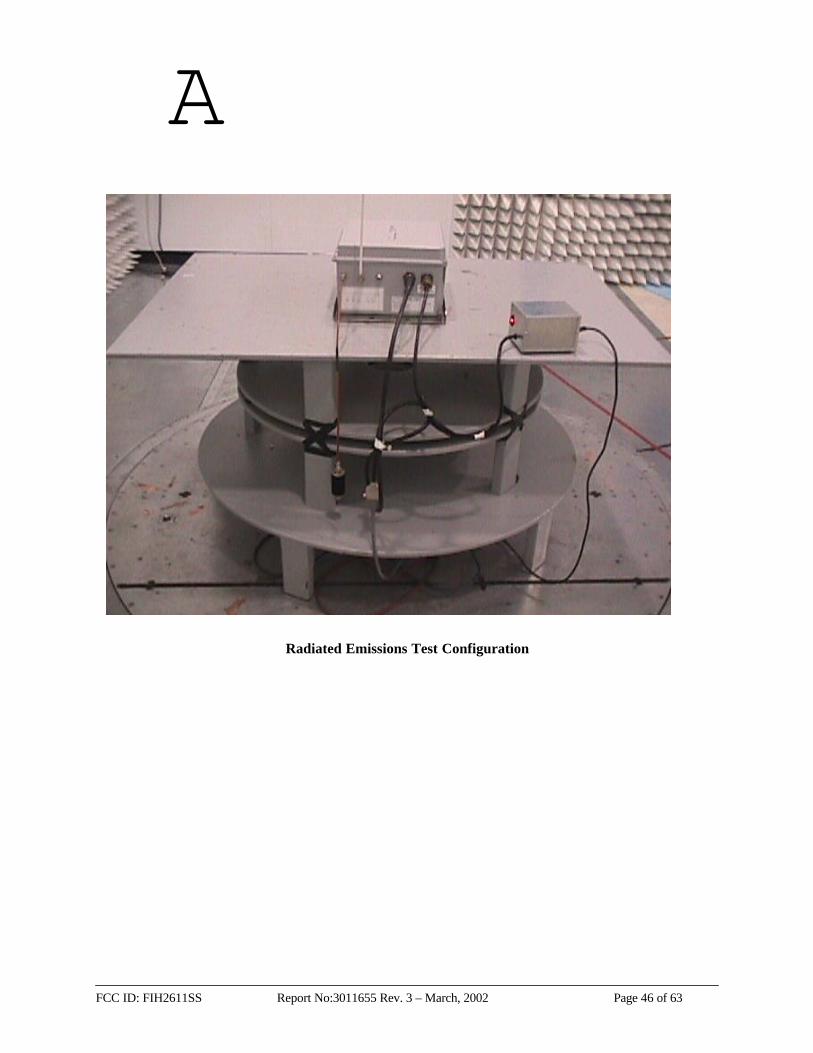
Test ProcedureThe EUT was placed on a non-conductive table 0.8m above the ground plane inside the Anecoic Chamber.The table was centered on a motorized turntable, which allows 360-degree rotation. The measurementantenna was positioned at distance 3m. The radiated emissions were maximized by configuring the EUT, byrotating the EUT, by changing antenna polarization, and by changing antenna height from 1 to 4m. Fieldstrength was measured and calculated (See Section 3.7). The Emissions with the level of about 20dB belowthe Maximum Spurious Emissions were chosen for substitution method of measurement.For substitution method the substitution antenna with the signal generator was placed instead of the EUTwith the center of substitution antenna was at the same location as the center of transmitter. The substitutionantenna was faced to measurement antenna with the same polarization as the measuring antenna. The levelof the generator output was adjusted until the previously recorded maximum emission reading for this set ofconditions is obtained. Substitution method of the Field Strength Calculation sees in Section 3.7.
The Table and Graphs below show the Field Strength of Spurious Radiation.

A
FCC ID: FIH2611SS Report No:3011655 Rev. 3 – March, 2002 Page 39 of 63
Radiated Emissions Date: 01-04-2001
Company: TransCore
Model: IT2611
Test Engineer: Norman Shpi lsher
Special Config. Info: Sabstitution Metod
Limits FCC 90 .210(k) (3 ) ( i i )
Test Site: 3m Anechoic Chamber
Note: The table shows the worst case radiated emissions
Table # 3-5-1
Frequency Measured Substitution Substitution Substitution Limi t M a r g i n
Emissions Antenna Power Antenna Gain Antenna EPR
M H z dBm V dBm dBi Power (dBm) dBm dB
1807.5 62.12 -47.5 8.4 -39.1 -25.0 -14.11829.8 48.44 -55.9 8.4 -47.5 -25.0 -22.5
2708.2 61.19 -39.5 9.4 -30.1 -25.0 -5.12745.4 57.09 -43.6 9.4 -34.2 -25.0 -9.2

A
FCC ID: FIH2611SS Report No:3011655 Rev. 3 – March, 2002 Page 40 of 63
Graph # 3-5-1
Graph # 3-5-2
INTERTEK TESTING SERVICESRADIATED EMISSIONS 30MHz - 1GHz
10.00M 100.00M 1.00G
Frequency MHz
10.0
15.0
20.0
25.0
30.0
35.0
40.0
45.0
50.0
55.0
60.0
65.0
70.0
75.0
80.0
Am
plitu
de d
BuV
Job #: 3011655Operator: Norman Shpilsher
Job # - 3011655Company - TransCoreModel # - IT2611Serial # -
maximum_v_h_cfMaximum_12fcca
INTERTEK TESTING SERVICESRadiated Emissions 1GHz-10GHz
1.0G 10.0G
Frequency GHz
0
5.0
10.0
15.0
20.0
25.0
30.0
35.0
40.0
45.0
50.0
55.0
60.0
65.0
70.0
Am
plitu
de d
BuV
Job #: 3011655Operator: Norman Shpilsher
Job # - 3011655Company - TransCoreModel # - IT2611Serial # -Additional Equipment -
maximum_v_h_cf
Maximum_12
fcc_a
A
FCC ID: FIH2611SS Report No:3011655 Rev. 3 – March, 2002 Page 41 of 63
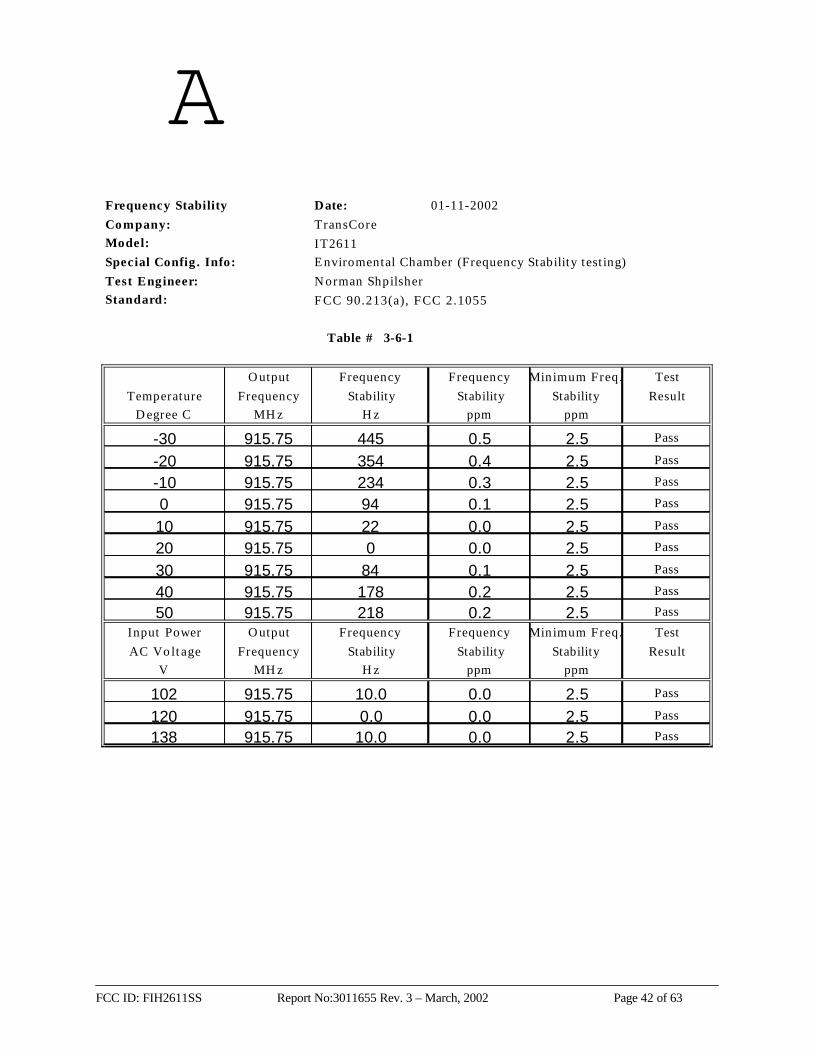
3.6 Frequency Stability, FCC 90.213(a), 2.1055
Frequency Stability with variation of ambient temperature was measured from –30 degrees C to +50degrees C at frequency 915.75MHz and rated power input 120VAC/60Hz.
Frequency Stability with variation of primary supply voltage was measured at 85% (102V) and 115%(138V) of rated AC Power Supply input voltage of 120V at frequency 915.75MHz.
Note: FCC 90.213(a) indicates that fixed non-multilateration transmitters with an authorized bandwidth thatis more than 40kHz from the band edge is not subject to frequency tolerance restriction.
Table and below shows the frequency stability vs. temperature ambient and supply voltage.
Test Procedure
The EUT was placed in an environmental test chamber and powered such that control element receivednormal voltage and the transmitter provided maximum RF output. The Chamber was programmed to coolfrom room temperature to minus 30 degrees C and then step in 10-degree increments to plus 50 degrees C.For Frequency Stability testing with variation of primary supply voltage the EUT power supply waspowered at rated supply voltage at 120VAC/60Hz and then at 102VAC/60Hz and 138VAC/60Hz
A
FCC ID: FIH2611SS Report No:3011655 Rev. 3 – March, 2002 Page 42 of 63
Frequency Stability Date: 01-11-2002
Company: TransCore
Model: IT2611
Special Config. Info: Enviromental Chamber (Frequency Stabi l i ty test ing)
Test Engineer: Norman Shpi lsher
Standard: FCC 90 .213 (a ) , FCC 2 .1055
Table # 3-6-1
Output Frequency Frequency Minimum Freq. Test
Temperature Frequency Stability Stability Stability Result
Degree C MHz H z ppm ppm
-30 915.75 445 0.5 2.5 Pass
-20 915.75 354 0.4 2.5 Pass
-10 915.75 234 0.3 2.5 Pass
0 915.75 94 0.1 2.5 Pass
10 915.75 22 0.0 2.5 Pass
20 915.75 0 0.0 2.5 Pass
30 915.75 84 0.1 2.5 Pass
40 915.75 178 0.2 2.5 Pass
50 915.75 218 0.2 2.5 Pass
Input Power Output Frequency Frequency Minimum Freq. Test
AC Vo l t age Frequency Stability Stability Stability Result
V MHz H z ppm ppm
102 915.75 10.0 0.0 2.5 Pass
120 915.75 0.0 0.0 2.5 Pass
138 915.75 10.0 0.0 2.5 Pass
A
FCC ID: FIH2611SS Report No:3011655 Rev. 3 – March, 2002 Page 43 of 63
3.7 Field Strength Calculation
Straight methodThe field strength is calculated by adding the emissions reading on the EMI Receiver to the factors associatedwith preamplifiers (if any), antennas and cables. A sample calculation is included below.
FS = RA – AG + AF + CF
Where FS = Field Strength in dBìV/mRA = Receiver Amplitude (including preamplifier) in dBìVAG = Amplifier Gain in dBiCF = Cable Attenuation Factor in dBAF = Antenna Factor in dB/m
Assume a receiver reading of 47 dBìV is obtained. The amplifier gain of 15 dBi is subtracted. The antennafactor of 19.5 dB/m and cable factor of 3.5 dB is added. The amplifier gain, antenna factor and cable factorcombined to the Total CF. The net field strength for comparison to the appropriate limit is 52 dBìV/m.
Substitution methodThe field strength is calculated by adding the power reading on the substitution generator to the antenna gainassociated with substitution antenna, and cables. A sample calculation is included below.
FS = GP + AG - CF
Where FS = Field Strength in dBmGP = Generator Output Power in dBmAG = Antenna Gain in dBiCF = Cable Attenuation Factor in dB
Assume a generator output power reading of -40 dBm is obtained. The antenna gain is 13 dBi is added. Thecable factor of 0.5 dB is subtracted. The field strength for comparison to the limit is –27.5 dBm.
Tested by:
Norman ShpilsherEMC Project EngineerIntertek Testing Services NA, Inc.
Agent for TransCoreSignature
Signature
Date: January 18, 2002
A
FCC ID: FIH2611SS Report No:3011655 Rev. 3 – March, 2002 Page 44 of 63
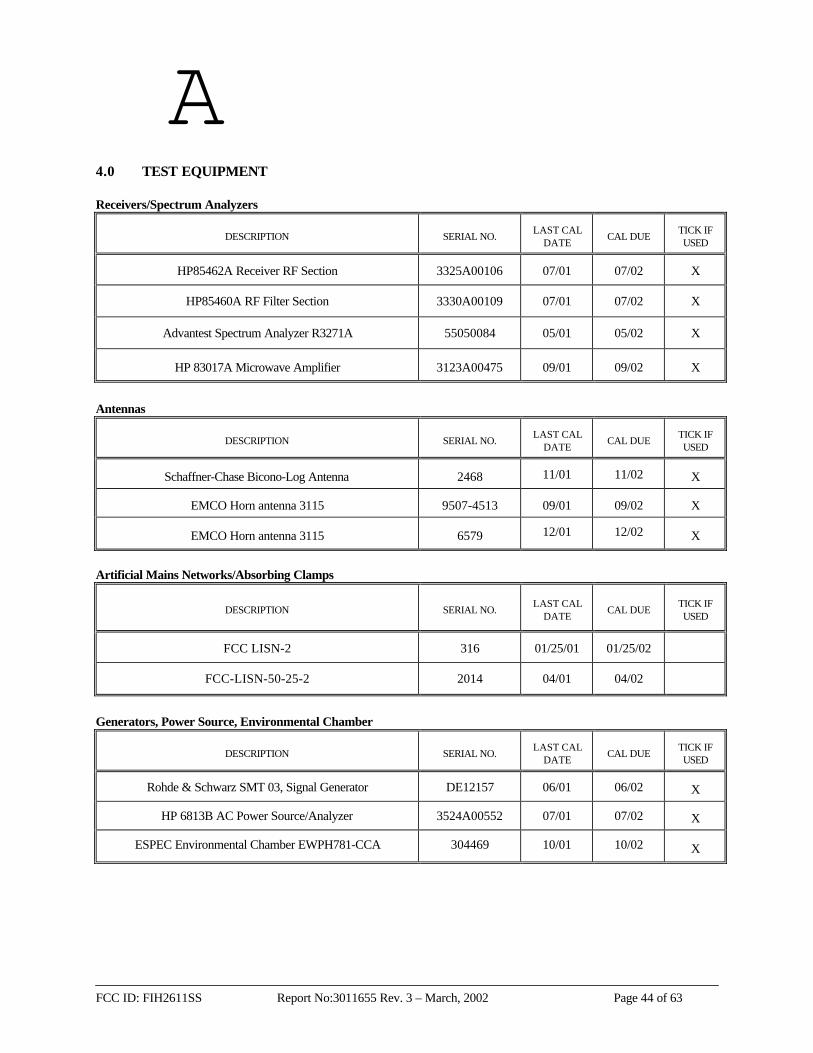
4.0 TEST EQUIPMENT
Receivers/Spectrum Analyzers
DESCRIPTION SERIAL NO.LAST CAL
DATECAL DUE
TICK IFUSED
HP85462A Receiver RF Section 3325A00106 07/01 07/02 X
HP85460A RF Filter Section 3330A00109 07/01 07/02 X
Advantest Spectrum Analyzer R3271A 55050084 05/01 05/02 X
HP 83017A Microwave Amplifier 3123A00475 09/01 09/02 X
Antennas
DESCRIPTION SERIAL NO.LAST CAL
DATECAL DUE
TICK IFUSED
Schaffner-Chase Bicono-Log Antenna 2468 11/01 11/02 X
EMCO Horn antenna 3115 9507-4513 09/01 09/02 X
EMCO Horn antenna 3115 6579 12/01 12/02 X
Artificial Mains Networks/Absorbing Clamps
DESCRIPTION SERIAL NO.LAST CAL
DATECAL DUE
TICK IFUSED
FCC LISN-2 316 01/25/01 01/25/02
FCC-LISN-50-25-2 2014 04/01 04/02
Generators, Power Source, Environmental Chamber
DESCRIPTION SERIAL NO.LAST CAL
DATECAL DUE
TICK IFUSED
Rohde & Schwarz SMT 03, Signal Generator DE12157 06/01 06/02 X
HP 6813B AC Power Source/Analyzer 3524A00552 07/01 07/02 X
ESPEC Environmental Chamber EWPH781-CCA 304469 10/01 10/02 X

A
FCC ID: FIH2611SS Report No:3011655 Rev. 3 – March, 2002 Page 45 of 63
EXHIBIT I
TEST SET UP PHOTOS
A
FCC ID: FIH2611SS Report No:3011655 Rev. 3 – March, 2002 Page 46 of 63
Radiated Emissions Test Configuration

A
FCC ID: FIH2611SS Report No:3011655 Rev. 3 – March, 2002 Page 47 of 63
Radiated Emissions Test Configuration

A
FCC ID: FIH2611SS Report No:3011655 Rev. 3 – March, 2002 Page 48 of 63
Radiated Emissions Test Configuration

A
FCC ID: FIH2611SS Report No:3011655 Rev. 3 – March, 2002 Page 49 of 63
Radiated Emissions Test Configuration

A
FCC ID: FIH2611SS Report No:3011655 Rev. 3 – March, 2002 Page 50 of 63
EXHIBIT II
FCC ID LABEL LOCATION
(See ID Label/Location Info. Attachments)

A
FCC ID: FIH2611SS Report No:3011655 Rev. 3 – March, 2002 Page 51 of 63
EXHIBIT III
EXTERNAL PHOTOS
A
FCC ID: FIH2611SS Report No:3011655 Rev. 3 – March, 2002 Page 52 of 63
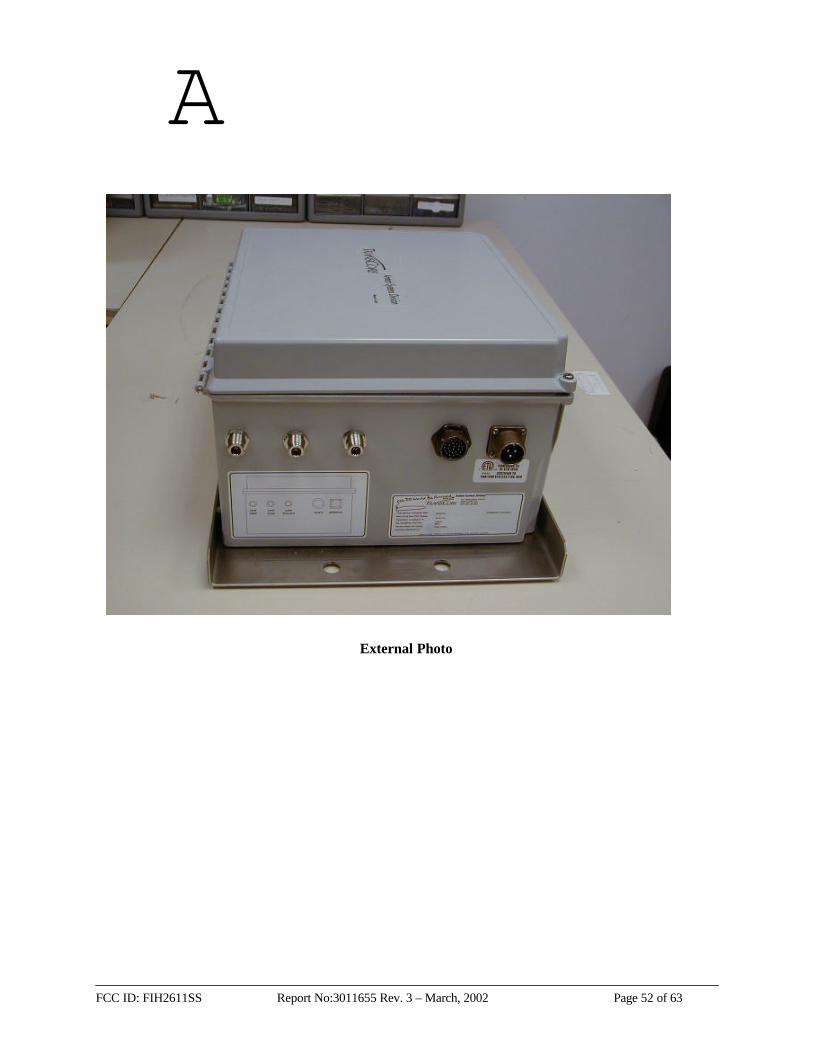
External Photo

A
FCC ID: FIH2611SS Report No:3011655 Rev. 3 – March, 2002 Page 53 of 63
External Photo

A
FCC ID: FIH2611SS Report No:3011655 Rev. 3 – March, 2002 Page 54 of 63
EXHIBIT IV
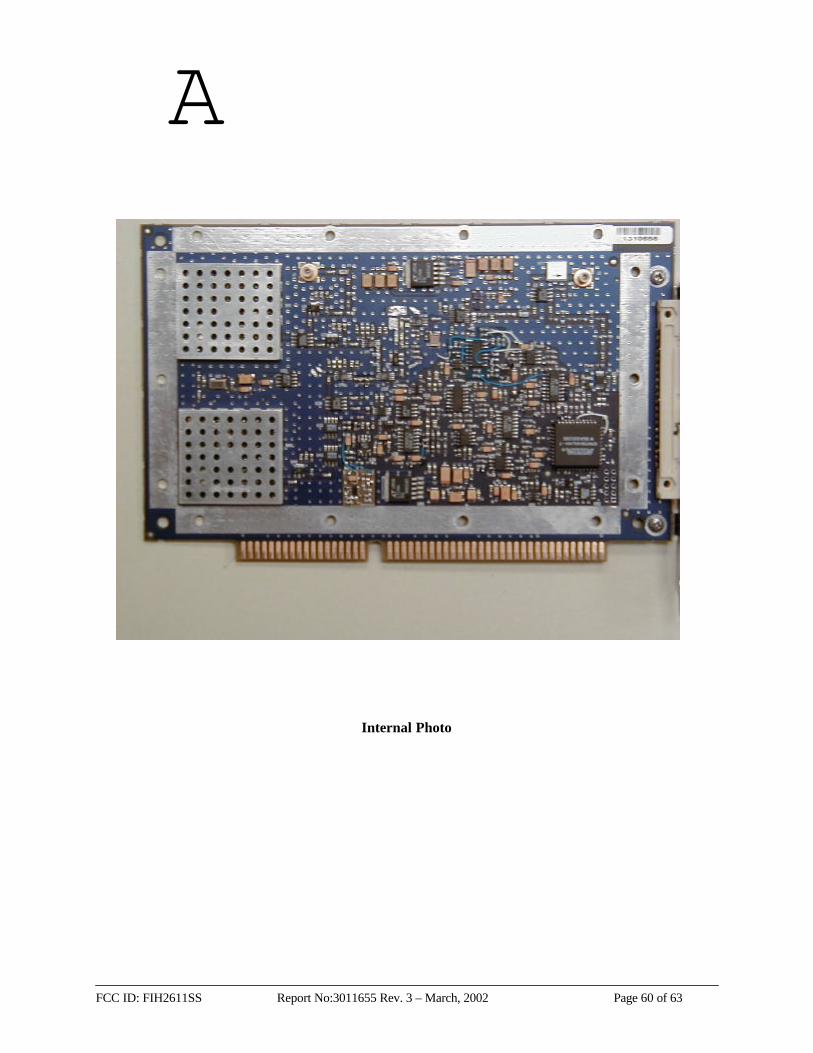
INTERNAL PHOTOS

A
FCC ID: FIH2611SS Report No:3011655 Rev. 3 – March, 2002 Page 55 of 63
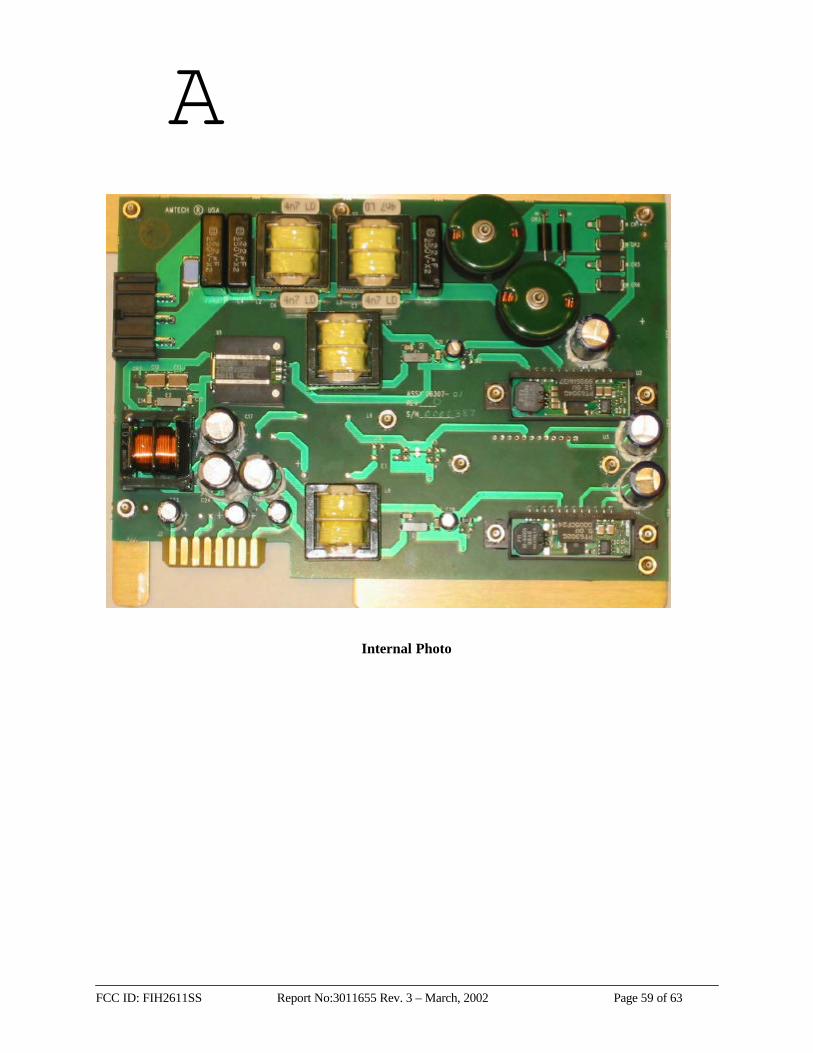
Internal Photo

A
FCC ID: FIH2611SS Report No:3011655 Rev. 3 – March, 2002 Page 56 of 63
Internal Photo

A
FCC ID: FIH2611SS Report No:3011655 Rev. 3 – March, 2002 Page 57 of 63
Internal Photo

A
FCC ID: FIH2611SS Report No:3011655 Rev. 3 – March, 2002 Page 58 of 63
Internal Photo
A
FCC ID: FIH2611SS Report No:3011655 Rev. 3 – March, 2002 Page 59 of 63
Internal Photo
A
FCC ID: FIH2611SS Report No:3011655 Rev. 3 – March, 2002 Page 60 of 63
Internal Photo

A
FCC ID: FIH2611SS Report No:3011655 Rev. 3 – March, 2002 Page 61 of 63
Internal Photo
A
FCC ID: FIH2611SS Report No:3011655 Rev. 3 – March, 2002 Page 62 of 63
EXHIBIT V
ELECTRICAL SCHEMATICS AND BLOCK DIAGRAM
(See Block Diagram and Schematic Attachments)
A
FCC ID: FIH2611SS Report No:3011655 Rev. 3 – March, 2002 Page 63 of 63
EXHIBIT VI
USER MANUAL AND OPERATIONAL DESCRIPTION
(See User Manual and Operational Description Attachments)