Embed Size (px)
Citation preview


2

3
TRANSACTION CAPITAL GROUP STRUCTUREHY17 FINANCIAL & OPERATIONAL HIGHLIGHTS (HY17 compared to HY16)
A vertically integrated taxi platform incorporating vehicle
procurement, retail, finance, insurance, repossession, spare
part procurement & refurbishment capabilities, combined with
SA Taxi’s proprietary data to deploy developmental credit,
distribute bespoke taxi insurance, sell focused vehicle models
& other allied services to taxi operators, thus ensuring the
sustainability of a fundamental mode of transport
A technology-led, data-driven provider of customer
management services in South Africa & Australia through
a scalable & bespoke platform, enabling its clients to
mitigate risk through their customer engagement lifecycle
CEO: Terry Kier, 10-year group tenure
R144 MILLION¹
HEADLINE
EARNINGS
R7.8 BILLION
GROSS LOANS
& ADVANCES
R195 MILLION
NON-INTEREST
REVENUE
CEO: Dave McAlpin, 9-year group tenure
R93 MILLION¹
HEADLINE EARNINGS
R930 MILLION
PURCHASED
BOOK DEBTS
80.3%
COST-TO-INCOME
RATIO
R210 MILLION
VALUE OF PURCHASED
BOOK DEBTS ACQUIRED
CEO: David Hurwitz, 12-year group tenure
R254 MILLION¹
HEADLINE
EARNINGS
43.3 CPS
HEADLINE EARNINGS
PER SHARE
15 CPS
INTERIM DIVIDEND
PER SHARE
581.3 CPS
NET ASSET VALUE
PER SHARE
R9.2 BILLION²
MARKET CAPITALISATION
3.3%
CREDIT LOSS RATIO
24.1%
RETURN ON EQUITY
17.2%
NON-PERFORMING LOAN
RATIO
16.1%
RETURN ON EQUITY
R1.5 BILLION
ESTIMATED REMAINING
COLLECTIONS
20.6%
RETURN ON EQUITY
▲22% ▲16% ▲21% ▲17% Core▲33%
Excluding acquisitions▲17%
▲63%
▲30% HY16 3.4% ▲22% ▲25% HY16 81.5%
▲ >100%
HY16 25.4% HY16 18.0% HY16 15.9% HY16 27.7% ▲40%
Financial ratios & results exclude once-off acquisition costs of R22 million incurred during HY17
1. Headline earnings attributable to the group, excluding minority interest | 2. Market capitalisation as at 31 March 2017

4
GROUP
STRATEGIC & OPERATIONAL HIGHLIGHTS
ACQUISITIONS
3 acquisitions within Transaction Capital
Risk Services (TCRS)
• 100% of Recoveries Corporation,
effective 1 January 2017
• 75% of Road Cover,
effective 1 December 2016
• 51% of The Beancounter,
effective 1 December 2016
• Performing in line with expectations
• Integration is a key strategic
& operational focus
STRATEGIC POSITIONING
OF OPERATING DIVISIONS
Delivering robust organic growth
• Occupy leading market positions
• Highly defensive businesses
• Vertically integrated & diversified
business model
• Continued investment in
technology & data
• Platforms to develop new products
& expand into new markets
DEBT CAPITAL MARKETS
Uninterrupted access to the debt capital
markets
• Despite political instability & South
Africa’s sovereign rating downgrade
• SA Taxi raised >R4 billion in HY17
• 2018 fully funded
• Accessed >R2 billion of debt funding
from European DFIs since 2010
• Secured >R2 billion of debt facilities from
US-based DFIs during HY17
• Established a R2 billion domestic note
programme
GROWTH OPPORTUNITIES
• Exploring the purchase of non-performing
loan portfolios as a principal in Australia
• Growth of TCRS’ fledgling insurance
recoveries offering in South Africa
• Road Cover products offered through
TCRS’ clients; to SA Taxi’s client &
commuter base; & directly to consumers
• Bolt-on acquisitions
UNGEARED & LIQUID
BALANCE SHEET
• 28.4 million shares issued raising
R419 million
• Net asset value per share ▲22%
• Liquid capital ~R600 million
• Capacity & flexibility to continue investing
in organic & acquisitive opportunities
INTERIM DIVIDEND
• Interim dividend per share ▲25%
to 15cps
• Interim dividend cover of 2.9 times
(HY16 3.1 times)
• Compound annual growth rate (CAGR)
of 36% since HY14

5
EVOLUTION SINCE LISTING MANAGEMENT INTERVENTIONS TO CREATE VALUE
9 6 10 12 1517 20 26 31 37 43
264
343
500
426477
581
2012 2013 2014 2015 2016 2017
Interim dividend per share (cps) HY Headline earnings per share¹ (cps) Interim net asset value per share² (cps)
June 2012
JSE Listing
November 2013
Paycorp disposal for R937m
IRR 18.2% & PE of 18.7 times
December 2013
Bayport disposal for R1.3bn
IRR 32.6% & PE of 6.7 times
March 2014
Special distribution
(210 cps or R1.2bn in total)
January 2015
Board restructured
& group executive
office simplified
November 2015
Early adoption of IFRS9
October 2016
Conditional share plan approved
November 2016
Dividend policy amended to 2.5 to 3 times (4 to 5 times at listing)
November 2016
Established a R2bn domestic note programme at group level
December 2016
Acquired Road Cover & The Beancounter
January 2017
Acquired Recoveries Corporation in Australia
February 2017
Issued 28.4 million shares raising R419m providing
capacity & flexibility for further acquisitions
CAGR HY12 to HY17:
HY headline earnings per share¹ ▲21%
Interim net asset value per share² ▲17%
Market capitalisation² ▲17%
Interim dividend per share³ ▲36%
Financial years 1 October to 30 September | Adopted IFRS 9 in 2015. 2012 to 2014 numbers on an IAS 39 basis as reported
1. Core headline earnings per share, excluding impact of Paycorp & Bayport
2. 2012 & 2013 adjusted to account for special distribution paid in March 2014
3. CAGR between 2014 & 2017, excludes the impact of Paycorp & Bayport

6
GROUP PORTFOLIO MIX
Headline earnings excludes once-off acquisition costs of R22 million incurred during HY17
1. Attributable to the group, excluding minority interest
2. Accretive cash deployment into acquisitions
Headline earnings
Rm Growth Contribution
2017 2016 2017 2017 2016
SA Taxi¹ 144 118 22% 57% 56%
TCRS¹ 93 70 33% 37% 33%
Group executive office (GEO) 17 22 (23%)² 6% 11%
Total 254 210 21% 100% 100%
Cents per share 43.3 37.0 17%
57%
37%6%
SA Taxi TCRS GEO
56%
33%
11%
20162017
COMPOSITION OF EARNINGS POST ACQUISITIONS TO BE MORE EVENLY WEIGHTED
ACCRETIVE CASH DEPLOYMENT CONVERTING GEO CASH YIELD INTO TCRS EARNINGS


8
TRANSACTION CAPITAL RISK SERVICES (TCRS)
TRANSACTION CAPITAL
RISK SERVICES IS A
TECHNOLOGY-LED,
DATA-DRIVEN PROVIDER OF
CUSTOMER MANAGEMENT
SERVICES IN SOUTH
AFRICA AND AUSTRALIA
THROUGH A SCALABLE
AND BESPOKE PLATFORM,
ENABLING ITS CLIENTS TO
MITIGATE RISK THROUGH
THEIR CUSTOMER
ENGAGEMENT LIFECYCLE
Innovative & bespoke
technology systems that
drive superior performance
& efficiency
1
2 Generating in-depth insights
from the continuous collection
of accurate & valuable data to
develop a consolidated view of
an individual that enables
precise & informed internal
& external decisioning
3 Improving its clients’ ability to
originate, manage & collect
from their customers through
their lifecycles, thus maximising
value
Assisting its clients by accelerating
cash flow as an agent on an outsourced
contingency or fee-for-service basis, or
as a principal in acquiring & collecting
non-performing loan portfolios
Proactive workforce management
& technology facilitate a flexible &
dynamic servicing capability able to
meet a client’s unique requirements
Regarded as a trusted partner by large
consumer-facing businesses & credit
providers across multiple industries
4
Enabling clients to generate higher
risk-adjusted returns through their
engagements with their customers at
the point of origination, management
& collection
5
6
7

9
ENVIRONMENT & MARKET CONTEXTCHALLENGING CONSUMER CREDIT ENVIRONMENT
IN SOUTH AFRICA, OF THE 35 MILLION ADULTS1 THERE ARE:
24 MILLIONCREDIT ACTIVE CONSUMERS
9.8 MILLION NON-PERFORMING CREDIT CONSUMERS (NCR Q4 2016)
OVER 11 MILLION SOUTH AFRICANS DESCRIBED AS “OVER-INDEBTED” (UP FROM 5 MILLION IN 2014)
HOUSEHOLD DEBT TO DISPOSABLE INCOME REMAINS HIGH AT 74%
• Increased number & size of NPL portfolios available to
acquire as a principal from clients preferring immediate
recovery from their NPLs
• Consumers’ disposable income stressed, negatively
affecting their ability to repay debt
• Increased cost & extended time to collect
ADVERSE MACRO-& SOCIO-ECONOMIC ENVIRONMENT
• Stable over the past 18 months
• Regulatory changes re affordability assessments result in
more responsible & lower levels of credit extension
• Earlier rehabilitation of consumers over medium-term
REGULATORY ENVIRONMENT
1. Aged 15 to 65
Source: NCR data at 31 December 2016 | Stats SA

10
TCRS MARKET POSITIONING DATA, ANALYTICS & SCALABLE TECHNOLOGY PLATFORM
• Opportunity to monetise data
• POPI compliant
Data is current,
relevant &
accurate as per:
CREDIT
BUREAU
DATA
OTHER DATA SOURCES
such as the Department of Home Affairs
& the Deeds Office
Data from
PRINCIPAL
PORTFOLIOS
ACQUIRED
Data sourced
from MDU
for maximised
ContactAbility
Transactional Data
enriched with collection
& ContactAbility results
CAMPAIGN
BUILDER
DIALER
& WORKFORCE
MANAGEMENT
• Enhances scale of
ContactAbility
• Schedule the workforce
• Flexible work-hour
selection
• ▲ talk time
• ▲ activations
Predictive analytics to
determine:
• Optimised campaign
• Propensity to pay
• Right time to call
• Right day to pay
• Dynamic matter
prioritisation
MASTER DATA UNIVERSE (MDU)
9.2 MILLION
UNIQUE & VALID ID NUMBERS
Each uniquely scored with a TCRS
propensity to pay score
94%
COVERAGE OF SOUTH AFRICA’S
NON-PERFORMING
CREDIT CONSUMERS
1 in 4South African adults
Up to 5
per unique ID number
ASSOCIATED
TELEPHONE NUMBERS
1 in 3credit-active people6 MILLION
POSTAL
ADDRESSES
unique & valid
>

11
TCRS’ EVOLUTION SINCE LISTING MANAGEMENT INTERVENTIONS TO CREATE VALUE
318
420
561
523
571
93058 62 74 84 97
143
4246
51
6170
93
2012 2013 2014 2015 2016 2017
Purchased book debts (Rm) HY Services EBITDA (excluding Transaction Capital Business Solutions) HY Headline earnings¹ (Rm)
2012
Entered the
payments services
market via the
acquisition of BDB
(now TCPS)
Entered the
municipal
collections sector
October 2014
Restructure including
centralised management team
& overarching strategy
June 2015
Improved penetration
in the Tier 1 banking &
specialised lending sectors
& increased focus on
telecommunications sector
July 2015
Entered the insurance
collections sector
November 2015
Early adoption of IFRS 9
December 2015
TCR achieves level 3 B-BBEE rating
March 2016
Focus on exclusive, forward flow & gain share transactions
April 2016
Technology enhancements, including
implementation of new predictive dialer
June 2016
Creation of the Master Data Universe
August 2016
Call centre centralisation strategy
(Johannesburg, Durban, Cape Town) enabling cost savings
September 2016
Rebrand to leverage Transaction Capital’s brand equity
December 2016
Entered value added services market
via 75% acquisition of Road Cover
December 2016
Acquired 51% of The Beancounter
January 2017
Entered Australian debt recoveries market
via 100% acquisition of Recoveries Corp.
January 2017
Relocation of JHB call centre to cost effective
operating facility located in JHB CBD
January 2017
Investor in people accreditation
March 2017
Initiated implementation of
workforce management technologies
2013
ISO
data security
accreditation
CAGR HY12 to HY17:
Headline earnings ▲18%
Services EBITDA ▲20%
Financial years 1 October to 30 September | 1. Headline earnings attributable to the group

12
In Australia
A$600m Contingency &
fee-for-service
collections
TCRS’ DIVERSIFIED BUSINESS MODEL
We rank 1st
or 2nd
by our clients in 89%
of the 217 MANDATES
where we are represented
FACE VALUE
OF UNSECURED
CONSUMER DEBT
MONITORED BY NCR
R80bn¹
Other fragmented
participants in
addressable market
R14bn Contingency &
fee-for-service collections
R18bnAcquisition of non-performing
loan portfolios as principal
31
36
43
61
69
81 80
105
89
78
67
63
59
71
2010 2011 2012 2013 2014 2015 2016
TCRS target market (unsecured) Mortgages & secured finance
NON-PERFORMING LOAN MARKET SIZE & GROWTH (Rbn)
Non
-per
form
ing
loan
val
ue (
NC
R m
onito
red)
(6%)
TCRS TARGET MARKET:
UNSECURED NON-PERFORMING CONSUMER CREDIT
17%
180 books in total
13 portfolios acquired for R210m in HY17
Asset turnover ratio 57.1%²
Estimated remaining collections R1.5bn
Source: NCR
1. R80bn comprises credit monitored by the NCR as at 31 December 2016. TCRS target market also includes sectors
not regulated by the NCR, being SMEs, education, insurance, public sector, telecommunications, SOEs & utilities
2. Gross principal book revenue as a percentage of average carrying value of purchased book debts

13
R13BILLIONAcquisition of
non-performingloans as principal
R16BILLIONContingency &fee-for-service
collectionsSouth Africa
TCRS’ DIVERSIFIED BUSINESS MODEL31 MARCH 2014
CL
IEN
T E
NG
AG
EM
EN
T M
OD
EL
R61bn¹FACE VALUE OF
UNSECURED CONSUMER
DEBT MONITORED BY NCR
ORIGINATE MANAGE COLLECT
LEAD GENERATION AND
CUSTOMER ACQUISITION
88%
2%10%
Credit retail
Telcos
Insurance
30%
1%26%
2%
16%
22%3%
Creditretail
Banking
Specialistlending Insurance
55%
1%
25%
16%3%
Credit retail
Publicsector
Other
100%
SMEs
61%
7%
5%
22%5%
Credit retail
Banking
Specialistlending
Telcos &education
PAYMENT AND ACCOUNT MANAGEMENT COLLECTION SERVICES
SME FINANCING DEBT PURCHASING
Public sector
Telcos
Banking
Public sector 0% at 31 March 2014
Telcos
R318MILLION
Gross loans & advancesTransaction CapitalBusiness Solutions
Lifestyle
Other
Sectors split by revenue per segment as at 31 March 2014
1. R61bn comprises credit monitored by the NCR as at 31 December 2013. TCRS target market also includes sectors
not regulated by the NCR, being SMEs, education, insurance, public sector, telecommunications, SOEs & utilities

14
R14BILLION
A$600MILLION
CL
IEN
T E
NG
AG
EM
EN
T M
OD
EL
ORIGINATE MANAGE COLLECT
LEAD GENERATION AND
CUSTOMER ACQUISITION
16%
70%
2% 13%
Creditretail
Valueaddedservices2
Telcos & specialistlending Insurance
28%
1%18%
27%
22%4%
Creditretail
Banking
Specialistlending
Insurance & telcos
32%
4%20%
7%
32%4%
SACreditretail
SA Banking
SA Other
100%
SMEs2 21%
36%
14%
26%3%
CreditretailBanking
Specialistlending
Insurance
PAYMENT AND ACCOUNT MANAGEMENT COLLECTION SERVICES
SME FINANCING DEBT PURCHASING
Public sector
Other
SA Public sector
SA Telcos
Public sector
Australia2
31%
31%
20%
18% InsurancePublic sectorUtilities and telcosBankingAUSTRALIA²
R18BILLIONAcquisition of
non-performingloans as principal
R80bn¹FACE VALUE OF
UNSECURED CONSUMER
DEBT MONITORED BY NCR
R464MILLION
Gross loans & advancesTransaction CapitalBusiness Solutions
TCRS’ DIVERSIFIED BUSINESS MODEL31 MARCH 2017
Sectors split by revenue per segment as at 31 March 2017
1. R80bn comprises credit monitored by the NCR as at 31 December 2016. TCRS target market also includes sectors
not regulated by the NCR, being SMEs, education, insurance, public sector, telecommunications, SOEs & utilities
2. Earnings generated by businesses acquired only included from the effective date of the acquisition
Contingency &fee-for-service
collections

1515
TCRS FINANCIAL PERFORMANCE
• Core headline earnings ▲33% to R93m
› Excludes once-off acquisition costs of R22m
› Accretive cash deployment converting cash yield
into earnings
• Headline earnings organic growth ▲17%¹
• Services EBITDA² organic growth ▲20%¹
• Contingency & fee-for-service revenue
› Growing revenue from adjacent sectors
› Insurance, telecommunications & public sector
contributing 9%¹
• Cost-to-income ratio improved to 80.3% from 81.5%
› Total costs ▼7%¹
› Continued investment in data (MDU), technologies
(dialer & workforce management) & analytics
yielding efficiencies
› Frugal cost management
• Transaction Capital Business Solutions
› Gross loans & advances ▲10% to R464m
1. Excluding the effect of acquisitions
2. Services EBITDA (excluding Transaction Capital Business Solutions)
523
571
930
523
524
715
61 70 9384 97 143
82.4 81.5 80.3
50 51
44
2015Pro forma IFRS 9
2016IFRS 9
2017IFRS 9
Purchased book debts (Rm) Total income (Rm)
Headline earnings (Rm) Services EBITDA (Rm)
Cost-to-income (%) Principal/contingency collections revenue split

1616
0.12
0.52
1.25
1.21
1.57
2.38
2
1.58
1.03
0.6
2.50
2.52
2.83
2.24
2.17
2017
2016
2015
2014
2013
Collections to date (31 March 2017) 96-month ERC
times
TCRS FINANCIAL PERFORMANCEPURCHASED BOOK DEBTS PERFORMANCE
• Principal revenue ▲19% (HY16: 9%)
› Purchased book debts ▲63% to R930m
› 13 portfolios acquired for R210m (FY16: R184m)
› Current economic context stimulates acquisition of
non-performing loan portfolios
› 180 portfolios owned in total
• Focus on exclusive, forward flow & gain share
transactions
• Continued but cautious progress in municipal sector
• Asset-turnover ratio remains high at 57.1%
› Diluted by high value of portfolio acquisitions
• 2017 ERC cover of 2.50 times
› ERC ▲40% to R1.5bn
› Longevity in the yield of principal portfolios on book,
expected to support future positive performance
› ERC is the estimated undiscounted remaining
gross cash collections from purchased book debts
to be recovered over the next 96 months,
expressed as a multiple of the purchase price
Vin
tage
ESTIMATED REMAINING COLLECTIONS (ERC)
VINTAGE PERFORMANCE AS AT 31 MARCH 2017
Collection multiple of Rand value deployed
to acquire purchased book debt portfolios
Excludes contracts where TCRS does not have title of the underlying claim

17
TCRS OPERATIONAL PERFORMANCE QUICK FACTS
R300MILLION
COLLECTED EACH MONTH
RESULTING FROM
~250 000DISBURSEMENTS
FOR CLIENTS EACH MONTH
“Investor in people organisation”Accreditation in January 2017
Workforce management (WFM) technologies
improved to schedule the workforce
• Quick to scale
• Quick to train
RESULTING IN
~R2.2 BILLION
OF PAYMENTS PROCESSED
FOR CLIENTS EACH MONTH
~500 000DEBIT ORDERS & NAEDO
TRANSACTIONS PROCESSED
FOR CLIENTS EACH MONTH
MOKOPANE
BOTSWANAJOHANNESBURG
(>1 000 seats)
DURBAN
(>600 seats)
CAPE TOWN
(>250 seats)
▲32% (since HY16)
REVENUE PER EMPLOYEE
~550 000PAYMENTS RECEIVED
EACH MONTH
~4.35 MILLION
VOICE INTERACTIONS
EACH MONTH
~25 MILLION
OUTBOUND CALLS FROM THE DIALER
EACH MONTH


19
SA TAXI IS A VERTICALLY
INTEGRATED TAXI
PLATFORM UTILISING
SPECIALIST CAPABILITIES
AND ENRICHED
PROPRIETARY DATA TO
JUDICIOUSLY DEPLOY
DEVELOPMENTAL CREDIT
AND ALLIED BUSINESS
SERVICES TO EMPOWER
SMES THUS ENSURING
THE SUSTAINABILITY OF
A FUNDAMENTAL MODE
OF TRANSPORT
SA TAXI
An innovative & pioneering
business model with
operations expanding
throughout the financing &
asset value chain, building a
scalable platform that can be
leveraged in adjacent markets
1
2A unique blend of vehicle
procurement, retail,
repossession & refurbishment
capabilities, with financing
& comprehensive
insurance competencies for
focused vehicle types
3Valuable client & market
insights developed from
overlaying granular telematics,
credit, vehicle & other data to
enable precise & informed
origination & collection
decisioning & proactive risk
management
Enabling financial inclusion by
proficiently securing funding from both
local & international debt investors to
judiciously extend developmental credit
to SMEs that may otherwise not have
access to credit from traditional
financiers
Providing complementary business
services that assist SMEs to maximise
cash flow & protect their income-
generating asset, thus improving their
ability to succeed
Empowering under-served & emerging
SMEs to build their businesses, which
in turn creates further direct & indirect
employment opportunities
4
Contributing to the recapitalisation
& sustainability of the taxi industry
– a critical pillar of the public transport
sector servicing the majority of South
Africa’s working population
5
6
7

20
SA TAXI IMPACTDELIVERING A SOCIAL & COMMERCIAL BENEFIT
INCLUSIVE GROWTHSME EMPOWERMENT & ECONOMIC TRANSFORMATION
SUSTAINABLE JOB CREATION
604
603
602
600
20.5%
18.2%
17.4% 17.2%
2014 2015 2016 HY17
Median Empirica score NPL %
450 500 550 600 650 700 750
Empirica score
Pro
port
ion
of c
usto
mer
bas
e
Score below which
traditional banks
are unlikely to offer
finance
Average score at
which SA Taxi
grants finance
By providing end user finance SA Taxi
enables the replacement of aged & unsafe
minibus taxis with new safer & more reliable
minibus taxis
PUBLIC TRANSPORT
INFRASTRUCTURE
PROPORTION OF CUSTOMERS CLASSIFIED
AS PREVIOUSLY FINANCIALLY EXCLUDED 90%
DIRECT JOBS PER
TAXI VEHICLE 1.8DIRECT JOBS CREATED BY
SA TAXI’S FLEET SINCE 2008 110 419
BLACKOWNED SMEs 100%
R1.4 BILLIONLOANS ORIGINATED CREATING
3 764SMEs IN HY17
R17.1 BILLIONLOANS ORIGINATED CREATING
61 344SMEs SINCE 2008
SA Taxi enables replacement
of aged less efficient vehicles
with new & reduced emission
vehicles
ENVIRONMENTAL
SUSTAINABILITY
6 775~ 600 000INDIRECT JOBS ENABLED BY
THE MINIBUS TAXI INDUSTRY¹
SA Taxi facilitates asset ownership by black owned SMEs
DIRECT JOBS CREATED BY
SA TAXI’S FLEET IN HY17
WOMENOWNED SMEs 20% UNDER THE
AGE OF 35 YEARS 18%
1. Department of Transport Minister Dipuo Peters address at National Council of Provinces Budget vote NCOP 2014/15

21
ENVIRONMENT & MARKET CONTEXTMINIBUS TAXI INDUSTRY IS RESILIENT & DEFENSIVE DESPITE SA’S ECONOMIC CLIMATE
SOURCE: National Land Transport Strategic Framework 2015 | Passenger statistics from Arrive Alive & StatsSA
noting individuals can take more than one mode of transport | SABOA website | Stats SA Land Transport Survey February 2017
MINIBUS TAXI
OVER
COMMUTER TRIPS DAILY
15 MILLION
~200 000 MINIBUS TAXIS
>2 600 TAXI RANKS
68% OF PUBLIC TRANSPORT
TRIPS TO WORK
COMMERCIALLY SELF-SUSTAINABLE
BUS
COMMUTER TRIPS DAILY
9 MILLION
~19 000 REGISTERED BUSES
>100 BUS STATIONS
GOVERNMENT SUBSIDISED
TRAIN
COMMUTER TRIPS DAILY
2 MILLION
~3 180 KM NATIONAL NETWORK
~550 TRAIN STATIONS
GOVERNMENT SUBSIDISED
• Minibus taxi serves as a trunk service in
parallel with train & bus, & is also the feeder
into these modes
INTEGRATED PUBLIC TRANSPORT
NETWORK
• 40% of South Africans use public transport
• Minibus taxis are the dominant form
of public transport
• 69% of all households use minibus
taxis (▲from 59% since 2003)
• Minibus taxi transport is a
non-discretionary expense
PUBLIC TRANSPORT COMMUTERS ARE
HEAVILY RELIANT ON MINIBUS TAXIS
GIVEN THE ACCESSIBILITY & EFFICIENCY

22
ENVIRONMENT & MARKET CONTEXTSTRUCTURALLY DEMAND FOR MINIBUS TAXI VEHICLES EXCEEDS SUPPLY
DEMAND: AN AGEING NATIONAL FLEET
SUPPLY: MINIBUS TAXI SUPPLY IN SOUTH AFRICA
IN SOUTH AFRICA THERE ARE
~200 000 MINIBUS TAXIS
PRODUCTION PER MONTH ~1 000
TOYOTA SESFIKILE
SA TAXI’S SHARE OF TOYOTA SESFIKILE PRODUCTION >41%
• Improved credit performance as SA Taxi is selective on credit risk, due to
limited supply
• Improved recoveries as asset retains value due to demand exceeding supply
• Liquid market for high quality & affordable SA Taxi pre-owned vehicles
ON AVERAGE OVER 9 YEARS OLD AN AGEING FLEET THAT IS UNSAFE, REQUIRING
REPLACEMENT & RECAPITALISATION
DRIVING HIGHER DEMAND FOR VEHICLES,
FINANCE & ALLIED SERVICES SUPPLIED BY SA TAXI
(38% IN 2015)
70 000 - 80 000 FINANCED & INSURED
120 000 - 130 000 UNENCUMBERED & HENCE AGED
TOYOTA SESFIKILE
Most prevalent vehicle in the minibus taxi industry
TOYOTA PRE-OWNED
Predominantly SA Taxi refurbished vehicles
NISSAN NV350
Although relatively new, steadily gaining acceptance
MERCEDES SPRINTER
Mainly used for long-distance routes
SOURCE: National Land Transport Strategic Framework 2015 | Passenger statistics from Arrive Alive & StatsSA
noting individuals can take more than one mode of transport | SABOA website | Stats SA Land Transport Survey February 2017

23
ENVIRONMENT FOR MINIBUS TAXI OPERATORS
DESPITE A CHALLENGING & LOW GROWTH SOUTH AFRICAN ECONOMIC ENVIRONMENT,
ECONOMIC FACTORS AFFECTING MINIBUS TAXI OPERATORS REMAIN FAVOURABLE
ECONOMIC FACTORS
For the period 1 Jan 2014 to 31 Dec 2016 STRUCTURAL ELEMENTS
RESULTS
TOYOTA MINIBUS TAXI PRICE
CAGR▲8.7%
SA REPO RATE
▲200 bps
TAXI FARES
Stepped increases experienced
FUEL PRICE¹ (per litre)
1 Jan 2014
R13.22Average over the period
R12.32
CONTINUED HIGH LEVELS
OF UNEMPLOYMENT
>24%
PROFITABLE & RESILIENT SMEs
23%
repeat clients over the last 12 months
IMPROVING CREDIT METRICS
Credit loss ratioCAGR
(HY14 to HY17)
▼16%
Non-performing loan ratioCAGR
(HY14 to HY17)
▼17%
USAGE OF MINIBUS TAXIS
CONSISTENTLY HIGH
KM travelled by the SA Taxi fleet in 2016
~1.5 BILLION KM
Structurally
demand for minibus vehicles
exceeds supply
Ageing fleet
Dominant mode of public transport
Integrated component
of public transport network
Commercially self-sustainable
No reliance on government
for capital investment to build
or ongoing subsidisation
to maintain & operate
1. Includes petrol & diesel as per www.energy.gov.za
24
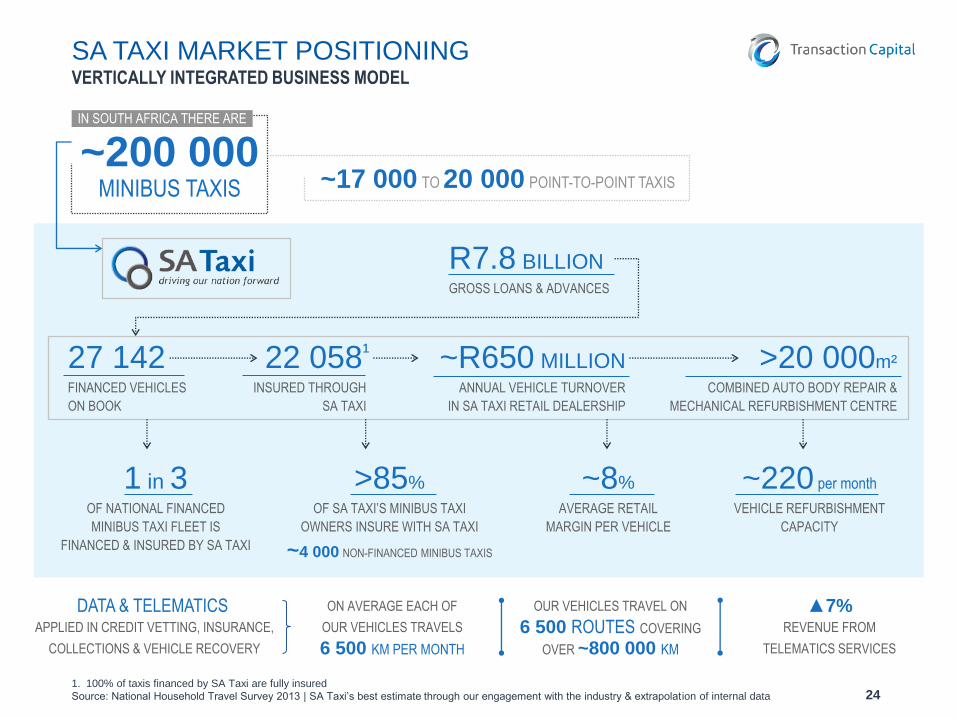
SA TAXI MARKET POSITIONINGVERTICALLY INTEGRATED BUSINESS MODEL
1. 100% of taxis financed by SA Taxi are fully insured
Source: National Household Travel Survey 2013 | SA Taxi’s best estimate through our engagement with the industry & extrapolation of internal data
IN SOUTH AFRICA THERE ARE
R7.8 BILLIONGROSS LOANS & ADVANCES
27 142FINANCED VEHICLES
ON BOOK
22 058¹
INSURED THROUGH
SA TAXI
~200 000MINIBUS TAXIS
ON AVERAGE EACH OF
OUR VEHICLES TRAVELS
6 500 KM PER MONTH
OUR VEHICLES TRAVEL ON
6 500 ROUTES COVERING
OVER ~800 000 KM
▲7%REVENUE FROM
TELEMATICS SERVICES
~17 000 TO 20 000 POINT-TO-POINT TAXIS
~R650 MILLIONANNUAL VEHICLE TURNOVER
IN SA TAXI RETAIL DEALERSHIP
DATA & TELEMATICS APPLIED IN CREDIT VETTING, INSURANCE,
COLLECTIONS & VEHICLE RECOVERY
>20 000m²
COMBINED AUTO BODY REPAIR &
MECHANICAL REFURBISHMENT CENTRE
>85%
OF SA TAXI’S MINIBUS TAXI
OWNERS INSURE WITH SA TAXI
~4 000 NON-FINANCED MINIBUS TAXIS
~8%
AVERAGE RETAIL
MARGIN PER VEHICLE
1 in 3OF NATIONAL FINANCED
MINIBUS TAXI FLEET IS
FINANCED & INSURED BY SA TAXI
~220 per month
VEHICLE REFURBISHMENT
CAPACITY
25
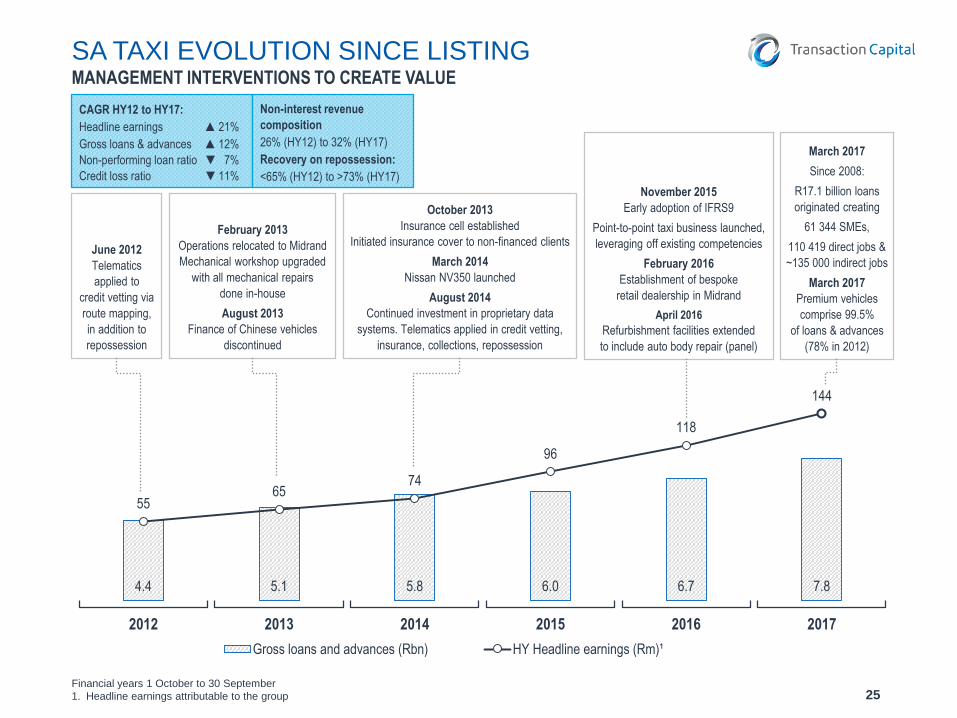
SA TAXI EVOLUTION SINCE LISTINGMANAGEMENT INTERVENTIONS TO CREATE VALUE
4.4 5.1 5.8 6.0 6.7 7.8
5565
74
96
118
144
2012 2013 2014 2015 2016 2017
Gross loans and advances (Rbn) HY Headline earnings (Rm)¹
June 2012
Telematics
applied to
credit vetting via
route mapping,
in addition to
repossession
February 2013
Operations relocated to Midrand
Mechanical workshop upgraded
with all mechanical repairs
done in-house
August 2013
Finance of Chinese vehicles
discontinued
October 2013
Insurance cell established
Initiated insurance cover to non-financed clients
March 2014
Nissan NV350 launched
August 2014
Continued investment in proprietary data
systems. Telematics applied in credit vetting,
insurance, collections, repossession
November 2015
Early adoption of IFRS9
Point-to-point taxi business launched,
leveraging off existing competencies
February 2016
Establishment of bespoke
retail dealership in Midrand
April 2016
Refurbishment facilities extended
to include auto body repair (panel)
March 2017
Since 2008:
R17.1 billion loans
originated creating
61 344 SMEs,
110 419 direct jobs &
~135 000 indirect jobs
March 2017
Premium vehicles
comprise 99.5%
of loans & advances
(78% in 2012)
CAGR HY12 to HY17:
Headline earnings ▲21%
Gross loans & advances ▲12%
Non-performing loan ratio ▼ 7%
Credit loss ratio ▼ 11%
Non-interest revenue
composition
26% (HY12) to 32% (HY17)
Recovery on repossession:
<65% (HY12) to >73% (HY17)
Financial years 1 October to 30 September
1. Headline earnings attributable to the group

2626
SA TAXI FINANCIAL PERFORMANCE
• Headline earnings¹ ▲22% to R144m
› All organic growth
• NIM stable at 11.0%
› Funding costs ▲ by 90bps to 11.3%
› ▲ foreign debt component, fully hedged to Rand
› Average interest rate is 24.9% on origination
(NCA max cap of 34%)
› Anticipated ▲ interest rate cycle not expected to
impact net interest margin
• Credit loss ratio improved from 3.4% to 3.3%
› Risk-adjusted NIM ▲from 7.6% to 7.7%
• Non-interest revenue ▲30% to R195m
› Loans originated via SA Taxi’s dealership at
margins of ~8%
› Comprehensive insurance
o >85% of financed clients also insured by SA Taxi
o Non-financed minibus taxis insured ▲23%
› Revenue from telematics services ▲7%
• Cost-to-income ratio ▲ from 48.4% to 50.1%
› Investment in retail dealership, auto body repair
centre, point-to-point taxi business
• Effective tax rate stabilised at 17.9%
742
855
1 03
6
96 118
144
11.111.0
11.0
47.7 48.450.1
10.310.4
11.3
4.1 3.43.3
2015Pro forma IFRS 9
2016IFRS 9
2017IFRS 9
Total income (Rm) Headline earnings¹ (Rm)
Net interest margin (%) Cost to income (%)
Average cost of borrowing (%) Credit loss ratio (%)
1. Headline earnings attributable to the group

2727
SA TAXI CREDIT PERFORMANCE
• Gross loans & advances ▲16% to R7.8bn
› Number of loans originated ▲11%
o Number of Toyota loans on book ▲11.3%
o Toyota vehicle prices ▲12.5% since 1 March 2016
› Number of loans on book ▲6%
o Active wind-down of Chinese vehicle portfolio
› Credit granting criteria remain conservative
• NPL ratio improved to 17.2% from 18.0%
› Continued strong collection performance
› Average balance per NPL ▼6%
› Superior credit quality via retail dealership
› Enhanced via analytics applied to telematics data
• Credit-loss ratio improved from 3.4% to 3.3%
› Recover > 73% of settlement value
› Improved quality & efficiencies in refurbishment centre
› Average repair cost ▼4% (~R82 000 from ~R85 000)
› Target credit-loss ratio remains 3% to 4%
• Provision coverage at 5.8%
› After tax credit-loss conservatively covered
at 2.4 times
› IFRS 9 early adopted in 2015; more conservative
provisioning methodology
24 9
31
25 5
91
27 1
42
5 96
7
6 68
8
7 75
7
9.37.8
5.8
4.1 3.43.3
19.3 18.017.2
2015Pro forma IFRS 9
2016IFRS 9
2017IFRS 9
Number of loans Gross loans & advances (Rm)
Provision coverage (%) Credit loss ratio (%)
Non-performing loan ratio (%)

28
Stage 1 Stage 2 Stage 3 Repo
IMPAIRMENT STAGEIAS 39 Provisions IFRS 9 Provisions
SA TAXI CREDIT PERFORMANCE IFRS 9 ADOPTION IN 2015: MORE CONSERVATIVE PROVISIONING METHODOLOGY
PR
OV
ISIO
NS
Construct of the book remains stable since year end
Mar 2017 Sep 2016
Stage 1 70% 70%
Stage 2 20% 20%
Stage 3 10% 10%
Improved quality of SA Taxi’s loans & advances since listing
2012 2017 CAGR %
Gross loans & advances (Rbn) 4.4 7.8 ▲ 12%
Non-performing loan ratio (%) 24.3 17.2 ▼ 7%
Credit loss ratio (%) 5.8 3.3 ▼ 11%
ULTIMATE LOSS
REMAINS UNCHANGED

29
33%
22%9%
11%
8%
6%
6%3%2%
SA TAXI
CUSTOMER
DISTRIBUTION
SA TAXI OPERATIONAL PERFORMANCE
Gauteng
KwaZulu-Natal
Mpumalanga
Western Cape
Eastern Cape
North West
Limpopo
Free State
Northern Cape
GEOGRAPHIC DISTRIBUTIONSA TAXI OPERATOR PROFILE
CUSTOMER PROFILE
100%
BLACK OWNED
SMEs
20%
WOMEN OWNED
SMEs
18%
UNDER THE AGE
OF 35 YEARS
47 YEARS
AVERAGE AGE
OF OWNER
CREDIT PROFILE OF LOANS ON BOOK
67 MONTHS
AVERAGE LOAN TERM
>R6 000MINIMUM MONTHLY OPERATOR PROFIT
24.9%
WEIGHTED AVERAGE
INTEREST RATE AT ORIGINATION
45 MONTHS
WEIGHTED AVERAGE
REMAINING TERM
16.5%
AVERAGE DEPOSIT¹
61%
AVERAGE
APPROVAL RATE
600AVERAGE
EMPIRICA SCORE
VEHICLES ON BOOK
1.2VEHICLES
PER CUSTOMER
86%
TOYOTA
VEHICLES
3.7 YEARS
AVERAGE AGE
OF VEHICLE
>85%
INSURED
WITH SA TAXI
23%
LOANS ORIGINATED TO REPEAT
CUSTOMERS (HY16 TO HY17)
Percentages calculated based on rand value
1. Average deposit on new vehicles


31
418
0
426
3
420
9
511
8
552
3
695
9
112
8
951
134
7 112
5
116
8
936
2012 2013 2014 2015 2016 2017
Senior debt Subordinated debt
134
4
194
8
286
4
245
7
273
9
359
0
5 308 5 2145 556
6 2436 691
7 895
1215
16
23
29
41
Total equity (Rm)¹ Number of debt funders
CAPITAL & FUNDING EVOLUTION SINCE LISTING
Financial years 1 October to 30 September | 2012 & 2013 excludes Bayport & Paycorp
1. Adopted IFRS 9 in 2015. 2012 to 2014 numbers on an IAS 39 basis as reported
February 2012
>R1bn raised from
European DFIs
since 2010
June 2014
Transsec:
R4bn S&P rated
& listed
securitisation
established
Initial issuance
R665m
March 2015
Over 20 funders
April 2015
Transsec tap issuance:
Privately placed R528m
November 2015
Transsec 2:
R4bn S&P rated &
listed securitisation
established
Initial issuance R396m
November 2015
Early adoption
of IFRS 9
August 2016
Transsec 2 tap issuance:
R451m raised
November 2016
Dividend policy amended to 2.5 to 3 times (compared to 4 to 5 times at listing in 2012)
November 2016
Established a R2bn domestic note programme at TC group level
January 2017
First local DFI: R100m financing agreement concluded with sefa
February 2017
Issued 28.4 million shares raising R419m
providing capacity & flexibility for further acquisitions
Secured >R2bn of debt facilities from US-based impact investors for the first time
Funding base includes all the major South African banks
March 2017
Accessed >R2bn of debt funding from European DFIs since 2010

3232
10.012.0
15.0
41.342.8
35.2
3.73.6
3.53.1
3.12.9
2015Pro forma IFRS 9
2016IFRS 9
2017IFRS 9
Interim dividend per share (cps) Capital adequacy ratio (%)
Gearing ratio (times) Interim dividend cover (times)
CAPITAL MANAGEMENT
• Uninterrupted access to the debt capital markets
› Despite political instability & SA’s sovereign rating
downgrade in April 2017
› Anticipated increasing interest rate cycle not expected
to impact net interest margin
› 2018 fully funded
• Continue to diversify funding sources
› Diverse debt investor base (>40)
› Secured >R2bn of debt facilities from US DFIs
› R2bn A-(ZA) rated JSE-listed domestic note programme
› Accessed >R2bn of debt funding from European DFIs
since 2010
› 17% of debt in issue from DFIs (HY16: 12%)
• Group cost of borrowing ▲ from 11.0% to 12.0%
› Margin above repo improved to 5.0%
› ▲ foreign debt component, fully hedged to Rand
• Capital adequacy position remains robust at 35.2%
› 26.6% equity
› 8.6% subordinated debt
• Net ungeared & liquid group balance sheet
• Liquid cash of ~R600m on balance sheet
5.0%
5.7% 7.0%
5.8%
5.1% 5.
0%
10.8% 10.8%12.0%
1H13 1H15 1H17
SA Reserve Bank's repo rate¹ Cost of borrowing margin above repo rate¹
COST OF BORROWING SINCE LISTING
PERFORMANCE
1. Calculated using Transaction Capital’s average cost of borrowing for the period & the South African Reserve Bank’s average repo rate for the period

33
FUNDING PHILOSOPHY
DIVERSIFIED & ENGAGED DEBT INVESTORS
• Diversification by geography, capital pool, debt investor
& funding structure
• Recurring investment motivated by performance, the ease
of transacting & appropriate risk adjusted returns
• Transparent & direct relationships with debt investors,
& where necessary facilitated by valued intermediaries
JUDICIOUS RISK MITIGATION
• Positive liquidity management between asset & liability
cash flows
• No exposure to overnight debt instruments & limited
exposure to short term instruments
• No exposure to currency risk & effective management
of interest rate risk
• Minimising rollover risk
OPTIMAL CAPITAL STRUCTURES
• Bespoke & innovative funding structures to meet
investment requirements & risk appetite of a range of debt
investors
• Targeted capital structure per asset class
• No cross-default or guarantees between structures
34%48%
18%
Structured financeOn-balance sheetRated listed securitisation
22%
28%18%
14%
17% 1%
Life companiesSpecialised asset managers & debt fundsBanksTraditional asset managersDFIsHedge funds
INNOVATION
Innovation is encouraged to cultivate unorthodox thinking
& develop pioneering funding solutions
0-6 months 6-12 months 1-2 years 2-3 years 3-4 years 4-5 years 5+ years
Assets Liabilities Cumulative
POSITIVE LIQUIDITY MISMATCH
DIVERSIFICATION BY DIVERSIFICATION BY
FUNDING STRUCTURE DEBT INVESTOR CATEGORY

3434
SHAREHOLDING
• Accelerated bookbuild (Feb 2017)
› 28.4m shares issued raising R419m
› Creates capacity for further acquisition opportunities
› Oversubscribed
› Predominantly taken up by institutional investors
o Institutional shareholding ▲from 26% to 31%
› Directors shareholding holding ▼from 47% to 44%
o Management not permitted to participate in the
bookbuild
• Foreign ownership ▲from 2% to 5%
• Retail investors ▼from 7% to 5%
• Average daily liquidity in ZAR ▲20%
› Free float percentage ▲to 56% (HY16: 53%)
44%
10%
10%
31%5%
Directors of Transaction Capital & its subsidiaries
Old Mutual Investment Group
Allan Gray Proprietary Limited
Remaining institutional shareholders
Retail investors
31 March 2017

35

36
INVESTMENT CASECOMPELLING & UNIQUE AS WE EXECUTE ON OUR MISSION
TRANSACTION CAPITAL
IS POSITIONED
IN ATTRACTIVE
MARKET SEGMENTS
WITH SPECIALISED
CAPABILITIES THAT ENABLE
A DEEP UNDERSTANDING OF
ITS CHOSEN MARKETS
› Businesses occupy strong market positions
› Highly defensive businesses able to withstand difficult
economic conditions
› Deep vertical integration enabling application of
specialised expertise to mitigate risk, participate in margin
& provide a fuller service to clients
› Organic growth driven through innovating solutions deeper
into existing market segments & leveraging capabilities
to enter adjacent markets (local & international)
› Superior data & leading-edge technology & analytics
capabilities differentiate our offerings, inform business
decisions & mitigate risk
AND A BESPOKE & ROBUST
CAPITAL STRUCTURE
GENERATING
APPROPRIATE RISK-
ADJUSTED RETURNS
› Sufficient equity capital geared conservatively to fund
organic growth & acquisition activity
› Proven ability to raise debt capital efficiently from diversified
range of debt investors
IS LED BY SKILLED
AND EXPERIENCED
MANAGEMENT
TEAMS
› Decentralised experienced &
specialised leadership
› Specialised intellectual capital applied
over a much smaller asset base than in
larger organisations
AND UNDERPINNED
BY A ROBUST
GOVERNANCE
FRAMEWORK &
SOUND GOVERNANCE
PRACTICES
› Experienced, diverse & independent
directors at group & subsidiary level
› Institutionalised governance, regulatory
& risk management practices
WHICH TOGETHER
POSITION IT FOR
SUSTAINABLE
GROWTH
› Decentralised businesses that are self-
sustaining & sizable in their own right
› Track record of delivering predictable
high-quality earnings with high cash
conversion rates & strong organic
growth prospects
› A focused acquisition strategy
supported by a strong balance sheet
AND THE DELIVERY
OF A MEANINGFUL
SOCIAL IMPACT
› Businesses intentionally positioned to
take advantage of demographic &
socio-economic trends, delivering both
social & commercial benefit
VIA A
DIVERSIFIED
BUSINESS MODEL
› Unique blend of highly cash generative & capital related
businesses
› Diversified revenue model across adjacent market
segments & geographies
› Enabling defensive positioning

37
DISCLAIMER
This presentation may contain certain "forward-looking statements" regarding beliefs or expectations of the TC Group,
its directors and other members of its senior management about the TC Group's financial condition, results of operations,
cash flow, strategy and business and the transactions described in this presentation. Forward-looking statements include
statements concerning plans, objectives, goals, strategies, future events or performance, and underlying assumptions and
other statements, which are other than statements of historical facts. The words "believe", "expect", "anticipate", "intend",
"estimate", "forecast", "project", "will", "may", "should" and similar expressions identify forward-looking statements but are not
the exclusive means of identifying such statements. Such forward-looking statements are not guarantees of future
performance. Rather, they are based on current views and assumptions and involve known and unknown risks, uncertainties
and other factors, many of which are outside the control of the TC Group and are difficult to predict, that may cause the actual
results, performance, achievements or developments of the TC Group or the industries in which it operates to differ materially
from any future results, performance, achievements or developments expressed by or implied from the forward-looking
statements. Each member of the TC Group expressly disclaims any obligation or undertaking to provide or disseminate any
updates or revisions to any forward-looking statements contained in this announcement.