Embed Size (px)
Citation preview
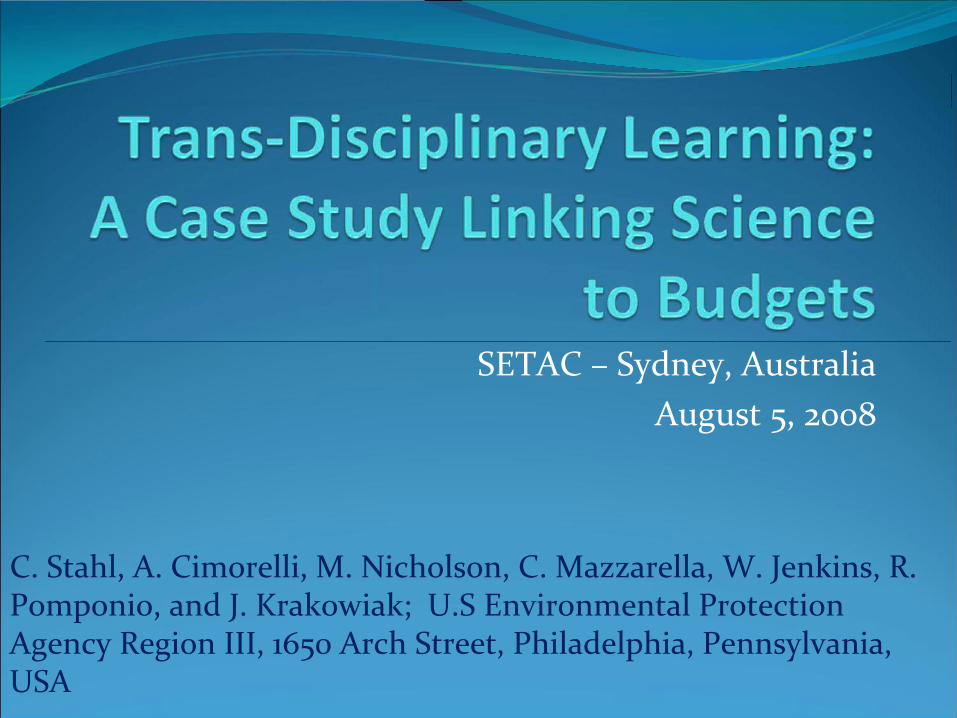
SETAC – Sydney, AustraliaAugust 5, 2008
C. Stahl, A. Cimorelli, M. Nicholson, C. Mazzarella, W. Jenkins, R. Pomponio, and J. Krakowiak; U.S Environmental Protection Agency Region III, 1650 Arch Street, Philadelphia, Pennsylvania,USA
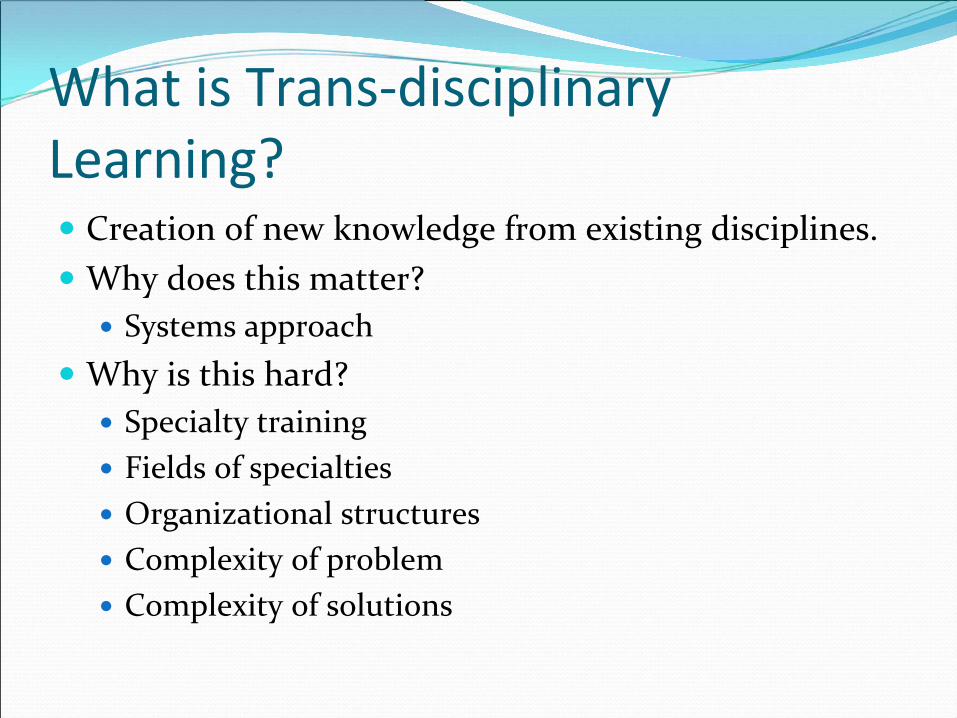
What is Trans‐disciplinary Learning?
Creation of new knowledge from existing disciplines.Why does this matter?
Systems approachWhy is this hard?
Specialty trainingFields of specialtiesOrganizational structuresComplexity of problemComplexity of solutions
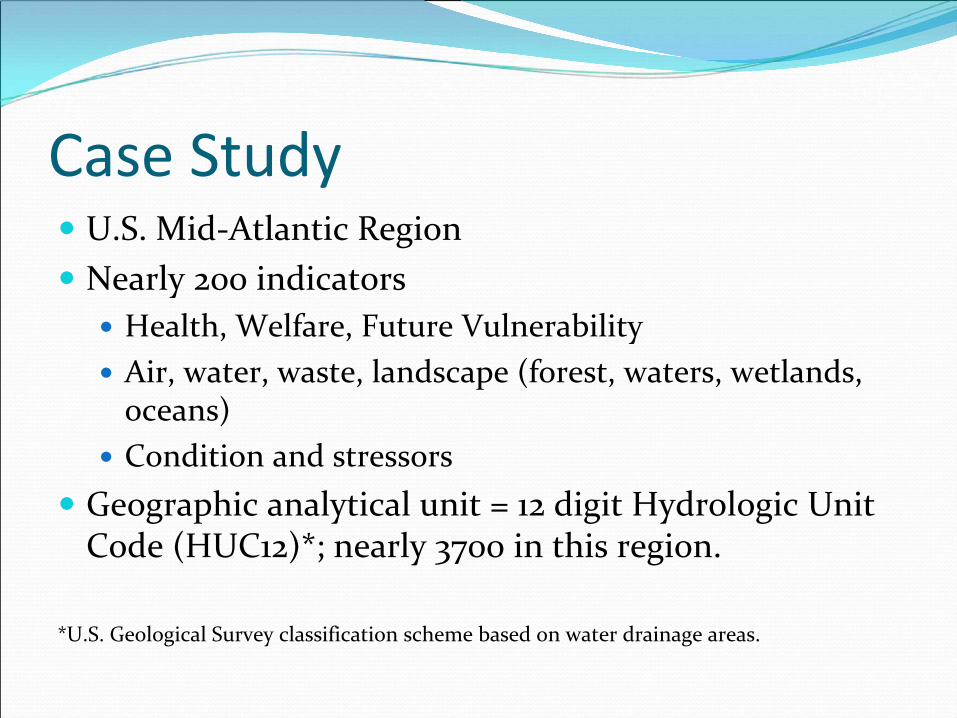
Case StudyU.S. Mid‐Atlantic RegionNearly 200 indicators
Health, Welfare, Future VulnerabilityAir, water, waste, landscape (forest, waters, wetlands, oceans)Condition and stressors
Geographic analytical unit = 12 digit Hydrologic Unit Code (HUC12)*; nearly 3700 in this region.
*U.S. Geological Survey classification scheme based on water drainage areas.
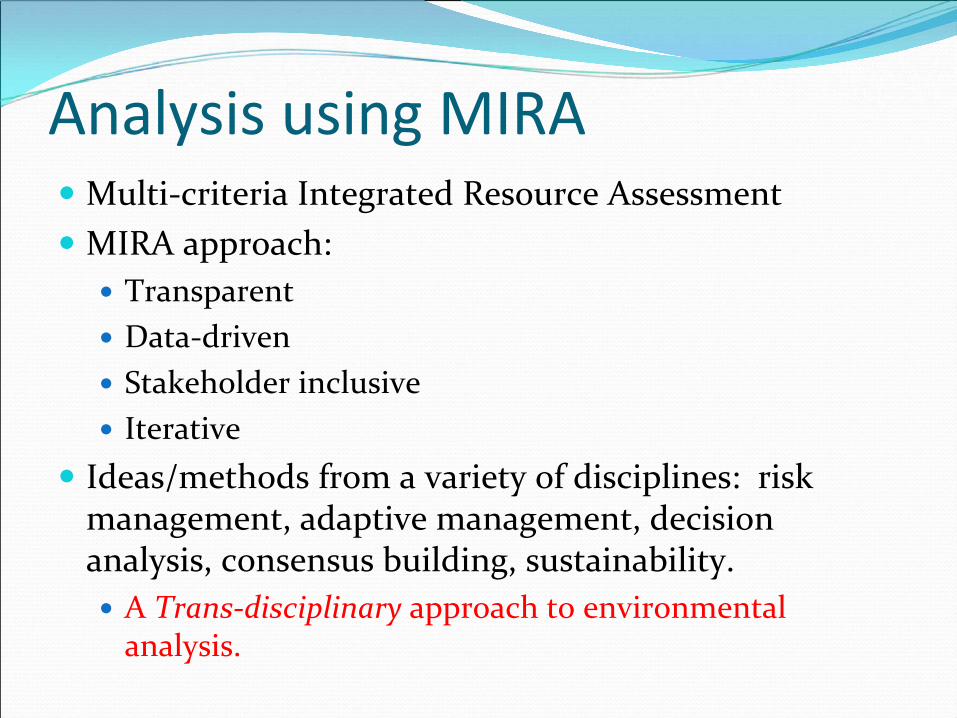
Analysis using MIRAMulti‐criteria Integrated Resource AssessmentMIRA approach:
TransparentData‐drivenStakeholder inclusiveIterative
Ideas/methods from a variety of disciplines: risk management, adaptive management, decision analysis, consensus building, sustainability.
A Trans‐disciplinary approach to environmental analysis.
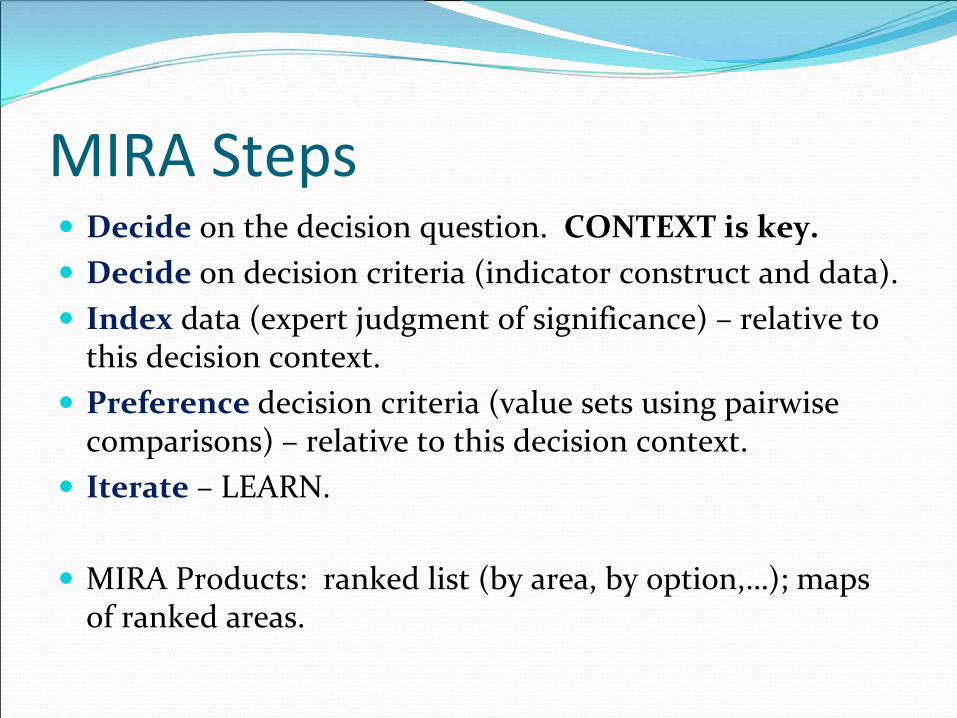
MIRA StepsDecide on the decision question. CONTEXT is key.Decide on decision criteria (indicator construct and data).Index data (expert judgment of significance) – relative to this decision context.Preference decision criteria (value sets using pairwisecomparisons) – relative to this decision context.Iterate – LEARN.
MIRA Products: ranked list (by area, by option,…); maps of ranked areas.
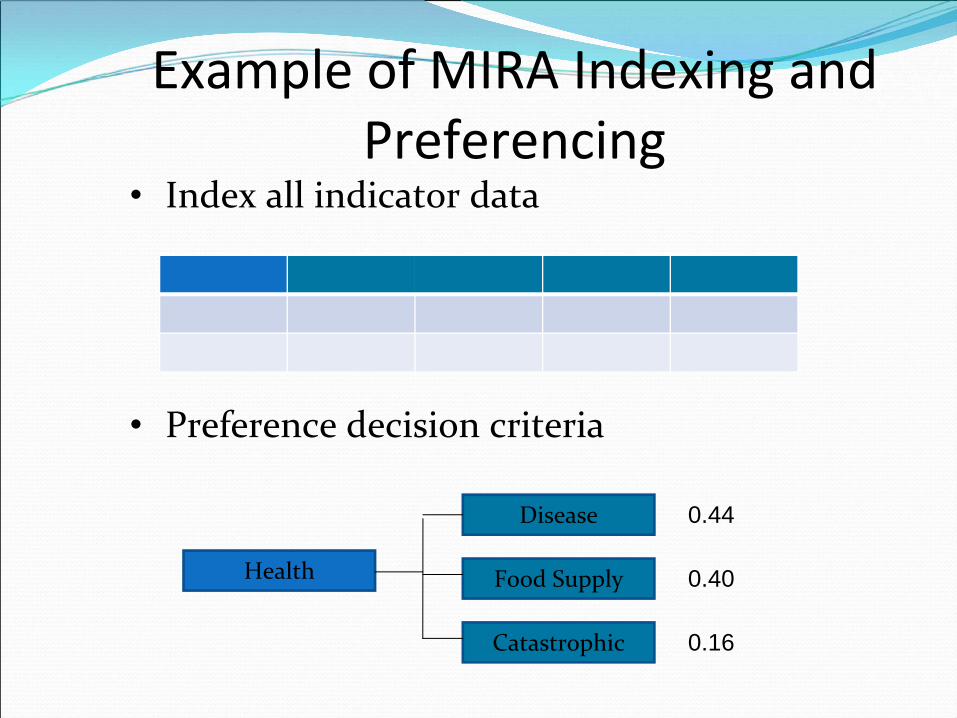
Example of MIRA Indexing and Preferencing
• Index all indicator data
Criteria Good (1) Bad Worst (8)
Waste 12 30 50 80
Forest 10000 8000 2000 100
• Preference decision criteria
Health
Catastrophic
Food Supply
Disease 0.44
0.40
0.16
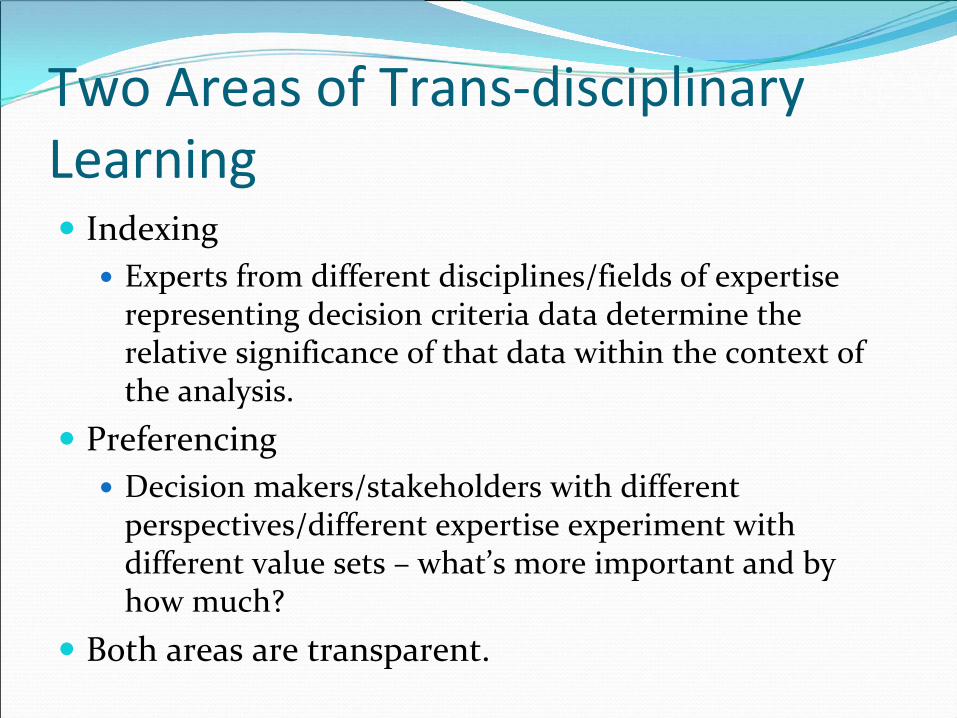
Two Areas of Trans‐disciplinary Learning
IndexingExperts from different disciplines/fields of expertise representing decision criteria data determine the relative significance of that data within the context of the analysis.
PreferencingDecision makers/stakeholders with different perspectives/different expertise experiment with different value sets – what’s more important and by how much?
Both areas are transparent.
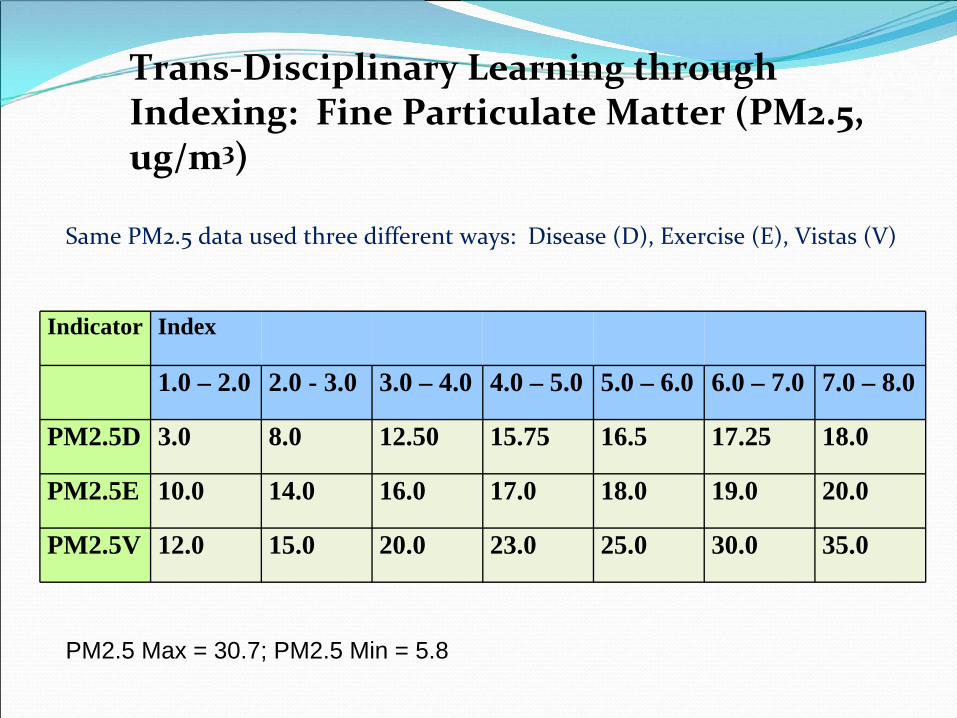
Trans‐Disciplinary Learning through Indexing: Fine Particulate Matter (PM2.5, ug/m3)
Same PM2.5 data used three different ways: Disease (D), Exercise (E), Vistas (V)
PM2.5 Max = 30.7; PM2.5 Min = 5.8
Indicator Index
1.0 – 2.0 2.0 - 3.0 3.0 – 4.0 4.0 – 5.0 5.0 – 6.0 6.0 – 7.0 7.0 – 8.0
PM2.5D 3.0 8.0 12.50 15.75 16.5 17.25 18.0
PM2.5E 10.0 14.0 16.0 17.0 18.0 19.0 20.0
PM2.5V 12.0 15.0 20.0 23.0 25.0 30.0 35.0
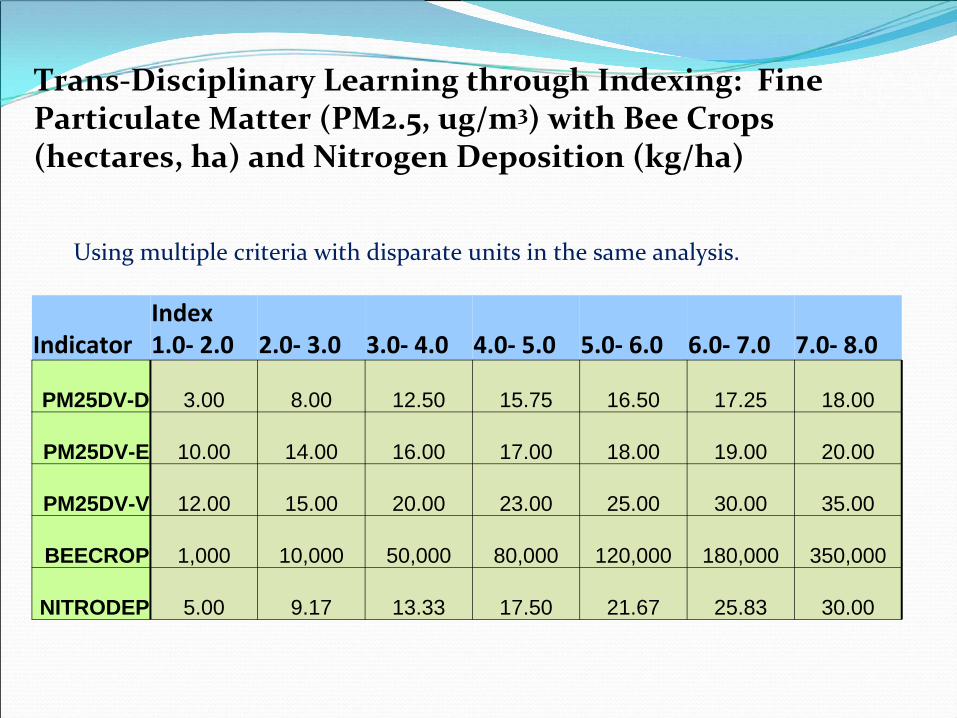
Trans‐Disciplinary Learning through Indexing: Fine Particulate Matter (PM2.5, ug/m3) with Bee Crops (hectares, ha) and Nitrogen Deposition (kg/ha)
Using multiple criteria with disparate units in the same analysis.
IndexIndicator 1.0‐ 2.0 2.0‐ 3.0 3.0‐ 4.0 4.0‐ 5.0 5.0‐ 6.0 6.0‐ 7.0 7.0‐ 8.0
PM25DV-D 3.00 8.00 12.50 15.75 16.50 17.25 18.00
PM25DV-E 10.00 14.00 16.00 17.00 18.00 19.00 20.00
PM25DV-V 12.00 15.00 20.00 23.00 25.00 30.00 35.00
BEECROP 1,000 10,000 50,000 80,000 120,000 180,000 350,000
NITRODEP 5.00 9.17 13.33 17.50 21.67 25.83 30.00
Trans‐Disciplinary Learning through Preferencing
Test the impact of different value sets on ranked watersheds.Learn what indicators/science drives which watersheds to rank high/low.Learn through the collective use of all indicators.
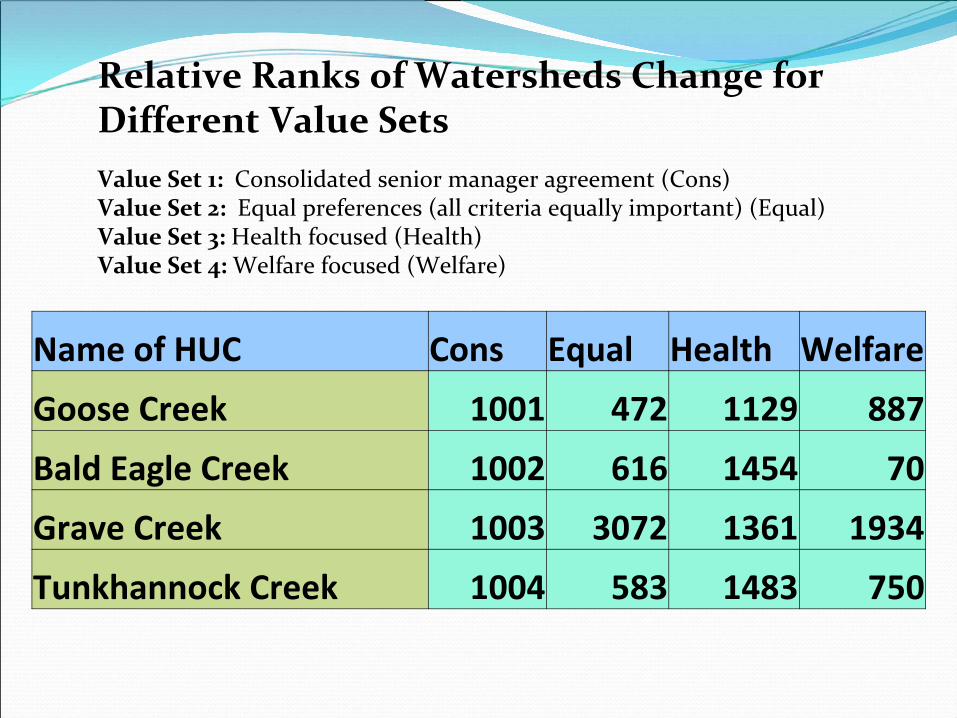
Relative Ranks of Watersheds Change for Different Value SetsValue Set 1: Consolidated senior manager agreement (Cons)Value Set 2: Equal preferences (all criteria equally important) (Equal)Value Set 3: Health focused (Health)Value Set 4: Welfare focused (Welfare)
Name of HUC Cons Equal Health Welfare
Goose Creek 1001 472 1129 887
Bald Eagle Creek 1002 616 1454 70
Grave Creek 1003 3072 1361 1934
Tunkhannock Creek 1004 583 1483 750
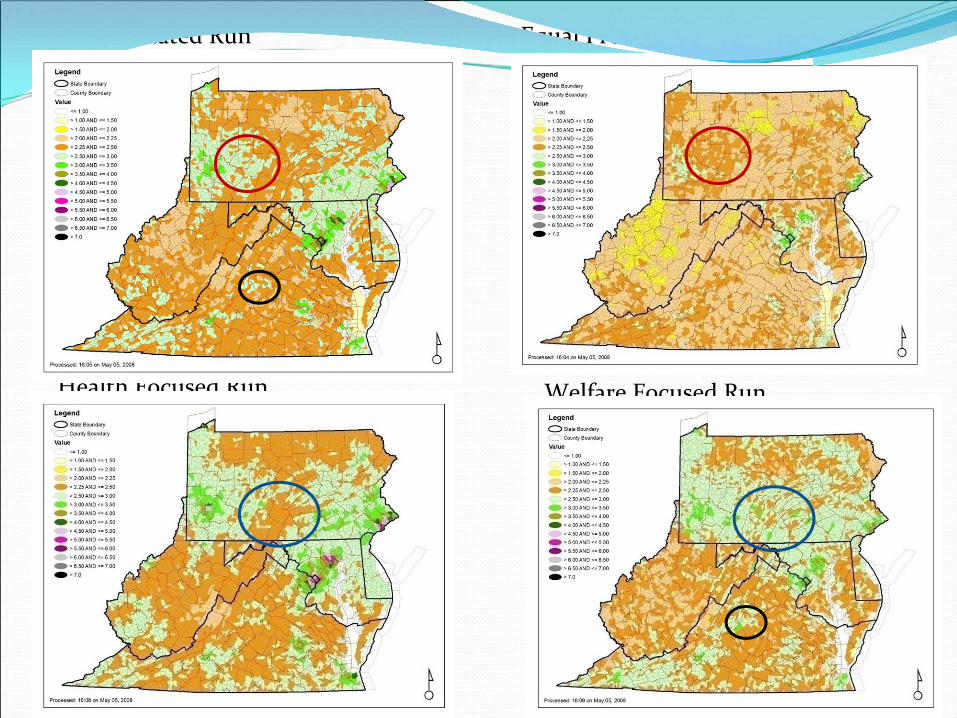
Consolidated Run Equal Pref Run
Health Focused Run Welfare Focused Run
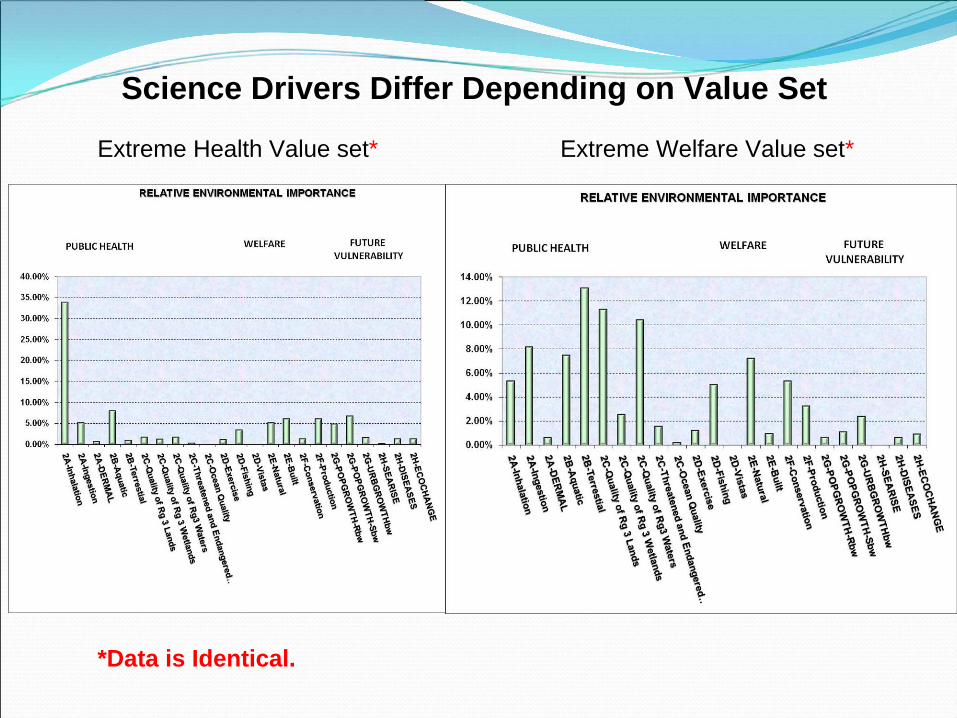
Science Drivers Differ Depending on Value Set
Extreme Health Value set* Extreme Welfare Value set*
*Data is Identical.
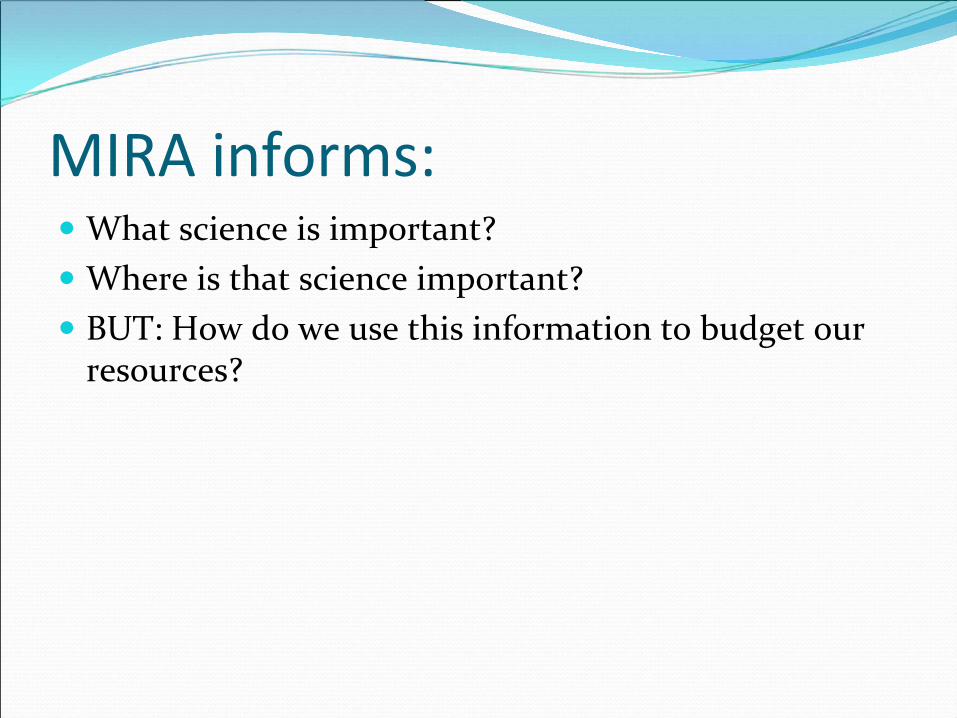
MIRA informs:What science is important?Where is that science important?BUT: How do we use this information to budget our resources?
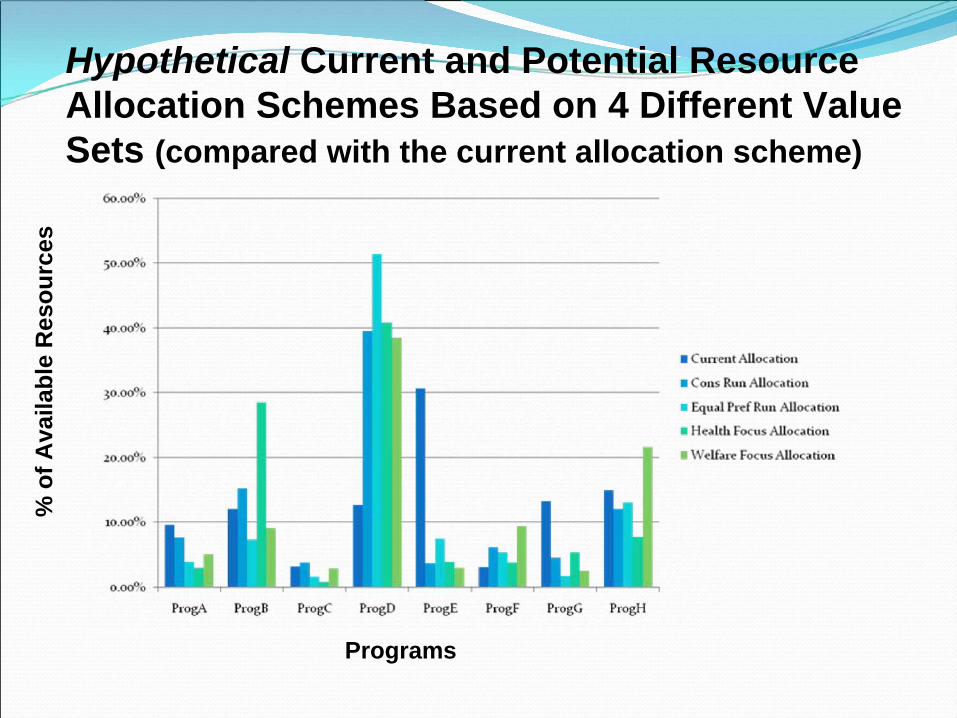
Hypothetical Current and Potential Resource Allocation Schemes Based on 4 Different Value Sets (compared with the current allocation scheme)
Programs
% o
f Ava
ilabl
e R
esou
rces
Linking Science to BudgetsUse data and values to inform resource allocation.Compare/Evaluate current allocation with other allocation possibilities.
Lessons LearnedTrans‐disciplinary learning isn’t just a concept.Using science to inform budget allocations is possible.The MIRA process facilitates communication and learning within the organization.We can use the MIRA process to identify gaps: data, knowledge, communication,…We can do better – and we will!
Contact InformationCynthia Stahl, U.S. EPA Region III, 215‐814‐2180, [email protected]