Embed Size (px)
Citation preview

Training Data for Machine Learning (ML) to Enhance Patient-Centered Outcomes Research (PCOR) Data Infrastructure FINAL REPORT Prepared by Booz Allen Hamilton for the Office of the National Coordinator for Health Information Technology under Contract No. HHSP233201500132I/ 75P00119F37012
September 2021

Training Data for Machine Learning (ML) to Enhance Patient-Centered Outcomes Research (PCOR) Data Infrastructure
ONC
2
Acknowledgements The authors of this document are:
• Matt Rahn, Deputy Director, Standards Division, Office of the National Coordinator for Health IT (ONC)
• Jiuyi Hua, Ph.D., Technical Subject Matter Expert, Certification and Testing Division, ONC
• Adam Wong, Senior Innovation Analyst, Technical Strategy & Analysis Division, ONC • Alda Yuan, Public Health Analyst, Office of Policy, ONC • Kenneth Wilkins, Ph.D., Mathematical Statistician, Biostatistics Program and Office of
Clinical Research Support, National Institute of Diabetes and Digestive and Kidney Diseases
• Kim Genberg, Vice President, Booz Allen Hamilton • Matt Keating, Principal/Director, Booz Allen Hamilton • Susan Tenney, Ph.D., Senior Lead Scientist, Booz Allen Hamilton • Summer Rankin, Ph.D., Senior Data Scientist, Booz Allen Hamilton • Lucy Han, Lead Data Scientist, Booz Allen Hamilton • Mike Shlipak, M.D., Co-Founder and Scientific Director, Kidney Health Research
Collaborative (KHRC), University of California San Francisco • Michelle Estrella, M.D., Executive Director, KHRC, University of California San
Francisco • Rebecca Scherzer, Ph.D., Director of Biostatistics, KHRC, University of California
San Francisco
The authors would like to recognize the important contributions made by the members of the Technical Expert Panel who shared their expertise and provided guidance in the development of this project:
• Peter Chang, M.D., Co-Director, Center for AI in Diagnostic Medicine, UC Irvine School of Medicine
• Mark DePristo, Ph.D., Founder & Chief Executive Officer, BigHat Biosciences • Kevin Fowler, President, The Voice of the Patient • James Hickman, Product Lead, Epic Systems • Eileen Koski, Director for Health and Data Insights, International Business Machines
Corporation (IBM) • Jarcy Zee, Ph.D., Assistant Professor of Biostatistics, University of Pennsylvania

Training Data for Machine Learning (ML) to Enhance Patient-Centered Outcomes Research (PCOR) Data Infrastructure
ONC
3
Table of Contents Acknowledgements ....................................................................................................................... 2
Executive Summary ...................................................................................................................... 6 Introduction and Background ................................................................................................... 6
Development of High-Quality Training Datasets And ML Models ............................................ 6
Recommendations for Supporting the Future Application of ML to Health, Health care, and PCOR ....................................................................................................................... 7
Conclusion ............................................................................................................................... 7
Introduction ................................................................................................................................... 8 Project Goal ............................................................................................................................. 9
Background ................................................................................................................................. 10
Overall Approach for Building the Training Dataset and ML Models .......................................... 12
Kidney Disease Use Case for the Project ................................................................................... 13
Building a High-Quality Training Dataset .................................................................................... 15 Source Data ........................................................................................................................... 15
High-Quality Training Dataset—Methodology and Results .................................................... 16
Criteria for a High-Quality Training Dataset ...................................................................................... 16
Data De-identification ....................................................................................................................... 17
USRDS Datasets and Programming Languages Utilized ................................................................ 17
Building the Cohort and Outcome Variable ...................................................................................... 18
Handling Outliers .............................................................................................................................. 25
Partitioning the Data for Training, Validation, and Test Datasets .................................................... 26
Missing Data Imputation ................................................................................................................... 27
Building ML Models ..................................................................................................................... 29 Algorithms Selected for the Project ........................................................................................ 29
ML Model Data Pre-Processing ............................................................................................. 29
ML Modeling Methodology and Results ................................................................................. 30

Training Data for Machine Learning (ML) to Enhance Patient-Centered Outcomes Research (PCOR) Data Infrastructure
ONC
4
Overview of ML Modeling Methodology ........................................................................................... 30
eXtreme Gradient Boosting (XGBoost) Model ................................................................................. 31
Logistic Regression Model ............................................................................................................... 36
Multilayer Perceptron (MLP) Model .................................................................................................. 38
Risk Categorization ................................................................................................................ 40
Fairness Assessment ............................................................................................................. 41
Considerations for Applying ML to PCOR and Health Care Use Cases ..................................... 43 Use Case and Data Source Selection ................................................................................... 43
Building the Training Dataset ................................................................................................. 44
Access to data sources ..................................................................................................................... 44
USRDS data de-identification ........................................................................................................... 45
USRDS data limitations and gaps .................................................................................................... 45
USRDS data format .......................................................................................................................... 47
Feature selection .............................................................................................................................. 48
Mapping diagnosis codes to diagnosis groupings ............................................................................ 48
Cleaning text data ............................................................................................................................. 48
Handling outliers and imputing missing data .................................................................................... 48
Reproducibility .................................................................................................................................. 49
Kidney transplant patients ................................................................................................................ 49
Train/test split ................................................................................................................................... 50
Building ML models ................................................................................................................ 50
Algorithm selection for the Project .................................................................................................... 50
Limitations of the ML models developed in this Project ................................................................... 50
Environment and speed .................................................................................................................... 50
Class imbalance for the outcome variable ........................................................................................ 50
Preprocessing data ........................................................................................................................... 51
Standardization and scaling ............................................................................................................. 51
Hyperparameter tuning ..................................................................................................................... 51
Model evaluation ............................................................................................................................... 52
Using imputed datasets in ML modeling ........................................................................................... 52
Imputation assessment ..................................................................................................................... 52
Feature importance for MLP ............................................................................................................. 53
Fairness assessment ........................................................................................................................ 53

Training Data for Machine Learning (ML) to Enhance Patient-Centered Outcomes Research (PCOR) Data Infrastructure
ONC
5
Recommendations for Supporting the Future Application of ML to Health, Health Care, and PCOR ......................................................................................................................... 54
Strategic Recommendations .................................................................................................. 54
Tactical Recommendations Based on Project Outputs .......................................................... 58
Recommendations for future use of the training datasets ................................................................ 58
Recommendations for future use of the ML models ......................................................................... 60
Conclusion .................................................................................................................................. 62
Glossary & Acronyms ................................................................................................................. 63 Glossary ................................................................................................................................. 63
Acronyms ............................................................................................................................... 64
Appendix ..................................................................................................................................... 67 R and Python libraries used in the Project ............................................................................. 67
Alternate use cases considered for the Project ...................................................................... 69
Resources ................................................................................................................................... 70
References .................................................................................................................................. 71

Training Data for Machine Learning (ML) to Enhance Patient-Centered Outcomes Research (PCOR) Data Infrastructure
ONC
6
Executive Summary INTRODUCTION AND BACKGROUND The Training Data for Machine Learning to Enhance PCOR Data Infrastructure project (hereafter termed the Project) led by the Office of the National Coordinator for Health Information Technology (ONC) conducted foundational work to support future applications of artificial intelligence (AI), specifically focused on machine learning (ML) to further health, health care, and patient-centered outcomes research (PCOR), and in turn enhance the adoption and implementation of a PCOR data infrastructurei. This Project is fundedii through the PCOR Trust Fund (PCORTF), established under the Patient Protection and Affordable Care Act of 2010, and managed by the Department of Health and Human Services (HHS) Assistant Secretary for Planning and Evaluation (ASPE) that leads projects to build PCOR data capacity and infrastructure.
A major challenge for advancing AI/ML applications to accelerate clinical innovation and support evidence-based decisions in clinical settings is the lack of high-quality training dataiii. To address this challenge, ONC partnered with the National Institutes of Health (NIH) National Institute of Diabetes and Digestive and Kidney Diseases (NIDDK) to define and develop high-quality training datasets that were provisionally tested using three ML algorithms. The Project used data from the United States Renal Data System (USRDS) to prepare these training datasets and to apply ML techniques for an end stage kidney diseaseiv (ESKD)/end stage renal disease (ESRD) use case. A key aspect of implementing this project was the engagement of a technical expert panel (TEP) composed of experts from AI/ML and health information technology and a patient advocate – who played a crucial role in vetting the criteria for high-quality training datasets and the methods and results from building the training datasets and ML models.
Dissemination of resources generated from this Project, including the detailed methodology and the code that was developed, points to consider when building training datasets and ML models, and recommendations for future projects gathered from the TEP, further promotes the broader application of AI/ML by PCOR researchers (these resources are available in the Implementation Guide and this Final Report).
DEVELOPMENT OF HIGH-QUALITY TRAINING DATASETS AND ML MODELS The use case – predicting mortality in the first 90 days of dialysis – was selected because mortality in the first 90 days of dialysis initiation in ESKD/ESRD patients remains notably highv,vi. From a patient-centered perspective, an ML model that predicts mortality in the first 90 days could inform patient-provider joint clinical decisions on whether to initiate dialysis.
The overall dataset was prepared using variables in the USRDS data with clinical relevance and prognostic value for mortality in the first 90 days after dialysis initiation. The criteria for high-quality training datasets were defined with input from TEP and other stakeholders and included applying inclusion/exclusion cohort selection requirements, structuring and curating to ensure that missing values and outliers were handled appropriately, scaling and balancing the data, and preparing a data dictionary with all the features selected for ML modeling. The features in the training dataset only included information known on or prior to the first

Training Data for Machine Learning (ML) to Enhance Patient-Centered Outcomes Research (PCOR) Data Infrastructure
ONC
7
day of dialysis and consisted of 188 features, with one record per patient. Two sets of features were included in the dataset – features taken directly from the USRDS data and those that were constructed.
Three ML algorithms (a mixture of non-parametric and parametric) were selected with guidance from the TEP to provisionally test the training datasets and develop ML models – eXtreme gradient boosting (XGBoost), logistic regression, and multilayer perceptron (MLP). Both non-imputed and multiply imputed datasets were used for XGBoost modeling to compare the contribution of multiple imputation on the model performance, whereas only the multiply imputed dataset was used for logistic regression and MLP, as these algorithms cannot natively handle non-informatively missing values. Due to the differing requirements of the input training dataset for these models, additional data processing steps were performed that included one-hot encodingvii, standardizationviii, and balancingix. Hyperparameters were tuned using the training dataset, and the final model was trained on the training dataset and evaluated on the testing dataset.
Performance of the models measured using receiver operating characteristic (ROC) area under the curve (AUC) showed high ROC AUC that ranged between 0.812 – 0.827. Calibration of the XGBoost models by plotting the observed versus estimated risk indicates an accurately estimated probability of mortality across all ranges of predicted risk. Features ranked in the top 10 by XGBoost and logistic regression included indicators of general health status, length of time prior to ESKD/ESRD, and the quality of care delivered. Performance of the models assessed for fairness measured by ROC AUC across demographic categories (age, race, sex) and initial dialysis modality demonstrated that XGBoost performed consistently across the evaluated categories as compared to logistic regression and MLP models.
RECOMMENDATIONS FOR SUPPORTING THE FUTURE APPLICATION OF ML TO HEALTH, HEALTH CARE, AND PCOR A major objective of this foundational project was to identify areas for future PCOR studies based on the challenges encountered and the findings from building the training datasets and ML models. Towards that end, the TEP and other stakeholders provided significant input and multiple recommendations for building upon the outputs and outcomes throughout the course of this project. These are detailed in this Final Report and include general strategic recommendations for industry to consider in advancing the application of AI/ML for PCOR and health care and specific more pragmatic recommendations for future PCOR researchers to build upon the training dataset and ML models developed in this project.
CONCLUSION The project addressed the goal of building and testing high-quality training datasets for a kidney disease use case that can potentially be utilized for AI/ML applications, including joint clinician-patient informed decision making. PCOR researchers can build off the foundational work completed through this project and extend the application of these methods to a wider array of use cases and advance the application of ML to enhance PCOR infrastructure.

Training Data for Machine Learning (ML) to Enhance Patient-Centered Outcomes Research (PCOR) Data Infrastructure
ONC
8
Introduction The Training Data for Machine Learning to Enhance PCOR Data Infrastructure project (hereafter the Project) led by the Office of the National Coordinator for Health Information Technology (ONC) conducted foundational work to support future applications of artificial intelligence (AI), specifically focused on machine learning (ML) to further health, health care, and patient-centered outcomes research (PCOR), and in turn enhance the adoption and implementation of a PCOR data infrastructurei. PCOR is “designed to produce scientific evidence to inform and support health care decisions of patients, families, and providers. PCOR focuses on studying the effectiveness of prevention and treatment options with consideration of the preferences, values, and questions patients face when making health care choices”x. This Project is funded through the PCOR Trust Fund (PCORTF), created under the Patient Protection and Affordable Care Act of 2010, and managed by the Department of Health and Human Services (HHS) Assistant Secretary for Planning and Evaluation (ASPE). ASPE partners with 12 HHS agencies to lead intradepartmental projects that build data capacity and infrastructure for conducting PCOR.
AI/ML applications have the power to utilize large amounts of real-world clinical data in varied and complex formats to rapidly identify effective treatments, potentially accelerating clinical innovation and supporting evidence-based decisions in clinical settingsxi,xii,xiii. However, the wide-spread application and adoption of AI/ML in health care and PCOR is wrought with challenges, including the lack of high-quality training data from which to build and maintain AI applications in healthxiv. This Project was undertaken to address the challenge of the lack of availability of high-quality training datasets. This Project informs future work that aims to leverage AI/ML to develop scientific approaches to support personalized medicine so that providers can eventually match patients to the best treatments based on their specific health conditions, life-experiences, and genetic/phenotypic profiles.
To support the goal of conducting foundational work that will facilitate future applications of AI/ML and enhance PCOR data infrastructure, ONC partnered with the National Institutes of Health (NIH) National Institute of Diabetes and Digestive and Kidney Diseases (NIDDK). Through this Project, ONC and NIDDK have advanced the application of AI and ML algorithms in PCOR by defining requirements for high-quality training datasets. The Project used data from the United States Renal Data System (USRDS)xv to prepare high-quality training datasets and to apply machine learning techniques for a chronic kidney disease use case of predicting mortality within the first 90 days of dialysis.
A technical expert panel (TEP) assembled for the Project composed of AI/ML and health IT experts and a patient advocate was instrumental in vetting the methodology, interpreting the findings, and helping to address the challenges encountered during the training dataset and ML development process. The TEP offered directional guidance and recommendations for other PCOR investigators to build upon the results of this Project and future opportunities related to the development and application of AI/ML to health, healthcare, and PCOR.
This project facilitates the broader application of AI/ML by PCOR researchers through the resources generated from this project including the methodology used and lessons learned in building the training dataset and ML models, and recommendations for future projects gathered from the technical experts assembled for this project. Foundational knowledge gathered from this project aligns with the goals of other

Training Data for Machine Learning (ML) to Enhance Patient-Centered Outcomes Research (PCOR) Data Infrastructure
ONC
9
PCORTF and ASPE funded projects aimed at enhancing the PCOR data infrastructure, including the Patient Matching, Aggregation, and Linking project that developed a framework to address data quality and data sharing, the privacy-preserving record linkage project that facilitates the linking of data from diverse data sources, and the more recent projects such as the building infrastructure and evidence for COVID-19 related research by developing synthetic linked data files or using split-learning ML techniques to enable health information exchange. Evidence generated from this Project also supports multiple federal and HHS investments, including the Precision Medicine Initiative (PMI), the Transitions in Care program conducted in coordination with the Department of Veterans Affairs, and agency-specific, and related NIDDK-funded kidney research programs such as the Kidney Precision Medicine Project.
PROJECT GOAL The goal of the project was to conduct foundational work of building a high-quality training dataset and ML models that serve to advance the capacity of PCOR infrastructure and support the application of ML by future researchers. This goal was achieved primarily through the following objectives in close coordination with the TEP:
• Preparing high-quality training datasets using USRDS data to address a kidney disease use case—predicting mortality within the first 90 days of dialysis
• Developing ML models based on three algorithms—eXtreme gradient boosting (XGBoost), logistic regression, and multilayer perceptron (an artificial neural network implementation)—to provisionally test the respective training datasets derived from the original high-quality full training dataset
• Validating the approaches for building the ML models by evaluating their performance using conventional metrics such as area under the curve (AUC) and a confusion matrix (used to calculate metrics such as sensitivity, specificity, positive predictive value, likelihood ratio, F1 score, etc.)
• Disseminating resources generated in the project, including considerations and best practices identified during the preparation of the training dataset and ML models, the ML code, and an implementation guide that future researchers can refer to when preparing training datasets and ML models for new kidney disease use cases
The project launched in September 2019 and was completed in September 2021.

Training Data for Machine Learning (ML) to Enhance Patient-Centered Outcomes Research (PCOR) Data Infrastructure
ONC
10
Background AI implementations are revolutionizing medical research and health care as evidenced by the increasing number of applications and tools being developed to automate and/or augment human tasks and decisions with the eventual goal of improving health carexi,xii,xiii,
xviii. Most of these are focused on cardiovascular or general health conditions and diabetes; only three applications have been developed for kidney diseases, none of which have been cleared by the FDA. Multiple studies, however, have focused on examining the use of ML in kidney conditions for assessing and classifying histopathological images, and predicting disease progression and survival
xvi. AI techniques, such as, ML are being used to identify patterns, classify information, discover associations, test hypotheses, and generate new clinical decision tools. The area that has seen the most advances with AI applications is medical imagingxvii, where the U.S. Food and Drug Administration (FDA) has approved close to 100 tools that employ some form of ML to acquire, screen, stratify, and interpret images and prepare reports that radiologists use for patient care. Other applications of AI in health care are still nascent—while there are approximately 109 AI-based non-imaging products or tools that have been developed in the past two decades, only about 20% have received FDA approvals and are being used in the clinic
xix,xx,xxi.
Most of the ML applications developed to-date involve supervised learning, where an algorithm iteratively learns from a training dataset that consists of a large set of observations to classify or predict an outcome. The performance of the trained algorithm is then evaluated against a distinct test dataset. The potential for applying such ML techniques in improving patient care is highlighted by some key developments that have occurred in the past decade:
• The availability of a vast volume of data from electronic health records (EHRs) and administrative data (such as Medicare claims), collected during routine patient care, that are stored in general or disease specific databases
• The increasing number of patients and study participants who are willing to share their data collected during clinical care, clinical trials, and research studies, and via patient reported outcome data, and social media
• Continuous improvements of AI/ML applications fueled by innovative solutions developed through broad stakeholder participation, including government, industry, academic, patients, and private citizens
Translating the findings from ML-based classification or prediction models to real world data and its broad adoption in health care settings, however, requires addressing challenges associated with the pivotal component of all ML—the data—specifically, the quality of training datasets. High-quality training datasets that are well-labeled, well-structured, and use common data elements are essential to train prediction models that use ML algorithms, extract features most relevant to specified research goals, and reveal meaningful associations. Challenges surrounding the availability of high-quality training datasets include:
• Real world data collected via EHR systems or from clinical research studies, registry based data, and other data collection systems are complex, diverse, and often noisy, error-prone, have incorrect, outlier or missing values, and have inconsistent measures and values across multiple facilities, even within the same health care setting

Training Data for Machine Learning (ML) to Enhance Patient-Centered Outcomes Research (PCOR) Data Infrastructure
ONC
11
• Variables, even those often considered to be core features in a training dataset (e.g., dates, sex, race, ethnicity), are often not collected in a standardized format and can lack proper annotations
• Duplicate datasets for patients within the same EHR or data collection systems due to lack of provenance or audit trail of the data
• Representativeness of observations/patients captured within an EHR system • Insufficient quantity of data with desired features for a specific ML use case • Regulatory and proprietary obstacles to accessing EHR data
Health care providers and patients alike need to have high confidence the clinical decision supporting predictive or classifier AI tools developed are accurate and reliable. The availability of high-quality training datasets is therefore a fundamental requirement for developing and deploying ML tools in clinical settings.
This Project was undertaken to help address the lack of availability of high-quality training datasets. To start, there is no standard definition of what constitutes a high-quality training dataset, and since ML models are custom tailored to the dataset on which it is trained, many ML practitioners define quality as a function of the ML model that will be developed (for example: some algorithms can inherently handle missing values and others cannot). Nevertheless, there are some baseline characteristics that all training datasets must have for successful use in developing ML applications. Towards identifying these baseline characteristics, and to develop a high-quality training dataset that can be employed for addressing the kidney disease use case selected for the project—predicting mortality in the first 90 days of dialysis, this project was implemented based on the following principles:
• Engaging clinical domain experts in kidney diseases throughout the course of the project to ensure that the training datasets and ML models are clinically relevant and patient-centered
• Pre-defining the quality criteria for the training dataset that was prepared and validating its quality (e.g., by testing the goodness of the imputations performed for missing values)
• Vetting the approaches and methodology used to build the training dataset and ML models, and reviewing the results and findings with a TEP consisting of AI/ML domain experts with broad experience in advanced ML techniques such as deep learning, health information technology (IT) solutions, and patient advocacy
• Capturing and incorporating lessons learned and recommendations provided by various stakeholders throughout the course of the project
Disseminating project progress and obtaining feedback from an Interagency Assembly with clinical and AI experts from across the federal agencies, including the NIH, FDA, the Centers for Medicare & Medicaid Services (CMS), Department of Veterans Affairs (VA), Centers for Disease Control and Prevention (CDC), Census Bureau, etc., that was established for the project.

Training Data for Machine Learning (ML) to Enhance Patient-Centered Outcomes Research (PCOR) Data Infrastructure
ONC
12
Overall Approach for Building the Training Dataset and ML Models The overall approach for building the training dataset and the ML models is based on the Cognitive Project Management for Artificial Intelligence (CPMAITM) methodology
xxiii) methodology, which defines a robust and proven approach for applying analytics to practical challenges. The CRISP
xxii, a detailed implementation of the widely used Cross-Industry Standard Process for Data Mining (CRISP-DM
-DM methodology has six phases; five are shown in Figure 1 below. The last phase of ‘Deployment’—the step of making the model available to end users of the model, such as in a clinic or a hospital or dialysis center—is beyond the scope of this project.
Figure 1: CRISP-DM Methodology Adapted for Clinical Research Applications
The detailed methodology for each of these steps used in the project aligns to the Patient-Centered Outcomes Research Institute (PCORI) Methodology Standards Checklist to ensure that the overall study design addresses patient centeredness appropriately.

Training Data for Machine Learning (ML) to Enhance Patient-Centered Outcomes Research (PCOR) Data Infrastructure
ONC
13
Kidney Disease Use Case for the Project Kidney disease-focused use cases are suitable for employing machine learning approaches because of the spectrum of kidney disease phenotypes, its impact on a myriad of important clinical, patient-centered, and health systems outcomes, and its large dependence on laboratory values over time for diagnosis and management. ML approaches could be applied to use cases ranging from prognostication of key outcomes such as progression to ESKD/ESRD, cardiovascular events or hospitalizations, identification of novel therapeutic pathways, and prediction of adverse drug events that could inform clinical decision-making. Such patient centric upstream use cases require access to a wealth of EHR or biospecimens linked to data on clinical phenotypes, which are not readily available or challenging to access due to privacy protections and lack of “cross-talk” across EHR platforms. While the original goal for this Project was to test ML approaches on use cases upstream of late-stages of kidney disease progression to help patients and their providers make informed decisions based on potential outcomes from the disease and treatments, the accessibility challenges with EHR data necessitated identifying a data source (USRDS) with relevant data for kidney diseases before deciding on a use case for this Project – this led to a use case focused on patients who had already progressed to ESKD/ESRD to build the training dataset and ML models. Focus on ESKD/ESRD is particularly important because it is the only chronic kidney disease stage that is covered through CMS Medicare in the U.S. regardless of the age of the patient (that is, under or over 65 years of age).
ESKD/ESRD is associated with exceedingly high morbidity and mortality. Unfortunately, mortality in the first 90 days of dialysis initiation also remains notably highv,vi. Patients during this vulnerable period of dialysis face several changes that place them at risk of adverse health events. For many patients, these changes include fluid fluctuations that lead to either volume overload or hypotension, electrolyte derangements associated with increased risks of arrhythmia, and loss of residual kidney function. This is related to and compounded by the degree and quality of preparation of patients for dialysis, such as whether patient has seen a nephrologist recently and whether dialysis is initiated with catheter or fistulaxxiv; however, data on preparation for dialysis are lackingxxv. Patients who “crash” into dialysis are more likely to have comorbid conditions such as diabetes, coronary artery disease, and congestive heart failurexxvi.
Although risk models do exist for predicting ESKD/ESRD, mortality in the first 90 days of dialysis is not well studiedvi,xxvii. From a patient-centered perspective, a model that predicts mortality in the first 90 days could inform patient-provider joint clinical decisions on whether to initiate dialysis and if so, which type of dialysis to initiate. Therefore, the specific use case—predicting mortality in the first 90 days of dialysis—was selected for the following reasons:
• The first 90 days following initiation of chronic dialysis represent a high-risk period for adverse outcomes, including mortality
• Studies of the end-stage kidney population have conventionally excluded this time period from analyses
• While the sudden and unplanned start of dialysis is a known risk factor, other factors leading to poor outcomes during this early period have not been fully delineatedxxviii,vi

Training Data for Machine Learning (ML) to Enhance Patient-Centered Outcomes Research (PCOR) Data Infrastructure
ONC
14
• Tools to identify patients at highest risk for poor outcomes during this early period are lacking; however, such tools may inform discussions between clinicians and patients and their shared decision-making regarding dialysis initiation
The purpose of this use case is to predict mortality in the first 90 days of dialysis initiation to potentially inform shared decision-making between patient and provider. The high-quality training datasets generated with this use case could be used to evaluate other relevant outcomes in the future. (For additional information, refer to Use Case and Data Source Selection under the Considerations section.)

Training Data for Machine Learning (ML) to Enhance Patient-Centered Outcomes Research (PCOR) Data Infrastructure
ONC
15
Building a High-Quality Training Dataset SOURCE DATA The source data for building a high-quality training dataset was obtained from the USRDS, the national data registry maintained by NIDDK that stores and distributes data on the outcomes and treatments of chronic kidney disease (CKD) and ESKD/ESRD population in the U.S. While USRDS data does not include complete EHRs for patients suffering from ESKD/ESRD, it has multiple advantages as the source data for building a training data for ML:
• It provides the most comprehensive capture of ESKD/ESRD patients who initiated or are currently on dialysis.
• It links to several databases, including those related to organ transplantation and mortality.
• It incorporates the CMS Form 2728 (the “medical evidence” form) which covers all Americans suffering from ESKD/ESRD, so it is a relevant dataset on which to apply ML to predict ESKD/ESRD-specific outcomes.
• As of 2006, CMS Form 2728 (MEDEVID dataset in USRDS) includes some information on how well prepared the patient was for dialysis—for example: whether the patient was under a nephrologist’s care prior to ESKD/ESRD and for how long.
• It incorporates CMS claims data for patients before diagnosis with ESKD/ESRD, which contains information (such as claims for nephrology care) on how well prepared the patient was for dialysis.
However, there are certain limitations with using the USRDS data for the use case—these include:
• ESKD/ESRD claims data is only available for the Medicare population (65 and older or younger patients diagnosed with ESKD/ESRD; limited CKD claims data is also available for patients with Medicare prior to ESKD/ESRD diagnosis).
• CMS Form 2728 is manually completed by clinical providers; therefore, it is prone to data entry errors.
• CMS Form 2728 does not contain the full range of data relevant to kidney risk. For example, Form 2728 has serum creatinine and serum albumin readings but not urine creatinine or urine albumin.
• Sudden changes in serum creatinine levels contain important information about kidney function; the data on Form 2728 may not be collected frequently enough to detect these changes.
• USRDS data lack continuous validation of its methods, lack complete comorbidity and laboratory data at registration, an initial survival bias in the data due to not including patients who die soon after ESKD/ESRD diagnosis, and a lack of accuracy of cause-of-death reporting.

Training Data for Machine Learning (ML) to Enhance Patient-Centered Outcomes Research (PCOR) Data Infrastructure
ONC
16
Notwithstanding the limitations, based on the advantages listed above, a robust training dataset of approximately 1.15 million sample size was prepared from the USRDS datasets for applying ML to predict mortality in the first 90 days of dialysis. (For additional information, refer to Access to data sources and USRDS data limitations and gaps under the Considerations section.)
HIGH-QUALITY TRAINING DATASET—METHODOLOGY AND RESULTS Criteria for a High-Quality Training Dataset Building a high-quality training dataset and capturing the details of the methodology used and the lessons learned in the process was a primary objective of the project. Towards that objective, the criteria for high quality were defined with input from various stakeholders, including the TEP. The criteriaxxix and how they were applied to the training dataset are shown in Table 1 below.
Table 1: Criteria for a High-Quality Training Dataset
Quality Criteria How addressed in the Training Dataset Features cleaned and correctly labeled (well-labeled)
• Removed or flagged outliers, erroneous, suspicious, duplicate, and inconsistent values
• Documented how outliers/inconsistencies were addressed across USRDS datasets (e.g., inconsistent coding practices, units, definitions)
• Documented and validated any constructed or derived features, to ensure that methods/ equations were selected and applied correctly
Dataset reliable and well curated (well-structured)
• Merging and joining done correctly • Inclusion and exclusion criteria applied correctly (such as only
including patients with valid dialysis start date, excluding patients <18, etc.)
• Missing data patterns documented and addressed (Medicare pre-ESKD/ESRD claims are missing for those who do not qualify for Medicare prior to ESKD/ESRD diagnosis)
• Centering/scaling/standardizing some variables for analysis or balancing the data based on the algorithm that was used
• Excluded operational factors such as location, provider, and masked dates when building features
• Train/test/validation split done such that the training data is representative of the rest of the data
• Data dictionary created
Use common data elements (CDEs)
• For constructed features, used CDEs • For features pulled directly from USRDS dataset, CDEs were based
on what was used by USRDS

Training Data for Machine Learning (ML) to Enhance Patient-Centered Outcomes Research (PCOR) Data Infrastructure
ONC
17
Data De-identification USRDS provides ‘limited datasets’ with most of the personally identifiable information (PII) removed but retaining certain limited PII such as dates and geographic (location) variables. To comply with requirements from the study IRB (from UCSF), these two variables were de-identified before use in this Project. USRDS data received in sas7bdat format were de-identified as per the Safe Harbor method of the Health Insurance Portability and Accountability Act (HIPAA)xxx using a SAS script. All date variables in USRDS—other than variables which contain only the year (with no month or day information)—were de-identified by offsetting all date fields by a randomly-chosen number specific to each patient included in the USRDS data. For location variables, the zip code and county Federal Information Processing Standard Publication (FIPS) codes variables were deleted. The accuracy of the date de-identification was validated by comparing a sample of the relative date ranges in the de-identified data to the relative date ranges in the source data. (For additional information, refer to USRDS data de-identification under the Considerations section.)
USRDS Datasets and Programming Languages Utilized The overall training dataset was prepared using variables in the USRDS data with clinical relevance and prognostic value for mortality in the first 90 days after dialysis initiation as determined by kidney disease experts from UCSF. The features in the training dataset only include information known on or prior to the first day of dialysis. To ensure the training dataset and ML models are broadly applicable, the training dataset was created from routinely collected data available in the following USRDS datasets:
• USRDS core files: MEDEVID (Medical Evidence), PATIENTS, kidney transplant waitlist datasets (WAITSEQ_KI, WAITSEQ_KP, and TX), from 2012 through 2017
• Medicare pre-ESKD/ESRD claims data (for assessing the degree to which a patient has been prepared for dialysis) from 2008 through 2017. Further details on the datasets and how they map to the use case is shown in Figure 2. Data from the special studies in USRDS were not used to prepare the training dataset due to the limited number of patients included in those studies.
Figure 2: USRDS Datasetsxxxi Utilized in the Project for Predicting Mortality

Training Data for Machine Learning (ML) to Enhance Patient-Centered Outcomes Research (PCOR) Data Infrastructure
ONC
18
The overall training dataset was created using Rxxxii (version 3.6.3 (2020-02-29) running on x86_64 Linux Ubuntu 20.04.1 LTS) and a PostgreSQL database (PostgreSQL 12.3, compiled by gcc (GCC) 4.8.3 20140911 (Red Hat 4.8.3-9), 64-bit). R was used to pre-process the training dataset (libraries found in Appendix Table 1) to prepare for the XGBoost models and Pythonxxxiii (version 3.6.9 running on x86_64 Linux Ubuntu 20.04.1 LTS) was used to prepare the training dataset (libraries found in Appendix Table 2) for the logistic regression and multilayer perceptron models. The code used to build the training dataset and the ML models can be found on ONC GitHub, and an Implementation Guide can be found on the project site. (For additional information, refer to USRDS data format under the Considerations section.)
Building the Cohort and Outcome Variable The following criteria was applied to the dataset for selecting the cohort for the project:
• An existing date of first dialysis treatment (n=3,096,526) • Death date not before first dialysis treatment (n=3,096,515) • Adults (age >=18 years old) (n=3,065,026) • Incident year from 2008-2017 (n=1,150,195)
This project employed supervised ML, which requires the data to have labels representing outcomes that ML can predict. The outcome variable for the selected use case is whether a patient died within the first 90 days of dialysis initiation. The methodology for preparing the overall study dataset and the training and testing dataset from the USRDS datasets is shown in Figure 3.
Training Data for Machine Learning (ML) to Enhance Patient-Centered Outcomes Research (PCOR) Data Infrastructure
ONC
19
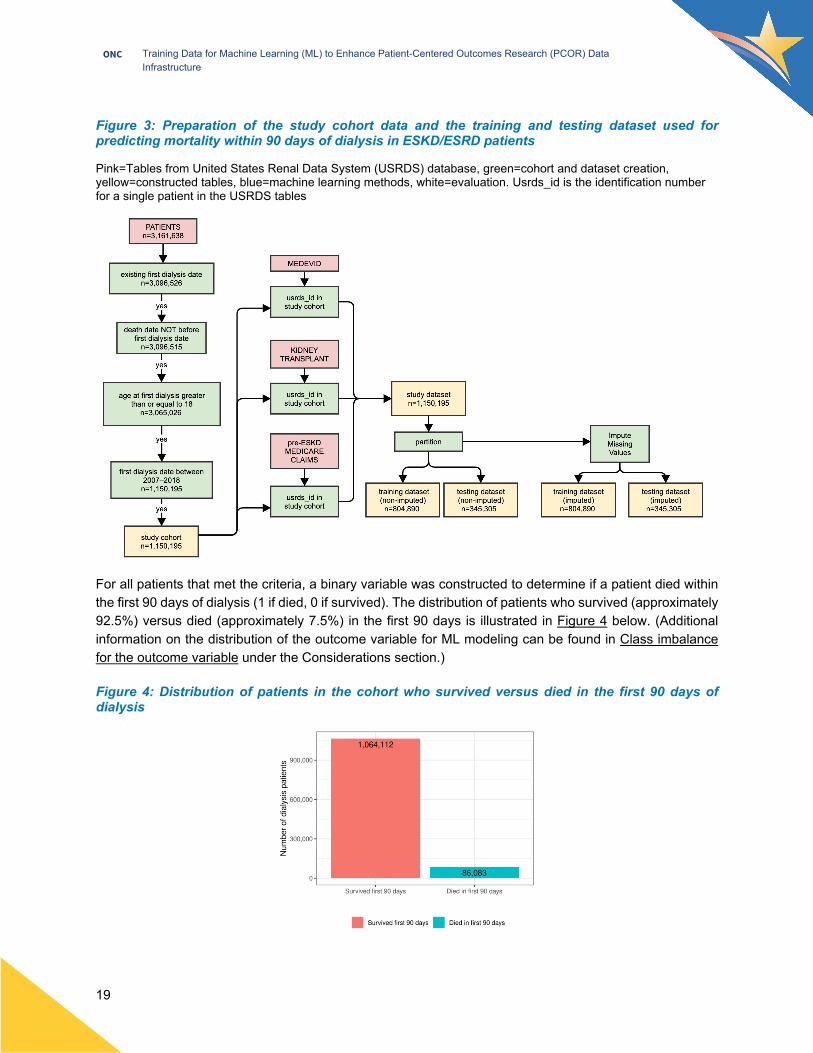
Figure 3: Preparation of the study cohort data and the training and testing dataset used for predicting mortality within 90 days of dialysis in ESKD/ESRD patients
Pink=Tables from United States Renal Data System (USRDS) database, green=cohort and dataset creation, yellow=constructed tables, blue=machine learning methods, white=evaluation. Usrds_id is the identification number for a single patient in the USRDS tables
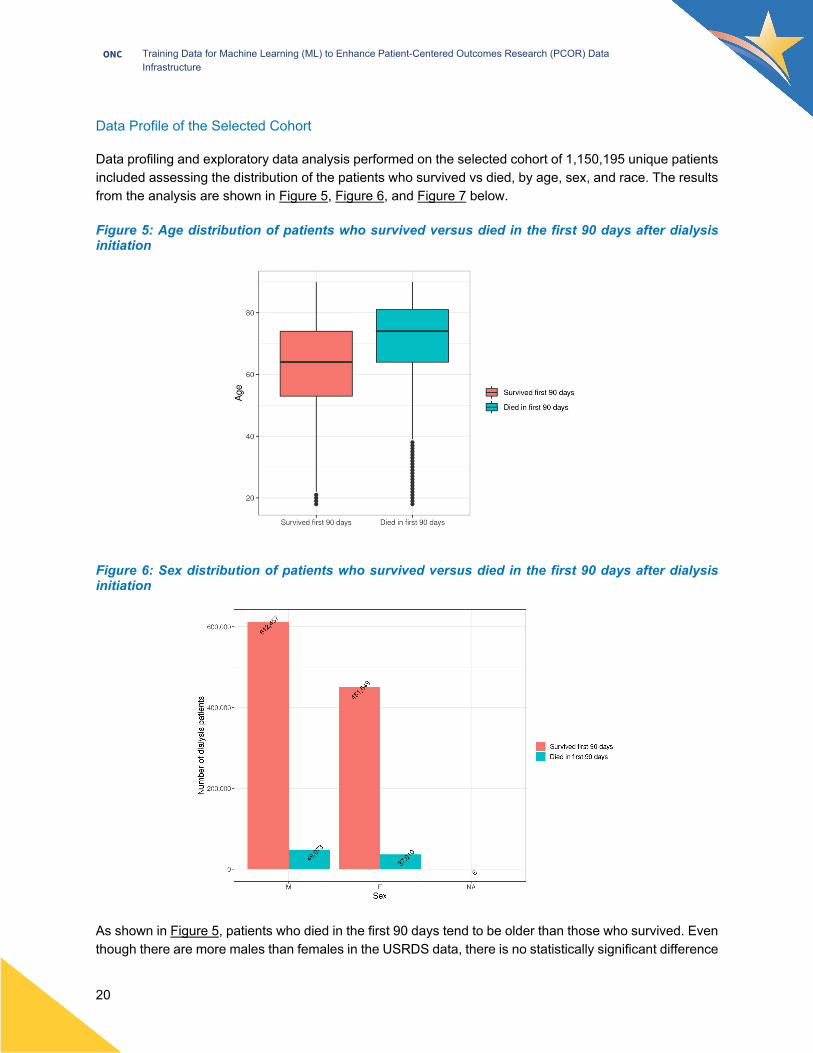
For all patients that met the criteria, a binary variable was constructed to determine if a patient died within the first 90 days of dialysis (1 if died, 0 if survived). The distribution of patients who survived (approximately 92.5%) versus died (approximately 7.5%) in the first 90 days is illustrated in Figure 4 below. (Additional information on the distribution of the outcome variable for ML modeling can be found in Class imbalance for the outcome variable under the Considerations section.)
Figure 4: Distribution of patients in the cohort who survived versus died in the first 90 days of dialysis
Training Data for Machine Learning (ML) to Enhance Patient-Centered Outcomes Research (PCOR) Data Infrastructure
ONC
20
Data Profile of the Selected Cohort
Data profiling and exploratory data analysis performed on the selected cohort of 1,150,195 unique patients included assessing the distribution of the patients who survived vs died, by age, sex, and race. The results from the analysis are shown in Figure 5, Figure 6, and Figure 7 below.
Figure 5: Age distribution of patients who survived versus died in the first 90 days after dialysis initiation
Figure 6: Sex distribution of patients who survived versus died in the first 90 days after dialysis initiation
As shown in Figure 5, patients who died in the first 90 days tend to be older than those who survived. Even though there are more males than females in the USRDS data, there is no statistically significant difference

Training Data for Machine Learning (ML) to Enhance Patient-Centered Outcomes Research (PCOR) Data Infrastructure
ONC
21
in the percentage of males and females who survived versus died in the first 90 days after dialysis initiation (Figure 6). Figure 7 shows that Black, American Indian or Alaska Native, Asian, and Native Hawaiian or other Pacific Islander patients have a lower percentage of mortality in the first 90 days, which may seem counterintuitive as minority patients typically have worse health outcomes than white patients. However, Figure 8 shows that, on average, minority patients initiate dialysis at an earlier age than white patients, which could explain the relative lower rates of mortality in the 90 days after dialysis initiation for minority patients as compared to white patients. Age at the time of ESKD/ESRD diagnosis has been shown to be an important predictor of mortalityxxxiv.
Figure 7: Distribution by race of patients who survived versus died in the first 90 days of dialysis

Training Data for Machine Learning (ML) to Enhance Patient-Centered Outcomes Research (PCOR) Data Infrastructure
ONC
22
Figure 8: Age at ESKD/ESRD diagnosis for patients by race group
The MEDEVID dataset can contain more than one record per patient because the Medical Evidence Form/Patient Registration Form is submitted for several reasons, including if a patient changes dialysis modality or in the case of a kidney transplant graft failure. To ensure that the MEDEVID record associated with the first course of dialysis treatment is used to create the features for the training dataset, the earliest MEDEVID record per patient was used (n=1,150,195).
The Medicare pre-ESKD/ESRD claims datasets are broken down by claim type (inpatient, outpatient, skilled nursing unit, home health, and hospice) and year (2008-2017) in the USRDS data. Table 2 shows the number of unique patients and the total number of claims for each type of Medicare pre-ESKD/ESRD claim. Each unique patient can have multiple claims per type of claim.
Table 2: Number of unique patients with each type of Medicare Pre-ESKD/ESRD claims
Inpatient (IP) Outpatient (OP)
Skilled Nursing Unit
(SN)
Home Health (HH)
Hospice (HS)
Number of Unique Patients 553,704 514,926 140,417 224,272 12,482
Total Number of Claims 2,496,683 15,222,280 592,970 939,751 50,200

Training Data for Machine Learning (ML) to Enhance Patient-Centered Outcomes Research (PCOR) Data Infrastructure
ONC
23
Feature Selection
Each feature captures information known about a patient on or prior to the date of dialysis initiation. The final structure of the training dataset, which was used to train and test the ML models, consists of 188 features, and has one observation per patient. Two sets of features were included in the training dataset: features taken directly from the USRDS datasets and features that were constructed. The full list of features and the methods for constructing certain features are shown in the Data Dictionary (link can be found in the Resources section). (For additional information, refer to the Feature selection under the Considerations section.)
Features taken directly from the USRDS data These included features from PATIENTS dataset—specifically, demographic variables: age, race, sex, and Hispanic ethnicityxxxv. Additionally, kidney disease experts identified variables of clinical relevance from the MEDEVID dataset for inclusion in the training dataset. Out of fifteen clinical and laboratory values in the MEDEVID dataset, only seven were included in the training dataset—the rest had a high percentage of missing values (less than 40 percent) or contained duplicate clinical information, such as methods of estimating glomerular filtration rate (GFR). Masked date variables from the MEDEVID dataset, such as patient signature date and clinician signature dates, were also excluded from the training dataset as they have little to no clinical relevance. The full list of features taken directly from the PATIENTS and the MEDEVID dataset are shown in Table 3.
Features that were constructed Detailed method for the features that were constructed from PATIENTS, MEDEVID and Medicare pre-ESKD/ESRD claims data are provided in the Data Dictionary (link can be found in the Resources section). A summary description of the construction method is provided below.
The transplant waitlist status feature was created using the dialysis start date from the PATIENTS dataset and the start and end dates from the kidney transplant waitlist datasets (WAITSEQ_KI, WAITSEQ_KP, and TX tables) to determine whether a patient was actively on the kidney transplant waitlist, removed from the waitlist, received a kidney transplant, or never on the waitlist prior to dialysis initiation. The time on transplant waitlist variable was constructed for the patients who are on the transplant waitlist by subtracting the start date from the end date. (For additional information, refer to Kidney transplant patients under the Considerations section.)
The primary cause of renal failure (PDIS) feature was constructed by taking the PDIS variable from the PATIENTS dataset and replacing the missing values with the PDIS values from the MEDEVID dataset to reduce the number of overall missing values. PDIS was coded as ICD-9 before 2015, as a mixture of ICD-9 and ICD-10 in 2015-2016, and as ICD-10 post-2016. (The variable CDTYPE indicated the appropriate ICD code type.) The PDIS values were mapped from ICD-9 to ICD-10 codes in text format and recoded to numeric categories.
Four features (number of comorbidities marked as: yes, no, unknown, or missing) were built from the comorbidity variables in the MEDEVID tables by counting the number of comorbidities—out of 26—for each category (yes, no, unknown, or missing). Binary variables were created for each clinical/laboratory feature included in the training dataset to indicate whether the original values were missing and whether the original

Training Data for Machine Learning (ML) to Enhance Patient-Centered Outcomes Research (PCOR) Data Infrastructure
ONC
24
values were out of bounds. The time in dialysis training was constructed by subtracting the end date training end date from the training start date variables in MEDEVID.
For the Medicare pre-ESKD/ESRD claims datasets, the features with clinical relevance were also identified by the UCSF clinicians. The total number of claims and total lengths of stay features for each type of claim setting (inpatient, outpatient, skilled nursing unit, home health, and hospice) were constructed by counting the number of claims per patient and summing the total lengths of stays per type of claim. Binary variables were also created to indicate the presence or absence of a claim in each claim setting (IP, OP, HH, HS, SN) as well as the presence or absence of any pre-ESKD/ESRD Medicare claim per patient in the study cohort. Features that indicate the time elapsed between first and last pre-ESKD/ESRD Medicare claim were constructed for each patient across all claims settings and also for each setting (IP, OP, HH, HS, SN) by subtracting the date of the first claim from the date of the last claim.
Diagnosis code groupings were created based on 12 major disease groups that were defined by the UCSF clinicians: diabetes, hypertension, heart failure, cardiovascular arterial disease, cerebrovascular disease, peripheral arterial disease, kidney failure, pneumonia, malignant neoplasm, alcohol dependence, smoking, and opioid dependence. These major disease groups have clinical relevance to ESKD/ESRD and are likely to have prognostic value. Through matching the primary diagnosis codexxxvi for each claim with the ranges of the ICD-9/10 codes associated with each major disease, variables for inpatient, outpatient, and skilled nursing unit settings were created for each primary diagnosis code, total number of claims/total length of stay, and type of claim combination (e.g., total number of claims for a hypertension primary diagnosis code for outpatient claim, total length of stays for a heart failure diagnosis code for an inpatient claim). A binary indicator for whether a patient has any claim in each disease group was also constructed for all claim settings. The full list of features constructed from the PATIENTS, MEDEVID, and pre-ESKD/ESRD claims datasets are shown in Table 3. (For additional information, refer to Mapping diagnosis codes to diagnosis groupings and Cleaning text data under the Considerations section.)
Table 3: Features Included in the Training Dataset
USRDS Dataset Category Feature/Feature Category List* [Bold: Constructed features]
PATIENTS Demographics Age, Race, Sex, Hispanic ethnicity PATIENTS/Kidney Transplant Waitlist
Prior care Transplant waitlist status, Time on transplant waitlist
PATIENTS/Medical Evidence (MEDEVID)
Renal failure Primary cause of renal failure (PDIS)
Medical Evidence (MEDEVID)
Clinical variables BMI, Weight, Height, Albumin, Hemoglobin, Serum creatinine, Glomerular filtration rate (GFR) EPI, Binary indicator for outlier clinical values, Binary indicator for missing clinical valuesxxxvii
Comorbidities
All 26 comorbidities from CMS Form 2728 (MEDEVID), Number of comorbidities marked yes, Number of comorbidities marked no, Number of comorbidities marked unknown, Number of comorbidities marked missing
Renal failure Primary disease causing ESKD/ESRD: detailed group

Training Data for Machine Learning (ML) to Enhance Patient-Centered Outcomes Research (PCOR) Data Infrastructure
ONC
25
USRDS Dataset Category Feature/Feature Category List* [Bold: Constructed features]
Prior care
Prior nephrology care, Range of nephrology care, Access type, Is maturing AVF present, Is maturing AVG present, Received exogenous erythropoietin (EPO), EPO range, Under care of kidney dietician, Range of diet care
Patient education Informed of transplant options, Reason not informed of transplant options, Patient has/will complete training, Self-dialysis training type, Time in dialysis training
Other Prior employment status, Current employment status, Insurance type (Medicaid, Medicare, Medicare Advantage, Employer Group, VA, Other, None), Primary dialysis type, Primary dialysis setting
Pre-ESKD/ESRD Claims
Prior care
Total number of claims (IP, OP, HH, HS, SN)xxxviii, Total length of stay (IP, OP, HH, HS, SN), Time elapsed between first and last claim, Time elapsed between first and last claim (IP, OP, HH, HS, SN)
Other
Binary indicators for any claims (IP, OP, HH, HS, SN), Whether patient has any pre-ESKD/ESRD Medicare claim, Diagnosis code groupings (IP, OP, HH, HS, SN) binary indicators, Diagnosis code groupings total length of stay (IP, OP, SN), Diagnosis code groupings total number of claims (IP, OP, SN)
Handling Outliers Kidney disease experts from UCSF based on their clinical experience defined the upper and lower bounds for each clinical and laboratory variable so that any values that fall outside these bounds were considered impossible. Table 4 contains the upper and lower bounds for the clinical and laboratory value features included in the training dataset. A small percentage of values—around 0.5 percent to 2.3 percent—for each clinical and laboratory variable were determined to be outliers. These values were subsequently set as missing.
Table 4: Upper and lower bounds for clinical and laboratory variables
Variable Lower bound Upper bound Height (cm) 76 243 Weight (kg) 20 250 BMI (kg/m2) 13 75
Serum Creatinine (mg/dL) 0.5 50 Serum Albumin (g/dL) 0.5 8
GFR EPI 1 30 Hemoglobin (g/dL) 2 18
Binary variables were created for each clinical/laboratory feature to indicate 1) whether the original values were missing and 2) whether the original values were out of bounds (the ranges for each values are so broad that an outlier is very likely to be an error in coding). The outlier values for each feature were set as

Training Data for Machine Learning (ML) to Enhance Patient-Centered Outcomes Research (PCOR) Data Infrastructure
ONC
26
missing and a numerical value was imputed, as described in the missing data imputation section. (For additional information, refer to Handling outliers and imputing missing data under the Considerations section.)
Partitioning the Data for Training, Validation, and Test Datasets Benchmarks in literature for large datasets (1-6 million observations) were used to determine the appropriate way to split the data into a training set and a test set. After a model is trained on the training data, it is tested on the test set to evaluate whether it can calculate an accurate outcome on data that the model has never ‘seen’ before; thus, the test set is created from data that is not part of the training set. Test sets reviewed in the machine learning literature ranged from a 10%xxi to 30%xxxix subset of the full dataset. We selected a conservative approximate 70% (train), 30% (test) for our train-test split to allow for enough data to robustly evaluate our model. (For additional information, refer to Train/test split under the Considerations section.)
To more effectively handle the large data size for modeling, the data were randomly partitioned into 10 subsets that are representative of the whole. Table 5 shows selected counts for sex (male), race group (white), number of missing values (hemoglobin, serum creatinine, serum albumin), total number of patients in each subset, and number of patients who died in the first 90 days of dialysis. These partitions have a small variation between the subsets for the sample demographic groups and missing values in Table 5, which is a measure of confidence that each partition is statistically representative of the whole dataset. (For additional information on using random numbers to partition data, refer to Reproducibility under the Considerations section.)
Table 5: Counts of select categories for each data partition
Subset Number of Males
Number of Race
Group (White)
Number of Missing
Hemoglobin Values
Number of Missing Serum
Creatinine Values
Number of Missing Albumin Values
Total Number of
Patients
Number of Patients who Died
0 65,981 76,535 17,248 2,055 35,925 114,824 8,529 1 66,131 76,864 17,108 2,051 35,129 115,050 8,773 2 66,137 76,773 17,240 2,043 35,428 115,044 8,669 3 66,031 76,846 17,406 1,937 35,100 115,027 8,426 4 66,282 76,788 16,971 1,917 34,933 114,802 8,549 5 66,042 76,652 17,285 2,008 35,138 114,936 8,671 6 66,579 77,002 17,266 1,976 35,219 115,207 8,728 7 66,332 77,221 17,266 2,035 35,019 115,557 8,695 8 66,982 76,605 17,027 2,014 34,797 114,925 8,478 9 66,033 76,751 16,847 1,936 34,973 114,823 8,565
Out of the ten subsets, seven subsets (approx. 70% of the total data) are used for algorithm training and validation while the other three subsets (approx. 30% of the total data) remain untouched until evaluating the models.

Training Data for Machine Learning (ML) to Enhance Patient-Centered Outcomes Research (PCOR) Data Infrastructure
ONC
27
Missing Data Imputation Missing data are unavoidable in EHR research but have the potential to introduce bias and loss of information, leading to invalid conclusions. A variety of methods have been developed to handle missing values. We chose multiple imputation, a principled method that is superior to single imputation methods because it addresses the uncertainty about missing data by creating several plausible imputed datasets. Multiple imputation was done using the ‘mice’ (multiple imputations by chained equationsxl) library (version 3.13.0) in R and using five imputations to achieve 95% relative efficiencyxli.
Clinical and laboratory variables with fewer than 40% missing values were included as features in the training dataset because multiple imputations are not advised when features contain more than 40% missing values xliii . In addition, more imputations would be needed as the fraction of missing data increases, which would increase the run
xlii ,
-time. The laboratory and clinical variables with less than 40% missing data that were imputed include: height, weight, BMI xliv , serum creatinine, serum albumin, hemoglobin, and GFR-EPIxlv.
The imputation model utilized eight independent variables to inform the imputation: age, sex, race, ethnicity as well as the number of comorbidities marked in the Medical Evidence form marked as yes, no, unknown, and missing. Only eight variables were chosen to maintain an acceptable runtime—increasing the number of independent variables also increases the run-time required for the imputation. These variables were chosen as they are demonstrably related to clinical and laboratory values and are missing in only a small percentage of cases or not missing at all. BMI and GFR-EPI and variables derived from other imputed variables were passively calculated using the imputed height/weight values and imputed serum creatinine values, respectively. (For additional information on passive imputation, refer to Handling outliers and imputing missing data under the Considerations section.)
Several imputation methods from the R ‘mice’ package – sample, norm, predictive mean matching (pmm), norm.predict, norm.nob, and mean – were tested to approximate run-time and imputation accuracy for the training dataset. The “goodness of imputation” tests were performed by using a sample of the dataset of 40,000 observations and setting 1,000 of it to null, and testing the six imputation methods to impute the artificially missing values, and calculating the average error and capturing the run-time of each method. It is worthwhile to note that this “goodness of imputation” assessment’s findings may only be generalizable to a very specific form of missing data – where all missing values are missing completely at random (i.e., probability of missingness has no relationship to any of the observed variable values) – a restrictive special case of the broader missing at random assumption tacit in multiple imputation. Out of the methods tested, pmm produced imputed values with the highest accuracy (Table 6). Since imputations are resource-intensive in a dataset with over one million observations, both for generating the imputations and for modeling, the run-time of each imputation method was considered alongside accuracy. The pmm method was chosen to impute the data as it achieved the highest accuracy out of the methods tested and has an acceptable run-time (< 24 hours).
Table 6: Goodness of imputations assessed through average error using methods in the R ‘mice’ package
Method Height Weight Serum Creatinine Albumin GFR
(EPI) Hemoglobin Duration (in sec)
sample 7.55% 34.38% 57.41% 28.62% 7.57% 19.57% 43

Training Data for Machine Learning (ML) to Enhance Patient-Centered Outcomes Research (PCOR) Data Infrastructure
ONC
28
Method Height Weight Serum Creatinine Albumin GFR
(EPI) Hemoglobin Duration (in sec)
norm 5.52% 31.87% 62.25% 27.86% 7.39% 18.31% 66 pmm 5.32% 29.05% 50.13% 27.53% 6.61% 18.61% 72 norm.predict 3.64% 21.40% 36.25% 20.45% 5.63% 13.22% 64 norm.nob 5.67% 30.92% 62.45% 28.07% 8.06% 19.07% 65 mean 5.41% 24.44% 42.29% 20.72% 5.97% 13.71% 50
The following design decisions were therefore made to manage resource requirements for the imputed datasets:
• Produce 5 copies of the imputed data, which should achieve a relative efficiency of 95% (Note: Rubin’s guidelines for achieving a certain relative efficiency were developed using simpler parametric models. The effective fraction of missing information (γ) has not been established for XGBoost because the mathematical properties have not been thoroughly examined.)
• Impute each partition separately; each partition is representative of the entire dataset since randomly partitioning the data ignores the patterns of missingness in the data
• Store imputations separately from the rest of the training dataset to avoid storing duplicates of the data
• Use the pmm imputation method selected based on comparing multiple methods (norm, norm.predict, etc.) in the “goodness of imputation” in the missing values assessment described above
There seems to be little to no consensus in the literature about whether imputing missing values improves ML model performance xlvii xlviii. Since some ML models, such as XGBoost can support nonxlvi, , -informatively missing values by default, the imputed and the non-imputed datasets were tested in the ML models to assess whether imputations improve ML model performance for this training dataset.

Training Data for Machine Learning (ML) to Enhance Patient-Centered Outcomes Research (PCOR) Data Infrastructure
ONC
29
Building ML Models ALGORITHMS SELECTED FOR THE PROJECT Three ML algorithms were selected with input from the TEP to provisionally test the training dataset: XGBoost, logistic regression, and multilayer perceptron (an artificial neural network implementation). These algorithms are a mixture of non-parametric (XGBoost) and parametric (logistic regression and multilayer perceptron) models.
• XGBoost is a popular implementation of gradient boosted decision trees because it performs especially well for tabular data, can be applied to a wide array of use cases, data types, and desired prediction outcomes (regression vs classification), and can handle non-informative randomly-missing values by defaultxlix. Such tree-based algorithms learn branch directions for missing values during training, which allows for a comparison between models run on non-imputed data versus models run on imputed data.
• Logistic regression is a classic categorization model that can be used to examine the association of (categorical or continuous) independent variable(s) with one binary dependent variable. However, it requires that the input dataset have no missing values.
• Multilayer perceptron is a class of hierarchical artificial neural network (ANN) that consists of at least three layers of nodes—an input layer, a hidden layer and an output layer—to carry out the process of ML. They are used for tabular datasets and classification prediction problems.
It is to be noted that the purpose of ML modeling in the Project was to provisionally test the training datasets and report the findings while capturing the lessons learned and considerations for future PCOR researchers; the purpose was not to compare the algorithms and identify the best performing model for clinical deployment (which was out of scope for the Project). (For additional information, refer to Algorithm selection for the Project and Limitations of the ML models developed in this Project under the Considerations section.)
ML MODEL DATA PRE-PROCESSING ML algorithms have differing requirements for the input training dataset. To prepare the training dataset for XGBoost, logistic regression, and multilayer perceptron models, several additional data processing steps were performed. The input of all three models must be numeric so all categorical features were one-hot encoded into numeric indicators of each factor in the categorical features (e.g., the sex feature was converted into 3 columns: sex_1 (male), sex_2 (female), sex_3 (unknown) through one-hot encoding). Since XGBoost models take numeric values as input and can handle missing values and class imbalance, the XGBoost model can use the training dataset after one-hot encoding the categorical features.
Logistic regression and multilayer perceptron models have more model input restrictions as compared to XGBoost, so the following additional data processing steps were performed to prepare the training dataset

Training Data for Machine Learning (ML) to Enhance Patient-Centered Outcomes Research (PCOR) Data Infrastructure
ONC
30
for modeling. (For additional information, refer to Class imbalance for the outcome variable, Preprocessing data, and Standardization and scaling under the Considerations section.)
• Logistic regression and multilayer perceptron models cannot inherently handle missing values in the input dataset as opposed to a tree-based model like XGBoost which learns to handle missing values during training; therefore, the specific numeric pre-ESKD/ESRD claims features with a large percentage of missing data (~40%) were removed from the training datasetl. Only the binary pre-ESKD/ESRD features, which were converted to categorical (i.e., 0=not present, 1=present, 2=missing), were retained in the training dataset for these two models. This effectively allowed retaining the meaning of whether the data was present or missing for the claims features.
• Removed features that had zero variance (variables that have only a single value) from the training dataset because the presence of these variables does not add information to the model.li, lii
• Numeric variables constructed from the pre-ESKD/ESRD Medicare claims with missing values (such as claims counts, diagnosis groupings, etc.) were removed and only the binary features (such as indicators for claims in each care setting, indicators for each diagnosis group, and indicators for pre-ESKD/ESRD claims were retained.
• Standardized each numeric feature to have a mean of zero and a standard deviation of one—the mean of each numeric feature was subtracted from each value and then divided by the standard deviation. Standardization allows for comparison of multiple features in different units and the penalty (e.g., L1) will be applied more equally across the features. Both logistic regression and multilayer perceptron models will learn the importance of features better and faster when they aren’t overwhelmed by a feature with a much larger range than the others.
ML MODELING METHODOLOGY AND RESULTS Overview of ML Modeling Methodology The approach taken to build the training datasets and the ML models using the three algorithms—XGBoost, logistic regression and multilayer perceptron—and an overview of the data flow through the ML models and the output of those models is shown in Figure 9. The training dataset with the full set of features was split into train and test datasets (by creating 10 partitions) at approximately a 70/30 ratio. This train/test split was maintained for all of the models to allow for comparison of results. XGBoost models were prepared using both the non-imputed dataset containing missing lab values and the imputed dataset whereas logistic regression and multilayer perceptron models were prepared using only the imputed datasets as these cannot handle missing values. Preprocessing (e.g., one-hot encoding, scaling) as well as class balancing was performed in all datasets. Hyperparameters were tuned using the train dataset, and the final model was trained on the train dataset and evaluated on the test dataset. For the imputed datasets, the results were pooled via averaging per Rubin’s rulesliii (performing analysis on each imputed dataset and averaging the parameter estimates to obtain a single estimate so that the variance estimates would reflect the appropriate uncertainty surrounding parameter estimates) and plotted.

Training Data for Machine Learning (ML) to Enhance Patient-Centered Outcomes Research (PCOR) Data Infrastructure
ONC
31
Figure 9: Overview of ML Modeling Methodology
eXtreme Gradient Boosting (XGBoost) Model Two XGBoost models were built: one for the non-imputed dataset and one for the imputed datasets. The R libraries used for XGBoost modeling are shown in Appendix Table 3. The R package xgboost (version 1.3.2.1liv) was used for this project. Additional documentation for the parameters can be found in the XGBoost documentation: https://xgboost.readthedocs.io/en/latest/parameter.html. The parameters and their ranges that were selected for tuning, which include the default model values, are shown in Table 7. The parameters that were set for the XGBoost models outside of parameter tuning were:
• Setting scale_pos_weight as 3.5, which is the square root of the ratio of the negative class (survived the first 90 days of dialysis) and the positive class (died in the first 90 days of dialysis). This parameter handles the class imbalance by weighting the minority class (died in the first 90 days of dialysis).
• Setting the number of iterations as 100. • Setting early stopping rounds to 15, as evaluated using the highest receiver
operating characteristic (ROC) AUC. This parameter ends model training if the ROC AUC has not increased in 15 iterations.
Hyperparameters were tuned for the non-imputed dataset with a Bayesian optimization approach, and 5-fold cross validation was used to identify the optimal hyperparameters for the model. The best performing model was evaluated by the selecting the hyperparameter combination with the highest ROC AUClv. Hyperparameters were tuned for the imputed datasets using a two-tiered approach. First, Bayesian

Training Data for Machine Learning (ML) to Enhance Patient-Centered Outcomes Research (PCOR) Data Infrastructure
ONC
32
optimization and 5-fold cross validation were used for each imputed dataset to narrow the ranges for the hyperparameter space. The highest and lowest values for each hyperparameter over the 5 imputed datasetslvi were set as the new ranges to use in a random grid search. From the new hyperparameter space, 25 hyperparameter combinations were randomly generated and tested. For each hyperparameter combination, the prediction scores for each imputed dataset were averaged to result in one prediction per patient per Rubin’s rules. These averaged predictions were used to calculate a ROC AUC for each hyperparameter combination. The best performing model was evaluated by the selecting the hyperparameter combination with the highest ROC AUC. The optimal hyperparameters for each model are shown in Table 7 below.
Table 7: XGBoost Hyperparameters
Hyperparameter (model parameters) Parameter Description Range of
values
Optimal value (Non-imputed
model)
Optimal value (Imputed model)
NRounds Number of learning iterations for each model
10 to 500 497 493
Eta Learning rate .001 to .80
0.057 0.050
Depth Maximum tree depth in generating splits
2 to 10 6 7
Alpha Regularization parameters for L1-norm
0 to 9 6.230 7.273
Lambda Regularization parameters for L2-norms
1 to 9 8.318 8.207
Gamma Minimum loss for generating a split
0 to 9 5.474 2.937
Subsample Percent of observations sampled
.2 to 1.0 0.751 0.751
Colsample_by_tree Percent of features used .3 to 1.0 0.621 0.661
Min_child_ weight The minimum number of observations subtending from a node in the tree
1 to 5 2 2
Max bin Controls the maximum number of times the algorithm can split
255 to 1023
354 935
Using the set of optimal hyperparameters to run the final XGBoost models, the non-imputed XGBoost model achieved an AUC of 0.826 on the holdout test dataset and the imputed XGBoost model achieved an AUC of 0.827 on the holdout test dataset. The ROC AUC plots are shown in Figure 10.

Training Data for Machine Learning (ML) to Enhance Patient-Centered Outcomes Research (PCOR) Data Infrastructure
ONC
33
Figure 10: Area under the receiver operating characteristic curve (AUC ROC) Plots for XGBoost Models (a) Non-Imputed and (b) Imputed
The AUC is 0.826 for non-imputed XGBoost model (panel A) and 0.827 for imputed XGBoost model (panel B). The dashed diagonal line is the performance for chance prediction.
Interpreting which of the features in the training dataset are more important to the XGBoost models can be assessed through gain (the relative contribution of the feature to the model). A higher gain implies a feature is more important for generating a prediction. The top 10 ranked features for each model are shown in Table 8a and Table 8b. For both the imputed and the non-imputed models, the top two features are the same—eight of the features in the top 10 ranking are the same between the models. Table 8a: Feature importance for the non-imputed XGBoost model
Feature Gain 1 Age 0.145 2 Total length of inpatient stays 0.074 3 Time elapsed between first and
last inpatient claim 0.050
4 Received EPO (unknown) 0.037 5 Has maturing AVF 0.036 6 Serum Albumin 0.035 7 Institutionalized 0.027 8 Serum Creatinine 0.025 9 Patient documented to be
medically unfit for transplantation 0.024
10 Underlying cause of ESKD categorized as other
0.022
•
Table 8b: Feature importance for the imputed XGBoost model
Feature Gain 1 Age 0.158 2 Total length of inpatient stays 0.079 3 No maturing AVF 0.044 4 Received EPO (unknown) 0.036
5 Patient documented to be unsuitable for kidney transplant due to age
0.030
6 Under care of kidney dietician (unknown)
0.030
7 Time elapsed between first and last claim
0.024
8 Serum Creatinine 0.022 9 Albumin 0.022 10 Estimated GFR (eGFR) 0.022

Training Data for Machine Learning (ML) to Enhance Patient-Centered Outcomes Research (PCOR) Data Infrastructure
ONC
34
Overall, the imputed XGBoost model performed similarly to the non-imputed XGBoost model according to the AUCs, confusion matrix findings, and feature importance. The imputations did not significantly improve model performance for this specific use case and training dataset when imputing under the models assumed in this application. (For additional information, refer to the Missing Data Imputation section as well as Using imputed datasets in ML modeling and Imputation assessment under the Considerations section; links to the Implementation Guide and ONC GitHub can be found in the Resources section.)
Both XGBoost models were calibrated using a non-parametric isotonic regressor trained on 66% of the testing dataset (subsets 7 and 8, n=230,482), and evaluated on the remaining 33% of the testing dataset (subset 9, n=114,823). Calibration (reliability) curves were plotted to reveal each prediction score decile, the number of patients that fall into each decile, and the proportion of patients in each decile who actually died in the first 90 days following dialysis initiation. The calibration for the XGBoost non-imputed and imputed models are shown in Figure 11 and Figure 12.
Figure 11: Calibration plot for XGBoost non-imputed model predicted risks (a) Predicted risk by 10% intervals; (b) Predicted risk by decile

Training Data for Machine Learning (ML) to Enhance Patient-Centered Outcomes Research (PCOR) Data Infrastructure
ONC
35
Figure 12: Calibration plot for XGBoost imputed model predicted risks (a) Predicted risk by 10% intervals; (b) Predicted risk by decile
The XGBoost models were also evaluated for sensitivity and specificity at the predicted mortality risk cut-points of 10%, 20%, 30%, 40%, and 50%, given the overall population risk of 7.5% - the results are shown in Table 9a and Table 9b. With increasing risk thresholds, sensitivity progressively decreased, whereas specificity remained high and showed slight improvement. The positive likelihood ratio was highest at the 40% threshold, whereas the negative likelihood ratio was lowest at the 10% threshold.
Table 9a: Performance across predicted risk thresholds of 10% through 50% of the non-imputed model
Model Threshold Sensitivity Specificity Likelihood
Ratio (+) Likelihood Ratio (–)
True Positive
False Positive
True Negative
False Negative
.10 0.69 0.79 3.39 0.38 5,947 21,712 84,546 2,618
.20 0.39 0.93 5.82 0.64 3,394 7,229 99,029 5,171
.30 0.19 0.97 9.22 0.81 1,709 2,299 103,959 6,856
.40 0.12 0.99 12.85 0.88 1,036 1,000 105,258 7,529
.50 0.04 0.99 12.04 0.95 397 234 106,024 8,168 Table 9b: Performance across predicted risk thresholds of 10% through 50% of the imputed model
Model Threshold Sensitivity Specificity Likelihood
Ratio (+) Likelihood Ratio (–)
True Positive
False Positive
True Negative
False Negative
0.10 0.70 0.79 3.38 0.37 6,024 22,134 84,124 2,541 0.20 0.42 0.92 5.48 0.62 3,625 8,200 98,058 4,940 0.30 0.20 0.98 9.15 0.82 1,738 2,357 103,901 6,827 0.40 0.10 0.99 13.49 0.91 860 791 105,467 7,705 0.50 0.04 0.99 21.92 0.96 387 219 106,039 8,178

Training Data for Machine Learning (ML) to Enhance Patient-Centered Outcomes Research (PCOR) Data Infrastructure
ONC
36
Logistic Regression Model The logistic regression model was trained using the imputed datasets as inputs as the logistic regression model cannot contain missing values. The hyperparameters were tuned using grid search and 5-fold cross validation on each imputed dataset to identify to optimal set of hyperparameters as evaluated by the highest precision recall (PR) AUC. The logistic regression model and cross validation methods from the Python (version 3.6.9) library scikit learnlvii (version 0.24.1) were utilized (Appendix Table 4).
The hyperparameter ranges and optimal hyperparameters for the logistic regression model are shown in Table 10. Class weight was set as ‘balanced’ for the logistic regression model to handle class imbalance.
Table 10: Logistic regression hyperparameters
Hyperparameter (model parameters) Parameter Description Range of values Optimal
value Number of rounds Number of learning iterations
for each model 100, 1000, and 5000 1000
C Inverse strength of regularization (smaller = strong penalty)
-4 to 4 (on logscale)
0.1
Penalty Type of regularization L1, L2, Elastic Net L2
The final logistic regression model was trained on the training set of data using the optimal hyperparameters and resulted in a mean ROC AUC of 0.812 on the holdout test sets (from the 5 imputed datasets). The logistic regression ROC AUC plot is shown in Figure 13.
Figure 13: ROC AUC plot for the final logistic regression model

Training Data for Machine Learning (ML) to Enhance Patient-Centered Outcomes Research (PCOR) Data Infrastructure
ONC
37
The logistic regression confusion matrix showing the true positives, false positives, true negatives, and false negatives for the 5th imputed dataset is shown in Table 11. The logistic regression model does a better job of balancing sensitivity and specificity compared to the XGBoost models. The logistic regression precision metric shows that this model better predicts patients who died in the first 90 days (true positives) but also wrongly predicts more people who died (false positives).
Table 11: Confusion matrix and evaluation metrics for the logistic regression model
Model True positive
False positive
True negative
False negative
Sensitivity (Recall)
Specificity
Precision (PPV)
Likelihood Ratio
F1 Score
Logistic Regression 19,314 89,403 230,164 6,424 0.750 0.720 0.178 2.682 0.287
Feature importance can be assessed for logistic regression models by examining the magnitude of the coefficient. A larger magnitude implies the feature is more important for generating a prediction. A positive coefficient means the features are more important in generating a positive prediction (died in 90 days); a negative coefficient means the features are more important in generating a negative prediction (survived the first 90 days). The top 15 ranked features for the logistic regression model and coefficients from the 5th imputation dataset are shown in Table 12.
Table 12: Feature importance for the logistic regression model
Feature Coefficient 1 Has hospice claim 1.011 2 Under care of kidney dietician (missing) -0.513 3 Age 0.505 4 Prior nephrology care (missing) 0.229 5 Has inpatient claim 0.227 6 Under care of kidney dietician (unknown) 0.184 7 Albumin -0.181 8 Received EPO (unknown) 0.156 9 Access type (AVF) -0.152 10 GFR EPI 0.151 11 Has skilled nursing unit claim 0.145 12 Has outpatient claim -0.134 13 Primary disease causing ESKD/ESRD: detailed group (other) 0.120 14 Patient has/will complete training -0.120 15 Access type (missing) 0.117
Five feature categories overlap between the XGBoost models and logistic regression model: age, inpatient stay claims, received erythropoietin (EPO), albumin, and arteriovenous fistula (AVF).
• Age: older age is associated with worse survivallviii

Training Data for Machine Learning (ML) to Enhance Patient-Centered Outcomes Research (PCOR) Data Infrastructure
ONC
38
• Inpatient stay claims: longer inpatient stays are more common in older and sicker patients and has been associated with mortalitylix
• Received EPO: EPO hormone is produced by kidneys when it senses low oxygen levels in the blood. It triggers bone marrow to produce more red blood cells which raises blood oxygen. Since patients with kidney failure produce less EPO, EPO can be administered by a clinicianlx. Patients on EPO typically have advanced chronic kidney disease (CKD) at the time of dialysis and are under the care of a nephrologist.
• Albumin: Albumin reflects the patient’s overall health status (including nutrition and inflammation). The risk of death is increased by poor serum albumin levels reflecting inadequate nutritionlxi.
• AVF: The presence of an AVF indicates prior nephrology care. Hemodialysis through AVF access is associated with reduced mortalitylxii.
Multilayer Perceptron (MLP) Model The selection of MLP for this Project was based on discussions with TEP members. We specifically engaged one TEP member (Dr. Peter Chang) who provided guidance on the selection and implementation of a simple neural network as Dr. Chang hosts publicly available codelxiii to learn how to run a docker container on an Amazon Web Services (AWS) instance for neural networks using medical data. Dr. Chang's code was used as a template for the neural network implementation. Given the purpose of modeling in this Project is to provisionally test the training datasets, a simple neural network algorithm (MLP) was chosen for the predicting mortality use case. MLP does not require intense computation and would provide an example of applying a neural network for the training dataset. A docker container (similar to running code in a virtual machine so that it is easy to replicate on any computer or operating system) was used to run the MLP model in the AWS instance.
The multilayer perceptron model was trained and evaluated using the imputed datasets as inputs to a neural network model cannot contain missing valueslxiv. The hyperparameters were tuned using grid search 5-fold cross validation on each imputed dataset to identify the optimal set of hyperparameters as evaluated by the highest precision-recall AUC plots (PR AUC). The multilayer perceptron model was trained using the python (version 3.6.9) tensorflow (version 2.4.1lxv) library and cross validation methods were from the Python (version 3.6.9) library scikit learnlvii (version 0.24.1). (See Appendix Table 5 for additional information.)
The hyperparameter ranges and optimal hyperparameters for the multilayer perceptron model are shown in Table 13. TEP expertise was used to narrow down the ranges of hyperparameters tuned (the number of neurons, the kernel regularizer, epochs, and batch size) as testing all combinations of hyperparameters considerably increased run time for hyperparameter tuning. Early stopping callback was based on the maximum PR AUC and set to a patience of 10.
Table 13: Multilayer perceptron hyperparameters
Hyperparameter (model parameters) Parameter Description Range of values Optimal
value Neurons Number of neurons in the dense layer 16, 32, 64, 128 16
Kernel regularizer Regularization for the nodes in each dense layer
L2 L2

Training Data for Machine Learning (ML) to Enhance Patient-Centered Outcomes Research (PCOR) Data Infrastructure
ONC
39
Hyperparameter (model parameters) Parameter Description Range of values Optimal
value
Dropout rate Setting for the dropout layer to avoid overfitting
0.1, 0.2, 04, 0.5, 0.6 0.2
Learning rate Rate for the optimization algorithm to reach the local minima
1e-2, 1e-3, 1e-4, 2e-4
0.0002
Epochs Number of iterations over the full dataset 10, 20 10 Batch size Number of samples per gradient update 512, 256 256
Optimizer Algorithm used to update the model based on the data it sees and its loss function for optimizing the model
Adam, SGD (stochastic gradient descent), Adamax
Adam
Activation Activation function for the dense layer Linear, relu, sigmoid, tanh Relu Initial weights Weights based on data imbalance to help
model converge faster None, bias=-2.514 log(died_count/ survived_count)
None
Class weight Weights based on the imbalanced classes to apply to the loss function when training
Survived=1 Died = [6.68, 1, 5, 10, 20]
Survived = 1 Died = 10
Layers Number of dense layers to extract representations from the data
[1, 2] 2
The set of optimal hyperparameters were used to train the final multilayer perceptron model which resulted in a mean (ROC) AUC of 0.812 on the holdout test dataset from each of the 5 imputed datasets. The multilayer perceptron ROC AUC plot is shown in Figure 14.
Figure 14: ROC AUC plot for the final multilayer perceptron model

Training Data for Machine Learning (ML) to Enhance Patient-Centered Outcomes Research (PCOR) Data Infrastructure
ONC
40
The multilayer perceptron confusion matrix showing the true positives, false positives, true negatives, and false negatives for the 5th set of imputed data (an arbitrarily-chosen subset whose findings should reflect results across all imputations) is shown in Table 14. The multilayer perceptron model performs similarly to the logistic regression model—it balances sensitivity and specificity and better predicts patients who died in the first 90 days (true positives) but also wrongly predicts more people who died (false positives) compared to the XGBoost models.
Table 14: Confusion matrix and evaluation metrics for the multilayer perceptron model
Model True positive
False positive
True negative
False negative
Sensitivity (Recall) Specificity Precision
(PPV) Likelihood
Ratio F1
Score Multilayer Perceptron 18,474 78,948 240,619 7,264 0.718 0.753 0.190 2.905 0.300
RISK CATEGORIZATION Risk categorizations constructed from model prediction scores are oftentimes more helpful to clinicians, rather than the binary died or survived predictions. For the project, prediction score categories were constructed for the non-imputed XGBoost, logistic regression, and multilayer perceptron models by using the prediction score for each patient in the test datasets. (The non-calibrated XGBoost model was used for risk categories.) The model prediction scores, which range from 0-0.99, were stratified by decile. Table 15a, Table 15b, and Table 15c show the prediction score categories (by decile), the number of patients that fall into each category, and the proportion of patients in each category who actually died in the first 90 days following dialysis initiation. For example: XGBoost model predicted a score of 0.8-0.89 for 1,457 patients; of these patients, the proportion of patients who actually died within the first 90 days of dialysis was 0.575 (or 57.5%). The trends from all three models in Table 15a, Table 15b, and Table 15c below support the findings from the confusion matrices—the models predict survival more accurately than death.
Table 15a: XGBoost risk categorization
Prediction Score
Category
Count in Category
Proportion of patients (actually
died in 90) 0-0.09 148,693 0.011
0.1-0.19 75,410 0.043 0.2-0.29 44,315 0.084 0.3-0.39 29,430 0.138 0.4-0.49 20,283 0.192 0.5-0.59 13,228 0.257 0.6-0.69 7,967 0.336 0.7-0.79 4,098 0.446 0.8-0.89 1,457 0.575 0.9-0.99 417 0.842 •
Table 15b: Logistic regression risk categorization
Prediction Score
Category
Count in Category
Proportion of patients (actually
died in 90) 0-0.09 43,355 0.004
0.1-0.19 56,118 0.011 0.2-0.29 51,660 0.022 0.3-0.39 44,382 0.040 0.4-0.49 38,132 0.064 0.5-0.59 33,063 0.097 0.6-0.69 29,209 0.138 0.7-0.79 24,319 0.195 0.8-0.89 17,702 0.274 0.9-0.99 7,337 0.381 •
Table 15c: Multilayer perceptron risk categorization
Prediction Score
Category
Count in Category
Proportion of patients (actually
died in 90) 0-0.09 55,558 0.004
0.1-0.19 68,189 0.014 0.2-0.29 45,782 0.027 0.3-0.39 37,633 0.048 0.4-0.49 33,200 0.072 0.5-0.59 30,138 0.102 0.6-0.69 30,025 0.146 0.7-0.79 32,336 0.226 0.8-0.89 11,643 0.341 0.9-0.99 801 0.454 •

Training Data for Machine Learning (ML) to Enhance Patient-Centered Outcomes Research (PCOR) Data Infrastructure
ONC
41
As per kidney disease domain experts, these decile prediction score categories may be further grouped into risk categories such as low, medium, high rather than the binary died or survived predictions. Converting a specific prediction score to a risk category (low, medium, high) conveys a relative risk of dying in the first 90 days after dialysis initiation instead of an outright prediction and can yield improved clinical interpretability and meaning for providers and patients. However, for clinical validity and acceptability of such risk categories, input from clinical stakeholders (providers and patients) will be needed to establish various thresholds to define clinically useful categories.
FAIRNESS ASSESSMENT ML models can perform differently for different categories of patients. The performance of the non-imputed XGBoost, logistic regression, and multilayer perceptron models were assessed for fairness using area under the Receiver-Operator Characteristic curve (AUC), or how well the model performs for each category of interest (demographics— age, race, sex—as well as initial dialysis modality). (The non-calibrated XGBoost model was used so that the fairness assessment was performed on the same test dataset for all three models.) Since age is a continuous variable, age was binned into the following categories based on UCSF clinician input and an example from the literaturelxvi: 18-25, 26-35, 36-45, 46-55, 56-65, 66-75, 76-85, 86+. The USRDS predefined categories for race, sex, and dialysis modality were used for the fairness assessment. Fairness was assessed by calculating the ROC AUC for each category (fairness for the logistic regression and multilayer perceptron models was calculated using the 5th set of imputed data—an arbitrarily-chosen subset whose values should reflect results across all imputations) and are shown in Table 16a, Table 16b, Table 16c, and Table 16d. The XGBoost model fairness assessment AUC ranged between 0.798-0.840 for the categories evaluated whereas logistic regression and multilayer perceptron models show that the AUC decreases as age increases. (For additional information, refer to Fairness assessment under the Considerations section.)
Table 16a: Fairness assessment age categories
Category XGB AUC
LR AUC
MLP AUC Count
18-25 0.829 0.831 0.844 4,340 26-35 0.823 0.823 0.833 12,774 36-45 0.828 0.827 0.831 26,120 46-55 0.830 0.803 0.809 53,564 56-65 0.824 0.788 0.788 85,076 66-75 0.825 0.767 0.766 86,140 76-85 0.822 0.739 0.737 62,193 86+ 0.830 0.724 0.716 15,098 •
Table 16b: Fairness assessment race
Category XGB AUC
LR AUC
MLP AUC Count
White 0.826 0.802 0.802 230,577 Black 0.825 0.812 0.813 93,560 American Indian/ Alaska Native
0.798 0.805 0.806 3,225
Asian 0.828 0.837 0.835 12,965 Native Hawaiian or Pacific Islander
0.825 0.809 0.818 3,776
Other or Multiracial 0.821 0.776 0.791 881
Unknown 0.825 0.729 0.721 321 •

Training Data for Machine Learning (ML) to Enhance Patient-Centered Outcomes Research (PCOR) Data Infrastructure
ONC
42
Table 16c: Fairness assessment dialysis modality
Category XGB AUC
LR AUC
MLP AUC Count
Hemodialysis 0.825 0.802 0.802 310,415 CCPD (continuous cycling peritoneal dialysis)
0.819 0.831 0.836 15,082
CAPD (continuous ambulatory peritoneal dialysis)
0.829 0.842 0.848 13,295
Other 0.815 0.983 0.986 77 NA 0.840 0.726 0.750 6,436 •
Table 16d: Fairness assessment sex
Category XGB AUC
LR AUC
MLP AUC Count
Male 0.826 0.816 0.816 198,347 Female 0.825 0.803 0.803 146,957 •

Training Data for Machine Learning (ML) to Enhance Patient-Centered Outcomes Research (PCOR) Data Infrastructure
ONC
43
Considerations for Applying ML to PCOR and Health Care Use Cases Key activities of this Project focused on applying ML to PCOR and health care included selecting a use case, accessing data relevant to the use case, building high-quality training datasets and provisionally testing the training datasets using ML algorithms to build ML models that would address the selected use case. To address the goal of this Project to generate foundational outputs for enhancing PCOR infrastructure, valuable lessons-learned and best practices identified throughout the course of this Project were captured based on discussions with the TEP, IA and other stakeholders/experts and experiences of the Project Team. These are compiled in this Considerations section for future researchers to learn from and take into account as they apply ML to PCOR.
USE CASE AND DATA SOURCE SELECTION For applying ML in PCOR and health care, clinically compelling patient centric use cases should be identified first rather than tailoring a use case to an existing, easily accessible (open) dataset. From a patient centered perspective, ML is particularly useful to predict potential outcomes prior to decisions that patients, in coordination with their providers, must make regarding whether to undergo treatment, which treatment to choose, and how to address potential adverse events once a treatment choice is made. Key to implementing ML for such prediction use cases is access to EHR and clinical research data that has been already collected through federal funds and stored in various federally sponsored repositories.
At the initiation of this Project, upstream kidney disease use cases were considered based on discussions with the TEP, which included a patient advocate, who emphasized the need to move PCOR to focus on research prior to being diagnosed with kidney disease or earlier in kidney disease progression. Such use cases require access to EHR data, which offer high granular information on relevant features at the system-, provider- and patient-level. It is to be noted that EHR data are particularly useful for a broad range of use cases focused on kidney disease. However, the Project Team faced the following challenges in trying to access EHR data stored in multiple federal and private repositories in a timely manner to address an upstream kidney disease use case within the two-year project period:
• Data security concerns surrounding patient privacy and confidentiality • Contractual agreements with health systems that incur additional costs • Requirement for approval by ethical and other regulatory bodies, including the
Institutional Review Boards (IRBs), and the differing processes for such approvals across health systems and repositories
Therefore, for this project, the data source (USRDS) was selected before identifying the use case – predicting mortality in the first 90 days of dialysis. This use case focuses on the very end-stages of kidney disease (ESKD/ESRD); however, most patients with kidney disease suffer from cardiovascular-related death and experience other relevant adverse outcomes prior to reaching ESKD/ESRD. Future projects could focus on these upstream events.

Training Data for Machine Learning (ML) to Enhance Patient-Centered Outcomes Research (PCOR) Data Infrastructure
ONC
44
Accessing data from USRDS required submission of approval from an IRB – this was accomplished as the Project Team was composed of clinical experts from UCSF, and as an academic health research entity, the UCSF IRB was able to serve as the ‘IRB of record’ for this project. This raises an important consideration for future ML researchers – partnership with an entity that has its own IRB or approval from a commercial IRB, such as the WIRB-Copernicus Group, (WCG) IRB (noting additional costs for such IRBs) will be required to obtain EHR or clinical data for applying ML to PCOR focused use cases.
BUILDING THE TRAINING DATASET Access to data sources AI/ML applications have the distinct advantage of being able to utilize large amounts of real-world clinical data to support evidence-based decisions in clinical settings; however, access to such data is pivotal for realizing the promise of AI. As described in the Kidney Disease Use Case for the Project and Use Case and Data Source Selection sections, the Project encountered some challenges while trying to access EHR data for considering upstream kidney disease use cases. This raised key issues regarding accessing clinical data, including:
• The requirement of obtaining approval for accessing EHR data in a timely manner from an IRB to comply with human subjects protection regulations such that sufficient time remained to prepare the training datasets and ML models within the two-year timeframe of the project
• As noted earlier in the Use Case and Data Source Selection section, regulatory entities such IRBs differ in their stipulations and processes for accessing and handling EHR and other patient data. Stipulations may include the requirement that the data be de-identified of HIPAA identifiers prior to research use, as was the case for this Project, where the limited dataset obtained from USRDS were de-identified to include random-shift masking of dates and deletion of geographical variables (for additional information, refer to USRDS data de-identification under the Considerations section.)
• Integration of EHR data from multiple data sources (as supported fully by USRDS per researchers’ IRB of record, see next bullet) increases the power of AI/ML applications for clinical decisions; however, each data source may impose differing access requirements limiting the number of data sources and precluding the study of certain clinical use cases
• USRDS facilitates the integration of their datasets with externally sourced datasetslxvii; however, this requires providing USRDS with identifier variables, such as name, social security number, date of birth, sex and date of death, if available. Accessing data with such key patient identifiers is a greater challenge with many repositories and requires strong justification of the need for such datasets in order to meet both the source-repository and IRB approval requirements.
Future PCOR researchers should take into consideration these factors and explore the feasibility of use cases that can be studied especially recognizing the timeframe for their projects.
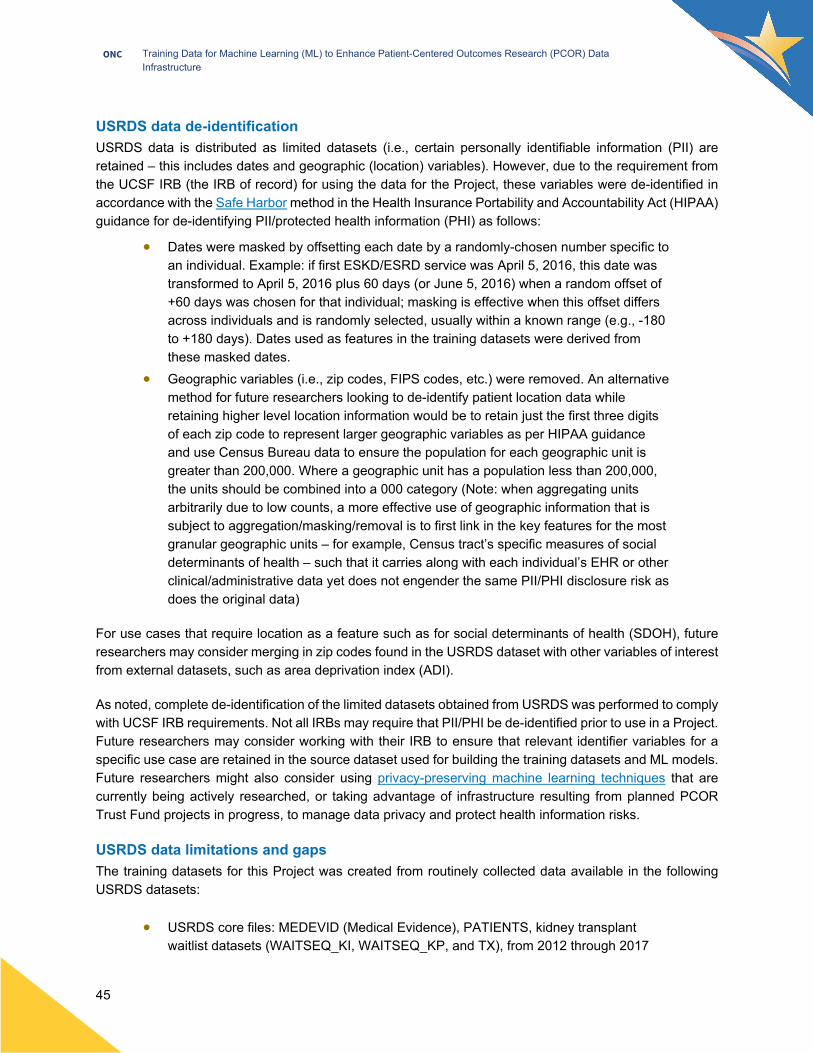
Training Data for Machine Learning (ML) to Enhance Patient-Centered Outcomes Research (PCOR) Data Infrastructure
ONC
45
USRDS data de-identification USRDS data is distributed as limited datasets (i.e., certain personally identifiable information (PII) are retained – this includes dates and geographic (location) variables). However, due to the requirement from the UCSF IRB (the IRB of record) for using the data for the Project, these variables were de-identified in accordance with the Safe Harbor method in the Health Insurance Portability and Accountability Act (HIPAA) guidance for de-identifying PII/protected health information (PHI) as follows:
• Dates were masked by offsetting each date by a randomly-chosen number specific to an individual. Example: if first ESKD/ESRD service was April 5, 2016, this date was transformed to April 5, 2016 plus 60 days (or June 5, 2016) when a random offset of +60 days was chosen for that individual; masking is effective when this offset differs across individuals and is randomly selected, usually within a known range (e.g., -180 to +180 days). Dates used as features in the training datasets were derived from these masked dates.
• Geographic variables (i.e., zip codes, FIPS codes, etc.) were removed. An alternative method for future researchers looking to de-identify patient location data while retaining higher level location information would be to retain just the first three digits of each zip code to represent larger geographic variables as per HIPAA guidance and use Census Bureau data to ensure the population for each geographic unit is greater than 200,000. Where a geographic unit has a population less than 200,000, the units should be combined into a 000 category (Note: when aggregating units arbitrarily due to low counts, a more effective use of geographic information that is subject to aggregation/masking/removal is to first link in the key features for the most granular geographic units – for example, Census tract’s specific measures of social determinants of health – such that it carries along with each individual’s EHR or other clinical/administrative data yet does not engender the same PII/PHI disclosure risk as does the original data)
For use cases that require location as a feature such as for social determinants of health (SDOH), future researchers may consider merging in zip codes found in the USRDS dataset with other variables of interest from external datasets, such as area deprivation index (ADI).
As noted, complete de-identification of the limited datasets obtained from USRDS was performed to comply with UCSF IRB requirements. Not all IRBs may require that PII/PHI be de-identified prior to use in a Project. Future researchers may consider working with their IRB to ensure that relevant identifier variables for a specific use case are retained in the source dataset used for building the training datasets and ML models. Future researchers might also consider using privacy-preserving machine learning techniques that are currently being actively researched, or taking advantage of infrastructure resulting from planned PCOR Trust Fund projects in progress, to manage data privacy and protect health information risks.
USRDS data limitations and gaps The training datasets for this Project was created from routinely collected data available in the following USRDS datasets:
• USRDS core files: MEDEVID (Medical Evidence), PATIENTS, kidney transplant waitlist datasets (WAITSEQ_KI, WAITSEQ_KP, and TX), from 2012 through 2017

Training Data for Machine Learning (ML) to Enhance Patient-Centered Outcomes Research (PCOR) Data Infrastructure
ONC
46
• Medicare pre-ESKD/ESRD claims data (for assessing the degree to which a patient has been prepared for dialysis) from 2008 through 2017
While the USRDS data provides the most comprehensive registry of data from CKD and ESKD/ESRD patients in the U.S., some of the limitations and gaps in the USRDS data identified by the Project Team are listed below for future researchers to consider when applying ML to other kidney diseases:
• The USRDS database captures data primarily on a selected population – those with ESKD/ESRD. Although some data are available for patients with pre-dialysis chronic kidney disease, such as clinical parameters and health care utilization, these data are limited to the Medicare population (aged 65 and older) and do not contain several other key clinical and PCOR variables that may be of interest to investigators.
• Longitudinal laboratory measures are not routinely collected in USRDS (i.e., lab values over time); therefore, the training dataset developed for this Project does not include this important set of information clinicians typically use to evaluate patient health and inform interventions. Merging USRDS data with EHRs would help to obtain the more comprehensive and longitudinal view of a patient’s health as they approach ESKD/ESRD. Other point-in-time laboratory variables recommended by project stakeholders to capture in the USRDS data include urine creatinine, phosphorus, calcium, and C-reactive protein (CRP).
• Racial-ethnic and socioeconomic-based health disparities in chronic kidney disease, including ESKD/ESRD, are well-recognized; however, data on patient-level socioeconomic variables and social determinants of health are somewhat limited within the USRDS database, thus could only be included through additional efforts by researchers who have resources needed to conduct a merged data request (https://www.usrds.org/for-researchers/merged-data-requests/).
• While USRDS data is the national registry for CKD and ESKD/ESRD, it does not capture certain subsets of patients (e.g., undocumented immigrants).
• An administrative limitation of ESKD/ESRD claims data is that patients do not quality for Medicare coverage on the basis of ESKD/ESRD diagnosis until after the 90 days of dialysis, and therefore do not have claims data for the first 90 days – the focus of the time period for the use case selected for this Project. Because of this administrative limitation, the Project did not use any features (variables), including death dates, from Medicare claims data after diagnosis with ESKD/ESRD. This limitation is also why USRDS primarily relies on death dates from CMS Form 2746 (ESKD/ESRD Death Notification) and supplements these death dates with data from other sources such as CMS enrollment dataset, CROWNWeb Events, etc. The hierarchy for constructing the death date for the PATIENTS dataset is available in the USRDS Researcher’s Guide. The ESKD/ESRD Death Notification Form is required for all patients with an ESKD/ESRD diagnosis who die regardless of whether they are eligible for Medicare coveragelxviii and is not considered part of CMS claims data. According to USRDS documentation, the ESKD/ESRD Death Notification Form captures the death date of over 99% of all patients who die.

Training Data for Machine Learning (ML) to Enhance Patient-Centered Outcomes Research (PCOR) Data Infrastructure
ONC
47
• The structure of the pre-ESKD/ESRD Medicare claims data can differ by incident year and claim type, so comparing the different schemas for the pre-ESRD claims is an important consideration to accurately construct one unified file for the pre-ESRD claims.
• The MEDEVID table provides two methods for documenting patient comorbidities: o A list of comorbidity categorical variables (the variables COMO_DIA,
COMO_CHF, etc.) and o A string that concatenates all the comorbidities marked as ‘yes’ in CMS Form
2728 (the COMORBID variable). Unfortunately, these two representations do not always agree perfectly. The training dataset created for this project utilized the list of categorical variables as the source for comorbidities. Future work could be performed to reconcile these two sources of comorbidity data.
• The data in USRDS are not mapped to common data elements (CDEs) standards such as the Systematized Nomenclature of Medicine (SNOMED) or Logical Observation Identifiers Names and Codes (LOINC) or to common data models (CDMs), such as Observational Medical Outcomes Partnership (OMOP) or the HL7 Reference Information Model. While one of the criteria for developing a high-quality training dataset is to use CDEs and CDMs, the training datasets prepared in this Project used the data elements and mappings that already existed in the USRDS core files (MEDEVID and PATIENTS) and Medicare pre-ESKD/ESRD claims data. Users of the USRDS data must be aware of the various caveats noted in the USRDS Researcher’s Guide in developing an analytical cohorts nested from the USRDS dataset to ensure selection of appropriate analytical approaches and interpretation of results
USRDS data format Each MEDEVID record is associated with a patient’s USRDS ID. However, multiple records/entries can exist for a single patient in the MEDEVID table as a form is resubmitted when a patient regains Medicare eligibility (i.e., due to transplant failures, etc.). Per the USRDS Researcher's Guide, the first MEDEVID entry should be selected for analysis. The MEDEVID table that was received for the project was exported from SAS as a .sas7bdat file and retains the order of patient records. However, the operations associated with importing a .sas7bdat file directly into a SQL database does not guarantee that the order of rows will be preserved. This was addressed in the project by first converting all .sas7bdat files received from USRDS to .csv format before importing the files into R for analysis (deduplication, cohort selection) and then saving the data to the SQL (PostgreSQL) database.
Additionally, the conversion to .csv allowed removing complex data structures and metadata stored in the .sas7bdat files (e.g., categorical variable encodings that are also documented in the USRDS Researchers Guide Appendix B and C) that cannot be imported into R or a PostgreSQL table.
Note: For other use cases, especially those requiring a longitudinal dataset, the multiple MEDEVID records per patient present in the MEDEVID table may need to be retained. Decisions on how to handle the duplicated data should be made with the proposed use case in mind.

Training Data for Machine Learning (ML) to Enhance Patient-Centered Outcomes Research (PCOR) Data Infrastructure
ONC
48
Feature selection Input from clinical experts is essential to ensure that the selection of the features for the training dataset is driven by a strong clinical understanding of the data and that variables that are operational factorslxix or ‘nuisance variables’ are excluded from the training dataset. Examples of operational factors include the date the physician signed the Medical Evidence Form, which reflects operational status and not a patient’s health status. Operational factors in the dataset can lead to two issues:
• Overfitting of the data, which should be managed by ensuring that the test dataset is representative of the entire dataset.
• Under-specifying the ML model (i.e., not being able to generalize outside of the source data), which will be managed by documenting variables that may be operational in nature vs clinical and measuring the extent that these variables contribute to the model. This can be performed as follows: o Use features identified as operational factors to predict the outcome variable and
assess a baseline AUC o Use features labeled as operational factors to predict clinical features as a
measure of impact
Operational factors were removed from the training datasets prepared in this Project. Working with clinicians throughout the feature selection process is crucial to determining that the final list of features is relevant for the use case being considered.
Mapping diagnosis codes to diagnosis groupings Each pre-ESKD/ESRD Medicare claim has an ICD-9/ICD-10 primary diagnosis code; these should be converted with clinician’s input into relevant disease groupings that can be used to create features with predictive value. It is difficult find a one-size-fits-all method for mapping diagnosis codes to meaningful categories as the categories are highly dependent on the use case. Future researchers may want to consider alternative disease groupings that are informed by clinicians and other health-care researchers.
Cleaning text data When cleaning text data for pattern matching, non-ASCII characters (e.g., umlauts or accents from foreign names of diseases) in the CMS source data should be removed or converted to ASCII in order to utilize certain functions used for pattern matching in text (e.g., the grep library in R)
Handling outliers and imputing missing data Although the data from USRDS is already curated, basic patient measures such as height and weight, and laboratory measures such as serum creatinine, albumin, and hemoglobin, contained unrealistic values. Clinicians should be engaged to determine which laboratory values are most vital in predicting outcomes and to define the minimum and maximum bounds of the values for each these measures.
Missing data are unavoidable in EHRs and other real-world data but have the potential to introduce bias and loss of information, leading to invalid conclusions. The multiple imputations by chained equations (MICE) package was used to handle missing values in this project. (Other imputation packages, such as the multiple imputation (MI) and Amelias package, can also be used for the imputations; specialized applications, such as comparative effectiveness studies or probability-sampling-based cohorts in machine

Training Data for Machine Learning (ML) to Enhance Patient-Centered Outcomes Research (PCOR) Data Infrastructure
ONC
49
learning, could leverage correspondingly specializes packages that accommodate the specific context – such as multiple imputation accommodate missing exposure or confounder values of propensity-score-matched cohorts, as done by https://www.rdocumentation.org/packages/MatchThem/versions/0.8.1.) In general, the multiple imputation method chosen should balance the trade-off between accuracy and run-time, especially for large datasets (greater than one million observations). If using multiple imputations by chained equations (MICE) package, multiple methods should be tested to determine accuracy and run time. For example, predictive mean matching (PMM) has the advantage of always imputing within the upper and lower bound of the variable whereas the norm method does not. However, in an older version of the MICE library, PMM was impractical for large datasets since PMM run-time scaled more than linearly with dataset size whereas norm scaled approximately linearly. An updated MICE package was released in November 2020 which improved the run-time for the PMM method so that it is comparable to the ‘norm’ method. Therefore, the imputation method in this project was updated from norm to PMM.
For derived variables such as BMI (from height/weight), or eGFR (from demographic characteristics) that were imputed, future researchers should note that these are typically imputed more efficiently and without severe inconsistencies when ‘passive imputation’ is employed. However, the literature on this topic is complex; handling derived variables via passive imputation through FCS (fully conditional specification) models can yield biased estimates if the imputation model is not compatible with the substantive modellxx. Because the approach followed in this study may not be applicable to other use cases, the practitioner is advised to follow published guidelines for constructing and checking imputation modelslxxi.
Reproducibility A seed should be set whenever running code that uses any kind of sampling method (e.g., MICE), in order for the code to be reproducible by other researchers. If a seed is not set prior to running the sampling function, the code will not produce the same results when it is rerun.
Kidney transplant patients Kidney transplant events occurred in 0.5% of patients in the study cohort of 1,150,195. Since only a small percent of patients had the competing outcome of kidney transplant, there is likely only a small effect of these patients on the outcome estimates. Future work could exclude these patients from the analysis (censoring patients) or explore the effect of the competing outcome (kidney transplant versus whether a patient dies in the first 90 days after dialysis initiation) on estimates using methods that account for this event, at least within the subset eligible for transplant per available data (a key patient-centered question for joint patient-clinician decision making). For example, a Fine-Graylxxii
lxxiii
lxxiv
competing risk model could be applied to the predictors selected by the ML model. A competing risk regression model (e.g., cmprsk::crr in R) could be appropriate when gauging risk by a sub-distribution hazard, as it corresponds with the non-parametric cumulative incidence function (preferred in clinical research to the Kaplan-Meier estimate ), while other methods may be of more of interest if examining a cause-specific hazard when the cause of interest is subject to a competing risk ,lxxv; this latter situation doesn’t assume the cohort is ”invulnerable” to competing risks, instead quantifying risk of ‘targeted‘ event for subjects also capable of experiencing a competing event (continuing the example above, cause-specific hazard of death among those eligible for a transplant when transplant is viewed as a competing risk for mortality-during-dialysis in transplant-eligible ESKD/ESRD patients).

Training Data for Machine Learning (ML) to Enhance Patient-Centered Outcomes Research (PCOR) Data Infrastructure
ONC
50
Train/test split The TEP recommended considering an alternative method to using a train/test split called bootstrapping to “simulate” an internal test set instead of using a train/test split. (Similarly, k-fold cross-validation on the entire dataset can be used to simulate internal test sets.) Although these approaches would allow for more data to be used in model training, the data used for this project seems sufficiently large (N > 1 million observations) to use a fixed test set. Future researchers working with a smaller dataset could consider using a bootstrapping approach or an overarching k-fold cross validation approach to increase the size of the training data for ML.
BUILDING ML MODELS Algorithm selection for the Project XGBoost was initially chosen as the model due to its ability to model with sparse data/missing values, as well as its performance over other algorithms in clinical use cases. The TEP recommended considering different classes of algorithms, such as parametric algorithms (logistic regression) as well as the non-parametric algorithms (XGBoost) and implementing a neural network. Thus, a logistic regression model and a multilayer perceptron model (an artificial neural network) were selected for modeling in addition to XGBoost. Some of the general considerations for selecting an algorithm include characteristics of the training dataset (tabular data vs image data, number of features, etc.), algorithms that have performed well in a specific domain area (kidney disease/clinical use cases), and available computational resources (for example, deep learning algorithms require intense compute resources).
Limitations of the ML models developed in this Project The project used USRDS data and it is possible that some of the factors affecting mortality in the first 90 days of dialysis may be found in EHRs, which are not included in the USRDS data. Also, the 90-day mortality outcome was predicted using USRDS data available from patients on or prior to being diagnosed with ESKD/ESRDlxxvi, who progressed to ESKD/ESRD. This means that the ML models predicted an outcome conditional on ESKD/ESRD. In other words, the model is applicable only to those having ESKD/ESRD. Future extensions of this work could merge USRDS data with EHR data to be able to predict progression to ESKD/ESRD or incorporate patient-centered features from EHR data to better predict mortality in the first 90 days after dialysis initiation.
Environment and speed Run time for hyperparameter tuning and for ML models differ with the type of ML algorithm and the number of hyperparameters selected. In this project, it was preferable for the non-imputed XGBoost and logistic regression models and necessary for the imputed XGBoost and multilayer perceptron models to provision high speed computing environments for the dataset and take advantage of parallel processing in order to complete the model hyperparameter tuning in a timely manner. Future researchers should consider algorithm run time when choosing the hyperparameters to be tuned, especially for tree-based models and neural nets which have large hyperparameter spaces. (For additional information, refer to Hyperparameter tuning under the Considerations section.)
Class imbalance for the outcome variable Clinical data oftentimes have class imbalances such as what was observed in this Project where the positive class (patient who died) was 7.5% vs the negative class (patients who survived) was 92.5% in the selected

Training Data for Machine Learning (ML) to Enhance Patient-Centered Outcomes Research (PCOR) Data Infrastructure
ONC
51
cohort size of 1,150,195. Neither logistic regression nor multilayer perceptron models perform well without additional tailoring when the outcome variable is imbalanced (or heavily skewed towards one outcome). Class imbalance was addressed in this Project through setting a model weighting parameter that applies a stronger penalty to the model when the minority class is incorrectly classified and a weaker penalty when the majority class is incorrectly classified. Balancing the data ensures that the models have sufficient data from both outcome classes (died vs. survived) on which to train. This results in a better trade-off between the model evaluation metrics of sensitivity and specificity. (For additional information, refer to Fairness assessment under the Considerations section.) Other ways to handle class imbalance that could be explored include: oversampling, undersampling, data augmentation via methods like synthetic minority oversampling technique (SMOTE)lxxvii, etc.
Preprocessing data One-hot encoding the categorical variables is preferable to numeric encoding (casting categorical encodings as numeric) as it is a better numeric representation of ordinal variables. However, one-hot encoding increases the total number of variables in the training dataset which increases run time. For this reason, features with more than five categories should not be one-hot encoded.
The approach used to handle missing values is dependent on the dataset and the features in the dataset. Clinical expertise is crucial in understanding the impact of missing values and whether or not they should be imputed, removed, or replaced.
Standardization and scaling Standardization and scaling of numeric features allow for comparison of multiple features in different units and for the penalty (such as L1) to be applied more equally across the features. The model learns the importance of features better and faster when it is not overwhelmed by a feature with a much larger range than the others. It is important to keep the test dataset separate from the training dataset when scaling, otherwise the model obtains information from the test dataset which causes an invalid evaluation of the model.
Hyperparameter tuning Consider running benchmark tests on a fewer number of iterations to gauge the run-time per iteration. Hyperparameter tuning in a model with a large hyperparameter space, such as for gradient boosted decision trees, can be computationally and time intensive. This approach allows the user to estimate the time to completion for the hyperparameter tuning script.
Hyperparameter tuning for the non-imputed XGBoost model and the logistic regression model only required an instance with 65 GB of memory, whereas hyperparameter tuning for the imputed XGBoost model required more memory (192 GB). The number of cores (24) was also upgraded for the imputed XGBoost model which helped to improve the computation time. The model utilizes parallel processing which uses all available cores/CPUs. It took approximately five days to run the entire code for the Imputed XGBoost model.
For the multilayer perceptron model, an environment with GPUs was utilized for tuning a large number of hyperparameters. If multiple cores or a GPU is not available, choosing only a few hyperparameters to tune at one time or using one imputed set of data to tune hyperparameters may be considered. These approaches reduced computational time while effectively tuning the parameters for the multilayer perceptron model.

Training Data for Machine Learning (ML) to Enhance Patient-Centered Outcomes Research (PCOR) Data Infrastructure
ONC
52
For the imputed XGBoost model, Bayesian optimization was used to narrow down the hyperparameter ranges for a pooled approach to hyperparameter tuning. Using Bayesian optimization to limit the hyperparameter space reduced the time required to run a pooled approach for hyperparameter tuning for the imputed datasets. Using a random grid search on these narrowed hyperparameter ranges allowed the model prediction scores from each imputed dataset to be pooled for each hyperparameter combination. This produced one AUC and resulted in a much shorter compute time to identify the optimal hyperparameters.
Model evaluation Different evaluation metrics can be chosen to determine the optimal set of hyperparameters, such as optimizing on precision-recall (PR) AUC or model calibration. The decision of the metric on which to optimize should be made in conjunction with clinical experts and will depend on the goal of the model. Due to the severe class imbalance (approximately 7.5 percent of patients died in the first 90 days), the Area under the ROC (receiver operating characteristic) curve (AUC ROC) tends to be high while recall (sensitivity or 'how many true positives did we get correct?') is low. It is well-known that PR AUC are more informative than AUC ROC plots when training a binary classification model on severely imbalanced data—based on this, the average precision metric from sklearnlxxviii was used in this project to tune hyperparameters for the logistic regression and multilayer perceptron models. It is important to obtain input from clinicians to understand what is most important to predict correctly when choosing a metric (more than one metric can be used in most libraries, e.g., tensorflow, sklearn). Future work in this area includes using reliability (or calibration) as the evaluation metric for maximum applicability to clinicians. [Examples of recommended questions to ask clinicians: Is it more important that we catch as many of the positive (died) class as possible (recall)? Is it more important that we minimize incorrectly classifying someone in the positive (died) class (precision)?]
Using imputed datasets in ML modeling In this Project, each imputed dataset was used for modeling and the resulting model estimates were averaged as per Rubin’s rules as described in the Overview of ML Modeling Methodology section. The TEP suggested an alternative approach of averaging the imputed values across imputed datasets prior to performing ML model and suggested that in some settings it could improve model performance; however, this approach does not account for the increased variance resulting from missing data uncertainty and may result in underestimated standard errors and overly confident variable selections, thus was not used in the Project.
Imputation assessment Model performance of the non-imputed XGBoost model fit and multiply-imputed XGBoost model fit were compared to determine if multiple imputations for the missing and out of bounds laboratory values present in USRDS data would improve the performance of the XGBoost model. The comparison demonstrated no difference in model performance between the imputed and the non-imputed XGBoost models. Future researchers can improve upon the imputation model by imputing features with methods that assume missing values that are missing not at random (MNAR) or even alternate missing a random assumptions that entail higher-order interactions and varying functional forms than those used by this Project, to assess impacts on prediction with a more complex imputation model.

Training Data for Machine Learning (ML) to Enhance Patient-Centered Outcomes Research (PCOR) Data Infrastructure
ONC
53
Feature importance for MLP Feature importance for the multilayer perceptron model was not assessed as neural nets do not have pre-defined feature ranking like XGBoost (gain, cover, etc.) or logistic regression (coefficients). Future work can determine feature importance for neural network models through a process called ablation, which is to run the model after selective removal of features to test feature importance. The features that cause the greatest decrease in accuracy would be the features that are the most important to the neural network model.
Fairness assessment Performing a fairness assessment gives additional insight into how a model performs by different patient categories of interest (e.g., by age, sex, race, geographic localities in an alternate USRDS data pull, etc.). Future researchers should perform fairness assessments lxxix to better evaluate model performance, especially for models that may be deployed in a clinical setting. Other methods of assessing fairness include evaluating true positives, sensitivity, positive predictive value, etc. These evaluation metrics better capture the fairness of the model across different categories of interest, especially for imbalanced outcome variables. Additionally, evaluating these metrics at various threshold across the different groups of interest would allow for the selection of a threshold that balances model performance across the groups of interest.

Training Data for Machine Learning (ML) to Enhance Patient-Centered Outcomes Research (PCOR) Data Infrastructure
ONC
54
Recommendations for Supporting the Future Application of ML to Health, Health Care, and PCOR This Project was designed to generate foundational knowledge that would serve to advance AI/ML applications by future PCOR and health care researchers. This knowledge was captured throughout the course of the project as recommendations from two sources – the detailed input and considerations provided by the stakeholders assembled for this Project, specifically the TEP, and the experience and challenges encountered by the Project Team while building high-quality training datasets and ML models for the selected kidney disease use case.
Many of the recommendations were incorporated into the Project during the preparation of the training datasets and ML modeling. Those that were not addressed in the Project due to various considerations including scope and schedule, are included below and fall into two categories:
• Strategic industry-wide recommendations for broader application of AI/ML in PCOR and health care
• Tactical, more pragmatic recommendations that can be implemented by other PCOR researchers to build upon the training datasets and ML models developed in this Project
STRATEGIC RECOMMENDATIONS Recommendation 1: An industry-wide strategy is necessary to address the ongoing challenge of accessing data in a timely manner, specifically EHR data, for applying AI/ML to important clinical use cases that can significantly impact patient-provider decisions and advance PCOR.
This project focused on building high-quality training datasets was initiated to address the specific challenge of the lack of high-quality training data from which to build and maintain AI applications in health, that was identified in the JASON report on Artificial Intelligence for Health and Health Careiii. The project constructed high-quality training datasets for the use case of predicting mortality in the first 90 days of dialysis using CMS clinical and claims data available from USRDS, the national registry for CKD and ESKD/ESRD patients.
At project initiation attempts were made to obtain EHR data from various federal and private sources to address upstream clinical use cases that the TEP had prioritized for the project. These attempts were aborted as the estimated time required to obtain EHR data did not align with the overall project timeline due to the lengthy process of IRB approvals and establishing data use agreements. This led to the project pivoting to first selecting a data source that could provide timely data (i.e., USRDS) and then identifying a use case for preparing the high-quality training dataset. This experience highlights two issues with developing and advancing AI/ML applications for patient centered clinical decision support tools:

Training Data for Machine Learning (ML) to Enhance Patient-Centered Outcomes Research (PCOR) Data Infrastructure
ONC
55
1. Institutional Review Board (IRB) approval requirements for accessing EHR data necessitates partnership with academic institutions: Sources that provide EHR data require approval from an IRB to ensure that the research plan is compliant with HIPAA and human subjects protections regulations. Most industry or private organizations do not have an IRB to review their research studies from a human subjects protections perspective and are required to partner with academic institutions. IRBs at these institutions are often overloaded with applications pending their review and approval; therefore, the time taken to obtain approvals must be taken into account when planning projects that use external data sources.
2. Patient centered use cases must drive the selection of data sources and not vice versa: While there is growing evidence that clinical decision tools based on AI/ML applications have increasing utility and have the potential to exceed human predictive powerlxxx, the development of such patient-centric tools can only be facilitated if the data necessary for addressing the use case is accessible by the broader research community without major data sharing obstacles (for example: requirement for IRB approval to access data, de-identification requirements imposed by IRBs especially when the data recipient is a HIPAA non-covered entity, challenges with merging data from multiple sources due to inconsistent data structure and formats, etc.)
The issues surrounding access to data, specifically EHR, are well documentedlxxxi lxxxii lxxxiii
lxxxiv. Some agencies such as NIH, are making strides in adopting Findability, Accessibility, Interoperability, and Reusability (FAIR) principles to ensure federally funded registries and repositories are making the dat
lxxxv lxxxvi
lxxxvii lxxxviii lxxxix. This is encouraging
, , . A report from a 2019 roundtable held by the Center for Open Data Enterprise (CODE) and the Office of Chief Technology at HHS that brought together stakeholders from across the government, industry, non-profits, and academia to discuss sharing and utilization of health data for AI highlighted the siloed and administrative hurdles to share data even among HHS agencies, with access to data taking up to 1.5 years
a accessible for meaningful use to qualified researchers. New approaches such as federated learning and split learning have been proposed that obviates the need for sharing or access to external data while enabling collaborative ML whereby multiple collaborators train the same model using their ‘own’ data to yield high-quality models. This approach still has privacy risks, as model parameters must be shared among the collaborators to some extent, which can potentially be used to help deduce characteristics of the training data. From a PCOR perspective, multiple recent studies have shown that most patients are willing to share data with health researchers provided adequate privacy and security protections are in place , , – for if the patients are willing to share their data, it behooves the researchers who are collecting patient data to also share within the bounds of appropriate privacy and security controls. Such controls could include role based accessxc and virtual data enclavexci among many other mechanisms. Data sharing must become common place within the health and clinical research ecosystem to address clinically compelling use cases that are patient-centric. It is imperative, therefore, that an industry-wide strategy be developed to address the recurring barriers that exist today for accessing data in a timely manner and in turn promote reaping the full benefits from AI/ML for health.
Recommendation 2: Ensure that a base set of widely used data elements such as demographics, clinical conditions and history, basic laboratory measures and values, clinical outcomes, etc. are captured comprehensively, completely, and accurately in national registries that serve as data sources for AI/ML applications

Training Data for Machine Learning (ML) to Enhance Patient-Centered Outcomes Research (PCOR) Data Infrastructure
ONC
56
The quality of a training dataset is dictated by the quality of the source data used for preparing the training dataset. Critical training dataset features (variables) that are required to address the clinical use case employed for preparing prediction models need to be available, accurate and complete, in the source data files. As observed in this project, for the selected use case of predicting mortality in the first 90 days of dialysis, variables such as urine creatinine were not available, a high percent of lab values such as serum creatinine (approx. 20%) and albumin (approx. 35%) were missing, 0.5 percent to 2.3 were outliers, many of the core lab values had outliers, and duplicate observations (rows) and values (columns) were observed in the USRDS data files for the period of 2008—2017. Inconsistent formats for data and metadata were also noted—for example, MEDEVID data records comorbidities in two ways—one in the string COMORBID, the other in a list of categorical variables. These two sources do not agree perfectly with one another, so the training dataset incorporates both as data.
It is well-known that data munging—cleaning and preparing the data to a usable format—accounts for as much as 60-80% of the time spent by data scientists during building machine learning models xciii. The missing or discrepant values are for laboratory data that are commonly collected and required to address most clinical research questions. Imputing missing and outlier values for such critical training dataset features can introduce subjectivity and bias and can lead to prediction models that are not translatable to real world situations. Ensuring that data sources store and share data that are of high quality for AI/ML applications will require funders of these repositories to establish quality requirements that data collectors and providers must adhere to, given the high degree of time and cost expended to retroactively clean the data for advanced analytics. Besides addressing the quality of data, such requirements must also include a base set of data elements that are relevant for both general and specialized repositories targeted for specific disease such as the USRDS. To the extent possible, the data stored in these repositories must be based on common data elements (CDEs) and terminology standards, and implementation of such a requirement is driven by how the data are collected. Health systems and clinical study investigators must consider using CDEs and standards right at the outset as they are planning the study and preparing data collection instruments. Use of such standard elements across health systems will contribute significantly to raising the quality of data and ensuring the development of more robust AI/ML applications.
xcii,
Recommendation 3: Engagement and close collaboration between AI/ML practitioners and clinical domain experts with AI/ML understanding are critical when developing prediction models that could potentially be deployed to support provider-patient decisions.
ML models that are patient-centered and have the potential to be deployed in the clinic as clinical decision support tools require input from clinical domain experts early and often. The goal of such intelligent tools is to augment clinical decisions and potentially standardize clinical care based on individual patient characteristics thereby enabling precision medicine. The CPMAITM methodology employed by this project (Figure 1) shows that the process starts with clinical research understanding to select the use case—this is an important step where the clinician is offering a dual perspective—in their caregiver role as well as of the patient who is at the center of the use case, validated by patient representative in TEP. Input from clinical domain experts is not a one-time event, however. Every subsequent step in the CPMAITM methodology is highly iterative where ML experts and clinical domain experts vet the development of the training dataset and ML model in the context of the real world and the machine world.
Clinical domain experts from the Kidney Health Research Collaborative (KHRC) at UCSF for this project were instrumental in identifying a use case that could utilize the USRDS dataset, engineering features for

Training Data for Machine Learning (ML) to Enhance Patient-Centered Outcomes Research (PCOR) Data Infrastructure
ONC
57
the training dataset, assisting with handling missing and outlier values for features relevant to the use case, and contextualizing and interpreting the results from ML modeling. Deployment to the clinic of ML based clinical decision support tools and continuous improvement of the tool even after deployment require buy in, not just from the clinicians who were involved in the development, but also from the broader physician base, which is yet another critical piece of engaging clinicians. While ML researchers working closely with clinical experts is critical, it is also important to take advantage of what an ML model may detect that is not already known clinically. Current work in AI/ML should pave the way for better understanding of purely data-driven analytics, while also validating these results with clinical evidence and understanding.
Effective collaboration with clinicians will require that they have a solid understanding of AI and ML and are able to translate the findings from modeling to a deployable tool. Currently, many of the clinicians are not adequately prepared to support AI/ML application development and will need to undergo additional trainings focused on data science methods and health informaticsxciv.
Recommendation 4: A standardized framework with checklists and best practices for prediction modeling and standardized metrics for evaluating ML models for addressing clinical use cases that have the potential to be deployed in the clinic will further expand the applications of AI/ML in health care more broadly
In conducting foundational work to facilitate future applications of AI/ML and enhance PCOR data infrastructure, this project employed the standard the CPMAITM methodology (Figure 1) widely used in the data science field. While this methodology helps to delineate the overall process for building training datasets and ML models, the exact requirements/specifications for each step along the process is not available and is subjective and varied among ML modelers. For example, a hotly debated field in ML is how to handle missing values and whether to impute or not impute—if the decision is made to impute the missing values (say because the chosen algorithm such as logistic regression or multilayer perceptron cannot have missing values in the dataset)—the question is which imputation method should be used. Subjectivity (and therefore bias), arises because the imputation method chosen can determine the predictive performance of the model; on the other hand, bias can enter when choosing not to impute if the probability of missingness depends in some way on other observable features. Subjectivity and variation are inherent at every step of the methodology for building the training dataset and ML model. A key byproduct of this subjectivity and variation is that while there are multiple prediction models that have been developed to-date, it is not possible to compare one model with the otherxcv. Performance metrics vary widely across studies and include AUC/ROC, AUC/PR, sensitivity, specificity, positive predictive value, etc., with no single standard metric that has been established to-date that can be applied across all models for a head-to-head comparisonxcvi.
For this project, extensive research of the literature, discussions with AI/ML experts (specifically the TEP), and explorations of alternate methodology options were undertaken throughout the course of the project to determine the specifications for the training datasets and models that were developed. Many projects do not have the resources (cost and time) or the availability of a TEP. Developing clinical prediction models that can potentially be deployed to patient care would necessitate, and greatly benefit from, the development of a standardized ML framework with a comprehensive checklist of requirements and best practices along with consistent metrics for evaluating ML models. Examples of approaches for building such a framework include the Transparent Reporting of a multivariable prediction model for Individual Prognosis Or Diagnosis for ML (TRIPOD-ML)xcvii
xcviii and the more recently published 20 critical questions for TREE
(transparency, reproducibility, ethics, and effectiveness) in ML. The adoption of a standardized ML

Training Data for Machine Learning (ML) to Enhance Patient-Centered Outcomes Research (PCOR) Data Infrastructure
ONC
58
framework across HHS agencies will pave the way for future PCOR and other researchers to advance AI for patient care in a more systematic and efficient manner
TACTICAL RECOMMENDATIONS BASED ON PROJECT OUTPUTS Various stakeholders for this Project including the TEP, IA, ONC, and NIDDK provided recommendations for future work that builds off the current project – these are categorized into those relevant to the training dataset and those relevant to the ML models.
Recommendations for future use of the training datasets Recommendation 1: Author a paper that demonstrates that the lack of access to EHR data is holding back the health care system and researchers in making improvements in early stage kidney disease care
This recommendation was proposed by the TEP as a result of the challenges of accessing EHR data for clinical research questions related to early stage kidney diseases that were being considered for the Project. Performing the research and analysis and developing a white/scientific paper was out of scope for the Project. However, ONC in coordination with future researchers might consider authoring such a paper and developing recommendations to address more broadly the current limitations of the type of clinical research questions that can be studied stemming from the lack of access to EHR data.
Recommendation 2: Integrate EHR data with USRDS data to address other compelling clinical use cases
The scope of this current project focused solely on USRDS data for reasons discussed earlier but primarily due to the timely accessibility for performing the Project within the two-year period. EHR and other public and private data sources that were identified with the TEP include the Dialysis Outcomes and Practice Patterns Study (DOPPS), Nephrotic Syndrome Study Network (NEPTUNE), NIH’s All of Us, Kidney Precision Medicine Project, VA Million Veteran Program (MVP), FDA Adverse Event Reporting System (FAERS), and various patient registries. More recent data sources that could be considered include the National COVID Cohort Collaborative (N3C) and the Consortium for Clinical Characterization of COVID-19 (4CE). Future researchers can integrate data from these sources with the data used for this Project from USRDS to expand the training datasets developed in this Project for other clinical use cases.
Recommendation 3: Use the datasets from smaller studies (e.g., special studies) available in USRDS to create additional features for a more limited patient cohort.
This Project aimed at preparing a training dataset with the broadest set of clinically relevant features for the use case of predicting mortality in the first 90 days of dialysis. Data from special studies in USRDS are limited to specific research questions such as the impact of dialysis dose on morbidity and mortality, and assessment of rehabilitation/quality of life/nutrition on dialysis patients. The data from these studies were therefore not used in this Project as it would have reduced the size of the patient cohort, without more elaborate approaches for handling missing data and other forms of selection bias. Based on the target use cases, future PCOR researchers could consider using data from these special studies in USRDS to build training datasets with appropriate clinically relevant features.
Recommendation 4: Construct features relating to social determinants of health (e.g., area deprivation index (ADI), mean household income, etc.); use ADI as a control for latent socioeconomic factors as an unbiased way to incorporate location information.

Training Data for Machine Learning (ML) to Enhance Patient-Centered Outcomes Research (PCOR) Data Infrastructure
ONC
59
As a requirement from the IRB of record that provided the approval for obtaining access to USRDS data, the Project Team de-identified the data by removing geographic variables such as zip codes, FIPS codes (such de-identification requirement by certain IRBs is to be noted especially when project team members are from a HIPAA non-covered entity). ADI was therefore not included as a feature in the training datasets prepared in this Project. Future researchers may consider merging in location data found in the USRDS dataset with other variables of interest, such as ADI, and construct features relevant to social determinants of health; use of non-masked (offset) dates may also allow incorporation of time-trends in changes of these determinants longitudinally. Furthermore, using ADI as a control for latent socioeconomic factors may be an unbiased approach to incorporate location information as it evolves for each locality over time.
Recommendation 5: Assess the impact of operational factors (nuisance variables not related to overall health on an individual basis) if present as features in the training dataset on the performance of the model.
Operational factors, or nuisance variables, in the training dataset such as location, time of day the lab samples/results were prepared, day of a physician’s signature, etc., can lead to bias in the performance of the model if not generalizable in some way to subgroups of interest for the task at hand (as they may be for social determinants of health, system-level process improvement, and the like). Future researchers should take care to properly understand the relationship between potential operational factors and the outcome variable before including them as a feature in the training dataset. Two important considerations for future researchers when assessing operational factors include:
• Identify true nuisance variables only after performing descriptive statistics of the data to look for patterns
• Distinguish the role of location (and possibly time-within-location) as an important feature for social determinants of health vs an operational factor.
Recommendation 6: Perform additional analysis that provides information on the inherent bias of the datasets, such as the differences between patient data captured in one database versus other data sources that capture the same variables for a patient but observe different distributions.
Real world data often have inaccuracies between databases leading to different distributions of the same variables for the same patient. Since this Project only utilized data from one source (USRDS), relationship between different variables was not assessed. Future researchers with access to multiple databases could compare the data captured in each data source and discover relationships between different variables using ML modeling.
Recommendation 7: Imputations can be used to enrich datasets but only after determining which imputation methods/rules are appropriate.
Real world datasets used in health, health care, and PCOR research often contains missing data due to data collection errors, missing data, or unrecorded data elements, etc. As such, data imputations are an important tool used to enrich datasets with such missing values; however, researchers should validate that their missing data assumptions (i.e., missing completely at random—MCAR, missing at random—MAR, missing not at random—MNAR, etc.) fit the assumptions/requirements for the imputation methodologies that are being considered to ensure that the analytic results using imputed data are valid.

Training Data for Machine Learning (ML) to Enhance Patient-Centered Outcomes Research (PCOR) Data Infrastructure
ONC
60
Recommendations for future use of the ML models Recommendation 1: Investigate performance of the ML models by examining predictions by site of service/facility, as systematic differences in how data is collected at various sites could potentially reduce model performance
Systemic differences in data collection can bias the performance of ML models due to the quality of data collected at different sites, etc. Location-based features were not incorporated into the training dataset in this Project as location data was de-identified to comply with IRB requirements for data use. Future researchers could incorporate location data provided location information can be retained to analyze the impact of data collection on the ML models.
Recommendation 2: Investigate performance of the ML models by examining the impact of different definitions of data elements on model sensitivity.
Clinical variables can have slightly different definitions due to the units used for laboratory tests, the equation used to calculate values, etc. For example, two eGFR variables are provided in the USRDS data: one calculated using the Chronic Kidney Disease Epidemiology Collaboration (CKD-EPI) and one calculated using the Modification of Diet in Renal Disease (MDRD) Study equationxcix. (Note: for this Project, clinical experts recommended the use of the CKD-EPI eGFR variable based on their prior experience as it is more accurate.) Using one eGFR variable instead of the other could result in different model results. Future researchers could investigate the impact of differing definitions on the performance of the ML models (e.g., model sensitivity).
Recommendation 3: With the same use case of predicting mortality in the first 90 days of dialysis, investigate 90-day mortality for those who switch dialysis modalities and use ML to calculate propensity scores to compare the groups.
Switching dialysis modalities, such as from peritoneal dialysis to hemodialysis, is not a baseline characteristic known on or prior to dialysis start. Thus, the feature was not included in the training dataset prepared for the project. Future researchers working on a different use case could create this feature from the data in USRDS.
Propensity score matching is used to estimate causal effects for observational data, whereas predictive ML modeling only predicts the outcome of interest. Future researchers could use approaches similar to Westreich et al. (2010)c to use ML for propensity score matching by age group, dialysis modality, etc.
Recommendation 4: With the same use case of predicting mortality in the first 90 days of dialysis, investigate 90-day hospitalization outcome for the same study cohort as the current project (adults who have ESKD/ESRD incident years between 2008-2017 with valid dialysis start dates)
The current use case predicts an outcome of mortality in the first 90 days of dialysis. Future researchers could also consider constructing an outcome variable of 90-day hospitalizations instead of mortality, in which case they would consider mortality prior to hospitalization as a competing risk for hospitalization. (For example, a Fine-Grayci competing risk model could be applied to the predictors selected by the ML model. A competing risk regression model could be appropriate when gauging risk by a sub-distribution hazard, as it corresponds with the non-parametric cumulative incidence function (preferred in clinical research to the Kaplan-Meier estimate), while other methods may be of more of interest if examining a cause-specific hazard when the cause of interest is subject to a competing risk.)

Training Data for Machine Learning (ML) to Enhance Patient-Centered Outcomes Research (PCOR) Data Infrastructure
ONC
61
Recommendation 5: Investigate 90-day mortality with the same feature set as the current project but for a smaller cohort, such as narrowing the cohort to only patients who have pre-ESKD/ESRD Medicare claims data.
The current study cohort includes all adult patients, even those who do not have pre-ESKD/ESRD Medicare claims data. Future researchers can future refine the cohort to only patients who have pre-ESKD/ESRD claims data for other use cases.
Recommendation 6: Predicting kidney transplantation outcomes/who should be considered for kidney transplantation after dialysis initiation.
Treatment options for ESKD/ESRD and their outcomes are oftentimes not properly communicated to patients diagnosed with ESKD/ESRD. Since kidney transplants tend to result in better long term outcomes, there is a push to move to increase kidney transplants as a treatment option. Future researchers can use resources from this project and USRDS data to investigate kidney transplant outcomes use case.
Recommendation 7: Consider the non-linearity of the features for the logistic regression and multiple imputation models.
Feature selection is an important part of training a statistical model, particularly logistic regression, or other univariate regression approaches such as those inherent to the MICE implementation for multiple imputation. The goal of this model was to provisionally test the high-quality training dataset using logistic regression with the features that were selected or created from the study dataset. There are additional steps that users can take to ensure that continuous features have a linear relationship with the dependent variable.
Recommendation 8: Consider using F_beta score as an evaluation score for the models to adjust the weights of sensitivity and precision based on the clinical use case.
F1 score, which equally weights sensitivity and precision, was used in this project. The beta should be chosen based on the use case and with clinician input. For example, if the prevalence of the interested outcome is unknown then specificity should be weighted more heavily than precision.
Recommendation 9: Accounting for interactions terms (i.e., between race and age) as part of the ML models (and imputation models, preparing data for ML model fit) to better understand the relationships between variables.
Accounting for interactions between two or more terms adds complexity to a model, especially when there are more than 100 features present. Given the objective of ML modeling in this Project was to provisionally test the high-quality training dataset using various algorithms within the Project’s scope and schedule, the decision was made to not perform the complex modeling required to address interaction of terms. Future researchers may address this by including interactions for a small selection of variables if the features and their interaction(s) is clinically relevant to the researchers.

Training Data for Machine Learning (ML) to Enhance Patient-Centered Outcomes Research (PCOR) Data Infrastructure
ONC
62
Conclusion This project focused on building high-quality training datasets was initiated to address the specific challenge of the lack of high-quality training data from which to build and maintain AI applications in health, that was identified in the JASON report on Artificial Intelligence for Health and Health Careiii. Such training datasets contributes to the foundational work that will facilitate future applications of AI/ML and enhance PCOR data infrastructure. The project achieved its aim by constructing high-quality training datasets for a kidney specific use case of predicting mortality in the first 90 days of dialysis using CMS clinical and claims data available from USRDS, the national registry for CKD and ESKD/ESRD patients. From a patient-centered perspective, such ML models that predict mortality in the first 90 days could inform patient-provider joint clinical decisions on whether to initiate dialysis and if so, which type of dialysis to initiate.
The criteria for high quality, the approach used for constructing, and the features selected for the training datasets were vetted with the TEP that was established for the project. Furthermore, three different types of machine learning algorithms—XGBoost, logistic regression and multilayer perceptron—were used to provisionally test the respective training datasets derived from the original high-quality full training dataset. Predictive performance of the ML models developed using the three algorithms demonstrated AUCs of 0.826 (XGBoost, non-imputed), 0.827 (XGBoost, imputed), 0.812 (logistic regression) and 0.812 (multilayer perceptron).
The top five features that were highly ranked in XGBoost and logistic regression models were age, whether the patient had inpatient stay claims, had received erythropoietin (EPO), the status of albumin, and the presence of arteriovenous fistula (AVF). The confusion matrix as well as prediction score categorizations, which is oftentimes more helpful to clinicians rather than the binary died (1) or survived (0) predictions, showed that the ML models developed in this project predicted survival more accurately than death. The fairness assessment performed using age, race, sex and initial dialysis modality demonstrated that XGBoost performs consistently across these categories (ranging from a low AUC of 0.798 to a high AUC of 0.840) whereas logistic regression and multilayer perceptron models are more variable (AUC between 0.716 to 0.848) and show that the AUC decreases as age increases.
Dissemination of the resources generated in the project, includes an Implementation Guide with detailed methodology and points to consider that future researchers can refer to for preparing training datasets and ML models for new kidney disease use cases, the code base available on ONC GitHub, and recommendations for future work provided by various stakeholders including the TEP. PCOR researchers can build off the foundational work completed through this project and stimulate the application of these methods to a wider array of use cases by PCOR researchers and advance the application of ML to enhance PCOR infrastructure.

Training Data for Machine Learning (ML) to Enhance Patient-Centered Outcomes Research (PCOR) Data Infrastructure
ONC
63
Glossary & Acronyms GLOSSARY
Term Definition Algorithm A procedure for solving a mathematical problem in a finite number of
steps that frequently involves repetition of an operation. Current term of choice for a problem-solving procedure, algorithm, is commonly used nowadays for the set of rules a machine (and especially a computer) follows to achieve a particular goal.cii
Artificial Intelligence (AI) A branch of computer science dealing with the simulation of intelligent behavior in computers; the capability of a machine to imitate intelligent human behavior.ciii
Artificial neural network Computing systems vaguely inspired by the biological neural networks that constitute animal brains. An ANN is based on a collection of connected units or nodes called artificial neurons, which loosely model the neurons in a biological brain. Each connection, like the synapses in a biological brain, can transmit a signal to other neurons. An artificial neuron that receives a signal then processes it and can signal neurons connected to it. The "signal" at a connection is a real number, and the output of each neuron is computed by some non-linear function of the sum of its inputs.civ
Area under the curve (AUC) An evaluation metric that considers all possible classification thresholds. The area under the receiver operating characteristic curve (AUC ROC) is the probability that a classifier will be more confident that a randomly chosen positive example is actually positive than that a randomly chosen negative example is positive.cv
Common data element (CDE) A common data element (CDE) refers to a data element that is common to multiple datasets across different studies, surveys, or registries. The intentional use of CDEs improves data quality and promotes data sharing.cvi
Cross validation A mechanism for estimating how well a model will generalize to new data by testing the model against one or more non-overlapping data subsets withheld from the training set.cv
Confusion Matrix A table with two rows and two columns that reports the number of true positives, true negatives, false positives, and false negatives. Each row of the matrix represents the instances in an actual class while each column represents the instances in a predicted class, or vice versa.cvii
Electronic health record (EHR)
An EHR is a digital version of a patient’s paper chart. EHRs are real-time, patient-centered records that make information available instantly and securely to authorized users. While an EHR does contain the medical and treatment histories of patients, an EHR

Training Data for Machine Learning (ML) to Enhance Patient-Centered Outcomes Research (PCOR) Data Infrastructure
ONC
64
Term Definition system is built to go beyond standard clinical data collected in a provider’s office and can be inclusive of a broader view of a patient’s care. One of the key features of an EHR is that health information can be created and managed by authorized providers in a digital format capable of being shared with other providers across more than one health care organization. EHRs are built to share information with other health care providers and organizations—such as laboratories, specialists, medical imaging facilities, pharmacies, emergency facilities, and school and workplace clinics—so they contain information from all clinicians involved in a patient’s care.cviii
End Stage Kidney (Renal) Disease (ESKD/ESRD)
A medical condition in which a person's kidneys cease functioning on a permanent basis leading to the need for a regular course of long-term dialysis or a kidney transplant to maintain life.cix
Feature An individual measurable property or characteristic of a phenomenon being observed. Choosing informative, discriminating and independent features is a crucial step for effective algorithms in pattern recognition, classification and regression.cx
Hyperparameter The "knobs" that you tweak during successive runs of training a model. For example, learning rate is a hyperparameter.cv
Machine Learning (ML) The process by which a computer is able to improve its own performance (as in analyzing image files) by continuously incorporating new data into an existing statistical model.cxi
Model The representation of what a machine learning system has learned from the training data.cv
Patient-Centered Outcomes Research (PCOR)
PCOR compares the impact of two or more preventive, diagnostic, treatment, or health care delivery approaches on health outcomes, including those that are meaningful to patients.cxii
Protected health information (PHI)
The Privacy Rule protects all "individually identifiable health information" held or transmitted by a covered entity or its business associate, in any form or media, whether electronic, paper, or oral. The Privacy Rule calls this information "protected health information”.cxiii
Personally identifiable information (PII)
As defined in OMB Memorandum M-07-1616, PII refers to information that can be used to distinguish or trace an individual’s identity, either alone or when combined with other personal or identifying information that is linked or linkable to a specific individual.cxiv
ACRONYMS Acronym Explanation ADI Area deprivation index AI Artificial intelligence ANN Artificial neural network

Training Data for Machine Learning (ML) to Enhance Patient-Centered Outcomes Research (PCOR) Data Infrastructure
ONC
65
Acronym Explanation ASPE Assistant Secretary for Planning and Evaluation AUC Area under the curve AVF Arteriovenous fistula AVG Arteriovenous graft BMI Body Mass Index CDC Centers for Disease Control and Prevention CDEs Common data elements CKD Chronic kidney disease CMS Centers for Medicare & Medicaid Services CODE Center for Open Data Enterprise CPMAI Cognitive Project Management for Artificial Intelligence CRISP-DM Cross-Industry Standard Process for Data Mining CV Cross validation DOPPS The Dialysis Outcomes and Practice Patterns Study EHR Electronic health record EPO Erythropoietin ESKD End-stage kidney disease ESRD End Stage Renal Disease FAIR Findability, Accessibility, Interoperability, and Reusability FDA The United States Food and Drug Administration FIPS Federal Information Processing Standard Publication GFR-EPI Glomerular Filtration Rate Epidemiology Collaboration HH Home health HHS The Department of Health and Human Services HIPAA Health Insurance Portability and Accountability Act HS Hospice IA Interagency Assembly ICD International Classification of Diseases IP Inpatient IRB Institutional Review Board IT Information Technology KHRC Kidney Health Research Collaborative LR Logistic regression MAR Missing at random MEDEVID Medical Evidence MICE Multiple imputations by chained equations ML Machine learning MLP Multilayer perceptron MNAR Missing not at random MVP Million Veteran Program NIDDK National Institute of Diabetes and Digestive and Kidney Diseases (NIDDK) NIH National Institutes of Health ONC Office of the National Coordinator for Health Information Technology

Training Data for Machine Learning (ML) to Enhance Patient-Centered Outcomes Research (PCOR) Data Infrastructure
ONC
66
Acronym Explanation OP Outpatient PCOR Patient-centered outcomes research PCORTF PCOR Trust Fund PDIS Primary disease causing renal failure PHI Protected health information PII Personally identifiable information PMI Precision Medicine Initiative PMM Predictive mean matching PR Precision recall ROC Receiver operating characteristic SDOH Social determinants of health SGD Stochastic gradient descent SN Skilled nursing unit TEP Technical Expert Panel TREE Transparency, reproducibility, ethics, and effectiveness TRIPOD-ML Transparent Reporting of a multivariable prediction model for Individual
Prognosis Or Diagnosis for ML TX Transplant UCSF University of California San Francisco USRDS The United States Renal Data System VA Veterans Affairs XGBoost eXtreme gradient boosting

Training Data for Machine Learning (ML) to Enhance Patient-Centered Outcomes Research (PCOR) Data Infrastructure
ONC
67
Appendix R AND PYTHON LIBRARIES USED IN THE PROJECT Appendix Table 1: R libraries used in dataset creation
R library name Version RPostgres 1.3.1 DBI 1.1.1 stringr 1.4.0 haven 2.4.0 readr 1.4.0 lubridate 1.7.9.2 dplyr 1.0.4 magrittr 1.5 tidyr 1.1.2 sqldf 0.4-11 RSQLite 2.2.3 gsubfn 0.7 proto 1.0.0 readxl 1.3.1 plyr 1.8.6 mice 3.13.0
Appendix Table 2: Python libraries used in preprocessing data
Python Library Version psycopg2 2.8.6 sqlalchemy 1.3.23 numpy 1.19.4 pandas 1.1.5 matplotlib 3.3.3 seaborn 0.11.1
Appendix Table 3: R libraries used for XGBoost modeling
R library Version RPostgres 1.3.1 DBI 1.1.1 dplyr 1.0.4 tidyr 1.1.2 skimr 2.1.2

Training Data for Machine Learning (ML) to Enhance Patient-Centered Outcomes Research (PCOR) Data Infrastructure
ONC
68
R library Version data.table 1.14.0 mltools 0.3.5 readr 1.4.0 stringr 1.4.0 here 1.0.1 rgenoud 5.8-3.0 DiceKriging 1.5.8 purrr 0.3.4 mlrMBO 1.1.5 mlr 2.18.0 smoof 1.6.0.2 checkmate 2.0.0 ParamHelpers 1.14 magrittr 1.5 xgboost 1.3.2.1 sqldf 0.4-11 Matrix 1.2-18 rBayesianOptimization 1.1.0 rsample 0.0.9 pROC 1.17.0.1 openxlsx 4.2.3
Appendix Table 4: Python libraries used for logistic regression model
Python Library Version scikit-learn 0.24.1 numpy 1.19.5 pandas 1.1.5 matplotlib 3.3.3 seaborn 0.11.1
Appendix Table 5: Python libraries used for multilayer perceptron model
Python Library Version tensorflow 2.4.1 scikit-learn 0.24.1 numpy 1.19.5 pandas 1.1.5 matplotlib 3.3.3

Training Data for Machine Learning (ML) to Enhance Patient-Centered Outcomes Research (PCOR) Data Infrastructure
ONC
69
ALTERNATE USE CASES CONSIDERED FOR THE PROJECT The following kidney disease use cases were considered and vetted with the TEP but were not selected for the Project. These are provided here for other researchers to consider for future AI/ML applications.
1) Incident Chronic Kidney Disease (CKD) risk prediction: Identify patients at increased risk of CKD based on clinical and omics data
• Benefit of ML: Prediction can be enhanced as ML uses all available data (geospatial, genomic) and includes non-causal pathways
• Potential Data Sources: EHR data, medical claims tied to EHR data, genomic data tied to EHR data, All of Us Program, BioMed Program
2) Imaging analytics: Conduct imaging analytics to improve diagnosis of kidney disease based on kidney biopsy tissue
• Benefit of ML: Improved diagnosis of kidney disease by automatically analyzing images (e.g., biopsies, ultrasound data, etc.)
• Potential Data Sources: NEPTUNE, TRIDENT (Transformative Research in Diabetic Nephropathy), H3Africa CKD, Kidney Precision Medicine Project

Training Data for Machine Learning (ML) to Enhance Patient-Centered Outcomes Research (PCOR) Data Infrastructure
ONC
70
Resources The following resources generated in this Project are available:
• Implementation Guide and Data Dictionary on the Project site • Codebase for training datasets and ML models on ONC GitHub • Project Webinar slides on the Project site

Training Data for Machine Learning (ML) to Enhance Patient-Centered Outcomes Research (PCOR) Data Infrastructure
ONC
71
References
i https://www.healthit.gov/topic/scientific-initiatives/building-data-infrastructure-support-patient-centered-outcomes-research ii https://aspe.hhs.gov/training-data-machine-learning-enhance-patient-centered-outcomes-research-pcor-data-infrastructure iii Artificial Intelligence for Health and Health Care, JASON Report 2017: https://www.healthit.gov/sites/default/files/jsr-17-task-002_aiforhealthandhealthcare12122017.pdf
iv ESKD is also referred as End Stage Renal Disease or ESRD. In order to maintain consistency with USRDS data, ESKD/ESRD is used in this document. v Soucie JM, McClellan WM. Early death in dialysis patients: risk factors and impact on incidence and mortality rates. J Am Soc Nephrol. 1996 Oct;7(10):2169-75. doi: 10.1681/ASN.V7102169. PMID: 8915977. vi Chan KE, Maddux FW, Tolkoff-Rubin N, Karumanchi SA, Thadhani R, Hakim RM. Early outcomes among those initiating chronic dialysis in the United States. Clin J Am Soc Nephrol. 2011 Nov;6(11):2642-9. doi: 10.2215/CJN.03680411. Epub 2011 Sep 29. PMID: 21959599; PMCID: PMC3359565. vii One-hot encoding involves converting categorical features into a collection or vector of numeric indicators viii Standardization involves transforming numeric features to have a mean of zero and a standard deviation of one ix Balancing ensures that the model has sufficient data from the died and survived outcome classes on which to train; the distribution of the classes in the cohort of 1,150,195 used for the project were approximately 7% who died (positive/minority class) and approximately 93% who survived (negative, majority class). x https://aspe.hhs.gov/patient-centered-outcomes-research-trust-fund xi Yu KH, Beam AL, Kohane IS. Artificial intelligence in healthcare. Nat Biomed Eng. 2018 Oct;2(10):719-731. doi: 10.1038/s41551-018-0305-z. Epub 2018 Oct 10. PMID: 31015651. xii Girosi F, Mann S, Kareddy V. Narrative Review and Evidence Mapping: Artificial Intelligence in Clinical Care. Patient-Centered Outcomes Research Institute; February 2021. Prepared by RAND under Contract No. IDIQ-TO#22-RAND-ENG-AOSEPP-04-01-2020. https://www.pcori.org/research-results/evidence-synthesis/evidence-maps-and-evidence-visualizations/artificial xiii Noorbakhsh-Sabet N, Zand R, Zhang Y, Abedi V. Artificial Intelligence Transforms the Future of Health Care. Am J Med. 2019 Jul;132(7):795-801. doi: 10.1016/j.amjmed.2019.01.017. Epub 2019 Jan 31. PMID: 30710543; PMCID: PMC6669105. xivArtificial Intelligence for Health and Health Care, JASON Report 2017: https://www.healthit.gov/sites/default/files/jsr-17-task-002_aiforhealthandhealth care12122017.pdf
xv https://www.usrds.org/ xvi Davenport T, Kalakota R. The potential for artificial intelligence in healthcare. Future Healthc J. 2019 Jun;6(2):94-98. doi: 10.7861/futurehosp.6-2-94. PMID: 31363513; PMCID: PMC6616181. xvii FDA cleared AI algorithms. American College of Radiology Data Science Institute. https://www.acrdsi.org/DSI-Services/FDA-Cleared-AI-Algorithms xviii Girosi F, Mann S, Kareddy V. Narrative Review and Evidence Mapping: Artificial Intelligence in Clinical Care. Patient-Centered Outcomes Research Institute; February 2021. Prepared by RAND under Contract No. IDIQ-TO#22-RAND-ENG-AOSEPP-04-01-2020. https://www.pcori.org/research-results/evidence-synthesis/evidence-maps-and-evidence-visualizations/artificial xix Ginley B, Lutnick B, Jen KY, Fogo AB, Jain S, Rosenberg A, Walavalkar V, Wilding G, Tomaszewski JE, Yacoub R, Rossi GM, Sarder P. Computational Segmentation and Classification of Diabetic Glomerulosclerosis. J Am Soc Nephrol. 2019 Oct;30(10):1953-1967. doi: 10.1681/ASN.2018121259. Epub 2019 Sep 5. PMID: 31488606; PMCID: PMC6779352 xx Kolachalama VB, Singh P, Lin CQ, Mun D, Belghasem ME, Henderson JM, Francis JM, Salant DJ, Chitalia VC. Association of Pathological Fibrosis With Renal Survival Using Deep Neural Networks. Kidney Int Rep. 2018 Jan 11;3(2):464-475. doi: 10.1016/j.ekir.2017.11.002. PMID: 29725651; PMCID: PMC5932308. xxi Tomašev N, Glorot X, Rae JW, Zielinski M, Askham H, Saraiva A, Mottram A, Meyer C, Ravuri S, Protsyuk I, Connell A, Hughes CO, Karthikesalingam A, Cornebise J, Montgomery H, Rees G, Laing C, Baker CR, Peterson K, Reeves R, Hassabis D, King D, Suleyman M, Back T, Nielson C, Ledsam JR, Mohamed S. A clinically applicable

Training Data for Machine Learning (ML) to Enhance Patient-Centered Outcomes Research (PCOR) Data Infrastructure
ONC
72
approach to continuous prediction of future acute kidney injury. Nature. 2019 Aug;572(7767):116-119. doi: 10.1038/s41586-019-1390-1. Epub 2019 Jul 31. PMID: 31367026; PMCID: PMC6722431. xxii https://www.cognilytica.com/cpmai-methodology/ xxiii https://www.sv-europe.com/crisp-dm-methodology/ xxiv Saggi, S., Allon, M., Bernardini, J. et al. Considerations in the optimal preparation of patients for dialysis. Nat Rev Nephrol 8, 381–389 (2012). https://doi.org/10.1038/nrneph.2012.66 xxv Hassan R, Akbari A, Brown PA, Hiremath S, Brimble KS, Molnar AO. Risk Factors for Unplanned Dialysis Initiation: A Systematic Review of the Literature. Can J Kidney Health Dis. 2019 Mar 13;6:2054358119831684. doi: 10.1177/2054358119831684. PMID: 30899532; PMCID: PMC6419254.. xxvi Brown PA, Akbari A, Molnar AO, Taran S, Bissonnette J, Sood M, Hiremath S. Factors Associated with Unplanned Dialysis Starts in Patients followed by Nephrologists: A Retropective Cohort Study. PLoS One. 2015 Jun 5;10(6):e0130080. doi: 10.1371/journal.pone.0130080. PMID: 26047510; PMCID: PMC4457723. xxvii Noordzij M, Jager KJ. Increased mortality early after dialysis initiation: a universal phenomenon. Kidney Int. 2014 Jan;85(1):12-4. doi: 10.1038/ki.2013.316. PMID: 24380902 xxviii Molnar AO, Hiremath S, Brown PA, Akbari A. Risk factors for unplanned and crash dialysis starts: a protocol for a systematic review and meta-analysis. Syst Rev. 2016 Jul 19;5(1):117. doi: 10.1186/s13643-016-0297-2. PMID: 27431915; PMCID: PMC4950106. xxix List of criteria for defining a high quality training dataset is not available in the published literature; therefore the specific criteria were compiled based on experiences of the Project Team and ML community websites and vetted with the Technical Expert Panel (TEP) to finalize. Some of the websites reviewed include: http://www.cs.ust.hk/~qyang/Docs/2003/Data_Preparation_for_Data_Mining_ZZY.pdf; https://machinelearningmastery.com/how-to-prepare-data-for-machine-learning/; https://towardsdatascience.com/5-steps-to-correctly-prep-your-data-for-your-machine-learning-model-c06c24762b73; https://www.kdnuggets.com/2018/12/six-steps-master-machine-learning-data-preparation.html; https://www.cloudfactory.com/training-data-guide; https://www.altexsoft.com/blog/datascience/preparing-your-dataset-for-machine-learning-8-basic-techniques-that-make-your-data-better xxx https://www.hhs.gov/hipaa/for-professionals/privacy/special-topics/de-identification/index.html xxxi USRDS dataset: https://www.usrds.org/media/1292/researchers_guide_appendix_a_19.pdf xxxii R Core Team. R: A language and environment for statistical computing. R Foundation for Statistical Computing, Vienna, Austria. 2020. URL: https://www.R-project.org/. xxxiii Van Rossum, G. & Drake, F. Python 3 Reference Manual. 2009. CreateSpace: Scotts Valley, CA xxxiv Lionel U. Mailloux, Alessandro G. Bellucci, Robert T. Mossey, Barbara Napolitano, Terrence Moore, Barry M. Wilkes, Peter A. Bluestone. Predictors of survival in patients undergoing dialysis. The American Journal of Medicine. Volume 84, Issue 5. 1988. Pages 855-862. ISSN 0002-9343. https://doi.org/10.1016/0002-9343(88)90063-0. xxxv The coding for each feature is captured in the data dictionary, which is expected to be hosted on the ONC GitHub alongside the code used to create the training dataset and ML model. xxxvi Secondary diagnosis codes are not included in the USRDS data. xxxvii This feature is only included as part of the imputed datasets xxxviii IP = inpatient, OP = outpatient, HH = home health, HS = hospice, SN = skilled nursing unit xxxix Huang C, Murugiah K, Mahajan S, Li SX, Dhruva SS, Haimovich JS, Wang Y, Schulz WL, Testani JM, Wilson FP, Mena CI, Masoudi FA, Rumsfeld JS, Spertus JA, Mortazavi BJ, Krumholz HM. Enhancing the prediction of acute kidney injury risk after percutaneous coronary intervention using machine learning techniques: A retrospective cohort study. PLoS Med. 2018 Nov 27;15(11):e1002703. doi: 10.1371/journal.pmed.1002703. PMID: 30481186; PMCID: PMC6258473. xl van Buuren S, Groothuis-Oudshoorn K. mice: Multivariate Imputation by Chained Equations in R. 2011. 2011;45(3):67. Epub 2011-12-12. doi: 10.18637/jss.v045.i03. xli Rubin, D.B. Multiple Imputation for Nonresponse in Surveys. John Wiley & Sons Inc., New York. 1987. Doi: http://dx.doi.org/10.1002/9780470316696 xlii Janus Christian Jakobsen et. al., When and how should multiple imputation be used for handling missing data in randomised clinical trials – a practical guide with flowchart. BMC Med Res Methodol. 2017 Dec 6;17(1):162. doi: 10.1186/s12874-017-0442-1 xliii Missing values will be imputed in the ‘Missing Data Imputation’ section, therefore only features with fewer than 40% missing values are included as features in the training dataset.
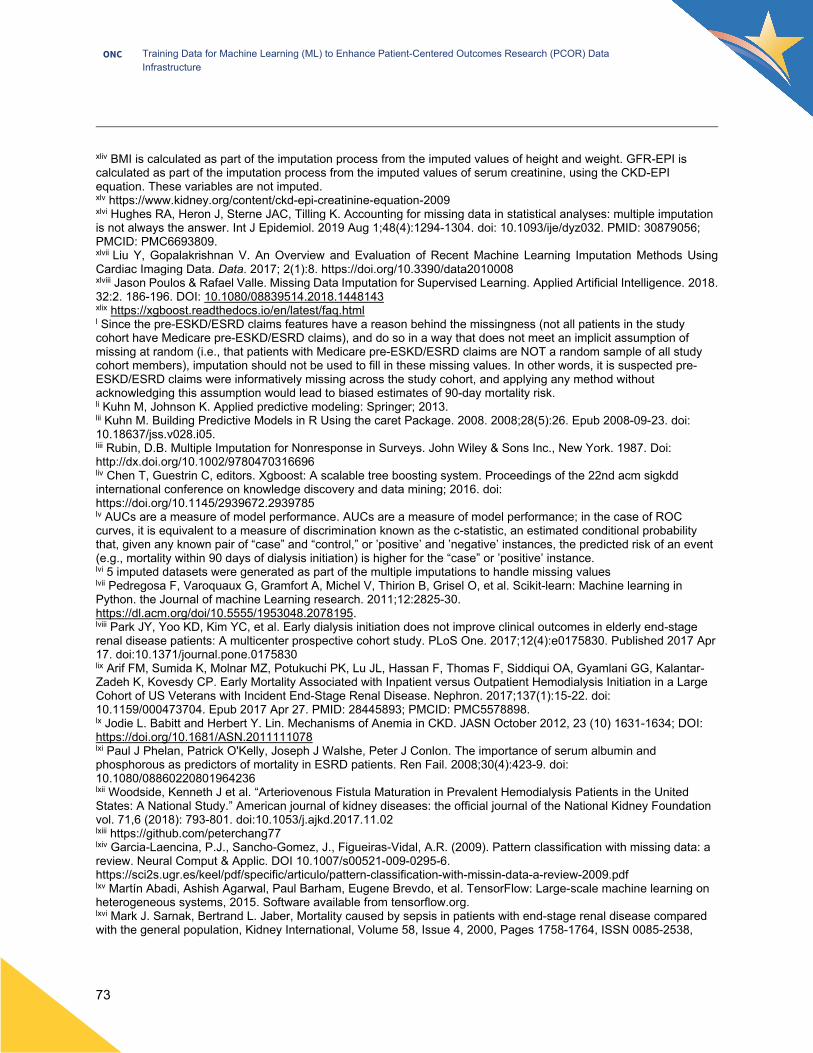
Training Data for Machine Learning (ML) to Enhance Patient-Centered Outcomes Research (PCOR) Data Infrastructure
ONC
73
xliv BMI is calculated as part of the imputation process from the imputed values of height and weight. GFR-EPI is calculated as part of the imputation process from the imputed values of serum creatinine, using the CKD-EPI equation. These variables are not imputed. xlv https://www.kidney.org/content/ckd-epi-creatinine-equation-2009 xlvi Hughes RA, Heron J, Sterne JAC, Tilling K. Accounting for missing data in statistical analyses: multiple imputation is not always the answer. Int J Epidemiol. 2019 Aug 1;48(4):1294-1304. doi: 10.1093/ije/dyz032. PMID: 30879056; PMCID: PMC6693809. xlvii Liu Y, Gopalakrishnan V. An Overview and Evaluation of Recent Machine Learning Imputation Methods Using Cardiac Imaging Data. Data. 2017; 2(1):8. https://doi.org/10.3390/data2010008 xlviii Jason Poulos & Rafael Valle. Missing Data Imputation for Supervised Learning. Applied Artificial Intelligence. 2018. 32:2. 186-196. DOI: 10.1080/08839514.2018.1448143 xlix https://xgboost.readthedocs.io/en/latest/faq.html l Since the pre-ESKD/ESRD claims features have a reason behind the missingness (not all patients in the study cohort have Medicare pre-ESKD/ESRD claims), and do so in a way that does not meet an implicit assumption of missing at random (i.e., that patients with Medicare pre-ESKD/ESRD claims are NOT a random sample of all study cohort members), imputation should not be used to fill in these missing values. In other words, it is suspected pre-ESKD/ESRD claims were informatively missing across the study cohort, and applying any method without acknowledging this assumption would lead to biased estimates of 90-day mortality risk. li Kuhn M, Johnson K. Applied predictive modeling: Springer; 2013. lii Kuhn M. Building Predictive Models in R Using the caret Package. 2008. 2008;28(5):26. Epub 2008-09-23. doi: 10.18637/jss.v028.i05. liii Rubin, D.B. Multiple Imputation for Nonresponse in Surveys. John Wiley & Sons Inc., New York. 1987. Doi: http://dx.doi.org/10.1002/9780470316696 liv Chen T, Guestrin C, editors. Xgboost: A scalable tree boosting system. Proceedings of the 22nd acm sigkdd international conference on knowledge discovery and data mining; 2016. doi: https://doi.org/10.1145/2939672.2939785 lv AUCs are a measure of model performance. AUCs are a measure of model performance; in the case of ROC curves, it is equivalent to a measure of discrimination known as the c-statistic, an estimated conditional probability that, given any known pair of “case” and “control,” or ’positive’ and ’negative’ instances, the predicted risk of an event (e.g., mortality within 90 days of dialysis initiation) is higher for the “case” or ’positive’ instance. lvi 5 imputed datasets were generated as part of the multiple imputations to handle missing values lvii Pedregosa F, Varoquaux G, Gramfort A, Michel V, Thirion B, Grisel O, et al. Scikit-learn: Machine learning in Python. the Journal of machine Learning research. 2011;12:2825-30. https://dl.acm.org/doi/10.5555/1953048.2078195. lviii Park JY, Yoo KD, Kim YC, et al. Early dialysis initiation does not improve clinical outcomes in elderly end-stage renal disease patients: A multicenter prospective cohort study. PLoS One. 2017;12(4):e0175830. Published 2017 Apr 17. doi:10.1371/journal.pone.0175830 lix Arif FM, Sumida K, Molnar MZ, Potukuchi PK, Lu JL, Hassan F, Thomas F, Siddiqui OA, Gyamlani GG, Kalantar-Zadeh K, Kovesdy CP. Early Mortality Associated with Inpatient versus Outpatient Hemodialysis Initiation in a Large Cohort of US Veterans with Incident End-Stage Renal Disease. Nephron. 2017;137(1):15-22. doi: 10.1159/000473704. Epub 2017 Apr 27. PMID: 28445893; PMCID: PMC5578898. lx Jodie L. Babitt and Herbert Y. Lin. Mechanisms of Anemia in CKD. JASN October 2012, 23 (10) 1631-1634; DOI: https://doi.org/10.1681/ASN.2011111078 lxi Paul J Phelan, Patrick O'Kelly, Joseph J Walshe, Peter J Conlon. The importance of serum albumin and phosphorous as predictors of mortality in ESRD patients. Ren Fail. 2008;30(4):423-9. doi: 10.1080/08860220801964236 lxii Woodside, Kenneth J et al. “Arteriovenous Fistula Maturation in Prevalent Hemodialysis Patients in the United States: A National Study.” American journal of kidney diseases: the official journal of the National Kidney Foundation vol. 71,6 (2018): 793-801. doi:10.1053/j.ajkd.2017.11.02 lxiii https://github.com/peterchang77 lxiv Garcia-Laencina, P.J., Sancho-Gomez, J., Figueiras-Vidal, A.R. (2009). Pattern classification with missing data: a review. Neural Comput & Applic. DOI 10.1007/s00521-009-0295-6. https://sci2s.ugr.es/keel/pdf/specific/articulo/pattern-classification-with-missin-data-a-review-2009.pdf lxv Martín Abadi, Ashish Agarwal, Paul Barham, Eugene Brevdo, et al. TensorFlow: Large-scale machine learning on heterogeneous systems, 2015. Software available from tensorflow.org. lxvi Mark J. Sarnak, Bertrand L. Jaber, Mortality caused by sepsis in patients with end-stage renal disease compared with the general population, Kidney International, Volume 58, Issue 4, 2000, Pages 1758-1764, ISSN 0085-2538,

Training Data for Machine Learning (ML) to Enhance Patient-Centered Outcomes Research (PCOR) Data Infrastructure
ONC
74
https://doi.org/10.1111/j.1523-1755.2000.00337.x. (http://www.sciencedirect.com/science/article/pii/S0085253815472746) lxvii USRDS/Merged Data Use Request: https://www.usrds.org/for-researchers/merged-data-requests/ lxviii https://www.usrds.org/media/1286/2019-researcher-s-guide.pdf#page=28) lxix Salkind, N. J. Encyclopedia of research design (Vols. 1-0). 2010. Thousand Oaks, CA: SAGE Publications, Inc. doi: 10.4135/9781412961288 (https://methods.sagepub.com/reference/encyc-of-research-design/n279.xml) lxx Bartlett JW, Seaman SR, White IR, Carpenter JR; Alzheimer's Disease Neuroimaging Initiative*. Multiple imputation of covariates by fully conditional specification: Accommodating the substantive model. Stat Methods Med Res. 2015 Aug;24(4):462-87. doi: 10.1177/0962280214521348. Epub 2014 Feb 12. PMID: 24525487; PMCID: PMC4513015 lxxi Nguyen, C.D., Carlin, J.B. & Lee, K.J. Model checking in multiple imputation: an overview and case study. Emerg Themes Epidemiol 14, 8 (2017). https://doi.org/10.1186/s12982-017-0062-6. lxxii Peter C. Austin, Douglas S. Lee and Jason P. Fine. Introduction to the Analysis of Survival Data in the Presence of Competing Risks Circulation. 2016;133:601-609 lxxiii Gooley TA, Leisenring W, Crowley J, Storer BE. Estimation of failure probabilities in the presence of competing risks: new representations of old estimators. Stat Med. 1999 Mar 30;18(6):695-706. doi: 10.1002/(sici)1097-0258(19990330)18:6<695::aid-sim60>3.0.co;2-o. PMID: 10204198. lxxiv Schuster NA, Hoogendijk EO, Kok AAL, Twisk JWR, Heymans MW. Ignoring competing events in the analysis of survival data may lead to biased results: a nonmathematical illustration of competing risk analysis. J Clin Epidemiol. 2020 Jun;122:42-48. doi: 10.1016/j.jclinepi.2020.03.004. Epub 2020 Mar 9. PMID: 32165133. lxxv Koller MT, Raatz H, Steyerberg EW, Wolbers M. Competing risks and the clinical community: irrelevance or ignorance? Stat Med. 2012 May 20;31(11-12):1089-97. doi: 10.1002/sim.4384. Epub 2011 Sep 23. PMID: 21953401; PMCID: PMC3575691. lxxvi The USRDS datasets pre-dating ESKD/ESRD are: Pre- ESKD/ESRD Institutional Claims, Pre- ESKD/ESRD Physician/Supplier Claims, Pre- ESKD/ESRD Prescription Drug — Part D, and Pre- ESKD/ESRD Payer History. lxxvii Chawla NV, Bowyer KW, Hall LO, Kegelmeyer WP. SMOTE: synthetic minority over-sampling technique. Journal of artificial intelligence research. 2002;16:321-57. doi: https://doi.org/10.1613/jair.953 lxxviiihttps://scikit-learn.org/stable/modules/generated/sklearn.metrics.average_precision_score.html#sklearn.metrics.average_precision_score lxxix Chouldechova A, Roth A. A snapshot of the frontiers of fairness in machine learning. Communications of the ACM. 2020;63(5):82-9. doi: https://doi.org/10.1145/3376898 lxxx Andrew L. Beam, Isaac S. Kohane. Big Data and Machine Learning in Health Care. JAMA. 2018;319(13):1317-1318. doi:10.1001/jama.2017.18391 lxxxi Gabriel Popkin. Data sharing and how it can benefit your scientific career. Nature 569, 445-447 (2019). doi: https://doi.org/10.1038/d41586-019-01506-x lxxxii Zhang et al. The Elements of Data Sharing. Genomics, Proteomics & Bioinformatics, Volume 18, Issue 1, February 2020, Pages 1-4. doi: 10.1016/j.gpb.2020.04.001 lxxxiii Jensen et al. Mining electronic health records: towards better research applications and clinical care. Nat Rev Genet. 2012 May 2;13(6):395-405. doi: 10.1038/nrg3208 lxxxiv Sharing and Utilizing Health Data for AI Applications – Roundtable Report. Published by The Center for Open Data Enterprise, www.opendataenterprise.org (2019). https://www.hhs.gov/sites/default/files/sharing-and-utilizing-health-data-for-ai-applications.pdf lxxxv Micah J. Sheller, Brandon Edwards, et al. Federated learning in medicine: facilitating multi‑institutional collaborations without sharing patient data. Scientific Reports (2020) 10:12598. https://doi.org/10.1038/s41598-020-69250-1 lxxxvi https://aspe.hhs.gov/using-machine-learning-techniques lxxxvii Mello MM, Lieou V, Goodman SN. Clinical Trial Participants' Views of the Risks and Benefits of Data Sharing. N Engl J Med. 2018 Jun 7;378(23):2202-2211. doi: 10.1056/NEJMsa1713258. PMID: 29874542; PMCID: PMC6057615. lxxxviii Kim J, Kim H, Bell E, Bath T, Paul P, Pham A, Jiang X, Zheng K, Ohno-Machado L. Patient Perspectives About Decisions to Share Medical Data and Biospecimens for Research. JAMA Netw Open. 2019 Aug 2;2(8):e199550. doi: 10.1001/jamanetworkopen.2019.9550. PMID: 31433479; PMCID: PMC6707015. lxxxix Seltzer, E., Goldshear, J., Guntuku, S.C. et al. Patients’ willingness to share digital health and non-health data for research: a cross-sectional study. BMC Med Inform Decis Mak 19, 157 (2019). https://doi.org/10.1186/s12911-019-0886-9

Training Data for Machine Learning (ML) to Enhance Patient-Centered Outcomes Research (PCOR) Data Infrastructure
ONC
75
xc Antonio de Carvalho Junior, M and Bandiera-Paiva, P. Health Information System Role-Based Access Control Current Security Trends and Challenges. Journal of Healthcare Engineering, Volume 2018: 6510249,. https://doi.org/10.1155/2018/6510249 xci Lane J and Schur C. Balancing Access to Health Data and Privacy: A Review of the Issues and Approaches for the Future. Health Services Research, 2010. Vol 45(5 Pt 2):1456-1467. DOI: 10.1111/j.1475-6773.2010.01141.x xcii Data Science Report. Crowdflower. https://visit.figure-eight.com/rs/416-ZBE-142/images/CrowdFlower_DataScienceReport_2016.pdf. xciii Ridzuan F, Zainon WMNW. A review on data cleansing methods for big data. Procedia Computer Science. 2019;161:731-8. https://doi.org/10.1016/j.procs.2019.11.177. (https://www.sciencedirect.com/science/article/pii/S1877050919318885) xciv Artificial Intelligence Education and Tools for Medical and Health Informatics Students: Systematic Review. JMIR Med Educ. 2020 Jun 30;6(1):e19285. doi: 10.2196/19285. xcv Kelly, et al. Key challenges for delivering clinical impact with artificial intelligence. BMC Medicine. 2019; 17:195 https://doi.org/10.1186/s12916-019-1426-2 xcvi Shah et al. Making Machine Learning Models Clinically Useful. JAMA. 2019;322(14):1351-1352. doi:10.1001/jama.2019.10306 xcvii Collins GS, Moons KGM. Reporting of artificial intelligence prediction models. Lancet. 2019;393:1577–9. doi: 10.1016/S0140-6736(19)30037-6 xcviii Vollmer et al. Machine learning and artificial intelligence research for patient benefit: 20 critical questions on transparency, replicability, ethics, and effectiveness. BMJ 2020;368:l6927. http://dx.doi.org/10.1136/bmj.l6927 xcixhttps://www.niddk.nih.gov/health-information/professionals/clinical-tools-patient-management/kidney-disease/laboratory-evaluation/glomerular-filtration-rate-calculators/mdrd-adults-conventional-units c Westreich D, Lessler J, Funk MJ. Propensity score estimation: neural networks, support vector machines, decision trees (CART), and meta-classifiers as alternatives to logistic regression. J Clin Epidemiol. 2010;63(8):826-833. doi:10.1016/j.jclinepi.2009.11.020 ci Peter C. Austin, Douglas S. Lee and Jason P. Fine. Introduction to the Analysis of Survival Data in the Presence of Competing Risks Circulation. 2016;133:601-609. doi: https://doi.org/10.1161/CIRCULATIONAHA.115.017719 cii https://www.merriam-webster.com/dictionary/algorithm#note-1 ciii https://www.merriam-webster.com/dictionary/artificial%20intelligence civ https://en.wikipedia.org/wiki/Artificial_neural_network cv https://developers.google.com/machine-learning/glossary#a cvihttps://registries.ncats.nih.gov/glossary/common-data-element-cde/#:~:text=A%20common%20data%20element%20(CDE,quality%20and%20promotes%20data%20sharing; https://www.nlm.nih.gov/portals/researchers.html cvii Tharwat A. (August 2018). "Classification assessment methods". Applied Computing and Informatics. doi:10.1016/j.aci.2018.08.003 cviii https://www.healthit.gov/faq/what-electronic-health-record-ehr cix https://www.cms.gov/Medicare/Coordination-of-Benefits-and-Recovery/Coordination-of-Benefits-and-Recovery-Overview/End-Stage-Renal-Disease-ESRD/ESRD#:~:text=End%2DStage%20Renal%20Disease%20(ESRD)%20is%20a%20medical%20condition,kidney%20transplant%20to%20maintain%20life. cx https://en.wikipedia.org/wiki/Feature_(machine_learning) cxi https://www.merriam-webster.com/dictionary/machine%20learning cxii https://www.ahrq.gov/pcor/potential-of-the-pcortf/index.html cxiii https://www.hhs.gov/hipaa/for-professionals/privacy/laws-regulations/index.html#:~:text=The%20Privacy%20Rule%20protects%20all,health%20information%20(PHI).%22 cxiv https://www.gsa.gov/reference/gsa-privacy-program/rules-and-policies-protecting-pii-privacy-act#:~:text=The%20term%20%E2%80%9CPII%2C%E2%80%9D%20as,linkable%20to%20a%20specific%20individual.