Embed Size (px)
DESCRIPTION
it is comprehensive
Citation preview
-ED 134 724
AUTHORTITLE
INSTITUTION
SPONS AGENCY
PUB DATEGRANTWOW,
EDRS pRICEDESCRIpTOB
ABSTRACT
DOCUMENT RESUME
CE 009 451
A JCopar George H.; Maurice, Clyde F.-47 Peocle's*Need for Additional Job Training: ProcedUe
wfOr Assessment. .
Minnesota Univ., Minneapolis. DeEit. of Vocational anl'echnical Education. ...,..,,
s
MinnesOta Researet-toorAlIating Unit for VocationalEdcation, Minneapolis. .
Nov 7676-0 4
.,
'149p. For a.related document see CE' :009 452p.
MF-$0. 3 BC-$7.35 Plus Postage.- .
Adminis rator Guides; *EducatidnAl,Needs; EduOational=Programs* *Evaluation MethodS; Guidelines; *Job .
Tr4ning, *Needs Assessment; Questionnaires; Research,-Met%cidolo y; Sampling; *Statistical Surveys; Surveys;Vocational EduCation_
The pUrpose of this handbook is to docUment aprocedure for obtaining isfo,matiOn,about the interest of people foradditional job' training. .(The\ procedure will result in a zek oftables proViding information On interest in job training for use in
' planning educational yrograms.. It is designed'to be flexible enoughfor use in areas as small 4s Schpol districts or.as large as WholeStateS and for use with a minimum of.formal training.ey personsunfamiliar with survey procedures.) An introductory Chapter diseussesthe purposes of people,s need assessment. Chapter 2 discusses '
activities, materialS, staffing and costs required formaking astudy. Descriptions'are based on experiences in ConduCting studies ofthe same type'in Steele Ccunty, MinnesotaArurai), South St. Paul and'Minneapolis (urban), and in Minnesotais Economic Development -RegionIV (regional). Chapter 3 outlines the-basic procedure for drawing a-Aldample of indiViduals ta be contacid during the 'asseftment study (amodification Of the procedures oujIlined by the-U.S. Bureau of Census
. .in its .Current'Population Survey). In chapter 4 the procedure 'forcontacting householdS and coding questionnaire responses is.explained. Chapter -5, on analysi and .summary of collected datk,provides as explanation of the su mary tables which result from theanalysis of returned guestionnaire 1 sumnary-\of.the procedures isappended along with a sawJp questio re,. an Ilidex-for hobby andSpecial interest programs, ahd ather,aids. (JT)
s
****###****444444*#****************#*************************44#**44**** -Documents acquired by ERIC nClude many informaf unpUblishtA *1.
* materials not available froM oiher.sources. ERIC'makls every effort *.* to obtain the best copy aiailable. Nevertheless, items of marginal* *repra,ducibElity_are,Cfien encountered and this_a&-fectsthe quaIitp *
the'microficEe and'hardcapy reproductions mue makes a!gilable *wia th4 ERIC Document-Reproduction Service (EDRS). EDRS is not *
* responsible for.the gdality of'the Original document. Reproductions ** supplied bfEDRS are-the ,best that can be.made from the-&iginal. ' *,'*********1*************************4***************0t***********t*******,
k,
71.

7
1
Cl
I.
7
o
4
People: Need forAdditionalJob Tri ing:Proc:- o ure forAssessment
George H. CopaClyde F. Maurice
A6141:0, AcIto6f
US
644W. 600°1'40.$
eto, 0.01oostGNv ,vt4s Of sS
ECE %SS
solsio,otoc;, po
00C- E
poCE,1°E0.4C,
sEsE000.
The project described in this report was supported by Grant 76-034from the Governor's Manpower Office in Minnesdta. Ideas andconclusions expreased frfthe report are t ose of the authors.and donot necessarily reflect. the official positio/E, of the Governor's an-power Office.
fvtinnesota Resegrch Coordinating Unitfor Vocational Education
/ :Department of Vocational and Technical'EducationUniversity of MinneSota
Minneapolis; Minnesota 55455
November 1976
of.
e-
PREFACE
The procedure described in this report is designed to col-rect infdrnation on the perceived needs 'of people for additionaljob training.- It is flexibje enough to be used in areas asflial],/as.school districts or as, latrge, as. whole states. The Pro-cgdure js destribed in-enough detail so that/it can be usedwith a minimum of formal training by penons/unfamilar withsulsvdy pfoedures.. The purpose of the collected informationis t.o improve the'decisions made in planning, approving, andimpleAenting jqb training.programs by securing'additional knoW-10,se about-_the,clients fqr, which programS are being designedand operated.
-
Developm6nt'of this'procedure began in 1970 with deliber-ations amenv.correagues at the Minnesota Research CoordinatingUnit for Vocational Education. The importance of aSsessing theneeds'af people for job-training was identified'as'a priorityat that time.by the Minnesota State.Advisory Council for Voc-ationar Education, Minnesota Researth and.Development ReviewCommittee for yocAional Education an,c1 the Division of Vocationaland Technical tducation in the Minnesota State Department ofEducation,- The first step was to develop a framework forde,fining "people's need for job training" and later, deVelop andtest means of collecting the negded information. Testing wasdone in a rural area with various size population centersSteele County, Minnesota. The result .of this effort,was areport entitled, "individual Demand for Vocational Education:Structure and Determination" authored. by George Copa, EdgarPCrsons,,and Paul Thomas.
The next tonticibuting effort in assessing.the nee'ds ofpeople for job training was a study conducted by Paul Thomas,a.3- his dissertation at the University of Minnesota under trie
advice of Edgar PersonA. In _fhis study, the procedure wasadapted for a, metropolitan area, South St. Paul, and mOdifica-tions were made to the que8tionnaire format.. Information col-lected was used in planning the vocational edUcation programsto be offered at the then new Dakota County Area,VocationalTechnical Institute.
The third major effort in assessing people's need for addiLtional job training was Conducted in 1974 as a joint project of.fhe Minneapo.lis Public chool Delstritt and the Minnesota ResearchCoordin'ating Unit for Voabstioaal Education. The purpose of theeffort was to provide infOrmation of use.in justifying;and plan-ning a'new proposed Minneapolis Area Vocational* Technical'Institute. A random sample o,f 5,000'households was contactedin the City of Minneapolis as well as a sample of seniors fromeath of Mi...qqeapolis' High Schools. In this study, the question-nrire Ni-ther refined and a specific data collection pro-
i3
cedure adopted. The result was a report en itled, "A Study
to Asses's Minneapoli,s Residents' Perceived s for Job Train/
ing". It was presented to the Minneapolis Scho 1 Board and:.
.later to the residents of Minneapolis as they- onsidered abond issu'e to raise money for the proPosed new Institute.
In another assesS'ment effort, the people's,need question-.
nairewa. a'dMinistered with minor.revisions to all tenth and -'el(eventh graders in the Anoka Ppblic School systeffi. Information
collected was used as one part of _a planning strategy for sec-
ondary vocational education/Trograms in the Anoka s.choolS.
The latest assessment effort resulting in the writing ofthis report was conducted in Mi:nnes'ota's Economic Development
Region PV with support rom the Governor's Manpower Office in
Minnesota. This effort provided akopportunity to test the
procedure in a large, multi-county rural area. A sample ofapproximately 3,600 househblds was Contacted in Region IV, along
with a sample of high Sehool senior's froM each county in the
,Region.,
The procedure- described in this report is based on theexperience gained through the effatts described above.- Expei-ience with the procedure has been in both rural and urban areasand with individuals ranging in age from grade ten to weil past
the age of -65. Initial support for developing the proc Hrewas provided by the Division of Vocational Technical Edcc:.-ion
in the,Minnesota State 'Department of Education and the DLNI:-t-
ment of,Vocational and Technical Education at the UniversiL-
of Minnesota. Later, additional s4mp3ort-vo.s provided-by indiv-
idual school.districts who Used thi procedure, and most recently,
byl the GoVernor's Manpower Office in Minnesota.,
4 .
Many individuals have contributed to the people's need
assessment procedure aescTibed in this report. Not all can be
named but special acknowledgeMent is due the following persons: N....
:Jethme Moss, Jr., fandon Smith, Edgar Persons, and Donald
Irvin colle'agUesat he.University of Minnesota; PaUl Thomas
and Kathy Novak members of the TeseaTch staff on past-effortsi
Pabl Mueller -- prOject direttor in the Minneapolis study; Gen'Olson proiett director in the Anokâ st.udy; and John Sem,Bill &harff, arid Karen Peterson project staff in the Economic.
Region IV-study. Special acknowlehement is due the Governor's
Man- ?r Qffice in Minnesota for supporting and
Ld, utTon of this report. ,
. .
...,
,
-.."'.
The authors hope_ that the protedure descrip4d will be usedwhere needed and modified as necessary to meet individualsituations toward the end of 'improving 'the educational pro-grams available to.the peoplk
A
iv
4
TABLE OF CONTENTS
PREFACE
CHAPTER I. PURPOSE OF PEOPLE'S NEED ASSESSMENL . : -
,:)
Major QuestionsUsers and Uses of Information
1
1
3:Limitationsof Information 4
,CHAPTER II. ACTIVITIES, MATERIALS, STAFFING, AND COST . 6
Secure,Commitment and. Resources 7
Hire Project Director and Secretarial Assistance, 8'Secure Space and EquipMent. for Project 9
.
Train Staff in Use of Assessment Procedure 90.,
,
Administer Assessment Study.. Conduct Public Relations EffortsDefine Population To Be AssessedSelect Sample of PoplationReview and Print Questionnaire and Cover LetterCollect Data
9
1213lS1827
Code Collected Data 28Analyze Data \.. 28Write Report of AsseSsment 29Disseminate Report'of A sse Ment . 29
Summary... , . . .. ... .......... . '. ,30
4
CHAPTER III. SAMPLING PROCEDURE 31
List Geographic Sub-Divisions 32
Identify Households in -Geographic Sub-Divisions.-. . 37Estimate Number of Sampling Segments in , .
Geographic, Sub;Divisitns 39
Determine Cumbulative'Numbex of SamplingSegments-in Geographic Area
.
.
Determine-Number of Sampling'Segments Selected ,,,from Geographic Sub-Divisions 45
Locate Househblds Within Geographic Sub-Divi,sion." 50 L.
Group Households into Sampli g Segments
I(
56Select Sampling Segitens For SamRle.,
" 'Identify Names and Addressesfor Householdsnrto be Sampled 64
Summary 64
CHAPTER IV. DATA COLL-
ECTION 66Prepare Household Identification Form 66Prepare and Mail QUestionnaires' 72
. Process Returned Questionnaises 75
Va
CHAPTER IV. (continued)toriXact Non-RespondentsCode Questionnaires ,
7576
CHAPTER V. PNALYSIS AND SUMMARY OF COLLECTED DATA . 92
Table 1.. Age' 92
Table'2. SexTable 3. .Present Occupation gTable 4. Employment Status 9
Table 5. Reason for Not Working .._ 99Table 6. Need for Education for Hobbies or
Special Interests .-1012.
Table 7. Reasons for Wanting More Education(Hobbies/Special Interests) 101
Table 8:
Table 9.
Table 10.
Table 11.Table 12.Table 13.
Table,14.
Table 15.Table 16.Table 17,
Table 18,
Table 19.
Table 20
Summary
Programs for Hobbies and SpecialInterests (Sample Information) 102Programs fbr Hobbies and SpecialInterests '(Population Estimatés) 103Courses of Interest for Hobbies .
and Special Intesrests .. 1:03
Nerd for Job Training 10.4
Reason for Wanting Job Training 109Job Group for Which Training isWanted (Sample Information) 110Job Group for Which Training isWanted (PoPUlation Information), .
for WhichJobs. Training is Wanted .
Need for More Education'. . - : 1111111'12
Time When More Education Could t;eAttended..... . . :.. . % . -. 112Hindrandes 'fo Attending Ethicationa1Trograms' 112Distance Willing to Travel'for
.
Those With Transportation Hindrance . . .. 118
Help Needed.to Determine EducationNeed' 119
149
CHAPTER VI. 'PROCEDURE SUMMARY. - ... . . .... : 121Infoxmation Needs 121Data Collection 121Management &trategy 122
APPENDIX I. SAMPLE QUESTIONNAIRE 125
4 APPENDIX II. INDEX POR HOBBY,AND SPECIAL INTERESTPROGRAMS
z APPENDIX III. USING RANDOM NUMBERS TABLE
129
133
.APPENDIX IV: SAMPLE COMPUTR OUTPUT ON SAMPLINfSEGMENTS . . . ...... ..... , . . 137
APPENDIX V. RELIABILITY OF pOPULATION ESTIMATEa . . . . 141
';'"\
6
CHAPTER I
PURPOSE OF pEOPLE'S NEED ASSESSMENT.
Those.responsible for providing educationaf programs designedto prepare people for work face the tYpiCal questions of,what,hoW,much', when, and'where., In answering these questions, theyconsider past.experiences and resort to "best guesses" about thefutute. .Consideration iS given to what "could" be done and .what"should" be done, but eventually they-Must detide WhatN"will"be done.. Many factors enter theldecision making process, such as:.(1) whatflare the demands of ;rindustry.for trained workers, (2)
what are the interestS of people for job training, (3) what.arethe types of, training programs which can be,provided legally byparticular funding agencies (e.g states under federal vocationaleducation legislation, prime sponsors under the CoMptehensiveEmploynient and Training 4st), (4) what training Apgrams can beprovided more effectivelythan from.alternatiye sources, (5) .
what.is the q ality of the training program wWich can be Offered,(6) hoW acces le is the training program in terms of providingequal opportun y, nd (7) is the training program efficient.
The' purpose of this handbook'is to document a procedure.forobtaining information' about one of-these factors interestsof pebple for job training. The importance of this factor stemsfrom it being the "wislies of the consumer" in the market 'placefor educational services. It isinformation about the perceivedneeds Of the buyer of job training services.- It is.only one of x/several types of information, which enters the educational decisionmaking process; but it is information which cannot be ignored,in a quest for relevance, use (i.e., enrollment), and dprehen-siveness of services. ;
,
MAJOR QUESTIONS
What are the major dimensions or ways of characterizing'the perceived needs of people for job training?v The an$wershould relate to how the-infórin'ation will be used. A maiordicotomy in use appears to be in deciding what job training .
services are needed, and in deciding how the services aw tobe offered..
Decidirig what servicks are needed requites information aboutwhy the training is needed (e.g., to prepare for dfirst jpb,to prepare for job adVancement or promotion); wha\type oftraining iS desi-4ed (e.g., secretarial, welding-, agricultural
s7
. .-
production)LandlioW many indiViduals want the training. The0
importance of the firsttwo.categories ofl,informatiop restsan the assumption and general practice that different trainingprograms are indeed-needed and can be designed and otfered for
Andividuals With diffetecombinations, of resPonses to the "Why",and "what.type" questionS.. For example: the,program to prepare:individuals fora first.job as.a.secretary is usually different,4om'a program to,prepare indi..V-idUals.to be' iiroll)oted or advancedta-;bea secretary. The difference is hot alway§(in content, butmay be in length, depth, or mode of deliveTy. The question ofhow many want the s4rvice ha's direcyimplioatiOns for the prior-ity b.f.' the program relative to other prOgims.
The qUestPon.of how.to deliver jab training services promPts.Auestions about when training can be attended, where can training' be attended, what are the special.,barriers to,atfendance, andother characteristics of the tonsUmer suth as age and eMplaymentstatus. ', Answers to when training.can be.attended (e.g., days,,-nights, weekends) have impLications forwhen Services should be'scheduled so as to be widely accessible:. InforMation about where -
. programs can be attended can be determined from responses toquestionS of.present location and the distanCe prospective en-rolleeSaje willing to travel. Knowledge of special barriers toparticipating in jobstraining servii,90s is particularity useful
.in deciding how or under'what conditions services,Will Joe offered.Sarriers may.involve concerns such as.lack of child care andtranSportation serviCes, insufficient resources to pay tuition',orcinadequate knowledge of what programs are available. These-cohcernS may iMply the need for services beyond job training.such as child care, tra,Ksportation facilities:counseling andguidance-serVices, and financial assistance. Without these ad-ditional services the programs are really ot accessible tosome people for reasons beyond their own control..
. .4In ,iimmary, the majof questions to be answered about the
perceived needs of_peoplor additional job training in makingdecision§ about educational:programs to meet these needs are:
11: Whr is,,ttaiffing needed (e.g.,.prepare for
first job)?'i
2. What type of training.is needed (e.g.,welding)?
3. How many want the training?'
4. When could:training 8e attended?
5. Where could'training be attended.?
4
v
6. 'What are special baYrjers to attendance?
7. What arc the characteristics of-people,to be served (e.g, age, employmerit status)?
\ . .,,
These.questions.form the leis for determining what infotmationtb bC.collected in th 'procedure explained in this handbook.
S .
.
,.. USERS AND USES OF INFORNIATION
Three major uses of .information on the perceivea needs ofpeople for job tradningare in the functions of planning, approving, and implementing-job training programs. These functions ,
arc often carried out by different gtoups 6f individuals. '
Planners can Use tshe informatten in defining the full array ofalternativp programs whictll.are,needed. Further, they can usethe infoymation in defilaing the alternative programs (e.g.,what are the characteristics of a "program"y.baw are the needssub-divided cnt6 mutually, exclusive and exhausive parts.). Plan-'nets- must define programS-in Order to array them and estimate"b. ,...
hOw-the program can be accompaished and how much dt will Cost.As'already mentioned, the infOrmation,about perceived needs canbe used in deciding "how" to delivet the proZramland, thereby, inesfimating its.likely,cost., Information -on how Aany want theprogram also has implications for Gost. .The.planners, as thought/fof,herc, arethose who staff, state departments-of education,prime spona..r...Lpg6ncies, economfc development commissionso andadministArators in loCal educational:agencies (e.g., area voca-tional tecnnical institutes, econdary schools, community colleges,-universities) ,
. . . . _ . . . f
:File second group of users is thqse' who fu.kction to approvejob trainimg'programs,. They use the information to set prior-ities among the array of alternative Programs In this function,prjorities are yeighed against resou
i
ces and "go/no ge" decisionspre made. Tho ipformation on petcei ed needs of people forvarious programs'can be used,as indi a tors of relevance and pot-ential utilization. The appirove'rs arespncerned with the "value"of the program.and its cost. Several ,factors are important indetermining "value", and one is the "acceptance" of the kdgramby those who are to benefit fröm it. PerceiVed needs of poten-tilal consumets can be-used as a measure'of acceptance. The"Spprovers" are thes.d who are mdmbers Of the legislative, exec-utive, andjudicial branches of government; nd-members,of schoolboards, college 'and university 6oards, state boards, and economic
9 .
3
development commissionst,
The third group of users are those who-funvtion to implementl
job training serlds,es. Their job is to decide specifically,howthe programs are to be operdted an& be active in their Operationand management.- The decision of how to implement is uniquelycharacteristic to each different situation in terms of time,
place, and the individualsinvolved. "Implementers" can use,
, the information in deciding how to make the programs4accessib;le
.and relevant to potential participants. The concern is with sel-
ecting the right time, place, subject matter, and instructor:Perhaps the use of the information on perceived needs of people
for additional job t, ining is moTe tenuous for this function
than for the two pre.tously-described. The reason is not thdtthe inforMation itself is of les use but that there aTe manyotherstypes of information which may be equally important (e.g.,_what facilities dre available, quality of instructor avaj.Lable,
how many students will actually shOw up, fit with programs offered .
in therecent past).. The "iMplementers" a're usually the intruc-tors and their iMmediate superiors (e.g., department heads in -educatioRal institutions, directors of continuing education Pro-
grams). .
LIMITATIONS OF INFORMATION
Before going further, the information on the Tereeived needs
,of people for additional job training -must.be put in perspective'.
The t011oiving list of limitations is intended asl"consumer prP-tePtion information" for those contemplating theuse of the pro-
) cedureS dgcribed in this handbook:
1 The information proxided is a self-perceptionof need; it depends on the current knowledgeand understandinvof the'respondent concerninghis need for additipnal job trainin/,specific type of joli training of interest,'d the benefits tobe obtained by attending,)
training program.
The'Antensity of perceiVe6T expected utility fpt whscale.which cdnbe-:applied.
a measurethe17e.is no Common&
>i.fdily to and by
each resTon)pnt. Only ordina1:1116a urement and
44
analysis'ar possible witha*t.mjor dssumptions.
, 3 The need as previously Stated, is only perceived.Certainly, there may be individuals in the pop-ulaeion who "need!' job training but dO not recog-nize this needfor one 6f several reasons (e.g.,don't knOw the benefit, are not aware of theirproblem.). ,
4. Petcefved heed is a measureof interest in'aparticular kind of additional job trainin,g anddoes not-mean that the individual would alwaysactually enroll or attend if the loragram,wereoffered.
5. The procedure advocated inv61v4s a 'Sample of thepopulation of an area at a giveh tiMe of year in.a particular year. Depending oh sample sizerelative...to population size and.the complete-neS's of response, -an-error of estimate-isexpected. Also, relative to time-of measur-ment, variations are expected in perceivedneeds depending on season' and year.
6. The information on perceived needs of pedple'is most useful in conjunction with-Other equal-ty important iriformation (e.g., demands ofindustry, program efficiency, program quality)..If this other dnformation is not available atthe; spine time,, the usefulness of the perceived.need for job training may be haMpered.
Where possible, the prOcedures which follow have been designed to, minimize these-limitations. but nevertheless, th'ey continue toexist in s'ome degree..-
Ale
4CHAPTER II
u
MATERIALS,, STAGINq, AND" COST
CondictinA a study to assess People's need fc6- additlionaf
job t.raining requires consider ble planning and coordination.
1This chaptC"r will describe the ,ajor activities in doing the-
, study as well as the resources required. These escriptions
are based on experiences in bon4ucting studies o in
_Steele County; Minnbsota; South-St. Paul and Minnea
Minnesota; and Minnesota's.4conomic Development Regi n IV.1
*
The major activities., which have to be planned and carried. 9
out are: ,'
1. \Seeure commi.tment and resources for'assessment. A
2. Hire local project directbr and secfetarial
assistance.
13. Secure space and equipment for project.
4. :Frain staff in .use of the assesstent procedure.
S. Plan assessment'stud.
1 See.the following publicatiobS for a.aescription of each:study,
respectiVely:
Copa, Geerge, Persons, Edgar and'Thomas., Paul..Individual Detand
for Vocational Educati-on: Structure and betermination. inhesota.
Research Coordinating Unit for Vocational Edusation, Univers1ty_MinDP4Ipolis,, February, 1973.
Thotas, Paul: Method to Determine- tile. Vocational Education Needs
of Adults in South St. Paul, Minnesota. 'EcLD. Dissertatioh.;.,
University of Minnesota: Miuneapolis, 1974. ,
.
* -
Minneapolis Public Schools and Minnes6ta Research Coordinatifig'
Unit fol- Vocational Education: A Study to AsSess MinneapolWResidents .Pd-tcpived Meeds for.JOb Training. Minneapoli.s..Pubtdc
Schools:: -Minn6apoliso. 1974._
Copa .Georcge and MauriCe, Ap.Clyde.eople.'s Ne d for Additional
Jobllaining: Development andjvaluation o an,Asqs,stOnt .!';" .-
Procedure.. Minnesota ResearChCo.ordinating pr14 for Vocati:onal
Education, Univiprsity of Minnesota: Minneapolis, October,'197,6,--,---/ . 1 l';
1 26
5
..
,':i r, 1
, 4 r42 4 ' . ' e . ''' 6. Condu.ct, public relations .effo,r.ts:'
J
-
Oefine popultii.2. be,assessed.
81.-.teleRisampl'e vof popula j.l?n:
.
9 ,1 Review ang ptint questiOnnaire,5 a/ridcover 4lette'rs :: . '.:"'
-.
0:.
10.- '.-tolaecf aata. Af., c
14. Code collected data
--42.0hnalyze data.* r p. ,1/4 _
13. Write report of asSessment., __,.
.,
,.14. alsseminate asseeS-sment report.
41
Evp ofvthese activities will_ now be destribed. Becauseactivities 8, 9, 10; 11, and 12 require lengthy descriptions,=they are covered in separate Chapters of this handbook and,therefore.; will be'only briefly treated in thiis chapter.
rSECURE COMMITMEW-AND R OURCES .
Administrative commitment for the asses ent should be'based on the uses of the information as presen ed itnsghapter I.'The assessment might be commissioned by the' pla ners, arirovers,or'implementers of jobr training programs. In a y case, all threetgrobps should 12e .1a4LI.g.ht together to make them aware of theassessment, and solicit their thisactivity Will pay oftl later whenC.the assessm t is completed andusd Of the information is a concern.
Commitment to do the assessment is usually indicated by the ,/
allocation of funds to do the study. The athount of funds requir6d.4-depends op several ,factors such as: (1) size oT population to. .
be,assessed; (2) needed accuracy of assessment, (31 density ofpcepOation (i.e., urban versus rural), and (4) availability ofresource materials. In general, the major factor is the number .
of households to be surveyed (i.e-., sample size). Past studieshave indicated that the cost is likely to average about threedollars per household surveyed. Therefore, if 3,000 ,houSeholdswere included in the sample, the co t of the asvssment would ibe
137
;6
"-r
I-41
fo
/ ' .404k '
1;- c .
.
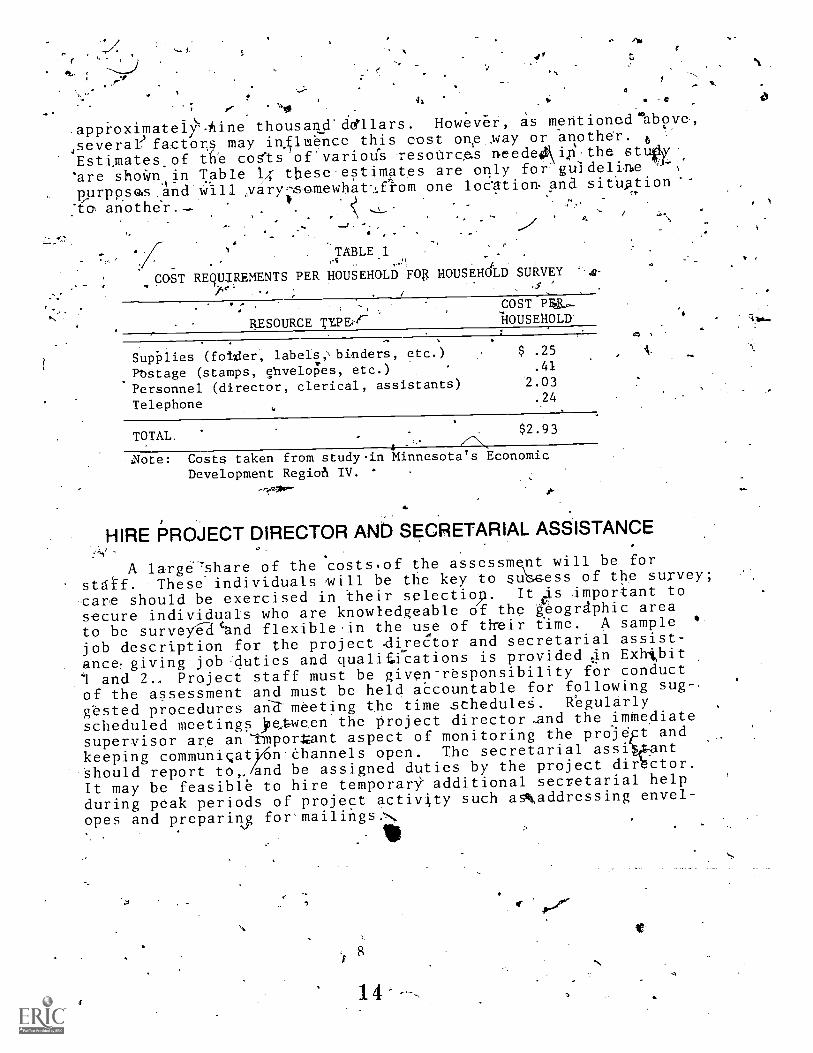
.approximatei.Aine thousand.dellars. However, as mentioned%bove,,severaefactors.may inluence this cost one.may or another. 6 '-
Esti,mates.of th'e cosqs of-varimis ,resoUrcas.neede.0\4i,the st ,
'are sholan4in Table 14 theseestimates are only tor''guldeltme
purppse.s.and.Will yary-s-amewhat...,flom one loCation nd sitUationt
:to anoth&r. _.
,
o
TABLE 1
cosT REWTREMENTS PER HOUSEHOLD FOR HOUSEHAD SURVEY
.
RESOURCE TYPEt44
COSTii0USEHOLD
SupiDlies (foieer, labels,\ binders, etc.) $ .25
Pbstage (stamps, Ovel4es, etc.) .41
Personnel (director, clerical, assistants) 2.03
Telephone.24
,
TOTAL-.t
$2.93
Note: Costs taken from study.in Minnesota's EconomicDevelopment RegioA IV. '
,
HIRE PROJECT DIRECTOR AND SECRETARIAL ASSISTANCE,
.
A large'Share of the costs.of the assessment will be for
stdtf. These' individuals mill be the key to st;sess of the survey;
care should be exercised in their selectiop. It.i.is dmportant to
secure individuals who are knowledgeable of the geogrdphic area
to be surveye-Pand flexible.in the use of their time. A sample '
job description for the project director and secretarial assist-
ance giving job,duties and qualiications is provided lin Exhibit
1 and 2.. Project staff must be given-responsibility for conduct
of the assessment and must be held atcountable for following sug-,
gbsted procedures arid meeting the time stheduleg. Regularly
scheduled meetings letween the project director,and the immediate
ct--asupervisor are an 'Import-ant aspect of monitoring the pronje t and
keeping communigatOn-Channels open.. The secretarial assi .nt
Should report te,./and be assigned duties by the project dir.ctor.
It may be feasible to hire temporarY- additional secretarial help
during peak periods of project activi,ty such agt,addressing envel-
opes and prepariu for' mailings.°.
.- 10
;
4
6
1
ofe=1
. ,
sr, ..,
S,ECURE -SPACE ANMEQUIPMENT FOR PROJECT.. .
, ,: i
. P-1.4siect acOwities wijl requiV several tyges of facilitiesand ecfuipment nordIally found in buslIess offices. ' Staff shAld
. 4be prdVide-d office ,pape, desks, filing space, typewriting, andother,sndard office-isupplies. In additi.o s because'severallarge mailings will'be conducted and mariy teleRhone calls re- .,
quired., the staff should have their awn telephOne lige'and actessto spacefor.preparils maili9gs. ..Spce mis jiso be,ptovided Aar,Storing t,onsiderable numbers of clirestionnai , envelopes, le't-'ters!., maps, and reference 'resource mAeria
,
I
. TRAIN STAFF IN USE OF ASS'ESS,ENT PROCEDURE, .
: Specific procedures have been developed and tested to con-duct the A-'sessment in an effectiveland efficient manner. Basedon past experience, it is essential that g idelines be llowed
g:explicitly. This'handbook describes the rocedures to b fol-lowed in conducting the assessment. In a ition, consult tionwith and attendance at workshops provided by staff of the _
Minnesota Research Co9rdinating Unit for Vodational Education willassist in developin'A speciari7ed competence in conductin theassessment study.-Canferring with other'-individuals who avedirected a study of thi,kind in the past may also prove helpfu
. .
-r
/ye
ADMINISTER ASSESSMENT STUDY
If the needs study s to rUn smoothly, it must be plannedand dire\cted efficiently. After reviewing each of theeMajoractivities and recelving training'on the assessment procedure,a detailed plan of owratio_whould be formulated.. The planshould define activities to be undertaken, determine when theyshould start, deter'mine deadlines.for completion; and identifyperson(S) responsible for-carrying put the activities.
'.1**
The plan will serve to keep the study on scheduldPand makeit a more manageable task. The time estimate for various activ-ities as shown in Table 2 may ta helpful in Setting timeschedule.
9.
10
so
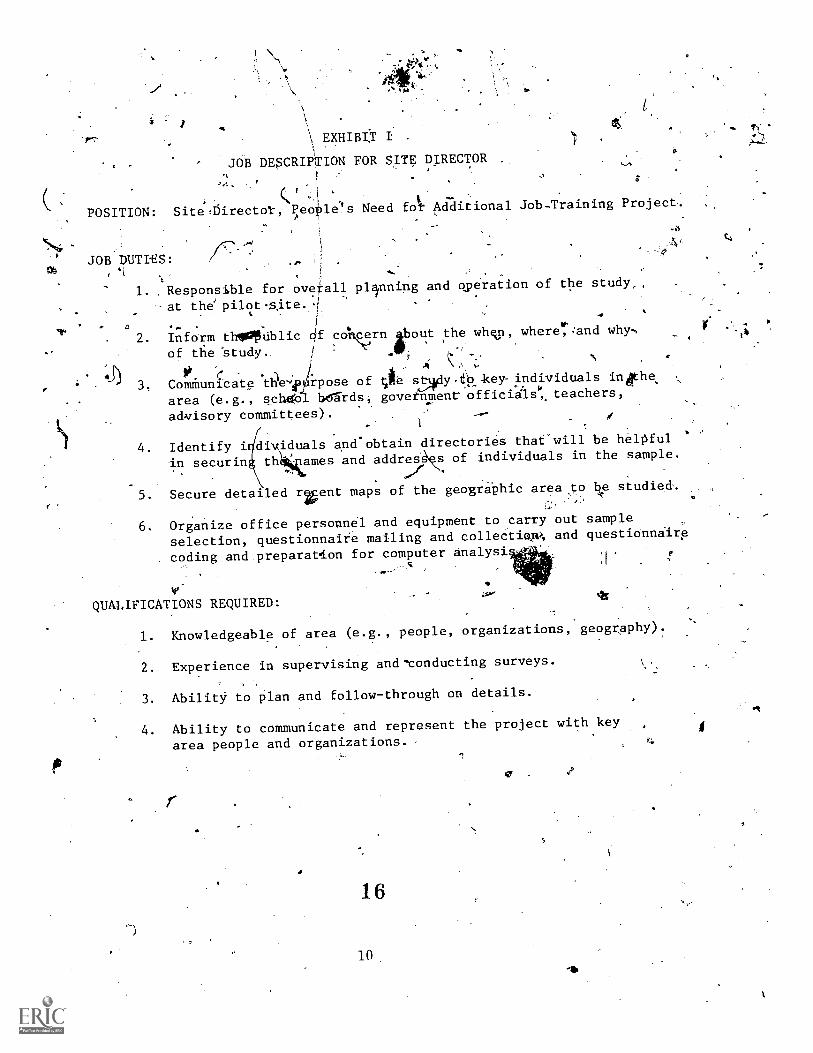
\ EXHIBtr I
JOB DECRIPTION FOR SITE DIRECTOR
( , CPOSITION: SitelDirecter, p4eople's Need folt Adational Job-Training Project.
-
JOB DUTIES:7
'1
1. Responsible for ove*all plinning and operation of the study
.at the' pilot s.ite.
;
e
2. Inform thOOldblicof tfie °study..
3. ComMunicate tHev rpose of Ole s Rey- individuals ingthe
area (e.g., ,schb1 begrds, gove nment-OfficiYls", teachers,
advisory committees).
qf concrn out the whsp ,., where,;and why
4. Identify i iduals and'obtain directories that-will be helpful
in securing thiames and addres s of individuals in the sample.
5. Secure detailed rzent maps of the geograbhic area ,to bte studied.
6. Organize office personnel and equipment to .carry out sample
selection, questionnaire mailing and collectieW, and questionniire
coding and.preparateion for computer analysi1
V'QUALIFICATIONS REQUIRED:
fa
-)
1. Knowledgeable of area (e. ., people, organizations, geography).
2. Experience in supervising and-conducting surveys.
3. Abilit3.7 to plan and follow-through on details.
4. Ability to communicate and represent the project with key
area people and organizations.
16
10
ff.
4
f
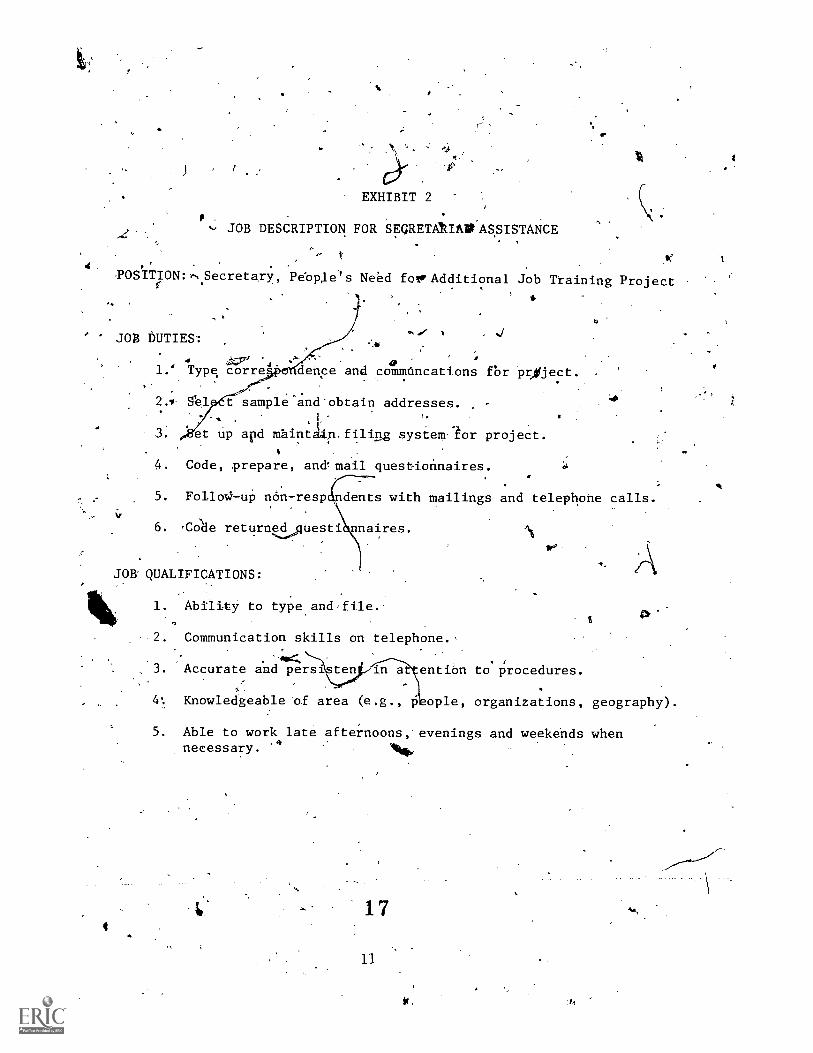
EXHIBIT 2
.
.
JOB DESCRIPTION FOR SEQRETARIAMIASSISTANCE
r
OSITION:1-,SecretarY, Pebpje's Need folvAdditional Job Training Project
JOB DUTIES':
JW74 '4 01.' Type corre dence and commüncations ror PrAlfject
2.0. 541 t sample and'obtain addresses.
3. et up apd maint ,n.filing system-tor project.
4. Code, prepare, and mail questionnaires.
5. Follor.3-uP nOn-resp dents with mailings and telephone calls.
6. -aide returned,guesti nnaires.
JOB QUALIFICATIONS:
1/41. Ability to type.and file.-
2. Communication skills on telephone.,
3. Accurate and pe;;Isten in a entibn to procedures.
4.. Knowledgeable of area (e.g., ople, organizations, geography).
5. Able to work late afternoons, evenings and weekends whennecessary. .4
17
11
0 , ti
44,
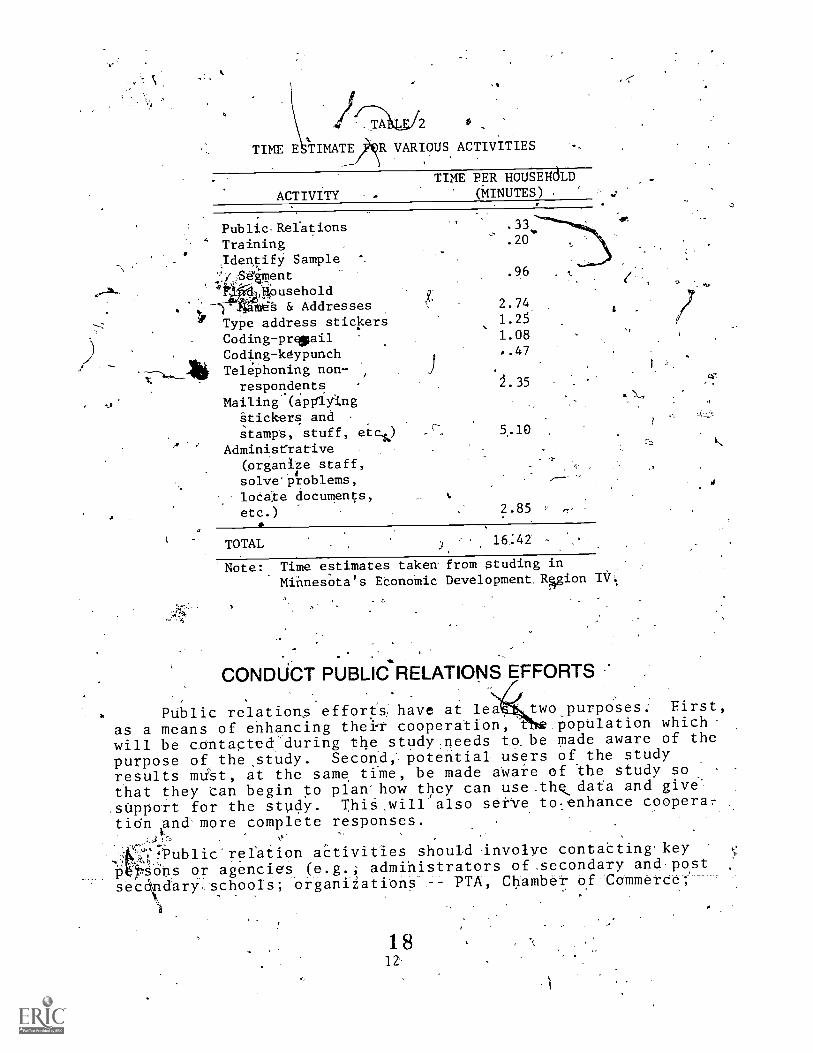
TA 2
TIME E TIMATE R VARIOUS ACTIVITIES
0
ACTIVITY
TIME PER HOUSEIAD(MINUTES)
Public-Rerations .33..
Training .20
Identify Sample '
'V'Segment .96
11: Apuseholds & Addresses 2.74
Type address stickers 1.25
Coding-pregail 1.08
Coding-keypunch ..47
Telephoning non- J .
respondents 2.35
Mailing.(appriAngStickers anastamps, stuff, etcl.) 5..10
Administrative(prganife staff,solve'problems,locate documents,etc.) 2.85 .
TOTAL 16:42 -
'Note:, Time estimates taken- from studing inMinnesota's EtonoMic Development_ Rvion IV
CONDUCT PUBLIeRELATIONS EFFORTS,
Public relations effoTts have at lea tWo purposes: First,,
as -a means of enhancing'thei.t cooperation, population which'
will be contacted:during the, study:rneeds tobe made aware of the
purpose of the.study. Second, potential users of the studyresults.mdSt, at the same tiMe, be made a'ware of the Study So
that they tan begin to plan how they can use.thecdata and give.suppoTt for the study. ThiS,will also serVe tolenhance cooperartidn an& more complete responses.
k
:;,lic
_
eub rention aCtivities should involve contaCting' key
tpso_s or agencieS (e.g.; admihistrators of ,secondary and.post
seccidary .SchOols-; Organiiations .--' PTA, Chatbet Of-Commerce.;. . ,
C2r.
1 812
I
.
governmenta.1 personnel mayors, 'county'co;liasjoners3.andpreparing newspaper-and raddo news releases. The to mIlnity
- must be informed ab ut the assesSment study bdth befbre and, -during the study. ublic relations'activities should be sched-uled so as to provi maximum contribution to4the success of -
the study. In gene alrpu:blic relations aCtivities ill be. aorajoil responsibility of the project director. ,
f 4 ,,te
DEFINE POPULATION TOBE ESSED
'The 'population" is the gToup individuals,a4out which .
information.on perceived need for additional job taiz1ngservices is to be obtained. The instrument for dadescrdbed'ki a lwtter seCt'on-, was detigned for use wi,th anyoneof high school,age and-over ith normal\reading abilities.'To date..it haf been usedswith tenth and eleventh4lgraders as-well as adUlts well past°the age o-f 65.. f
It.q.S-SuggeXed that data be 011ected'on broadly definedpopulations, in order to keep data on smaller subsets of thepopulation (e:g..age groups, sex groups, groups Iaith particulari terests) in perspective-for planning purpose-s. Essentially,
finition of the population will'depend on. Mire purpose of thet_udy,,the geographic area to which generalications will be made,
and the amolinipof resources available to conduct th0 assessment.Jf convenienOrthe pOpulation should be.defined in terms -of.kxisting geographiC location boundaries, (e.g.; school.tricts,counties) so that:.other° data (e.g., CensU% of Population, CountyBusiness Patterns) is conVeniently availWe about the popula-tion in question.
'
kELECTSAMPLE OF POPULATION
While there are several methods:of sampling that miiht pro-Vide good representation of the. population,0 methqd that,-appearSqto be least costly in both time and.money is one based(on the
. tl. geographic location of ho s'eholds., It- inVolves a ranaom saMplingof sampling units consi$ti g Of abOut.six; households each. Themajor advantages of.this Method of sampling are: (1) much.of.the_work in identifying the sampipe can be done in an-office by_secretarial personnel, (2) everyone m st live somewhere, thus,
lk19, 13
4
the "hausehold" allows potential contact with everybne in the
population, and (3) the general proceduTe hae been ddcumentedand used s,uacessfully for other purposes Bor Some time by the
. -.-
°
Curr6nt Population Surveys/of the Bureawof.the Cens Tht
sampling'procèss is.descrtbed in detail_in a laeer tef of
this report....?
. ,
,
The.proposeccpampling proCedure is ITiost.'alppro riate if use
.
J.
when sampling adults inka particular geagraphix rea. ,If inform
ation is wanted oll,ey febm individuals in the Ja.t leats of high
school or post:secondary Gchools, it,may be4pore appropriato,collect infoymation from every ne meeting these criteria.administering the,qUestionnaire in school.
Anothe-f,imortant aspect of the sampling question is to
det mine-the sample size needed. The solution to.this problem
.1s based on'Imany factors,.orwhich only'a few of-the most impor-
't nt will be dealt with here.4 In.discussing-these factors, it
s assumed that the estimate heing made.is the prp.otion of7persgesin the ptgulation wlio'fit a.particular
if 4. 0 r-the proportion of pqrsons in thepovUlatdon int,,-:vy enrol-
.
Ling in an autt,mechanics pzygram)1. It.i71,!.!; 1 1,1.&.r. i. at th6
ampling method is a ;ple ilOndom Sainple10.
i ,,,
>fir
With these aSsumptions in..mind, thef406 '.rmport4lt to,the sampling question conside,ved here are:t4 desired dcuracyin fhe estimate, (2) the expected proportio4df persons,icategory before doing the studyY.M1 resourcv, ayAilable tduct the study, and (4) the population size4'
,
With unlimited resources, one can, et,100 percent a curacy
by making the sample the Same sige,at-th- population. However,
unlimited resources are not the4usua1 "case.,-. so this alternative
can ht ignofed! exo4pt when the population 1 elatively small
.
a'particular SchoO1).4 and easily accessible' (e.g., all'students.
2Fo more detailed study, there are several books and publications
which' deal with this topic. Someexamples are: .
Walker, Helen M, and-Joseph ev. Statistical Inference, Holt,
Rinehart, and Xinston: Ne.York,,1953.
i
.
,,-
Slonim, Morris James. aiipling, Simon and SChuster: New York,
1967.
Kish,Leslie, Survey Samplinz, John Wiley and,Sons, Inc.: New
York, 196.
14
2 0
' I
4When r SO.urces are limi:ted and till* opuI tion large, a Sampleof so eze less thap- the,population_m t be considered.
\k,
With s'ome resource flexi lity, it is logical to start bydecidingupon the acc1.1.14i necessary to result in valid laforma-
,f tion. for the purposes intended. brings into,playiithe rade-off between accuracy of inf rmation and the ambunt of
- ilesources requtred-toobtain the i formation. Generally, the' more acctrate one wadts to be, the arg r the Ample requlred,and, therefore, the higher the costs.
.r
_
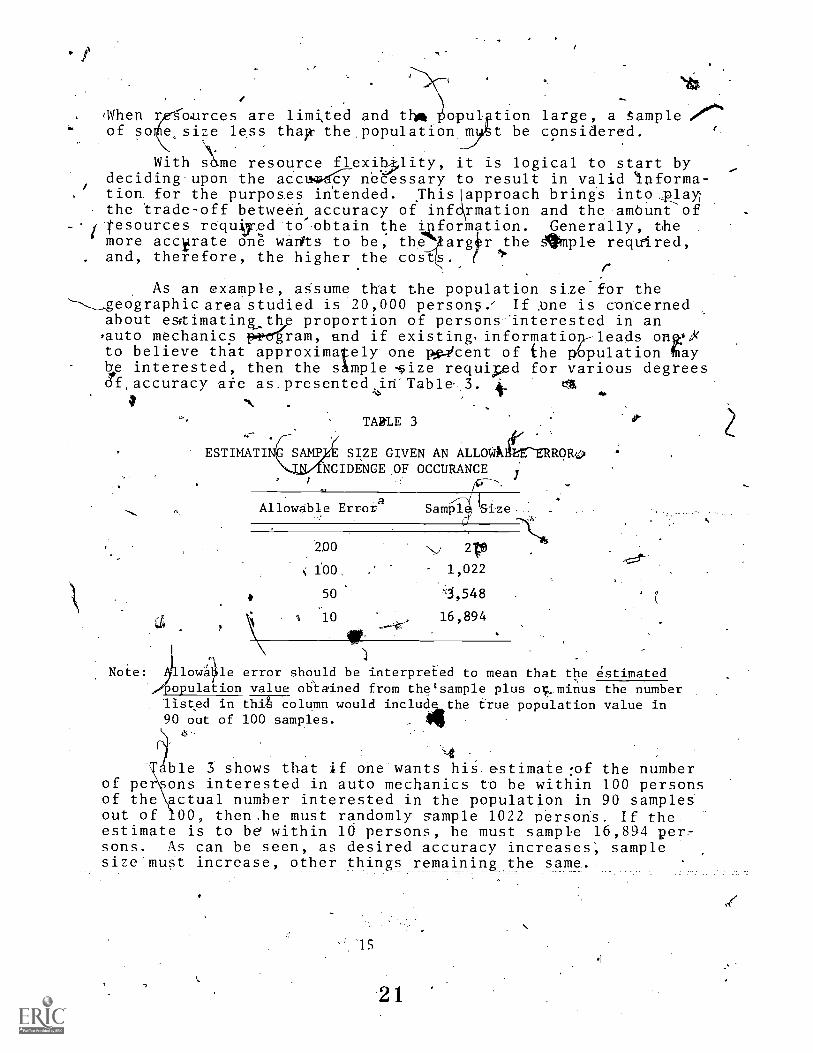
As an example, aSsume that the population size for the'--,geographicareastudied is 20,000 personf If Apne is concerned
about estimatinILIT proportion of persons-interested in an'auto mechanics ram, and if existing.informationleads ong)(to believe that approximately one nacent of ihe pbpulation fiaybe interested, then the sAmple *ize requid for various degrees*
.
of,accuracy afe as.presented in'Table3..
I N .
ESTIMATI
TAKE 3
C:IRRSIZE GIVEN AN ALLOA ORk2
NCIDENGE,OF OCCURANCE
Allowable Errora /Thl
Samplq Size-
2.00
f00,
50
10
ir-
Note: llow4le error should be interpreied to mean that the estimatedopulation value oblained from thetsample plus ov_minus the number
listed in thit column would include the true population value in90 out of 100 samples. 4
21p
1,022
1,548
16,894
ble 3 shows that if one wants his estimate:of the numberof per ons interested in auto mechanics to be within 100 personsof the actual number interested in the population in 90 samplesout of 00, then.he must randomly sample 1022 person's. If the.estimate is to be within 10 persons, he must sample 16,894 per.-sons. As can be seen, as desired accuracy increases; samplesize must increase, other things remaining the same-.
15
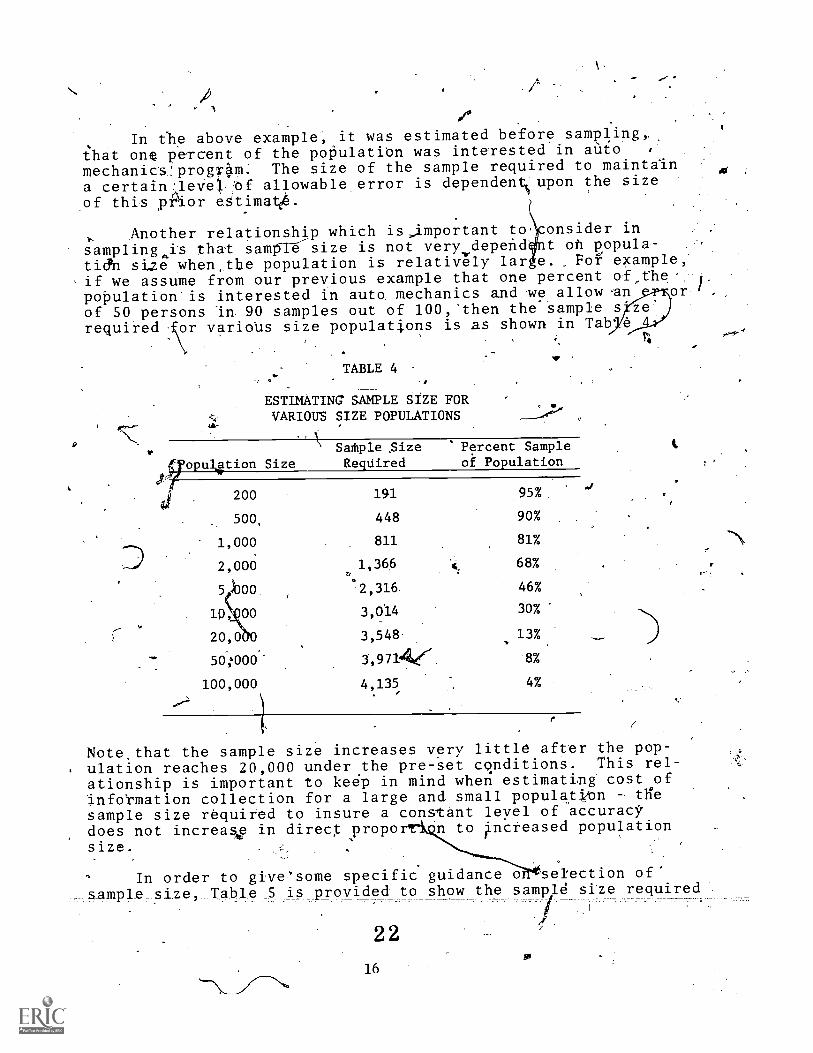
In the above example, it was estimated before sampling,.that one percent of the poPulatiOn was interested in auto
mechanics:progr4m. The size of the sample required to maintaln
a certain .1eVel ,of allowable error is dependentisupon the sizeof this pi4or estimate.6.
Another relationship which isimportant to, onsider insamplingis that sampl-e--size is not very,depeñd1nt oh popula-tioen size when:the population is relatively lar e. Fof example,
,if we assume from our previous example that one percent of,the.' /
population is interested in auto mechanics and we allow 'an Or /
of 50 persons an 90 samples out of 100,'then the'sample srequired- or various size populations is as shown in Tab'
9
TABLE 4-1
ESTIMATING SAMPLE SIZE FORVARIOUS SIZE POPULATIONS
ate
Satple 5ize PFcent Sampleopu1gtion Size Required of Population
200
500,
1,000
2,000
51b00.
10, 00
20,0'O
50.000."
100,000
191
448
811
1,360.
.2,316.
3,014
3,548.
3,97144{
4,135
95%,
90%
81%
68%
46%
30%
,13%
8%
4%
I.
Note.that the sample size increases very little after the pop-
. ulation reaches 20,000 under the pre-Set cgnditions. This rel-ationship is important to keep in mind when estimattng cost of'info'rmation collection for a large and small populattbn tge
sample size required to insure a constant leyel of accuracydoes not increav in direct propor n to picreased populationsize.
In order to give'some specific guidance o selection of'
sample_size, Table 5 is provided to show the sample size required
2 2
16
/
f
TABI,E 54 e
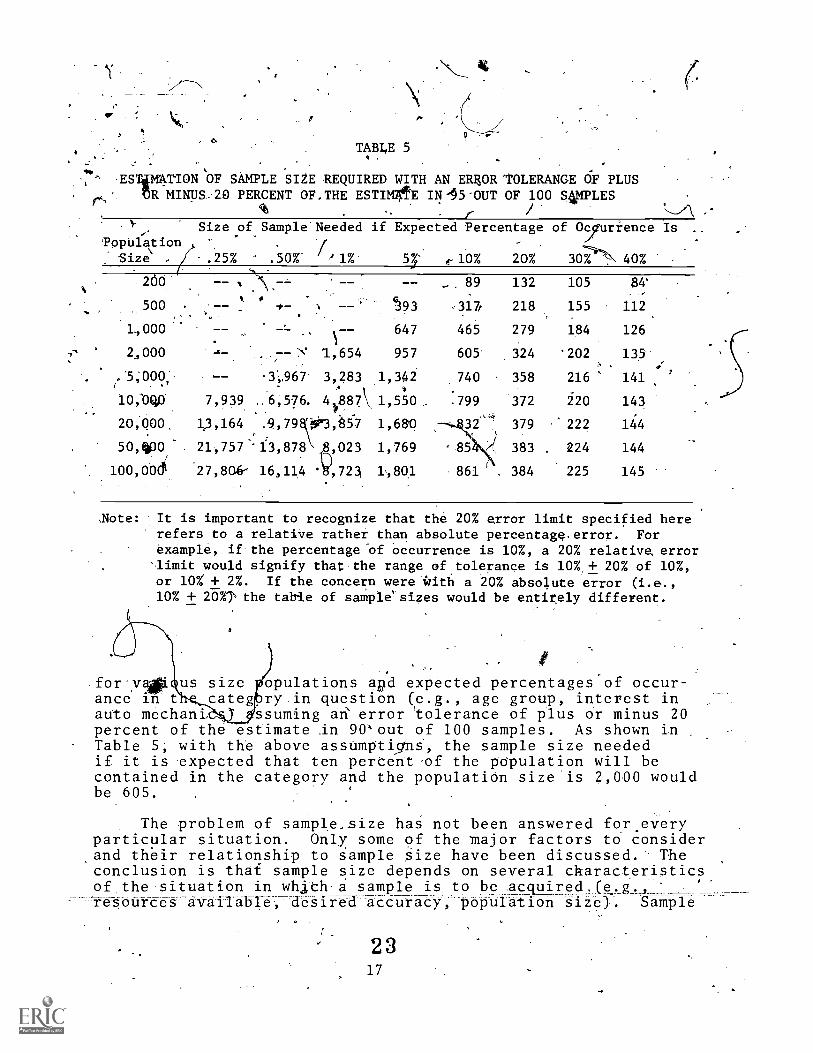
ESTiM4TIONOF SAMPLE SIZE REQUIRED WITH AN ER4OR 'TOLERANCE OF PLUS6R MIN1JS.20 PERCENT OF,THE ESTIM4gh IN'15'0UT OF 100 SAMPLES
, r
PopulationSize ,
Size.of.Sample Needed if Expected Percentage of Orrrence Is
.25% .'50%- '1% 53' d- 10% 20%. 303-* 40%
260
500
1.,000
2,000
(.3;000;
10;00,0
20,000
50,1130,-
100,006
--
7,939
13,164
21,757
27,806^
-
t
1,654
-3,967 3,283
_6;576. 41,887
.9,798c03,:857
'13,8788,023
16,114 4,723
393
647
957
1,342i,
1,550 _
1,680
1,769
1,801
89
.317/
465
605
740
.799
32
' 85
861
132
218
279
324
358
372
379
383 .
384
105
155
184
'202
216
2-20
222
224
225
.
84'
112
126
133
141
143
144
144
145
4,-
'
,Note: It is important to recognize that the 20% error limit specified hererefers to a relative rather than absolute percentage,error. Forexample, if the percentage 'of occurrence is 10%, a 20% relative error*limit would signify that the range of tolerance is 10% + 20% of 10%,or 10% + 2%. If the concern were ilith a 20% absolute error (i.e.,10% + 20X7 the table of samplessizes would be entirely different.
for-v4. us size 6opulations apd expected percentages of occur-ance in t catepry in question (e.g., age group, interest inauto mechani, /ssuming ari error tolerance of plus or minus 20percent of the estimate An 90out of 100 samples. As shown inTable 5; with the above assumptiOns, the sample size neededif it is expected that ten percent-of the population will becontained in the category and the population size is 2,000 wouldbe 605.
The problem of sample.size has not been answered for.everyparticular situation. Only some of the major factors to consider.and their relationship to sample size have been discussed. Theconclusion is thai sample size depends on several characteristicsof the situation in whltha sample is to be acquired.(e.g.,resources availabfe, desired accuracy, population size). Sample
,
2 317
1.
qz,
L.
Can be specific only afteft these charateriistics are madeI
explicit. t .
\
REVIEW AND-PRINT.QUESTIONNAIRE ANID COVER LETTER
. ,
.
The exact questions to be, asked are dependent on the pur-
(I pose of the, studr and somelAat on the populatiqn Of individuals
4e-ing assessed. '.The,questionnaise Presented here Is that which, .
was developed'and used.ikAhe needs assessment StuOconductedin EconoMic DeVelopment_Region IV in Minnesota.3 nt wasdesigned
to obtain.inforthation about need for more education ffIT j61). :
preparation as werl'as.hobbias and special int res1s.. The Sampl
questionnaire and its bases,will be described ik this section.The questionnaire tan be used as is or can serve as a starting
point for developing a more specialized questionnaire suited to
particul r purposes
Review of Questionnaire
The questionnaire was developed to answer the qbestions,posed in Chapter I as being important items of information about
a population to be served when planning educaXional programs. '41,
These questions were:
'1. Why is training needed (e.g., prepare for the
first job),
2. What type of training is needed (e.g., welding)?'t
3. HOw manY want the training?
4. When Ould training be-attended?
S.. Whbre could training be attended?
"
3 Ibid.- Copa and Maurice.
2 4
18
-
6. .What are special barriers-to attendance?8
7. What. are the characteristicsof people tohe served (e.g., age, employment status)?
, The .questionnaire,will be des,Cribed, in sectiOns.relatingto each of these.questions. :A comOete-questionnaire is shownas Appendix I...
,
0-. .
General Characteristics of P6p 4
4 .
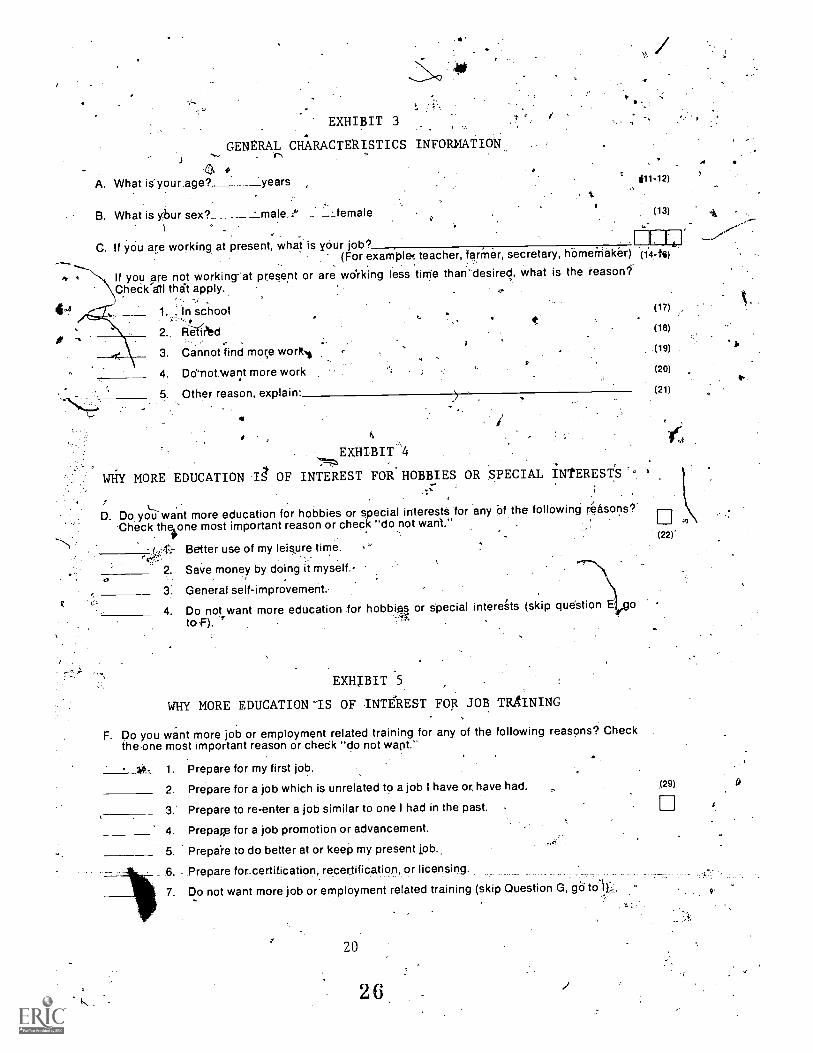
Starting first.withAthe 1au on whkch concern,s;generalcha a.teristics of the poNlationhe rel vant,sectipn of the'
sti 0 naire is sKown.as Elxhitit 3. Info mation or general4
tid"Vaztristics serve at- least.fwo major p rpose5. First; itprovtdes information upon which to check hoW well the sample of ,
respondent's matches.the-Pbpulation from which the sample was .
drawn. For example, usin the infOrmation'Shown'on the question--, naire in Exhibit,3, the sample of respondents can be described/
in terms of their age, sex, and employment status and then Com-pared to-existing data Of this kind about the fulr.populatIon
ir being sudied. These factors are all related to likely biaSes -the sambIe might-have regarding the desired amobnt and type offur'thje,r,,,education, partiCularily for job preparation.
,
Second, the general characeeristics informat'ion.provides(s-
a,means for subdividing thedata nto groups of special interest(e-:g., males, age 24-30, unemployed, retired). In this way,the usefulness of the data is' increased many .fold for use inplannOg educational prbgrams to meet the'needs of specificgrod0 of individulls.. Ngte that for this section of the ques-tionnaire and ether sections, provisions have been made for cod-
.
ing of the questionnaires and direct.transfer of information tokey punched computer carUs (i.e., see the numbered.boxes on thequestioltaire).
\Tr inin41kWhy g Is Needed
: As -shown in Exhibit 4 and 5," the questionnaire s divided.
into two basic sections, one dealing with interest in moreeducation for hobbies and special interests and the other 1.nter--est in more education for job training, In each.case, respond-ents-are given the-ofiportunity-to-ireview ahd-indicate why they
254
19
1
EXHIBIT 3
GENERAL CHARACTERISTICS INFORMATION.,-e?.
A. What is'yourage? ___Lyears
B. What is ybur sex? male_2 female (13)
C. If you are working at present, what is your job?(For example4 teacher, farmer, secretary, harnemaker) 0.4-fs)
If you Are not working- at present or are wo'rking less time than desired, what is the reasorilChe6k`a that apply.
it
1. . In school
2.. Relft'td
3. Cannot find more worN , ,.
.
4. Denot Want more work
5. Other reason, explain
EXHIBIT 4
WHY MORE EDUCATION I OF INTEREST FOR- HOBBIES OR SPECIAL INTERESTS
(17).
o
(18)
(19)4
.1,
(20)
(21)
%___ -
D. Do you want more education for hobbies or special interests for any bf the following reasons?'Check theione most important reason or check "do not want."
,El
..
Better use of my leisure time. ,' .(22r
.
2. Save money by doing it myself.-0 , .
General self-improvement.
4. Do not want more education for hobbies or Special intergts (skip question Efgoto-F). 1.
-i.';',.
A
EXHIBIT -5,
WHY MORE EDUCATION °IS OF INTBREST FOR JOB TRAINING
F. Do you want more job or employment related training for any of the following reasons? Checkthe-one most important reason or chedk "do not want."
- 1. Preparelor my first job.
2. Prepare for a job which is unrelated to a job I have or, have had.
3. Prepare to re-enter a job similar to one I had in the past.
4. Prepsrp for a job promotion or advancement.
5. Prepaie to do better at or keep my present job..
11_6.----Prepare-for certification, recertification, or licensing.
7. Do not want more job or employment related training (skip Question G, gO to ,
20
2 6
,(29)
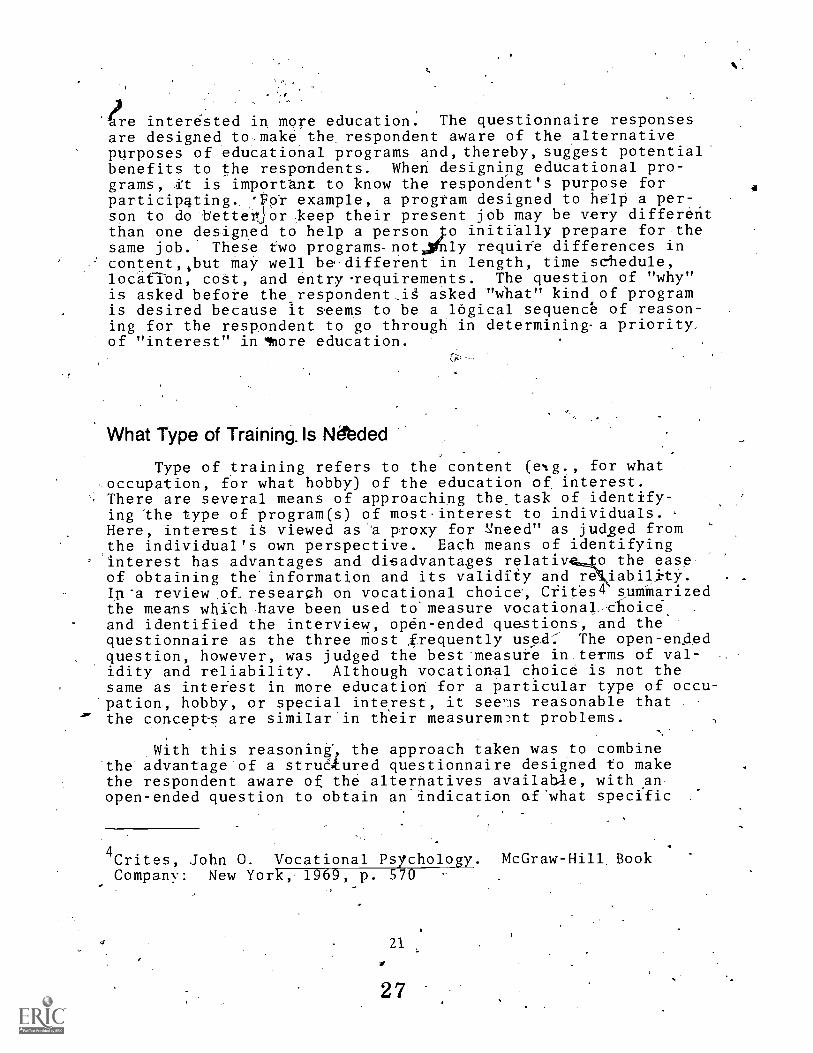
le interested in more education. The questionnaire responsesare designed to.,makethe respondent aware of the alternativepurposes of educational programs and,thereby, suggest potential'benefits to the respondents. When designing edUcational pro-grams, ft is important to know the respondent's purpose.forparticipating.. :Vor example, a program designed to help a per-son to do betterjor ;keep their present job may be very differetthan one designed to help a person I() initially prepare for thesame job. These two programs-not,ffilly requite differences incontentbut may well be-different in length, time schedule,location, coSt, and entry-requirements. The question of "why"is asked before the respondent,ig asked "what" kind of programis desired because it seems to be a logical sequence of reason-ing for the respondent to go through in determining-a priority,of "interest" in4more education.
What Type of Training. Is Ndbded
Type of training refers to the content (eNg., for-whatoccupation, for what hobby) of the education of. interest.There are several means of approaching the.task of identify-ing the type of program(s) of most-interest to individuals. ,
Here, interest iS viewed as'a proxy for .need" as judged from.the individual's own perspective. Each means of identifying'interest has advantages and disadvantageS relativ44Che easeof obtaining the'information and its validity and re iabili-tY.ITL'a review .of.researgh on vocational choice, C1ites4 sumMarizedthe means which .have been used to measure vocational,--thoice .
and identified the interview, open-ended questions, and thequestionnaire as the three most frequently used: The open-en.dedquestion, however, was judged the best-measure in terms of val-idity and reliability. Although vocational choice is not thesame as intefest in more education for a particular type of occu-
-pation, hobby, or special interest, it see-As reasonable that .
' the concepts are similar'in their measuremmt problems.
With this reasoning', the approach taken was to combine'the advantage of a struaured questionnaire designed to makethe respondent aware o the alternatives availab4e, with anopen-ended question to obtain an indication of'what specific
4Crites, John 0. Vocational Psychology. McGraw-Hill BookCompany: New York, 1969, p. 570
21
a.
2 7
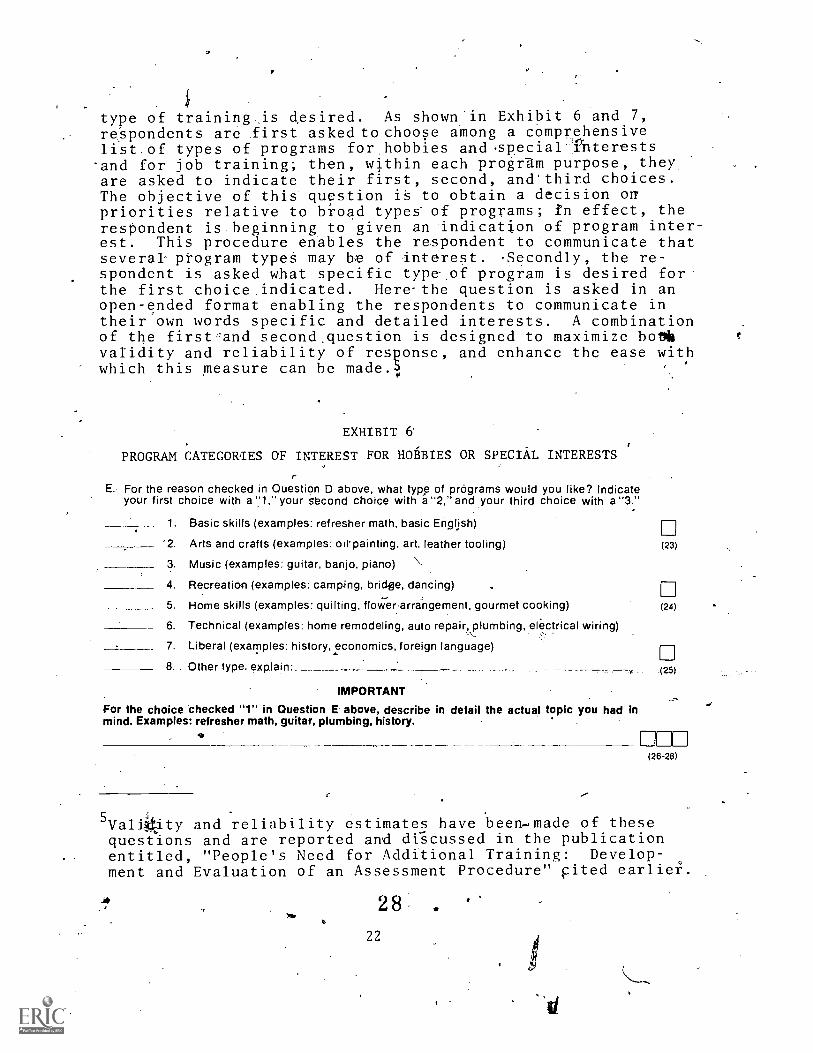
type of training .is desired. As shown in Exhibit 6 and 7,respondents are first asked to choose among a comprehensivelist of types of programs for hobbies and ,special:Thterests-and for job training; then, within each progr-dm purpose, theyare asked to indicate their first, second, and'third choices.The objective of this question iS to obtain a decision orrpriorities relative to broad typeS of programs; in effect, theresPondent is beginning to given an indication of program inter-est. This procedure enables the respondent to communicate thatseveral program type§ may be of interest. -Secondly, the re-spondent is asked what specific type,of program is desired for'the first choice indicated. Here-the question is asked in anopen-ended format enabling the respondents to communicate intheir own words specific and detailed interests. A combinationof the firstand second.question is designed to maximize bottlevalidity and reliability of response, and enhance the ease withwhich this measure can he made.
EXHIBIT 6'
PROGRAM CATEGORIES OF INTEREST FOR HOgBIES OR SPECIAL INTERESTS
E. For the reason checked in Question D above, what type of programs would you like? Indicateyour first choice with a "1," your scond choice with a "2," and your third choice with a "3."
1. Basic skills (examples: refresher math, basic English)
2. Arts and crafts (examples: oil'painting, art, leather tooling)
3. Music (examples: guitar, banjo, piano) \4. Recreation (examples: camping, bridge, dancing)
5. Home skills (examples: quilting, floW-er..arrangement, gourmet cooking)
6. Technical (examples: home remodeling, auto repair, plumbing, eleCtrical wiring)
7. Liberal (examples: history, economics, foreign language)
8 Other type, explain:_
IMPORTANT
For the choice checked "1" in Question E above, describe in detail the actual topic you had inmind. Examples: refresher math, guitar, plumbing, history.
(23)
(24)
(25)
DM(26-28)
Valikty and reliability estimates have beemmade of thesequestions and are reported and di-scussed in the publicationentitled, "People's Need for Additional Training: Develop-ment and Evaluation of an Assessment Procedure" cited earlier.
* 2 8 .INN
22
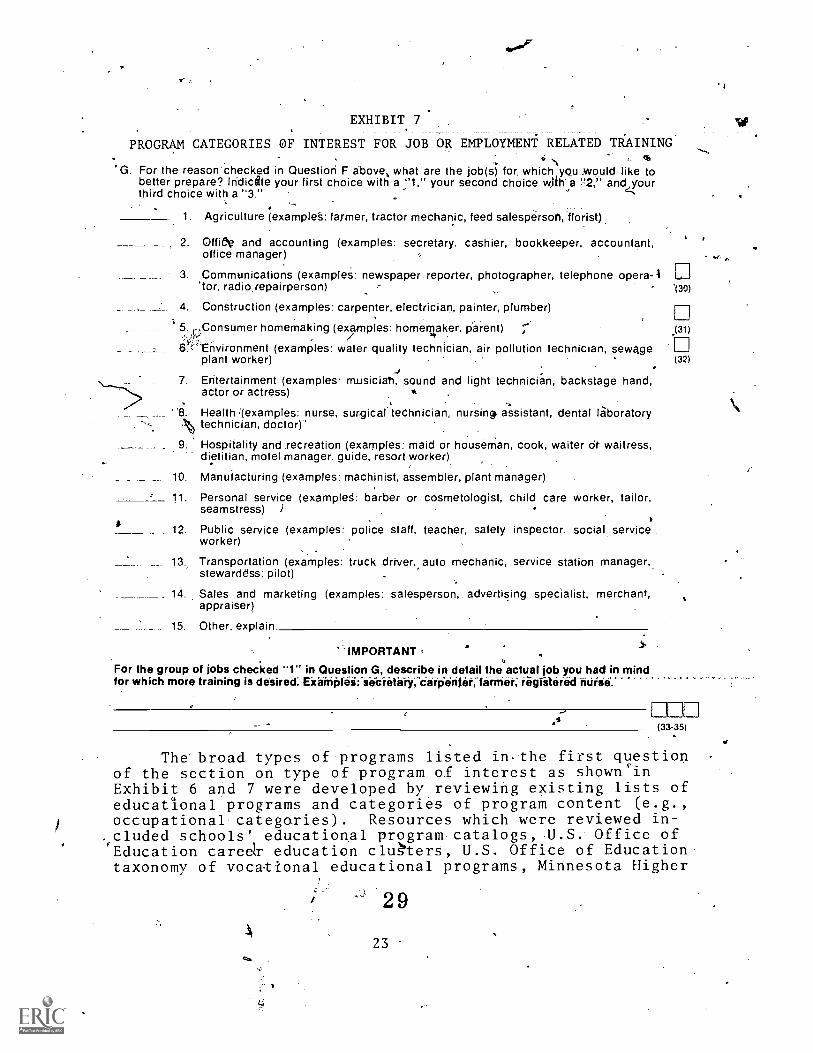
EXHIBIT 7
PROGRAM CATEGORIES OF INTEREST FOR JOB OR EMPLOYMENT RELATED TRAININGch
'G. For the reason-checked in Question F abovet what are the job(d) for. which you..would like tobetter prepare? Indicite your first choice with a -"1, your second choice w,ith a and yourthird choice with a "3."
1. Agriculture (example§: furrier, tractor mechanic, feed salesperson, florist),
2. Offift and accounting (examples: secretary. cashier, bookkeeper, accountant,office manager)
. Communications (examples: newspaper reporter, photographer, telephone opera-1'tor, radio repairperson) -
4. Construction (examples: carpenter, electrician, painter, plumber)
130)
5. onsumer homemaking (examples: homemaker, parent) .(31)0
.,-Environment (examples: water quality technician, air pollution technician, sewage I 1
plant worker) (32)
7. Entertainment (examples musiciati, sound and light technician, backstage hand,actor or actress)
8. Health .'(examples: nurse, surgical teChnician, nursing assistant, dental laboratorytechnician, doctor)"
9. Hospitality and recreation (examples: maid or houseman, cook, waiter dr waitress,dietitian, motel manager. guide, resort worker)
10. Manufacturing (examples: machinist, assembler, plant manager)
11. Personal service (exampled: barber or cosmetologist, child care worker, tailor,seamstress) )
12. Public service (examples: police staff, teacher, safety inspector, social serviceworker)
13., Transportation (examples: truck driver, auto mechanic, service station manager,stewardess, pilot)
14. Sales and marketing (examples: salesperson, advertising specialist, merchant,appraiser)
15. Other. explain-
IMPORTANT , -
"13
For the group of jobs checked "1" in Question G, describe in detail the actual job you had in mindfor which more training is desired: Elarmiles: secriztlary, carpenter:farmer, regalefed nurse.
(33-35)
The broad types of programs listed in,the first questionof the section on type of program of interest as shown'inExhibit 6 and 7 were developed by reviewing existing lists ofeducational programs and categories of program content (e.g.,occupational categories). Resources which were reviewed in-cluded schools' educational program catalogs,.U.S. Office ofEducation careetr education cluhers, U.S. Office of Educationtaxonomy of vocational educational programs, Minnesota Higher
2 9
A23
.
-Education Coordinating Board program taxonomy, U.S. CensAis of
Population-list-o-f-occupationsand-industries-,:-and-the-Dictieparyof OcCupational Titles. The broad edu6ational program cat-egories were then Subject to review by educational and dtherstaff personnel located withiln the geographic areas where paststudies of this kind-'have been made. In addition, for each setof program categories, a category entitled "other" is includedto make sure that the respondent has some place to respond ifthe listed categories appear inappropriate. For each broad pro-gram category, examples of,types of specific programs are illu-strated' in order to give meaning to the broad program categorylabels.
,
How Many Want Training
I/The answer t a, question-.of how many want training is
designed to be obt ned from responses to questions about pur-pose of training as shdwn in Exhibit 2 and 3. All responsesto the choices other than "do not want mare education" areconsidered to be indications of interest in more education.Indications of how many want more education for a particularpurpose and in a particular tyve of program can be obtained .
by observing the frequency of responses in other sections ofthe questionnaire (see Exhibit 2-7).
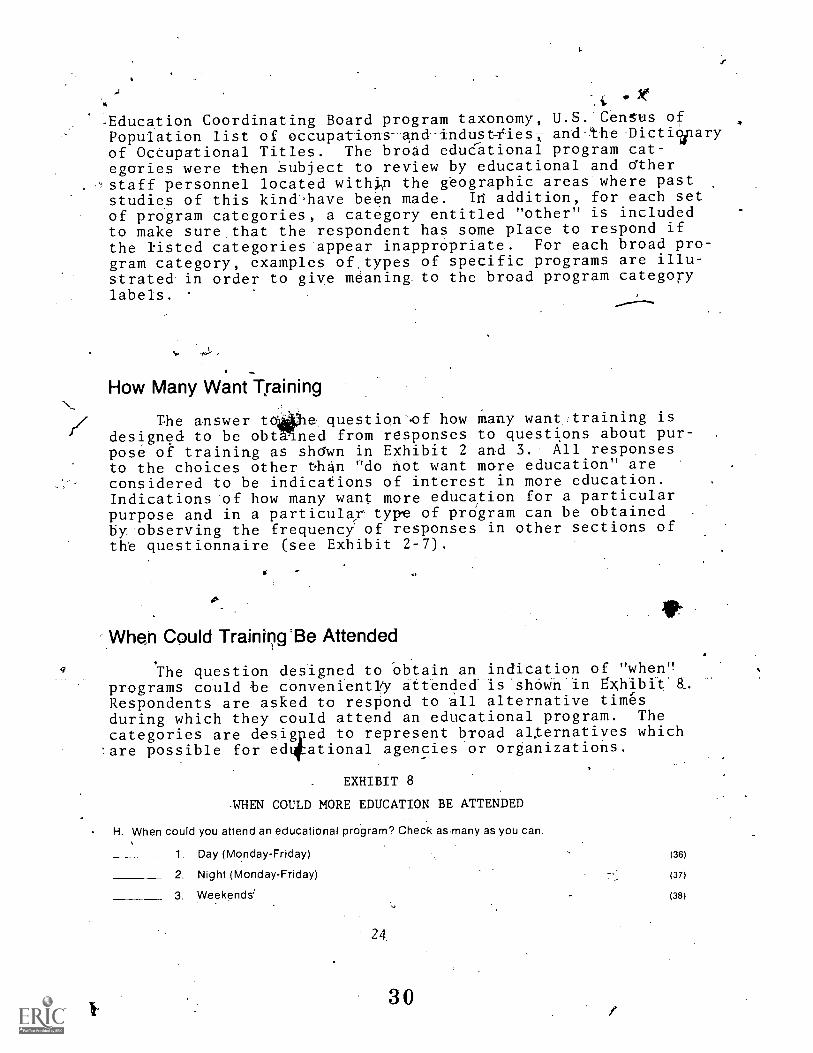
When Could Training Be Attended
The question designed to Obtain an indication of "wheW!programs could be convenientFy attended is-shóWn in ExhibitAt.Respondents are asked to respond to all alternative timesduring which they could attend an educational program. Thecategories are desiwed to represent broad aLternatives which'are possible for ed ational agencies or organizations.
EXHIBIT 8
,14HEN COULD MORE EDUCATION BE ATTENDED
H. When could you attend an educational program? Check as-many as you can.
1. Day (Monday-Friday)
2. Night (Monday-Friday)
3. Weekends'
24
3 0
(36)
(37)
(38)
What Are Special BaffriersThAttoillance.
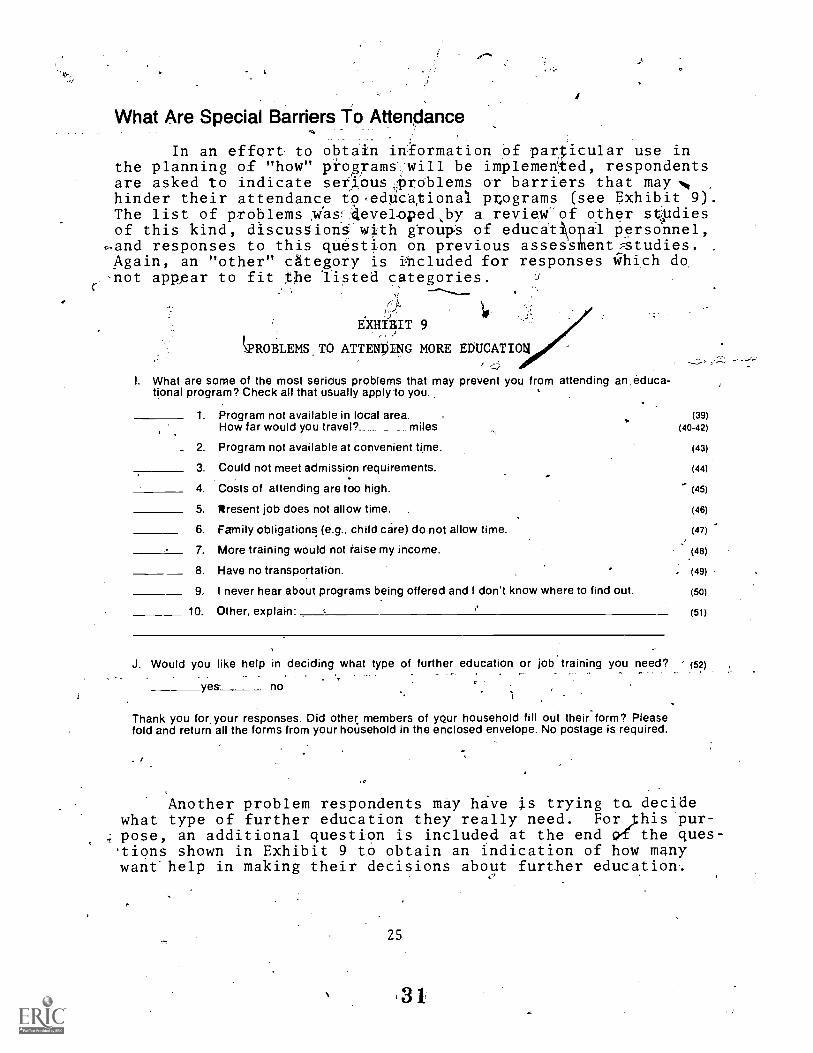
In an effort to obtain in.:formation of particular use inthe planning of ."how" programill be implemened, respondentsare asked to indicate setiOusiProblems OT barriers that may %,hinder their attendance t0,edOcational pr,ograms (see Exhibit 9).The list of problems lias4eveLoped,by a. reviO4-of other stpdiesof this kind, discusion' with 0.oup's of educatl\opal personnel,
and responses to this question on previous assesstnent.fstudiesAgain, an "other" category is ioncluded for responses which do-not appftar to fit Ole li.sted categories.
/)!
E.XHI)BIT 9
1,'ROBLEMS. TO ATTENDING MORE EDUCATION
I. What are some of the most serious problems that may prevent you from attending an educa-tional program? Check all that usually apply to you.
1. Program not available in local area. (39)(40-42)How far would you travel? miles
2. Program not available at convenient time. (43)
3. Could not meet admission requirements. (44)
4. Costs of attending are too high. (45)
5. *resent job does not allow time. (46)
6. Family obligations (e.g.. child care) do not allow time. (47)
7. More training would not raise my income.
8. Have no transportation..(413)
(49)
9. I never hear about programs being offered and I don't know where to find out. (50)
10. Other, explain: (51)
-
J. Would you like help in deciding what type of further education or job training you need? (52)
yes no
Thank you for your responses. Did other, members of your household fill out their-form? Pleasefold and return all the forms from your household in the enclosed envelope. No postage is required.
I C
Another problem respondents may have is trying ta decidewhat type of further education they really need. For ;his pur-
4 pose, an additional question is included at the end 194* the ques-.tions shown in Exhibit 9 to obtain an indication of how manywant help in making their decisions about further education.
25
3 1
Where Could Training Be Attended
In order to obtain information on "where" training couldbe attended, two items of information are included on the
questionnaire. The first is a code for the specific geographic,location of the respondent's household. The location is specificenough to identify which blqck within a city and township with-
a rural area. It can also)be aggregated more broadly in termsOf City and county. This ede is contained in the boxes atthe upper left hand cotner of the questionnaire (see Appendix
and is placed on .the questionnaire at the time the question-naire is prepared fdr mailing.
The second item of.information on the questionnaire relat-ing to "whefe" programs could be attended is shown in Exhibit 9and asks the question "How far would you travel" as an additionto the distance .barrier. Combining these two items of informa-tion, where the respondent lives and how far they are willingto travel,' provides an 'indication of where programs can be
conveniently attended.
Suminary
A brief explanation of,a SImp e questionnaire format devel-olSed through revidWs of and exper'enees with past assessmentsof need ,S..or-additional educa:tion Jas "been provided. In conduct-
in a need assessment study, the sample questionnaire couldbe used as is or might serve as a prototype questionnairewhich could be modified to meet particular purposes and situa-
tions. If_the questionnaire is used as iS, eXisting computerprograms can be used to analyze and summarize the collecteddata.-; where modifications are made in the questionnaire, e_xist-
ing computer programs may have to be modified or an entirelydifferent program must be developed. When questionnaire mod-ifications are made, some of the basic questions still need tobe addressed (e.g., what purpose.; what type of program is needed,when could programs be conveniently attended) and some of theformats for the questiOns (e.g., structured and open-ended) maybe similar. Most frequent changes will probably be in the op:tions or categories used as responses to questions (e.g., educa-tional program categories, pToblem categories).
3 2
Printing Questionnaire and Cover Letter .
Three points are important in preparing the questionnaireand cover letters after the final foxmat of the questionnairehas been decided and the group to be sampled has been identified.The "cover letter" is the letter which will .be sent with th&
..14a. questionnaire to explain its purpose and give-directions forits completion. First, the process of getting the printingdone must be started soon enough to secure questionnaires andcover letters With enough advance time to code them before mail-ing.is to be iaitiated. Second, qaality priAting is essential.-Both questonnaire and cover letter should be prepared by "off-set" printing. Before printing, a check should be made thatthe questionnaire is a6nable to coding and key punching if thedata is to be Computer.analyzed; a.little,ef ort to make thischeck will saye much time and resources late .' The third point.is preparing a sufficient _number of both que fionn'aires and coverletters. More specific directions for this spect,of printingare covered in a,laier chapter of this repor.. As a note of
Ltaution, questionnaires, and cover letters sh uld be given atfinal proof by several persons 'before final ifltiple copiesare produced.
COLLECT DATA
After evaluatang several differentmthtsof collectingassessment data of this kind,6 it is recomen ed that the pro-cedure of tWo bailAngs with a follow-dp te4ep One call be used,to collect the data. This procedure has 0-ov n to' be the mosteffective in getting returns fOr the cost Liacurred.
Data collection will involve preparing first mailingof the questionnairesand cover letters to' aO the householdsin the sample, a second mailing of the same que'stionnairesand a new cover letter to non-respondents;la 4:1' a telephone callreminder to the remadning non-respondents. D riag'data collec:tion', access tO facilities to p-i-epare and po's' \tIle mailing,
Ibid Copa, Persons, and Thomas, p. 50-56. ven differentTe7tIods of collecting need asSessment informatio were tested;methods involved direct mailing, mailing with in entive,telephone, and personal interview.
3 3
27
\'1
[>*
handle in-coming mail, and makqetelephone calLs ka-essential.
Most of the data collection efforts can-be done by/secretarial .staff after they have received training in the assessment proced2
ures.
CODE COLLECTED DATA
As questionnaires are returned, they must be coded for either
hand or computer analysis. Again this activity is described in
Tore detail later. Essential aspects of coding are tht it be
done accurately and consistently. During coding, a check should -
be made of the' completeness of the questionnaire response. In
some cases is may be necessary to re-contact respondents for
more complete information. Coding is straight forward except
for the section oe'the questionnaire requiring.coding of the
specific type of program of interest to respondents (s'ee the
last question in Exhibit 1.6 and 7). Here-a judgement must be
made. A dictionary of occupations and industries prepared by
the U.S. Bureau of the Census makes the job of-coding the type
of program for job'training fairly routine.7 A similar, but
less comprehensive ,ndex for hobby and special interest programsis included in Appenalfx II of this report. An accurate job of
coding will greatly facilitate later data analysis activites.
ANALYZE DATA
Analysis of the data involves the summary of question-
naire responses into some meaningful tables based on the pur ose,
of the assessment. Although analysis can be done by hand,
usally computer analysis is more efficient 4f there are ov r
100 questionnaires. A computer program for the questionnaire
described-in this chapter has been developed and is availabLe
at the St. Paul Campus Computing Center, University of Minnesota.
The computer analysis includes key punching the data directly
from the questionnaire to computer cards, editing of the data
cards to detect missing or inaccurate data and summary of the
U.S. Bureau of. the Census. Alphabetic Index of Industries and'
Occvations, 1970 Census of Populatiori. U.S. Government Print-
ing Office: Washington, D.C., June, 1971. 44
0)
28
Q A
data tpto a set of predefined tables. Tables can.be preparedfor the full group of respondents or selected subsets (e.g.,age; !6Aups, sex, promem desired). Although only -dekriptiveanalySis of the data;T's suggested here, more vigorous analysisinvolving inferential statistics may be appropriate in some
'situations.
RITE REPORT OF ASSESSMENT
In orderf the study to have full impact and be correctly'.interpreted, a co plete report mist'be prepared. This..reportshould describe the purpose of the stuay, the population andsample, the data collection instruments and procedures, the.suMmary tables, and most important, a set of interpretationsof the summary data. The report should be tailored.for theaudience which will be. receiving it. This more complete report.should serve as a base-document from which briefer and more'focused reports or oral-presentations might be made. The'"inter--pretatlón" section should describe answers, based on the datacollected, to questions.posed in Chapter I of.this repOrt under"purpose" of the assessment. Inte'rpretation may include bothconclusions and recommendaiions depending.on the purpose of the ,
assessment study. Care must be taken in making interpretationso'as to avoid statements which are not warranted based on thedata alone.
0 \
DISSEMINATE REPORT OF ASSESSMENT
Dissemination involves.getting the results of the assesS-ment to people, who will benefit from knowing about the results(e.g., decision makers) in a form which is convenient and effec- .
tive. Dissemination decisions will involve questions of howmany reports to produce, how will it be done, who will do it,who will make presentations, to whom should oral presentationsbe given, and should a radio and newspaper release be prepared.
OWN,
29
35

SUMMARY
Major activities in conducting an assessment of perceived
needs of people for more education have been describ d in this
chapter. Each of the activities contributes to succ ssful com-
pletion of the study. The remaining chapters of this reportprovide a more detailed discussion of selected activities.
,
30
CHAPTER III
SAMPLING PROCEDURE
To ideally determlne What educational'needS exist in acomMimity, it may be best to elicit pertinent information fromall_the.residents of that commullity... The end result, thoughquite expensive and-time consuming, would provide educationalplanners'. with a true indication of the edugational 'programswhich are desired by the public they serve. In most cases,however, limited'financial resources and the limited timeavailable prevent obtaining information from the total popula-tion. It then becomes necessary to select part of the popula-tion in such a manner, that the part or Sample selected trulyrepresents the total Topulatign. This sample, if well selected,can provide information equally suited for planning edUcationalprograms.
The purpose of this chapter is'to outlin the basic pro-_cedure for...drawing sample of individuais to be contacted dur-,ing the assessment study. The procedure used is a modificatioliof the procedure outlined by the United States Bureau of Censusin its Current Population Survey.° The outcome is the selectionof a random-sample of households complete with,the addressesuSed to initia'r contact with household members.
Since the Census Bureau bases its botndrieSNDn a tural-urban criteria for data reporting purposes, and since popula-tion density detormines the placement of geographic boundriesand the presentition of census data, it is necessary to differ-efltiate between two types' of areaS for sample Selection. Metro-,politan aTeas have a minimum population of 50,000 and,a density_Of at least 150 persons per square mile while rural areas-aremade up'of two types,of sub-areas: First there are scattered.Topulation centers which are referred to as !'places' and forwhich special maps _place maps are provided by the CensuSBureau. Setond, there are low population density areas (e.g.,farm land, recreation areas). Because the base population datafor these two different types of areas are presented by theCensus Bureau in different tables, the, sample selection pro-cedure will be specific to metropolitan areas and rural areas. s-
.7
8U.S. Bureau of the Census, The Current Population SurveyA Report on Methodology: Technical Paper No. 7, U.S. Govern-ment' Printing office: Washington, 1963.
Ave'"
L.
3 7
31
Census data provitles information for each Enumeration D'is-trict (ED) in.rural areas or Census Tract (CT) in metropolitan
areas. An ED or CT can be defined as a distinct geographicarea, such as a township, or as a,geographic area containing .
a given number of people within defined,boundry. The house-
holds within these boundries form the base from which thesample will be selected using the procedure described in this
chapter. Following is an-outline of the procedure:
. LIST GEOGRAPHIC SUB-DIVISIONS,
Given that a geographic area has, been selected 'for the
study, the first step is to identify sub-divisions of the geo-
graphic area as defined by:the Census of.Population. The geo-'
graphic area may be part of a county (e.g., school.distiict,-city), a whole county, several counties, or a whole State.-
The major sub-divisions used by the Census were identifedearlier as the Enumeration District (for-rural areas) and,the Census Tract (for metropolitan areas). The purppse of
gis step in the procedure is to identify the respectiye sub-divisions in the geographic area to be studied and then to listthese.sub-divisions in descending order by population. The,
listing produced will eventually be used to,drawiaow4,11,sampleof households which lt representative of all of,ti1160'hou8eholds
in the full geographic area. Mos,t steps .4ja tbe Sainpling pro-
'cedure will require different procedures fft. rural and metroT
politan 'areas; therefore; where'relevant, tfiey_are, discuSSedseparately under eaCh step.- Base information on'the population,.size and number- of households in.various Census Sub-divisions,of a geggraphic area are available frot the Bureau-of-theCensus,-or in the 'case of Minnesota, from the Minnesota Analy-
sis and Planning System. (MAPS) located at the UniVersitysof
Minnesota.
9U.S. Bureau of the Census. 1970 Census of-'1-rousing.. U.S.
Goliernment Printing Office: Washington, D.C.1 August, 1971.
32
38
RuralAr4s
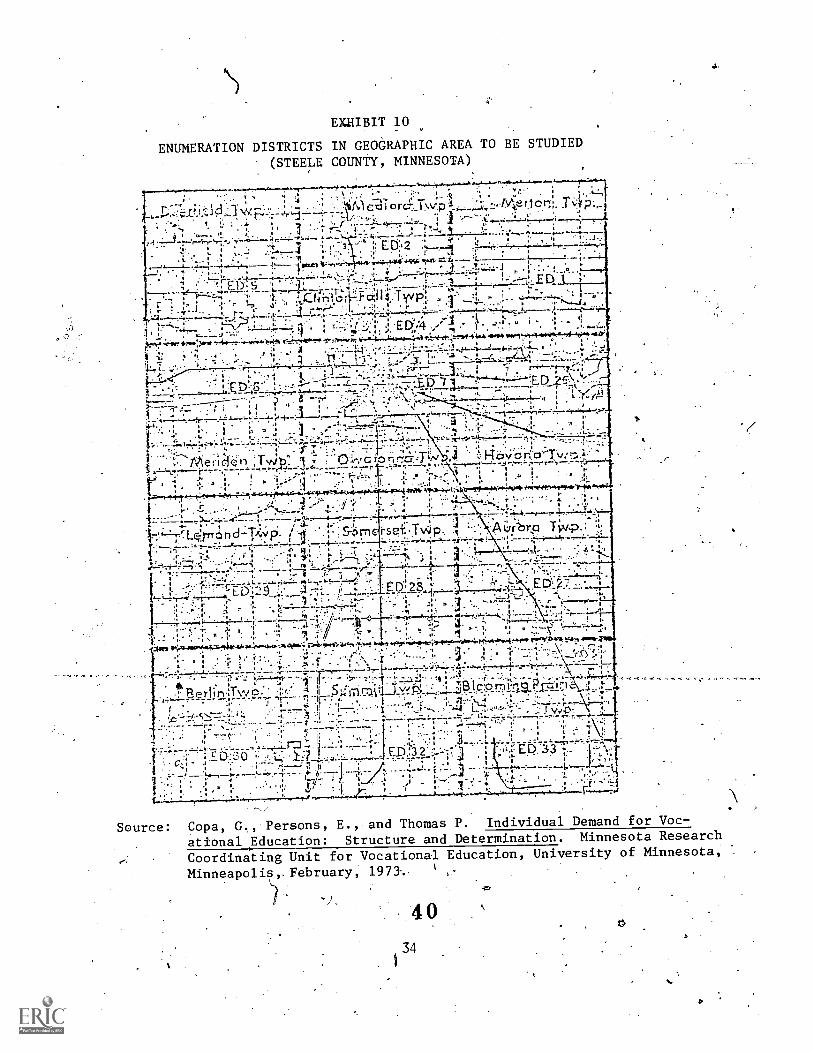
In rural areas, listing the ED's in descending order bypopulation will suffice since ED's will also be included forthe densely settled Population centers,(places) Within,eachrural area. It should be noted., however, that some of thesepopulation . centers'may have several ED's listed with the samename. Exhibit 1.0 shows the 35 ED's in Steele County, ,Minnesota,witl 16 of those ED's focated in the city of Owatonna. Exhibit11 Chows the listing of the 35- EIP's with the corresponding name,identification code, populafion c.ount, and housing count asobtained from MAPS. All four of these items of inforMationshould be obtained about each ED. Note that ED's 7 through 25are located in the City of Owatonna. The listing of ED's indescending order by population is shown in Exhibit 12.
, N
Metropolitan Areas
In metropolitan areas, a Census Tract (CT) instead of,Enumeration_District (ED) is used as the ba'sic geographic SP;i/-
segment. Again, all CT's in the geographic area to be studiedmust be identified and then listed in descending order bypopulation size. Exhibit 13 shows a listing of the Census .
Tracts in South St. Paul. There are three census tracts anda total population of 25,016.
Regional Sampling
In drawing a sample for s-region made up of several counties,listing can be accOmplished in the same descending order for allED's and CT!-s in the-region. However-,it is important to keepnote of the county and area names with their respective ED br.CT identification codes. ,An example of a partial listing ofenumeration.districts for Minnesota's EconOmic Region 4 (anine dounty area) is shown in Exhibit 14. In this table, ED's .1
ate also listed in descending order by population.
39 7?.1.A
EXEIBIT 10
ENUMERATION DISTRICTS IN GEOGRAPHIC AREA TO BE STUDIED
(STEELE COUNTY, MINNESOTA)
4.
r--7.: :i-.1c1.3y./^.-... -.:":::::-2:-..A ..- f':-.."_....- .; '. I1
,
' 1 ; i ..''.-4.14)-.21-ior4 rvp 1 ...'2,-....1:.IV:te r.i c.c.-;,,. .Tyyp;,_,, 1-,: f .......,;.
; ...--...., c. !:: '. t 1 i :L.:- _i I-, -.,-:----c-'.-77 --;--Pr ..._.,. , -, .1,____;__2:. .-,.._,:...............;,....-....,-.., ..L.3........-' .,--'.°7-,::-I'.-..'-a-.-.-.;-;'-'-'4,-.'''-'''''''''7- I '' 4
'. E D., 2 i.4.--.1.- .0.....,44... - 4 ...,e, 4....,..-..
. .. , .,.-- . ,, . ,,Qii-iic; .k.alls, IIINP:. . 1- \ -1--1-.' ;:' :- 7 t I "'74-- r*A-,---"--',"--7-f"- i
. .- -4-'-1.. ' .. 7. . ,4 -....i-o: . . 4, r ,.. 4 ----**-- 7' *. -. N-./..Zil...77,4-; 77.72-77.2:- ' .17 -.: ..,......---.A -......- ......._ 4.........,..-- .................,.....--.' .,...g.1*L411 .14.1.4414.,,.. 4, -.-.-...-.... 1.-............z4-
-.4 - ' 7 ' . ---.. .-.----', 4 . , ---7,,,,,.:J. :. ...,:. ElY 4 . -0 .- '1 .........1.
.......7: ;,te 10.)4W 40-4-1*-4.4.4,4% r......-441.45.* :ft.:N.144n1/..4.4....1444..V4'4:%',4.t'4% t-.).-$.44,4 4044. 04,4171.44`+4-40,+-41;
i:;: , c . ., ,./ i', I .. -...._'......,1:4%., .: ". :..!..;;;:_-.:.[_."1_:..1..4...,o--1:.....:t.-zf-±,-, i , : .......;I 1 :. r ' I 1 ' . 1 ...' 7. ..3 ,s,-._-_liz-__IN.,..:,4,4.,-__:.,....t..-;..... '-
IL_ .._ '. '. ..' 7--,t 2 ..... "yx ." ..-0. `' -...,= --- 17 a ;:,. ?- s
1
. ____,_,L._lb 1).. 6 ; ....:.-- --,.,_......t,___.:::__:. -ED 7 3
.,---- .-,----- ,;---- D d --.....: ! ,- : . ...\ ..,: : , .1 - - '1 7'1.,' 4.1
--...- 7i.. .:7...:- . ' I .. . I ; '. ' ,,e'..... ' st : ... L: tc. -L- . 1 L .r-r,=
1 I
: ''1 1
.714.4W1404-
,
..I . ....
- ' , 4 . , 1 g '... IL \ .,;
.. . .
.. 43 : 7.'''''''''''7c,..''..-:--n-, 4 ,. ..
(-. r 1.- -41417:4414.:4 4-111.... 1111 44 .-....: ...... 1 . 4 4..., .......... ,.... 44.4... ).,...... ?.4.....44....41.,.....1-24. ..- .4.1 ... ....,....., .1,1.',4 ' .4444, ..4444.4............ 4 ....4,4 .. ..
1
. .-4
- --
4 - . .
t ,...1..---,"...,___'til...e,f_1..C.I. ..................... I, .0.1...: i-0 r... r:=.6'..4 .1 ,..1\ . H. ;'. Ray a r'cr'''Tv -., .,_.
___..... ,,...,...,__._,..,. t ......."-.............., .:4 .4......, ',... -.0 ,...........!... ...)
..',. ....I, . . 1,- .,,.:, ... '''s '.; 1%. 1 ...
i ' , .:- ' ' . ' ..!,...'' 1 ' ..r . t. . . 1 i . ' '7-, 'I
.:0.1.,1.
. 11T".!41. ,,'-..4f4.444....4.14-if,......:,,,,As ... troo,-LIKs-,-Izi tr-,11.-,4*.,pror,./r-pi,
'... S-...., ;., , ..........",........, .
........ .*, . .1: 1
4
i-set ,TW p... .1 ..
..-.4..
.1-.:...4..,.. ... . ...
#2.-....IL-L.L._5_-_,_...rti-7f7:4._-:.-___ ,:..,..., a
1-:' "Y'r L ql. tn. n d -:T2 '''' . 1' c.'.,
vrbr,o Twp.: ....,yip. 1 -I . ; . _Tonef -..,-...:_-:: --R7- -,,,.--1,--:-.:- 0 :.----4-,;.---,.-= ,,*-,..,+-,;--0,....--,1,--,re
. .. , ..... 1 1 I :.:...: l. . I
..... -. :1,..4....-.4..-
.A. , -: :p,,,,.,...; 1.':
*..,' 1 , -'4rI...r.,-,r-' 4.-r-rte. b ..:. ._.::::_.....j .71_ _II ....:_:,:-.: .:--:'_ t D.' 23 .r ...... . -, -...,---
_ 1 ,. ; - '.,- . i:-- ' . -.7- - '' '' :.:-,7 , ... . .3 . ---..
......
--,. 1;1
- L ' .-.4 ': f 1
s;.v....c.444mw4e-s.4,...70w- r.../y;r44:4,Lt, ;..t .
. '
,rSprilri.,i Wi...:6 111
-
r1.444.
s
.,....._....i.......y......,...._..._,,,....H.:,/:,...,±:r.,4 :44..44. , 44, .4..14.4..i.r......,..i.......4.,... .... ..... -.................4.
144 Pr/7.. r!'.... ... ...- ...7 ..1 I.
,...,
-,.. .. .4 1 . -.. . ... - - . .. .. ..,Y --.. . ....Li L ..,...:,.,..-tr..- -tv-'..,-..7.7...:J........
t I ..:4 r .I,
-.L., .44 ...i..T ''
. .
D. 73'3 ... - I''
' 1. .; rt I
-11.. ,. S "
4 '71... '. '' .. ,__, I:, .. ' '.,.
_,-;-4-- ---- -....":--..-!--' 11---' --r"- '," ', r D-:"-1 0 .. .,..,. 1:/...:,.., . ED:'.3 .--: 3,
,.... , .
. . .1 4 .- . . a 4
1 .. ; . . ,......"-.. / I 7 , 444a ....4.- .....,......1,--... ....4.1 ...1 t
- .........., ..-- ........,-,- , ...:-.....4.."... - i. , - - Jr ,, --..-, ---,-.- 7 lk.,, - - ... - .2., ; T -- , i
1 ..1. 1 j. ' '77 . v 1 ) ., , , .... ... - a
.1 .. ' '
V.0 na,-.
. ' r -.--.--11
. i-...........?..,
Source: Copa, G., Persons, E., and Thomas P. Individual Demand for Voc-
ational .Education: Structure and Determination. Minnesota Research
Coordinating Unit for Vocational Education, University of Minnesota,
Minneapolis,. February, 1971.
4 0
34
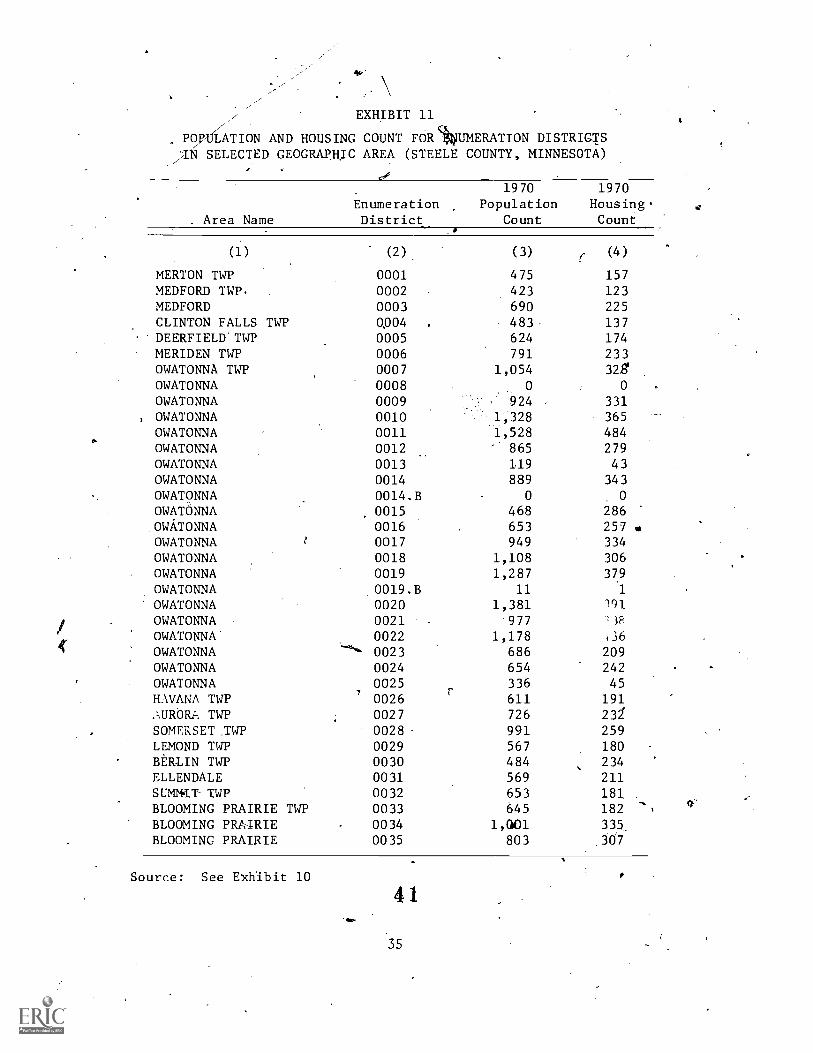
EXHIBIT 11
POP LATION AND HOUSING COUNT FORIVUMERATION DISTRICTS,T.N SELECTED GEOGRAPHIC AREA (STEELE COUNTY, MINNESOTA)
. Area NameEnumerationDistrict
1970Population
Count
1970Housing'Count
(1) (2) (3) (4)
MERTON TWP 0001 475 157
MEDFORD TWP. 0002 423 123MEDFORD 0003 690 225CLINTON FALLS TWP 0,004 483 137DEERFIELD'TWP 0005 624 174
MERIDEN TWP 0006 791 233OWATONNA TWP 0007 1,054 32.81
OWATONNA 0008 0 0
OWATONNA 0009 924 331OWATONNA 0010 1,328 365OWATONNA 0011 1,528 484OWATONNA 0012 865 279
OWATONNA 0013 119 43OWATONNA 0014 889 343OWATONNA 0014.B 0 0
OWATONNA 0015 468 286OWATONNA 0016 653 257OWATONNA 0017 949 334OWATONNA 0018 1,108 306OWATONNA 0019 1,287 379
OWATONNA 0019.B 11 IOWATONNA 0020 1,381 191
OWATONNA 0021 977 38
OWATONNA' 0022 1,178 436
OWATONNA 0023 686 209OWATONNA 0024 654 242
OWATONNA/
0025i
336 45
HAVANA TWP 0026 611 191.,1,URORA TWP 0027 726 23/SOMERSET_TWP 0028 991 259LEMOND TWP 0029 567 180BERLIN TWP 0030 484 234ELLENDALE 0031 569 211SUMWT- TWP 0032 653 181BLOOMING PRAIRIE TWP 0033 645 182BLOOMING PRAIRIE 0034 1,001 335,
BLOOMING PRAIRIE 0035 803 30
Source: See Exhibit 10
4 1
35
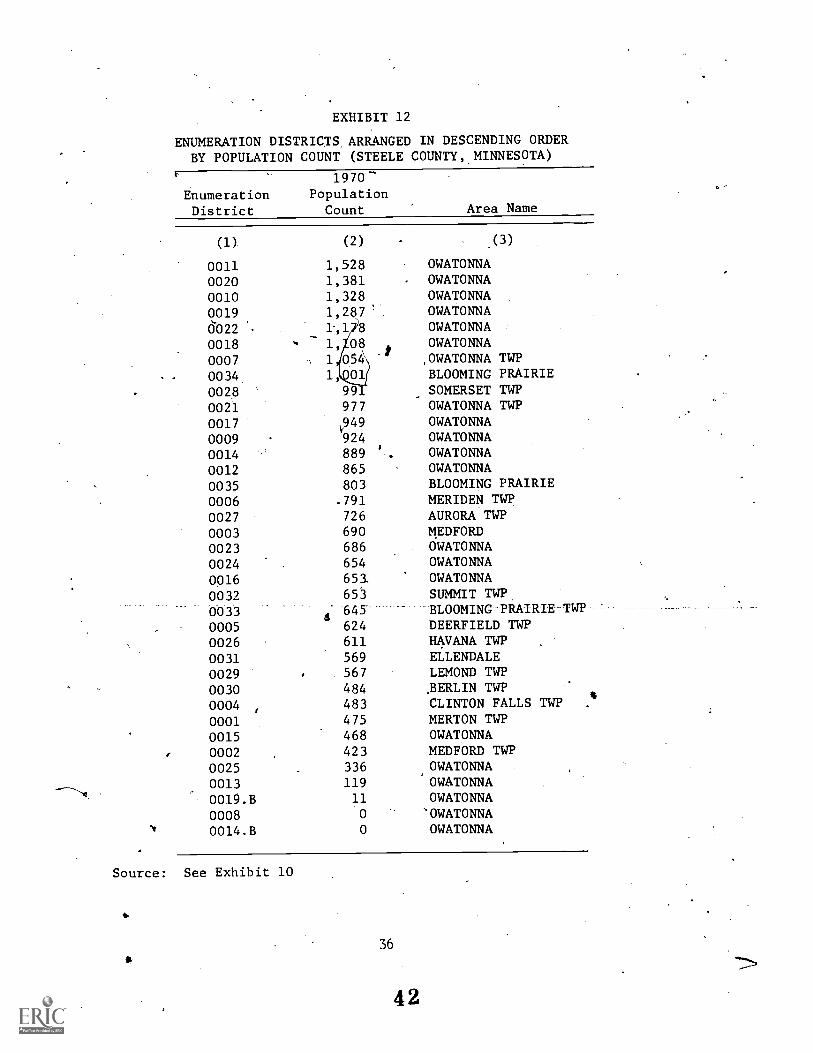
^
EXHIBIT 12
ENUMERATION DISTRICTS ARRANGED IN DESCENDING ORDERBY POPULATION COUNT (STEELE COUNTY, MINNESOTA)
1970
Enumeration Population
District Count Area Name
(1) (2) (3)
0011 1,528 OWATONNA
0020 1,381 OWATONNA
0010 1,328 OWATONNA
0019 1,287 H OWATONNA
6022 1,1 8 OWATONNA
0018 ''' 1, 08 OWATONNA
0007 1 o54 ,OWATONNA TWP
0034 1, 01 BLOOMING PRAIRIE
0028 99 SOMERSET TWP
0021 977 OWATONNA TWP
0017v949 OWATONNA
0009 924 OWATONNA
0014 889 ' OWATONNA
0012 865 OWATONNA
0035 803 BLOOMING PRAIRIE
0006 791 MERIDEN TWP
0027 726 AURORA TWP
0003 690 MEDFORD
0023 686 OWATONNA
0024 654 OWATONNA
0016 651 OWATONNA
0032 653 SUMMIT TWP
0033 01. 645 BLOOMING PRAIRIE TWP
0005 624 DEERFIELD TWP
0026 611 HAVANA TWP
0031 569 ELLENDALE
0029 . 567 LEMOND TWP
0030 484 ERLIN TWP0004
$483 CLINTON FALLS TWP .
0001 475 MERTON TWP
0015 468 OWATONNA
. 0002 423 MEDFORD TWP
0025 336 OWATONNA
0013 119 OWATONNA
0019.B 11 OWATONNA
0008 0 'OWATONNAN 0014.B 0 OWATONNA
Source: See Exhibit 10
36
4 2
->
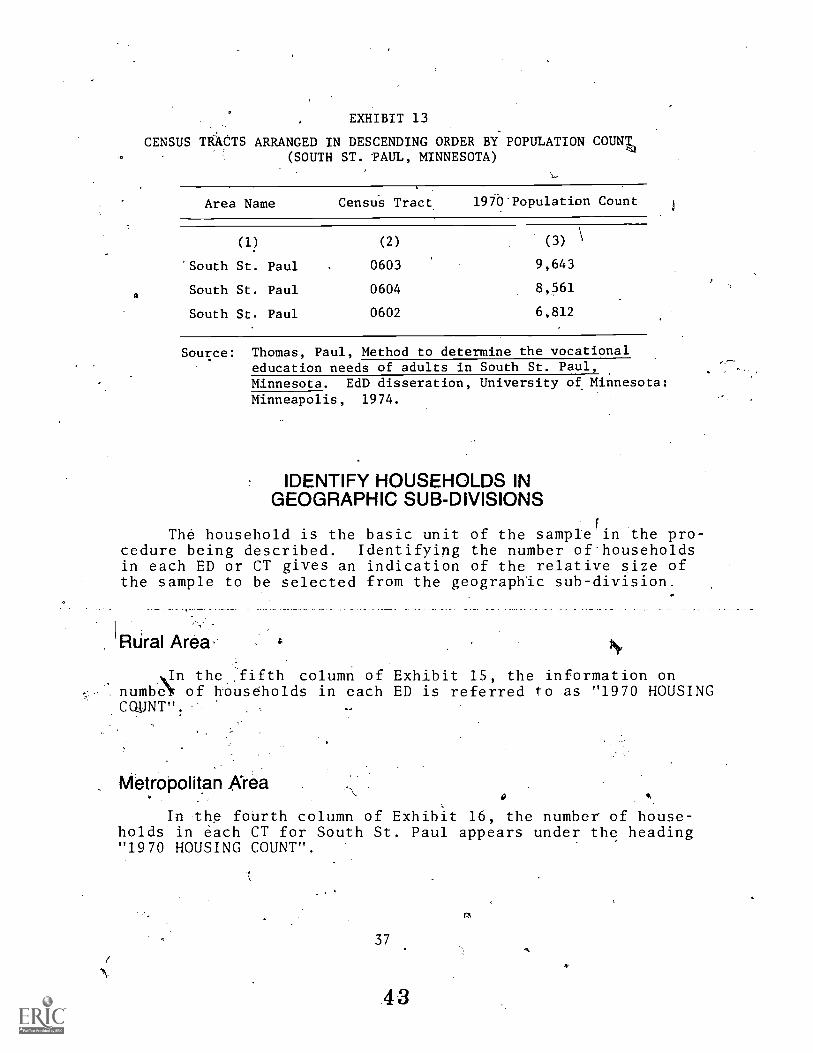
(
EXHIBIT 13
CENSUS TRACTS ARRANGED IN DESCENDING ORDER BY POPULATION COUN%(SOUTH ST. -PAUL, MINNESOTA)
Area Name Censtis Tract 1970'Population Count
(1) (2) (3) \
'South St. Paul 0603 9,643
South St. Paul 0604 8,561
South St. Paul 0602 6,812
Source: Thomas, Paul, Method to determine the vocationaleducation needs of adults in South St. Paul,Minnesota. EdD disseration, University of Minnesota;Minneapolis, 1974.
IDENTIFY HOUSEHOLDS INGEOGRAPHIC SUB-DIVISIONS
The household is the basic unit of the sample in the pro-cedure being described. Identifying the number of'householdsin each ED or CT gives an indication of the relative size ofthe sample to be selected from the geographic sub-division.
Rtiral Area,
In the ,fifth column of Exhibit 15, the information onnumbeN of households in each ED is referred to as "1970 HOUSINGCOUNT".
MetrOpolitan Area .
9 A
In the fourth column of Exhibit 16, the number of house-holds in each CT for South St. Paul appears under the heading"1970 HOUSING COUNT".
4 3
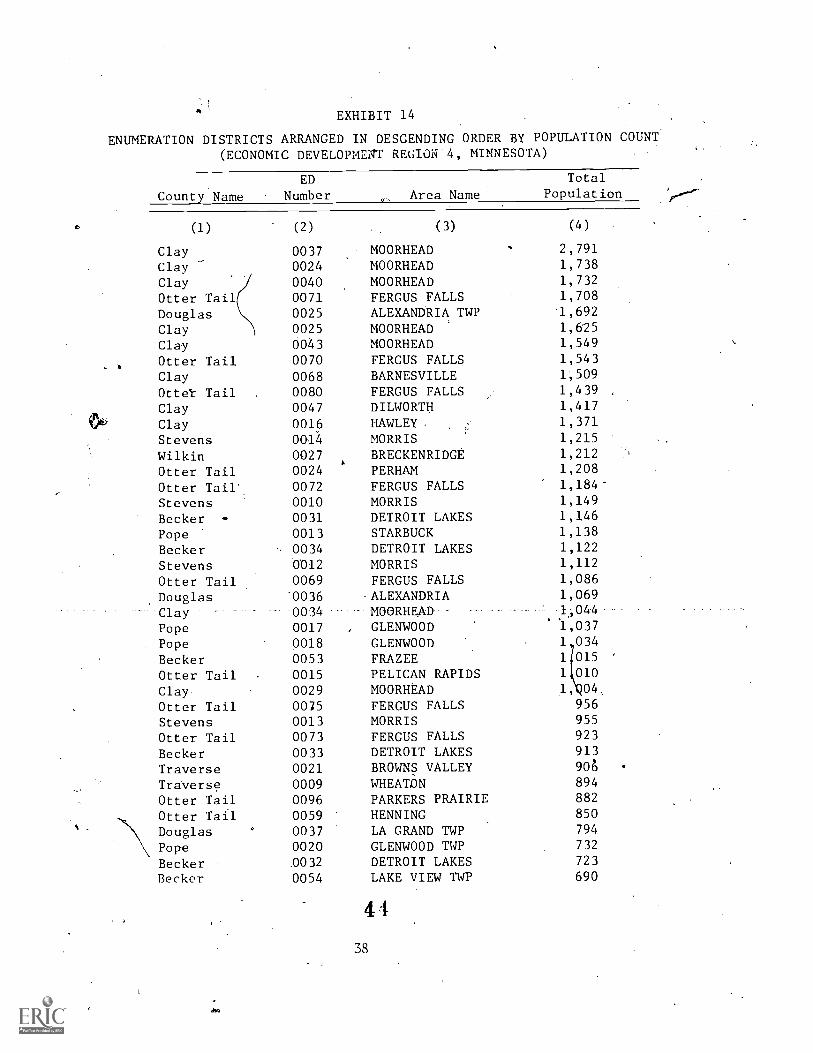
6
EXHIBIT 14
ENUMERATION DISTRICTS ARRANGED IN DESCENDING ORDER BY POPULATION COUNT(ECONOMIC DEVELOPMEgT REGION 4, MINNESOTA)
County Name
(1)
ClayClayClay JOtter TailDouglasClayClayOtter Tail
a
ClayOtter TailClayClayStevensWilkinOtter TailOtter TairStevensBecker ...
PopeBeckerStevensOtter TailDouglasClayPopePopeBeckerOtter TailClayOtter TailStevensOtter TailBeckerTraverseTraverseOtter TailOtter TailDouglasPope
BeckerBecker
ED
Number Area Name
TotalPopulation
(2)
00370024004000710025
(3)
MOORHEAD .
MOORHEADMOORHEADFERGUS FALLSALEXANDRIA TWP
(4)
2,7911,7381,7321,708'1,692
0025 MOORHEAD 1,625
0043 MOORHEAD 1,549
0070 FERGUS FALLS 1,543
0068 BARNESVILLE 1,509
0080 FERGUS FALLS 1,439
0047 DILWORTH 1,417
0016 HAWLEY . 1,371
00.14 MORRIS 1,215
0027I,
BRECKENRIDGE 1,212
0024 PERHAM 1,208
0072 FERGUS FALLS 1,184
0010 MORRIS 1,149
0031 DETROIT LAKES 1,146
0013 STARBUCK 1,138
- 0034 DETROIT LAKES 1,122
0012 MORRIS 1,112
0069 FERGUS FALLS 1,086
'0036 -ALEXANDRIA 1,069
-0034 MOORHEAD -1;044. .
0017 , GLENWOOD 1,037
0018 GLENWOOD 1 034
0053 FRAZEE 1 015
0015 PELICAN RAPIDS 1 010
0029 MOORHEAD 1, 04
0075 FERGUS FALLS 956
0013 MORRIS 955
0073 FERGUS FALLS, 923
0033 DETROIT LAKES 913
0021 BROWNS VALLEY 90;
0009 WHEATON 894
0096 PARKERS PRAIRIE 882
0059 HENNING 850
0037 LA GRAND TWP 794
0020 GLENWOOD TWP 732
.0032 DETROIT LAKES 723
0054 LAKE VIEW TWP 690
4 4
38
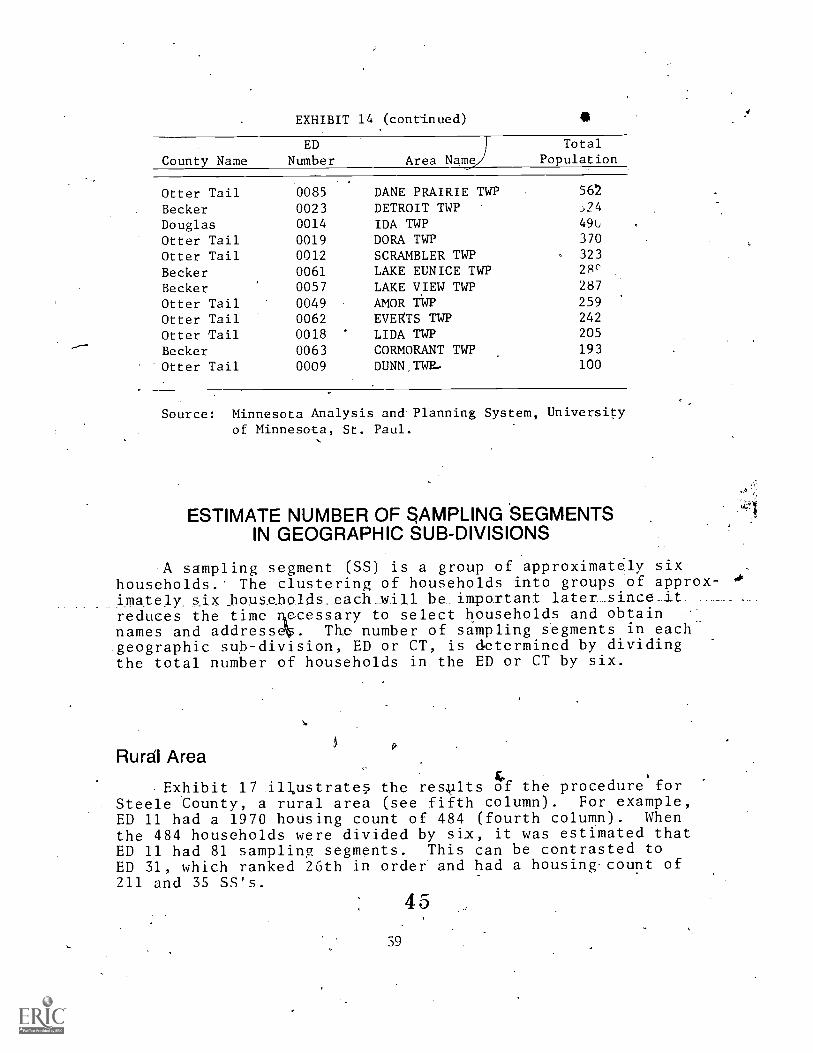
EXHIBIT 14 (continued)
County NameED
Number Area Name
TotalPopulation
Otter Tail 0085 DANE PRAIRIE TWP 562
Becker 0023 DETROIT TWP J24
Douglas 0014 IDA TWP 49U
Otter Tail 0019 DORA TWP 370
Otter Tail 0012 SCRAMBLER TWP 323
Becker 0061 LAKE EUNICE TIP 28e
Becker 0057 LAKE VIEW TWP 287
Otter Tail 0049 AMOR TWP 259
Otter Tail 0062 EVEKTS TWP 242
Otter Tail 0018 LIDA TWP 205
Becker 0063 CORMORANT TWP 193
Otter Tail 0009 DUNN,TWEL 100
Source: Minnesota Analysis and Planning System, Universityof Minnesota, St. Paul.
ESTIMATE NUMBER OF SAMPLING SEGMENTSIN GEOGRAPHIC SUB-DIVISIONS
A sampling segment (SS) is a group of approximately sixhouseholds. The clustering of households into groups of approx-imatelr six _house.helds_each_will be.impartant_later_since_it..reduces the time necessary to select households and obtainnames and addressap. The number of sampling segments in eachgeographic s0-division, ED or CT, is determined by dividingthe total number of households in the ED or CT by six.
Rural Areafr
4. Exhibit 17 ill,ustrate the res4.11tS of the procedure for
Steele County, a rural area (see fifth column). For example,ED 11 had a 1970 hoUsing count of 484 (fourth column). Whenthe 484 households were divided by six, it was estimated thatED 11 had 81 sampling segments. This can be contrasted toED 31, which ranked 26th in order and had a housing-count of211 and 35 SS's.
4 5
39
k
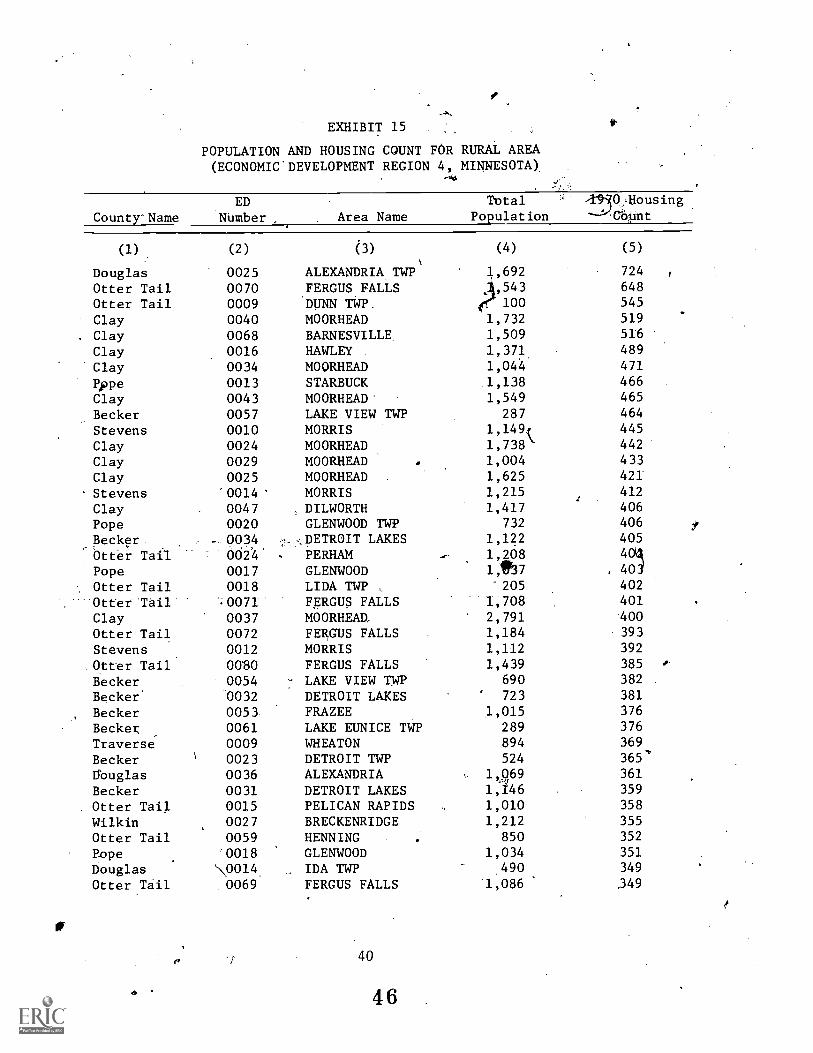
EXHIBIT 15
POPULATION AND HOUSING COUNT FOR RURAL AREA(ECONOMIC'DEVELOPMENT REGION 4, MINNESOTA).
EDCounty-Name Number
(1) (2)
Douglas 0025Otter Tail 0070Otter Tail 0009
Clay 0040Clay 0068Clay 0016
Clay 0034
Pppe 0013Clay 0043Becker 0057Stevens 0010Clay 0024Clay 0029Clay 0025Stevens "0014Clay 0047Pope 0020Becker 0014
,-, _
Otter Tail 0024Pope 0017Otter Tail 0018Otter"Tail- %0071'Clay 0037Otter Tail 0072
Stevens 0012Otter Tail 0080Becker 0054Becker' 0032
Becker 0053,
Becker 0061Traverse 0009Becker \ 0023Ubuglas 0036Becker 0031Otter Tail 0015Wilkin 0027Otter Tail 0059Piope '0018Douglas \0014.Otter Tail .0069
Area NameTotal ,11-.30ousing
Population
(3) (4) (5)
ALEXANDRIA TWP 1,692 724 (
FERGUS FALLS )1,543 648
'DUNN TWP. te 100 545
MOORHEAD 1,732 519
BARNESVILLE 1,509 51.6
HAWLEY . 1,371. 489
MOORHEAD 1,044 471
STARBUCK 1,138 466
MOORHEAD- 1,549 465
LAKE VIEW TWP 287 464
MORRIS 1,149( 445
MOORHEAD 1,738 442
MOORHEAD 1,004 433
MOORHEAD 1,625 421
MORRIS 1,215 412
DILWORTH 1,417 406GLENWOOD TWP 732 406
DETROIT LAKES 1,122 405
PERHAM .-- 1,208 404GLENWOOD 1"7 . 401LIDA TWP , -205 402
FERGUS FALLS 1,708 401
MOORHEAD, 2,791 400FERGUS FALLS 1,184 393
MORRIS 1,112 392
FERGUS FALLS 1,439 385
LAKE VIEW TWP 690 382
DETROIT LAKES 723 381
FRAZEE 1,015 376
LAKE EUNICE TWP 289 376
WHEATON 894 369
DETROIT TWP 524 365'ALEXANDRIA 1,1169 361
DETROIT LAKES 1,f46 359
PELICAN RAPIDS 1,010 358
BRECKENRIDGE 1,212 355
HENNING . 850 352
GLENWOOD 1,034 351
IDA TWP ,490 349
FERGUS FALLS -1,086 .349
40
4 6
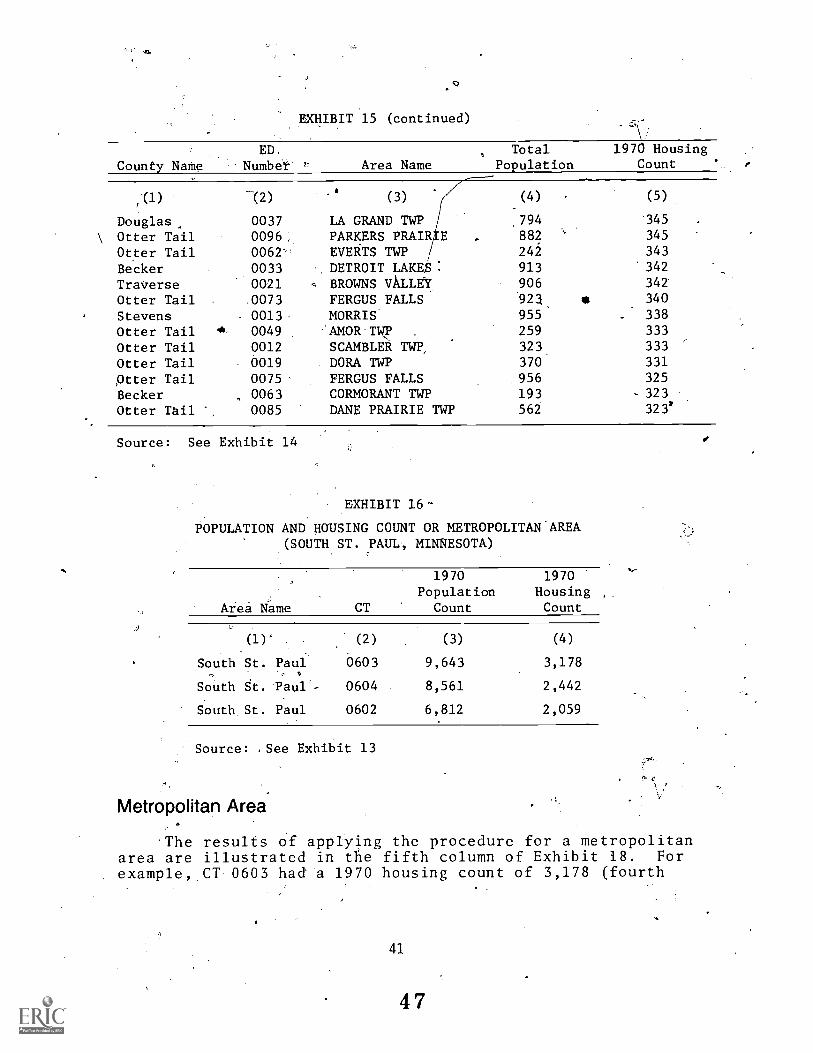
EXHIBIT 15 (continued)
County NateED,
'Number Area NameTotal
Population1970 Housing
Count
:(1) (2) (3) (4) (5).
Douglas 0037 LA GRAND TWP 794 345
Otter Tail 0096, PARKERS PRAIR E . 882 345
Otter Tail 0062 EVEliTS TWP 242 343
Becker 0033 DETROIT LAKEh: 913 342
Traverse 0021 , BROWNS VALLEY 906 342
Otter Tail 0073 FERGUS FALLS 921, * 340
Stevens 0013 MORRIS 955 - 338
Otter Tail 4L 0049 AMOR TWp . 259 333
Otter Tail 0012 SCAMBLER TWP, 323 333 '
Otter Tail 0019 DORA TWP 370 331
0tter Tail 0075 FERGUS FALLS 956 325
Becker 0063 CORMORANT TWP 193 - 323
Otter Tail 0085 DANE PRAIRIE MD 562 323'
Source: See Exhibit 14
EXHIBIT 16-
POPULATION AND HOUSING COUNT OR METROPOLITAN AREA(SOUTH ST. yAuL, MINNESOTA)
1970 1970Population Housing ,
Area Name CT Count Count
(l) (2) (3) (4)
South St. Paul,
0603 9,643 3,178
South ft. Paul - 0604 8,561 2,442
South St. Paul 0602 6,.812 2,059
Source: ,See Exhibit 13
Metropolitan Area
'The results of applYing the procedure for a metropolitanarea are illustrated in the fifth column of Exhibit 18. Forexample, CT 0603 had a 1970 housing count of 3,178 (fourth
41
4 7
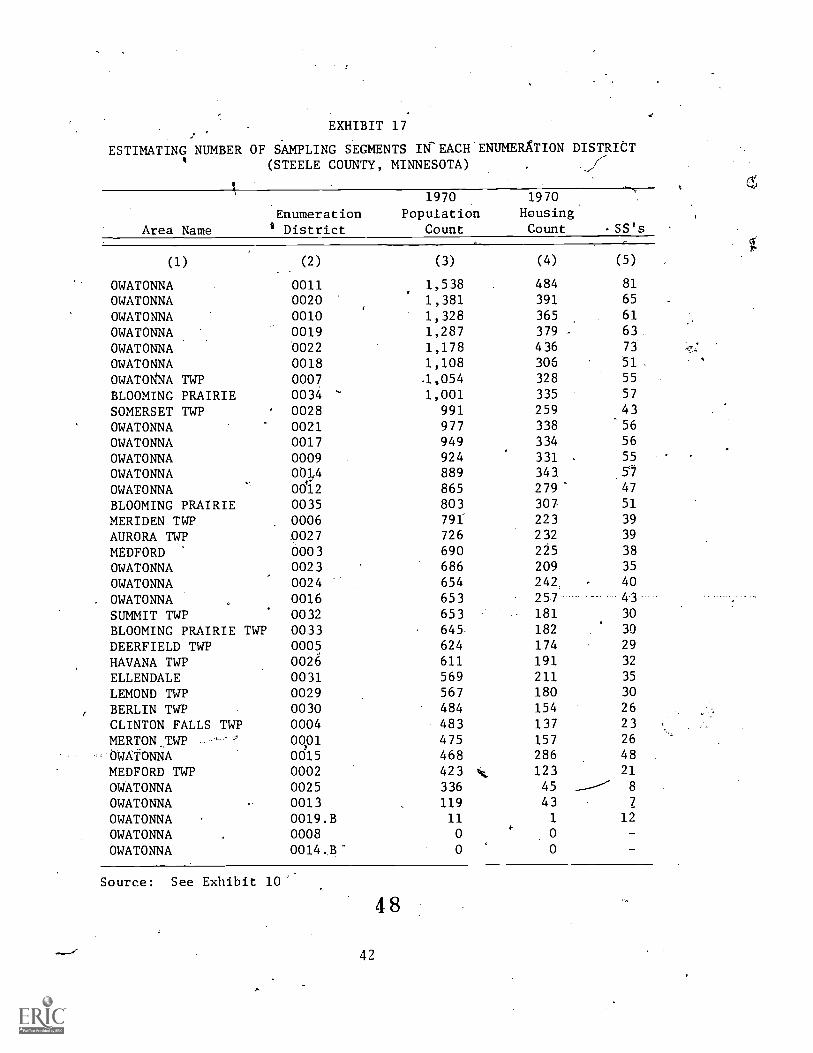
EXHIBIT 17'
ESTIMATING NUMBER OF SAMPLING SEGMENTS IM-EACH ENUMERATION DISTRICT(STEELE COUNTY, MINNESOTA)
Area NameEnumerationDistrict
1970
PopulationCount
1970HousingCount .SS's
(1) (2) (3) (4) (5)
OWATONNA 0011 1,538 484 81
OWATONNA 0020 1,381 391 65
OWATONNA 0010 1,328 365 61
OWATONNA 0019 1,287 379 63
OWATONNA 0022 1,178 436 73
OWATONNA 0018 1,108 306 51
OWAT0/4NA TWP 0007 .1,054 328 55
BLOOMING PRAIRIE 0034 ' 1,001 335 57
SOMERSET TWP 0028 991 259 43
OWATONNA 0021 977 338 56
OWATONNA 0017 949 334 56
OWATONNA 0009 924 331 55
OWATONNA 00.14 889 343 51
OWATONNA 0012 865 279 47
BLOOMING PRAIRIE 0035 803 307 51
MERIDEN TWP 0006 791 223 39
AURORA TWP 0027 726 232 39
MEDFORD 0003 690 225 38
OWATONNA 0023 686 209 35
OWATONNA 0024 654 242 40
OWATONNA 0016 653 257 43
SUMMIT TWP 0032 653 181 30
BLOOMING PRAIRIE TWP 0033 645 182 30
DEERFIELD TWP 0005 624 174 29
HAVANA TWP 0026 611 191 32
ELLENDALE 0031 569 211 35
LEMOND TWP 0029 567 180 30
BERLIN TWP 0030 484 154 26
CLINTON FALLS TWP 0004 483 137 23
MERTON TWP 00,01 475 157 26
OWATONNA 0015 468 286 48
MEDFORD TWP 0002 423 t 123 21
OWATONNA 0025 336 45 ------- 8
OWATONNA 0013 119 43 7
OWATONNA 0019.B 11 1 12
OWATONNA 0008
OWATONNA 0014.B
Source: See Exhibit 10'.
42
4 8
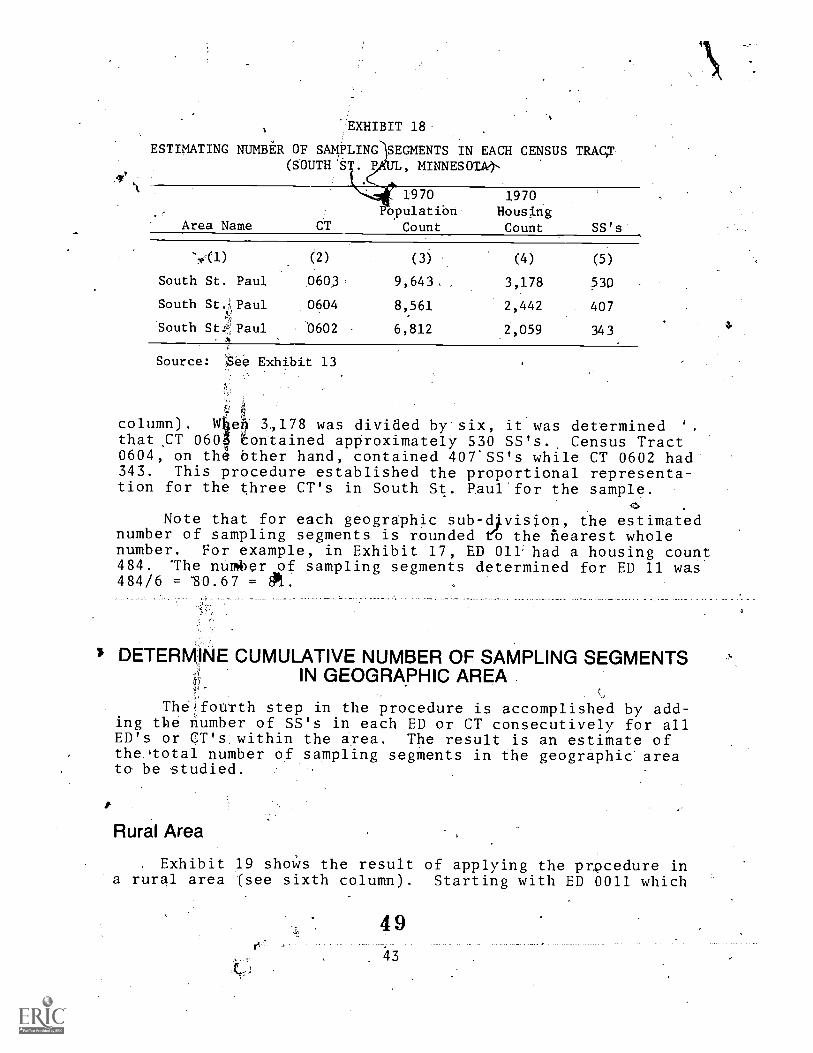
EXHIBIT 18
ESTIMATING NUMBER OF SAMPLING SEGMENTS IN EACH CENSUS TRACJ(SOUTH S. PJIUL, MINNESOTA,),
1970 1970Population', Housing
Area Name CT Count Count SS's
(2) (3) (4) (5)
South St. Paul 060,3 9,643, 3,178 530
South St.:Paul 0604 8,561 2,442 407A
South StPaul 0602 6,812 2,059 343. k
Source: 'See Exhibit 13
column). Whe 3,178 was divided by'six, it was determined .
that,CT 060; contained approximately 530 SS's.. Census Tract0604, on th6 Other hand, contained 407.SS's while CT 0602 had343. This procedure established the proportional representa-tion for the three CT's in South St. Paul'for the sample.
Note that for each geographic sub-cqvision, the estimatednumber of sampling segments is rounded 1(o the nearest wholenumber. For example, in Exhibit 17, ED 011 had a housing count484. 'The number of sampling segments determined for ED 11 was484/6 = '80.67 =
I DETERMINE CUMULATIVE NUMBER OF SAMPLING SEGMENTSIN GEOGRAPHIC AREA
TheifoUrth step in the procedure is accomplished by add-:
ing the number of SS's in each ED or CT consecutively for allED's or QT's within the area. The result is an estimate ofthe qotal number of sampling segments in the geographic' areato be studied.
Rural Area
Exhibit 19 shoWs the result of applying the procedure ina rural area (see sixth column). Starting with ED 0011 which
4 9
43
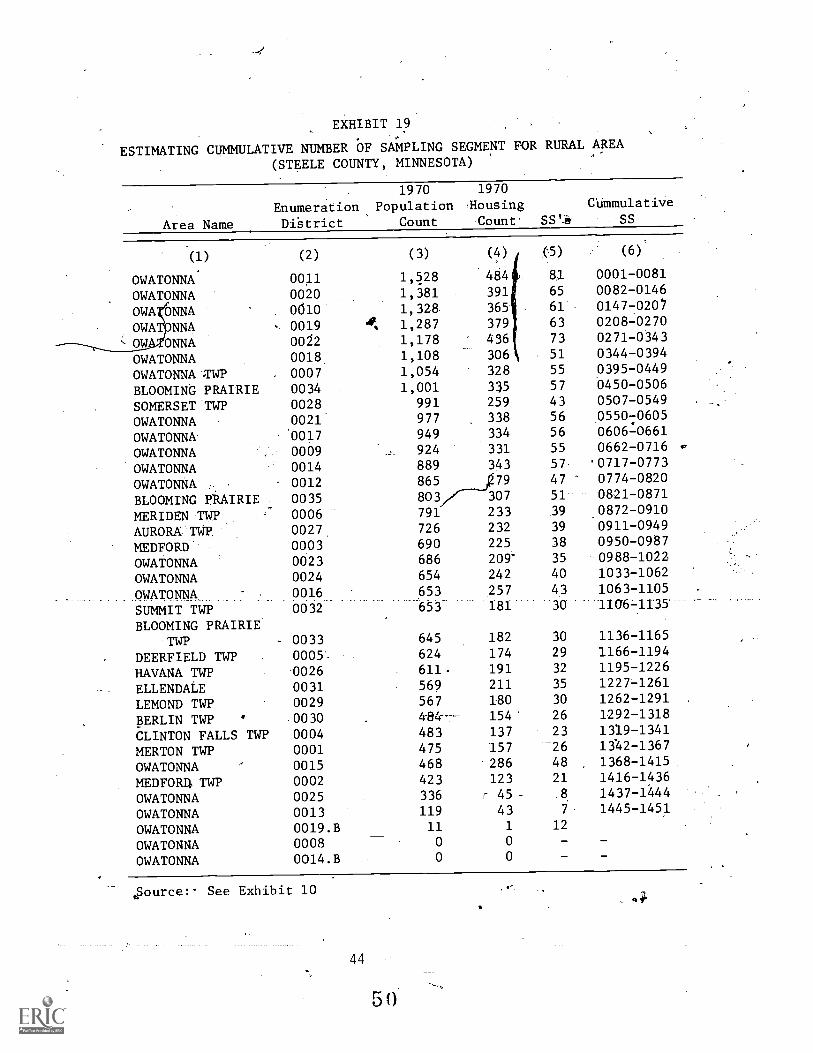
EXHIBIT 19
ESTIMATING CUMULATIVE NUMBER OF SAMPLING SEGMENT FOR RURAL AREA
(STEELE COUNTY, MINNESOTA)
Area Name
1970 1970
Enumeration Population .Housing
Dfstrict Count Count.
(1)
OWATONNAOWATONNAOWA ONNAOWAT NNAOW ONNAOWATONNAOWATONNA -ZIA.T
BLOOMING PRAIRIESOMERSET .TWPOWATONNAOWATONNAOWATONNAOWATONNAOWATONNABLOOMING PRAIRIEMERIDEN TWPAURORA:114P.MEDFORD'OWATONNAOWATONNA
JNATONNA.SUMMIT TWPBLOOMING PRAIRIE
TWPDEERFIELD TWPHAVANA TWPELLENDALELEMOND TWPBERLIN TWP'CLINTON FALLS TWPMERTON TWPOWATONNAMEDFOR4 TWPOWATONNAOWATONNAOWATONNAOWATONNAOWATONNA
(2)
00110020061000190022001800070034002800210017000900140012003500060027000300230024
00160032
0033000500260031002900300004000100150002002500130019.B00080014.B
41.
( 3)
1,5281,3811,3281,2871,1781,1081,0541,001
991977949924889
865
803791
726
690686654
653653
645
624611.569
567
48347546842333611911
(4)
484
391
365
379
436
306
328335
259
338334
331
34379
307
233232225
209'
242
257181'
182174191211180154137157286123
c 45
43
SS'it.
CUmmulativeSS
(5) (6)
81 0001-008165 0082-014661 01477020,6.3 0208-027073 0271-034351 0344-039455 0395-044957 0450-050643 0507-054956 .0550:0605
56 0606-066155 0662-071657 '0717-077347 0774-082051' 0821-0871.39 .0872-091039 0911-094938 0950-098735 0988-102240 1033-106243 1063-1105-30 -11061135.
30 1136-116529 1166-119432 1195-122635 1227-126130 1262-129126 1292-1318
23 1319-1341-26 1342-136748 1368-141521 1416-14368 1437-14447 1445-1451
12
epource:. See Exhibit 10
44
5 0
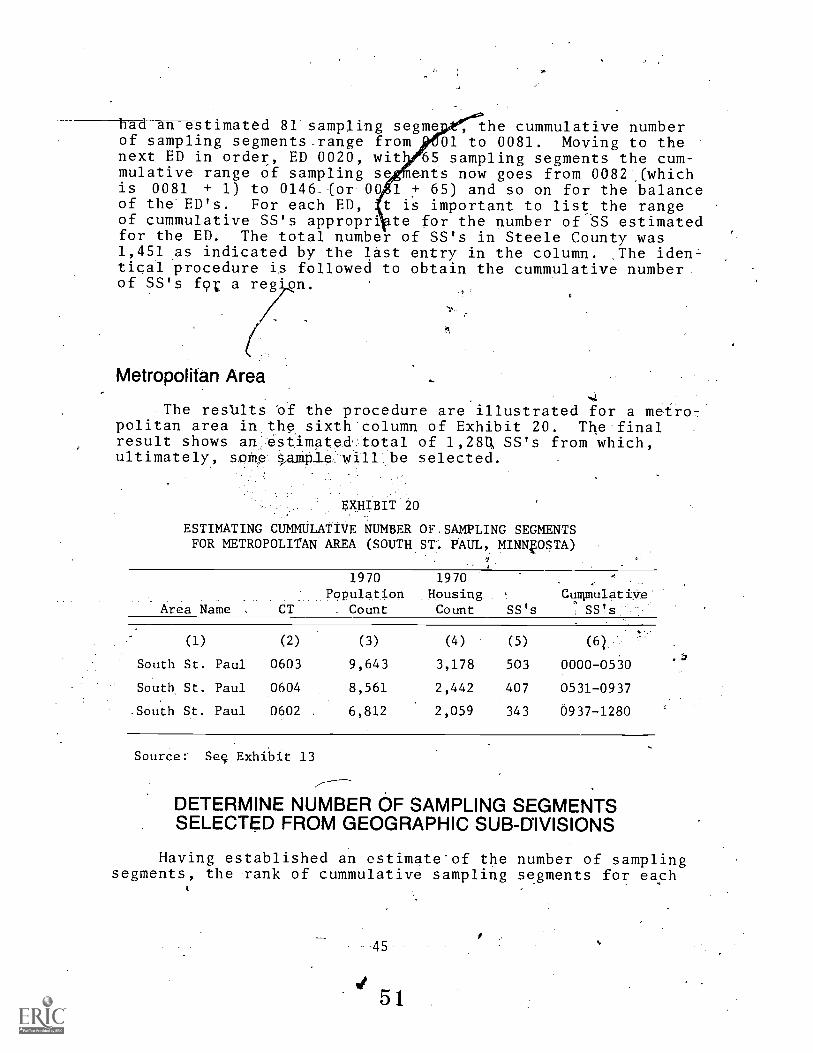
hadan estimated 81 sampling segmev , the cummulative numberof sampling segments_range from ' 01 to 0081. Moving to thenext ED in order, ED 0020, wit 65 sampling segments the cum-mulative range of sampling se ants now goes from 0082 .(whichis 0081 + 1) to 0146 (or 00,.1 + 65) and so on for the balanceof the ED's. For each ED, t is important to list the rangeof cummulative SS's appropri te for the number of SS estimatedfor the ED. The total number of SS's in Steele County was1,451 as indicated by the last entry in the column. _The iden-tical procedure is followed to obtain the cummulative numberof SS's fot a reg'on.
Metropolitan Area
a
The resblts 'of the procedure are illustrated for a metro-politan area in the sixth column of Exhibit 20. The finalresult shows an estimated' total of 1,284 SS's from which,ultimately, sciMe §-ample-will be selected.
ENKBIT 20
ESTIMATING CUMULATIVE NUMBER OF.SAMPLING SEGMENTSFOR METROPOLITAN AREA (SOUTH ST% PAUL, MINWSTA)
1970 1970Popplqtion .Housing Cummu10.0*e:
. _ . .
Area Name . CT . Count Count SS's H SS's-
(1) (2) (3)
South St. Paul 0603 9,643
South, St. Paul 0604 8,561
.South St. Paul 0602 . 6,812
(4) (5) (q
3,178 503 0000-0530
2,442 407 0531-0937
2,059 343 0937-1280
Source: Sec Exhibit 13
DETERMINE NUMBER OF SAMPLING SEGMENTSSELECTED FROM GEOGRAPHIC SUB-DIVISIONS
Having established an estimate'of the number of samplingsegments, the rank of cummulative sampling segments for each
45
5 1
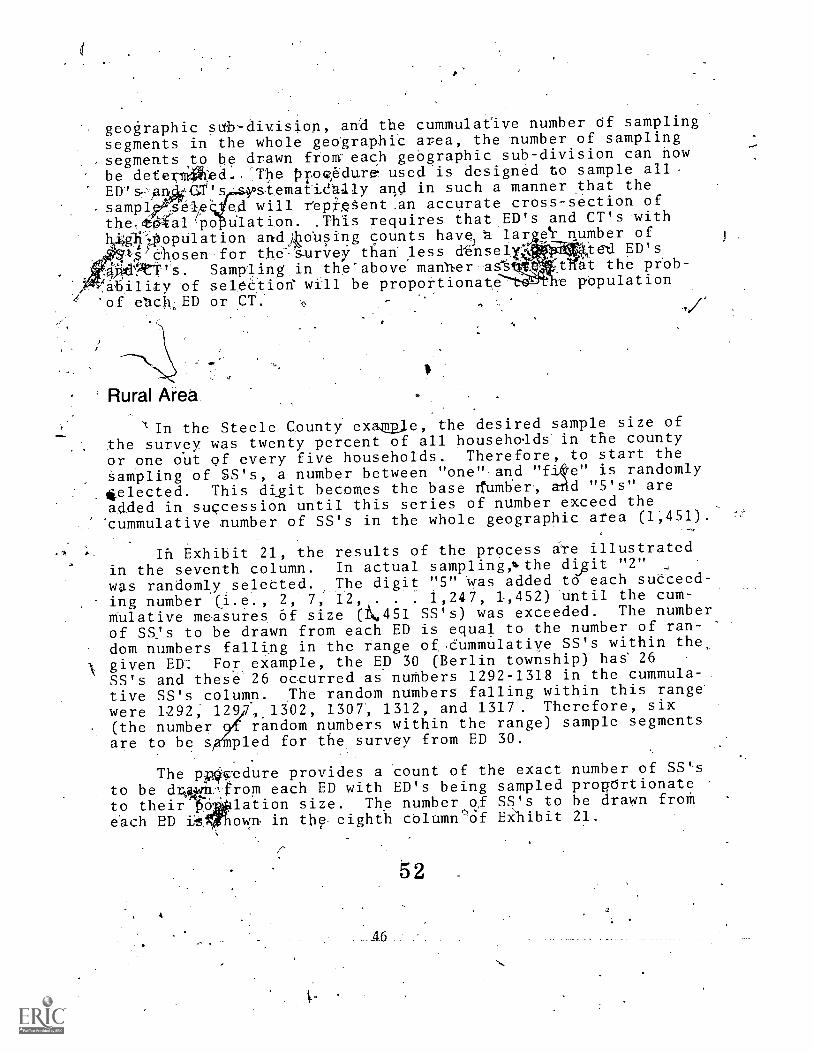
geographic sdb-division, and the cummulafive number Of sampling
segments in the whole geographic area, the number of sampling
, segments tobe drawn ftorrreach geographic sub-division can nowbe determiliedThe ppoo,edure .. used is designed to sample all.
EDisan, Ga"s ystemafieaaly and in such a manner that the
-samp12'ele' ed will rep"reent.an accurate cross-section of
the,04-aljpo This requites that ED's and CT's with*glipopUlation afticU4Ousing counts have a lar!e'r number ofA-5YC'hosen for the s.urvey than less dense1 le.04-teti ED's
t's. Sampling in the'above mann.er as7§ tlIfit the prob-a,
of seleCtioe will be proportionate e pOpulation
"of eckED or CT.
Rural Area
\In the Steele County example, the desired sample size of
the survey was twenty percent of all househo4ds in the county
or one ()lit of every five households. Therefore, to start thesampling of SS's, a number between "one" and "fIqe" is randomly
*elected. This digit becomes the base Trumber, arid "5's" are
added in succession until this series of number exceed the. cummulative number of SS's in the whole geographic area (1;451).
In Exhibit 21, the results of the process ate illustrated
in the seventh column. In actual sampling,lithe digit "2"
was randomly selected. The digit "5" *was added to each succeed-
ing number 2, 7, 12, . . .1,247, 1,452) umtil the cum-
Mulative measures Of size (1\4451 SS's) was exceeded. The number
of SS,'s to be drawn from each ED is equal to the number of ran-
dom numbers falling in the range of .Cummulatiye SS's within the,
given ED°: For example, the ED 30 (Berlin township) has 26
SS's and these 26 occurred as numbers 1292-1318 in the cummula-
tive SS's column. The random numbers falling within this range
were 1292; 1297,.1302, 1307, 1312, and 1317. Therefore, six
(the number random numbers within the range) sample segments
are to be s1thnpled for the survey from ED 30.
The pocedure provides a count of the exact number of SS'sto be dr.INKfrom each ED with ED's being sampled prop-Ortionate
to their'ISO lation size. The number of SS's to be drawn froth
each BD it own in the, eighth columedf EXhibit 21.
46
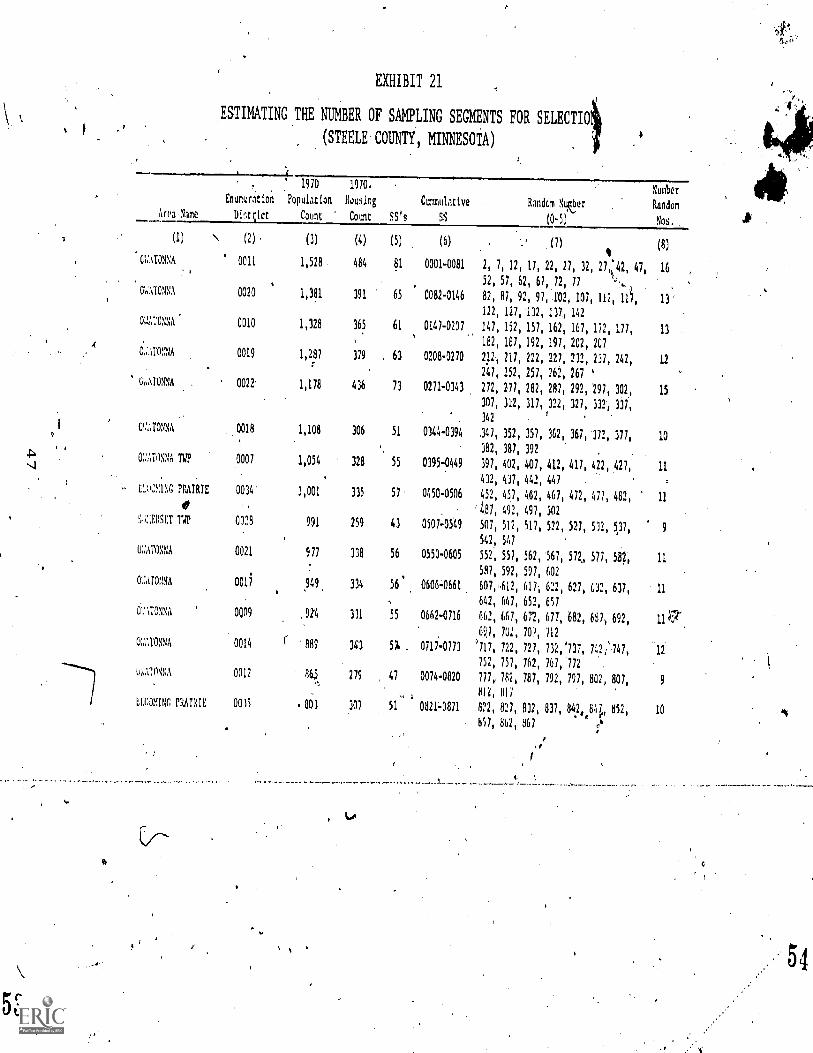
A ' '799 '158 'OR
OI 'IS11
'1h8.Z.Ill
'LES 'ZIO '17,8 7114 Ii00-1Z110 IS
,
LIN '718
6 '108 'ZOR '161 'Z6I '181 '181 'LI 0Z110.1100 LI
ZIL. '191 'Z9L 'LS/ 'ZSL
.ZI 'L11.,1 '/E1,'ZE1 'al 'Zit 'CIL, (110-1110 ' 'LS
711 '401 '701 '169
-6' IT 4Z69 '09 '192 "LL9 'ZIA '199 '799 9110-7990 SS
159 "69 'Lh9 'Zh9
11 '1E9 '709 '179 '719 '119 '719'109 19901090 '
,95
ZO9 '/65 '165 '18S
II 19i '1LS ItS '195. '195 '/SS 'ZSS S090-OSSO 9S
OS 'ZhS
6
,
'ICS 'ZES 'US 'ZIS '/1S '/1S '105 615071050 Eh
ZOS '161 'Z6h 'al,
II ,
'ZSI 'IV; Ittl TA 'tfA 'LSh 'ZS, 9050-0ShO ,IS
. Oh 'Zhh 'III '10.
11 '1Z1 'ZZ1 'III 11h '101 '70h '16E 61I0-560 SS
76E '18E 'nic
01 'La 'iv. '190 79E 'LSC 'ISE 'LlE 16E0-110 IS
P ' ZhE
'4( 'm 'ar '770 '110 Tc 'Lot
SI 'IOC '161. '767 'HZ '181 1,1LZ 'ZLZ thCO-IIZO IL
4
197 '07 'LSZ 'ZSZ 'LIZ
ZI 'Z'a '157 'ZEZ 'IZ7 'ZZZ 'I1Z '117 0170-8070 09
197 '707 '161 '761 'NI 'NI '
LOt. tO8 '
6IZ 68
CIE 688 . )
ILE I76.
10E 616
80E 116
657 166
SEE 100'1
87E hSO'I
900 801'1
90 BL1'1
1 61E 181'I
SLOO 111)111M A10111
' Z100 VNNW,An
11100 VS6O1X0
6000
(TOO ITNOIT:0
ROO YNSOIVM
ENO 4. l'Or's
00
1E00 3I8IVII 0NINC011
1000 4!11 MT=
9100 .
11M01=
,ZZOO Moim ,
6100 ViCar()
. CI 'III 'ZtI 'LIT '791 'LSI 'ISI '41I L0Z0-11I0 19 60 WI OHO ,VNNZno VI 'itI 'ZLI.'llI 'ZZI
EI '01 .'ZI1 'MI '101;16 '76 '18 '78 9110-7800 S9 160 I8E'I
OZOO UNOMO e LL '7L '19 '79 'tS 'ZS
91 '1, 77,17 'ZE 'LZ 'ZZ 'Ll '71 't '7 1800-1000 Ii IP 815'i
1100 A '
(8) (0 .
'
(9) (5) (9) (0) .
(t) (1)
,
(S-0) ss siss lima) ;DIal,da
ueNu.lv wopm 149 wopuull mpulnlunD 9USnC9 uoilvIndoa uoluwou3
'0161 0161 '
(vIosaux 'IN liOILDRIRS
110i SINTAORS ONFINVS 11a101 au 0NIIVNIISH
NtItflO0 aaaIs) l
IZ 'MIER
C9
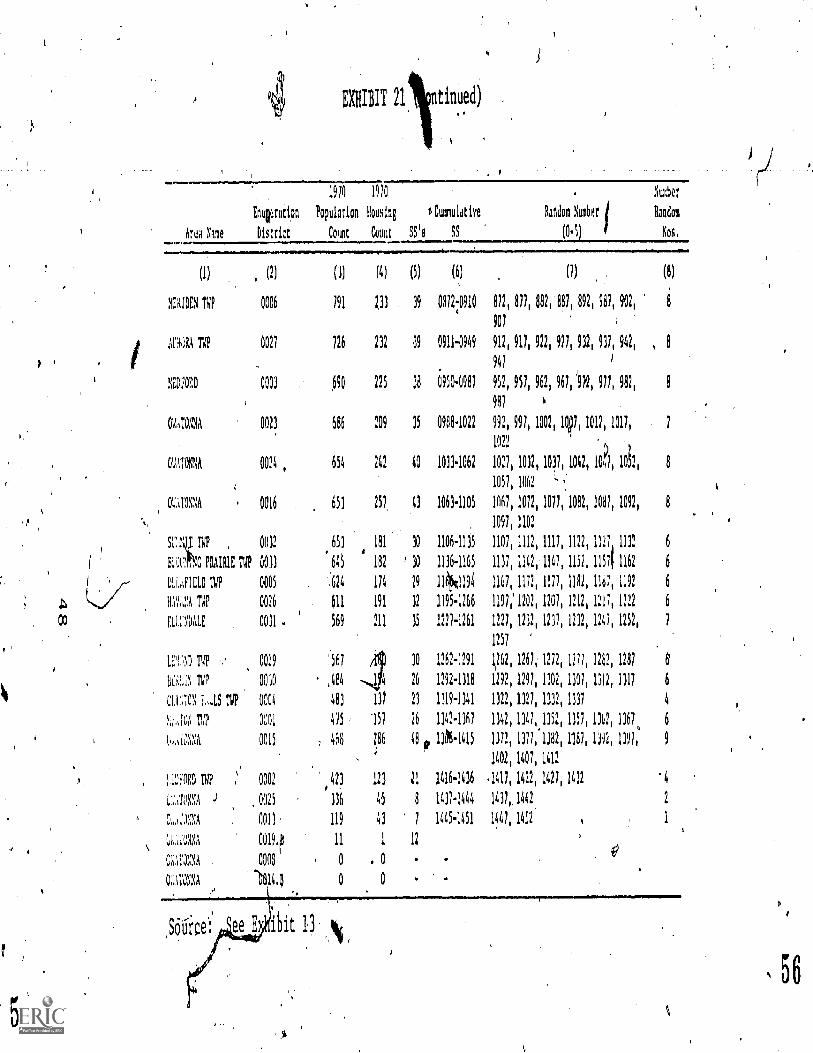
IIIEXHIBIT 21 ntinued)
Ara Name
Engrain
District
1970 1310
Population Housing
Count Count WEI
t Cummuldtiva
99
Random Number
(041
Nuber
Random
Nos,
(1) , (2)
MERIDEN IliP 0006
,;r4+1 TIP 0027
NE1)1,0E0 0003
OLTNIA 0023
NATONNA 0024
EC,..%10NNA 0016
514,1 TO , 0012
E.,:!4C 111411RIE TIP 001)
Iti;.1,1E10 IV? 0005
TI1P 0026
RH:50,1LE 0011 .
LE'n0 11,T ,' 0029
LIN i 0010Ili N
CIT.70N fIS VP 0004
;...Ti)5 VP OA
0015
1:Di90 1N? 0002
0015
0,,ZNA 0011
1,12,'t 0019 lit
0009
0;.,11ZNA 14.8
(3) (4) (5)
191 233 . 39
726 232 39
690 225 38
686 209 35
654 242 40
651 25?, 43
653 181 30,
645 182 ' 30
'.614 114 29
611 191 32
569 211 35
1561 30
,484 ---,Ili 26
481 117 21
415 '157 26
,. 464 1,86 48
.
423 123 21, ,
316 45 8
119 43 1
11 1 11
, 0 . 0
0 0
(6)
0812-.0910
0911-0949
.
0950-8981
0908-1022
1013-1061
1063-1105
1106-1135
1136-1165
1411194
1195-1266
1227-1261
1262-1291
1292-1318
1119-1341
1141-1161
08-1415
1416-1436
1417-1444
1445-1451
. (1)
812, 811, 882,181, 892, 981, 902,
90?
911, 911, 912, 971, 932, 911, 942,
941/
,
952, 951, 962, 961, 9112, 911, 982,
981 1
932, 991, 1002, 41, Nal 1011,
1022
1027, 1032, 1037, 1042, 104, 10il,
1057, 1062
1061, 1012, 1017, 1082, 1081, 1092,
1097, 1102
1107, 1112, 1117, 1122, 1121, 1112
11)1, 1142, 1147, 1152, 11571 1162
1167, 1112, 1117, 1182, 11d1, 1132
1191; 120, 1201, 1212, 1211, 11Q2
1227, 1232, 1237, 1232, 1241, 1252,
1257
1,262, 1264 1212, 1211, 1262, 1281
1292, 129/., 1302, 1101, 1312,1317
1)22, 1321, 1332, 1331
1)42, 1141, 1352,1351, 1)0, 1167.
1371, 1)11;1382, 1187, 1192, 1391,
1402, 1407, 1412
.1411, 1422, 1421, 1432
1434 1442
1441, 1452
(0
8
, 8
8
8
8
6
6
6
6
7
6'
6
4
6
9
..
ee E ibit 13 4(
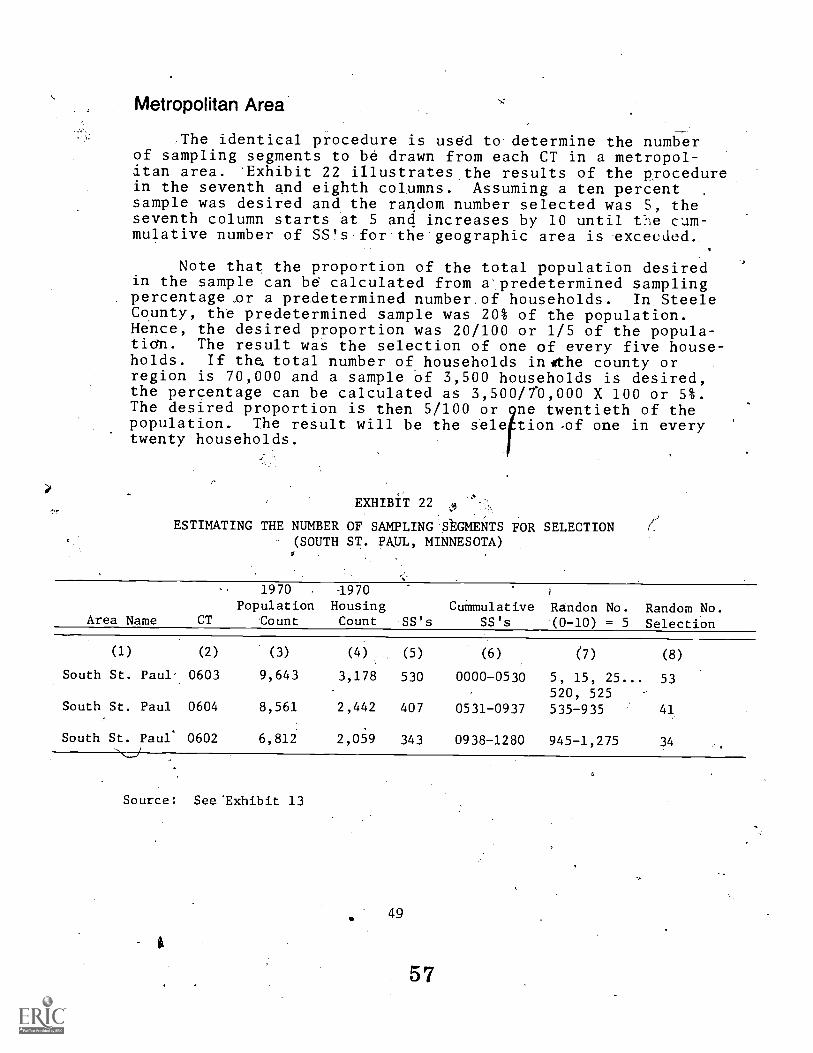
Metropolitan Area
The identical procedure is used to determine the numberof sampling segments to be drawn from each CT in a metropol-itan area. 'Exhibit 22 i1lustrates the results of the procedurein the seventh and eighth columns. Assuming a ten percentsample was desired and the random number selected was 5, theseventh column starts at 5 and increases by 10 until t.-le cum-mulative number of SS s for tlie'geographic area is exceeded.
Note that the proportion of the total population desiredin the sample can be calculated from a predetermined samplingpercentage,or a predetermined number.of households. In SteeleCounty, the predetermined sample was 20% of the population.Hence, the desired proportion was 20/100 or 1/5 of the popula-tidn. The result was the selection of one of every five house-holds. If the, total number of_ households inothe county orregion is 70,000 and a sample of 3,500 households is desired,the percentage can be calculated as 3,500/70,000 X 100 or 5%.The desired proportion is then 5/100 or gne twentieth of thepopulation. The result will be the sele tion -of one in everytwenty households.
EXHIBIT 22
ESTIMATING THE NUMBER OF SAMPLING SEGMENTS FOR(SOUTH ST. PAUL, MINNESOTA)
SELECTIONlj.
Area Name CT
1970Population
Count
4970HousingCount SS's
CummulativeSS's
Randon No.'(0-10) = 5
Random No.Selection
(1) (2) (3) (4) (5) (6) 7) (8)
South St. Paul- 0603 9,643 3,178 530 0000-0530 5, 15, 25... 53520, 525
South St. Paul 0604 8,561 2,442 407 0531-0937 535-935 41
South St. Pau1 0602 6,812 2,059 343 0938-1280 945-1,275 34
Source: See'Exhibit 13
49
57
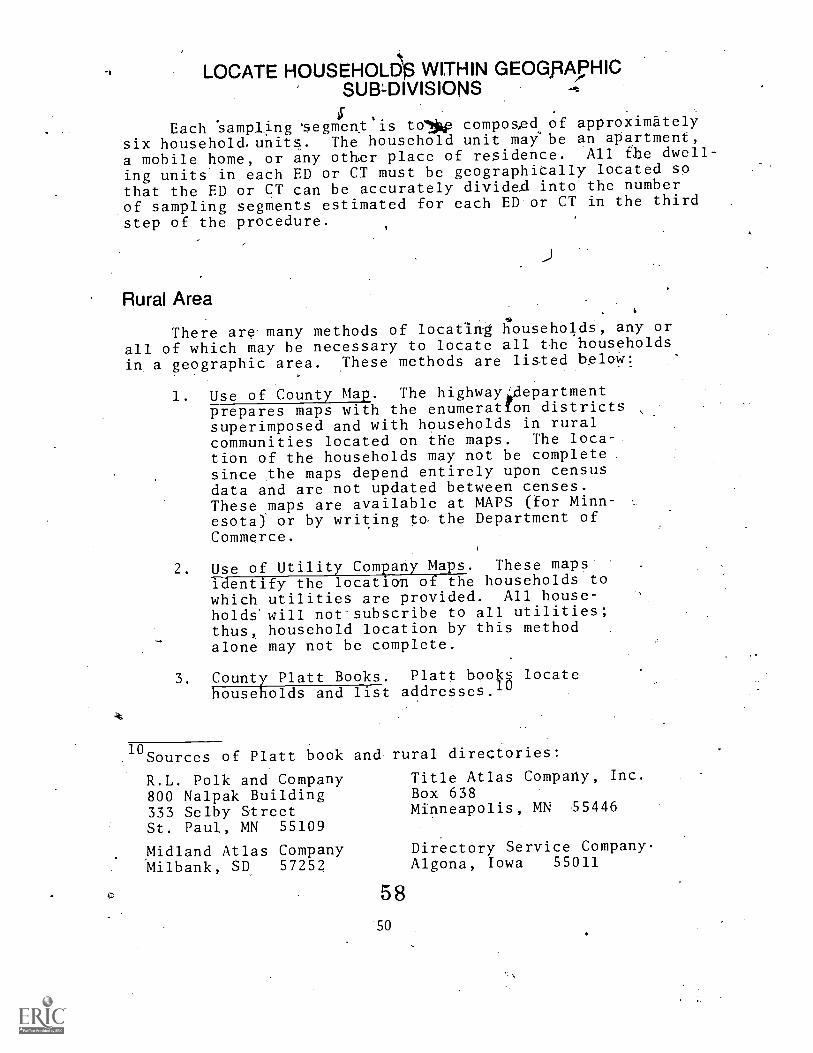
-a LOCATE FICUSEHOL8'f3 vvrrm GEDEVRA,pHICSUB.-DIVISIONS ,
Each 'sampling 'segment is tolp compos,ed of approximately
six household. units. The household unit may'be an apartment,
a mobile home, or any other place of residence. All fbe dwell-
ing units in.each ED or CT must be geographiCally located so
that the ED or CT can be accurately dividad into the numberof sampling segments estimated for each ED or CT in the third
step of the procedure.
Rural Area
There are many methods of locating households, any or
all of which may be necessary to locate all the householdsin a geographic area. These methods are listed b,elow:
1. Use of County Map. The highwayirdepartmentprepares maps with the enumeration districtssuperimposed and with households in ruralcommunities located on the maps. The loca-tion of the households may not be complete .since the maps depend entirely upon censusdata and are not updated between censes.These maps are available at MAPS (for Minn-esota) or by writing to the Department ofCommerce.
2 Use of Utility Company Maps. These mapsidentify the location of the households towhich utilities are provided. All house-holds will not-subscribe to all utilities;thus, household location by this methodalone may not be complete.
3. County Platt Books. Platt book§ locatehouseholds and list addresses.lu
10 Sources of Platt book
R.L. Polk and Company800 Nalpak Building333 Selby StreetSt. Paul, MN 55109
Midland Atlas CompanyMilbank, SD 57252
and rural direct'orieS:
Title Atlas Company, Inc.Box 638Minneapolis, MN 55446
5 8
50
Directory Service Company.Algona, Iowa 55011
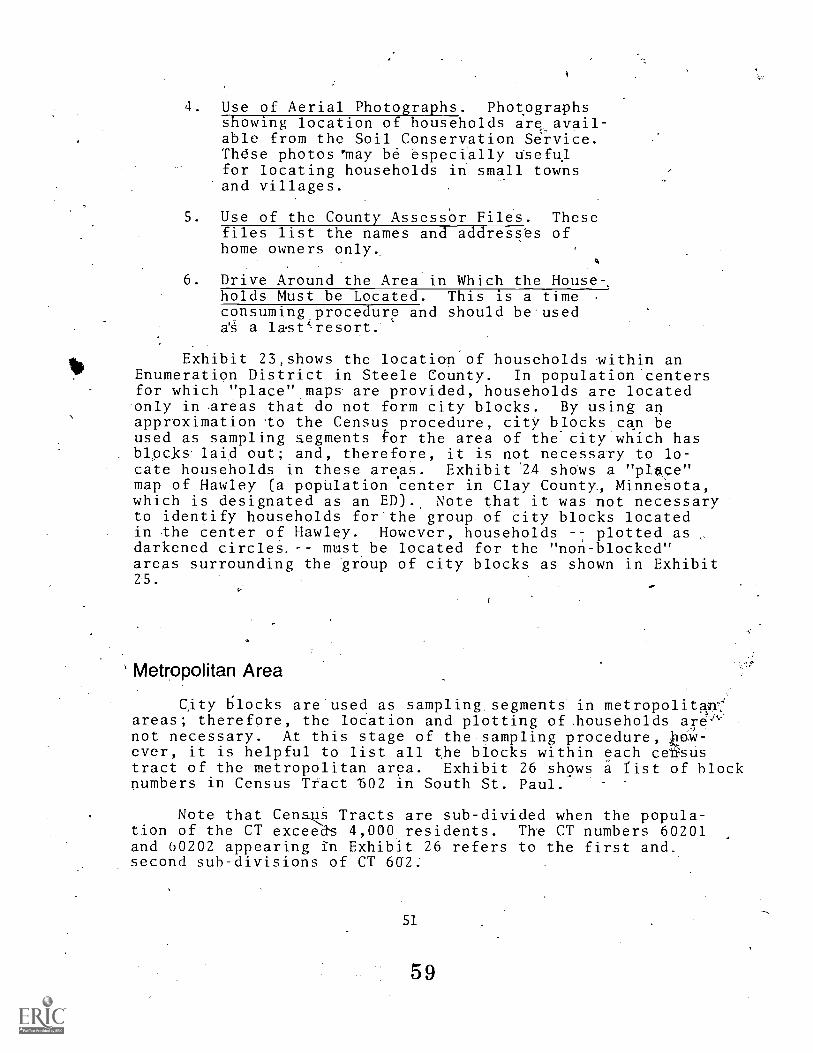
4. Use of Aerial Photographs. Phot.ographsshowing location of households are,avail-able from the Soil Conservation Service.These photosrmay be especially dsefu.for locating households in small towns
"and villages.
5. Use of the County Assessor Files. Thesefiles list the names and addresses ofhome owners only..
6. Drive Around the Area in Which the House-.holds Must be Located. This is a time .
consumingADrocedure and should be.useda'S a last.`-resort.
Exhibit 23,shows the location of households mithin anEnumeration District in Steele County. In population centersfor which "place".maps. are provided, households are locatedonly in reas that do not form city. blocks. By using anapproximation to the Census procedure, city blockscan beused as sampling s.egments tor the area of the-city which hasblpci(s laid out; and, therefore, it is not necessary to lo-cate households in these areas. Exhibit '24 shows a "p/Ace"map of Hawley (a population center in Clay County, MinneSota,which is designated as an ED)., Note that it was not necessaryto identify households for the group. of City blocks locatedin the center of Hawley. However, households -7 plotted asdarkened circles. must be located for the "non-blocked"areas surrounding the trOup of city blocks as shown in Exhibit
' Metropolitan Area
city 6locks are used as sampling segments' in metropolitan':areas; therefore, the loCation and plotting of .householdsnot necessary. At this stage of the.sampling procedure, tom-ever, it is helpful to list all the blocks within each ce'dsustract of the metropolitan area. Exhibit 26 shows a list of blocknumbers in Census Tfact '602 in South St. Paul.
Note that Cens_us Tracts are sub-divided when the popula-tion of the CT exceed's 4,000 residents. The CT numbers 60201and 60202 appearing in Exhibit 26 refers to the first and.second sub-divisions of CT 602:
51
5 9
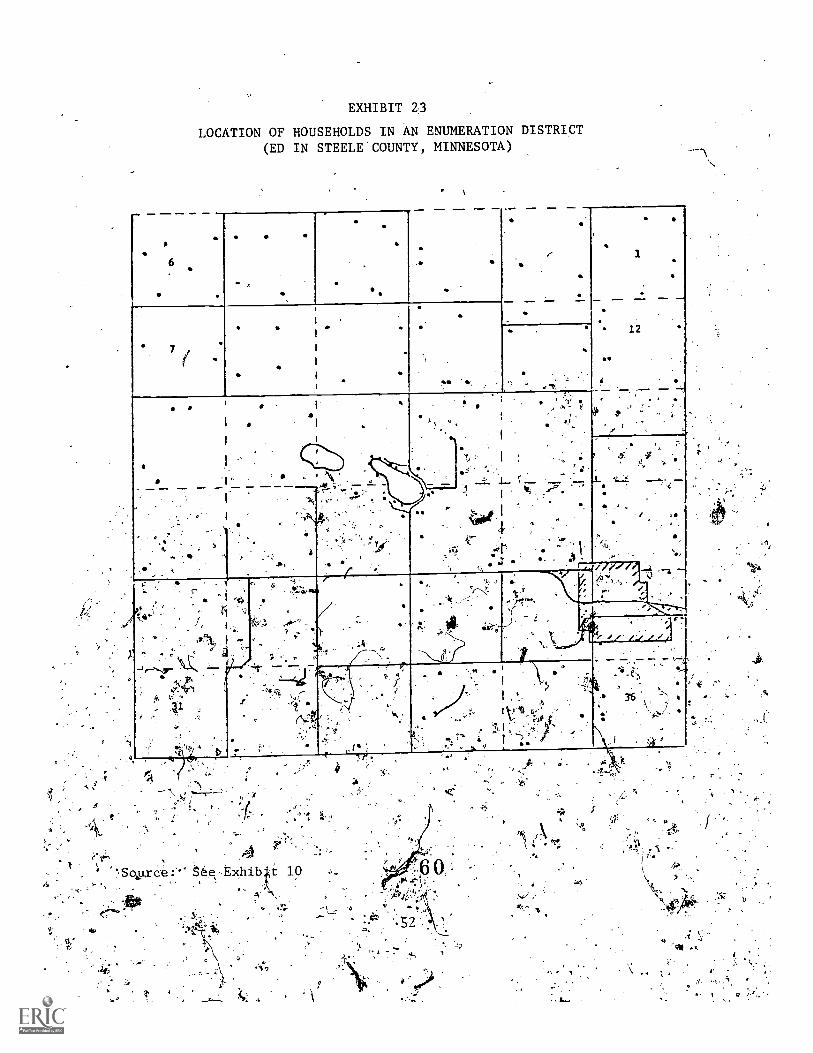
EXHIBIT 2.3
LOCATION OF HOUSEHOLDS IN AN ENUMERATION DISTRICT(ED IN STEELE COUNTY, MINNESOTA)
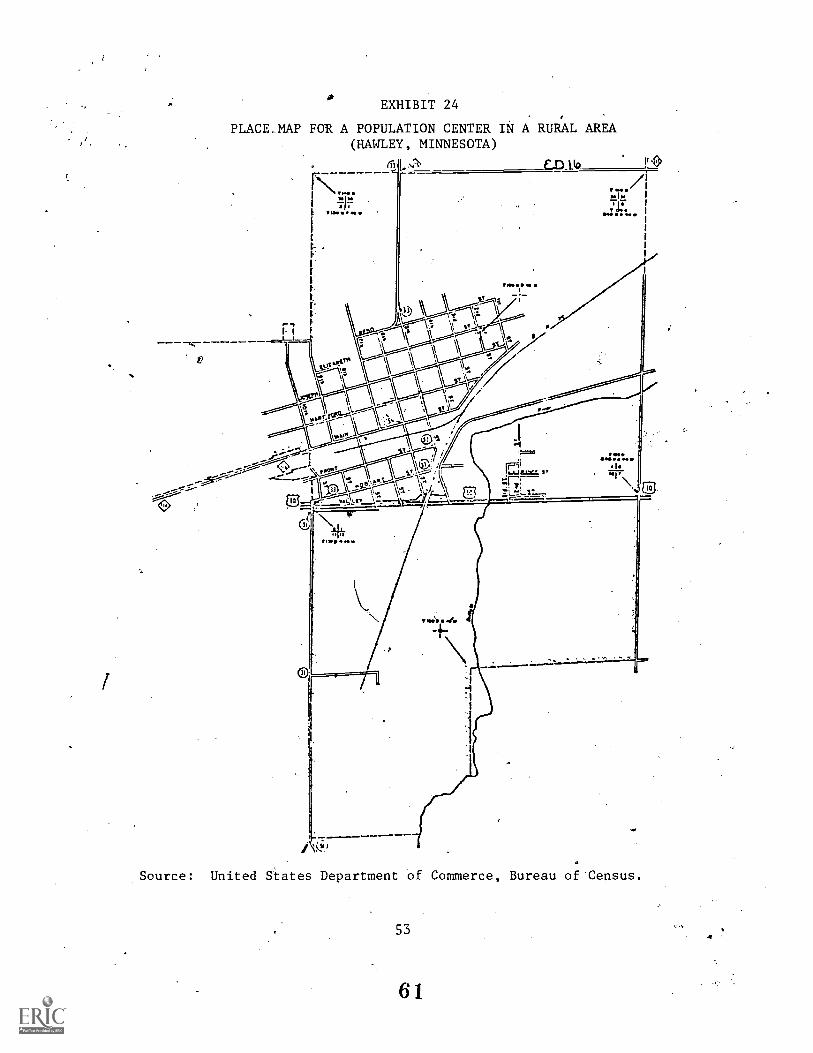
EXHIBIT 24,
PLACE,MAP FOR A POPULATION CENTER IN A RURAL AREA(HAWLEY, MINNESOTA)
el)Ito
111 71;-00
Source: United States Department of Commerce, Bureau of Census.
6 1
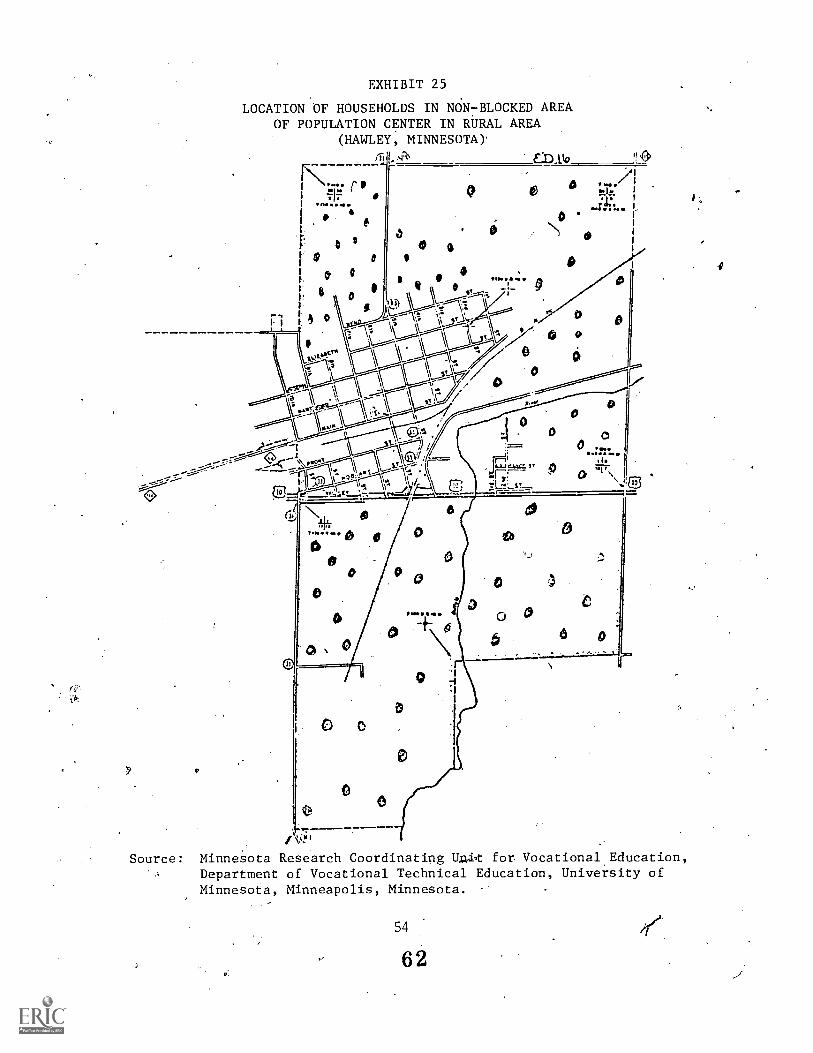
EXHIBIT 25
LOCATION OF HOUSEHOLDS IN NONBLOCKED AREAOF POPULATION CENTER IN RURAL AREA
(HAWLEY, MINNESOTA).
ri
-I TR'
I 6
VISO?\ 0 , . ..-
.,.....",7; 1
Y,:-.....',..kri.---- j'.T V; .' V.....1,-
1 j..c,......j.r.
60
Source:
10
tri-lieASCA.
0
0
4.1)
;#4
117.
0
00 11
111111
a
no1a
0 0
In
Minnesota Research Coordinating tha.i.t for Vocational Education,Department of Vocational Technical Education, University ofMinnesota, Minneapolis, Minnesota.
54
6 2
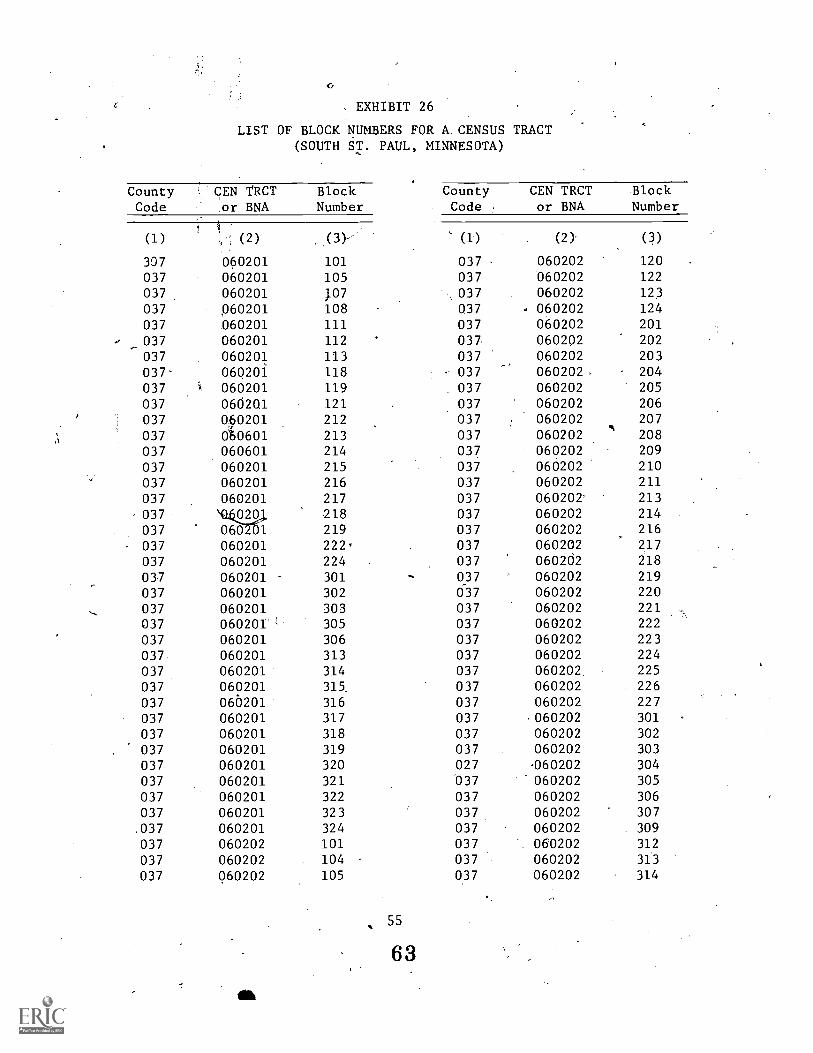
EXHIBIT 26
LIST OF BLOCK NUMBERS FOR A CENSUS TRACT(SOUTH ST. PAUL, MINNESOTA)
County CEN TRCT BlockCode or BNA Number
1
(1) ,,-; (2) (3)-
307 060201 101
037 060201 105037 060201 }07
037 060201 108
037 060201 111
_037 060201 112
037 060201 113
037 060201 118
037 i 060201 119
037 060201 121
037 40201 212
037 060601 213037 060601 214
037 060201 215
037 060201 216
037 060201 217
.037 020 218
037 060 01 219
037 060201 222,
037 060201 224
037 060201 301
037 060201 302
037 060201 303
037 060201 ( 305
037 060201 306037 060201 313
037 060201 314
037 060201 315,
037 066201 316
037 060201 317
037 060201 318
037 060201 319
037 060201 320
037 060201 321
037 060201 322
037 060201 323
.037 060201 324
037 060202 101
037 060202 104
037 060202 105
ss
6 3
CountyCode .
CEN TRCTor BNA
BlockNumber
(I) (2)- (3)
037 060202 120
037 060202 122
.037 060202 123
037 . 060202 124
037 060202 201
037 060202 202
037 060202 203
037 060202 204
037 060202 205
037 060202 206
037037
060202060202
207208
037 060202 209
037 060202 210
037 060202 211
037 060202' 213
037 060202 214
037 060202 216
037 060202 217
037 060202 218
0,37 060202 219
037 060202 220
037 060202 221
037 060202 222
037 060202 223
037 060202 224
037 060202 225
037 060202 226
037 060202 227
037 060202 301
037 060202 302
037 060202 303
027 .060202 304
037 060202 305
037 060202 306
037 060202 307037 060202 309
037 060202 312
037 060202 313
037 060202 314
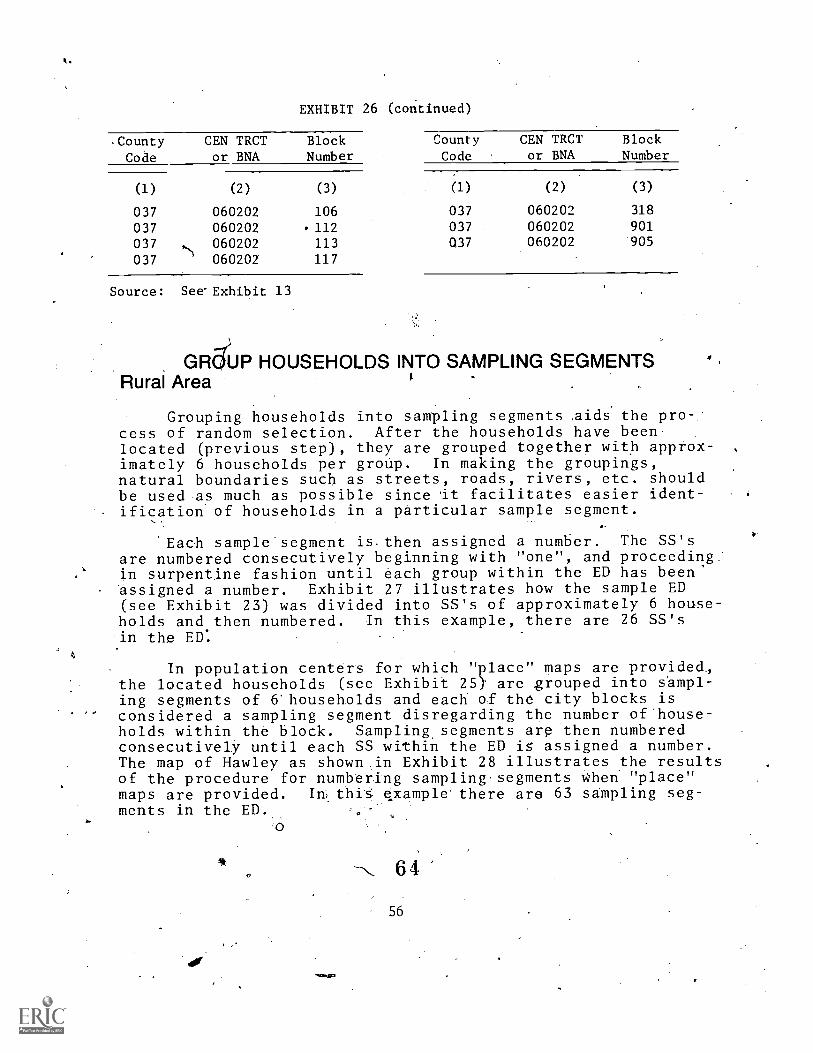
EXHIBIT 26 (continued)
CountyCode
CEN TRCTor BNA
BlockNumber
(1) (2) (3)
037 060202 106
037 060202 .112037
037
,)
060202060202
113117
Source: See'Exhibit 13
County CEN TRCT Block
Code or BNA Number
(1) (2) (3)
037 060202 318
037 060202 901
Q37 060202 905
GR&P HOUSEHOLDS INTO SAMPLING SEGMENTSRural Area
Grouping households into sampling segments aids the pro-cess of random selection. After the households have beenlocated (previous step) , they are grouped together with approx-imately 6 households per group. In making the groupings,natural boundaries such as streets, roads, rivers, etc. shouldbe used as much as possible since it facilitates easier ident-ification of households in a particular sample segment.
-
'Each sample-segment is.then assigned a number. The SS'sare numbered ,consecutively beginning with "one", and proceeding_
4 in surpentine fashioh until each group within the ED has beenssigned a number. Exhibit 27 illustrates how the sample ED(see Exhibit 23) was divided into SS's of approximately 6 house-holds and then numbered. In this example, there are 26 SS'sin the ED:
a.
In population centers for which "place" maps are provided,the located households (see Exhibit 25) are grouped into s'ampl-ing segments of 6 households and each of the city blocks isconsidered a sampling segment disregarding the number of'house-holds within the block. Sampling.segments arp then numberedconsecutively until each SS within the ED ig assigned a number.The map of Hawley as shown in Exhibit 28 illustrates the resultsof the procedure for numbering sampling.segments When "place"maps are provided. In. thig e.xample there are 63 sampling seg-ments in the ED.
6 4
56
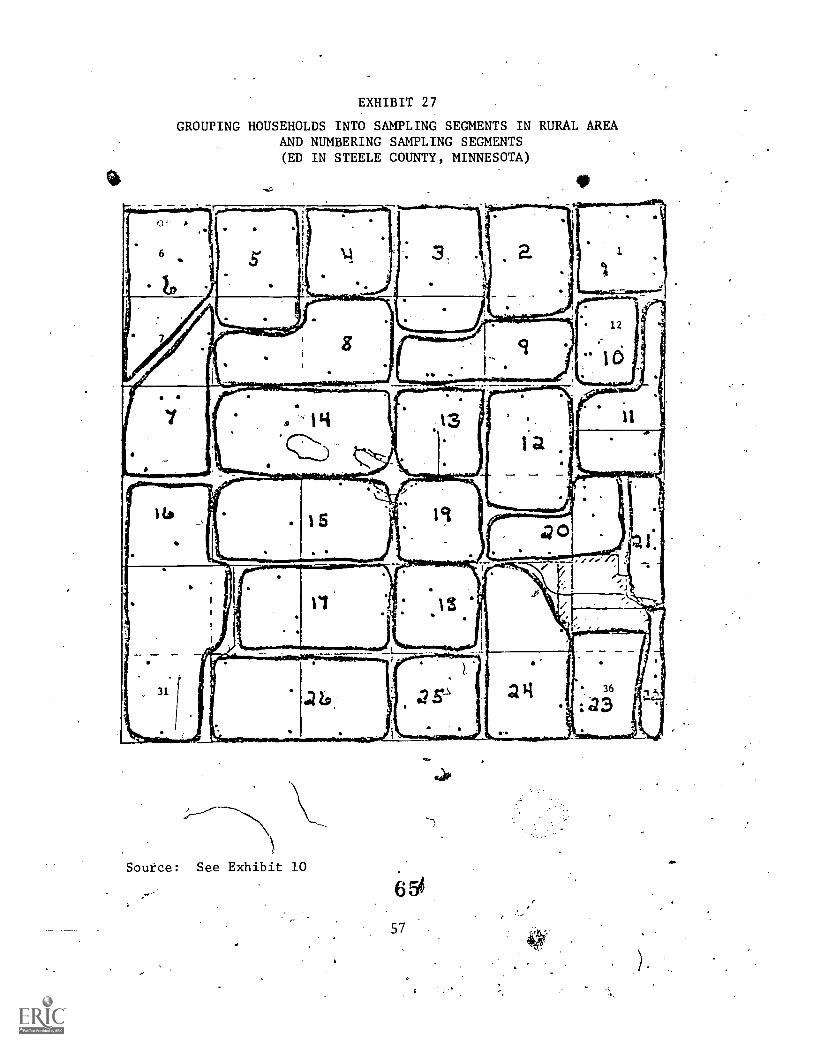
EXHIBIT 27
GROUPING HOUSEHOLDS INTO SAMPLING SEGMENTS IN RURAL AREAAND NUMBERING SAMPLING SEGMENTS(ED TN STEELE COUNTY, MINNESOTA)
Source: See Exhibit 10
Lan
654
57
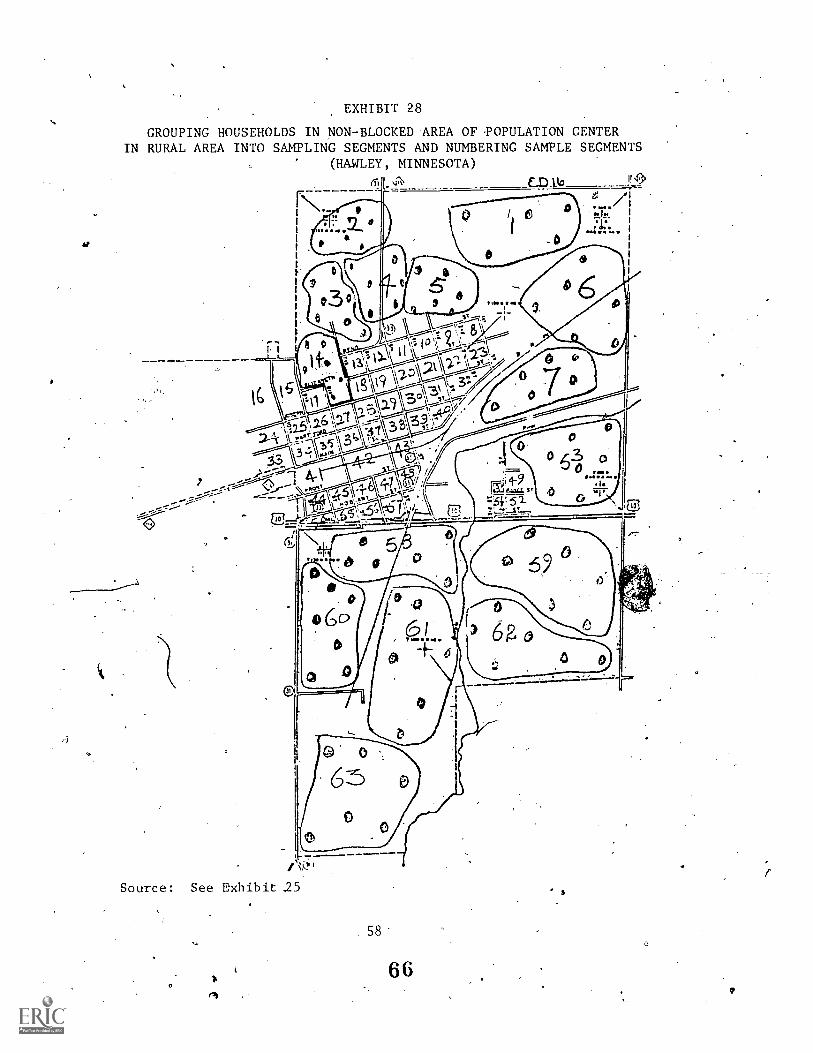
EXHIBIT 28
GROUPING HOUSEHOLDS IN NON-BLOCKED AREA OF POPULATION CENTERIN RURAL AREA INTO SAMPLING SEGMENTS AND NUMBERING SAMPLE SEGMENTS
' (HAWLEY, MINNESOTA)
_CIDAJD q47>
eLT:
, ,.; to %:7'
,
\?---kW
3....-:.1.--- ,
--,., _
dl N r 6 5-
t() ,, rod, 6cl
4! 0
!V"Source: See Exhibit 25
II
58-
66
Metropoiitan Area
In a metropolitan area with a list; orblocks for eachcensus tract, a number i§ assigned,. beg4nning at 'one' in eachCT and proceeding until each block within that CT is assigned' ,
a sampling segment number. In Exhibit 29, the bluXs., of CT 602were asqgned numbers (see fourth column).
SELECT SAMPLING SEGMENTS FOR SAMPLE
The sample segments of an Enumeration District or CensusTract a're to be:randomly selected. This is.accomplished byusing a rat: number table such as commonly available in stat-istical ref nces (ste Appendix III). 'The exact nuMber oTSS's to'be chosen from each ED or CT is determine4 by the re-sult$ of the fifth ,step of the .sampling procedure describedearlier. kandom numbers occurring between "one" and the numberof SS's irb.the ED or CT are selected without replacement untiras many numbers are chosen as there are sampling segments tobe selected for that.ED or CT.
Rural Arer 0
,
As an example, Exhibit 21 shows that nine sampling segments,.(eiOth column) must be selected ffkim the 43 SS's of SomersettowAship Heiace, the first nine random numbers .occuriingbet een the numbers "one" and "fourty-three" will identify
- the nine sampling segments to be selee+ed from_this ED.
Metropolitan Area
As an example, Exhibit 22 shows that 34 SS's (eighth column)must be selected from the 343 SS's of CT 602. In Exhibit 29,the blocks are numbered one through 87 for. CT 602. Hence, thefirst 34 random numbers occurring between the numbers "one"and "eighty-seven" will identify the 34 blocks from each of
59
6 7 ,
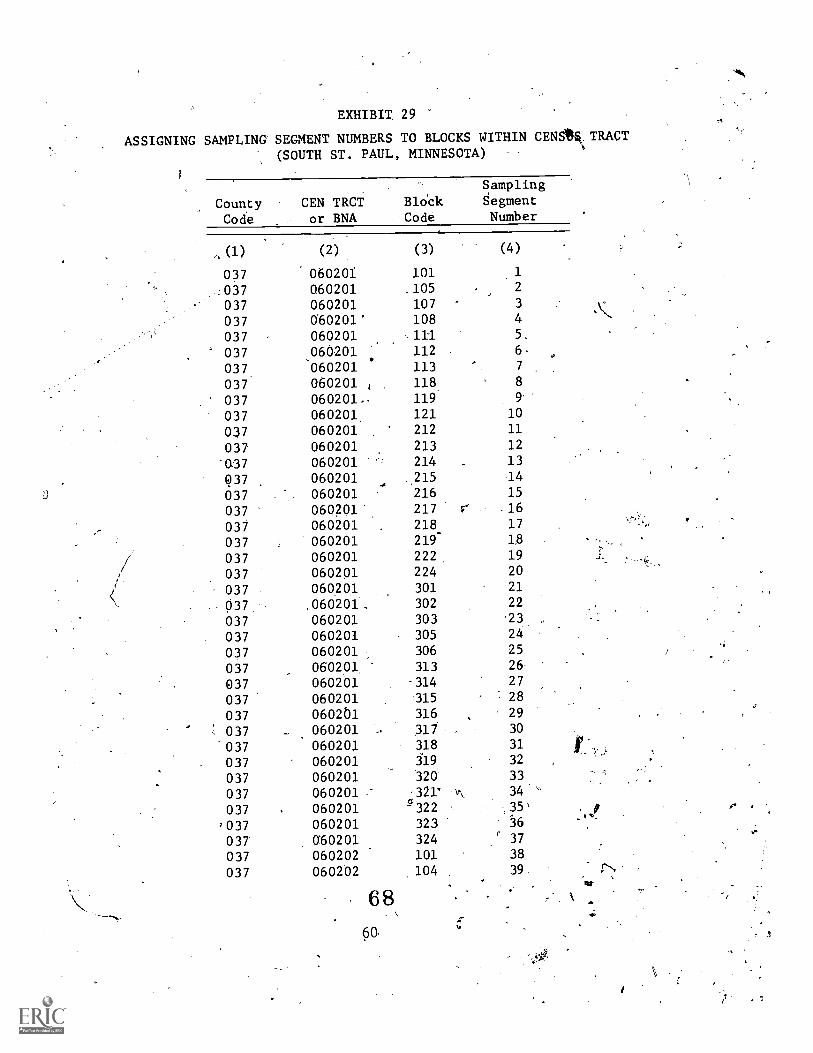
EXHIBIT 29
ASSIGNING SAMPLING SEGMENT NUMBERS TO BLOCKS WITHIN CENSIN.TRACT
(SOUTH ST. PAUL, MINNESOTA)8
Sampling
County CEN TRCT Bldck Segment
Code or BNA Code Number
,
(1) (2) (3) (4)
037 060201 101 1
_037 060201 105 2
037 060201 107 3
037 060201 108 4
037 060201 111 5
037 060201 112 6..
037. 060201 113 7
037 0602014 .
118 8
037 060201.. 119 9'
037 060201, 121 10
037 060201 .212 11
037 060201 213 12
-037 060201 214 13
037 060201 _.215 14..
037 060201 216 15
037 060201 217 .16
037 060201 218 17
037 060201 219 1.8
037 060201 222 19
037 060201 224 20
037 060201 301 21
-- 037 .060201 302 22
037 060201 303 '23
037 060201 305 24
037 060201 306 25
037 ,060201 313 26.
037 060201 314 27
037 060201 315 28
037 0602Q1 316 29
, 037 060201 317 30
037 060201 318 31
037 060201 319 32_
037 060201 320 33
037 060201 ,321° A 34
037 060201 5322 35'
/037 060201 323 .'16
037 G60201 324 ' 37
037 060202 101 18
037 060202 .104 39,
. I
rat
_;..
'41
6860.
f
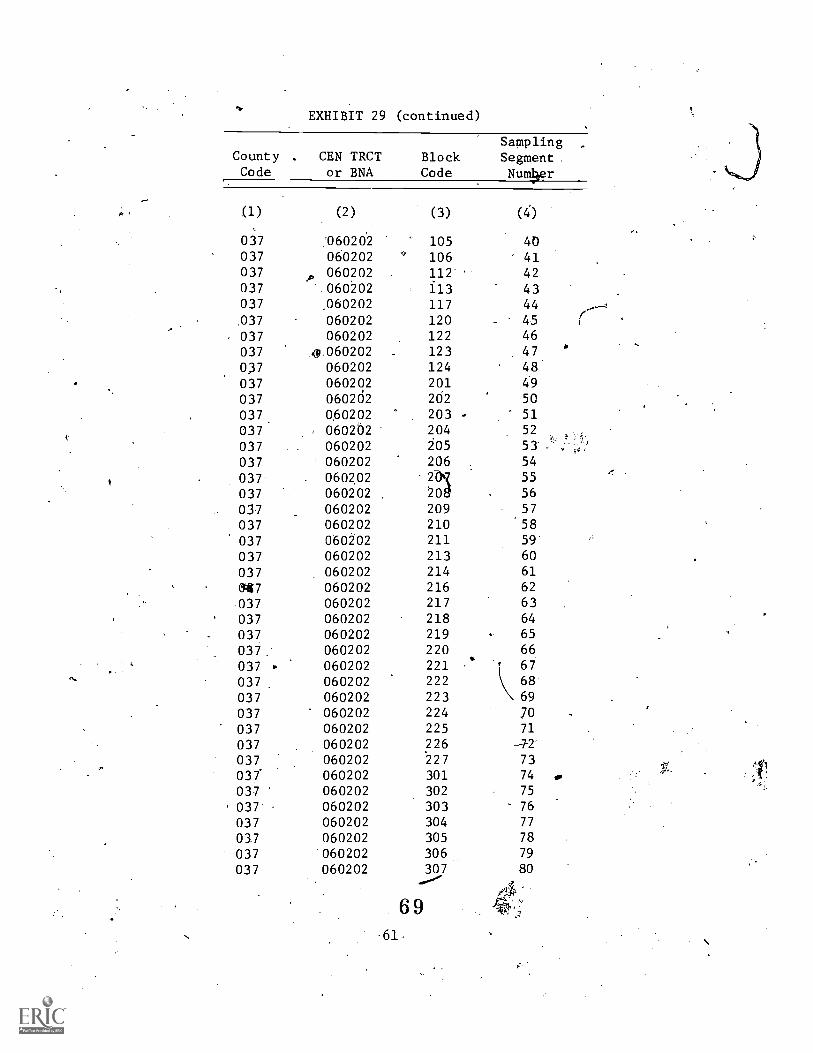
EXHIBIT 29 (continued)
CountyCode
. CEN TRCTor BNA
BlockCode
SamplingSegment.Numr
(1) (2) (3) (0
037 ,060202 105 40037 060202 106 41037 060202P 112' 42037 060202 113 43037 ,060202 117 44
037 060202 120 45
037 060202 122 46
037 ,0.060202 123 470,37 060202 124 48'
037 060202 201 49
037 060202 202 50
037, 060202 203 - 51
037 , 060202 204 52
037 060202 205 53
037 060202 206 54
037 . 060202 2-01/ 55
037 060202 204 56
037 060202 209 57
037 060202 210 58
037 060202 211 59
037 060202 213 60
037 060202 214 61
6047 060202 216 62
-037 060202 217 63
037 060202 218 64
037 060202 219 65
037. 060202 220 66
037 060202 221 67
037 060202 222 68
037 060202 223 69
037 060202 224 70
037 060202 225 71
037 060202 226
037 060202 227 73
037 060202 301 74
037 060202 302 75
037 060202 303 76
037 060202 304 77
037 060202 305 78
037 060202 306 79
037 060202 307 80
6 9
.61,
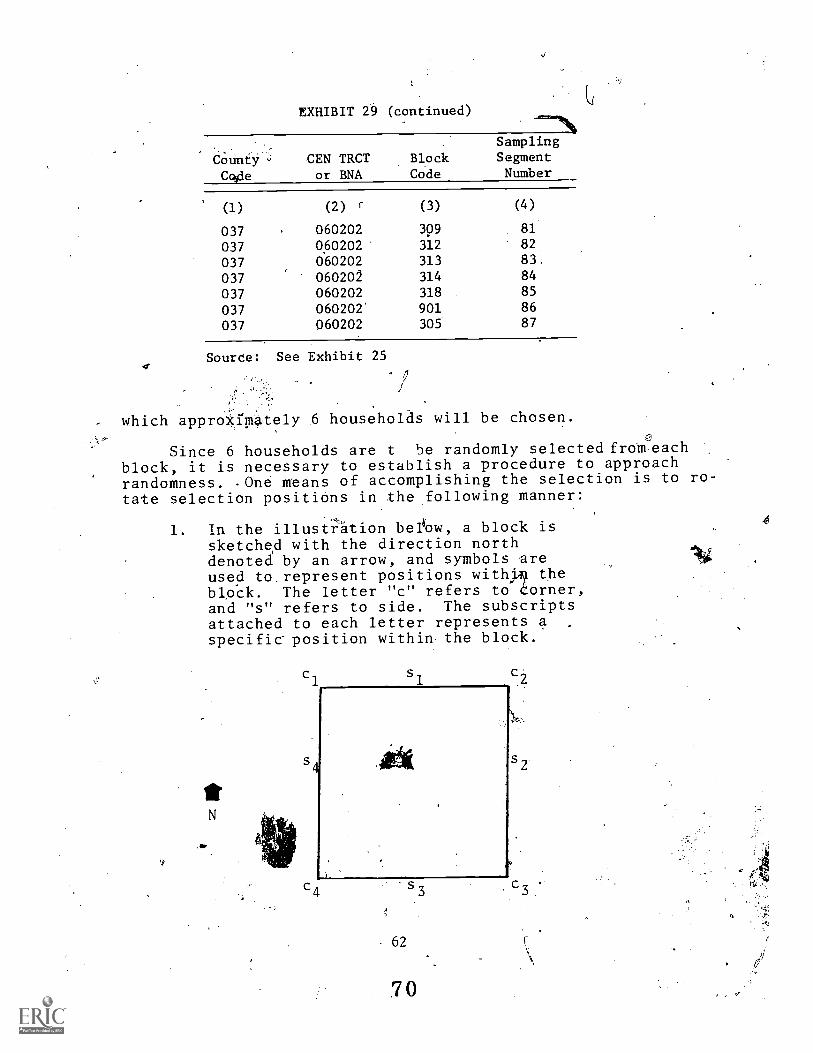
EXHIBIT 29 (continued)
Sampling
CoUntjr CEN TRCT Block Segment
Cq4e or BNA Code Number
(1) (2) 1 (3) (4)
037 060202 309 81
037 060202 312 82
037 060202 313 83.
037 060202 314 84
037 060202 318 85
037 060202 901 86
037 060202 305 87
Source: See Exhibit 25
which approirmately 6 households will be chosen.
Since 6 households are t be randomly selected from eachblock, it is necessary to establish a procedure to approachrandomness. -One means of accomplishing the selection is to ro-tate selection positions in the following manner:
1. In the illustration bel4ow, a block issketched with the direction northdenoted by an arrow, and symbols areused to,represent positions withA theblp.ck. The letter "c" refers to borner,and "s" refers to side. The subscriptsattached to each letter represents aspecific- position within the block.
62
7 0
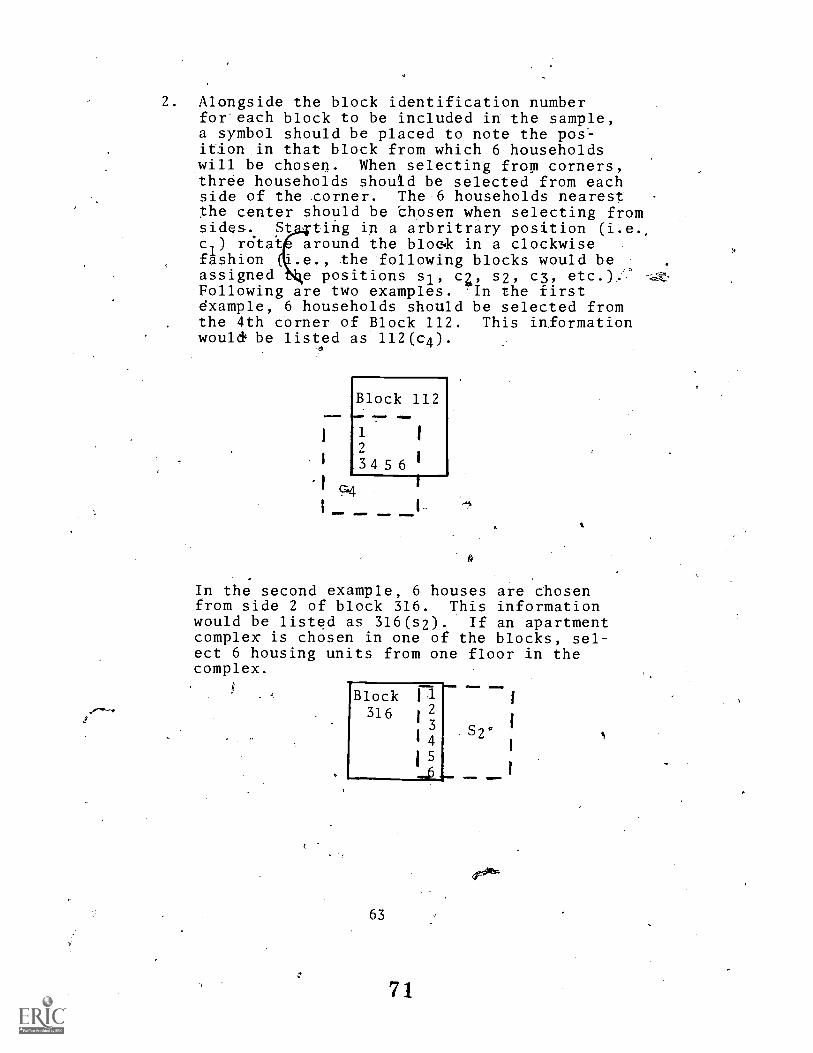
2. Alongside the block identification numberfor'each block to be included in the sample,a symbol should be placed to note the pos-ition in that block from which 6 householdswill be chosen. When selecting frop corners,three households shouid be selected from eachside of the zorner. The 6 households nearest -
the center should be 'chosen when selecting fromsides. St ting in a arbritrary position (i.e.,c1
) rdtat around the bloo& in a clockwisefashion e., the following blocks would beassigned Ne positions sl, ca, s2, c3, etc.).Following are two examples. In the firstdxample, 6 households should be selected fromthe 4th corner of Block 112. This informationwoul& be listed as'112(c4).
1
2
I 3 4 5 6 I
In the second example, 6 houses are chosenfrom side 2 of block 316. This informationwould be listed as 316(s2). If an apartmentcomplex is chosen in one of the blocks, sel-ect 6 housing units from one floor in thecomplex.
Block Ilj.....
316 i23
I 4S2c
I s
63
7 1
IDENTIFY .NAMES AND ADDRESSESFOR HOUSEHOLDS TO BE SAMPLED
The identification and listing of names and addresses of,households marks the end of the sample selection procedure..Telephone, numbers, if aVailable, should also be recorded atthis time.
Rural Areas
Names and addresses are obtained bythe methods listed inthe step entitled, "Locate Households Within Geographic Sub-Division". Persons familiar with the area anlYits residents,usually community residents, can be of immense help in identify-
_
Ing names and addresses.
Metropolitan Areas
A census map with block descriptions (Metro Series Map)should be obtained for the metropolitan area of concern, andthe Selected blocks for inclusion in the sample identified.The location of households, with the appropriate names andaddresses, is the next step. A "city directory", if availableand current, is best used to identify names and addresses formetropolitan communities. The "city directory" is essentiallya reverse telephone directory providing the names, addresses,and telephone numbers of persons-living in each block of thecommunity.
SUMMARY
The procedure outlined in this chapter results in theidentification of the names and addresses of persons living ina random sample of househ-olds in the geographielarea to bestudied. The process, however, is not entirely free of hin-drances. In some cases, the blocks chosen or loactions ident-ified are within an industrial sector of the community whichis devoid of housing units; in other cases, the households
'7 2
64
e
-
identified are summer homes, resort locations, or public instit-utions. Sometimes households are identified in areas wherefloods, renewal, or highway construction caused evacuation.In all icases, other sampling segments must bes'identified toreplacd segments that are not usable.
It should also be noted here that a computer program toaid in selecting the sample has been developed joy the Minnesota 1Analysis and Planning System (MAPS). This program identifiesthe number of sampling segments to be selected,from each ED,
. and is available for public use. An example of the programoutput is e4ibited in Appendix IV.
6
73
65
-7)
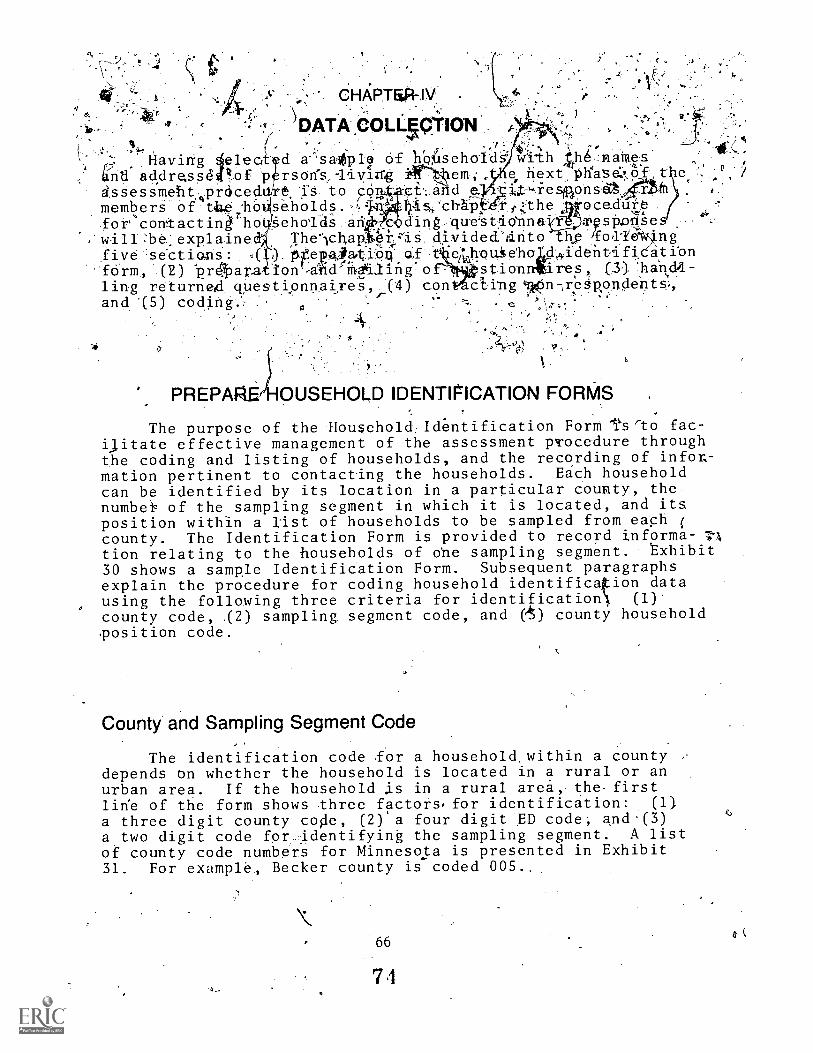
...
4f y. ,,: CHAPTRA-IV >
., DATA COLL4Q1ION ,4
' , i.- , Ai ,. ,). i 0
Having 4electt d a-satple Of halseholds; with ;he nahteskntl'addre.ss of p rsods livngW_ -i em;, e, hext Wase:7,o.f t
dssessmeht4prciced t. iTs to F6at -ct-,a d e i.t,.iesalonsd%
members of thO eholds.: 4.1s;chap, rthe ocedutefor contactiq ho sehulds an coding-que-st!iUnna mpsp.oq'Se
, will be explained The-)chap. Aqs divided'anto hp /fol/e "\ng
five sections: ( ) pfepAlatio4 af t houiehol0,,identifi. atibnform, (2) Pret.?Par.aiIonI,Ad-mtiiing.o stionntij.res, (3) 'handil-
4
ling returneod questionnaiffes,,..(4) con cttngti#pn-,resRondents.,and (5) coding.- .
- -..
., ",
^ \
41
4, '
PREP OUSEHOLD IDENTIPICATION FORMS .
The purpose of the Household,Identification Form I's rto fac-ijitate effective management of the assessment procedure throughthe coding and listing of households, and the recording of infor-mation pertinent to contacting the households. Each householdcan be identified by its location in a particular county, thenumbeic of the sampling segment in which it is located, and itsposition within a list of households to be sampled from each (
county. The Identification Form is provided to record informa- T1tion relating to the households of one sampling segment. 'Exhibit
30 shows a sample Identification Form. Subsequent paragraphsexplain the procedure for coding household identification datausing the following three criteria for identificatio0 (1)'
county code, .(2) sampling segment code, and et) county householdposition code.
County and Sampling Segment Code
The identification code for a household within a countydepends on whether the household is located in a rural or anurban area. If the household j_s in a rural area, the.firstlirie of the form shows three factors,for identification: (1)
a three digit county coile, (2) a four digit ED code; and'(3)a two digit code for.identifying the sampling segment. A listof county code numbprs for Minnesota is presented in Exhibit31. For example, Becker county is coded 005.,
66
7 4
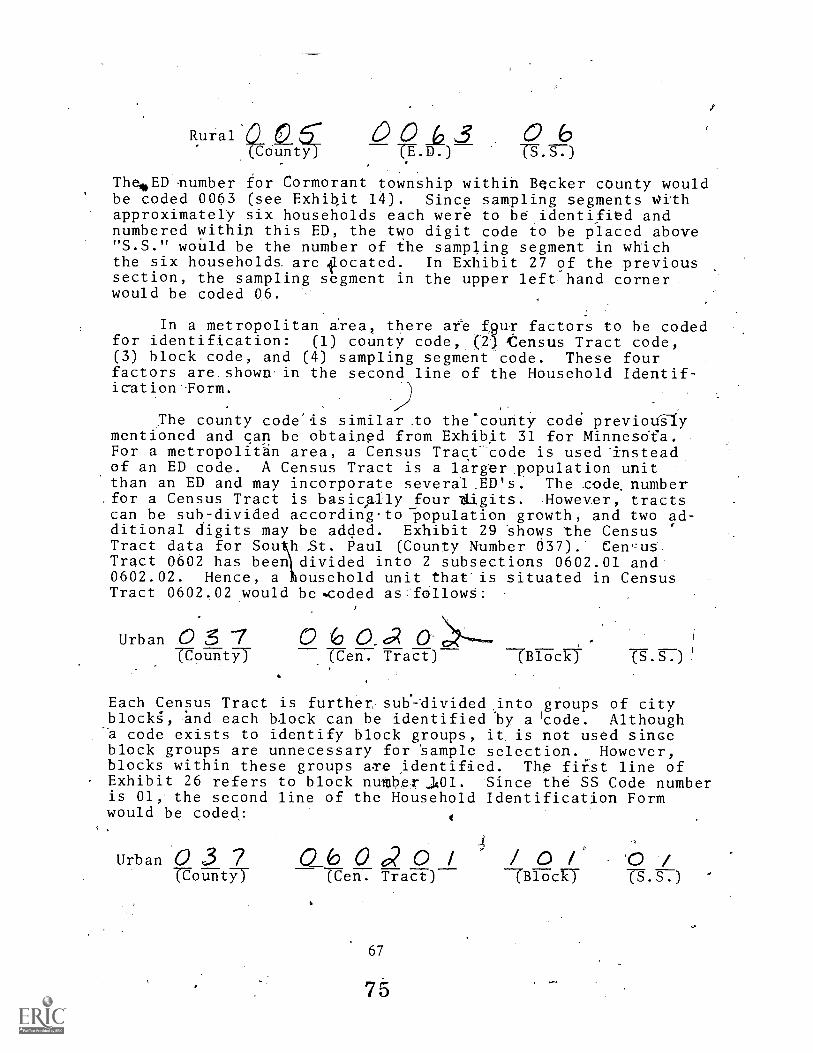
Rural 62 0 0 3 0 6Coun Tr.D.)
ThevED number for Cormorant township within Becker county wouldbe coded 0003 (see Exhibit 14). Since sampling segments withapproximately six households each were to be identified andnumbered within this ED, the two digit code to be placed above"S.S." would be the number of the sampling segment in whichthe six householda are focated. In Exhibit 27 of the previoussection, the sampling segment in the upper left hand cornerwould be coded 06.
In a metropolitan irea, there areifgur factors to be codedfor identification: (1) county code,.(2) tensus Tract code,(3) block code, and (4) sampling segment code. These fourfactors are.shown.in the second line of the Household Identif-ication-ForM.
The county code'is similar to the'county code previoUgiymentioned and can be obtained from Exhibit 31 for Minnesdfa.For a metropolitan area, a Census Tract-code is used-insteadof an ED code. A Census Tract is a larger population unitthan an ED and may incorporate several ED's. The .code. number.for a Census Tract is basicpaly four tigits. However, tractscan be sub-divided according.to population growth, and two ad-ditional digits may be added. Exhibit 29 Shows the CensusTract data for Sou h St. Paul (County Number 037). Cen-usTract 0602 has been divided into 2 subsections 0602.01 and0602.02. Hence, a Piousehold unit that'is situated in CensusTract 0602.02 would be.coded as followS:
Urban 0 5 I 0 o a-Mount-77 T-CerT.- TTaa)-- -TBrikki (g.g7))
Each Census Tract is further, sub.-divided ,into groups of cityblockS", :and each Mock can be identified "by a Icode. Althougha code exists to identify block groups, it is not used sinceblock groups are unnecessary for 'sample selection. However,blocks within these groups aTe _identified. The fiist line ofExhibit 26 refers to block numbeT J401. Since the SS Code numberis 01, the second line of the Household Identification Formwould be coded:
Urban o37(CountYT
060do(Ce1717 TTaET)--
67
75
/ 0 /--(BlockT
/s )
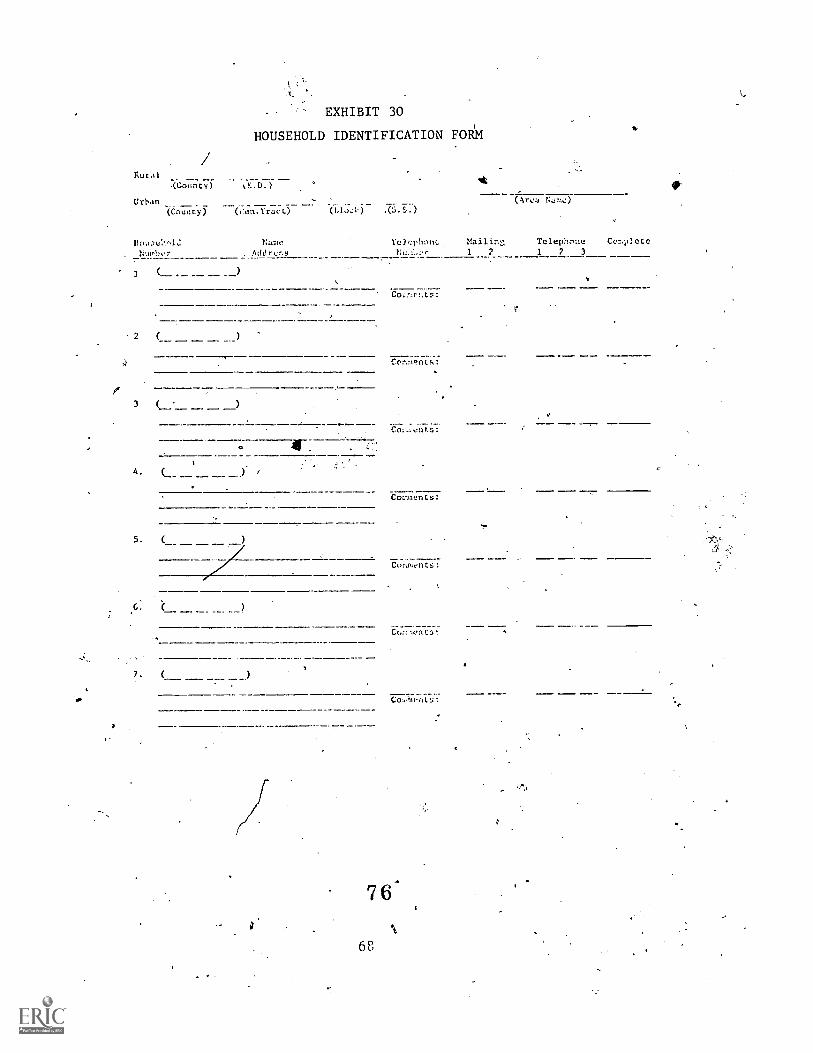
EXHIBIT 30
HOUSEHOLD IDENTIFICATION FORM
Rural
.(CcZ.[Tr-)
Urban(County) (cjn.Ir-act)
1:41.ne
Nulr'lwr AddrQr.s
2 (
3
(I.1),1-)
.6:
CO L.?: (71-t. :
Comnents:
Co:-avuLs:
COL-ments:
Corawnts:
Cor,-.Ont31
COA1(.1-0.!
7 6'
68
-(Arca Nam,2)
Con.p2c[c
1 2 1 2 3
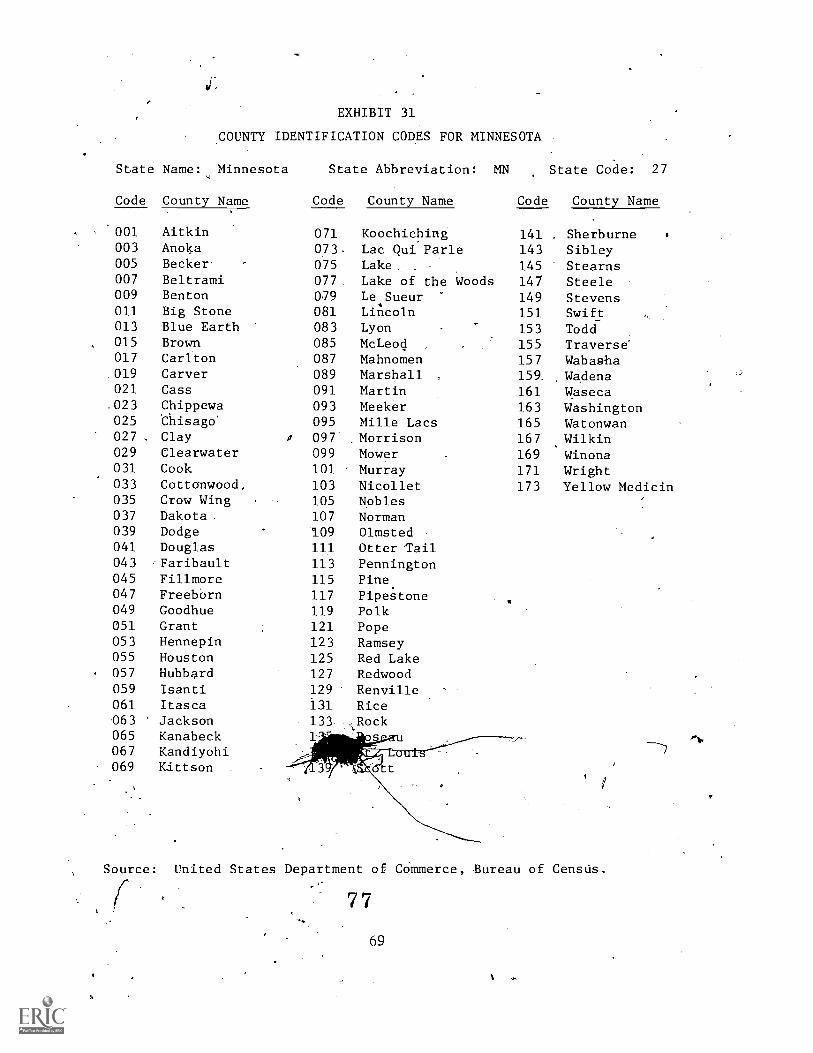
EXHIBIT 31
COUNTY IDENTIFICATION CODES FOR MINNESOTA
State Name: Minnesota
Code County Name
001
003005
007009
011013015017019021023025027029
031
033035037039
041043045047049
051
053055057059061063065067069
AitkinAnokaBeckerBeltramiBentonBig StoneBlue EarthBrownCarltonCarverCassChippewathisago'ClayClearwaterCookCottonwood,Crow WingDakotaDodgeDouglasFaribaultFillmoreFreebornGoodhueGrantHennepinHoustonHubbardIsantiItascaJacksonKanabeckKandiyohiKittson
State Abbreviation: MN State Code: 27
Code County Name
071 Koochiching073 Lac Qui Parle075 Lake077 Lake of the Woods0.79 Le.Sueur081 Lincoln083 Lyon085 McLeod087 Mahnomen089 Marshall .
091 Martin093 Meeker095 Mille Lacs
a 097 Morrison099 Mower101 Murray103 Nicollet105 Nobles107 Norman109 Olmsted111 Otter T'ail
113 Pennington115 Pine.
117 Pipestone119 Polk121 Pope123 Ramsey125 Red Lake127 Redwood129 Renville131 Rice
133 Rock1-
Aar es
4.
Code County Name
141 . Sherburne143 Sibley145 Stearns147 Steele149 Stevens151 Swift153 Todd155 Traverse'157 Wabaaha159. Wadena161 Waseca163 Washington165 Watonwan167 .Wilkin169 Winona171 Wright173 Yellow Medicin
Source: United States Department of Commerce, Bureau of Census.
77
69
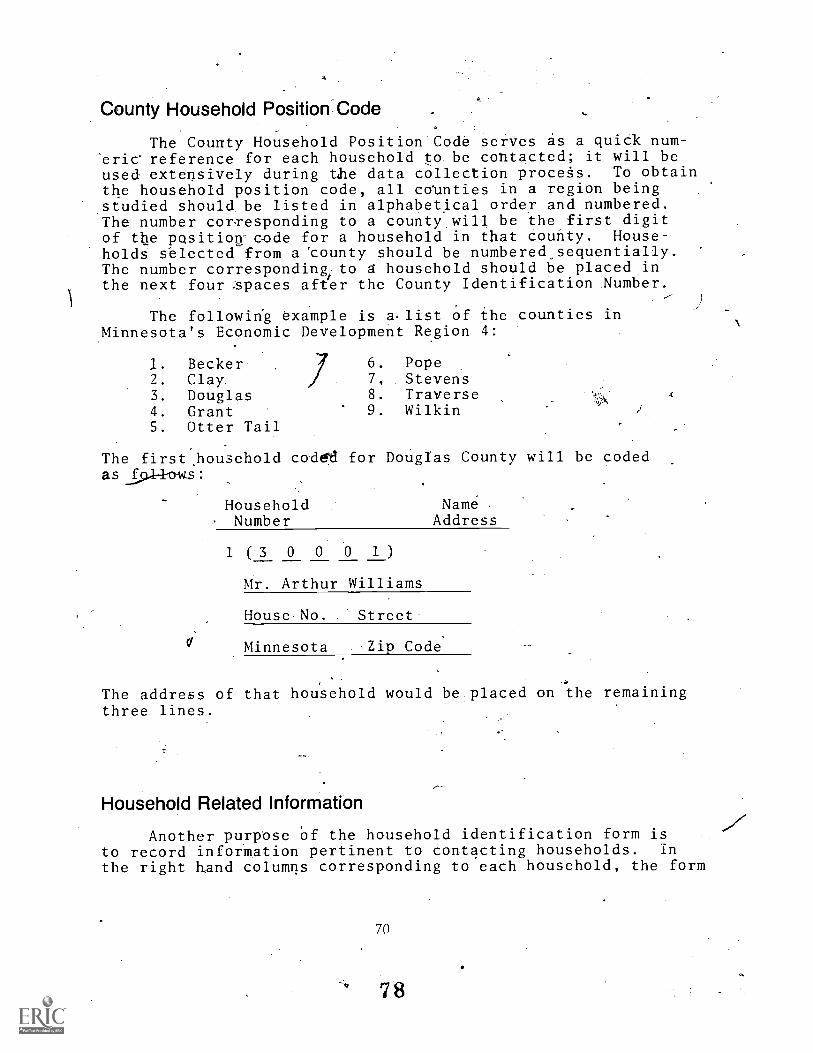
County Household Position Code
The County Household Position Code serves as a quick num-'eric reference for each household to be contacted; it will beused extensively during the data collection proceSs. To obtainthe household position code, all cvunties in a region beingstudied should be listed in alphabetical order and numbered.The number corTesponding to a county will be the first digitof tbe pcasition-c-ode for a household in that county. House-holds selected from a 'county should be numbered sequentially.The number corresponding/to a household should b'e placed inthe next four ;spaces after the County Identification Number.
The followirig example is a.list of ihe counties inMinnesota's Economic Development Region 4:
1. Becker 6. Pope2. ClaT 7, Stevens3. Douglas 8. Traverse4. Grant 9. Wilkin5. Otter Tail
The first,household code for Douglas County will be codedas
HouseholdNumber
Name .
Address
1 ( 3 0 0 -0 1 )
Mr. Arthur Williams
House No. Street-
Minnesota Zip Code'
The address of that household would be placed on the remainingthree lines.
Household Related Information
Another purpose of the household identification form isto record information pertinent to contacting households. In
the right hand columns corresponding to each household, the form
70
78
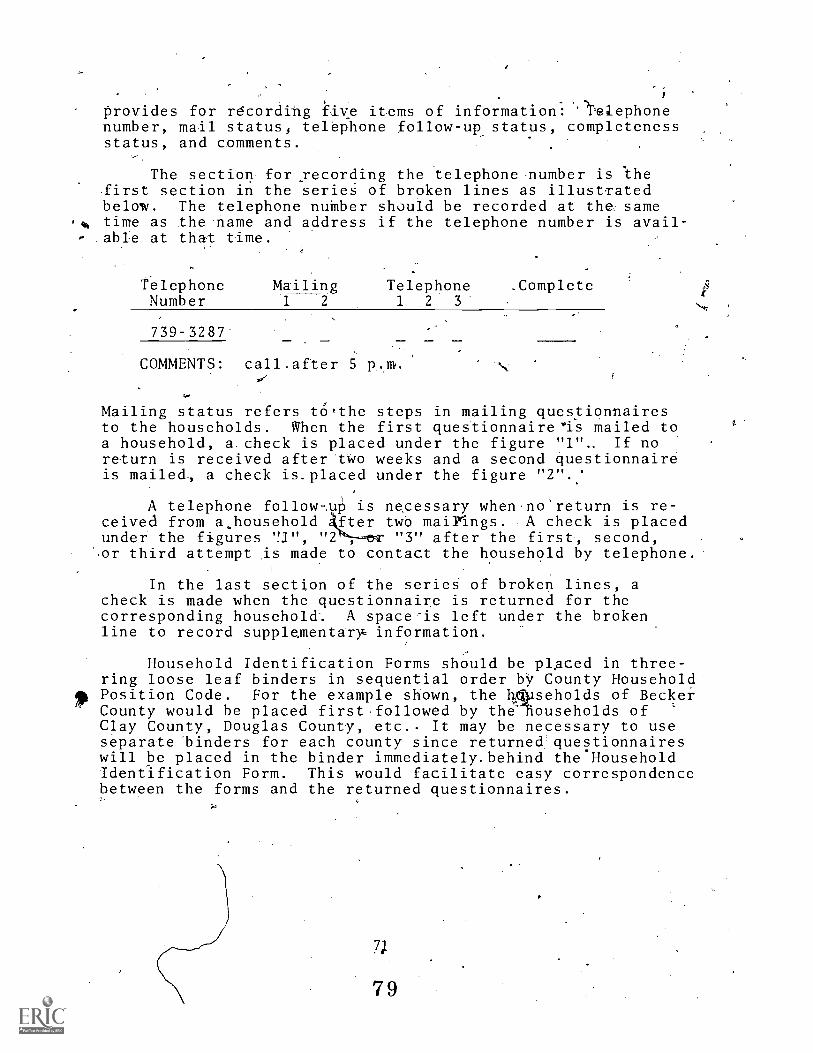
provides for r6cording fiKe items of information: '')Felephonenumber, mail status, telephone follow-up.status, completenessstatus, and comments.
The section- for recording the telephone.number is Iheirst section in the series of broken lines as illustatedbelow. The telephone nuMber should be recorded at thea same
i% time as theliame and address if the telephone number is avail-,. abte at that time.
TelephoneNumber
739- 32 87
Mailing1 2
-
Telephone _Complete1 2 3
COMMENTS: call.after 5 p.m.
cro
Mailing status refers t6,the steps in mailing questionnairesto the households. When the first questionnaire'is mailed toa household, a.check is placed under the figure "1".. If noreturn is received after two weeks and a second questionnaireis mailed, a check is_placed under the figure "2".:
...-
A telephone follow-. p is necessary when.no'return is re-ceived from a
X-Mjlousehold fter O mairings. A check is placed
under the figures '!1", "2 er, "3" after the first, second,'.or third attempt ,is made to contact the household by telephone.
. ,.
In the last section of the series of broken lines, acheck is made when the questionnaire is returned for thecorresponding household-. A space-is left under the brokenline to record supplementar information.
Household Identification Forms should be plAced in three-ring loose leaf binders in sequential order by County Household
10 Position Code. For the example shown, the kcipseholds of BeckerCounty would be placed first followed by thehouseholds ofClay County, Douglas County, etc.. It may be necessary to useseparate binders for each county since returned questionnaireswill be placed in the binder immediately.behind the HouseholdIdentification Form. This would facilitate easy correspondencebetween the forms and the returned questionnaires.
7 9
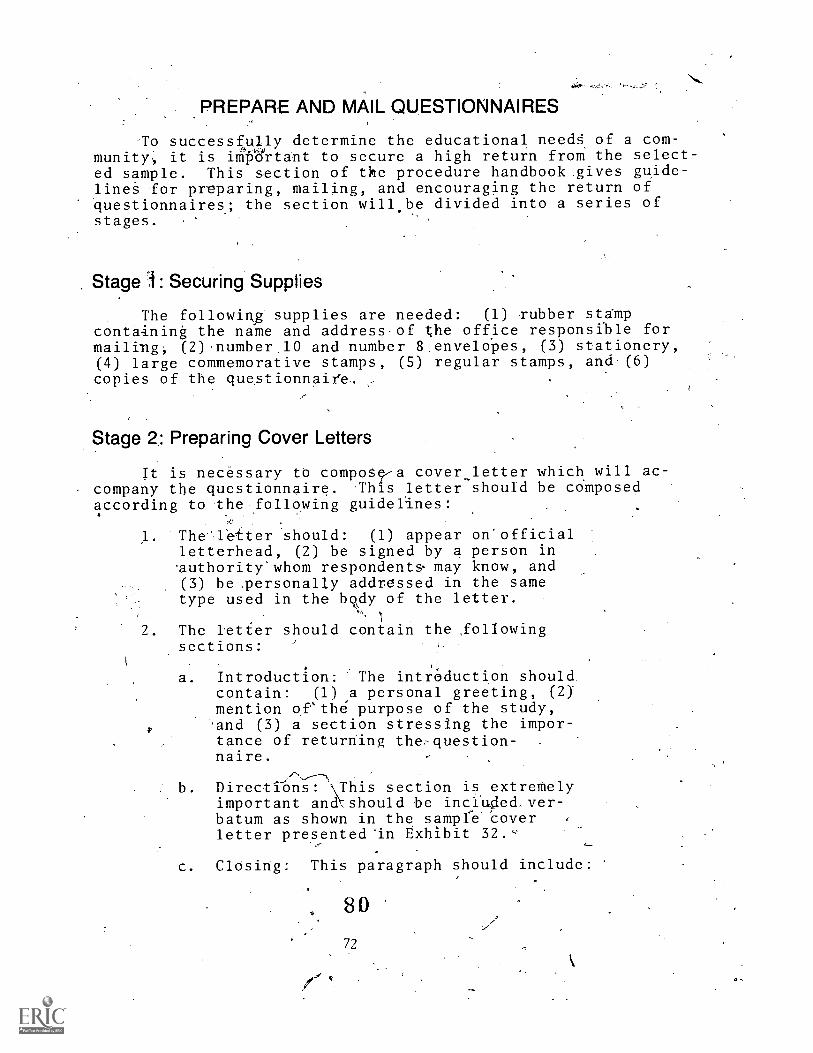
PREPARE AND MAIL QUESTIONNAIRES
-To successfully determine the educational neecN of a com-munity; it is impartant to secure a high return from the select-ed sample. This section of tke procedure handbook gives guide-line for prrparing, mailing, and encouraging the return ofquestionnaires; the section will.be divided into a series ofstages.
Stage : Securing Supplies
The following supplies are needed: (1) rubber stampcontaining the name and address.of the office responsible formailing; (2)number.10 and number 8 enveldpes, (3) stationery,(4) large commemorative stamps, (5) regular stamps, and (6)copies of the questionnaife.
Stage 2.: Preparing Cover Letters
It is necessary to compos?,a cover_letter which will ac-company the questionnaire. 'This letter should be composedaccording to the following guidelines:
1. 'The-lrtter 'should: (1) appear on'officialletterhead, (2) be signed by a person in'authority'whom respondents. may know, and(3) be.personally addressed in the sametype used in the bo,dy of the letter.
2. The letter should contain the followingsections:
a. Introduction: 'The intl:Oduction shouldcontain: (1) a personal greeting, (2)mention ofthe purpose of the study,
0 and (3) a section stressing the impor-tance of returning the7question-naire.
b. DirectiOns: \This section is, extretelyimportant andshould be inciwle&ver-batum as shown in the sample Coverletter presented-in Exhibit 32.Q
c. Closing: This paragraph should include:
8 0
7 2
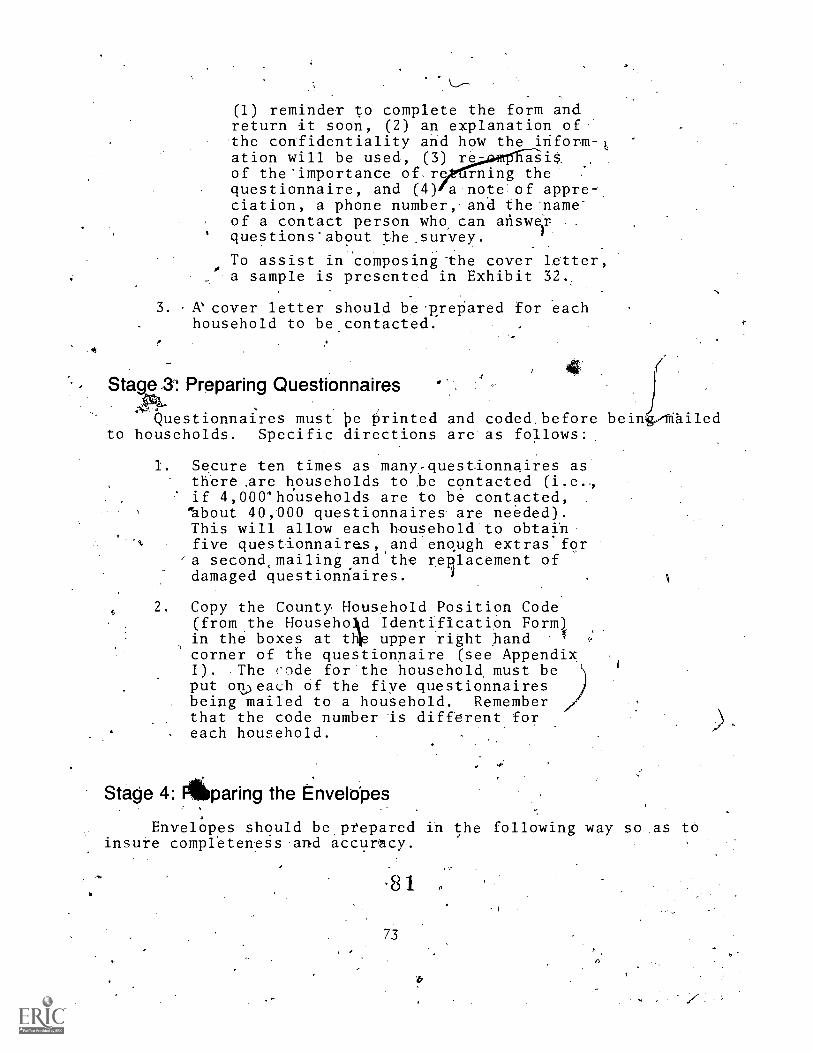
(1) remindeT to complete the form andreturn it soon, (2) an explanation-of.the confidentiality and how the inform-ation will be used, (3)
t
of the'importance of.re ming thequestionnaire, and (4) a notelof appre-ciation, a phone number, and the.name-of a contact person who, can answer . .
)' questionsabout the.survey.
. .
To assist in composing-the cover letter,0a sample is presented in Exhibit 32.
3. ,A'cover letter should be.RrepaTed for eachhousehold to be contacted.
Stage 3: Preparing Questionnaires
alr
vQuestionnaires must 13e t;rinted and coded.before beingAflailed
to households. Specific directions are as follows:
1. Secure ten times as many:questionnaires asthere ,are households to be contacted (i.e.,if 4,000'households are to be contacted,'about 40,000 questionnaires are needed).This will allow each household to obtainfive questionnaires, and enqugh extras.for
'a second, mailing and'the rellacement ofdamaged questionnaires.
2: Copy the County Household Position Code(from the Househokd Identification Form)
,
in the boxes at thle upper right handcorner of the questionnaire (see AppendixI). .The code for"the household must beput on.)each of the fiye questionnairesbeing mailed to a household. Rememberthat the code number is different foreach household.
4
Stage 4: Filhparing the EnveloPes
Envelopes should be pteparedinsure completenes-and accuracy.
8 1
73
the following way so as tO
1. PefSonally address,an enizelope to each ,house-,hold to be contacted. The address should betyged in the same type style.on the coverletter or use a general heading. .Enveiopes,should be addressed to the.name-of the headof the household, Or the "present tesident".It is best to do cover letter and envelope-7at the same.time to avoid mix-ups when stufif-
ing the envelopes.
2. Stamp the.envelopes with a colo-Pful commen-orative stamp (e.g., a wildlife stamp);
.
3. Envelopes should have official Letterheadfor return address.
4. Envelopes .should be mailed "first class" sincethis.will require the'post office to rettirnany envelopes ,which are not delivered,
S. Prepare return envelopes (No. 8 envelopes)with office address and stamp. k sample .
envelope for mailing anctreturning question-.naires iS shown in Exhibit 33.
Stage 5: Mailing Questionnaires
Questionnaires must be mailed in an org4nized manner;the following steps-provide guidelines.
1. Be certain that each eIve1ore containsfive'questionnaires and a i%eturn.envelope.
2. Be certain that questionnaires aie mailedto all the 1households Selected in thesample.
3. Mail alI questionnaires on the .SaMe lay,at least fot speEific gebgraphic areassuch as counties.
4. For each household, place a check on theHousehold Identification Form to indicatethat the first questionnaire has beenmailed.
74
8 2
PROCESS RETURNED'QUESTIONNAIRES
As questiohnaires are received, each one should'be pro-,.'cessed separately.. This section of the handbook oUtlines the
- procedure for handling the returned questionnaires. Additional-large-loose leaf binders mar.be needed for filing questionnairesif the sample is large. The step's in processing return questi.on-naires are as follows:.
I. Establish a -conarenient anereliable pro-0cedure to obtain the returned question-naire,s from office mail. ,
2. Each returned questionnaire should bestatped with the preSent
and-placed in the loose -leaf'binder for questionnaires returning.from that county. The,first' digit inthe_code:nutber at the upPer lqft"hadd corner of_thequestionnaire'swifl ide'tify the county.
3. On the H4sehoId Identification Pormcorrespondineto.the qUeStionnaire,place a Check mark'in the complete.
' column if the questionnaire iscom-plete. The number at the top lefthand corner of ,the 'questionnaire isused for locating the household inthe binder containing the household
identification forms.
CONTACT NON-RESPONDENfS
The quality Of the needs.asses'sment is directly,:relate'd.to the number ofAuestionnaires.Teturned. For this reasoilanyone who fails to return an originalfquestionndire-i-s con-_tacted.again 4nd,urgea.to retuTn'it.: This section describesthe steps,desieed to help Obtain the needed responses:.
1. TwO weeks after the original,mailingof the questionnaire, mail a reminder'
. letter and a second. Set of copies ofthe questionnalesto.those.:-Mkuseholds
Y:which have noti-etbrned A questionnaire.
75
83
A sampfe gre'minder letter aueas Exhibit, me andealkdreMeach househo,l4 can ound byfconing the 'ApprOiate liseho.;,d Identifition Form. 6,91seholds liste# withOtti,check in the "eompilete" column are4
, households 'that are non-respondentS at'-this point 2.11. time. Preparation forthe second matling should begin a weekafter the first mailing in order to be
.ready .to., send,the second mailing twoweeks, after,,thei first. It is extremeimportant t6 follow the mailing schedas cl*ly as possible. Send the re-minder".letter and ahother set of ques-tionnwes to.Immediktely be
-batch OfqUestmail OliVery
axe non-respondents. ,Aling the seconds, check Ihe lastrned questionnates.
Withdraw4uestidn es from the seeondhousehOds tlat have recently
retUt#edgaestiohnaires.r
FoOr -eks':after the original (first)ma-ilpirOthe questionnaires, begintieplighInOli:ose'holaseholds whichIlavlotreturnsa a questionnaire.PoIrsaMplipt for the call appearsaS:E*.h1-brit,-35. Follow the script asclo-se/S'potsihle for each call.Foi beSi. -possible results, callsshbUI,,db-e. made between 5:00 p.m.an"d:47:00 p.m. ,In rural areas withaiiiih-poPulation of farmers, callssh".ould.be made at lunch time and-inthe late evening during the summer,
CODE QUESTIONNAIRES
The_purpos.Of. coding is to facilitate computer data anal-ysis thrOughtheiransfei of infgrmatfon from the completed ,
questionnaires onto computer cards The da.ta froM.each ques-. tionnaire is transferred to one computer card. qie: numbers,-
along the right side of the questionnaire refer to.. card colu4sA .
8476
at
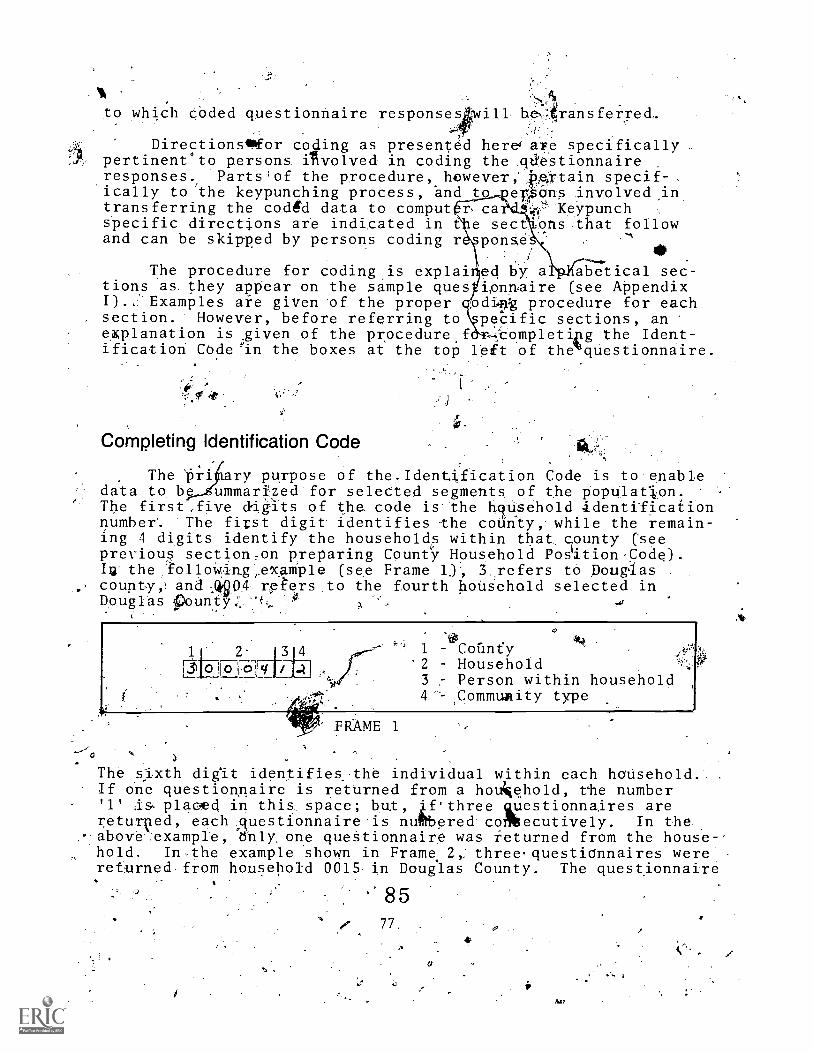
to which coded questionnaire responses will bes,Aransfeired..
Directionslifor ccsling as presente'd here' afe specificallypertinent'to persons nvolved in coding the qdestionnaireresponses. Parts'of the procedure, however, "..grtain specif-ically to the keypunching process, and to er ons involved intransferring the coded data to comput ca Keypunchspecific directions are indicated in ie sect.-bhs that followand can be skipped by persons coding r ponse
40
The procedure for coding.is explai ed by a abetical sec-tiohs as they appear on the sample ques ipnilaire (see AppendixI).. Examples are given af the proper qodi ont procedure for eachsection. However, before referring to peci ic sections, anexplanation is given of the procedure f tompleti g the Ident-
.
ification Cade'in the boxes at the top left of the questionnaire.
Completing Identification Code
The 15ri ary purpose of the,Identification Code is to enabledata to be ummarized for selected segments of the populatlon.The first,five ddgits of the code is the hgusehold identificationnumber'. The first digit identifies the coun'ty, while the remain-ing 4 digits identify the households within that county (seeprevious section:on preparing County Household Pos'ition-Code).ha-the following,exAmple (see Frame 1.), 3 refers to Doup1ascounty,: and4g04 rpfers to the fourth household selected inDouglas pounty:. 0
FkAME 1
The sixth digat identifies_ the individual within each hausehold.If 6ne questionnaire is returned from a houkehold, the number'1' is, placed in this space; but, ifthree auestionnaires arereturved, each Auestionnaire is nuMbered colbecutively. In the
. above example, dhly one queStionnaire was returned from the house-.hold. In,the example shown in Frame. 2, threequestiOnnaires werereturned from household 0015 in Dauglas County. The questionnaire
.1 8577,
.1
,
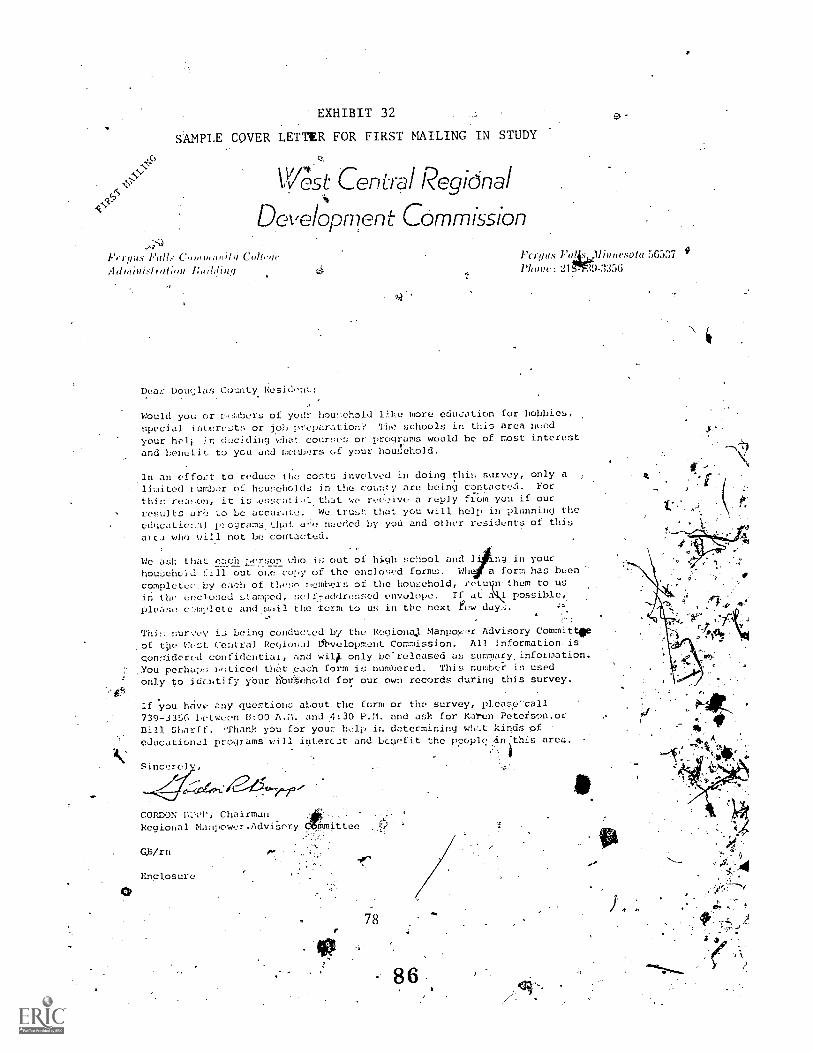
EXHIBIT 32
SAMPLE COVER LETTER FOR FIRST MAILING IN STUDY
West Lentrpl Regidnal
Development Commission
Ferflus Falls (..'w,to,i10/11 ColfrgeAd minis/ ralimr 1;.«.1(ling
Dear Dou(Jlas County Resid,nt:
rcrgies 151ikj.....11inneso1a 56537 9Phone: 21M-9-333G
Would you or R-emhers of your hotv:ehold like 'more education for hobbies,
special interests or j.(3, prep;:ration? Tha schools in this area nucd
your heli )n deciding what coures or programs would be of most interest
and hendiit. to you and members of your houLhold.
.1n an effozt to reduce the costs involved in doing this survey, only alimited lumlwr of hotieholds in thu county are being contacte:I. For
this reci!.on, it is ,esscnti;!l, that we reeivo a reply from You if our
results ar . to be accurate. We t_rus that you will help in planning the
cdncatio:,11 p2ogram:5.that mjeded hy yoU and other residents of this
alc.1 who %Jill not be contactud.
We ask that eaFil ,,_rson who is out of hi.gh school and I ng i.n your
househo;d fill out ol.e copy of the enclosed forms. Wh a. form has been
completec.by each of thesr members of the household, to us
,:in the ene3oed 1,amped, self7addressed envolope. If at a I possible,.
please caplete and mail the tom to -us in the next few day:;.
'this Survey L.; being conducted by the Regiona.1 Manpor Advisory Committipof. 9e West Central Reqiohal Obvelopnlent Commission. All information.is
conidered confidential, and will, only be'released as summary,information.You perhap!: 1,-)ticed thilt..pach form is numV)ered. This numbei- in used
only to idcntify ybur libAehold for our own records during this survey.
lf 'you hav.: any questioin; about the form or the survey, please'call .
739-335(; butween 0;00 A.n. and 4:30 P.M. and ask for Karen Peteison.or
Bill Sharff. 'Thank you for your help in d;:termining whL,t; 'kinds ofeducational pro:Jrams sill interc.;t and bcuefit the ppoplc: in 'this arei:.
Sincerely,
CORDON 111,, ChairmanRegional Manpower.Adviaory :fimittee
GX/rn
Enclosure
78
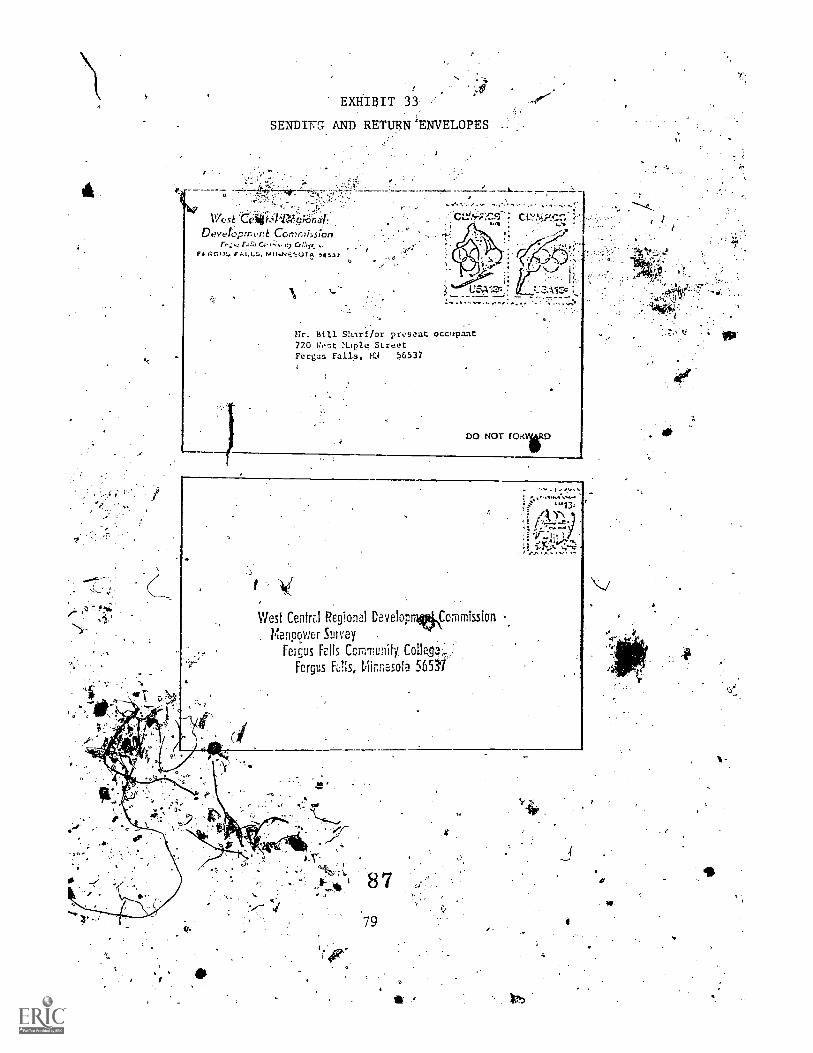
"t
EXI-fIEIT 33
SENDIFG. AND RETURN ENVELOPES
.
West 'Celigt:1..6.01:-,
DevelOpment Commission
_
,
Ce!.?ig,
FLRGIri FALLS. to,111NUT A '0537
H. Mil ShAtf/or present occupant720 Vest Hiple StreetFergus Falln, K.',1 56537
DO NOT
West Centrd Regional DavelapnWommission. Manpower Swvey
Fergus Falls Community
Fergus Faris, Minnesota 56531
8 7
%79
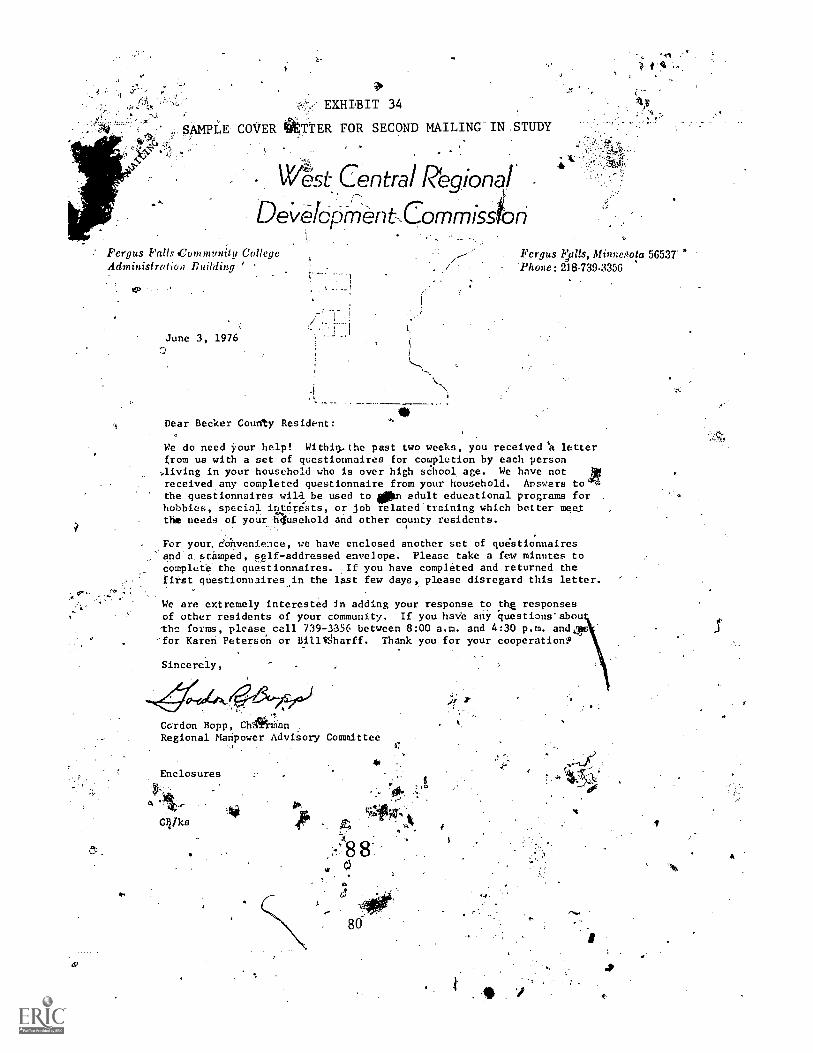
' EXHIBIT 34
AMPLE COVER *TTER FOR SECOND MAILING-IN:STUDY
er,t Central Pegiond
DeVélophient-,Commisstori
Fergus Palls Community CollegeAdministrotio,; Building '
. .
June 3, 1976
Dear Becker County Resident:
We do need Your help! Withio,the past two weeks, you received 'a letterfrom us with a set of questionnaires for completion by each person)living in your household ho is over high school age. We have notreceived any completed questionnaire from your household. Answers toj!
w
the questionnaires wila.be used to iipm adult educational programs forhobbies, special interests, or job related.training which better mee,tthe needs of ',Our ausehold and other county residents.
jor yonr. eonvenience, we have enclosed another set of questionnairesand Listamped, sgf-addressed envelope. Please take a few minutes tocomplete the questionnaires. .If you have completed and returned thefitst questionnaires in the last few days, please disregard this letter.
,
Fergus lalls, Minnoota 56537 '*'Phone: 218-739-3356
We are extremely interested in adding your response to pig responsesof other residents of your community. If you haVe any questions-abou-thc forms, please call 739-1356 between 8:00 a.m. and 4:30 p.m. and,*-for Karen Peterson or BillgSharff. Thank you for your cooperation:0
Sincerely,
Cordon Bopp,Regional Manpower Advisory Committee
Enclosures
Wks

EXHIBIT 35
SAMPLE- TELEPHONE SCRIPT FOR CONTACTING NONRESPONDENTS
0 TELEPHONE SCRIPT
1. My name is . I am calling from the office
of the West Central Regional DevelopmeNks Commission.j'I would like to speak
to(Name of person on h46se1iold information sheet) *
46.
If person taking call c responds to the name on.,the household identift-,
cation form continue with section 2 (below). If.the identical person on
mthe household.ID form cannot,be contacted, speak to another adult member#of the household. RemeMber to repeat the first two sentences of Section I
when another r:embat-of the .household is contacted. '1
2. If an effort, to Offer relevant educational programs in your community, we
are contacting a few households to findout what type of education is
.needed by the members of these househo s.0. Have you received the quespion-
linaire whic_we'recently sent you.'askIn about your interest in more educa-
tion?'
_-If respondent answers "y.u.-7" continue with section 3.below. Ifrespondent.
-- -...
rs "no", double check Als listed addets with respc*ellt by asking
ii yon live at . .(11.-Pec.1 T:lc.irc.'sV ...'jf-..-...''-^ IrASpOndent .
to this question, apologize far the diOurbance.or any....
you may:have caused.. If the respondent answers "yes",the--,!.
listed.' v4: *hRuld be-correct. You may continuejhe telephone. ,,.
with section 3.04B4t, -40:A.,-'....
nozterview
.
May I'ask if you or any".4.42.er cif your household are interested in education
for hobbtes or special intere:N16
?
If the respondentanswers Pyea" to this question, record the Zetter "Y" in
thelkmment section of the household identigication form, and place a hash
.(/) after the lettel (e.g., Y/). 1f.the respondent answers "no", write the
letter' "111" and place the slash after the letter [e.g.,'N"). "If there are
89_
1

EXHIBIT 35 (coninued)
ot
more than ono whilt mo::lber'in the houpehold, eleicit the response ofeach
member to the cbom.: questidn. heafd Yhe response of each household member
on a -scparatejine. Nh;le woording the response, proceed MO section 4.
DO NOT PAUSE, 'TO :?Eco:Cd
6
4. "Arc you or any wet:berh of your household interested MOre job or employ-
ment related trainingV1
If the responlont unswere "L!es", write the letter "Y" next to .the.leter
of the previo!,s response. .,".r the respondent answers "no" record,the, letter(
"N". For the person w!ze responds "yes" to 'the first questions and ."no" to
the sesond, the infomation will be n:corded in the commentsection. as
follows: Y/N/. hememi.er to the response of each household member
on a lgaparate line.
1.'or each respondent who answel'ed "yee. t,oany of the above questions, request
that. the q6,:estionnalres be returned in the envelopes 4104. were enclosed with
initial t:cilings, und thank the, responAnWfor theirilooperatic.n.
colozed marker to place an astePOok. nexito.the listed'4Ouse11old where the
par hj irated that they 1-11ke retuming the form, ,P2.,oceed o section
for respondents who answered "n04-' to each ot the aboveiquestions.,
"I wIlVitakka _note of that -and 'Pill out a form for you. For 'our records,
4,, 0
may.,1 ask.your ag Thank yroOrery much"..4R . itt
RecTord the age.next to the responses of the two pmvious qUestiond: -For ao
person 'by agc 25, the information in theeoirrnent section wil.2 be code& as
..follows:..N/N/26. When this infomation 'is obtained, indicatOwe017.4tion
on the househA identifi,eation form. If the recpcindeA.is hesitant;:to'''.330v,
0;7
Astate his/her actual age, use aqe categoreis of 25, 35, 45,56 and 0+.
4.
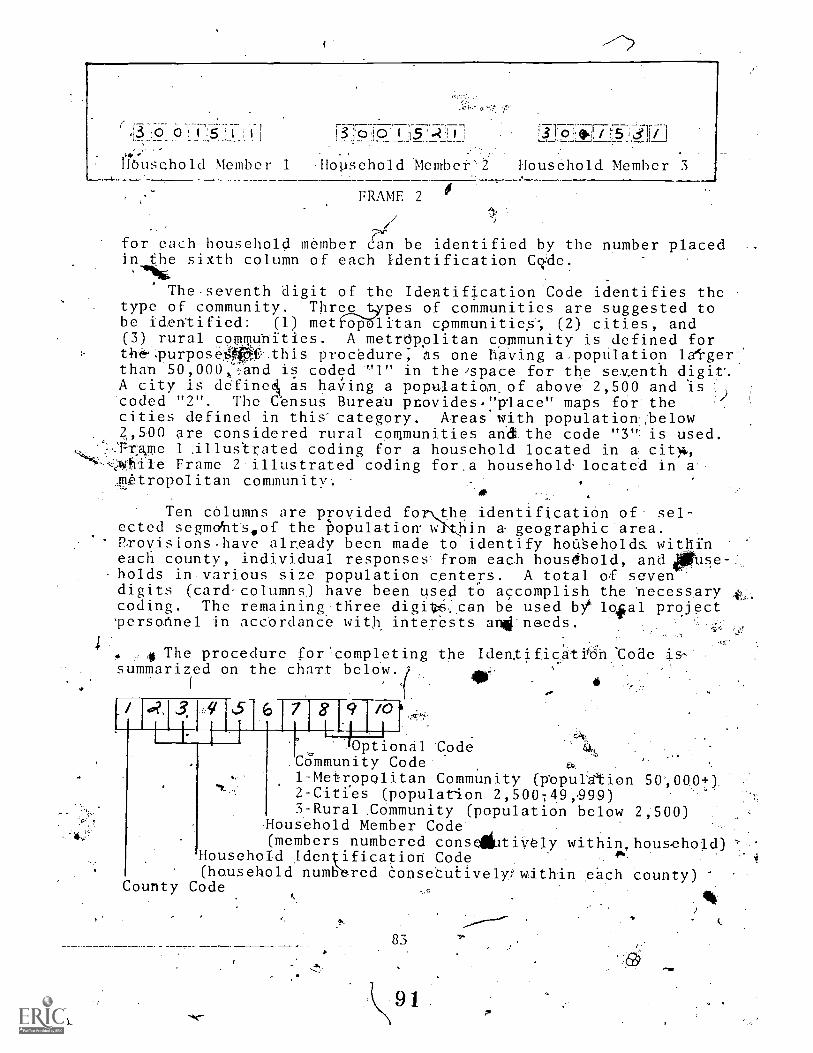
----___ ----,----.---T--, '1'._._ _ , _JI _1;5 A IT,T6-770 i ' 5 1..2'
,--,,,,HOuschold Member 1 ,Houschold Mcmbct'2 Household Member 3
.
. .
0FRAME 2
71for each household member Can be identified by the number placed ..,
in the sixth column of each Identification azde.
The-seventh digit of the Identification Code identifies thetype of community. Three_t4rpes of communities are suggested tobc identified: (1) metrofkilitan cpmmunitieS-, (2) cities, and(3) rural communities. A metrbpplitan community is defined forthe. :purposetW.this procedure, as one having a.popillation lergerthan 50,000and is coded '1" in the'spaCe for the sev.enthA city is defineek as haTing a population,of above. 2,500 and iscoded "2". The Census Bureau provides,"pqace" maps for:thecities defined in this category. Areas with populationbelow2,,,500 are considered rural communities'and the code "3"; is used.:FrAme 1 illus'trated coding for a household located in a cit)4,
Frame 2 illustrated coding for,a household located in a-.Daropol.itan community.
-
Ten celumns are uovided fo the identificatien of- sel-cctcd segmobtsaof the population w hin a geographic area.Rrovisions.have alneady been made to identify hou'seholda witIl..fneach county, individual responscs from each household, and 00Use-holds in various size population centers. A total of sevendigits (card'columns) have been used to accomplish the necessarycoding. Thc remaining three digi*can be used V' loel project'personnel in accOrdance with interests aniCnaeds.
4 The procedure for'completing the Identificatibn Code is--summarized on the chart below.
(
.
.
, / 0? . 3, 6 7 8 /0i 1 I _ 1 1
a4'
517 onal 'CodeCommunity Code'1-Metropolitan Community (population 50,00.0+2-Citfes (population 2,500749,-99,9)
.Community (population below 2;500)liousehold Member Code'(members numbered conseititiVely within.household)
Household Iden ification Code(household numb red Consetutively within each County)
County Code
4 ,
9 1
41101
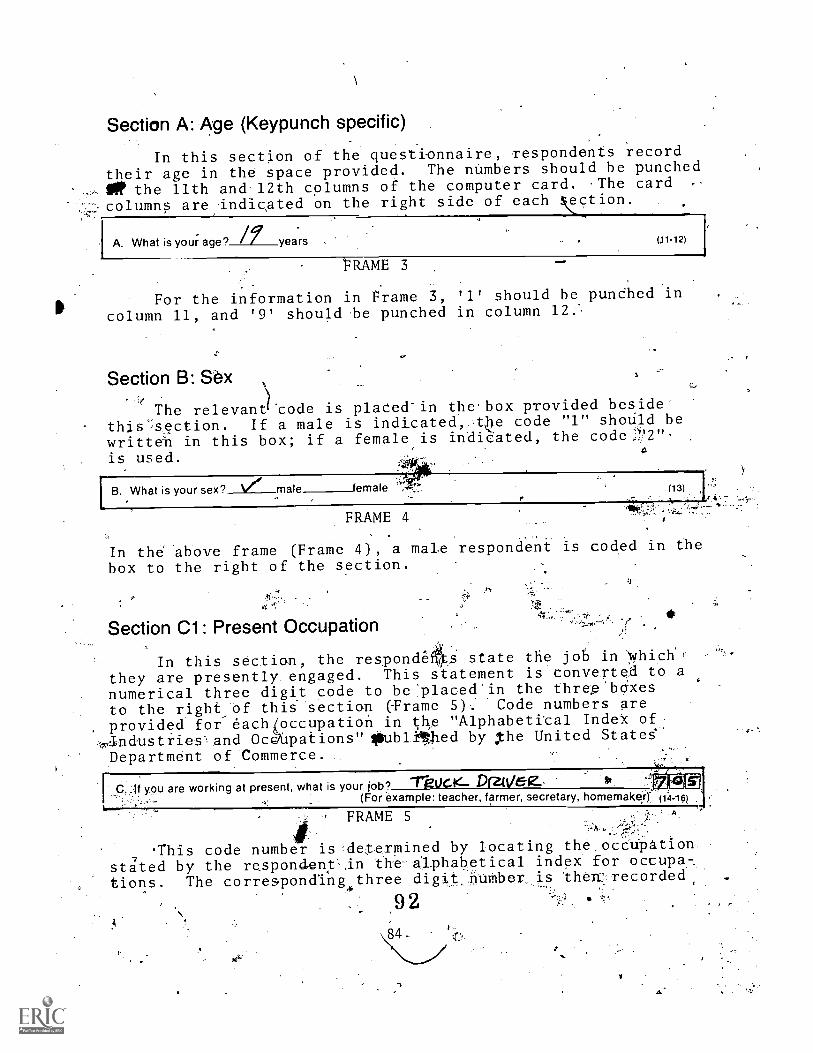
Section A Age (Keypunch specific)
In this section af the questiannaire, respondents recordtheir age in the space provided. The numbers should be punched
the llth and-12thcolumns of the computer card. .The cardJcolumns are indicAted on the right side of each !_ction.
A. What is your- age'? /r yea.rs (.11-12)
FRAME 3
For the information in Frame 3, '1' should be punthed in
column 11, and '9' should-be punched in column 12...
Section B: Sex
The relevancode is plated-in the.box provided beside'
thiss.ection. If a male is indicatede code "1" shoUld bewritten in this box; if a female is indicated, the code..2"-
is used. 4 t
0
%i
B. What is your sex? V# male female (13) ,
FRAME 4
In the above frame (Frame 4) , a mate respondent is coded in the
box to the right of the section.
Section (D1 : PresentOccupation
In this section, the respondefrO.state the job. in )0lich.,
they are presently. engaged. This statement is converted to anumerical three digi.t code to be'placed'in the threp'bcixes
to the right:of this 'section (Frame S) Code numbers areprovided for eachOccupation in tke "AlphabetiCal IndeX of:
;1;ndustriesand Oceupations"*.thlitlied by :Xhe UnitedSt,atespepartment of 'Commerce.
[TkUcie-- Diz.4/6-1Z. fitC. _If you are working at present, what is your job'?: .-- --- (For example: teacher, farmer, secretary, homemakei)
FRAME S
'This code number isde;termined by lOcating theocCupation.7
stated by the respondentin thea4habetical index for occupa,-
tionS. The correaponding digit is thenrecorded,
9 2
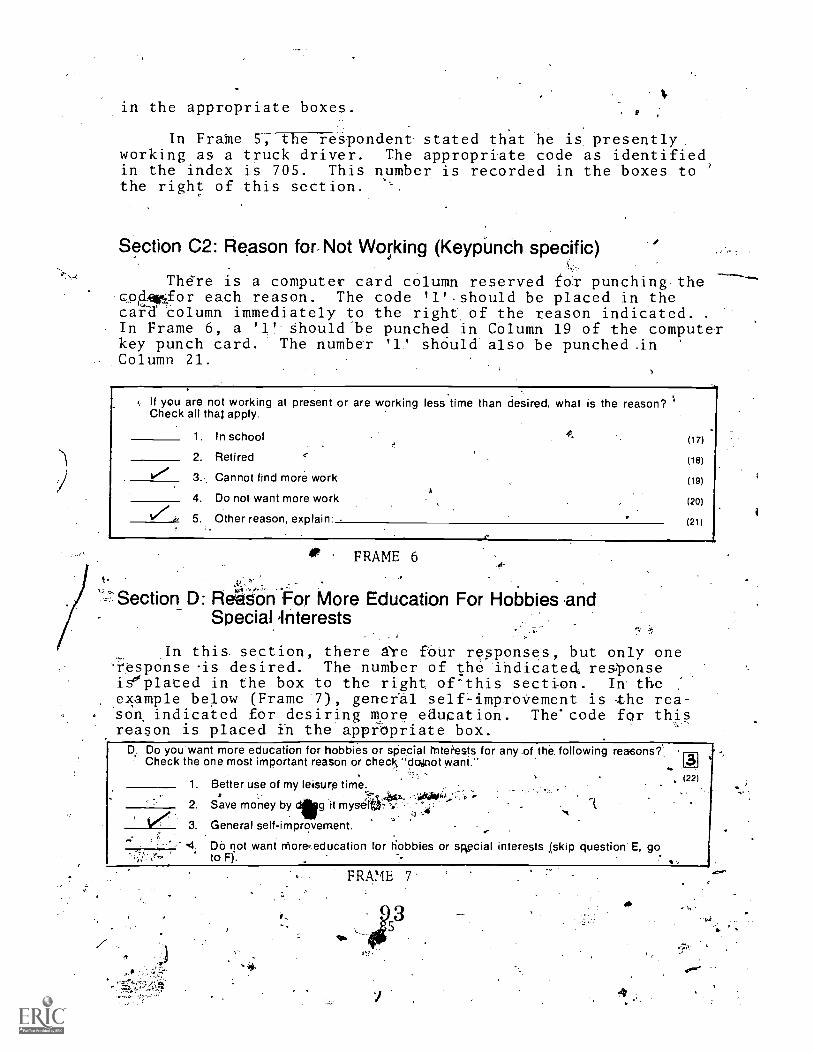
in the appropriate boxes.
In Frate 5, the respondent stated that he is presentlyworking as a truck driver. The appropriate code as identifiedin the index is 705. This number is recorded in the boxes tothe right of this section. ''..
Section G2: Reason for-Not Working (KeypUnch specific)
The-re is a computer card column reserved for punching the -------c.04.016for each reason. The code '1'.should be placed in thecard column immediately to the right of the reason indicated.In Frame 6, a '1' should'be punched in Column 19 of the computerkey punch card. The number '1' shOuld also be punched .inColumn 21.
If you are not working at present or are working less time than desired, what is the reason?Check all that apply.
1. In school (17)
2. Retired (19)
3. Cannot find more work (19)
4. Do not want more work (20)
5. Other reason, explain- (21)
A
16
FRAME 6
L: Section D: ReênFor More Education For Hobbies andSpecial Interests
o. .",tr.
In this section, there 6Ye four responses, but only one:i'esponse'is desired. The number of the indicated, responsei?wplaced in the box to the right of-this section. In the,example below (Frame 7), gener'al self-improvement is the rea-son, indicated for desiring more education. The'code for this
Areason is placed in the appropriate box.D. Do you want more education for hobbies or sPecial rriter'ests for any .of the. following reasons?
Check the one most important reason or checls"dognot wrant."(22)
1. Better use of my leisure time.
2. Save money by clig it myseirk
3. General self-improvement.
z
Do not want rtiore,,education for Hobbies or skecial interests Iskip question E, goto Fj.
FRAME 7.
, ;53
1,
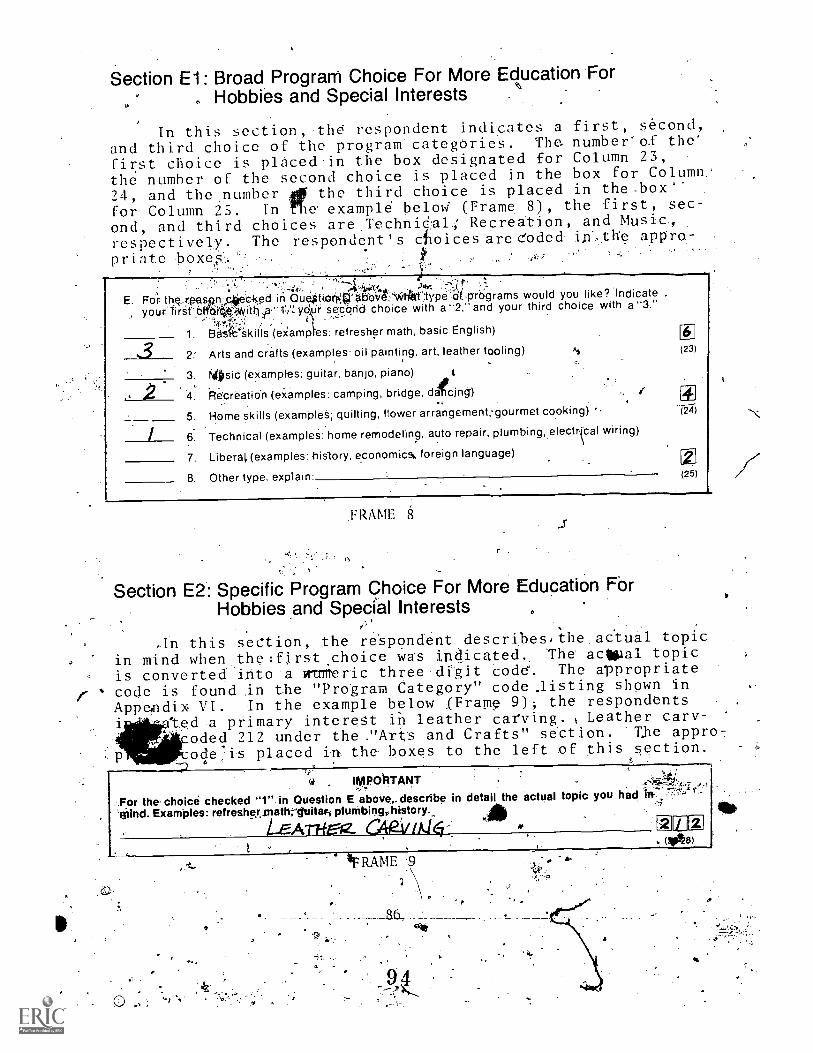
Secfion El: Broad Program Choice For More Educafion.For. Hobbies and Special Interests .t
In this section,-the respondent.indicates a first, second,and third choice of the program categories. Tha number'of the'
first choice is placed.in the box designated for Column 23,the number of the second .choice is placed in the box for Column:
24, and the,number the third.choice is placed in the.box .
for Column 25. In file. example below (Frame 8), the first,, sec-
ond, and third choices are.TechnieRecreation, and Music,respectively. The respondent's clioices are eoded irf,the appro.-
Printe boxes-
E. For the_reeson cec4ed in aug4tion4.0'4bbv ;4itiettetype ot,prdgrams would you like? 'Indicate. . .
your'lirSC Ct/tiqqAith4e,"1!.':.y .r second choice with a 2 and your third choice with a "3."
1. Ba'sfskills (eZamptes: refresher math, basic English)
2: Arts and crafts (examples: oil painting, art, leather tooling) (23)
3. rillosic (examples: guitar, banjo, piano)
42' R6creatio. n (examples: camping, bridge, datinl) ,
5. Home skills (examples; quilting, flower arrangement,,qourmet cooking) (24)
6. Technical (examples: home remodeling, auto repair, plumbing, electrccal wiring)
7. Libera (examples: hislory, economic% foreign language)
8. Other type. explain (25)
.FRAME 8
Section E2: Specific Program Choice For More Education FOrHobbies.and Special Interests
this section, the respondent describesethe.actual topic
in mind when .the :first,choice was indicated.. The aclipal topic
is converted. into 'a eumeric three-di'git Code. The appropriate
code is found An the "Program Category" code Jisting shown inAppefndix. VI. In the example below fFrame 9)i the respondents
ted.a primary interest ih leather carving. Leather carv-oded 212 under the ."Arts and Crafts" section. 'The appro7ode .is placed in. the b.OXQS to the left of-this section.p
ci 1110614TANT ,.
....For the choice checked "1".in Question E above,.describe in detail the actual topic you hadMind. Examples: refresheyjnathrquitari plunibing,..history...., -
1-EAMEg. 6414/ uti4--: .
4FRAME `,9
7
.2;1*
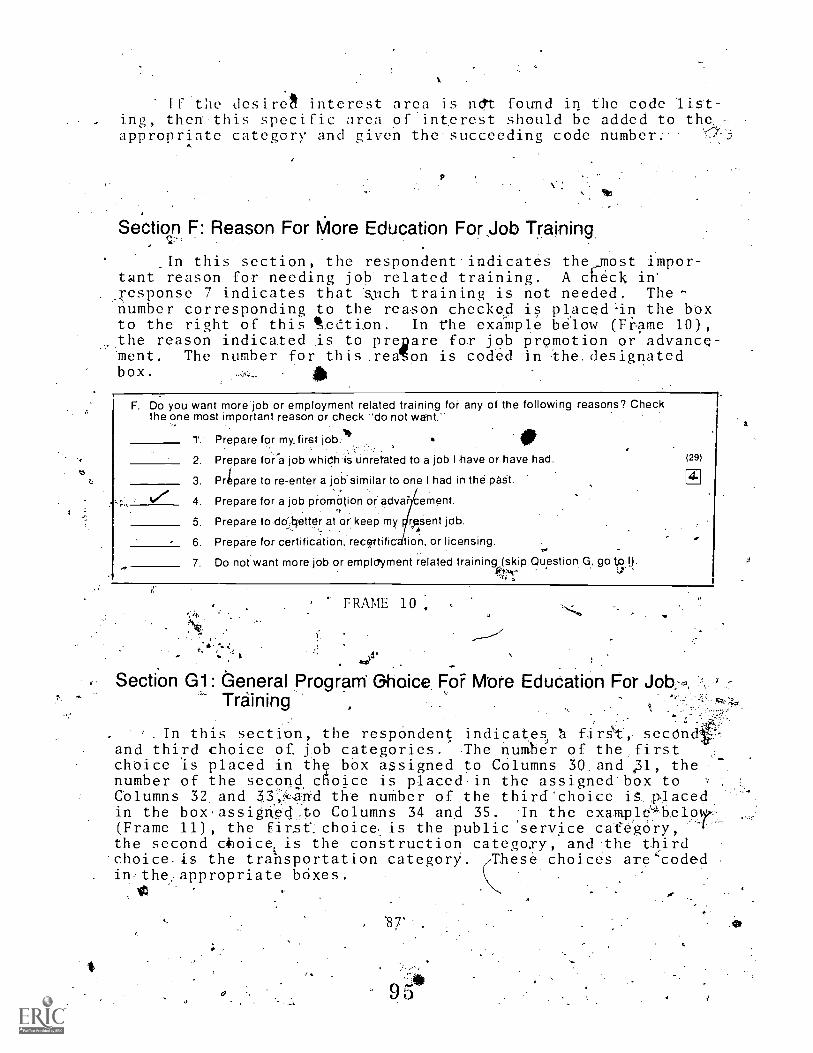
IF the desire!! interest arca is lilt found in .the code list-ino0, then-this specific area of interest should be added to theappropriate category and given the-succeeding code number.-
Section. F: Reason For More Educafion For Job Training
_In this section, the respondent.indicates the,most impor-tant reason for needing job related training. A checic in
. jesponse 7 indicates that Sjich training is not needed. The-number corresponding to the reason checkosd is pla.ced'in the bbxto the right of this toLtti.on. In the example below (Frame 10),the reason indicated is to preTiare for job promotion or advance-Ment. The number for this,rea1Ton is coded in the,designatedbox. AM
F. Do you want morejob or employment related training for any of the following reasons? Checkthe one most important reason or check "do not want.-
1. Prepare for my, first job.14.
2. Prepare fora job whiChis unret.ated to a job I tiave or have had.
3. Prhpare to re-enter a job-similar to one I had in the paSt.
4. Prepare for a job promion or.adva ement.
5. Prepare to,d0::better at dr. keep my 1reent job.
6. Prepare for certification, recertific tiorl, or licensing.
7. Do not want more job or employment related training (skip Question G, go ,).
(29)
FRAME 10,
Section G1: deneral Program- Ghoice Fof More Education For Job,,,Training
In this section, the respOndent indicatos, a firs't,- secOndand third choice of lob categories. The number of the:firstchoice Is placed in the box assigned to COlumns Wand 431, thenumber of the second cfioice is placed.in the assigned-box to ,
Cblumns 32. and 3.3.-1 the number of the third'choice iS_placed:in the box,assignod,Z,o Columns 34 and 35. jn the exampleboloy:(Frame 11), the first: Choiceis the public service cateOry, .1--the second c.hoicetis the construction category, and the thirdchoice.is the transportation categorY. 7mesè choices are'codedin-the,appropriate bOxes.,01
I
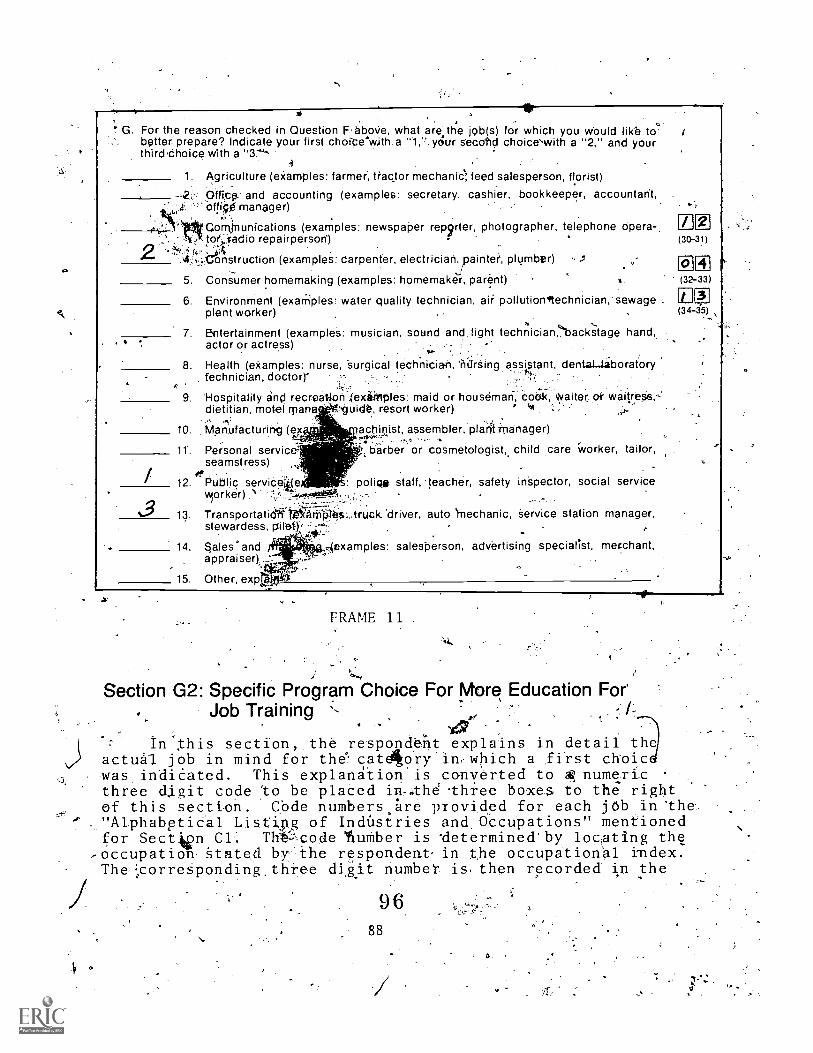
¶ G. For the reason checked in Question F. abmie, what areithe job(s) for which you would likb to ibetter prepare? Indicate your first choite'w,ith a "1,". your secoild choiceswith a "2," and yourthirdthoicp with a "3:`¶- .
4
1. Agriculture (eXamples: farmer, tractor mechanic), feed salesperson, florist)
.--,2; Offtp.: and accounting (examples: secretary. cashier, bookkeeper, accountant,Offige manager) .
0 s, Cominunications (examples: newspaper reporter, photographer, telephone opera-,',:.toOadio repairperson) f
,..__;;A'
(30-31)
-4...i.:,uonstruction (examples: carpenter, electrician, painter, plumber)J
5. Consumer homemaking (examples: homemaker, parent) .
'";
0(32-33)
6. Environment (exam-dies water quality technician, air pollution4technician, sewage . IT 3plant worker) (34-35)
., ,
-,..-
Entertainment (examples: musician, sbund and light technicianNackstage hand,.. . actor or actress)
8. Health (eXamples: nurse, Surgical technician, iiiirSing assistant, dentat-daboratory.. N.,fechnician, doctorr .-- .- .. :.., .
4:
9. 'Hospitality and recrea0on .jexiiirples: maid or houseman cocik Waiter or waitreas,-'dietitian, motel mane uide, resort worker)
10. Manufacturing (ex achinist, assembler, plant:manager)
11 . Personal service, . barber or cosmetologist, child care Worker, tailor,seamstress)
O.12. Public service'''' e polio* staff, 'teacher, safety inSpector, social service
Alorker) "
103 13. TransportaticKtIkenVes....trUck 'driver, auto ).nechanic, Service station manager,stewardess, prilot-Y,,
.,e!.,--.
. -14. Sales and vAexamples: salesperson, advertising specialist, merchant,
appraiser)i, _
15. Other, expr
FRAME 11
;Section G2: Specific Program Choice For More,. Education For
Job Trainingsier
'In Xhis section,,the respondent- explains in detail theactual job in mind for thecat4orY in, which a fii-st choicmas.indiCated. This explanation'is converted to * numulcthree d.igit code :to be plaCed inthd-thiee boxes,to the rightof this section. COde numbers:Are provicled for each jOb in 'the"AlphabgtiOal Listing of IndUstries and. Occdpations" mentionedfor Sectje CL Thttode 'fluMber is -determined.by locating the
-occupation. §tatO by;-the respondent. in Ole occupational kndex.'The-:,correSponding,thiee di,git number is then recorded in the
9 6
88
,
,
4

appropriate boxes. In.the example below (Frqme 12),,'the respori-dent indicates-va training-need to become a game warden in a gamerefuge. 'The.number corres nding to game warden in the occupa-tional initdex,is 245. T n mber is recorded in the three boxes
. .
°to the right of this section.
IMPORTANT-AFor the group of jobs checked "1" in Question G, describe in detail the actual job you had in mind
for which more training is desired. Examples: secretary, carpenter, farmer, registered nurse.
- 1 t.11 L At 14 L r41(36-38).
FRAME 12
Section H:,Attendance Time (Keypunch specific)
Thi's'section elicits the mos't convenient time for therespondent to attend an educational program. The number 7'1"is punched in the columns corresponding to.,the res.ponses checked.One cai=d column is reserved kor each of the three responses.
.. .
In the illustration belOw, the respondent checked responses_two and three. The ntimeral. 1 is punched in-Columns 40 and 4'1,4'.
Y'H. When could you attend ab educational program? Check as many as yob can..,
1 Day (Monday-Friday)
2 Night (MoVay-Friday)
3. Weekends-
FRAME.13
4,4!
Section I: Obstacles To Attendance (KeypUnch specific)
In thit, section, the respondent checks some of the mostimportant problems which may prevent attending an eduCatiOnalprogram. The nuMber.1' is 'punched in the column correspondingto-the reSponses checked. One card column /1-r-i:eserved for each
9 7
0.
r
response witil the eXception of tile first response for whiéh
three. cardolumns_are,reserved. If the-first respbnse ischecked,a/'1' is .Ppnched in the 42nd. co1umy1, The nespondentsWouldialsdindicate the distance they. ate willing to travel.
identjcal two-digit number i punehed'in -Columns 43 and 44.
jif-t,he d_istance IT'indicated with.a one digit number, a.. zero. (0)
is.plinch'ed7in Column 43 and.the digit -indicated is punched in
Column 44. This,is il,lustrated in the frame below. (Frace 14).
the numeral is punched in Columns 42,:48, and 49- An "09"
is punched in Column$ 43 and:4L1.'-/
...
. What are some of the most serious problems that mayt prevent you from attenaing an.educa-tidnal program? Check all that usually apply to'you.
, V ,c ..
1. ,Program not available in loca...I area.
.. How far would you travet9 7 miles
2. 45.mq-ram-not available at convenient time.1 t
3. Coljld not meet admission requirements.
4. Costs of attending are.,too high.
5.1 Present job does nbtallow time
V 6. Fami,ly obligations (e.g., child care) do not allow time.
7. More training would hot raise my income.
8. Have no transportation.
9. I never hear about progra s being offered and I don't know where to find out.
10. Otber:explain.
(42)
(43-44)
(45)
(46)
.(47,)
(48) 4.
(49)
(51) '
(52)
(5
I to FRAME 14
.4.0"-Section J: Need For CoUnseling Service (Keypunch specifiq)
In this sect-ion,,itis indicated whether the respondentneeds help in decidingt-what kind of further educa.tion is needed.If the respondent checks 'yes', a '1'is punched in 'Column 54.
If '-n-ITTnis cheeked,, a '2' is placed in this column.. This is
illa)rated in the frame beloW. Since the respondent checked'no', the numeral '2' is punc)'ed in Column 44.7
J. Woul you like help in deciding what type of further education or job training you .nee
yes 17 no
(54)
FRAME 15
90
,9 8
J,

Section "J" is the last section te be coded. .Having codedtfiis section, the previous sections should be double checkedto;insure that they were correctly coded. Where there arejlo
.responses given to questions by the respondents, the bo?ces inwhickh coding is required shourd be left blank. The coded queS-.tionnaire 'is then placed in a three ring binder to be submittedwith the batch of questionnaires for.dataGnalysis. Both.com-rete and,incompiete questionnaires will be.used for data analy-
sis.err,
,k4
9 9
91'
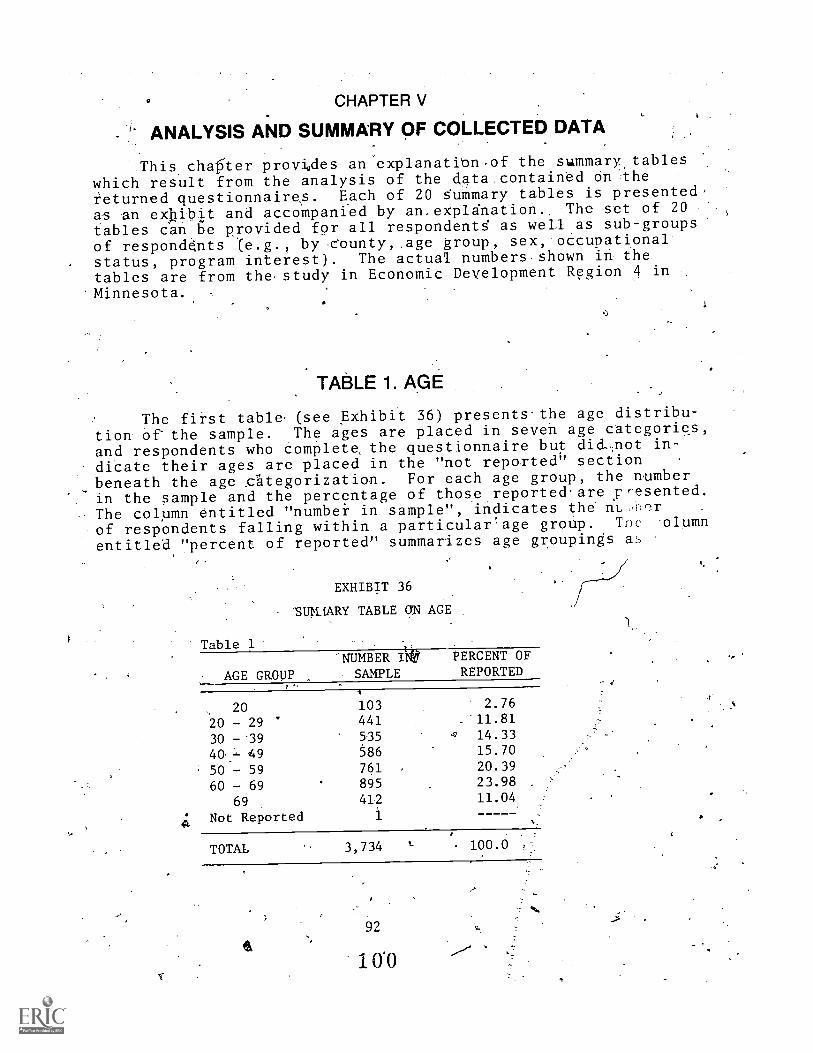
CHAPTER V
-ANALYSIS AND SUMMARY OF COLLECTED DATA
.This ch4ter provi,des an explanation.of the summary,tables
which result from the analysis of the data,contained On the
returned questionnaires. Eech of 20 SuMmary tables is presented,as en exibit and accoMpanied by an.expIgnation., The set of 20tables can.be provided for all respondentg as well as sub-groupsof respondrits (e.g., by County,.age group, sex, oecuoati.onal
status, program interest). The actual numbersshown in thetables are from thestudy in Economic Development Region 4 in
Minnesota.
TABLE 1. AGE
The first table, (see Exhibit 36) presents-the age distribu-
tion Of the sample. The ages are placed in seven age categories,
and respondents who Complete, the questionnaire but did-,not in-diCate their ages are placed in the "not reported" sectionbeneath the age _categorization. For each age group, the number
. - .
. in the sample and the percentage of those reported.are y resented.
The column entitled "numbei in sample", indicates the nL,A-)rof respondents falling within a particularage group. The -olumn
entitled "percent of reported" summarizes age groupings as
EXHIBTT 36
SUMAARY TABLE ON AGE
Table 1 .
AGE GROUP
'NUMBER It*
SAMPLE
PERCENT OFREPORTED
20 103 2.76
20 - 29 441 . 11.81
30 -39 535 14.33
40 - 49 586 15.70
50 - 59 761 , 20.39
60 - 69 895 23.98
69 412 11.04
4 Not Reported 1
TOTAL 3,734 . 100.0 ,
92
1 0.0
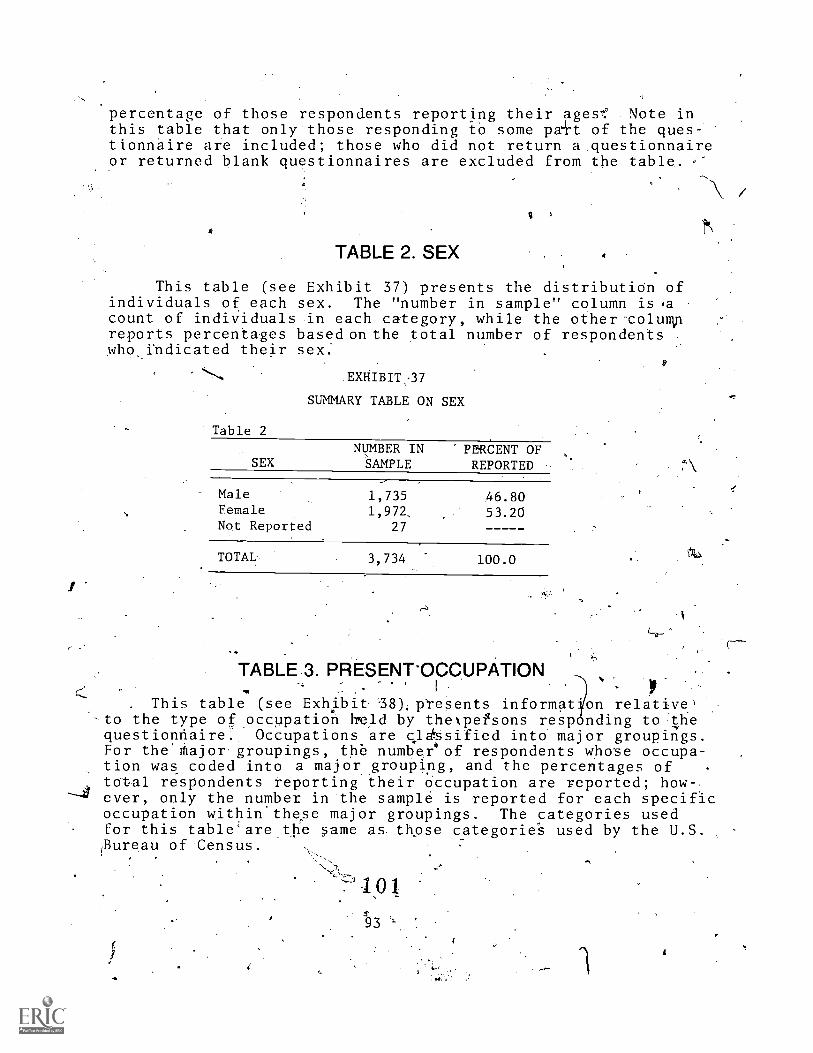
ci
percentage of those respondents reporting their ages,: Note inthis table that only those responding tO some part of the ques-tionnaire aie included; those who did not return a.questionnaireor returned blank questionnaires are excluded from the table. u"
TABLE 2. SEX
. This table (see Exhibit 37) presents the distributiOn ofindividuals of each sex. The "number in sample" column iscount of individuals in each category, while the other-colurilnreports percentages based on the total number of respondents .
who indicated their sex:
SUMMARY TABLE ON SEX
Table 2
SEXNUMBER IN PERCENT OFSAMPLE REPORTED
Male 1,735 46.80Female 1,972, 53.20Not Reported 27
TOTAL. 3,734 100.0
TABLE 3. PRESENT-OCCUPATIONI
This table (see Exhbit '38), ptesents informat'on relative,to the type of ,occupation hireld by thepefsons responding tolihequestionnaire. Occupations are clgSsified into major groupings.For the Ifiajorgroupings, the number°of respondents whose occupa-tion was coded into a major grouping, and the percentages oftotal respondents reporting their Occupation are reported; how.
--I ever, pnly the number in the sample is reported for each specificoccupation within'these major groupings. The categories usedfor this table'are,the same as. those categorie's used by the U.S.Bureau ofCensus.
N
93
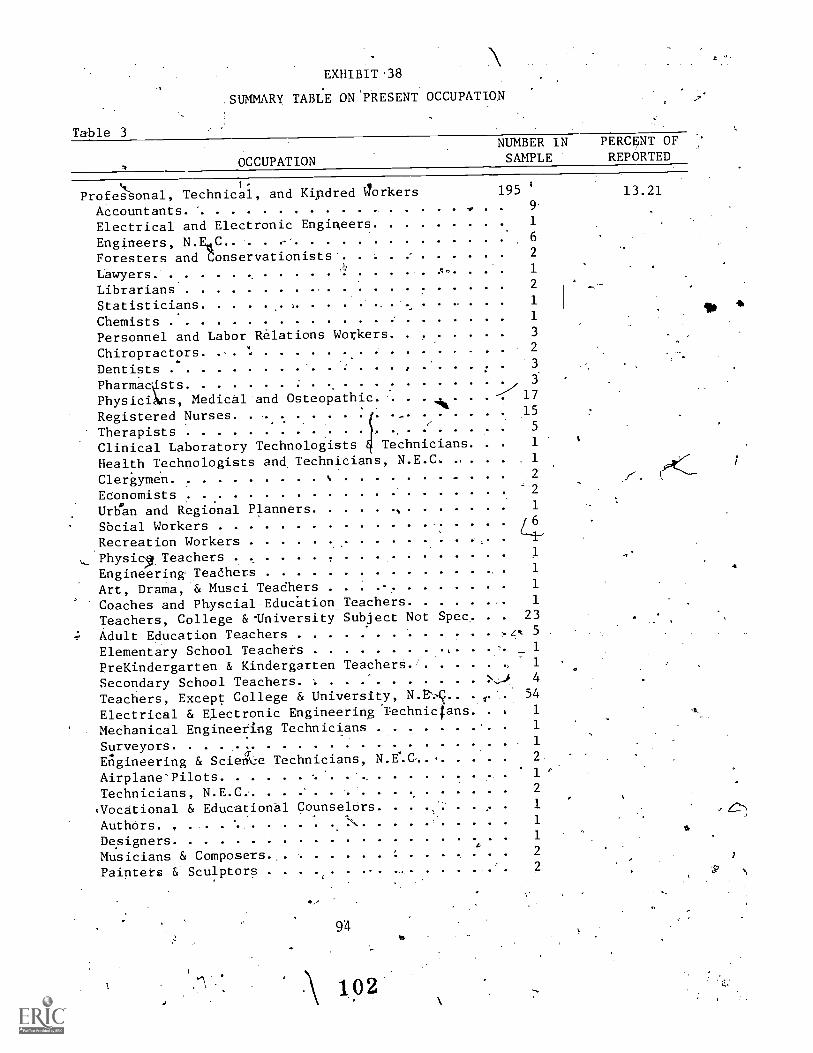
EXHIBIT-38
,SUMMARY TABLE ON'PRESENT OCCUPATION
Table 3NUMBER IN PERCENT OF
OCCUPATION SAMPLE REPORTED
t.- t
ProfeZ`Sonal, Technical, and Kipdred corkers 195
Accountants ... . 9'
Electrical and Electronic Engitleers 1
Engineers, N.V. -' 6
Foresters and Conservationists. 2
Lawyers 1
Librarians 2
Statisticians 1
Chemists 1
Personnel and Labor Relations Workers 3
Chiropractors 2
,Dentists , 3
Pharmacpts 3
PhysiciAns, Medical and Osteopathic. ". . .----'/ 17
Registered Nurses , 15,-
Therapists ,5
,
Clinical Laboratory Technologists Technicians. 1
Health Technologists and. Technicians, N.E.C. , . 1
Clergymen % . . 2
Economists .2
Ure,Gan and Regional Planners .1
Sbcial WorkersC-1.1E'.Recreation Workers
13.21
z -
PhysidATeachersEngineering, TeadhersArt, Drama, & Musci Teadhers
z
Coaches and Physcial Educhtion.TeachersTeachers, College &-University Subject Not Spec,
-.; Adult Education TeachersEleMentary School Teachers ,
PreKindergarten & Kindergarten Teacher§Secondary School Teachers
--(iTeachers, Except College & University, N.E% ..
Electrical & Electronic Engineering Technicians.
Mechanical Engineering TechniciansSurveyors
3-
Engineering & Scien'ce Technicians, N.f.C. ,
Airplane'Pilots .
Technicians, N.E.C.'/ocational & Educational CounselOrs. ., ...
.
Authors. ,\
Designers ,
Musicians & ComposersPainters & Sculptors
,
. .
,z.
-
,,J.
4. ...
,
, .
1
1
1
1
23
5
1z
1 .
4
54
1
1
1
2.
1
2
1
1
1
2
2
2
v
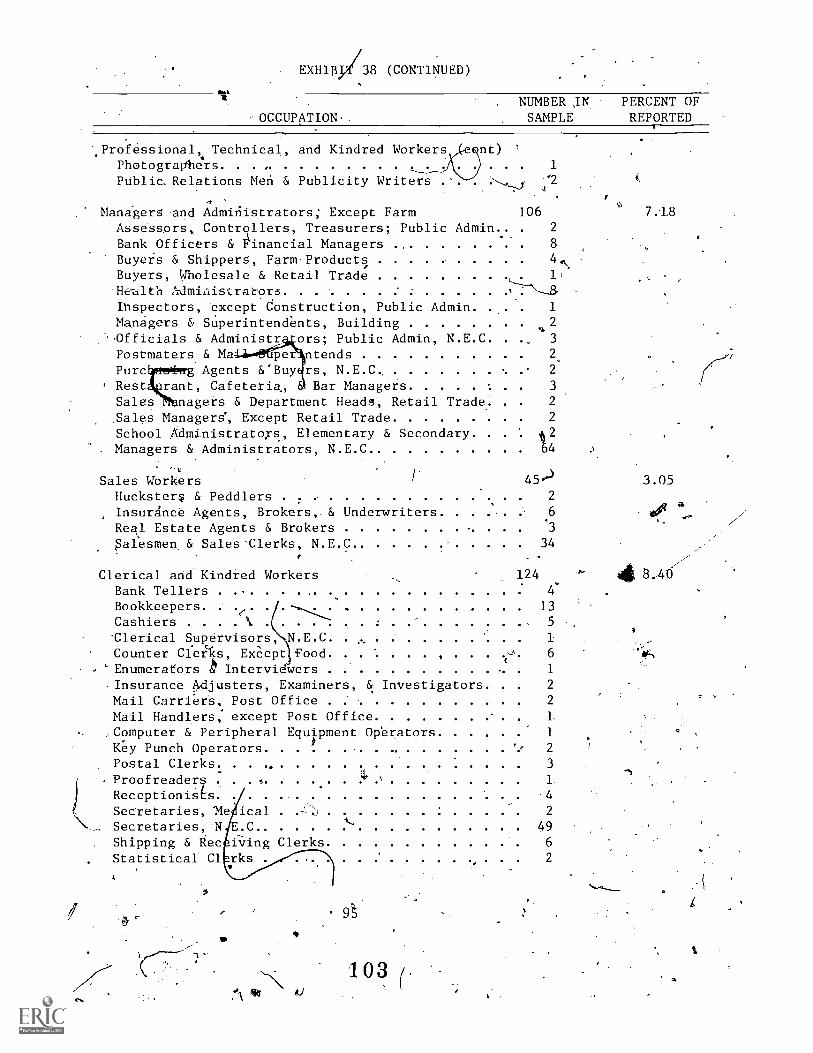
EXHIB 38 (CONTINUED)
-OCCUPATION-.
NUMBER IN PERCENT OFSAMPLE REPORTED
Professional,. Technical, and Kindred Workers nt) '
Photogravbers , . . 1
Public. Relations Men & Publicity Writers 'J :24
41.
Administrators; Except Farm 106 7..18Managers andAssessors, Controllers, Treasurers; Public Admin.. 2
Bank.Officers & linancial Managers 8
Buyers & Shippers, Farm-Products 4`\.
Buyers, Wholesale & Retail Trade 1,
--7------2,He-alth A-dministrators
Ihspectors, -except Construction, Public Admin. 1
Mangers & Superintendents, Building. 2
'Officials & Administr. ors; Public Admin, N E C 3
Postmaters & Ma pe ntends 2
Purc Agents &°Buy rs, N E C 2
Rest rant, Cafeteria., Bar Managers 3
Sales nagers & Department Heads, Retail Trade:Sales Managerg', Except Retail Trade 2
School Administratus, Elementary & Secondary.Managers & Administrators, N.E.C.
3Sales Workers 45.'
Huckster$ & Peddlers 2
InsurAnc'e Agents, Brokers,.& Underwriters. 6
Real Estate Agents & Brokers 3
alesmen & Sales'Clerks, N.E.C. 34
3.05
. .
Clerical and Kindred Workers 124 .... 8.-40. .
Bank Tellers . 4 .
Bookkeepers . .- . .."... - .....
. 13
Cashiers 'b. 5
'Clerical Supervisors, N E C I
Counter Cfetlks, ExCept Food ,., 6
. "Enumerators Intervidwers 1f
.Insurance Adjusters, Examiners, & Investigators. 2
Mail Carriers, Post Office 2
Mail Handlers: except Post Office ..... . L,Computer & Peripheral Equipment Operators 1
.K'ey Punch Operators . , 2
3
1.
..-1
.4
Secretaries,-Me ical 2i..,Secretaries,. N E.C. 49
Shipping & Rec firing Clerks 6
Statistical Cl rks . 2
4
Postal Clerks.Proofreaders 5
Receptionists
9 's
1 0 3, (
\
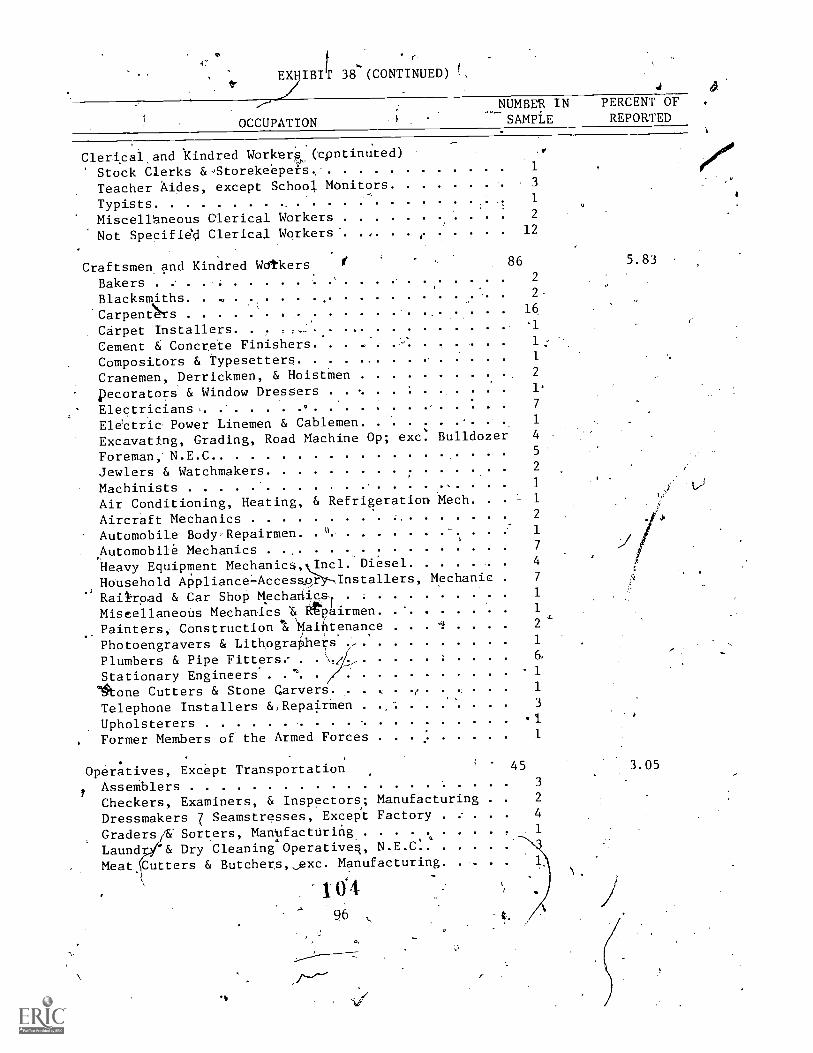
xIBIlr 38 (CONTINUED).
r .
.....',--- NUMBER IN PERCENT OF .
OCCUPATION SAMPLE REPORTED
Clericai,and 'Kindred Workerl(tpntinuted) .0
Stock Clerks 6,-,Storekeepers 1
Teacher Aides, except School Monitors 3
Typists,
1
Miscellaneous Clerical Workers 2
Not Specified Clerical Workers ,,
12
Craftsmen and Kindred Wdtkers 86
Bakers2
Blacksmiths. . , 2-
CarpenN.s 16
Carpet InstallersCement & Concrete Finishers. . 1:
Compositors & Typesetters 1
Cranemen, Derrickmen, & Hoistmen 2
pecorators & Window Dressers 1.
Electricians .7
Electric Power Linemen & Cablemen 1
Excavating, Grading, Road Machine Op; exc. Bulldozer 4
Foreman, N.E.0 5
Jewlers & Watchmakers 2
.Machinists 1
Air Conditioning, Heating, & Refrigeration Mech. . . 1
Aircraft Mechanics 2
Automobile Body-Repairmen i 1
Automobile Mechanics 7
Heavy Equipment Mechanics, Incl. Diesel .. ... 4
Household Appliance-Accesaer Installers, Mechanic 7
JRail-road & Car Shop Mechanicst 1
Miscellaneous Mechanics '& Rtpairmen 1, (
Painters, Construction.& Naintenance / 2
Photoengravers & LithograPiers 1
Plumbers & Pipe Fitters-Stationary Engineers
..
C71-'1-
61
Vtone Cutters & Stone Carvers. . . . . 1. . . .
Telephone Installers &,RepairmenUpholsterers -
Former Members of the Armed Forces
Operatives, Except TransportationAssemblersCheckers, Examiners, & Inspectors; ManufacturingDressmakers 7 Seamstrsses, Except FactoryGraders "Sorters, Manufacturing.
Laund 6, Dry Cleaning Operatives, N.E.C.Meat Cutters & Butchersexc. Manufacturing.
3
1
453
2
4
1 6496
.
5.83
a
3.05
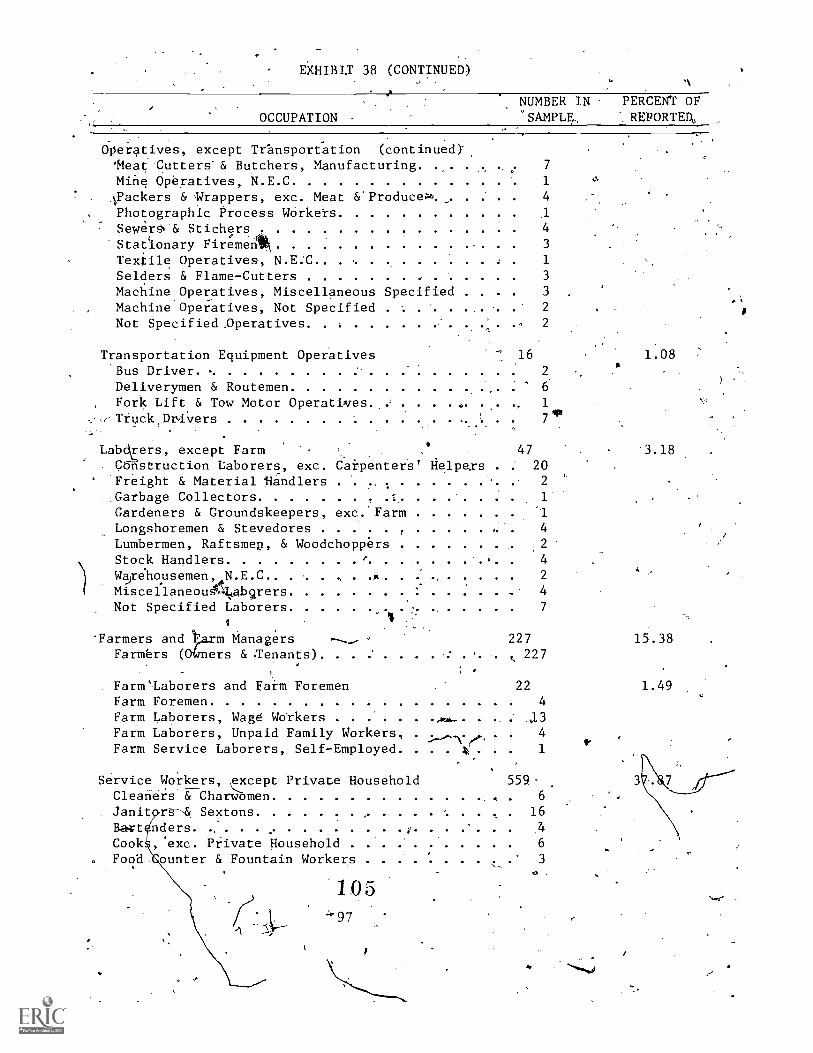
EkHIBLT 38 (CONTINUED), A
OCCUPATIONNUMBER INSAMPL4,
Operatives, except TeansporCation (continue0'Meat 'Cutters & Butchers, Manufacturing . . .
Mine Operatives, N E C. APackers & Wrappers, exc. Meat WProduce
, Photographic Process WOrketsSeWri & Stichers
g.
Stationary Fire'menik
7
1
4
1
4
3
t'
Texiile Operatives, N.E:C 1
Selders & Flame-Cutters 3
Machine.Operatives, Miscellaneous Specified . 3
Machine Operatives, Not Specified . . . .. . . 2
Not Specified Dperatives. .0 , 2
Transportation Equipment Operatives'Bus Driver
16
2a
Deliverymen & Routemen 6.
, Fork Lift & Tow Motor Operatives . . ... .,,. 1
,---TruckpriVers 71*
L b rers, except Farm .47
.
C nstruction Laborers, exc. Carpenters' HelpersFreight & Material Eandlers
.
Garbage Collectors, =.
Gardeners & Groundskeepers, exc.'FarmLongshoremen & Stevedores
r
Lumbermen, Raftsmep, & WoodchoppersStock Handlers ,
Warellousemen, N.E.C.)
abersMisceflaneougikvNot Specified Laborers ....
a
: 202
1
1
4
2
4
2
4
7
-Farmers and tam Managers ----.., °
Fartbrs (0(aners & .Tenants)
Farms-Laborers and Farm ForemenFarm ForemenFarm Laborers, Wage WorkersFarm Laborers, Unpaid Family Workers,
.
Farm Service Laborers, Self-Employed. .
Service Workers, except Private Household
0
- -1Q., .
. .
:..--\ e,o,
4 .
227,, 227
22
4
134
1
559-.
..._
Cleaners & Charwomen 6
Janit rs----4 Sextons 16
Bact nders J ,4'.
Cook , 'exc. Private Household 6
Foo8 ounter & Fountain Workers..._
3
1.05
PERCENT OFREFORTE%
1.08
3.18
15.38
1.49
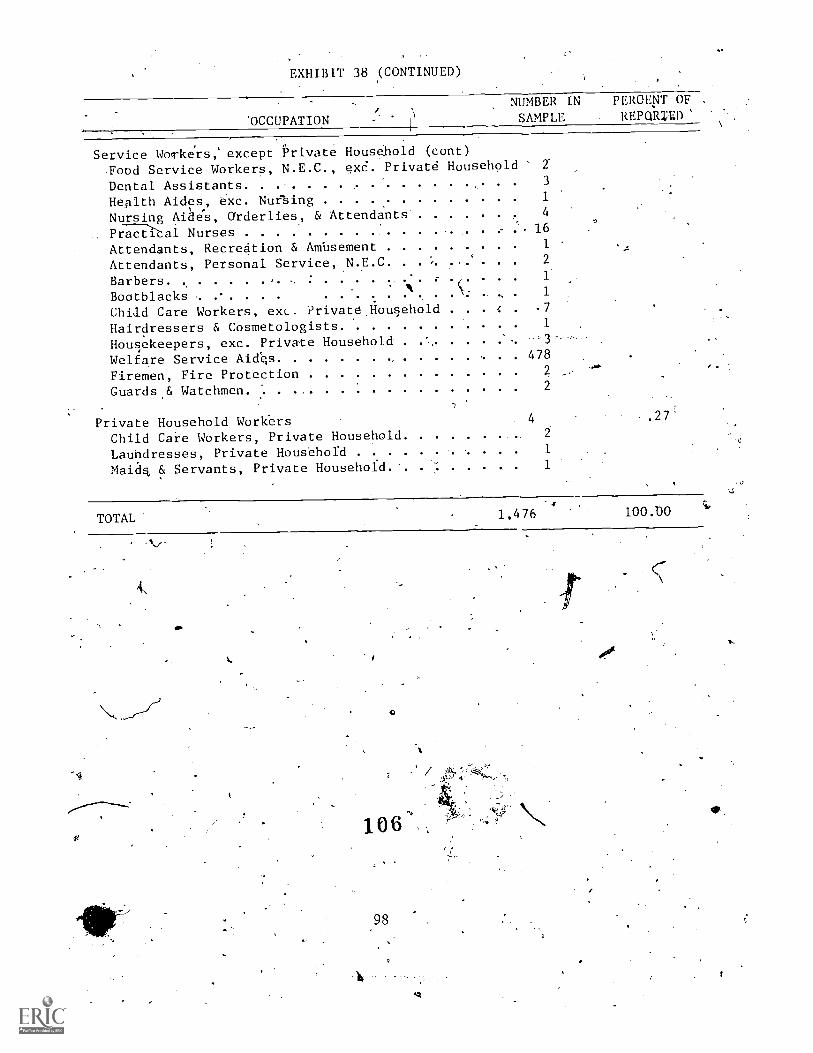
EXHIBIT 38 (CONTINUED)
'OCCUPATION
NUMBER IN PEROENT OF .
SAMPLE REPURZED'
Service Workers, except Private Houshold (coot)Food Service Workers, N.E.C., exC. Privatd Household 2'
Dental Assistants 3
Health Aides, 6xc. Nuesing 1
Nursing Aihe's, Orderlies., & Attendants' 4
Practital Nurses . 16
Attendants, Recreation & Aldusement 1
Attendants, Personal Service, N E C 2
Barbers 1
Bootblacksll 1
Child Care Workers, exc. Private Household 7
Hairdressers & Cosmetologists 1
Housekeepers, exc. Private Household . .., . ..- . 3--
Welfare Service Aidqs 478
Firemen, Fire ProteCtion 2
Guards,& Watchmen 2
Private Household Workers 4
Child Care Workers, Private Household 2
Laundresses, Private Household 1
Maidg & Servants, Private Househofd 1
.27:
TOTAL 1,476 100.00
98
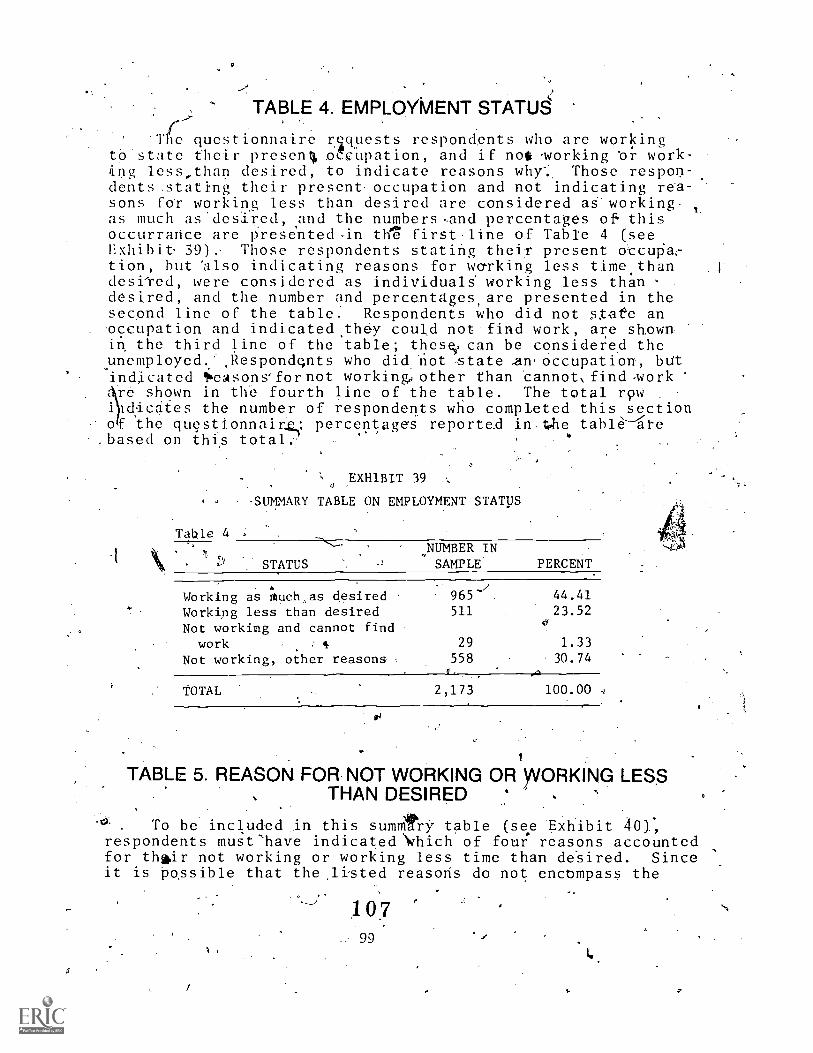
TABLE 4. EMPLOYMENT STATU4
'The questionnaire relquests respondents who are workingto state their presenti6 ociipation, and if no* 'working 'or work-
g less,than desired, to indicate reasons why:. Those respon-dents .stating their present occupation and not indicating rea-sons FOT working less than desired are considered as-working,as much as'desired, and the numbers,and percentages of. thisoccurrance are Prese'nted4n tHvg firstline of Table 4 (seeExhibi 39). Those respondents stating their present Occul5a4-tion, but 'also indicating reasons for warking less time.thandesi-red, were considered as individuals' working less than .
desired, and the number and percentages,are.presented in thesecond line of the table. Respondents Who did not s,tate anoccupation and indicated *they could notfind work, are shownin the third line of the table; these? can be considered theunemployedRespondqnts who did. 'not -state ..an occupation, butindicated 4easons'fornot working,other than eannot,find.work,re shown in the fourth line of the table. The total ri*ildjcaies the number of respondents who completed this sectionof the questionnair4 percentages reported in..4-he tablete
.. ,
based on thi,s total.
EXHIBIT 39
-SUMMARY TABLE ON EMPLOYMENT STATUS
Tab.le 4
t NUMBER INSTATUS SAMPLE PERCENT.
. .
Working as much,as desired 965 44.41
Working less than desired 511 23.52
Not working and cannot findwork , : 29 1.33
Not working, other reasons 558 30.74
TOTAL 2,173 100.00 q
TABLE 5. REASON FOR NOT WORKING OR r/ORKING LESSTHAN DESIRED
'°. . To be included in this sumIlity table (see Exhibit 40).,respondents must'have indicated`Which of four reasons accOuntedfor thadr not working or working less time than desired. Sinceit is possible that the,ltsted reasons do not enclompass the
j[
99
a
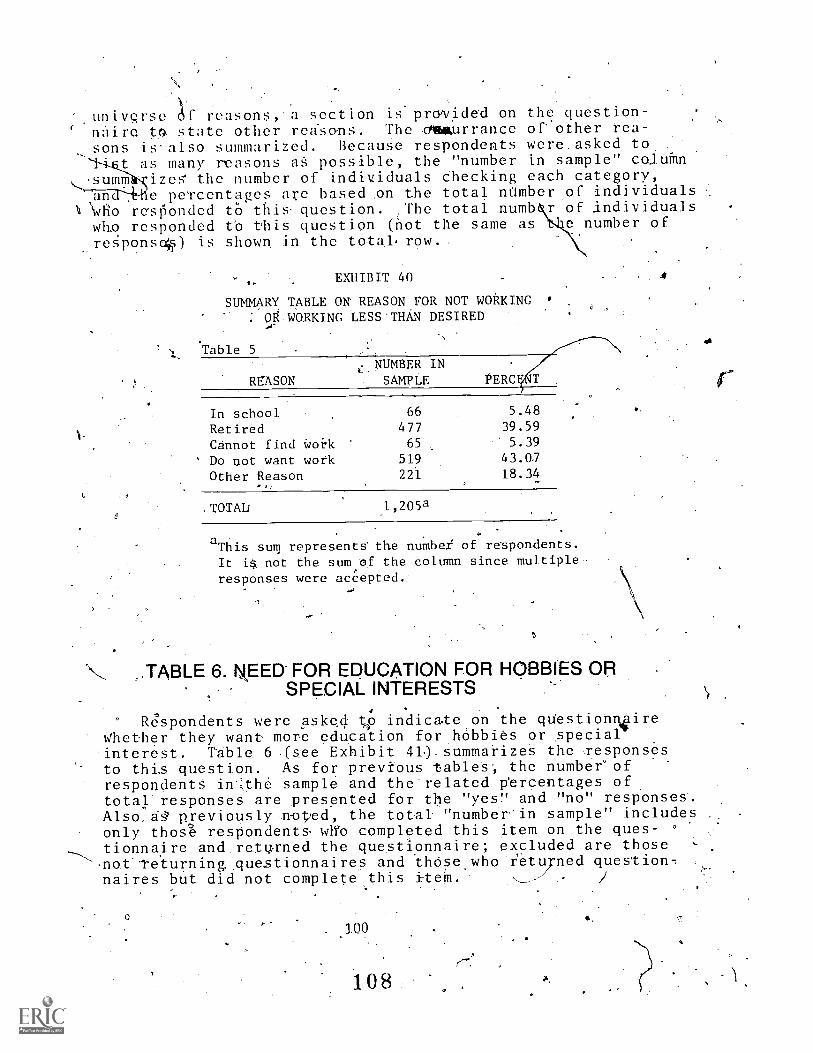
universe L' reasons, a section is.provided on the question-ta state other redsans. The ,oeftlatirrance orother tea-
sons is.also summarized. Because respondents were.asked to, .
t aS many reasons aS possible, the "number in sample" coJuffin
.summ izes' the number of individuals Checking each categoty,an e peTcentages are based on the total number,of individuals
Owfio resOonded to this- question. ,The total numb r of individualswho respondedtb this question (not the same as i&e number ofreSponso;) is shown in the tota* row. .
I. EXHIBIT 40
SUMMARY TABLE ON REASON FOR NOT WORKING *
OI WORKING LESS"THAN DESIRED
1
t.
Table 5
RgASON
c,NUMBER INSAMPLE PERC
In schoolRetiredCannot find Woik
' Do pot want workOther Reason
-,
66
477
65
519221
5.4839.595.39
43.0.7
18.34
.TOTAL _1,205°
aThis suT represents' the numbeY of re'spondents.
It iA not the sum,ef the column since multiple-responses were acCepted.
.,TABLE 6. REED FOR EDUCATION FOR HOBBIES ORSPECIAL INTERESTS
6 4
Respondents were asked tlo indicate_on the qifestionnoireWhether they want more education for hobbies or special''interest. Table 6 (see Exhibit 41).summatizes the xesponsesto this question. As for previous tables the numbeeofrespondentS in.4he sample and the'related p'ercentages oftotal'responses are presented for the "yes." and "no" responses'.Also,à previously n-ot,ed, the total. "number'in sample" includesonly those respondents, wWo completed this item on the ques-tionnaire and retuTned the questionnaire; excluded are those,not'returning_questionnaires and these.who'ietiymed ques.tionnaires but did not complete,this item.
100
108
6,
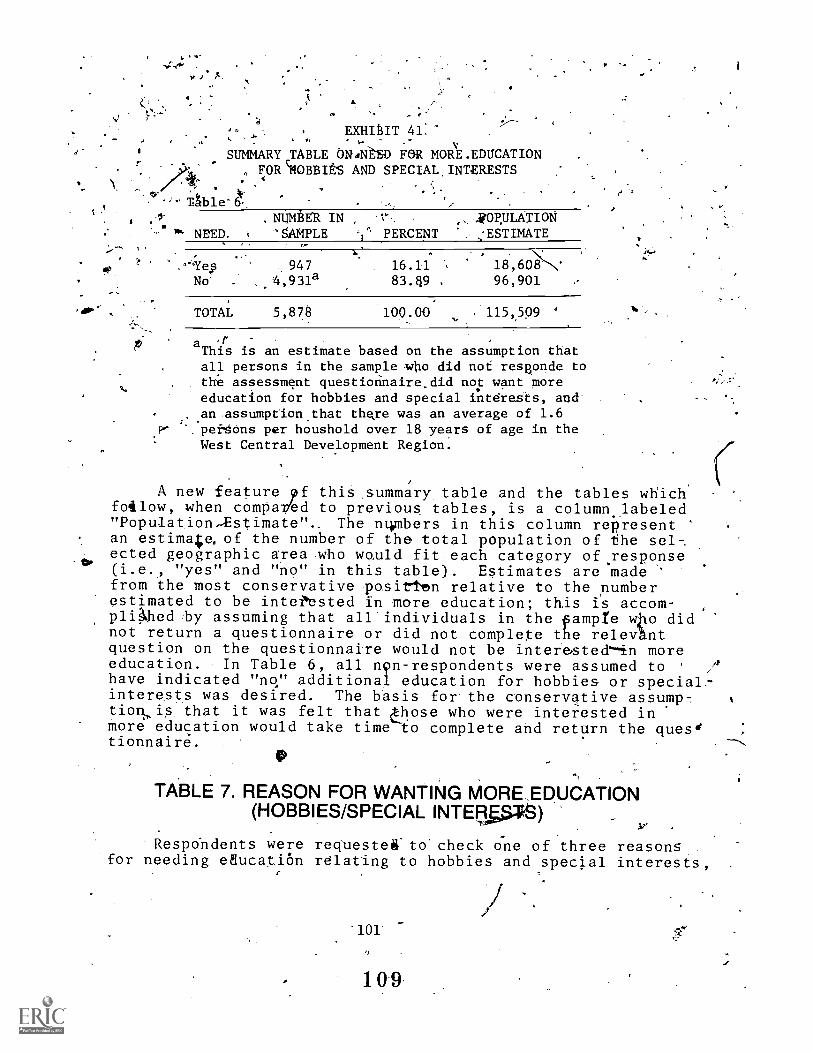
a.-
''', .,.
EXHIBIT 41:l J. . A ,
SUMMARY TABLE ON.NE'ED FeRMORv
E.EDUCATION, FORMOBBIES AND SPECIAL INTERESTS .". .
\.' ,* - ' 4 V . %
Table' 6, .... .
1.10
,
*` NEED.
,NUMBER IN'gAMPLE ' PERCENT
OP,ULATION;ESTIMATE
-
',°66Ye,p
No' .
947
.,4,931a16.1183.$9 .
18,60\k'96,901
TOTAL 5,878 100.00 115009 °
,raThis is an estimate based on the assumption thatall persons in the sample wbo did noe resRonde tothe assessment questiofinaire.did not want poreeducation for hobbies and special intdres-ts, and'.am assumptIon,that thexe was an average of 1.6
..pefOns per houshold over 18 years of age in theWest Central Development Region.
,
A new feature pf this.summary table and the tables whichfollow, when compaybd to previous tables, is a column_labeled"Population,Estimate".. The ntimbers in this column representan estima;e.of the number of the total population of the sel-.ected geographic area who wauld fit each category of.response(i.e., "yes" and "no" in this table). Estimates are madefrom the most conservative pasitten relative to the numberestimated to be intePtsted in more education; this is accom- ,
pliAed :by assuming that all individuals in the fawn willo didnot return a questionnaire or did not complete the relevhntquestion on the questionnaire would not be inter&sted~in moreeducation. In Table 6, all nyn-respondents were assumed to
'
have indicated "no," additional education for hobbies or special.-interests was desired. The basis for- the conservative assump-. 1
tion,is that it was felt that those who were interested inmore education would take time to complete and return the quesdtionnaire. .
TABLE 7. REASON FOR WANTING rviORE EDUCATION(HOBBIES/SPECIAL INTER )
'Respondents were requestel.to'check one of three reasons .
for needing egucatiOn relating to hobbies and special interests,
101
109
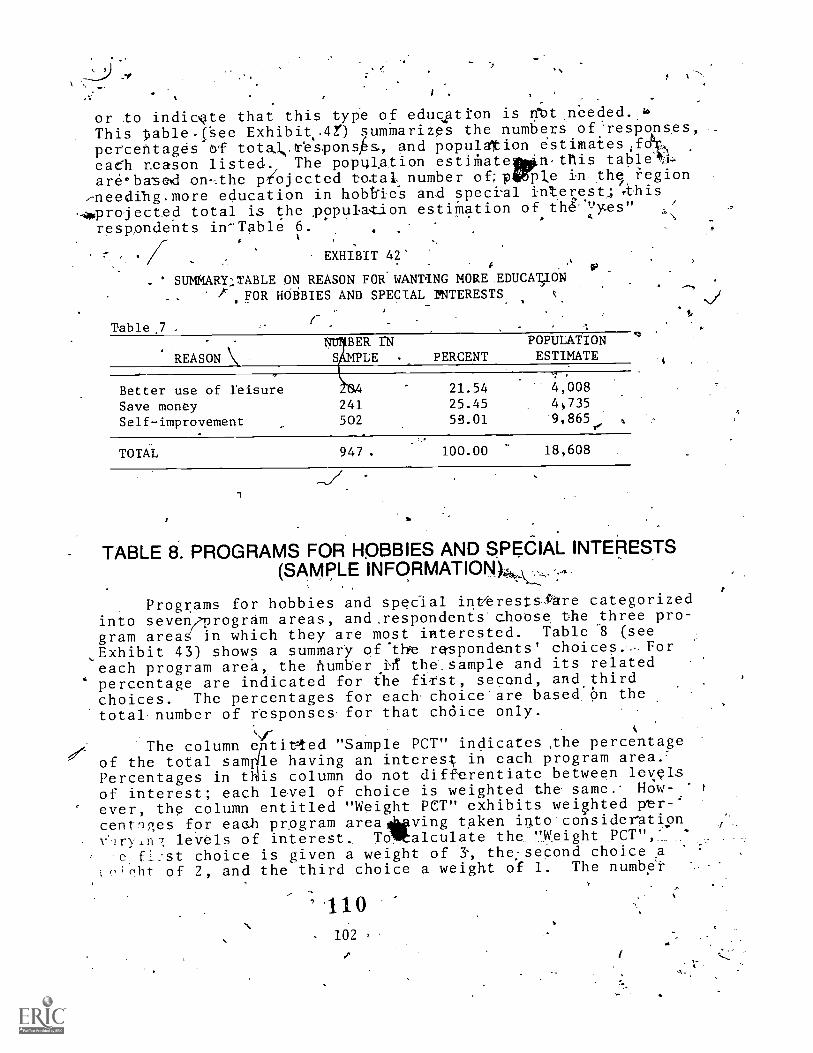
or to indicate that this type of educatkon is dibt..needed..4,
This able,f'see Exhibit4t) summarizes the numbers of 'responses,
percentagés of totak.rresponsks and populaTion estimaies.f4,,eaCh reason listed. The poplaation estithatelmin.this tat;leliL4
are.base%d on,the prOjected total number of;016131e inth'.iegion,-needillg.more education in hobfries and speci-al interest,; this
--4,projected total is the population estiMation of thS.4mes" ./A
respondents in-Table 6. .
EXHIBIT 42'4
- * SUMMARY;TABLE ON REASON FOR-WANTING MORE .EDUCAPNFOR HOBBIES AND SPECIAL INTERESTS._ _
,
Table .7 .
r -
iP
REASON \\_
ImBER rN POPULATION
SAMPLE - PERCENT ESTIMATE
Better use of reisure SASave money 241
Selfimprovement 502
TOTAL 947.
21.54 4,00825.45 4,735
58.01 9,865e %
100.00 18,608
,
TABLE 6. PROGRAMS FOR HOBBIES AND SPE6IAL INTEOESTS(SAMI7LE
Programs for hobbies and special inttrestsOare categorizedinto seven/program areas, and.respondents choose the _three pro-
gram areas' in which they are most interested. Table 8 (see,Exhibit 43) shows a summary ortlete r4spondents' choices. Foreach program area,, the number.ill the_sample and its related
° percentage are indicated for the fil4st, second, and.third
choices. The percentages for each choice'are based On the-total number of responses for that .choice only.
k\if-
The column e titted "Sample PCT" indicates the percentageof the total sam le having an intere in each program area.:Percentages in t is column do not differentiate between lev,elsof interest; each level of choice is weighted the same.- How-.-ever, the column entitled "Weight PCT" exhibits weipted ptr-centqres for eaall program areal/laving taken into considerationl'Ary._n77, levels of interest. TOtalculate the "Weight_PCT",'
eji:st choice is given a weight of 3-, the-'second choicecvht of 2, and the third choice a weight of 1. The numbft
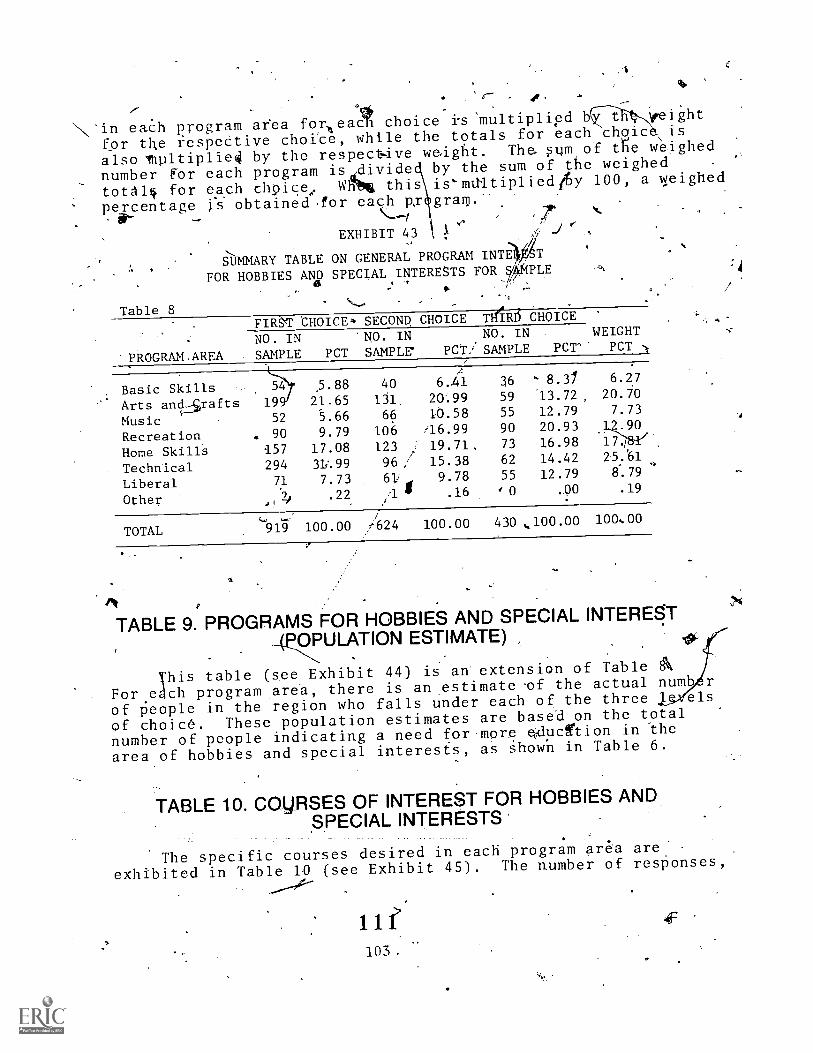
6"-- , 0,
in each program afea foreaCt choice Ps'multiplipd b
q.
weight
for the respettive choice, while the totals for each thoic \is
alsoltultiplie4 by the respect-ive wedght. The vim of t5e weighed
number for each program isddividetotft4 for each choice,. WITig this
percentage is obtained .for each px
EXHIBIT 43
1:1101ARY TABLE ON GENERAL PROGRAM INTE T
FOR HOBBIES AND SPECIAL INTERESTS FOR 7 PLEaby the sum of the weighedis'maltipliedAy 100, a weighedgram.
1
Table 8
PROGRAM,AREA
FIR7T CHOICE,. SECOND CHOICE TFIIRJS CHOICEWEIGHT
PCTNO. INSAMPLE PCT
'NO. INSAMPLE
NO. INPCT/ SAMPLE PCT'
Basic Skills 54 5.88 40 6.41 16 - 8.31 6.27
Arts ancilVafts l99 21.65 131 20.99 59 13.72 20.70
Music 52 5.66 66 10.58 55 12.79 7.73
Recreation . 90 9.79 106 :16.99 90 20.93 L290
Home Skills 157 17.08 123 , 19.71, 73 16.98 17.
Technical 294 31/.99 96,/ 15.38 62 14.42 25.61
Liberal 71 7.73 61 9.78 55 12.79 8.79
Other 21.22 .1 .16 '0 .00 .19
j
TOTAL c-914 100.00 A24 100.00 430 ,100.00 100,00
a
TABLE 9. PROGRAMS FOR HOBBIES AND SPECIAL INTERESTOPULATION ESTIMATE)
This table (see Exhibit 44) is an extension of Table A
For.edch program area, there is an estimate .of the actual numb r
of people in the region who falls under each of the three els
of choice. These population estimates are based on the total
number of people indicating a need for more elducfstion in the
area of hobbies and special interests, as shown in Table 6.
TABLE 10. COWRSES OF INTEREST FOR HOBBIES ANDSPECIAL INTERESTS
The specific courses desired in each program area are:
exhibited in Table IA (see Exhibit 45). The number of responses
103.
:4
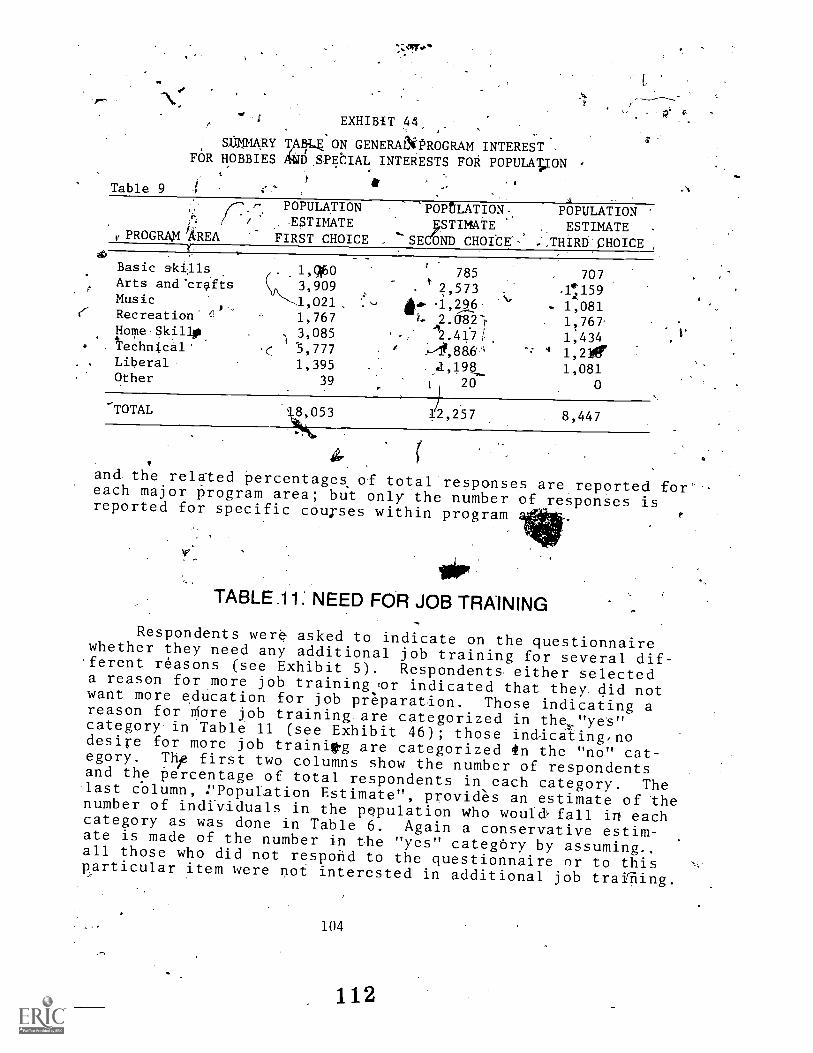
EXHIBIT 44,
WMMARY TABLZ ON GENERANPROGRAM INTEREST -
FOR HOBBIES AtI1D5PEtIAL INTERESTS FOR. POPULATJON -
-Table 9 1
.
POPULATION. 'POPtLATION- POPULATION
, .ESTIMATE psTImAtE ESTIMATE,,PROG aREA FIRST CHOICE _ "SECOND CHOICE': ,:,tHiRb'CHOICE
,
.6
Basic skills 1Apo, Arts and'crafts 3,909
Music 1,021_..
(7. Recreation 6I
1,767
4.Home.Ski110 _ 3, 085
. . Technical' .( 5,777Liberal 1,395Other 39
785 7072,573 . '11159-1,296 1,081
i.. .0821- 11767.12.417 1,434
#1-4,88,6
. _,1,198 1,0811 20 0
-TOTAL HJ.8,053 12,257 8,447
and the related percentages, of total responses are reported for'each major program area; but only the number of responses isreported for specific cow-ses within program
TABLE ,11: NEED FOR JOB TRAINING
Respondents were asked to indicate on the questionnairewhether they need any additional job training for several dif-.ferent reasons (see Exhibit 5). Respondents either selecteda reason for more job training ,or indicated that they. did notwant more education for job preparation. Those indicating areason for 'More job training are categorized in the,"yes"category-in Table 11 (see Exhibit 46) ; those ind-icating,nodesire for more job trainiOg are categorized In the "no" cat-egory. The first two columns show the number of respondentsand the i)ercentage of total respondents in each category. Thelast column, VPopulation Estimate", provides an estimate of henumber of individuals in the population who would5 fall in eachcategory as was done in Table 6. Again a conservative estim-ate is made of the number in the "yes" categOry by assuming.,all those who did not respond to the questionnaire or to thisparticular item were not interested in additional job traiTling.
104
112
4
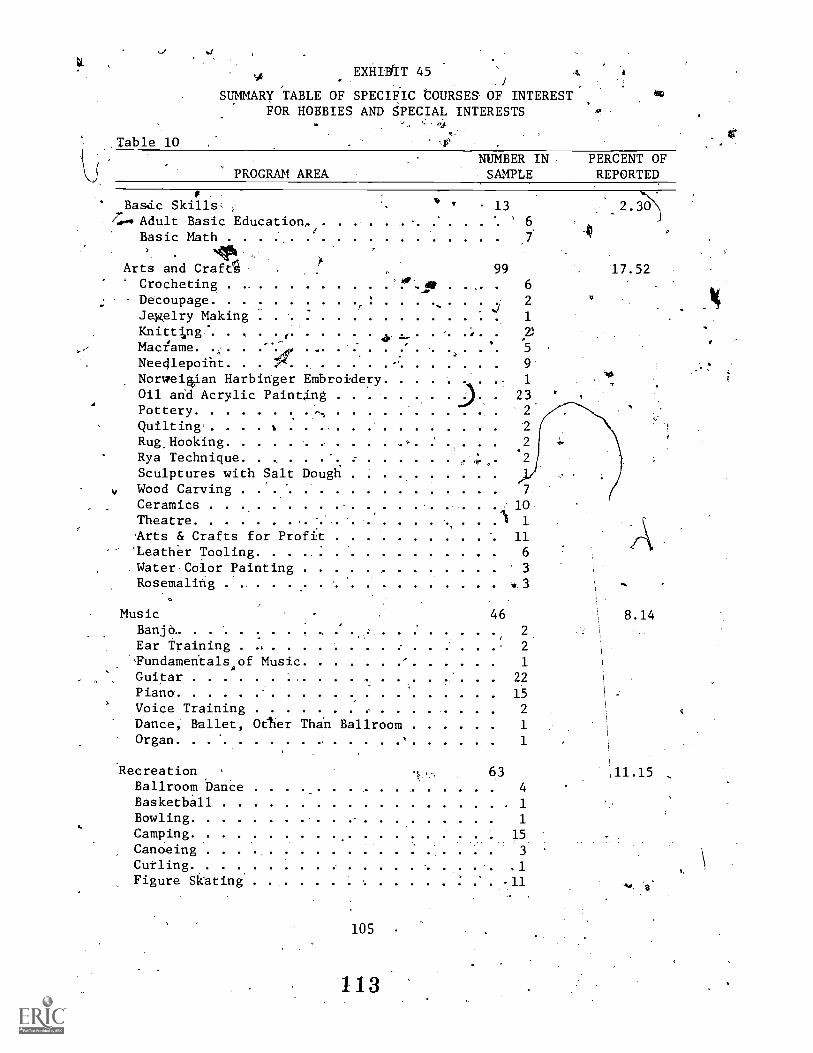
Table 10
EXHIAtt 45A .1
summARy 'TABLE OF SPECIFiC touRsEs OF INTERESTFOR HOBBIES AND SPECIAL INTERESTS
PROGRAM AREA
, .
Basdc Skills;2..... Adult Basic Education,
rBasic Math
If!)'
,
Arts and CraftitCrochetingDecoupage. . .
f
Jegelry Making
NUMBER IN,SAMPLE
lb
' 13' 6
99
-"'"' or . .. . 6
2J.
.
1
KnittIng.... . 4 -- ,P
.,' Macame. ---. .. .. : ... ' . . . 5. . . .
%,'Needlepoint - 9
Norweig,ian Harbinger EmbroideryOil and Acrylic Painang 23 '
Pottery ,, 2
Quilting . . . . a
Rug,Hooking ,
Rya Technique
1
Sculptures with Salt Dough
v Wood Carving 7
Ceramics 10
2
Theatre ...... . , . -,. . . . A 1
Arts & Crafts for Profit 11
'Leather Tooling 6
Water Coior Painting 3Rosemaling v.3
MusicBanje)
Ear training ,
"Fundamenrals of MusicGuitar ... ... ...
,
PianoVoice Training
>
Dance, Ballet, Other Than BallroomOrgan
Recreation ,
Ballroom baileeBasketballBowling
,
CampingCanoeingCurlingFigure Skating
105
PERCENT OFREPORTED
_2.30
17.52
2,,
2
' 1
.... . . 22!
15 1
2 !
,
1 1
, 1\
1
63 \11.154
1
1
15
3
1
11
46 8.14
A.,
113
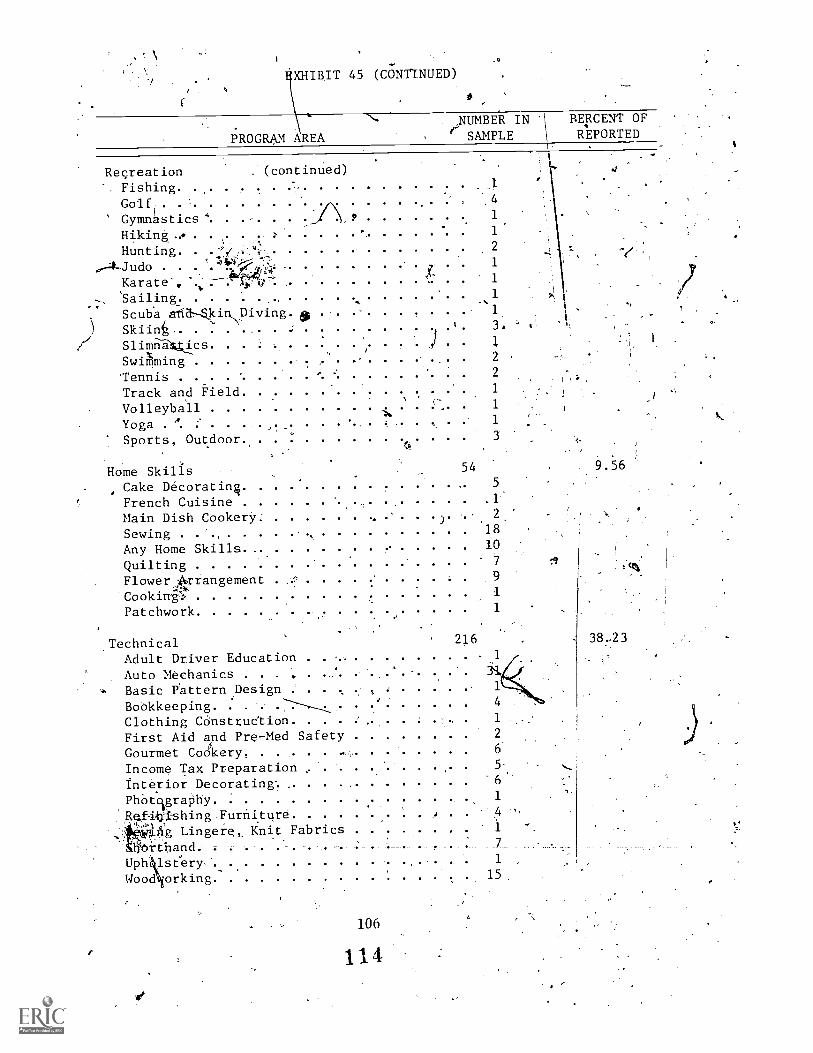
XHIBIT 45 (CONTINUED)
i.ROGRAM AREA
j\IUMBER IN
SAMPLE
BERCENT OFREPORTED
Recreation (continUed)
FishingGolf 4
GymnkstiCs 1
Hiking. 1.
Hunting. .2
,4-Judo??-4.
1
Karate', %v. 1
'Sailing_ 1
1
3,
1
2 .
Scub'a -SkinDiving.Skii4
SwOming'Tennis
Track and FieldVolleyball
Yoga. ... . .... . . .. .
Sports, Outdoor
HoMe SkillsCake Decoratin4 5-
French Cuisine.
Main Dish Cookerji: ...... .
Sewing ,
Any Home SkillsQuiltingFlower itxrangement
Cooking'Patchwork
54
2
1
1
1
3
.TechnicalAdult Driver EducationAuto Mechanics . .
a,
216
. . . . . .
Basic Vattern Design 2 . . , , , .. ......:
BoOkkeeping.,
. . .. .7.:--,..,,,, ... ' ..... . 4
Clothing CdnstructionFirst Aid and Pre-Med Safety 2
Gourmet Codkery ,
6'
Income Tax Preparation 5-
Interior Decorating% - .. .... 6'°
.PhOtigraphyRe.,f-it.shing Furniture
.
Wig Lingere, Knit Fabricstbi6and, ; , ,
Uphiklstery,
Wooaiorking
.
9.56
1
106
114
1
4
7
1
15
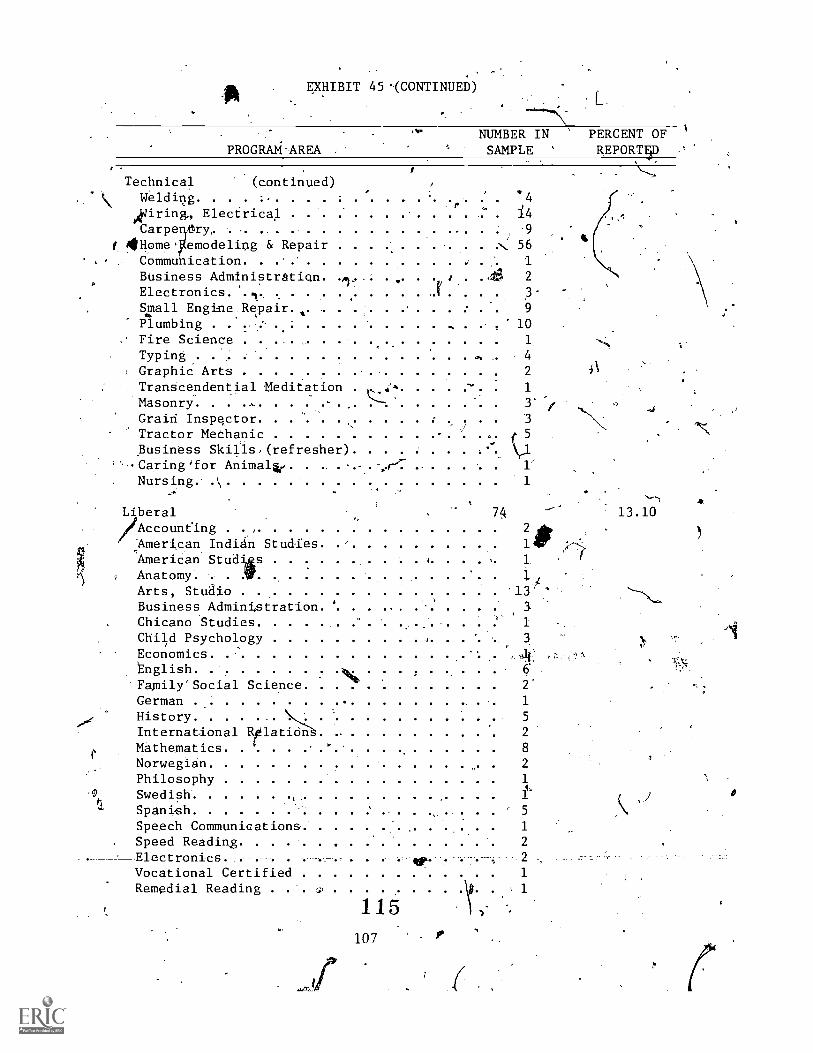
. -
EXHIBIT 45 -(CONTINUED)
%P.
PROGRAti'AREA
NUMBER IN PERCENT OF '
SAMPLE ' REPORTpl
Technical (continued) ,
Weldiug. . . .-. :, .... ; . .... ' .. ... '4peiring, Electrical
.14
Carpery, .. , .. . . - ......... ... -9
f 414ome emodeliug & Repair .s. 56, Commu ication 1
Business Administratidn. .1, J . .4 2
ElectronicsSmall Engine Repair 9
Plumbing ,. 10
Fire Science 1.
Typing, , 4
Graphic Arts 2 4k
TranScendential Meditation ,.44 .....-..1
_
Masonry. .
Graid InspectorTractor MethanicBusiness Skills,(refresher).Caring'for Anima14e. . . .-.-
Nursing \
'-
AccounCing ,
American Indidh Studies '
'American StudiosAnatomy'Arts, StudioBusiness AdministrationChicano StudiesChild PsychologyEconomicsBnglish ,
Family'Social ScienceGermanHistoryInternational RtlatiOnMathematics '
NorwegianPhilosophySwedish.
'.Spanish ....... :.Speech Communications.'Speed ReadingElect-roni-cs
Vocational CertifiedRemedial Reading . .
3,
3
Q-..-..r. .. -. . 1-
1
74, 13.10
2g,1-4W
I ' 1 : r
1
..
r,
'13
.
3
1
3
5 6 .
2"
1
5
2
8
2
1
l' 0,: . . .
, 5
1
2
q. 2 ,
1
. 1
115107
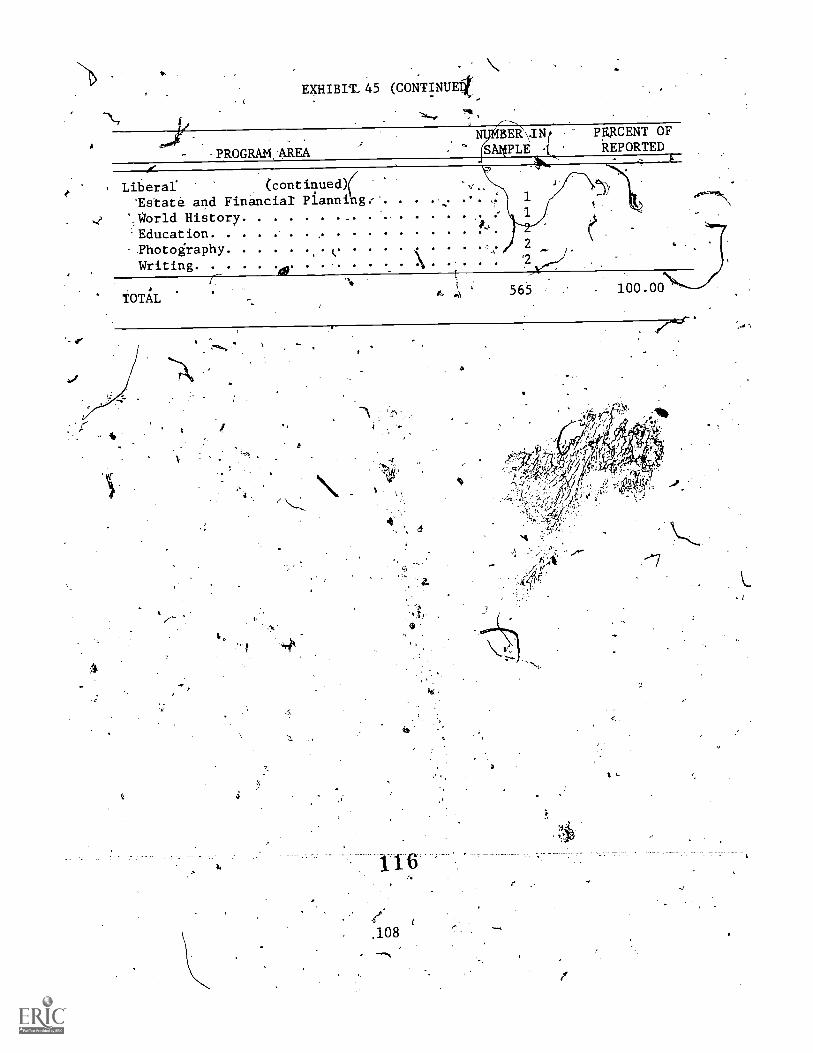
EXHIBIT-45 (CONTINUE1
-PROGRAM:AREA
Lil;erar (continued'Estat6 and Financial Planning/ .
orld History'Education. PhotographyWriting
BERNINt PRZCENT OF
SA4PLE 4 REPORTED,
TOTAL
' 6
116
,108
"'"`
4
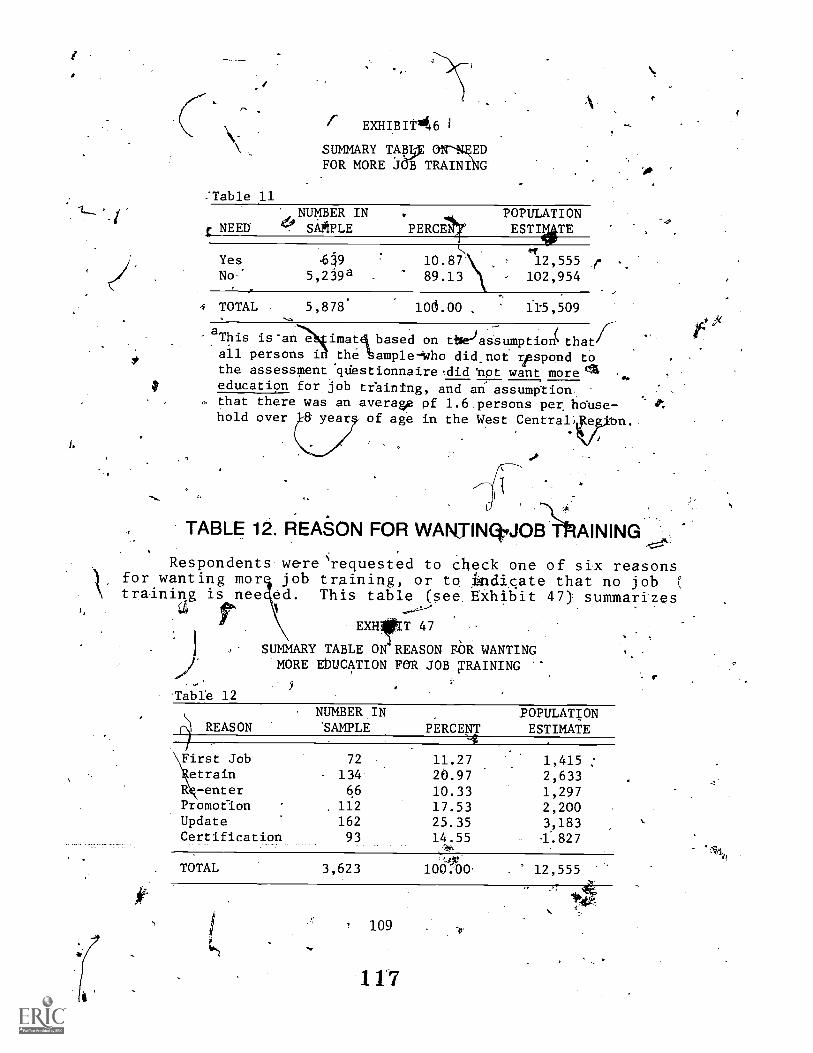
I.
EXHIBITA6 1
SUMMARY TABV ON--NEEDFOR MORE j01 TRAINING
:Table il
c NEEUNUMBER IN POPULATION
4? SAAPLE PERCE
619 12,555 r5,239a 102,954
115,509
YesNo
TOTAL 5,878'
This is-an e imatel based on tbelas.sumption:thatia .
ail persons i the bample-'Who did.not rpspond tothe assessment *clUestionnairedid tpt want more 1411education for job tfainfng, and an'assumption.
. that there was an averagg pf 1.6.persons per. liduse-hold over 8. year of age in the West Central; on..
8
10.87)9.13
106.00 .
0+.
-.e
TABLE 12. REASON FOR WARTINCtoJOEIAINING
Respondents wererequested to check one of six reasonsVfor wanting mores job training, or to Lndicate that no jobtrainiag is nee ed. This table (see.Exhibit 47) summarizes
EXIt T 47
4' SUMMARY TABLE ON REASON YOR WANTINGMORE EbUCATION FOR JOB XRAINING
'Table 12
REASONNUMBER INSAMPLE PERCENi
POPULATIONESTIMATE
First Job 72 11.27 1,415 :etrain 134 20.97 2,633
R -enter 66 10.33 1,297Promotion 112 17.53 2,200Update 162 25.35 3,183Certification 93 14.55 .1.827
TOTAL 3,623 100:00.- 12,555
109 -4
117
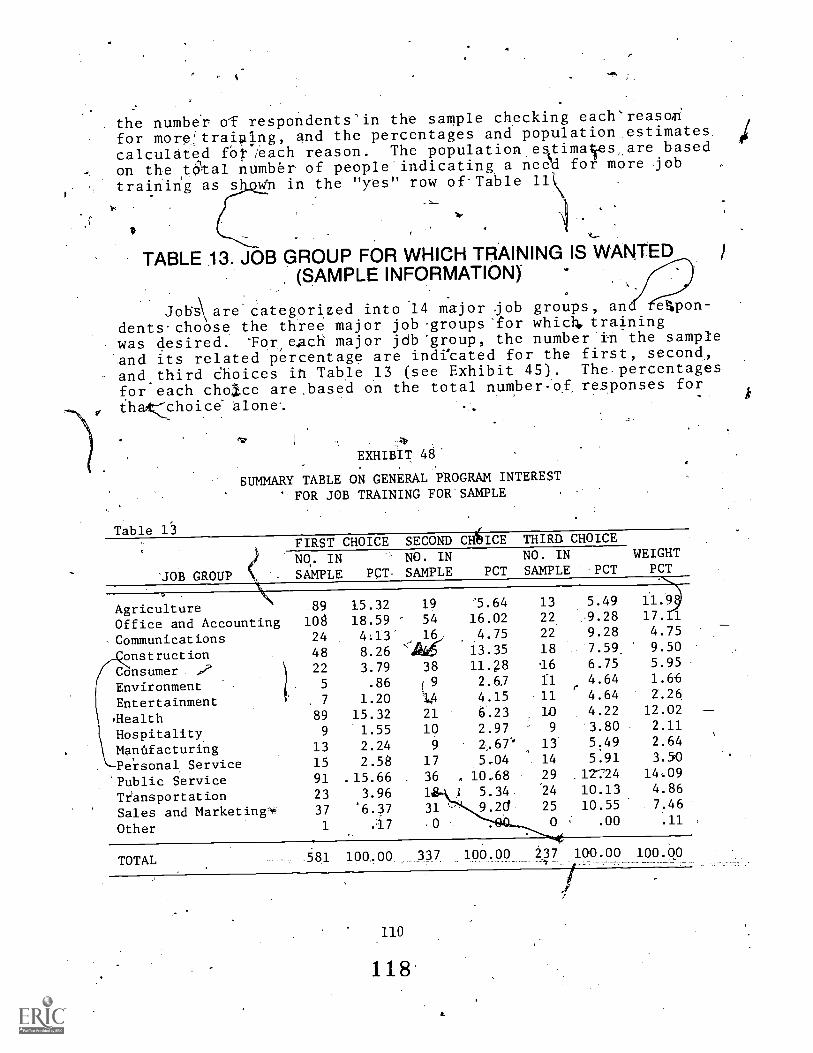
.the number aT respondents'in the sample checking each'reasarifor more:trailalng, and the percentages and population estimates.
calculated fot.,each reason. The population.esttimaies,.are based
on the itoltal nUmbèr of people'indicating a need for more job
training as s Wn in the "yes" row of-Table 11
11"
TABLE 13 JOB GROUP FOR WHICH TRAINING IS WANTED. (SAMPLE INFORMATION)
Jobare'categorized into -14 major job grolips, an e4pon-
dents-choose the three major job .groups'for whic1-4, training
was.desired. Tor each major.jdb 'group, the number 'in the sample,
'and its related percentage are indfcated for the first, second,and.third choices ih Tahle 13 (see Exhibit 45). The.percentages
for each choice are.based on the total numberof responses forthatchoic& Alone%
EXHIBIT 48
SUMMARY TABLE ON GENERAL PROGRAM INTEREST
FOR JOB TRAINING FOR'SAMPLE
Table IAFIRST CHOICE
'JOB GROUP
AgricultureOffice and AccountingCommunicationsConstructionConsumer r?EnvironmentEntertainmentsHealthHospitalityManffacturingPersonal Service'Public ServiceTiansportationSales and Marketing*Other
TOTAL
N0. INSAMPLE PQT-
89 15.32
108 18.5924 4.13
48 8.2622 3.79
5 .86
7 1.20
89 15.32
9 1.55
13 2.24
15 2.58
91 .15.6623 3.96
37 '6.37
1 .17
581 100.00
SECOND C ICE
NO. INSAMPLE PCT
19 '5.64
54 16.02
16 4.7513.35
38 114,8
f 9 2.6Y
1A 4.1521 6.2310 2.97
9 7.67
17 5.04
36 , 10.68
1 5.34
31 9.20
THIRD CHOICENO. IN WEIGHTSAMPLE PCT PCT
13 5.49 11.9
22 9.28 17.
22 9.28 4.75
18 7.59 9.50
.16 6.75 5.95
ll 4.64 1.66
11 4.64 7.26
10 4.22 12.02
9 3.80 2.11
13 5.49 2.64
14 5.91 3.50
29 12:24 14.09
'24 10.13 4.86
25 10.55 7.46
.00 .11
337 100.00 237 100.00 100.00
110
118
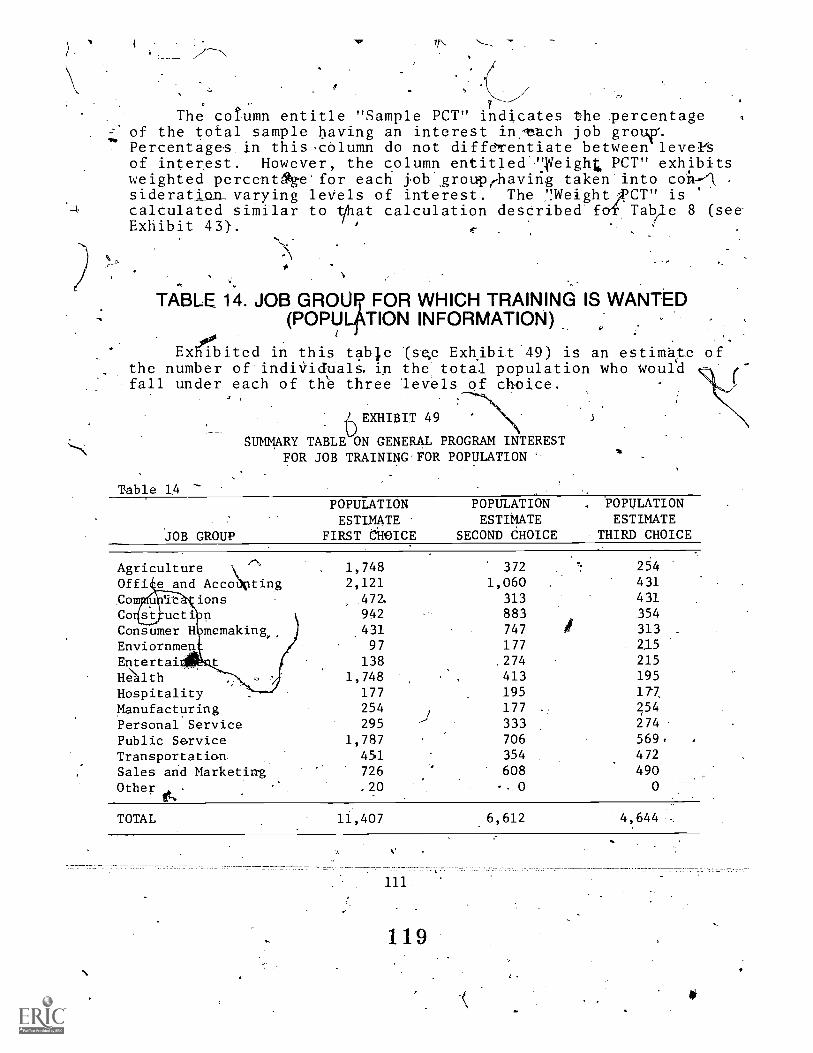
71, ----- 7,
,
The cotumn entitle "Sample PCT" indicates the Tercentageof the total sample having an interest in.'ea.ch job groV.Percentages in this,cOlumn do not diffeTentiate between leveltof interest. However, the column entitlecllleight PCT" exhibitsweighted percentdtge'for each j.ob'zrouprhaving taken'into coh-,.-- ,
sideration varying leVels of interest. The !!Weight CT" iscalculated similar to Oat calculation described'f Taye 8 (see-
Exhibit 43}. , ,
TABLE 14. JOB GROU4 FOR WHICH TRAINING IS WANTED(POPU TION INFORMATION)
Exebited in this tab'e .(se,e Exhibit.49) is an estimatethe number of indiViduals. in the total population who woul'dfall nnder each of the three levels of choice.
EXHIBIT 49
SUMMARY TABLE ON GENERAL PROGRAM INTERESTFOR JOB TRAINING'FOR POPULATION '
Table 14
JOB GROUP
POPULATIONESTIMATE
FIRST O'HOICE
POPULATIONESTIMATE
SECOND CHOICE
, POPULATIONESTIMATE
THIRD CHOICE
/\Agriculture \
Offi e and AccApting.Com ionsCo ucti PConsumer H memakingEnviornmenEntertai\Health
HospitalityManufacturingPersonal ServicePublic ServiceT ransportationSales and MarketingOther
1,7482,121
472.
942
.43197
1381,748
177254295
1,787451726
.20
372
1,060313883747
177
.274
413195177333
706354
608. 0
1
2544314313543132.15
215195
177.
254
274
5690472490
0
TOTAL 11,407 .6,612 4,644 ,
of
111
119

TABLE 15, JOBS FOR WHIQH TRAINING IS WANTED. ;
The pecific jobs for Whic is desifed ih eachjob grottp aresihown in this table (seehibit.50). The numberin the s mple and the related percentages are reported for eachmajor oc upationarcatetory but only the number' in the,sample.
is reported for specifi'c occup ions within major occupational_categories. The:percentage. iu the "Percent of Reported" columnare bas-ed 'only on,,those responding to thds item on the question-
4.,
TABLE 16. NEEp FQR MORE EDUCATION'
:Table 16 (see Exhibit\'51) summarizes the total intel-etmorp education, combining he interest in more education fof .hobbies apd specia interests as well as for job training.
) - Respondenks are co nted only once in,this summary table even) if they responded t bo h the sections on interest in,hobbiesN and specjalintexest ancL,n job training. Informafion is pre-
sented for number of repondents indicating either or both types (
of interest, the pexcentage in each,category and an estimatefor the population.
TABLE 17. TIME WHEI.MORE EDUCATION COULD bE ATTENDED
This table (see hibit 52) summa:iizes the times when re-spondents can be avai IN.v6 for more educatidh. For each timeor time combination, thendmber in the sample for whom thistime is' donvenient is indicated together with the relatedpercentage and population estimate. Population estimates arebased on the estimated number of the population who would re-spond "yes" to interest in more education as shbwn in Table 16.
r.TABLE la: HINDRANCES TO ATTENDING'EDUCATIONAL PROGRAMS
Ftom the listed nine hindrances' to attending educational'programs, therespondents_ were ractusted_to check as pany as
120112
4
f
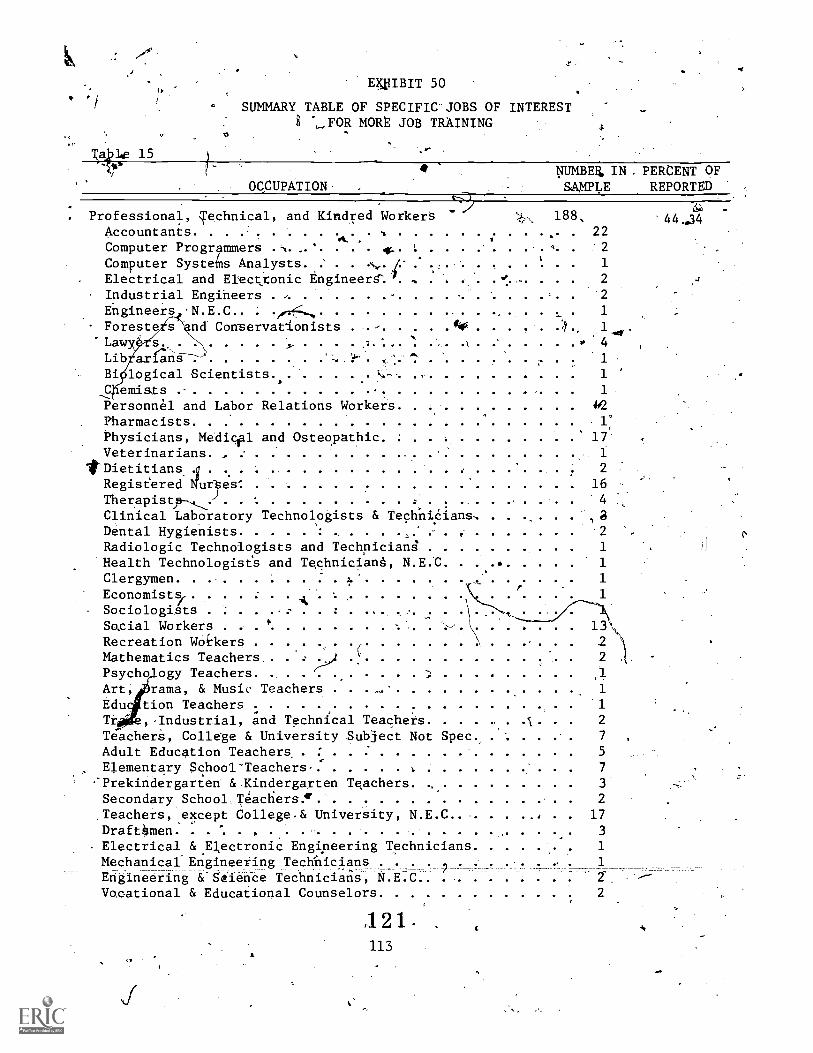
T10140 15
ENUIBIT 50
SUMMARY TABLE OF SPECIFIC-JOBS OF INTEREST1,FOR MORB JOB TRAINING
OCCUPATION-
-'
c--,
, Professional, Technical, and Kindred Workers /Accountants %
Computer Programmers .--,. ..'. . . . ir. . L ....Computer Systeilis Analysts . .' .. ....,..1.- : ..Electrical and Elect_tonic Engineera-.1. ,Industrial Engineers - ,
Engineers 'N.E.C.. . ..,,,,rA,
Forestisnd Conservationists . - . .... 40"Law s
Lib arana- .
Bi logical Scientists k-- .
. ..
,,,, 188,
22*
.
.... A.. 21. ..... 1
2, 2
1
..... :4 ., 1 40.,4
,-1
1
NUMBEll IN PERCENT OFSAMPLE REPORTED
6;)
44..34
C emists , 1
Personnel and Labor Relations Workers 4#2,
Pharmacists r,
Physicians, Medicial and Osteopathic 17Veterinarians. , 1
*Dietitians. i.
2
Regiseered Nures 16
Therapisty 4. ,
Clinical Laboratory Technologists & Technicians,Dental Hygienists A f
2 ,
Radiologic Technologists and Technician4 1
Health Technologist's and Technic1an6, N.E.C. . . . . 1:
Clergymen 1
Economists/ A
Sociologi,sts .
So,cial Workers . .
Recreation WorqcersMathematics Teachers
,
.--')Psycho ogy Teachers ,,
Art, rama, & Music Teachers 1
Edu tion Teachers 1
Tr ,-Industrial, and Technf.cal Teachers 2
Teachera, College & University Subject Not Spec., . : .. 7
Adult Education Teachers, 5
Elementary School'Teachers, 1. . . ...... . 7
..Prekindergarten & Kindergarten Teachers-.
3
Secondary School Teactiers e 2
,Teachers, .except College.& University, N.E.C. . . 17,
Drafthmen . 3
Electrical &.Electronic Engineering Technicians 1
Mechanical-Engineering Techilicians . . . . . , 1
Eniineering Sigaience Technicians, N.E.C.Vocational & Educational Counselors 2
.121 -
113
2' ----
.
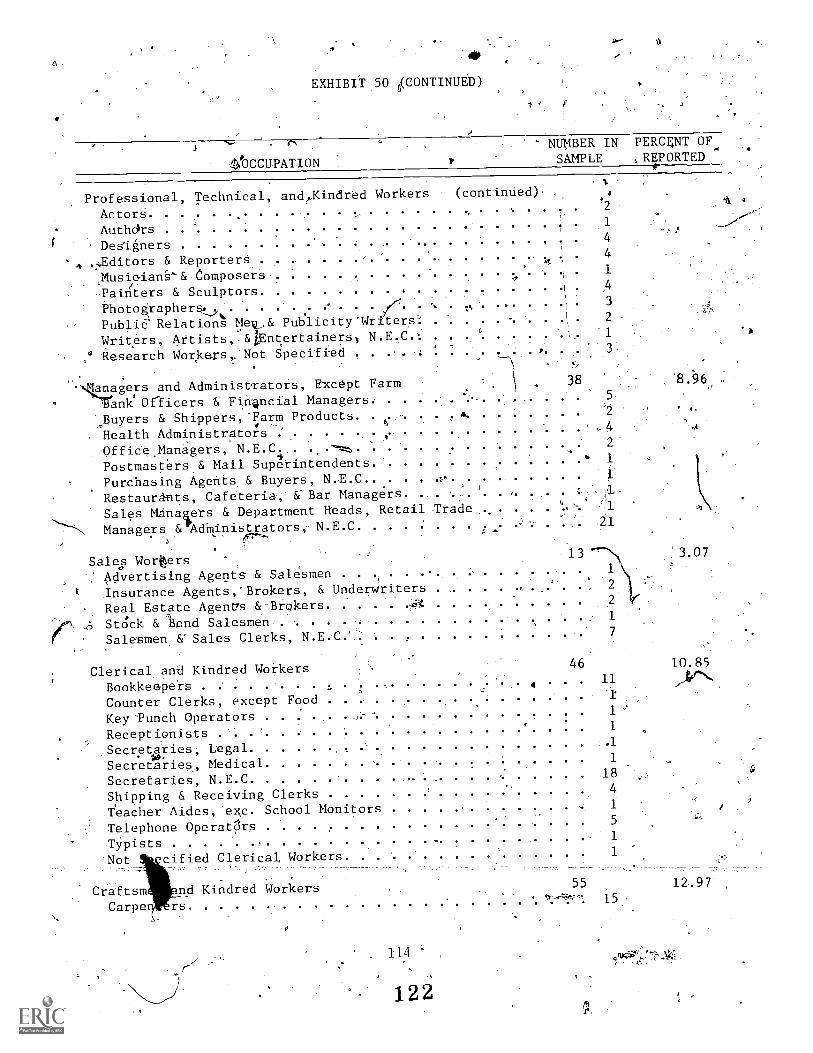
F
,
.40
EXHIBIT 50 pONTINUED)
,
4tCCUPATION
Professional, Technical, ancle,Kindred Workers
ActorSAuthdrs
' DesIgners, 4Editors & ReporterS. ,
,Music-ian'S-& Composer's;
-Pain(ters & Sculptors
Photographers.;
4 ---/
Public Relations Me & Pub.licity"Wr"ter,
Writers., Artists,. ncertainers; N.E,C -:
,4 Research Workers, Not Specified
NUNBER INSAMPLE
PERCENT OF..
,REPORTED
(continued),u . .
,
4
.
.
,
: ,
. s4,
f2
1
4
4
1
3
2
1
a'a
4
k
*qan_agers and Administrators, Except Farm
Tank Oflicers & Fin4hcial Managers.: . , .. .
Buyers & Shippers,'Farm Products. . A.
..
_.. -. 4 ,f,
2
1
1
c 1.
Health AdministratorsOffice,Managers, N.E.C.;:. .
Postmasters.& Mail SuperintendentsPurchasing Agents. & Buyers, N.E.C. . .. .. :k.
ResteurAnts, Cafeteria,'&'Bar Managers. ,... .
u
Sales Manaaers & Department Heads, Retail trade
Managers 8(vdilinistrators,- N E C
Sales Worters4'vertis1ng Agents & Salesmen
,
13
!
k.:Insurance Agents,'Brokers, & Underwriters
21
3.07
Real Estate Agent's &.-Brokers . : ...4; Stack & lond Salesmen
Salesmen &" Sales Clerks, N E 'C
Clerical and Kindred Workers
....4
46
21
7
Bookkeepei-s 411
Counter Clerks, except FoodKey °Punch Operators
1
Receptionists1
Secretaries, Legallos.
Secretaries., Medical
.1
1
Secretaries, N . E . C . . , ..... 18
Shipping & Receiving Clerks 4
Teacher Aides, 'exc. School Monitors 1
Telephone OperatPrs5
TYpists. I
'Not gcified Clerical, Workers 1
10.85
,
'
Oraftsm nd Kindred Workers 55 12,97
Carpe rs15
114
122
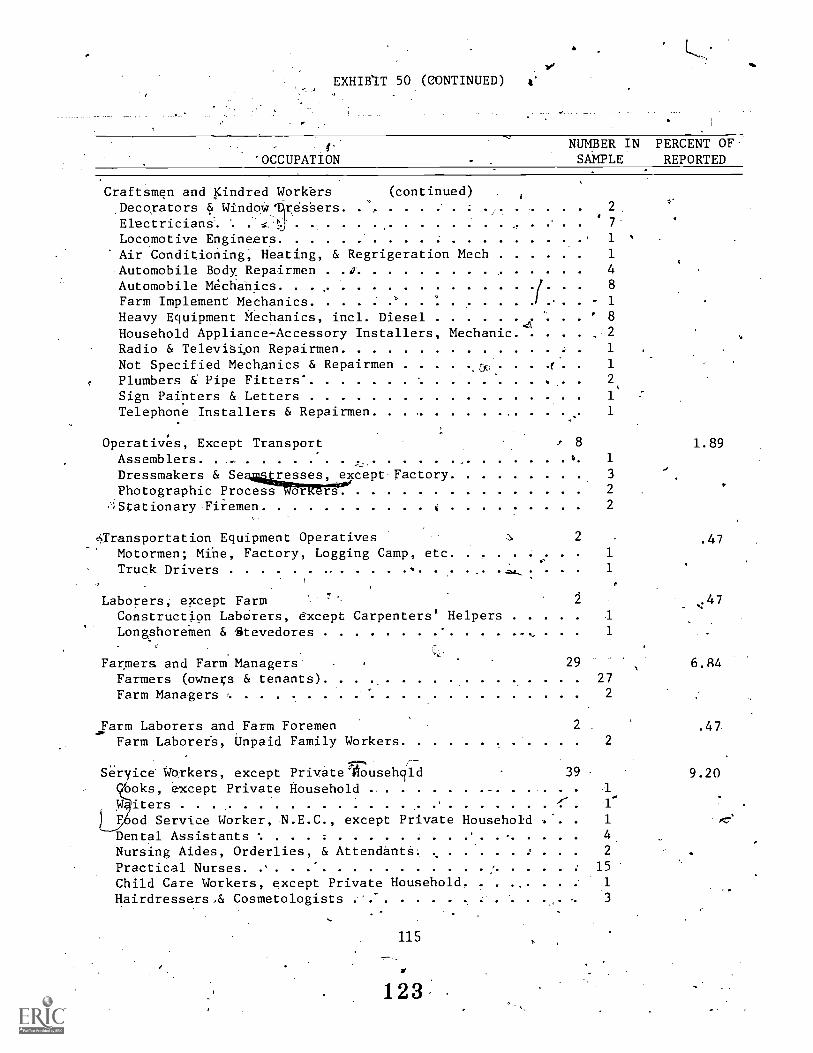
%la
EXHIBIT 50 (CONTINUED)
NUMBER IN PERCENT OF'OCCUPATION SAMPLE REPORTED
Craftsmen and Kindred Workers (continued),Decorators & WindoW:1)fresSers 2.
Electricians'. '.....,d 7'
Locomotive Engineers 1 '
Air Conditioning; Heating, & Regrigeration Mech 1
Automobile Body. Repairmen ir 4
Automobile Mechanics 8
Farm Implement Mechanics I . 1
Heavy Equipment Mechanics, incl. Diesel 8-4
Household Appliance,-Accessory Installers, Mechanic 2
Radio & Televisipn Repairmen 1
Not Specified Mechanics & Repairmen a. .(.. 1
Plumbers & Pipe Fitters- . 2
Sign Painters & Letters 1'
Telephone Installers & Repairmen. ..... . ..... 1
Operatives, Except Transport if 8
Assemblers. o 1,Dressmakers & Sea,iialsesses, .except Factory 3
,Photographic ProceT7TrOreglIr" 2
.Stationary Firemen 2
JTransportation Equipment Operatives a 2_.
Motormen; Mi,- ne, Factory, Logging Camp, etc 1,
Truck Drivers .-2.a., : '
1
-r---...
Ser ice Wqrkers, except Privatellousehcirld 39
ooks, except Private Household .. ....... -. . . 1
1.89
.47
Laborers, except FarmConstruction LabOrers, e-xcept Carpenters' Helpers 1
LongshoreMen & -Stevedores 1
Farmers and Farm Managers 29 6.84Farmers (owners & tenants)
.
27.
FarmManagers .. . .. . ............. 2
.47
Farm Laborers and.Farm Foremen 2 . .47Farm Laborer's, Unpaid Family Workers
0
2
9.20
W,iters. .
,
'..- 1'
{_pod Service Worker, N.E.C., except Private Household . . 1
Dental Assistants 4.
Nursing Aides, Orderlies, & AttendantS 2
Practical Nurses ' 15
Child Care Workers, except Private Household, 1
Hairdressers,& Cosmetologists ' 3
115
123'
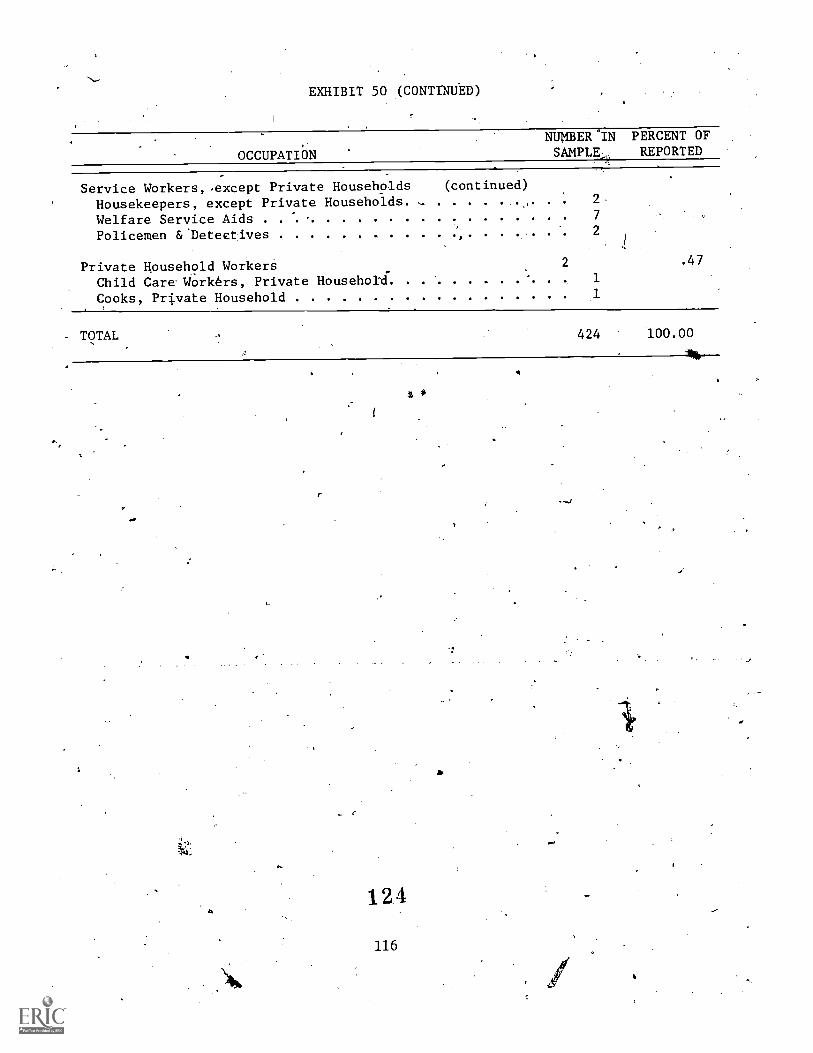
-
EXHIBIT 50 (CONTINUED)
OCCUPATION
NUMBER'INSAMPLE.
PERCENT OFREPORTED
Service Workers, .except Private Households (continued)
Housekeepers, except Private Households. .. .. . . 2
Welfare Service Aids 7
Policemen 6f.Detectives 2
Private Household WorkersChild Care Workers, Private Househo llf
2
1
47
Cooks, Private Household
TOTAL 424 100.00
12.4
116
s #
a.
ow.
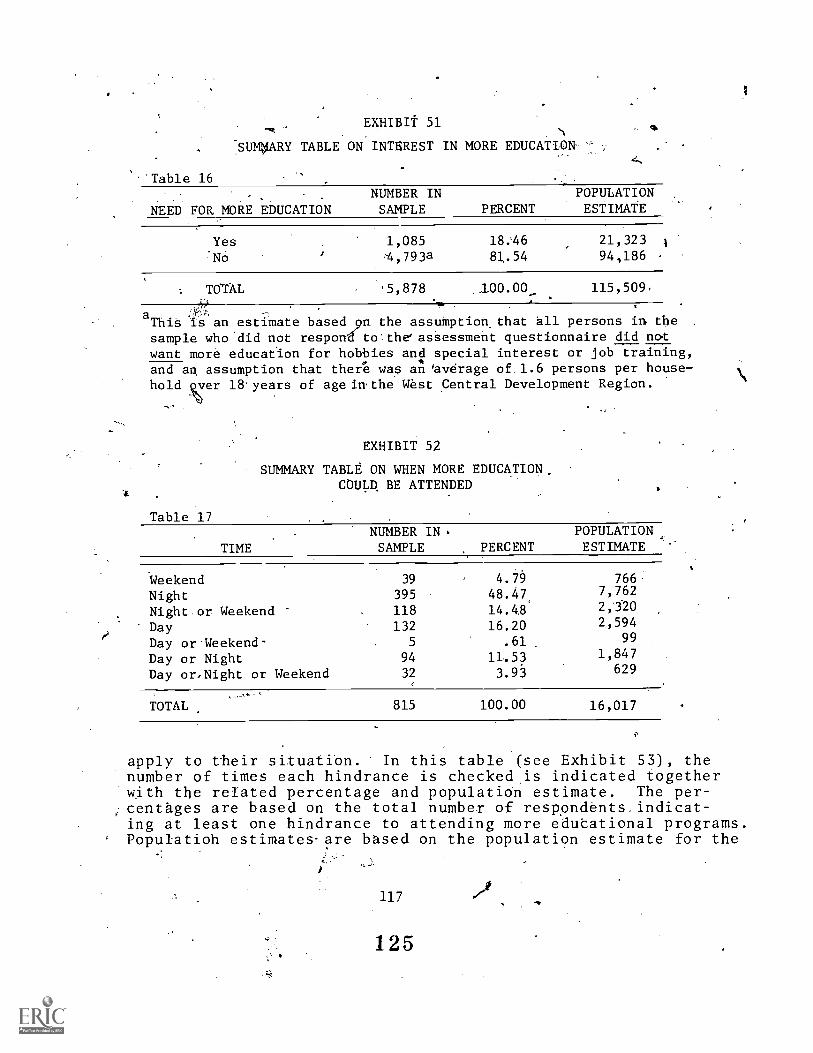
EXHIBIt 51
SUMtiARY TABLE ON INTEREST IN MORE EDUCATION- -
'Table 16NUMBER IN POPULATION
NEED FOR MORE EDUCATION SAMPLE PERCENT ESTIMATE
Yes 1,085 18.446 21,323
:No --4,793a 81..54 94,186 -
'MAL '5,878 100.00:"
115,509,
aThia iS an estiMate based on the assuffiption that all persons in thesample who'did not respondto'the'asSessment questionnaire did notwant more education for hobbies and special interest or job training,and an asSumption that there was an daNdrage of. 1.6 persons per house-hold ever 18;years of age lathe West Central Development Region.
EXHIBIT 52
SUMMARY TABLE ON WHEN MORE EDUCATION.COULD BE ATTENDED
Table 17
TIME
NUMBER IN,SAMPLE PERCENT
POPULATION.ESTIMATE '
Weekend 39 4.79 766
Night 395 48.47. 7,762
Night or Weekend 118 14.48 2,320
Day 132 16.20 2,594
Day or Weekend- 5 .61 99
Day or Night 94 11,53 1,847
Day or,Night or Weekend 32e
3.93 629
TOTAL 815 100.00 16,017
apply to their situatibn. In this table (see Exhibit 53), thenumber of times each hindrance is checked,is indicated iogetherw.ith the related percentage and populatioh estimate. The per-
r.centages are based on the total numbeT of respondents.indicat-ing at least one hindrance to attending more edutational programs.Populatioh estimates-are based on the population estimate for the
117
125
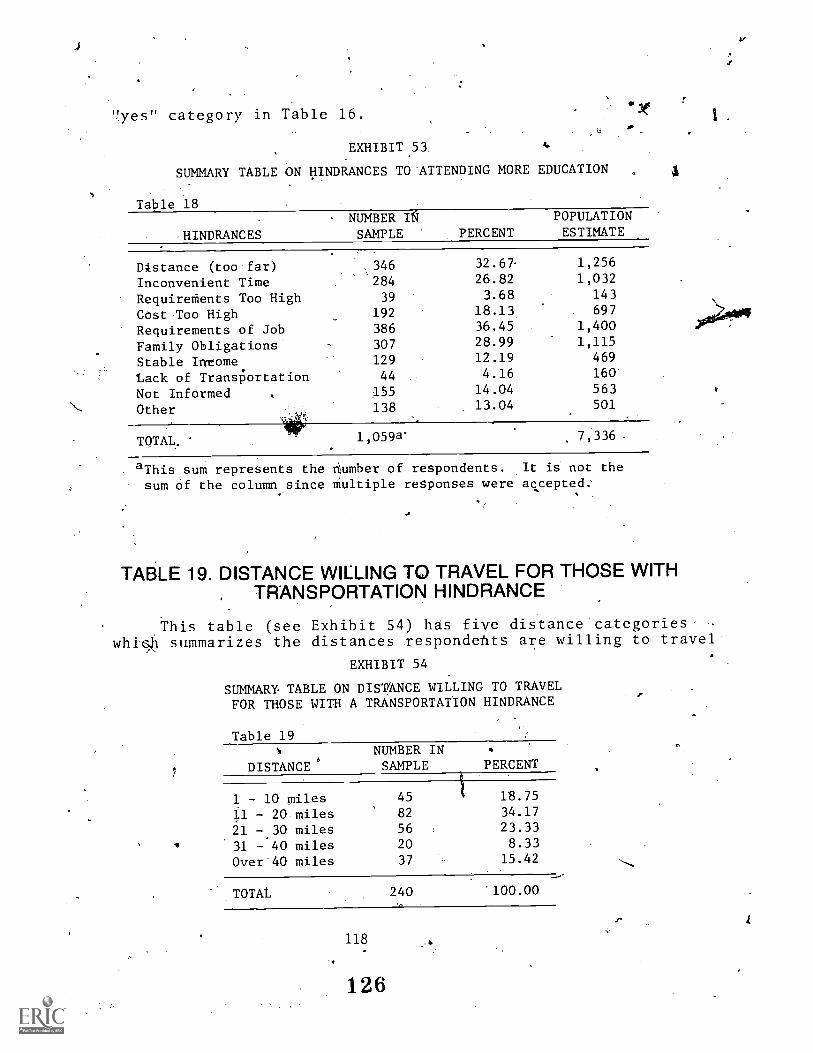
"yes" category in Table 16.
.EXHIBIT .51
SUMMARY TABLE bri HINDRANCES TO'ATTENDING MORE EDUCATION
Table 18
.HINDRANCES
- NUMBER ISAMPLE PERCENT
POPULATIONESTIMATE
Distance (too far) ,346 32.67 1,256
Inconvenient Time 284 26.82 1,032
Requireffients Too High 39 3.68 143
Cest.Too High 192 18.13 697
Requirements of Job 386 36.45 1,400
Family Obligations 307 28.99 1,115
Stable Inrome 129 12.19 469
Lack of TransPortation 44 4.16 160'
Not Informed . 155 14.04 563
Other..-?;
138 13.04 501
TOTAL. 1,059a* 7,336
aThis sum represents the number of respondents. It is not the
sum of the column since Multiple responses were accepted.
TABLE 19. DISTANCE WILLING TO TRAVEL FOR THOSE WITH, TRANSPORTATION HINDRANCE
'This table (see Exhibit 54) has five distance categorieswhisk summarizes the distances respondehts are willing to travel
EXHIBIT 54
SUMMARY TABLE ON DISTANCE WILLING TO TRAVELFOR THOSE WITH A TRANSPORTATION HINDRANCE
Table 19
DISTANCE a
NUMBER INSAMPLE PERCENT
1 - 10 miles 45 18.75
11 - 20 miles 82 34.17
21 -.30 miles 56 23.33
31 - 40 miles 20 8.33
Over 40 miles 37 15.42
TOTAL 240 '100.00
118
126
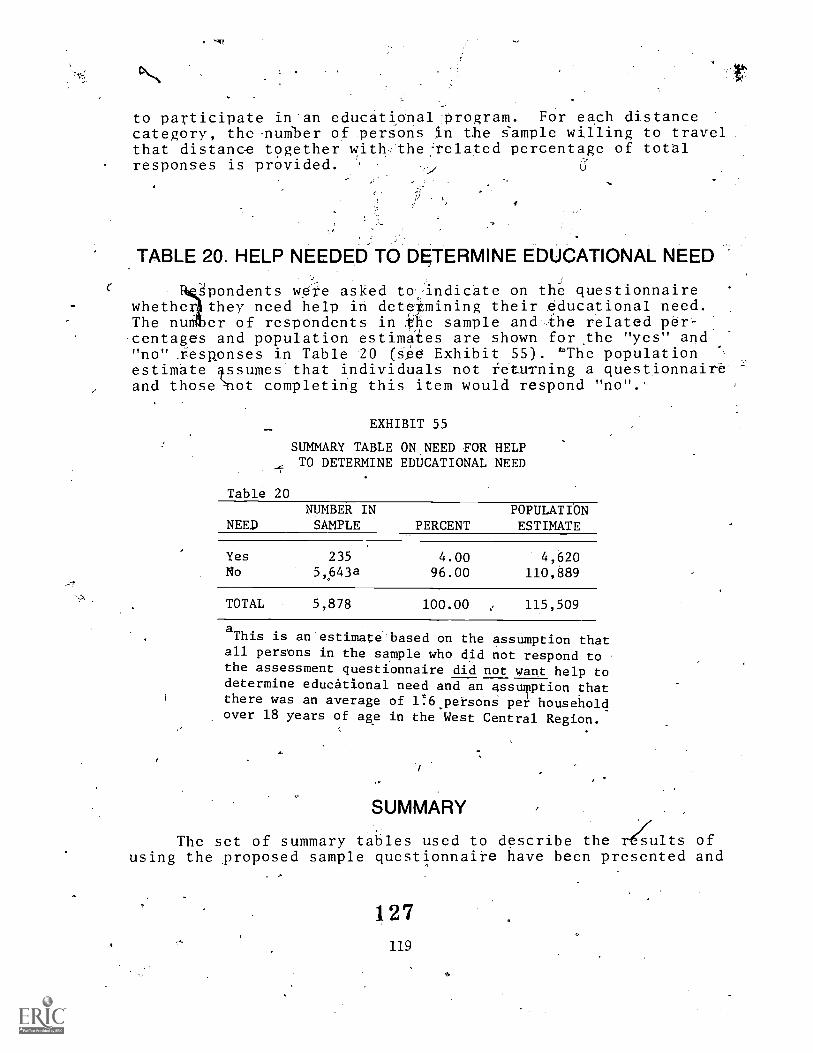
'aft
to participate in'an educational-program. For each distancecategory, the-number of persons in the s'ample willing to travel .that distanoe together withthe:related percentage of totalresponses is provided. '
TABLE 20. HELP NEEDED TO I:TERMINE EDUCATIONAL NEED
Spondents were asked to:,:indicate on the questionnairewhether they need help in detepuning their educational need.The nu er of respondents in ;the sample andAhe related per---centages and population estimates are shown for the "yes" and"no" .responses in Table 20 (,ee Exhibit SS). 'The populationestimate assumes that individuals not retuTning a questionnaire-and thosenot completing this item would respond "no".'
EXHIBIT 55
SUMMARY TABLE ON.NEED FOR HELPTO DETERMINE EDUCATIONAL NEED
Table 20NUMBER IN POPULATIbN
NEED SAMPLE PERCENT ESTIMATE
Yes 235 4.00 4,620No 5,643a 96.00 110,889
TOTAL 5,878 100.00 e 115,509
aThis is an estimate based on the assumption that
all persons in the sample who did not respond tothe assessment questionnaire did not want help todetermine educational need and an assumption thatthere was an average of l6 persons per householdover 18 years of age in the West Central Region.
SUMMARY
The set of summary tables used to describe the r4ults ofusing the proposed sample questionnaire have been presented and
127119
6

explained. The tables are designed io answer the key questionsposed in Chapter 1 of this report. Note that the set of summarytables can be providelor the total group of respondents inthe study as well as various subs-gróups of the population whichmay be of particular interest.
128
120
CHAPTER VI
PROCEDURE SUMMARY
The purpose of this handbook,.as stated in Chapter I, wasto document a. procedure for.obtaining infor'mation about the-intqrest. of people for additionar job training. The procedure,as documented, will result in the acquisition of a set oftables .(similar to those exhibited in Chapter V). These tablesare designed to provide information so as to allow specifica-tion ihd communication of interest in job training for thepurpose of planning edueational programs, The purpose qf thislast cliapter is to briefly summarize the procedure and to,reiterate the key poipts which are critical to the assessmentof needs for additional job training.
"The three majonconcerns of the procedur are:. 61 Whattype of ihformation must be collected, (2) how should the infor-mation be collected, and (3) what management strategy and organ-ization facilitate effective operation.
INFORMATION NEEDS+
The informatign to bp'collected should describe the charac-teristics of the people to be,served, and provide informationpertinent to the,major facets of planning job training programs.Data on age, sek, and employment status describe the ample aridficilitiates comparison with the population from Which'the samplewas.derived. Although this information is an integral part ofthe information needed for planning programs,.data which are'much more_pertineht to the planning process must be collected..Such data includes the number of people needing job training,the tyPe f training needed and,the reason for its need, the .
place and time training could be attended; and the special bar-riers to attendance. This information is usually of ihvaluableassistance in the planning and implemention of programs forwhiCh meed exists, at the convenience of those in need.
DATA COLLECTION
After the type of information to be collected has beendetermined, the most immediate concerns.are the selection of a
121°
129
i
-, 4r,
sample of people:from whom:the4nfoxmation should be collectedand the adoption:oT a feasible and-effective method,of data col-
.lect4on.. Theserconcerns address the'core of the needs assess---
ment protedure:1
ThoUgh it may be desirable to collect informatW from theentire population of concern, limited time and financial re-
sources are usually the major deterrents. As a resuft, a sampleor part of the entire population must be selected in such a Man-nerthat the tesulting information will be generalizable to thepopulation of concern. The second chapter of this-handbooksummarizes acceptable sample sizes w'th respect to populationslize and desired level of accuracy: e third chapter', mores'pecifically, outlines an effective me hod of identifying the
names and addfesses cif households to.be included in the sample;in effect, it details the mei'hod of sample selection. The
sample selection method is a modification of the 'procedure out-lined by the UniteTtStates Census Bureau for its Current Popula-tion SurVey and it requires census data concerning population and
household'numbers., t.
1-laving identified-the sample, the next step involves con-
tacting the households- and gathering information concerning jobtraining needs. The method of contact described in this hand-book requires the use of two mailings and a telephone follow-up;
a procedure which=combines a,high rate of return,with'efficient.use.of reources'. rn each mailing, a cover letter and question-naires are enclosed. JThe procedure,for mailing, coding, and .
telephone contact is described in Chapter IV. The
que ionnaires returned by respahdents are coded and prepated
for:data anlaysis.
MANAGEMENT STRATEGY r,
The variety of activities involved, in addition to thecritical nature of deadlines and the importance of timelytermination, make effeAive management compulsory for success-fulfy coordinating the assessment activities. Critical manage-'ment activities include the hiring and training of staff;securing space, equipment, and resources for the project; devel-
oping .a plan of operation for'the study; conducting'public rela-lions efforts; and after data analysis, writing and disseminatingtioe assessment report. These activities are reviewed in thesecond chapter of this handbook.
p.
130122,,
:Vplan of operation contributes immensely to managerialeffectiveness since critical deadlines as mailing and termina-tisan'dates are always kept in focus; and the plan-skves as abase Tor monitoring the effectiveness of the process. AneffectAve management strategy, coupled with the collectionof thTight type of information,from an acceptable sample-of the.population, As the basis of a job trainirtkneeds assess-ment procedure which provides impottant data to program plan- ,
'ners, approvers and implementers.
0
1
131
123
6

APPENDIX I
SAMPLE QUESTIONNAIRE
.... ......
1-3 2
125
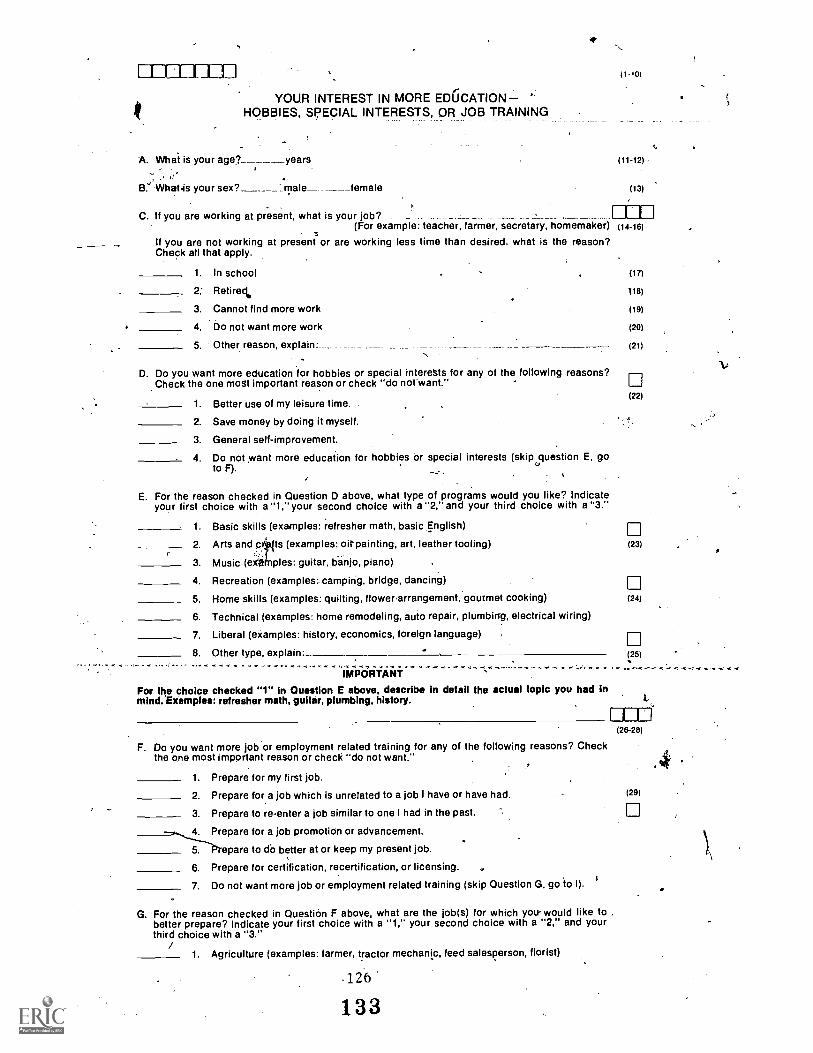
LULU _LIJYOUR INTEREST IN MORE ED6CATION
HOBBIES, SPECIAL INTERESTS, OR JOB TRAINING
A. What is your age?_____years
Whatis your sex? male_ _
C. If you are working at present, what is
If you are not working at present orCheck all that apply.
1. In school
2: Retireq.
3. Cannot find more work
4. Do not want more work
5. Other reason, explain:
_female
your job? _
(For example: teacher, farmer, secretary, homemaker)
are working less time than desired, what is the reason?
D. Do you want more education for hobbies or special interests for any of the following reasons?Check the one most important reason or check "do not'want."
1. Better use of my leisure time.
2. Save money by doing it myself.
3. General self-improvement.
4. Do not want more education for hobbies or special interests (skip question E, goto F).
.
E. For the reason checked in Question D above, what type of programs would you like? Indicateyour first choice with a "1," your second choice with a "2," and your third choice with a "3."
1. Basic skills (examples: refresher math, basic English)
2. Arts andc Its (examples: oil' painting, art, leather tooling)
3. Music (e ples: guitar, banjo, piano) .
4. Recreation (examples:. camping, bridge, dancing)
5. Home skills (examples: quilting, flowerarrangement, gourmet cooking)
6. Technical (examples: home remodeling, auto repair, plumbing, electrical wiring)
7. Liberal (examples: history, economics, foreign language) ,
8. Other type, explain: °
IMPCiRTANT
For the choice checked "1" in Question E above, describe in detail the actual topic you had inmind..Examples: refresher math, guitar, plumbing, history.
F. Do you want more job or employment related training for any of the following reasons? Checkthe one most impprtant reason or check "do not want."
1. Prepare for my first job.
2. Prepare for a job which is unrelated to a job I have or have had.
3. Prepare to re-enter a job similar to one I had in the past.
4 Prepare for a job promotion or advancement.
'-.-5-.--Rrepare to do better at or keep my present job.
6. Prepare for certification, recertification, or licensing. .7. Do not want more job or employment related training (skip Question G, go to l).
G. For the reason checked in Question F above, what are the job(s) for which you- would like tobetter prepare? Indicate your first choice with a ''1," your second choice with a "2," and yourthird choice with a "3."
1. Agriculture (examples: farmer, tractor mechanic, feed salesperson, florist)
.126
133
I
(14-16)
(22)
(23)
(24)
(25)
(26-28)
(29)
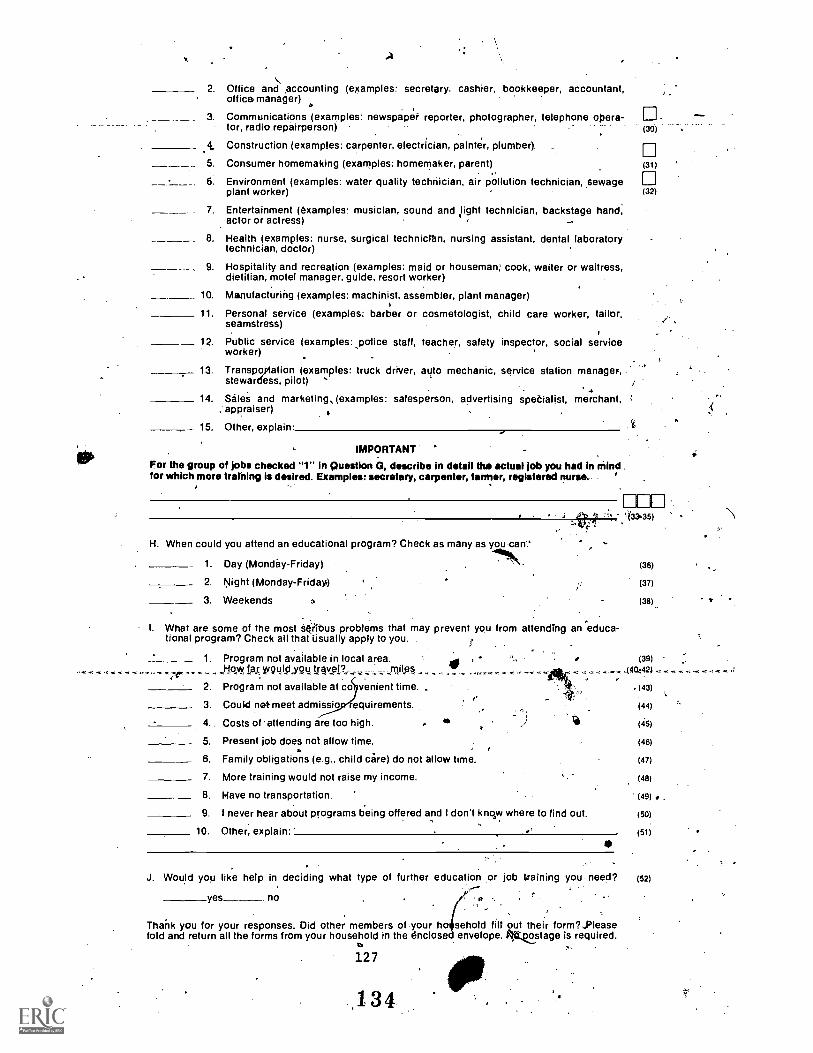
2. Office and accounting (examples: secretary, cashier, bookkeeper, accountant,office, manager)
3. Communications (examples: newspaper reporter, photographer, telephone opera-tor,-radio repairperson) (30)
.4, Construction (examples: carpenter, electrician, painter, plumber)
5. Consumer homemaking (examples: homemaker, parent) (31)
6. Environment (examples: water quality technician, air pollution technician, sewage LIplant worker) (32)
7. Entertainment (examples' musician, sound and ,light technician, backstage hand,actor or actress)
8. Health (examples: nurse, surgical technicten, nursing assistant, dental laboratorytechnician, doctor)
9. Hospitality and recreation (examples: maid or houseman; cook, waiter or waitress,dietitian, motel manager, guide, resort worker)
10. Manufacturing (examples: machinist, assembler, plant manager)
11. Person& service (examples; barber or cosmetologist, child care worker, tailor,seamstress)
12. Public service (examples: potice staff, teacher, safety inspector, social seMceworker)
13. Transpoytation (examples: truck driver, auto mechanic, service station manager, .stewardess, pilot)
14. Sales and marketing, (examples: salesperson, advertising speãialist, merchant,appraiser)
15. Other, explain'
IMPORTANT 'For the group of jobs checked "1" In Question GI, describe in detail the actual lob you had In ndndfor which more trarnIng is desired. Examples: secretary, carpenter, farmer, registered nurse.
H. When could you attend an educational program? Check as many as you cam'
1. Day (Monday-Friday)
2. Night (Monday-Friday)
3. Weekends
. r j 3 36 3 5 )t
Ar
(36)
(37)
(38).
I. What are some of the most seiibus problems that may prevent you from attending an educa-tional program? Check all that Usually apply to you. f
1, Program not available in local area.10 '
(39) .,
travglt,How !ter yvgulslyou . __ mites . ,,, ...... J41421.- .
2. Program not available at co venient time. - (43)
(44)
(45)
.
3. Could net-meet admissio equirements.
4. Costs of 'attending are too high.
5. Present job does not allow time. (46)
6, Family obligations (e.g.. child care) do not allow time. (47)
7. More training would not raise my income. (48)_ 8. Have no transportation. (49)
9. I never hear about programs being offered and I don't knqw where to find out. (50)
10. Other, explain' (51)
0
J. Would you like help in deciding what type of further education or job training you need? (52)
yes no
Thank you for your responses. Did other members of your ho sehold filt out their form?,Pleasefold and return all the forms from your household in the enclosed envelope. 14,111.kostage is required.
127
,134
.

/APPENDIX.II
INDEX FOR AOBBY AND- SPECIAL INTEREST PROGRAMS
135
129
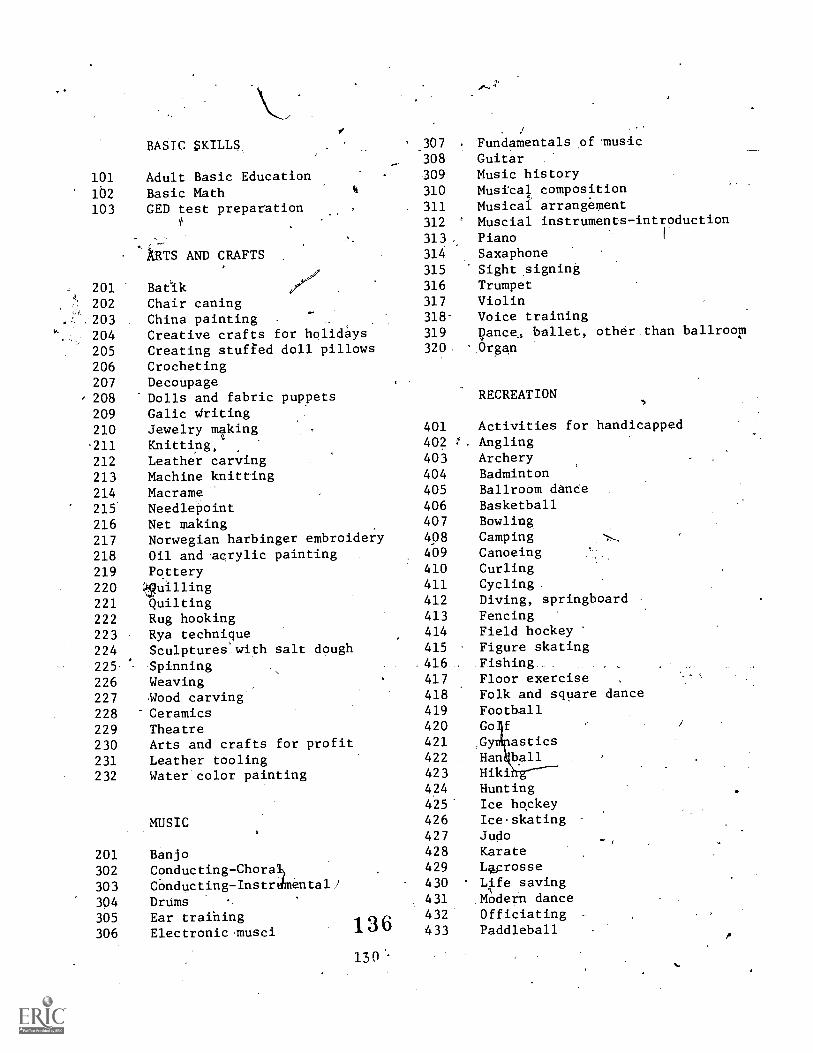
BASIC SKILLS
101 Adult Basic Education
162 Basic Math103 GED test preparation
201202
203204205
206
207, 208
209
210.211
212
213214215216217218
219
220221
222
223224225
226227228229230231232
kiTS AND CRAFTS
BaeikChair caning
-China painting -
Creative crafts for holidaysCreating stuffed doll pillowsCrochetingDecoupageDolls and fabric puppetsGalic NeritingJewelry makingKnitting.Leather carvingMachine knittingMacrameNeedlepointNet makingNorwegian harbinger embroideryOil and acrylic paintingPottery
QuiltingRug hookingRya techniqueSculptures with salt doughSpinningWeavingMood carvingCeramicsTheatreArts and crafts for profitLeather toolingWater color painting
MUSIC
201 Banjo
302 Conducting-Choral)
303 COnducting-Instrdmental/304 Drums305 Ear traihing306 Electronicmusci 136
130
_307
308
-309
Fundamentals of 'music
GuitarMusic history
310 Musical composition. 311 Musical arrangement
312 ° Muscial instruments-introduction
313 Piano .
314 Saxaphone
315 Sight aigning
316 Trumpet317 Violin318- Voice training319 Dance, ballet, othar.than ballroom320. Organ
RECREATION
401 Activities for handicapped402 4', Angling
403 Archery404 Badminton405 Ballroom dance
406 Basketball407 Bowling408 Camping409 Canoeing410 Curling411 Cycling412 Diving, springboard
413 Fencing414 Field hockey415 Figure skating416 Fishing417 Floor exercise .
418 Folk and square dance419 Football420 Go f421 Gy astics422 Han ball423 Hiki424 Hunting425- Ice hockey426 Ice,skating427 Judo428 Karate429 L4prosse430 ' Life saving431 Modern dance432 Officiating433 Paddleball r
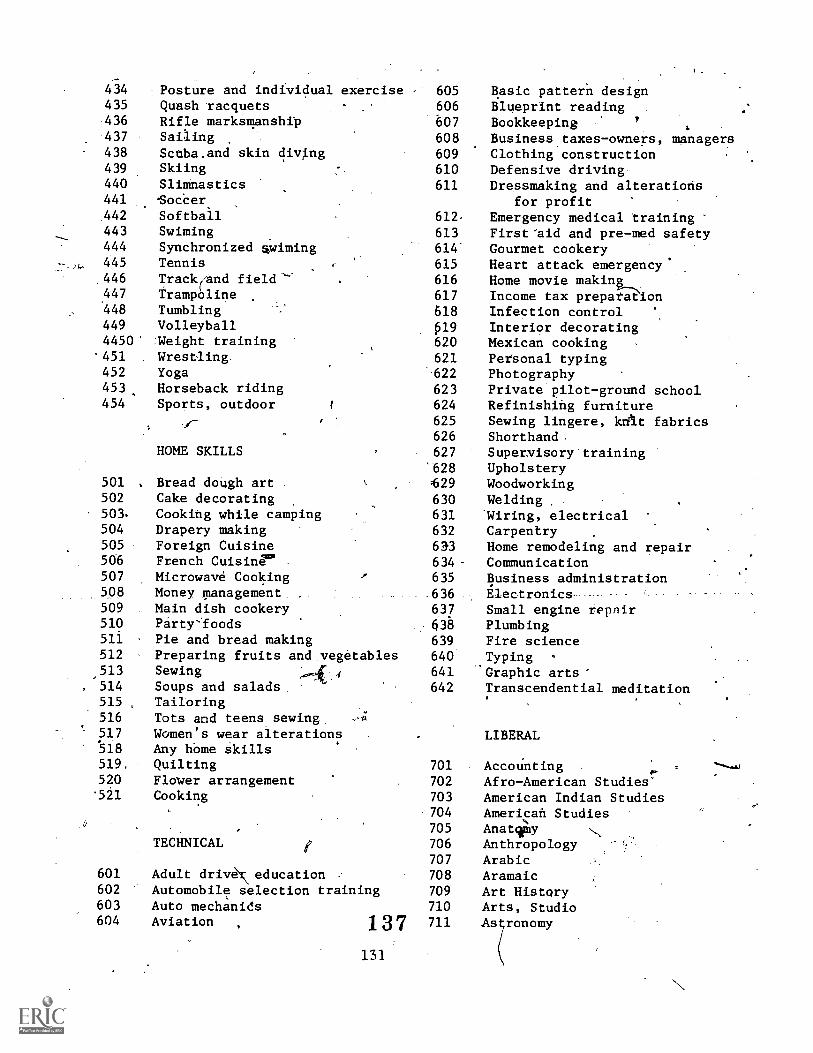
434435.436
-437
438439440441.442
443444445446447448449
4450451452453,454
Posture and individualQuash racquetsRifle markemanshipSailingScuba.and skin divingSkiingSlimnasticsSocCerSoftballSwimingSynchronized spimingTennisTrack(And fieldTrampolineTumblingVolleyball.Weight trainingWrestling.YogaHorseback ridingSports, outdoor
HOME SKILLS
501 , Bread dough art502 Cake decorating503. Cooking while camping504 Drapery making505 Foreign Cuisine506 French Cuisine507 Microwave Cooking508 Money management509 Main dish cookery510 Party'foods511 Pie and bread making512 Preparing fruits and513 Sewing514 Soups and salads515 , Tailoring516 Tots and teens.sewing517 Women's wear alterations518 Any hOme Skills519 Quilting520 Flcwer arrangement521 Cooking
exercise
vegetables
TECHNICAL f
601 Adult driver,education602 Automobile selection training603 Auto mechanids604 Aviation 137
131
605 Basic pattern design606 Blueprint reading607 Bookkeeping 7
608 Business taxes-owners,609 Clothing construction610 Defensive driving611 Dressmaking and alterations
for profit612. Emergency medical training613 First'aid and pre-med safety614" Gourmet cookery615 Heart attack emergency616 Home movie making_,617 Income tax preparation618 Infection control
Interior decorating620 Mexican cooking621 Personal typing622 Photography623 Private pilot-ground school624 Refinishing furniture625 Sewing lingere, kdlt fabrics626 Shorthand627 Supervisory training628 Upholstery629 Woodworking630 Welding631 Wiring, electrical632 Carpentry633 Home remodeling and repair634 Communication635 Business administration636 Electronics.637 Small engine repnir638 Plumbing639 Fire science640 Typing641 Graphic arts'642 Transcendential meditation
managers
LIBERAL
701 AccoUnting702 Afro-American Studies'703 American Indian Studies704 Ameri,can Studies705 Anatway706 Anthropology707 Arabic708 Aramaic709 Art History710 Arts, Studio711 As ronomy
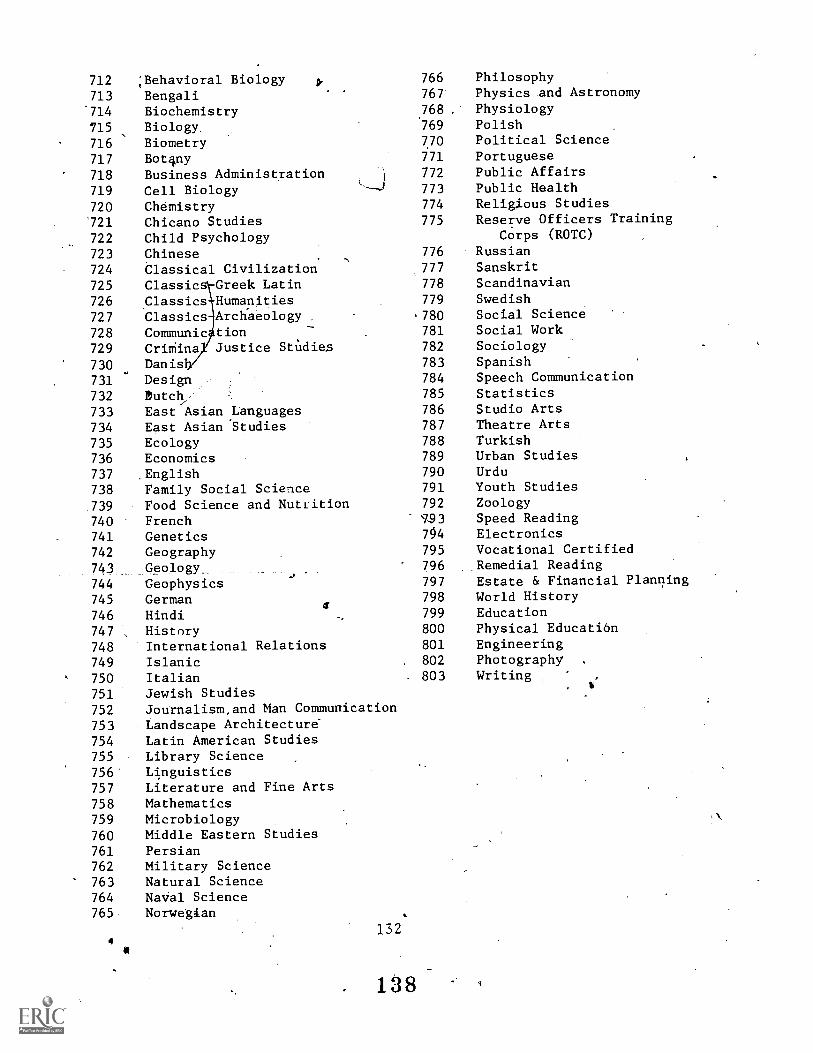
712
713'714
715
716
717
718
;Behavioral BiologyBengaliBiochemistryBiology.
BiometryBot4nyBusiness Administration
766
767
768
769
770
771
772
PhilosophyPhysics and AstronomyPhysiologyPolishPolitical SciencePortuguesePublic Affairs
719 Cell Biology 773 Public Health
720 Chemistry 774 Religious Studies
'721 Chicano Studies 775 Reserve Officers Training
722 Child Psychology Corps (ROTC)
723 Chinese 776 Russian
724 Classical Civilization 777 Sanskrit
725 Classic Greek Latin 778 Scandinavian
726 Classics Humanities 779 Swedish
727 Classics Archaeology . .780 Social Science
728 Communic tion 781 Social Work
729 CriniinaX Justice Stildies 782 Sociology
730 Danis 783 Spanish
731 Design 784 Speech Communication
732 !hitch, 785 Statistics
733 East Asian Languages 786 Studio Arts
734 East Asian Studies 787 Theatre Arts
735 Ecology 788 Turkish
736 Economics 789 Urban Studies
737 .English 790 Urdu
738 Family Social Science 791 Youth Studies
739 Food Science and Nutlition 792 Zoology
740 French `793 Speed Reading
741 Genetics 794 Electronics
742 Geography 795 Vocational Certified
743 Geology. 796 Remedial Reading
744 Geophysics 797 Estate & Financial Planning
745 German 798 World History
746 Hindi 799 Education
747 , History 800 Physical Educati6n
748 International Relations 801 Engineering
749 Islanic 802 Photography
750 Italian 803 Writing
751 Jewish Studies
752 Journalism,and Man Communication
753 Landscape Architecture-
754 Latin American Studies755 Library Science756 Linguistics757 Literature and Fine Arts
758 Mathematics759 Microbiology760 Middle Eastern Studies761 Persian762 Military Science763 Natural Science764 Naval Science765- Norwegian
4132
. 138

, APPENDIX III
USING RANDOM NUMBERS TABLE
,
139
133
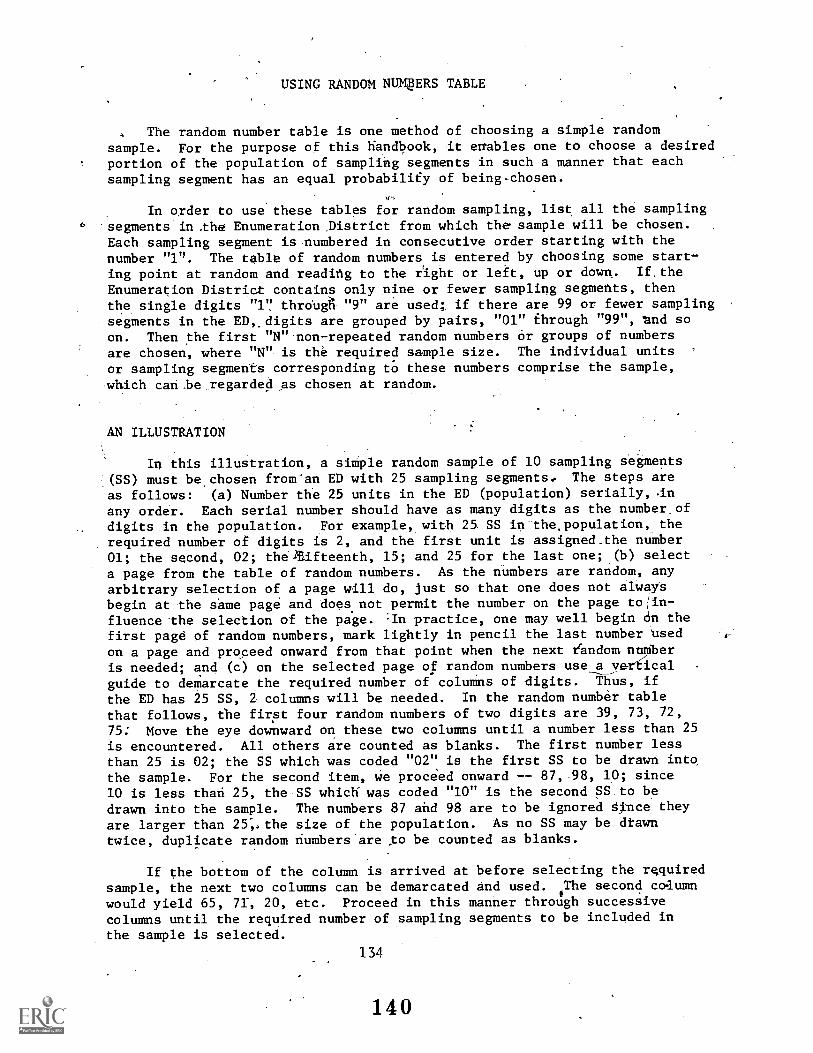
USING RANDOM NUMpERS TABLE
The random number table is one method of choosing a simple randomsample. For the purpose of this handbook, it enables one to choose a desiredportion of the population of sampling segments in such a manner that eachsampling segment has an equal probability of being-chosen.
In order to use these tables for random sampling, list all the sampling6 segments in the Enumeration Ildstrict from which the sample will be chosen.
Each sampling segment is numbered in consecutive order starting with thenumber "1". The table of random numbers is entered by choosing some start-ing point at random and reading to the right or left, up or down,. If.the
Enumeration District contains only nine or fewer sampling segments, thenthe single digits "17 throne "9" are used; if there are 99 or fewer sampling .
segments in the ED,,digits are grouped by pairs, "01" through "99", and soon. Then the first "N" non-repeated random numbers Or groups of numbersare chosen, where "N" is the required sample size. The individual unitsor sampling segments corresponding to these numbers comprise the sample,which can,be regarded as chosen at random.
AN ILLUSTRATION
In this illustration, a simple random sample of 10 sampling segments(SS) must be chosen from'an ED with 25 sampling segments.. The steps are
as follows: (a) Number the 25 units in the ED (population) serially, .in
any order. Each serial number should have as many digits as the number ofdigits in the population. For example, with 25 SS in the.population,_ therequired number of digits is 2, and the first unit is assigned.the number01; the second, 02; the2Eifteenth, 15; and 25 for the last one; (b) selecta page from the table of random numbers. As the numbers are random, anyarbitrary selection of a page will do, just so that one does not alwaysbegin at the same page and does not permit the number on the page to(in-fluence the selection of the page. :In practice, one may well begin On thefirst page of random numbers, mark lightly in pencil the last number nsedon a page and proceed onward from that point when the next random noyberis needed; and (c) on the selected page of random numbers use a verticalguide to demarcate ,the required number of columns of digits. Thus, if
the ED has 25 SS, 2 columns will be needed. In the random number tablethat follows, ehe first four random numbers of two digits are 39, 73, 72,75: Move the eye downward on these two columns until a number less than 25is encountered. All others are counted as blanks. The first number lessthan 25 is 02; the SS which was coded "02" is the first SS to be drawn intothe sample. For the second item, we proceed onward -- 87, 98, 10; since10 is less than 25, the SS which was coded "10" is the second SS to bedrawn into the sample. The numbers 87 and 98 are to be ignored since theyare larger than 25;.the size of the population. As no SS may be dtawntwice, duplicate random numbers are o be counted as blanks.
If the bottom of the column is arrived at before selecting the requiredsample, the next two columns can be demarcated and used. liThe second calumn
would yield 65, 71, 20, etc. Proceed in this Manner through successivecolumns until the required number of sampling segments to be included inthe sample is selected.
134
140

The serial numbers of the 10 sampling segments to be drawn from theED in this illustrkion for inclusion in the random sample are ag follows:02, 10, 21, 22, 19,V, 03, 04, 23, and 15. Since 10 numbe, below 25were obtained from t e first column, it was not necessary to use a secondcolumn of 2 digits.
1-41135
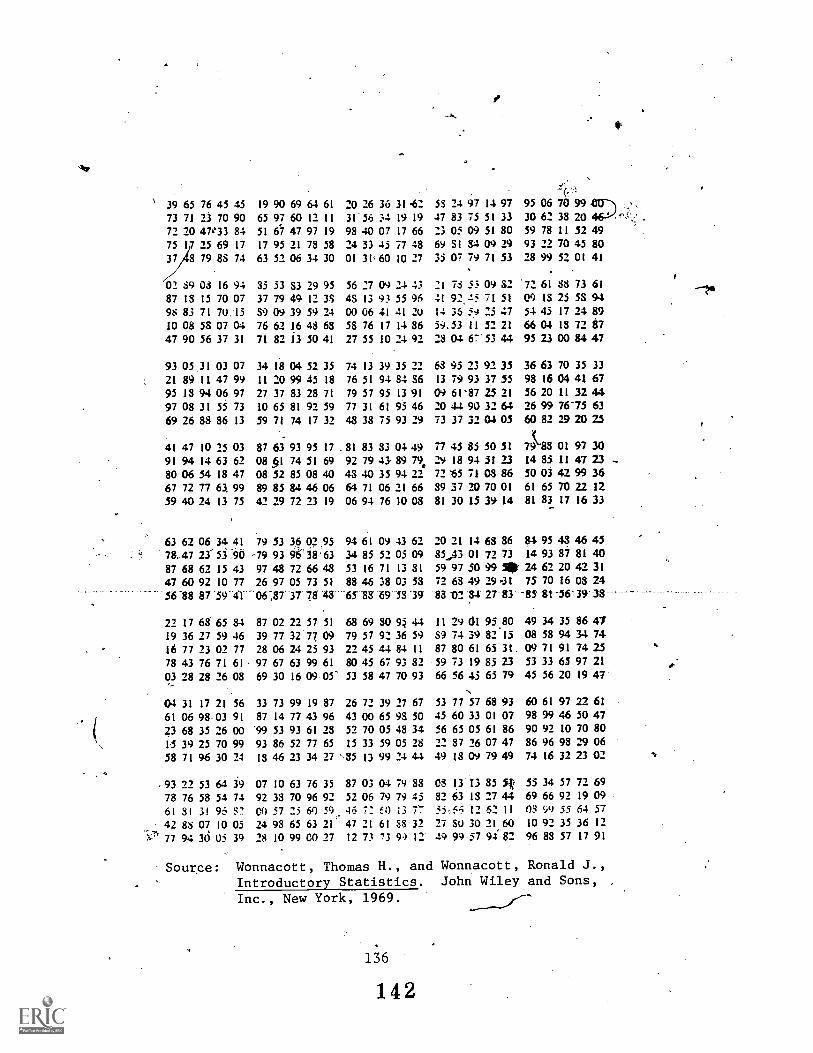
,btr
39 65 76 45 45 19 90 69 64 61 20 26 35 314273 71 23 70 90 65 97 60 12 II 3156 34 19 19
72 20 47%13 84 51 67 47 97 19 93 40 07 17 66
75 17 25 69 17 17 95 21 73 58 24 31 45 77 48
37 3 79 SS 74 63 52 06 34 30 01 31,60 10 27
02.S9 OS 16 94 35 53 83 29 95 56 27 09 24 43
87 IS 15 70 07 37 79 49 12 38 4S 13 93 55 96
98 83 71 70,15 S9 09 39 59 24 00 06 41 41 20
10 08 58 07 04 76 62 16 48 68 58 76 17 14 36
47 90 56 37 31 71 82 13 50 41 27 55 10 24 92
93 05 31 03 07 34 18 04 52 35 74 13 39 35 22
21 89 11 47 99 11 20 99 45 18 76 51 94 84 86
95 13 94 06 97 27 37 83 28 71 79 57 95 13 91
97 08 31 55 73 10 65 81 92 59 77 31 61 95 46
69 26 88 86 13 59 71 74 17 32 48 33 75 93 29
41 47 10 25 03 87 63 93 95 17 81 83 33 044991 94 14 63 62 08 §I 74 51 69 92 79 41 89 79,
80 06 54 18 47 08 52 85 08 40 43 40 35 94 22
67 72 77 61 99 89 85 84 46 06 64 71 06 21 66
59 40 24 13 75 42 29 72 23 19 06 94 76 10 08
63 62 06_34 41 79 53 16 9.1.95 94 61 09 43 62
78,47 2351:96 -79 93 96'3863 34 85 52 05 09
87 68 62 15 43 97 48 72 66 48 53 16 71 13 31
47 60 92 10 77 26 97 05 73 51 88 46 38 03 58
56 88 87.59-41-06,87 37 78-43 65-8g 69 5339
22 17 63. 65 34 87 02 22 57 51 68 69 30 95 44
19 36 27 59 46 39 77 32 77 09 79 57 92 36 59
16 77 23 02 77 28 06 24 25 93 22 45 44 84 II
78 43 76 71 61 97 67 63 99 61 80 45 67 93 37
03 28 28 26 03 69 30 16 09.05- 53 58 47 70 93
04 31 17 21 56 33 73 99 19 87 26 72 39 27 67
61 06 98-03 91 87 14 77 43 96 43 00 65 9S 50
23 68 35 26 00 99 53 93 61 28 52 70 05 43 34
15 39 25 70 99 93 86 52 77 65 15 33 59 05 2S
58 71 96 30 24 13 46 23 34 27 ,35 13 99 24 44
.93 22 53 64 19 07 10 63 76 35 87 03 04 79 33
78 76 58 54 74 92 33 70 96 92 52 06 79 79 45
61 SI 3! 96 ST! CO 57 25 60 59. 46 7: 60 i3 7-
42 Ss 07 10 05 24 98 65 63 21 47 21 61 88 32
77 94 30 05 39 28 10 99 CO 27 12 73 73 99 12
5S 24 97
47 83 75
23 05 09
69 SI 84
35 07 79
1497 95 06 70 99
51 33 30 62 33 20
51 80 59 78 11 32
09 29 93 22 70 45
71 53 28 99 52 01
49
80
41
21 73 53 09 SZ '72 61 SS 73 61
4! 92.45 71 51 09 IS 25 5S 94
14 35 59 25 47 54 45 17 24 89
59,51 II 52 21 66 04 13 72 87
28 04 67.53 44 95 23 00 84 47
63 93 23 92 35 36 61 70 35 33
13 79 93 37 55 98 16 04 41 67
09 61'87 25 21 56 20 11 32 44
20 44 90 32 64 26 99 7615 63
73 37 32 04 05 60 82 29 20 25
77 45 85 50 51 79 83 01 97 30
29 18 94 51 23 14 85 11 47 23 -
72 '65 71 03 86 50 03 42 99 36
39 37 20 70 01 61 65 70 22 12
81 30 15 39 14 81 83 17 16 33
20 21 14 68 86 84 95 48 46 45
3541 01 72 73 14 93 87 81 40
59 97 JO 99 5011r 24 62 20 42 31
72 63 49 29=31 75 70 16 03 24
83 -02
11 29 01 95.80 49 34 35 86 47
89 74 39 82 15 08 58 94 34 74
87 80 61 65 31 09 71 91 74 25
59 73 19 85 23 53 33 65 97 21
66 56 45 65 79 45 56 20 19 47
53 77 57 68 93 60 61 97 27 61
45 60 33 01 07 98 99 46 50 47
56 65 05 61 86 90 92 10 70 80
22 37 26 07 47 86 96 93 29 06
49 13 09 79 49 74 16 32 23 02
OS 13 13 35 St 55 34 57 72 69
32 63 IS 27 44 69 66 97 19 09
55,66 t2 62 11 OS 99 55 64 57
27 Su 10 21 60 10 92 35 36 12
49 99 57 9482 96 83 57 17 91
Source: Wonnacott, Thomas H., and Wonnacott, Ronald J.,Introductory Statistics. John Wiley and Sons, ,
Inc., New York, 1969.
136
142

APPENDIX IV-
SAMPLE COMPUTER 'OUTPUT ON SAMPLING SEGMENTS
143
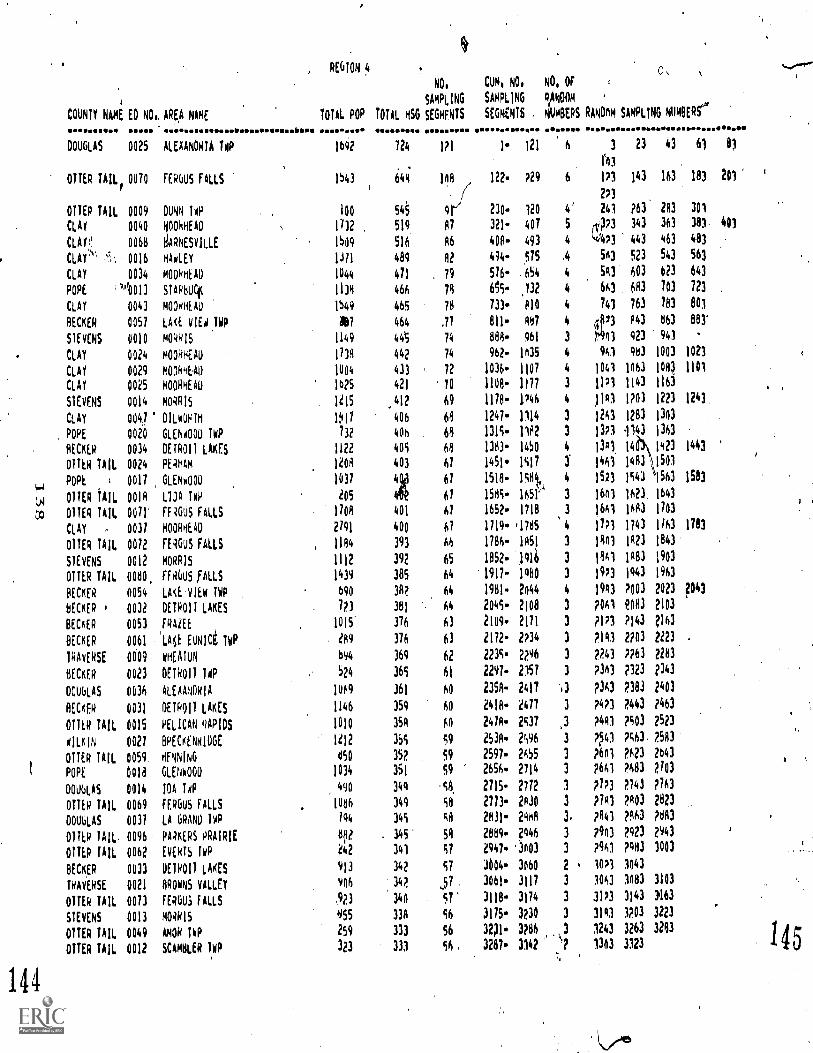
COUNTY NAmi ED NO1 AREA NAHE
RE6ION 4
TOTAL POP
NO,
SAMPLING
TOTAL MSG SEGMENTS
CUM, NO,
SAMPLING
SEGMENTS
0,NO, OF
9,ANDOm
NUMBERS RAND4m SAMPLING NUMBERS°
DOUGLAS 0025 ALEAANORTA TWP 1692 724 121 I- 121 6 3 23 43 61 81
OTTER TAIL 0070 FERWS FALLS 1543 64; 100 122. 729 6 173 143 163 183 201
( 273
OTTER TAIL 0009 DUNN loP 100 545 41'/ 230- 120 241 263' 283 301
CLAY 0040 mOORHEAD 732 519 07 321- 407 5 473 343 363 383 403
CLAY'! 0068 gARNESVILLE 509 516 86 400- 493 4 '473 443 463 483
CLAY' 0016 HANLEY J71 489 m? 494- 575 A 503 523 543 563
CLAY 0034 m004HEAD 044 471 79 576- .654 4 543 603 623 643
POPE °0013 sTARB4 134 466 74 655- ,732 4 643 683 703 723
CLAY 0043 m0o0REAu 549 465 78 733- 010 4 74] 763 783 803
BECKER 0057 LAKE VIE TWP 464 .77 811. 887 4 on 743 863 883'
STEVENS 0010 mORRIs 149 44S 74 888- 961 3 t903 ;23 943
CLAY 0024 MOORHEAD 138 44? 14 962- 1035 4 941 983 003 1023
CLAY 0029 MOOmHEAR 004 433 12 036- 1107 4 041 063 083 1101
CLAY 0025 MOORHEAD 625 421 70 108- 1117 3 173 143 163
STEVENS 0014 MORR15 115 412 69 170- 1746 4 193 PO) 223 1243
CLAY 004y DILWORTH f111 406 61 247- 1114 3 243 283 313
POPE 0020 GLENNOOD TWP 732 40h 68 315- 1182 3 373 143 363
BECKER
OTTER TAIL
0034
0024
DETROIT LAKES
PERHAM
122
208
405
403
68
67
383- 1450
451- 1517
4
3.
383
443
4
4A3
423 1443
501
1+
(14
POPE t
OTTER TAIL
OTTER TAIL
0017
0018
0011
GLENwoOD
1.1)A TwP
FE4GuS FALLS
037
205
708
:4
401
67
61
67
518- IciI$
585- 1651 '''
652- 1718
4
3
3
573
603
663
543
623
683
563 1583
643
703
CLAY , 0037 MOORHEAD 2791 400 67 719- '1705 4 121 /43 163 1783
OTTER TAIL
STEVENS
00/2
0012
FERGUS FALLS
MORRIS 81111142
393
392
Ah
65
7136- 161
052- 1916
3
3
803
843
A23
083
843
903
OTTER TAIL 0080 FEAUS fALLS 1439 385 64 917- 1980 3 973 943 963
BECKER 0054 LAKENIER TWP 690 382 64 981- 2444 4 903 7003 2023 ?043
BECKER 0032 DEIR011 LAKES 773 381 64 2045- 2108 3 2061 fo83 2103
BECKER 0053 FRAIEE 1015 376 63 2109- 2171 3 2173 7143 2143
BECKER 0061 'LAO Wild TIP 69 376 63 1112- 2734 3 7183 2203 2223
IRAvERSE 0009 WHEATS 894 369 62 2235- 2296 3 2243 7263 2263
BECKER 0023 DETROIT ToP 524 365 61 2297- 2157 3 7303 2323 2343
000LAS 0036 ALEAANORIA 1069 361 60 2358- 2417 7363 2383 2403
BECKFR 0031 DETR011 LAKES 1146 359 60 2410- 671 3 7473 2443 2463
OTTER TAIL 0015 PELICAN RAPIDS 1010 358 60 2418- 2537 .3 7481 2503 2523
OWN 0027 BRECKENRIDGE 1212 355 59 2538- 2596 3 741 7563, 2583
OTTER TAIL 0059 HENNING 050 352 59 2591- 2455 3 7601 2623 21,43
POPE 0018 GLEN400 1014 351 59 2656. 2714 3 2663 PhD, 2703
DOU6LAS 0014 IDA TO 490 349 .58. 2715- 2712 3 7773 2743 2163
OTTER TAIL 0069 FERGus FALLS 1006 349 58 2773- 2830 3 7783 2803 2623
DOUuLAS 0037 LA GRAND INP 104 345 56 2831- 2568 3. 7843 2863 2883
OTTER TAIL 0096 pA4KER5 PRAIRIE 61,12 145 54 2889- 2946 3 7903 2923 2943
OTTER TAIL 0062 EVERTS fwP 242 341 57 2947- '3003 3 7963 2983 3003
BECKER 0033 DETROIT LAKES 913 342 57 3604- 3060 2 1073 3443
TRAVERSE 0021 BROWNS VALLEY 906 342 ,57 .3061- 3117 3 3043 3083 3103
OTTER TAIL 0073 FER6u; FALLS ,923 340 51' 3118- '3174 3 3173 3143 )163
STEVENS 0013 MORRIS ,955 338 56 3175- 3230 3 3183 3203 3223
OTTER TAIL 0049 AMOR TO 259 333 56 3231- 3286 3 1243 3263 3283
OTTER TAIL 0012 SCAMBLER TWP 323 333 56 3281- 3142 2 1303 3323
144
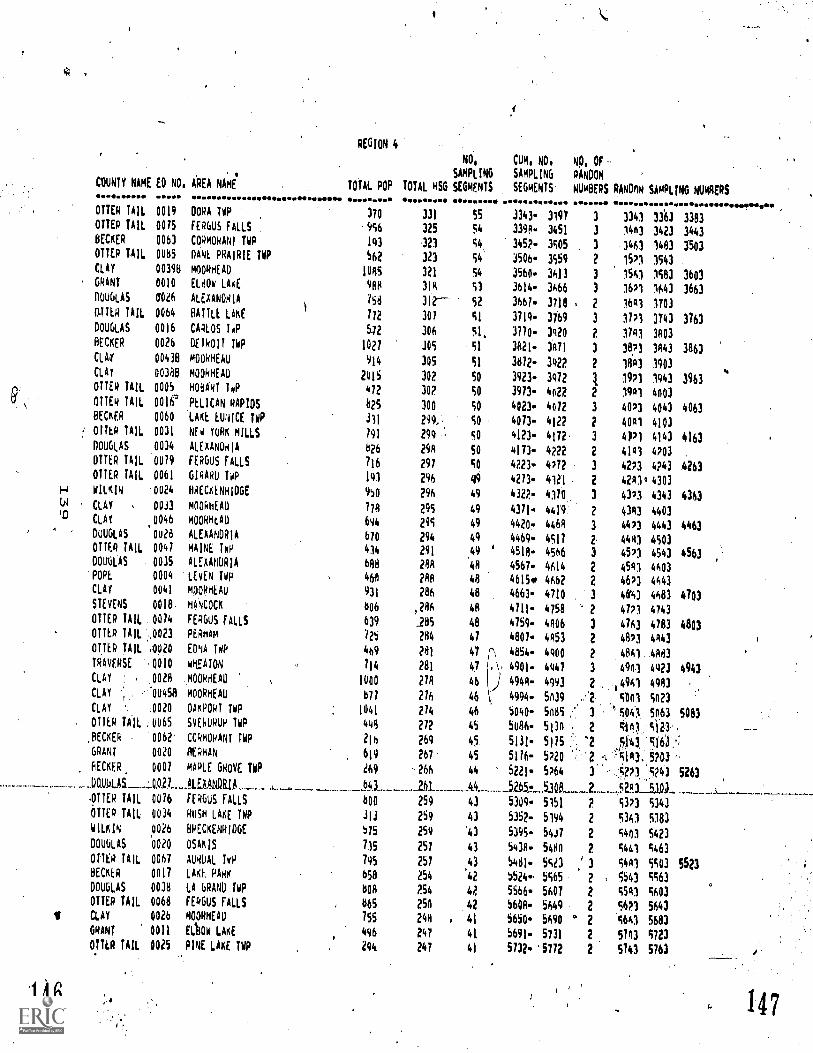
COUNTY NAME EO NO, AREA NAme
REGION 4
NO, CUM, No, 10, OF
SAMPLING SAMPLING RANDOM
TOTAL POP TOTAL HSG SEGRENTS SEGMENTS NUMBERS RANOnN SAMPLING NUMRERS
OTTER TAIL 0019 DORA TWP 370 331 SS 3343- 3197 3 3341 33.63 3383OTTER TAIL 0015 FERGUS FALLS 956 325 54 3394- 3451 3 1443 3423 3443BECKER 0063 CORMORANT TwR 143 323 54 3452- 3905 . 3 .3463 1483 1503OTTER TAIL 0065 DANE PRAIRIE TWP 562 323 54 3506- 3559 2 1521 3543CLAY 00398 MOORHEAD 1045 321 54 .3560- 3613 3 1543 1583 3603GRANT 0010 ELHOw LAKE 988 318 91 3614- 366 3 3621 1643 3663DOUGLAS 6026 ALEAANDNIA 758 31'2-- 52 3667- 3718 2 1643 3703041E4 TAIL 0064 BATTLE LAKE 772 307 51 3719- 3769 3 3721 3743 3763DOUGLAS 0016 CARLOS ToP 512 306 51, 3170- 3420 2 1743 3403BECKER 0026 DETROIT TWP 1021 JOS 51 3471 3 3823 3843 3063CLA/ 00438 MOORHEAU 914 305 SI 3812- 3422 2 1843 3903CLAY 00308 MOORHEAD 2015 302 50 3923- 3412 1 1923 1943 3963OTTER TAIL 006 HOBART TwP 472 302 SO 3913- 4022 2 3941 4003OTTER TAIL 00Ie PELICAN RAPIDS 625 300 SO 4023- 4072 3 4023 4043 4063BECKER 0060 'LAKE EUNICE TIP 331 299 SO 4073- 4122 2 4041 4103OTTER TAIL 0031 NEW YORK MILLS 791 299 sO 4123- 4172. 3 4121 4143 4163DOUGLAS 0034 ALEXANDRIA 626 248 50 4173- 4222 2 4143 4703OTTER TAIL 0079 FERGUS FALLS 116 297 50 4223- 4272 : 3 4273 4243 4263OTTER TAIL 0061 GIRARD TO 141 296 49 4213- 4121 2 4243Q 4303wILKIN .0024 BRECKENHOGE 950 296 49 4322- 4370,, 3 4323 4343 4363CLAY , 0033 mOokHEAD 778 295 49 4371- 4419. 2 4143 4403CLAY .0046 MOORHEAD 694 295 49 44207 4468 3 4423 4443 4463DUGLAS 0028 ALEAANDRIA 674 294 49 4469- 4517 2, 4443 4503OTTER TAIL 0041 MAINE TO 414 291 49 4518- 4566 3 4523 4543 4563DOUGLAS . 0035 ALEXANDRIA 688 284 48 4567- 4614 2 45113 4403
'POPE 0004 LEVEN Twp 4611 288 48 4615. 4462 2 4623 4443CLAY 0041 MooRHEAu 931 286 48 4663- 4710 3 4N43 4683 4703STEVENS 0018.. HANCOCK ,286 48 4111- 4758 2 4773 4743OTTER TAIL 0014 FEPGuS FALLS 639 285 48 4159- 4406 3 4143 4783 4803OTTER TAIL :,0023 PERmAH 125 284 47 4807- 4453 2 4823 4443OTTER TAIL 4020 EDNA TIP 469 281 47 r\ 4854- 4400 2 4841 4483TRAVERSE ,0010 wmEATON 714 281 41 .\. 4901- 4441 3 4941 4423 4943CLAY ,0028 mOORHEA0 1000 278 46 4948- 4993 2 , 14941 4983CLAY ;, ,''00458 MOORHEAD 677 276 46 . 4994- 5n39 SOO 5023CLAY 4020 OAKPORT TIP 1041 274 46 5040- 5085 3 5p4) 5463 5063OTTO TAIL ,0065 SVERDRUP TwP 448 272 45 5086- 5130 2 441:5123'.,BECKER . 0062' CORMORANT TWR 216 269 45 5131- 5)15 "2 ..043 "516)';'.'GRANT 0020 BERMAN 619 267 45 5176- SP20 .A.143:5?03 -BECKER, 0001 MAPLE GmoVE TIP 269 266 44 5221- 5264 3-- $271 5243 5263MOUS 3.621 AlEAANORIA. 6001TER TAIL 0076 FERGUS FALLS BOO 259 43 5309- 5151 2 9373 5343
OTTER TAIL 0034 ROSH LAKE TIP 313 259 43 5352- 5194 2 5343 5383COIN 0026 BRECKENRIDGE 575 259 '43 5395- 5437 2 5403 5423DOUGLAS n020 OSAK15 735 257 43 5434- 5480 2 5441 5463OTIER TAIL 0061 ANUAL TwP 795 257 43 5481- 5523 3 5443 5503 5523BECKER 0011 LAKE PARK 658 254 42 5524.. 5565 2 , 5543 5563DOUGLAS 0038 LA GRANU TwP 254 42 5566- 5607 2 5543 5603
OTTER TAIL 0068 FERGUS FALLS 665 250 42 5608- 5649 Z 5671 5643I CLAY 0026 mooRHEAD 755 24m , 41 5650- 5490 4 2 5643 5683
GRANT 0011 EllOw LAKE 446 247 41 5691- 5731 2 5743 5723OTTO TAIL 0025 PINE LAKE TIP 294 247 41 5732., 5772 2 5763 5763
146 147
APPENDIX V
RELIABILITY OF POPULATION ESTIMATES
148
e141
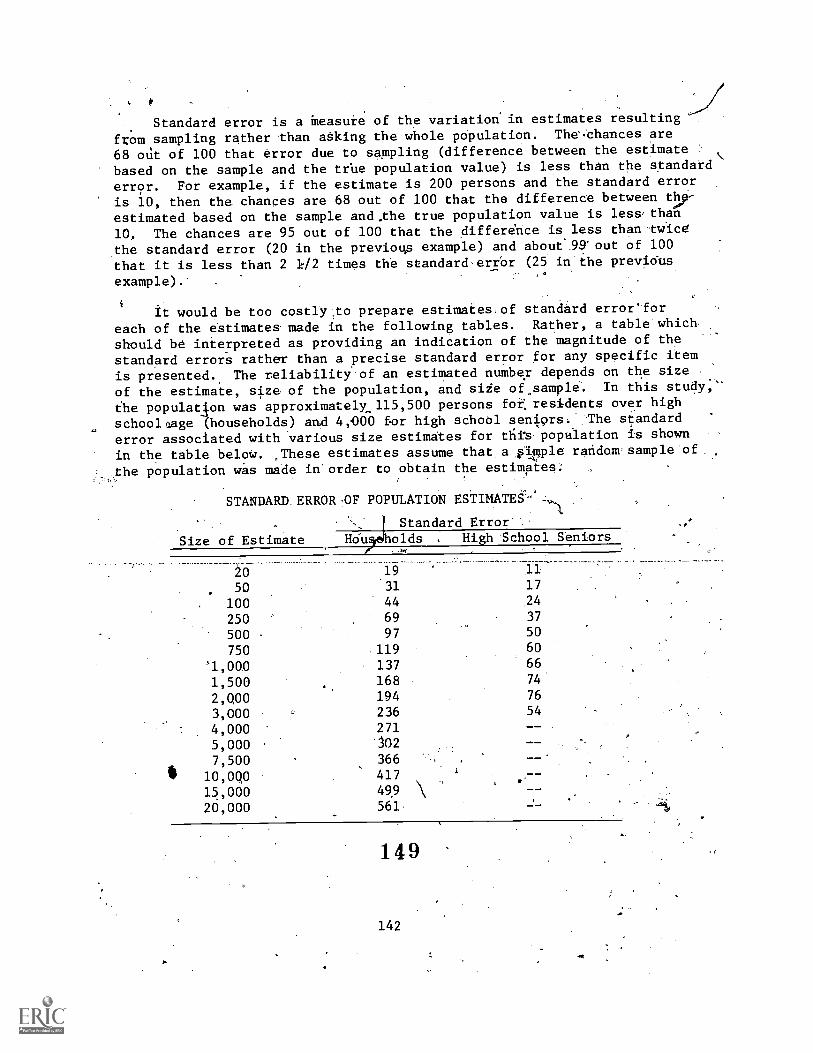
Standard error is a Measure of the variation in estimates resulting
from sampling rather than atking the whole population. The.chances are
68 mit of 100 that error due to sampling (difference between the estimate
based on the sample and the teue population value) is less than the standard
error. For example, if the estimate is 200 persons and the standard error
is 10, then the chances are 68 out of 100 that the difference between thy
estimated based on the sample and.the true population value is less,than
10,. The chances are 95 out of 100 that the difference is less than twice
the standard error (20 in the previoup example) and about' 99'out of 100
that it is less than 2 1./2 times the standard,error (25 in the previdus
example).
it would be too costly.to prepare estimates,of standard error'foreach of the estimates made in the following tables. Rather, a table which
should be interpreted as providing an indication of the magnitude of the
standard errors rather than a precise standard error for any specific item
is presented.. The reliability of an estimated number depends on the size
of the estimate, size of the population, and siie of.sample-. In this study,
ehe population was approximately,115,500 persons for:residents over high
schooloage (households) and 4,000 for high school seniors. The standard
error associated with various size estimates for tilts population is shown
in the table below. .These estimates assume that a gpple random sample o
the population Wes made in order to obtain the estimetes:
STANDARD. ERROR-OF POPULATION ESTIMATES'-'1
Size of Estimate
Standard Error- .-
Hou,&holds High School Seniors
20
50
1931
1117
100 44 .24
250 69 37
500 97 50
750 .119 60
1,000 137 66
1,500 168 74
2,000 194 76
3,000 236 54
4,000 271
5,000 '102
7,500,
366
10,000 417 ' .---
15,000 499 \20,000 561.
149
142