Embed Size (px)
Citation preview

Freeway Geometric Design for Active Traffic Management in Europe
International Technology Scanning Program
Sponsored by:
In cooperation with:
American Association of State Highway and Transportation Officials
National Cooperative Highway Research Program
M a r c h 2 0 1 1

N O T I c E
The Federal Highway Administration provides high-quality information to serve Government, industry, and the public in a manner that promotes public understanding. Standards and policies are used to ensure and maximize the quality, objectivity, utility, and integrity of its information. FHWA periodically reviews quality issues and adjusts its programs and processes to ensure continuous quality improvement.
Technical Report Documentation Page1. Report No.
FHWA-PL-11-0042. Government Accession No. 3. Recipient’s Catalog No.
4. Title and Subtitle
Freeway Geometric Design for Active Traffic Management in Europe
5. Report Date
March 20116. Performing Organization Code
7. Author(s)
Jeffrey C. Jones, Martin C. Knopp, Kay Fitzpatrick, Mark A. Doctor, Charles E. Howard, Gregory M. Laragan, James A. Rosenow, Brooke A. Struve, Barton A. Thrasher, and Elizabeth G. Young
8. Performing Organization Report No.
9. Performing Organization Name and Address
American Trade Initiatives P.O. Box 8228 Alexandria, VA 22306-8228
10. Work Unit No. (TRAIS)
11. Contract or Grant No.
DTFH61-99-C-00512. Sponsoring Agency Name and Address
Office of International ProgramsFederal Highway AdministrationU.S. Department of TransportationAmerican Association of State Highway and Transportation Officials
13. Type of Report and Period Covered
14. Sponsoring Agency Code
15. Supplementary Notes
FHWA COTR: Hana Maier, Office of International Programs16. Abstract
Continued growth in travel on congested urban freeway corridors exceeds the ability of agencies to provide sufficient solutions and alternatives based on traditional roadway expansion and improvement projects. Several countries are implementing managed motorway concepts to improve motorway capacity without acquiring more land and building large-scale infrastructure projects. The Federal Highway Administration, American Association of State Highway and Transportation Officials, and National Cooperative Highway Research Program sponsored a scanning study of England, Germany, the Netherlands, and Spain to examine the use of innovative geometric design practices and techniques to improve the operational performance of congested freeway facilities without compromising safety.
Managed motorways are a combination of active or dynamically managed operational regimes, specific designs of infrastructure, and technology solutions. The concept uses a range of traffic management measures to actively monitor the motorway and dynamically control speeds, add capacity, and inform road users of conditions on the network with the objective to optimize traffic and safety performance. Examples include shoulder running, variable mandatory speed limits, lane control signals, and driver information using variable message signs. Managed motorways increase journey reliability and throughput of a motorway by speed management and increase capacity by shoulder running.
17. Key Words
Active traffic management, driver information, increased capacity, lane control signal, managed motorways, plus lane, shoulder running, speed control, variable mandatory speed limits, variable message sign
18. Distribution Statement
No restrictions. This document is available to the public from the: Office of International Programs, FHWA-HPIP, Room 3325, U.S. Department of Transportation, Washington, DC [email protected]
19. Security Classify. (of this report)
Unclassified20. Security Classify. (of this page)
Unclassified21. No. of Pages
9222. PriceFree
Form DOT F 1700.7 (8-72) Reproduction of completed page authorized


Freeway Geometric Design for Active Traffic Management in EuropeMarch 2011
Jeffrey C. Jones (AASHTO Cochair) Tennessee DOT
Martin C. Knopp (FHWA Cochair) FHWA
Kay Fitzpatrick (Report Facilitator) Texas Transportation Institute
Mark A. Doctor FHWA
Charles E. Howard Puget Sound Regional Council
Gregory M. Laragan Idaho Transportation Department
James A. Rosenow Minnesota DOT
Brooke A. Struve FHWA
Barton A. Thrasher Virginia DOT
Elizabeth G. Young Parsons Brinckerhoff
For
Federal Highway Administration U.S. Department of Transportation
American Association of State Highway and Transportation Officials
National Cooperative Highway Research Program
Prepared by the International Scanning Study Team:

iv INTERNATIONAL TECHNOLOGY SCANNING PROGRAM
The International Technology Scanning Program, sponsored by the Federal Highway Administration (FHWA), the American Association of State Highway and Transportation Officials (AASHTO), and the National Cooperative Highway Research Program (NCHRP), evaluates innovative foreign technologies and practices that could significantly benefit U.S. highway transportation systems. This approach allows for advanced technology to be adapted and put into practice much more effi-ciently without spending scarce research funds to re-create advances already developed by other countries.
FHWA and AASHTO, with recommendations from NCHRP, jointly determine priority topics for teams of U.S. experts to study. Teams in the specific areas being investigated are formed and sent to countries where significant advances and innovations have been made in technology, management practices, organizational structure, program delivery, and financing. Scan teams usually include representa-tives from FHWA, State departments of transporta-tion, local governments, transportation trade and research groups, the private sector, and academia.
After a scan is completed, team members evaluate findings and develop comprehensive reports, including recommendations for further research and pilot projects to verify the value of adapting innovations for U.S. use. Scan reports, as well as the results of pilot programs and research, are circulated throughout the country to State and local transportation officials and the private sector. Since 1990, more than 80 international scans have been organized on topics such as pavements, bridge construction and maintenance, contracting, intermodal transport, organizational management, winter road maintenance, safety, intelligent transportation systems, planning, and policy.
The International Technology Scanning Program has resulted in significant improvements and savings in road program technologies and practices through-out the United States. In some cases, scan studies have facilitated joint research and technology- sharing projects with international counterparts, further conserving resources and advancing the state of the art. Scan studies have also exposed transportation professionals to remarkable advance-ments and inspired implementation of hundreds of innovations. The result: large savings of research dollars and time, as well as significant improvements in the Nation’s transportation system.
Scan reports can be obtained through FHWA free of charge by e-mailing [email protected]. Scan reports are also available electronically and can be accessed on the FHWA Office of International Pro-grams Web site at www.international.fhwa.dot.gov.
International Technology Scanning Program
FREEWAY GEOMETRIC DESIGN FOR ACTIvE TRAFFIC MANAGEMENT IN EUROPE v
n Safety Assuring Bridge Safety and Serviceability in Europe (2010)
Pedestrian and Bicyclist Safety and Mobility in Europe (2010)
Improving Safety and Mobility for Older Road Users in Australia and Japan (2008)
Safety Applications of Intelligent Transportation Systems in Europe and Japan (2006)
Traffic Incident Response Practices in Europe (2006)
Underground Transportation Systems in Europe: Safety, Operations, and Emergency Response (2006)
Roadway Human Factors and Behavioral Safety in Europe (2005)
Traffic Safety Information Systems in Europe and Australia (2004)
Signalized Intersection Safety in Europe (2003)
Managing and Organizing Comprehensive Highway Safety in Europe (2003)
European Road Lighting Technologies (2001)
Commercial Vehicle Safety, Technology, and Practice in Europe (2000)
Methods and Procedures to Reduce Motorist Delays in European Work Zones (2000)
Innovative Traffic Control Technology and Practice in Europe (1999)
Road Safety Audits—Final Report and Case Studies (1997)
Speed Management and Enforcement Technology: Europe and Australia (1996)
Safety Management Practices in Japan, Australia, and New Zealand (1995)
Pedestrian and Bicycle Safety in England, Germany, and the Netherlands (1994)
n Planning and Environment
Reducing Congestion and Funding Transportation Using Road Pricing In Europe and Singapore (2010)
Linking Transportation Performance and Accountability (2010)
Streamlining and Integrating Right-of-Way and Utility Processes With Planning, Environmental, and Design Processes in Australia and Canada (2009)
Active Travel Management: The Next Step in Congestion Management (2007)
Managing Travel Demand: Applying European Perspectives to U.S. Practice (2006)
Transportation Asset Management in Australia, Canada, England, and New Zealand (2005)
Transportation Performance Measures in Australia, Canada, Japan, and New Zealand (2004)
European Right-of-Way and Utilities Best Practices (2002)
Geometric Design Practices for European Roads (2002)
Wildlife Habitat Connectivity Across European Highways (2002)
Sustainable Transportation Practices in Europe (2001)
Recycled Materials in European Highway Environments (1999)
European Intermodal Programs: Planning, Policy, and Technology (1999)
National Travel Surveys (1994)
n Policy and Information
Transportation Research Program Administration in Europe and Asia (2009)
Practices in Transportation Workforce Development (2003)
International Technology Scan ReportsInternational Technology Scanning Program: Bringing Global Innovations to U.S. Highways
vi INTERNATIONAL TECHNOLOGY SCAN REPORTS
Intelligent Transportation Systems and Winter Operations in Japan (2003)
Emerging Models for Delivering Transportation Programs and Services (1999)
National Travel Surveys (1994)
Acquiring Highway Transportation Information From Abroad (1994)
International Guide to Highway Transportation Information (1994)
International Contract Administration Techniques for Quality Enhancement (1994)
European Intermodal Programs: Planning, Policy, and Technology (1994)
n Operations
Freight Mobility and Intermodal Connectivity in China (2008)
Commercial Motor Vehicle Size and Weight Enforcement in Europe (2007)
Active Travel Management: The Next Step in Congestion Management (2007)
Managing Travel Demand: Applying European Perspectives to U.S. Practice (2006)
Traffic Incident Response Practices in Europe (2006)
Underground Transportation Systems in Europe: Safety, Operations, and Emergency Response (2006)
Superior Materials, Advanced Test Methods, and Specifications in Europe (2004)
Freight Transportation: The Latin American Market (2003)
Meeting 21st Century Challenges of System Performance Through Better Operations (2003)
Traveler Information Systems in Europe (2003)
Freight Transportation: The European Market (2002)
European Road Lighting Technologies (2001)
Methods and Procedures to Reduce Motorist Delays in European Work Zones (2000)
Innovative Traffic Control Technology and Practice in Europe (1999)
European Winter Service Technology (1998)
Traffic Management and Traveler Information Systems (1997)
European Traffic Monitoring (1997)
Highway/Commercial Vehicle Interaction (1996)
Winter Maintenance Technology and Practices—Learning from Abroad (1995)
Advanced Transportation Technology (1994)
Snowbreak Forest Book—Highway Snowstorm Countermeasure Manual (1990)
n Infrastructure—General Freeway Geometric Design for Active Traffic Management in Europe (2011)
Public-Private Partnerships for Highway Infrastructure: Capitalizing on International Experience (2009)
Audit Stewardship and Oversight of Large and Innovatively Funded Projects in Europe (2006)
Construction Management Practices in Canada and Europe (2005)
European Practices in Transportation Workforce Development (2003)
Contract Administration: Technology and Practice in Europe (2002)
European Road Lighting Technologies (2001)
Geometric Design Practices for European Roads (2001)
Geotechnical Engineering Practices in Canada and Europe (1999)
Geotechnology—Soil Nailing (1993)
n Infrastructure—Pavements
Warm-Mix Asphalt: European Practice (2008)
Long-Life Concrete Pavements in Europe and Canada (2007)
Quiet Pavement Systems in Europe (2005)
Pavement Preservation Technology in France, South Africa, and Australia (2003)
Recycled Materials in European Highway Environments (1999)
South African Pavement and Other Highway Technologies and Practices (1997)
Highway/Commercial Vehicle Interaction (1996)
European Concrete Highways (1992)
European Asphalt Technology (1990)

FREEWAY GEOMETRIC DESIGN FOR ACTIvE TRAFFIC MANAGEMENT IN EUROPE vii
n Infrastructure—Bridges
Assuring Bridge Safety and Serviceability in Europe (2010)
Bridge Evaluation Quality Assurance in Europe (2008)
Prefabricated Bridge Elements and Systems in Japan and Europe (2005)
Bridge Preservation and Maintenance in Europe and South Africa (2005)
Performance of Concrete Segmental and Cable-Stayed Bridges in Europe (2001)
Steel Bridge Fabrication Technologies in Europe and Japan (2001)
European Practices for Bridge Scour and Stream Instability Countermeasures (1999)
Advanced Composites in Bridges in Europe and Japan (1997)
Asian Bridge Structures (1997)
Bridge Maintenance Coatings (1997)
Northumberland Strait Crossing Project (1996)
European Bridge Structures (1995)
All publications are available on the Internet at www.international.fhwa.dot.gov.

viii CONTENTS
Contents
Executive Summary 1Introduction 1Background 1Key Findings 2Findings for Design 5Findings for Performance Measures 7Findings for Planning 7Findings for Lessons Learned 7 Next Steps 8
Chapter 1: Introduction 9Background 9Purpose 9Managed Motorways—A Definition 10Scan Team Members 10Travel Itinerary 11Host Delegations 11Questions 11 Report Format 12
Chapter 2: European Agency Approaches to Managed Motorways 13
Spain 13Meeting and Presentations 13 Design Overview 13 Case Study Examples 13
Germany 15Meetings and Presentations 15 Hessen 15 Congestion-Free Hessen 2015 15 Line Control in Hessen 16 Hard Shoulder Running in Hessen 16 Long-Distance Corridors in Hessen 18 Rheinland-Pfalz 18 Line Control Systems 19
Dynamic Rerouting 19 Hard Shoulder Running 19 Overview of Hard Shoulder Running 19 Safety of Hard Shoulder Running 20 German Lane Widths 22
Netherlands 25Meetings and Presentations 25 National Mobility Scheme 25 Hard Shoulder Running 25 Dynamic Speed Limits 28 Interchange Lane Control 29 Geometric Design 29
England 32Meetings and Presentations 32 Highways Agency Strategic Plan 32 Controlled Motorways 32 Managed Motorways 33 M42 Pilot Study 33 Compliance With variable Mandatory Speed Limits 35 Web Sites 36 Managed Motorway Elements 36 Managed Motorway Safety 39 Managed Motorway Hazard Log 42 Reported Benefits 42 Recent Developments 43 Education 45 Traffic Officers 46
Chapter 3: Key Findings 47
Chapter 4: Implementation Strategy 49
Appendix A: Scan Team Members 51
Appendix B: Symposium Findings 55

FREEWAY GEOMETRIC DESIGN FOR ACTIvE TRAFFIC MANAGEMENT IN EUROPE ix
Appendix C: Workshop on Managed Motorways— A Way Forward for the Future 67
Appendix D: Host Country Contacts 68
Appendix E: Amplifying Questions 71
Glossary 75
Endnotes 77
FiguresFigure 1. England: variable speed limit in Birmingham (vehicles enter the roadway from the left, opposing traffic is on the right, and speeds shown are in miles per hour). 1
Figure 2. Netherlands: shoulder running. 2
Figure 3. England: variable message signs in Birmingham (vehicles enter the roadway from the left, opposing traffic is on the right, and speeds shown are in miles per hour). 2
Figure 4. Germany: shoulder use and variable speed limit in Hessen (speeds are in kilometers per hour). 3
Figure 5. Netherlands: variable speed limit (speeds are in kilometers per hour). 3
Figure 6. England: emergency refuge area in Birmingham (traffic travels on the left side on England’s roadways). 3
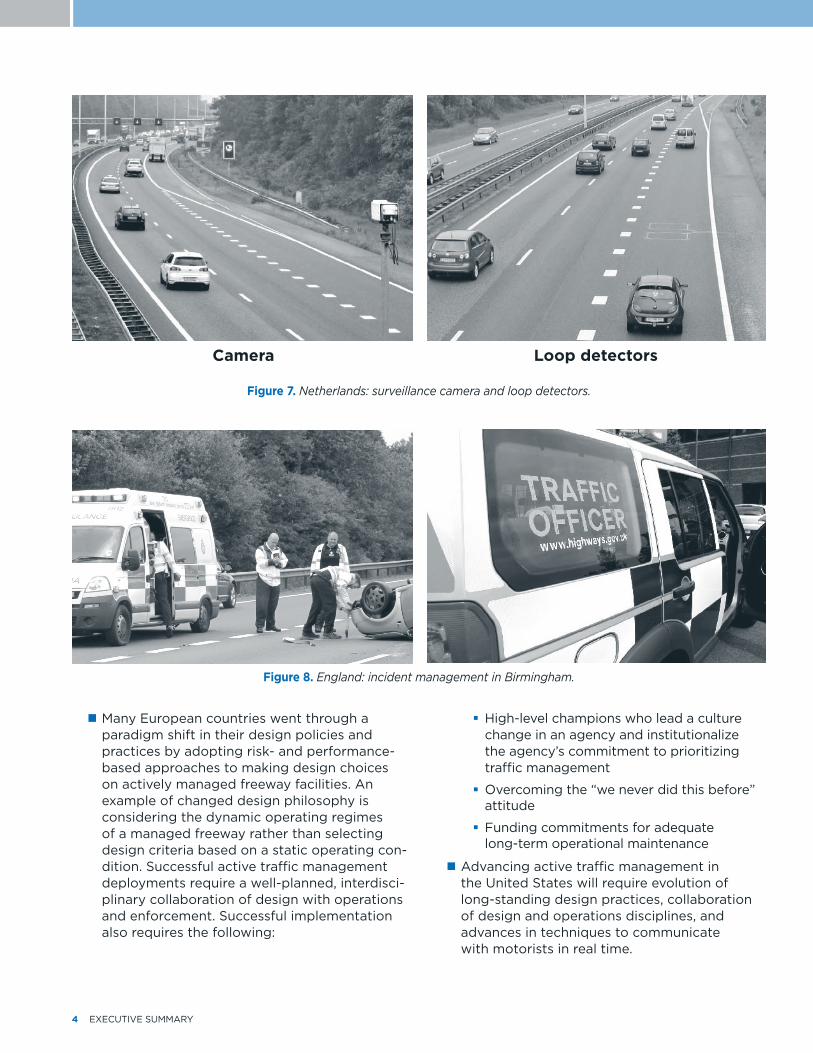
Figure 7. Netherlands: surveillance camera and loop detectors. 4
Figure 8. England: incident management in Birmingham. 4
Figure 9. Automated enforcement signs. 5
Figure 10. Freeway geometric design practices for improved performance scan team (from left to right, first row, Liz Young, Charlie Howard, Kay Fitzpatrick, Brooke Struve, Jim Rosenow; second row, Bart Thrasher, Jeff Jones, Martin Knopp, Mark Doctor, Greg Laragan). 10
Figure 11. Spain: view of approach and exit from tunnel. 14
Figure 12. Germany: duration of congestion on motorways in Hessen. 16
Figure 13. Germany: signs for hard shoulder running. 17
Figure 14. Germany: temporary hard shoulder running impact on congestion for A5. 17
Figure 15. Germany: temporary hard shoulder running impact on safety for A5. 18
Figure 16. Germany: cross section for four-lane freeways allowing hard shoulder running. 21
Figure 17. Germany: road safety on the A7 where AR(I) = fatal and severe injury crash rate and AR(II) = slight injury crash + severe property damage-only crash rate. 22
Figure 18. Germany: standard cross sections for interurban autobahn (freeway). 23
Figure 19. Germany: standard cross section for four-lane highways. 23
Figure 20. Germany: standard cross section for intercity autobahn (freeways). 24
Figure 21. Netherlands: hard shoulder running. 25
Figure 22. Netherlands: hard shoulder running. 26
Figure 23. Netherlands: plus lane with former style of lane markings. 26
Figure 24. Netherlands: A12 plus lane with current plus lane markings and truck restriction. 26
Figure 25. Netherlands: A12 plus lane closed to traffic. 27
Figure 26. Netherlands: signs used to indicate hard shoulder running is closing. 27
Figure 27. Netherlands: example of when hard shoulder running is not permitted. 27
Figure 28. Netherlands: closeup of red cross used to indicate hard shoulder running is not permitted. 28
Figure 29. Netherlands: off-ramp design. 28
Figure 30. Netherlands: on-ramp design. 28
Figure 31. Netherlands: opening sequence for hard shoulder running. 29
Figure 32. Netherlands: traffic safety at hard shoulder running and plus lane sites. 29
x CONTENTS
Figure 33. Netherlands: traffic benefits of hard shoulder running and plus lanes. 30
Figure 34. Netherlands: interchange with interchange merge control. 30
Figure 35. England: location of pilot test of hard shoulder running on the M42 in Birmingham. 33
Figure 36. England: variable mandatory speed limit compliance. 35
Figure 37. England: graphic showing managed motorway parts. 37
Figure 38. England: detection methods. 37
Figure 39. England: emergency refuge area and sign. 38
Figure 40. England: telephone in an emergency refuge area. 38
Figure 41. England: variable message signs. 39
Figure 42. England: variable speed limit and shoulder control signs in Birmingham. 40
Figure 43. England: mandatory lane signals. 41
Figure 44. England: M42 pilot safety case study. 41
Figure 45. England: comparison of hazards for active traffic management site and other comparable sites. 42
Figure 46. England: hazard log bar chart. 43
Figure 47. England: journey time improvements. 44
Figure 48. England: potential through shoulder running signs. 45
Figure 49. England: new legend for through shoulder running being tested. 45
Figure 50. Denmark: locations with ghost driver initiatives. 57
Figure 51. Denmark: treatments for ghost drivers. 57
Figure 52. Denmark: chevron markings. 58
Figure 53. Netherlands: pavement markings for three road classes. 58
Figure 54. Sweden: motorway and alternative four-lane cross sections from the 1970s. 61
Figure 55. Sweden: typical 2+1 median barrier design on 13-m paved width. 61
Figure 56. Sweden: overtaking lane principles with rumble or barrier median. 61
Figure 57. Sweden: median barrier project. 62
Figure 58. United Kingdom: WS2+1 layout. 63
Figure 59. United Kingdom: hard shoulder use. 63
Figure 60. Conceptualized driver decision model. 65
Figure 61. Relationship between efficiency and information to process. 66
Tables
Table 1. Hosted locations for the freeway geometric design scanning study. 9
Table 2. Germany: sections with dynamic hard shoulder running in 2009. 20
Table 3. Germany: sections included in safety study on hard shoulder running. 21
Table 4. Netherlands: road projects. 25
Table 5. Netherlands: results of pilot study on interchange merge control. 31
Table 6. Netherlands: cross section widths. 31
Table 7. England: Highways Agency managed motorway draft program. 36

FREEWAY GEOMETRIC DESIGN FOR ACTIvE TRAFFIC MANAGEMENT IN EUROPE 1
Executive Summary
Introduction
Continued growth in travel along congested freeway corridors exceeds the ability of agencies to provide sufficient solutions and alternatives based on traditional roadway expansion and improvement projects. High construction costs, constrained right-of-way, statutory restrictions, and environmental factors are pushing agencies to explore solutions such as active traffic manage-ment and managed lanes, which improve safety by reducing collisions and nonrecurring congestion and maximize throughput under congested conditions. Finding cost-effective options to mitigate recurrent and nonrecurrent congestion on freeway facilities is one of the most significant challenges State and regional transportation organizations face.
Several countries are implementing managed motorway concepts to move higher traffic volumes on their highways more efficiently without acquir-ing more land and constructing large-scale infra-structure projects. Managed motorway concepts introduce new and revised operational activities that place greater reliance on technology than traditional roadway projects. Managed motorways combine actively or dynamically managed opera-tional regimes, specific infrastructure designs, and technology solutions. They use a range of traffic management measures to actively monitor the motorway based on real-time conditions:
Dynamically control speeds (see figure 1). ��
Add capacity (figure 2, see next page). ��
Inform road users of conditions on the network ��(figure 3, see next page).
The objective of implementing this range of mea-sures is to optimize traffic and safety performance.
Examples of these measures include shoulder running, variable speed limits, lane control signals, dynamic rerouting, and the provision of driver information using variable message signs. Managed motorway concepts applied in Europe have been proven to reduce collisions, improve journey time reliability, and increase vehicular throughput.
BackgroundIn 2006 a scan team observed that transportation agencies in Denmark, England, Germany, and the Netherlands, through the deployment of conges-tion management strategies, were able to optimize the investment in infrastructure to meet drivers’ needs. Strategies included speed harmonization, temporary shoulder use, and dynamic signing and rerouting. The team’s recommendations for U.S. implementation included promoting active traffic management to optimize existing infrastructure during recurrent and nonrecurrent congestion,
Figure 1. England: variable speed limit in Birmingham (vehicles enter the roadway from the left, opposing traffic is
on the right, and speeds shown are in miles per hour).

2 EXECUTIvE SUMMARY
emphasizing customer orientation, focusing on trip reliability, providing consistent messages to roadway users, and making operations a priority in planning, programming, and funding processes.
Since the 2006 scanning study, active traffic management concepts have been implemented in Washington and Minnesota and are being consid-ered in virginia. During these implementations, several geometric design-related questions were voiced. A scanning study was proposed to obtain a better appreciation for how geometric design is being handled with active traffic management programs. The desk scan revealed that several European countries have implemented innovative geometric design solutions in their active traffic management programs. In June 2010 a team
of 10 U.S. transportation professionals with expertise in planning, design, and operation of freeways visited four countries in Europe: England, Germany, the Netherlands, and Spain. The purpose of the scanning study was to examine active traffic management design practices used in other coun-tries to improve the operational performance of congested freeway facilities without compromising safety. This 2010 scan built on other scans that focused on congestion management and managed lane programs.
Key FindingsKey findings from the 2010 scan include the following:
Much like the United States, many European ��nations face growing traffic and congestion levels on their freeway networks. Several European highway agencies are responding to growing congestion by implementing active traffic management systems that better use the existing roadway footprint. In Europe, “managed motorways” is the term used to describe the range of traffic manage-ment measures implemented to improve traffic flow, enhance safety, and inform road users of conditions on the freeway network. Managed motorway concepts have had great success in the countries the scan team visited, and these strategies and techniques are likely to provide great benefit if applied in the United States.
The European countries ��visited comprehensively integrate a suite of com-plementary techniques to dynamically manage traffic flow in response to changing volumes, speeds, and incidents. The result is demonstrably improved safety, travel time reliabil-ity, and congestion relief on urban motorway sections. Techniques that integrate roadway design with operational strategies include the following:
Figure 2. Netherlands: shoulder running.
Figure 3. England: variable message signs in Birmingham (vehicles enter the roadway from the left, opposing traffic is on the right, and speeds shown are in miles per hour).

FREEWAY GEOMETRIC DESIGN FOR ACTIvE TRAFFIC MANAGEMENT IN EUROPE 3
variable speed limits, line control, and �speed harmonization (see figures 1, 4, and 5)
Shoulder running (figures 2 and 4) with �emergency refuge areas (figure 6)
Queue warning and variable messaging �(figure 3)
24/7 monitoring of traffic with cameras �and/or in-pavement sensors (both to detect incidents and identify when to reduce speed limits) (figure 7, see next page)
Incident management (figure 8, �see next page)
Automated enforcement (see figure 9 �on page 5 for examples of signs)
Specialized algorithms for temporary �shoulder running, variable speed limits, and/or incident detection and management
Ramp metering (coordinated or �independent function)
Managed motorway strategies are synergistic ��and are most effective when applied in an integrated and dynamic system.
Many managed motorway concepts are ��applicable to all U.S. metro areas and rural high-volume freeway corridors. The manage-ment strategies appropriate for a freeway corridor evolve as the needs and demands of the area change. In other words, transportation officials should recognize that freeways need a continuum of operational and management strategies that change as traffic needs and demands change.
European countries faced safety concerns ��similar to those in the United States and successfully addressed those concerns in managed motorway deployments. Managed motorways have contributed to substantial safety improvements in Europe.
Figure 4. Germany: shoulder use and variable speed limit in Hessen (speeds are in kilometers per hour).(11)
Figure 5. Netherlands: variable speed limit (speeds are in kilometers per hour).
Figure 6. England: emergency refuge area in Birmingham (traffic travels on the left side on England’s roadways).
4 EXECUTIvE SUMMARY
Many European countries went through a ��paradigm shift in their design policies and practices by adopting risk- and performance-based approaches to making design choices on actively managed freeway facilities. An example of changed design philosophy is considering the dynamic operating regimes of a managed freeway rather than selecting design criteria based on a static operating con-dition. Successful active traffic management deployments require a well-planned, interdisci-plinary collaboration of design with operations and enforcement. Successful implementation also requires the following:
High-level champions who lead a culture �change in an agency and institutionalize the agency’s commitment to prioritizing traffic management
Overcoming the “we never did this before” �attitude
Funding commitments for adequate �long-term operational maintenance
Advancing active traffic management in ��the United States will require evolution of long-standing design practices, collaboration of design and operations disciplines, and advances in techniques to communicate with motorists in real time.
Figure 8. England: incident management in Birmingham.
Camera Loop detectors
Figure 7. Netherlands: surveillance camera and loop detectors.

FREEWAY GEOMETRIC DESIGN FOR ACTIvE TRAFFIC MANAGEMENT IN EUROPE 5
Findings for Design
Functionality of shoulders. �� Representatives of the host highway agencies shared their evolving perspectives on the functionality of freeway shoulders. In both England and the Netherlands, it was noted that the need for the outside shoulder to serve as a disabled vehicle area has diminished because of improvements in vehicle mechanical reliability. Therefore, the risk level for not providing full shoulder widths may have diminished since fundamental freeway design criteria were first established. These types of considerations weigh into the host highway agencies’ assessment of the tradeoffs for continual or dynamic shoulder running. Each of the countries visited had a general practice of reducing the speed limits in freeway sections where shoulder width was reduced (both permanently and part time) to allow shoulder running.
Shoulder running (or plus lanes) with variable ��speed limits. On some motorway segments in England, Germany, and the Netherlands, the shoulder is used dynamically to create an additional travel lane when conditions are appropriate. When the travel lane is added on the outside edge (e.g., right side for Germany and the Netherlands, left side for England), “hard shoulder running” is the term generally used. When the additional lane is on the inside edge, “plus lane” is the term used. Gantries that include speed and lane control signs are provided in these sections and can show a green arrow when the lane is available for use and a red cross when it is closed. The signs can also show the appropriate speed limit for when shoulder running is allowed or the plus lane can be used. In Germany, when a paved shoul-der is converted to a travel lane, a reduced speed limit of 120 kilometers per hour (km/h) (75 miles per hour (mi/h) is considered (from a normal speed limit of 130 to 150 km/h (81 to 93 mi/h)). If reallocation of the roadway for hard shoulder running reduces lane widths to less than 3.5 meters (m) (11.5 feet (ft)), a speed limit of 100 km/h (62 mi/h) is instituted. During shoulder running, the speed limit of the hard shoulder and the general travel lanes varies based on data from surveillance systems (loop detectors and/or cameras).
Lane width. �� When an existing roadway cross section is reallocated to add a lane, existing lane widths may be narrowed to accommodate the new lane. In several locations, lane widths varied within the cross section, with narrower lanes typically on the inside (or the lane nearest the median). In some instances, no-passing
Figure 9. Automated enforcement signs.
England: roadside sign in Birmingham
England: sign on overhead gantry in Birmingham
Netherlands: roadside sign

6 EXECUTIvE SUMMARY
restrictions were instituted for trucks to restrict them from the narrow inside lanes, harmonize speeds, and maintain lane control.
Shoulder running and ramp junctions. ��Different approaches are considered for shoulder running through ramp junctions. In England, initial operations of shoulder running used only shoulder segments between ramps (i.e., the shoulder functioned as a lane gain or lane drop at each interchange). In 2009 Eng-land implemented a pilot allowing through junction running on the M42 motorway at certain locations to increase capacity at key bottlenecks.
Lighting needs with shoulder running. ��Lighting for shoulder running sections has been a discussion topic in England and, over time, the Highways Agency has found that continuous lighting treatments are not highly essential. In Germany and the Netherlands, continuous lighting is considered beneficial.
Variable speed limits, line control, and speed ��harmonization. Speed harmonization is intro-duced through the use of variable speed limits to improve traffic flow on freeway sections that experience recurrent congestion and protect vehicles at the back of congestion- or incident-related queues. The speed harmonization system detects changes in traffic speeds and volumes along a corridor, and an algorithm automatically reduces speeds based on real-time traffic conditions. To ensure respect for the variable speed limits, communicating the reason for the lower speed and enforcement is essential. Representatives of the European agencies used the phrase “trust equals compli-ance” on several occasions to indicate that the speed limit needs to be reasonable and the reason for lower speed needs to be clear.
Gantry and detector spacing. �� The spacing between gantries that contain variable speed limit and line control signs and detectors that collect traffic data varies among counties. In Germany the national standard is 2.5 km (1.6 mi), but Hessen spaces its detectors at 1 km (0.6 mi) and gantries at 1 to 1.5 km (0.6 to 0.9 mi). It justifies the closer spacing to collect better traffic flow data, provide better alter-nate route information, and improve system
management. Other countries use 600-m (0.37-mi) to 1,000-m (0.62-mi) spacing of gantries. For gantry spacing, the countries visited stressed the importance of having a continuum of information with intervisibility of signs on successive gantries for the driver.
Emergency refuge areas. �� When the shoulder was used as a travel lane—either part time or permanently—emergency refuge areas were added. The spacing of the refuge areas varied by facility and country.
Signs. �� There is an ongoing debate on the best balance between static and variable message signs. One thought is that variable message signs provide better opportunity to communi-cate with the driver, such as the reason for speed limit changes or the presence of a queue or anticipated delay downstream. Some sug-gest that all signs should be dynamic signs, whether electronic or mechanical. However, variable message signs are more costly and require backup power systems to maintain continuous operation during a power failure.
Evolution in design philosophy: transition to a ��performance- or risk-based design approach. Representatives from England, Germany, and the Netherlands all emphasized the need to use performance- and risk-based methods for making design choices. Historically, highway design criteria have been developed with a static roadway in mind. On a dynamically operated roadway, the needs and solutions may differ from those of a statically designed road-way. Performance-based design is an outcome-based, operationally focused design approach that considers the desired goals and objectives of the transportation facility and establishes project design criteria accordingly. England has developed a risk-based approach to innovative design practices, providing additional flexibility to design for safe operations.
Evolution of design criteria. �� Countries continuously evaluate cost-saving approaches, including the tradeoffs of increasing the spacing between gantries, detectors, and emergency refuge areas. In England earlier implementations are now considered conservative and experience indicates that greater spacing may be appropriate.
FREEWAY GEOMETRIC DESIGN FOR ACTIvE TRAFFIC MANAGEMENT IN EUROPE 7
Findings for Performance Measures
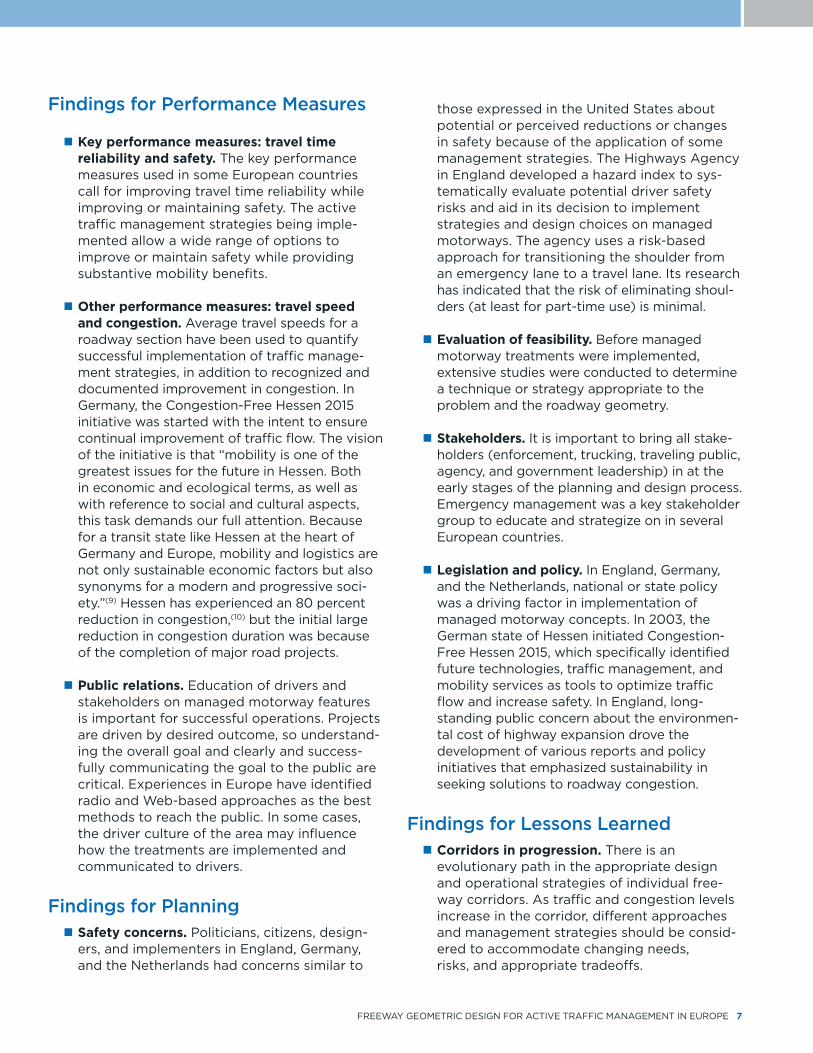
Key performance measures: travel time ��reliability and safety. The key performance measures used in some European countries call for improving travel time reliability while improving or maintaining safety. The active traffic management strategies being imple-mented allow a wide range of options to improve or maintain safety while providing substantive mobility benefits.
Other performance measures: travel speed ��and congestion. Average travel speeds for a roadway section have been used to quantify successful implementation of traffic manage-ment strategies, in addition to recognized and documented improvement in congestion. In Germany, the Congestion-Free Hessen 2015 initiative was started with the intent to ensure continual improvement of traffic flow. The vision of the initiative is that “mobility is one of the greatest issues for the future in Hessen. Both in economic and ecological terms, as well as with reference to social and cultural aspects, this task demands our full attention. Because for a transit state like Hessen at the heart of Germany and Europe, mobility and logistics are not only sustainable economic factors but also synonyms for a modern and progressive soci-ety.”(9) Hessen has experienced an 80 percent reduction in congestion,(10) but the initial large reduction in congestion duration was because of the completion of major road projects.
Public relations. �� Education of drivers and stakeholders on managed motorway features is important for successful operations. Projects are driven by desired outcome, so understand-ing the overall goal and clearly and success-fully communicating the goal to the public are critical. Experiences in Europe have identified radio and Web-based approaches as the best methods to reach the public. In some cases, the driver culture of the area may influence how the treatments are implemented and communicated to drivers.
Findings for Planning Safety concerns. �� Politicians, citizens, design-ers, and implementers in England, Germany, and the Netherlands had concerns similar to
those expressed in the United States about potential or perceived reductions or changes in safety because of the application of some management strategies. The Highways Agency in England developed a hazard index to sys-tematically evaluate potential driver safety risks and aid in its decision to implement strategies and design choices on managed motorways. The agency uses a risk-based approach for transitioning the shoulder from an emergency lane to a travel lane. Its research has indicated that the risk of eliminating shoul-ders (at least for part-time use) is minimal.
Evaluation of feasibility. �� Before managed motorway treatments were implemented, extensive studies were conducted to determine a technique or strategy appropriate to the problem and the roadway geometry.
Stakeholders. �� It is important to bring all stake-holders (enforcement, trucking, traveling public, agency, and government leadership) in at the early stages of the planning and design process. Emergency management was a key stakeholder group to educate and strategize on in several European countries.
Legislation and policy. �� In England, Germany, and the Netherlands, national or state policy was a driving factor in implementation of managed motorway concepts. In 2003, the German state of Hessen initiated Congestion-Free Hessen 2015, which specifically identified future technologies, traffic management, and mobility services as tools to optimize traffic flow and increase safety. In England, long-standing public concern about the environmen-tal cost of highway expansion drove the development of various reports and policy initiatives that emphasized sustainability in seeking solutions to roadway congestion.
Findings for Lessons LearnedCorridors in progression. �� There is an evolutionary path in the appropriate design and operational strategies of individual free-way corridors. As traffic and congestion levels increase in the corridor, different approaches and management strategies should be consid-ered to accommodate changing needs, risks, and appropriate tradeoffs.

8 EXECUTIvE SUMMARY
Effective use of space. �� Several European countries dynamically manage the freeway space available. For example, they may use the paved shoulder space for traffic movement during peak travel periods and as a typical shoulder during offpeak travel times.
Importance of collaborative design process. ��Actively and effectively managing roadways requires coordination across disciplines, and collaboration among planning, operations, and design is imperative. In England the Highways Agency uses the operational regimes to deter-mine design criteria rather than adhere strictly to design standards.
Operating costs. �� Stable, consistent, and ongoing funding for operations and mainte-nance is a critical component of the managed motorway concept.
Capital costs. �� The M42 in England was designed conservatively on spacing of gan-tries, emergency refuge areas, and ancillary equipment. After monitoring operations and results, the English are making incremental changes based on data that demonstrate they can maintain or improve flow and safety while increasing the spacing between gantries and refuge areas and reducing lighting to lower costs.
Complementary treatments. �� Many applications are complementary. For example, line control (or variable speed limits) and shoulder running installations result in complementary and synergistic operations and benefits.
Benefits. �� The countries visited report that managed motorways result in improved safety, reliability, and air quality benefits and can be provided at less cost than traditional capacity expansion.
Public perception. �� The countries recognize that a proposed operational scheme will be successful only if the public perceives it to be successful (despite what data may say).
Procurement. �� Construction methods are evolv-ing as a result of the high degree of technology required for managed motorway concepts. England has used innovative construction
methods and offsite locations to assemble managed motorway gantries, signs, and ancillary equipment and realized efficiencies in buying equipment.
Sign messages. �� England, Germany, and the Netherlands have found that it is important to test new sign messages with users before implementation.
Next Steps As evidenced in this report, the scan team believes that much can be gained in the United States by implementing several concepts and strategies observed during the scanning study. The next critical step is the implementation phase. Scan team members are communicating key findings, promoting implementation ideas, and advancing the adoption of key approaches and practices described in this report. The scan team is also seeking champions from transportation agencies and organizations to implement policies and practices using flexibility and innovation in designing freeways for improved safety and operational performance.

FREEWAY GEOMETRIC DESIGN FOR ACTIvE TRAFFIC MANAGEMENT IN EUROPE 9
Chapter 1: Introduction
The purpose of this scanning study was to examine innovative design practices and techniques used in other countries to improve the operational performance of congested freeway facilities with-out compromising safety. This scan builds on other scans that focused on congestion management and managed lane programs.
BackgroundThe Federal Highway Administration’s (FHWA) Office of International Programs leads and coordi-nates efforts to implement international programs and activities that meet the priorities of FHWA and the U.S. transportation community.(1) The Interna-tional Highway Technology Scanning Program serves as a means to access innovative technologies and practices in other countries that could signifi-cantly improve highways and highway transporta-tion services in the United States. The program enables innovations to be adapted and put into practice much more efficiently without spending scarce research funds to re-create advances already developed by other countries. Personal domestic and international networking, team dynamics, and the creation of domestic champions for promising foreign ideas are keystones of the scan process. Successful implementation in the United States of the world’s best practices is the goal of the program.(2) The program is undertaken jointly with the American Association of State Highway and Transportation Officials (AASHTO) and the Transportation Research Board’s (TRB) National Cooperative Highway Research Program (NCHRP).
Planning for this scanning study began in February 2010 with a desk scan that recommended England, Germany, and the Netherlands as the countries to visit, along with Spain as the host of the 4th Interna-tional Symposium on Geometric Design. In June 2010 a team of 10 U.S. transportation professionals with expertise in planning, design, and operations of
freeways visited the four countries. Appendix A provides contact information and biographies for the team members. Table 1 lists the locations visited. During the scan, the team also attended the 4th International Symposium on Geometric Design and a workshop on managed motorways. Key findings from the symposium are in Appendix B. Appendix C provides the workshop agenda.
Table 1. Hosted locations for the freeway geometric design scanning study.
Countries Visited Locations Visited
Spain valencia
Germany Frankfurt, Hessen, and Mainz, Rheinland-Pfalz
Netherlands Delft and Utrecht
England Birmingham
Purpose
Continued growth in travel on congested urban freeway corridors exceeds the ability of agencies to provide sufficient solutions and alternatives based on traditional roadway expansion and improvement projects. High construction costs, constrained right-of-way, statutory restrictions, and environmen-tal factors are pushing agencies to explore solutions such as active traffic management and managed lanes to maximize throughput under congested conditions and improve safety by reducing collisions and nonrecurring congestion.
The purpose of the scanning study was to examine design practices and techniques used in other countries to improve the operational performance and safety of congested freeway facilities. Finding cost-effective options to mitigate recurrent and nonrecurrent congestion on urban freeway facilities

10 CHAPTER 1: INTRODUCTION
is one of the most significant challenges State and regional transportation organizations face. Interna-tionally, transport agencies are using geometric design treatments linked to operational strategies, such as reallocating the roadway cross section, to dynamically reduce congestion while improving or maintaining safety of freeways in congested urban freeway corridors.
Managed Motorways—A Definition“Managed motorways” is a term used in Europe and Australia.(3) Managed motorways combine actively or dynamically managed operational regimes, specific infrastructure designs, and technology solutions. They use a range of traffic management measures to actively monitor the motorway and, based on the monitoring, dynamically control speeds, add capacity, and inform road users of conditions on the network to optimize traffic and safety performance.
Examples of these measures include hard shoulder running, variable mandatory speed limits, lane control signals, incident detection and response, and driver information using variable message signs.
Managed motorways provide a significant opportu-nity to improve the capacity of motorways (called freeways in the United States) without acquiring more land and building large-scale infrastructure projects. Managed motorway concepts introduce new and revised operational activities that place greater reliance on technology than previously.
Managed motorways increase journey reliability and throughput of a motorway by speed management, and they increase capacity by hard shoulder running. Other techniques can be used to reduce disruption from joining traffic (e.g., ramp metering) and to improve safety (e.g., monitoring, detection, and emergency refuge areas).
For terms used in connection with managed motorways, see the Glossary.
Scan Team MembersThe 10 scan team members (see figure 10) represented Federal agencies, State departments of transportation (DOTs), metropolitan planning organizations, research agencies, and private firms:
Jeffrey (Jeff) C. Jones�� (AASHTO cochair), assistant chief engineer of design, Tennessee DOT
Martin C. Knopp�� (FHWA cochair), division administrator, FHWA Florida and Puerto Rico Divisions
Kay Fitzpatrick�� (report facilitator), senior research engineer, Texas Transportation Institute
Mark A. Doctor,�� safety and design engineer, FHWA Resource Center
Figure 10. Freeway geometric design practices for improved performance scan team (from left to right, first row, Liz Young, Charlie Howard, Kay Fitzpatrick, Brooke Struve, Jim Rosenow;
second row, Bart Thrasher, Jeff Jones, Martin Knopp, Mark Doctor, Greg Laragan).
FREEWAY GEOMETRIC DESIGN FOR ACTIvE TRAFFIC MANAGEMENT IN EUROPE 11
Charles (Charlie) E. Howard,�� transportation planning director, Puget Sound Regional Council
Gregory (Greg) M. Laragan, �� assistant chief engineer, operations, Idaho Transportation Department
James (Jim) A. Rosenow,�� State geometrics engineer, Geometric Design Support Unit, Minnesota DOT
Brooke A. Struve, �� design program manager, FHWA
Barton A. Thrasher,�� assistant State location and design engineer, virginia DOT
Elizabeth (Liz) G. Young, �� project manager and senior supervising transportation planner, Parsons Brinckerhoff.
Travel ItineraryDuring the 2-week study, the team visited representatives in four countries and attended TRB’s 4th International Geometric Design Symposium. The itinerary was as follows:
June 1: �� valencia, Spain, team meeting
June 2:�� valencia, Spain, Geometric Design Managed Motorway Workshop
June 2–4: �� valencia, Spain, TRB 4th International Geometric Design Symposium
June 4: �� valencia, Spain, meeting with hosts
June 5: �� travel day
June 6:�� Frankfurt, Germany, team meeting
June 7: �� Frankfurt and Mainz, Germany, meetings with hosts
June 8–9: �� Delft and Utrecht, Netherlands, meetings with hosts
June 10–11: �� Birmingham, England, meetings with hosts
June 12:�� Birmingham, England, final team meeting
June 13:�� return to United States
Host DelegationsDuring the study, the team members met with representatives from various national and regional transportation agencies in the host countries. A list of individuals the team met with and contact information are in Appendix D.
QuestionsTo help the host countries address the team’s inter-ests, a set of amplifying questions was provided to them several months before the trip. The questions, in Appendix E, were grouped in four topics:
Geometric design. �� Questions on geometric design were targeted to geometric design practices used to optimize the performance of existing or future freeway capacity. Examples of geometric design practices include dynami-cally varying the allocated use of the roadway section, reducing lane widths, and providing reserved areas for vehicle refuge, enforcement, or incident response and recovery. Also reviewed were signing, pavement marking, traffic control, lighting, variable speed limits and lane control, queue warning, and other elements considered in the design.
Performance measures. �� The scan team asked questions on performance measures and metrics to evaluate, monitor, and report on geometric design alternatives aimed at improving the performance and flexible use of freeway facilities (e.g., full-time capacity addition, part-time capacity addition). The team sought information on existing and proposed methods, procedures, tools, public outreach, and techniques used to assess safety and operational implications or to compare geometric design alternatives, active traffic management strategies, and innovative uses of the cross section of a freeway.
Planning. �� The scan team asked questions on the planning components used to integrate geometric design practices for improving freeway performance. The team was interested

12 CHAPTER 1: INTRODUCTION
in organizational impacts, such as the need to address competencies, processes, structures, or other resource and agency leadership priorities; public acceptance or controversy; and political leadership and involvement.
Benefits and lessons learned. �� Information was sought on the benefits of and lessons learned from different types of geometric design practices used to optimize the performance and flexible use of existing or future expanded freeway capacity.
Report FormatThe purpose of this report is to describe the tech-niques being implemented in Europe to improve operations on motorways, summarize the findings from the scanning study, suggest strategies that might be applicable to the United States, and recommend activities that might increase aware-ness and knowledge of the need to and means for implementing managed motorway concepts.
Chapter 2 summarizes the visits to each country. Chapter 3 summarizes key findings, and Chapter 4 outlines the scan implementation plan. Appendix A provides contact information and biographies for the team members. Appendix B presents findings from the symposium the scan team attended. The agenda for the workshop before the symposium is in Appendix C. Appendix D and E provide host country contacts and amplifying questions.
FREEWAY GEOMETRIC DESIGN FOR ACTIvE TRAFFIC MANAGEMENT IN EUROPE 13
Chapter 2: European Agency Approaches to Managed Motorways
This chapter describes the findings from each site visit. It provides a context for each country’s overall approach to managing its motorways.
SPAIN
Meeting and Presentations On June 24, 2010, the scan team met with and heard presentations from the following from the Ministry of Public Works:
Jose A. Hinojosa, director��
vicente Ferrer Perez, civil engineer ��
Jose Yuste Maizal, civil engineer��
Design OverviewSpain has few cases in which right-of-way for expansion is a severe limitation. Normally, it uses the median to increase the number of lanes or the land beside the highway. Most high-capacity roads in Spain (autopistas and autovias) are under the authority of the General Roads Directorate (Dirección General de Carreteras) of the Ministry of Public Works, a department of the central govern-ment of Spain. The Ministry of Public Works focuses on construction, while other departments, such as Enforcement or Police, handle operations. There is some coordination between operations and public works, but no strong ties. In addition to the central government, Spain has 17 local autonomous com-munities with responsibility for many highways. The working relationships of the General Roads Directorate with urban and regional traffic opera-tions and planning agencies are often minimal.
Case Study Examples The meeting with and presentations by the Spanish officials focused on a series of case studies illustrating Spain’s approach to freeway design:(4)
CASE STUDY 1: Widening from two to three lanes
Since 2000, typical freeway and highway construction has included a 9- to 10-meter (m) (30- to 33-foot (ft)) median that is preserved for future expansion. Before 2000, there was no set requirement for median widths or expansion pres-ervation. The Spanish use median and shoulder width for expansion from two to three lanes. Lane widths of 3.5 m (11.5 ft) are required on the interre-gional freeways and highways, with no exceptions. In this particular instance, the widening resulted in a 1-m (3.3-ft) outside shoulder and 50-centimeter (cm) (1.6-ft) inside shoulder (or shy distance). Roadway expansions are permanent, and the Spanish have not yet implemented shoulder or median lane use on a congestion-related or temporary basis. In some instances, they have reduced speed limits on the roadway because of sight distance restrictions from lane expansions. However, in this case, they were able to maintain the 80-kilometer-per-hour (km/h) (50 mile-per-hour (mi/h)) speed limit. Emergency pulloffs are located about every 1 km (3,300 ft).
14 CHAPTER 2: EUROPEAN AGENCY APPROACHES TO MANAGED MOTORWAYS
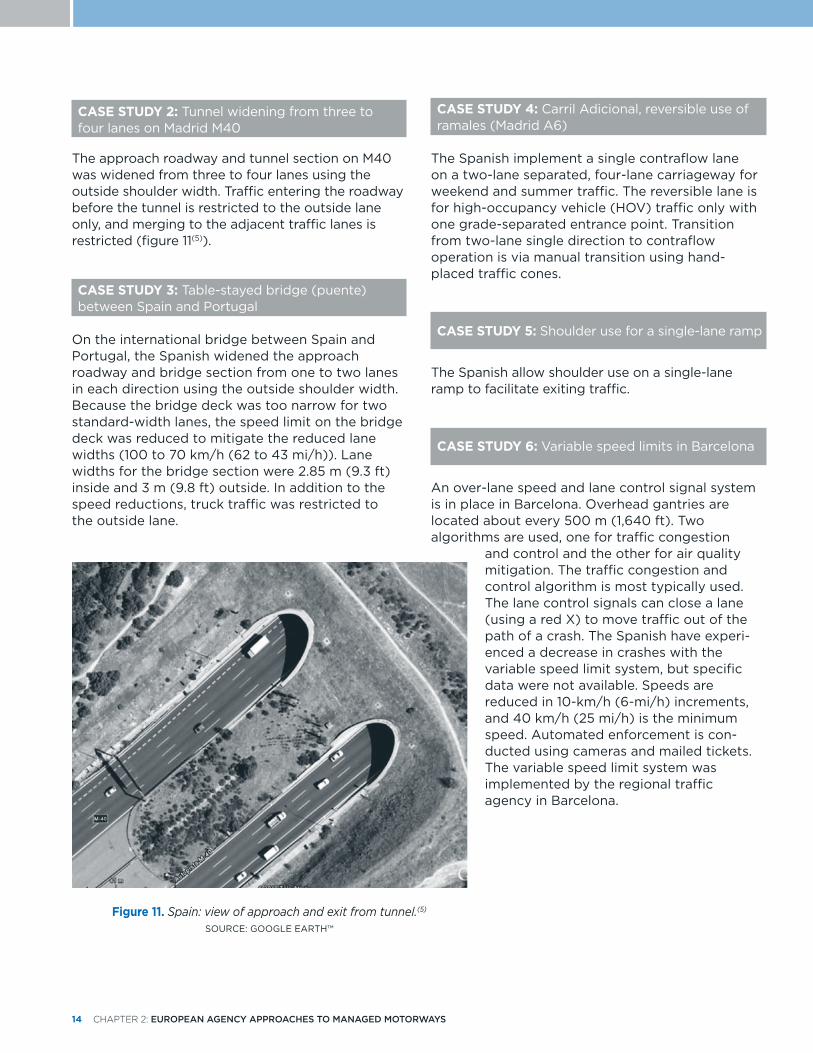
CASE STUDY 2: Tunnel widening from three to four lanes on Madrid M40
The approach roadway and tunnel section on M40 was widened from three to four lanes using the outside shoulder width. Traffic entering the roadway before the tunnel is restricted to the outside lane only, and merging to the adjacent traffic lanes is restricted (figure 11(5)).
CASE STUDY 3: Table-stayed bridge (puente) between Spain and Portugal
On the international bridge between Spain and Portugal, the Spanish widened the approach roadway and bridge section from one to two lanes in each direction using the outside shoulder width. Because the bridge deck was too narrow for two standard-width lanes, the speed limit on the bridge deck was reduced to mitigate the reduced lane widths (100 to 70 km/h (62 to 43 mi/h)). Lane widths for the bridge section were 2.85 m (9.3 ft) inside and 3 m (9.8 ft) outside. In addition to the speed reductions, truck traffic was restricted to the outside lane.
CASE STUDY 4: Carril Adicional, reversible use of ramales (Madrid A6)
The Spanish implement a single contraflow lane on a two-lane separated, four-lane carriageway for weekend and summer traffic. The reversible lane is for high-occupancy vehicle (HOv) traffic only with one grade-separated entrance point. Transition from two-lane single direction to contraflow operation is via manual transition using hand-placed traffic cones.
CASE STUDY 5: Shoulder use for a single-lane ramp
The Spanish allow shoulder use on a single-lane ramp to facilitate exiting traffic.
CASE STUDY 6: variable speed limits in Barcelona
An over-lane speed and lane control signal system is in place in Barcelona. Overhead gantries are located about every 500 m (1,640 ft). Two algorithms are used, one for traffic congestion
and control and the other for air quality mitigation. The traffic congestion and control algorithm is most typically used. The lane control signals can close a lane (using a red X) to move traffic out of the path of a crash. The Spanish have experi-enced a decrease in crashes with the variable speed limit system, but specific data were not available. Speeds are reduced in 10-km/h (6-mi/h) increments, and 40 km/h (25 mi/h) is the minimum speed. Automated enforcement is con-ducted using cameras and mailed tickets. The variable speed limit system was implemented by the regional traffic agency in Barcelona.
Figure 11. Spain: view of approach and exit from tunnel.(5) SOURCE: GOOGLE EARTH™

FREEWAY GEOMETRIC DESIGN FOR ACTIvE TRAFFIC MANAGEMENT IN EUROPE 15
GERMANY
Meetings and Presentations
The scan team had meetings with the following:
Dr. Justin Geistefeldt, director of strategic traffic ��section, Hessian Road and Traffic Authority
Reiner Dolger, Helga Rottenau, and Klaus Noll ��of the Ministry for Economics, Transport, Agriculture, and viniculture in Rheinland-Pfalz
Dr. Kerstin Lemke of the Federal Highway ��Research Institute (BASt) after her symposium presentation on hard shoulder running
The scan team met with representatives from two of Germany’s 16 states (Hessen and Rheinland-Pfalz). Responsibilities at the state level include the following:
Planning, designing, constructing, maintaining, ��and operating motorways
Finance��
Police and rescue services��
Framework for traffic information, including ��radio broadcasting
Federal government responsibilities include the following:
Financing motorways, including equipment ��(such as intelligent transportation system (ITS) infrastructure)
Setting technical guidelines and rules for ��motorways (as part of federal roads)
Research and development (through BASt or ��dedicated projects)
Lemke’s presentation(6) and paper(7) provided background information on hard shoulder running and safety studies conducted by BASt.
Hessen
In Hessen, Geistefeldt provided information on Congestion-Free Hessen 2015, hard shoulder running, and line control.(8)
Congestion-Free Hessen 2015The Congestion-Free Hessen 2015 initiative started in 2003 with the intent to ensure continual improve-ment in the traffic flow on Hessen’s roads. The vision of the initiative is the following:
Mobility is one of the greatest issues for the future in Hessen. Both in economic and ecological terms, as well as with reference to social and cultural aspects, this task demands our full attention. Because for a transit state like Hessen at the heart of Germany and Europe, mobility and logistics are not only sustainable economic factors but also synonyms for a modern and progressive society.(9)
The initiative recognized that mobility is a crucial economic factor and that an important part of a work zone is the need to manage traffic. Along with improvements in flow, the goals are safer roads and reduced pollution. The project has three focus areas: future technologies, traffic manage-ment, and mobility services.
Under traffic management, several programs are being implemented. The following is an overview of each program from the pamphlet “Congestion-Free Hessen 2015: A Success Story.”(9)
The Hessen traffic center includes more than ��80 monitors and data from more than 3,000 induction loops.
Temporary use of hard shoulders is allowed ��during peak times. The Hessen traffic center opens the shoulder to vehicles based on traffic demand. The shoulders are monitored by cameras. Positive effects include the following:
Congestion reduced 30 percent �
Crashes caused by traffic jams reduced �25 percent(9)
16 CHAPTER 2: EUROPEAN AGENCY APPROACHES TO MANAGED MOTORWAYS
A network control system using variable ��direction signs is used to provide information about alternate routes. Since 2005 additional dynamic information boards have been used. These displays can provide diversion informa-tion along with the reason for the diversion and expected delay. The additional information can increase acceptance of the diversion recom-mendations. Another feature of the network control system is the ability to provide delay data on signs. A model the state developed uses speed data from pavement sensors spaced at 3 to 4 km or at 1 km when within a line control section. The rule of thumb is that drivers will willingly reroute if travel time exceeds 20 minutes.(9) The contact noted that others display length of queue, but drivers want to know minutes and the value on the sign can have a large impact on driver behavior.(8)
Long-distance corridors reflect cross-border ��traffic management with other German states. In the event of disruption to long-distance corridors, previously agreed-on diversion strategies are activated. Test corridors in use include the following:
South: Munich to Frankfurt �
West: Frankfurt to Cologne �
North: Dortmund to Hamburg �
Road works management involves scheduling ��road construction or maintenance to minimize the effect on traffic. Factors used and consid-
ered include an extensive historical database of traffic patterns, effective traffic models, planned special occasions (e.g., large trade fairs, sport events), and timing of maintenance on parallel routes.
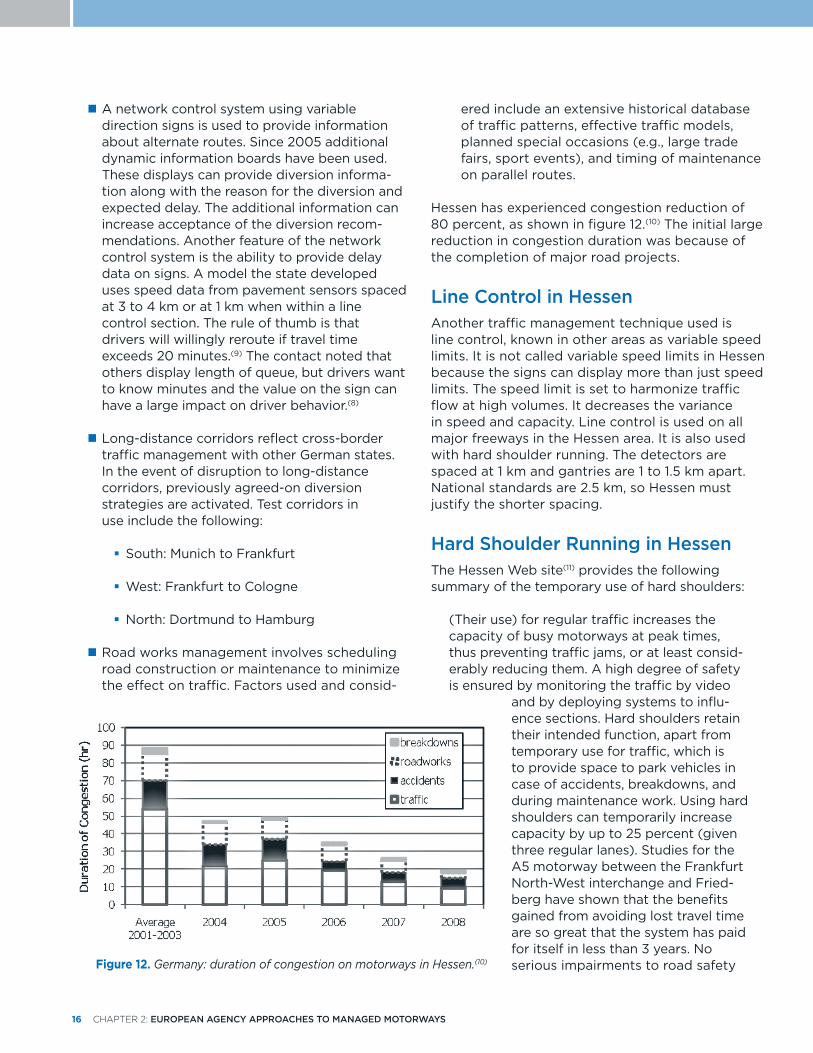
Hessen has experienced congestion reduction of 80 percent, as shown in figure 12.(10) The initial large reduction in congestion duration was because of the completion of major road projects.
Line Control in HessenAnother traffic management technique used is line control, known in other areas as variable speed limits. It is not called variable speed limits in Hessen because the signs can display more than just speed limits. The speed limit is set to harmonize traffic flow at high volumes. It decreases the variance in speed and capacity. Line control is used on all major freeways in the Hessen area. It is also used with hard shoulder running. The detectors are spaced at 1 km and gantries are 1 to 1.5 km apart. National standards are 2.5 km, so Hessen must justify the shorter spacing.
Hard Shoulder Running in HessenThe Hessen Web site(11) provides the following summary of the temporary use of hard shoulders:
(Their use) for regular traffic increases the capacity of busy motorways at peak times, thus preventing traffic jams, or at least consid-erably reducing them. A high degree of safety is ensured by monitoring the traffic by video
and by deploying systems to influ-ence sections. Hard shoulders retain their intended function, apart from temporary use for traffic, which is to provide space to park vehicles in case of accidents, breakdowns, and during maintenance work. Using hard shoulders can temporarily increase capacity by up to 25 percent (given three regular lanes). Studies for the A5 motorway between the Frankfurt North-West interchange and Fried-berg have shown that the benefits gained from avoiding lost travel time are so great that the system has paid for itself in less than 3 years. No serious impairments to road safety Figure 12. Germany: duration of congestion on motorways in Hessen.(10)

FREEWAY GEOMETRIC DESIGN FOR ACTIvE TRAFFIC MANAGEMENT IN EUROPE 17
have been established to date. On the contrary: Studies for the A3 demonstrate that the higher capacity resulting from the use of hard shoulders noticeably reduces the potential congestion on a section, and thus the frequency of accidents caused by traffic jams. At present, hard shoulders are already in temporary use on 63 km (39.1 mi) in Hessen. Due to the very positive experience, further segments have been earmarked for temporary use of hard shoulders. Of these, around 12 km (7.4 mi) are presently undergoing implementation (A5 between the Darmstadt interchange and the Eberstadt junction in both directions).(11)
Hard shoulder running was first implemented in 2001. Frankfurt now operates 65 km (40.3 mi) of hard shoulder running. Hard shoulder control is usually integrated with line control systems. Both static and dynamic signs are used. The static signs have the arrows on a rotating drum that is changed depending on whether hard shoulder running is allowed (see figure 13). The dynamic signs show the following:
Blank = hard shoulder running is not allowed ��
Red X = disabled vehicle is on the shoulder ��
Green downward arrow = hard shoulder ��running is permitted
Figure 14 shows the dynamic impacts on conges-tion from temporary hard shoulder running on the A5.(8) Before 2001, more than 600 hours of congestion per year was experienced in the
northbound direction. After hard shoulder running was implemented, congestion peaked at less than 200 hours of congestion. The southbound section did not experience as large a reduction, but most of the section did experience a reduction. The area near the interchange of Frankfurt did experience slightly more hours of congestion because of the transition to the nonmanaged
Figure 13. Germany: signs for hard shoulder running.(7)
Figure 14. Germany: temporary hard shoulder running impact on congestion for A5.(8)
18 CHAPTER 2: EUROPEAN AGENCY APPROACHES TO MANAGED MOTORWAYS
section. Congestion, determined by sensors, was defined as speeds of less than 70 km/h (43 mi/h).
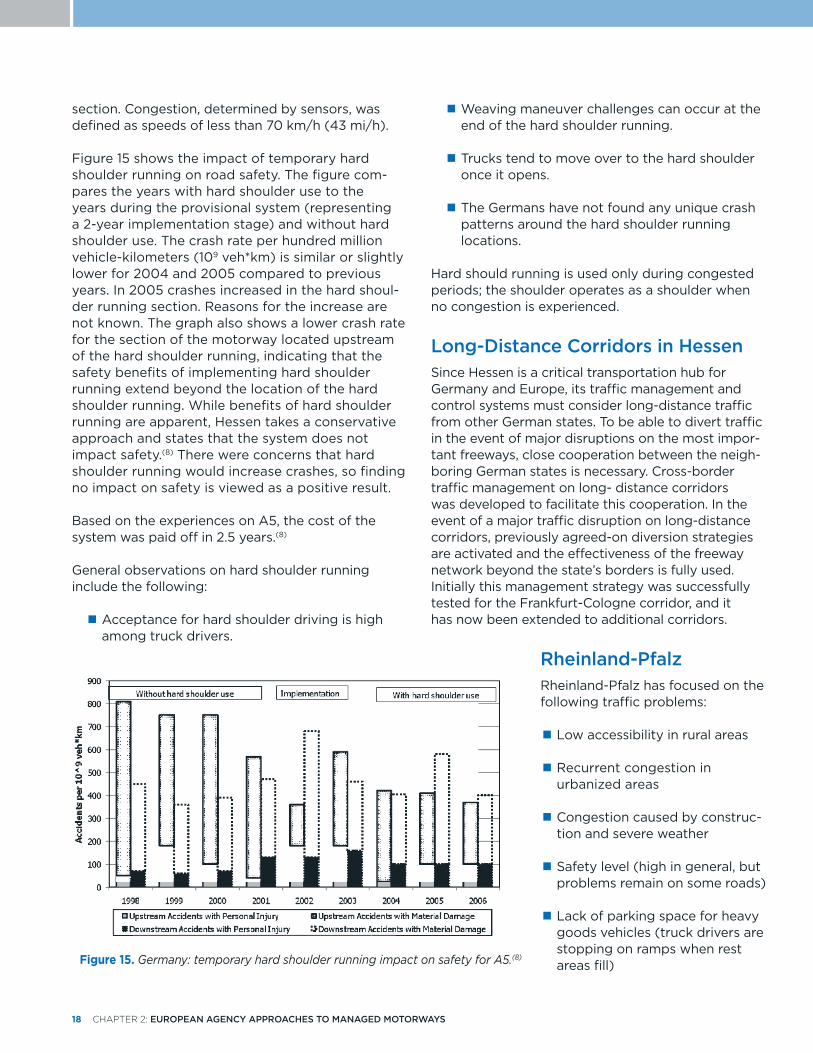
Figure 15 shows the impact of temporary hard shoulder running on road safety. The figure com-pares the years with hard shoulder use to the years during the provisional system (representing a 2-year implementation stage) and without hard shoulder use. The crash rate per hundred million vehicle-kilometers (109 veh*km) is similar or slightly lower for 2004 and 2005 compared to previous years. In 2005 crashes increased in the hard shoul-der running section. Reasons for the increase are not known. The graph also shows a lower crash rate for the section of the motorway located upstream of the hard shoulder running, indicating that the safety benefits of implementing hard shoulder running extend beyond the location of the hard shoulder running. While benefits of hard shoulder running are apparent, Hessen takes a conservative approach and states that the system does not impact safety.(8) There were concerns that hard shoulder running would increase crashes, so finding no impact on safety is viewed as a positive result.
Based on the experiences on A5, the cost of the system was paid off in 2.5 years.(8)
General observations on hard shoulder running include the following:
Acceptance for hard shoulder driving is high ��among truck drivers.
Weaving maneuver challenges can occur at the ��end of the hard shoulder running.
Trucks tend to move over to the hard shoulder ��once it opens.
The Germans have not found any unique crash ��patterns around the hard shoulder running locations.
Hard should running is used only during congested periods; the shoulder operates as a shoulder when no congestion is experienced.
Long-Distance Corridors in HessenSince Hessen is a critical transportation hub for Germany and Europe, its traffic management and control systems must consider long-distance traffic from other German states. To be able to divert traffic in the event of major disruptions on the most impor-tant freeways, close cooperation between the neigh-boring German states is necessary. Cross-border traffic management on long- distance corridors was developed to facilitate this cooperation. In the event of a major traffic disruption on long-distance corridors, previously agreed-on diversion strategies are activated and the effectiveness of the freeway network beyond the state’s borders is fully used. Initially this management strategy was successfully tested for the Frankfurt-Cologne corridor, and it has now been extended to additional corridors.
Rheinland-PfalzRheinland-Pfalz has focused on the following traffic problems:
Low accessibility in rural areas��
Recurrent congestion in ��urbanized areas
Congestion caused by construc-��tion and severe weather
Safety level (high in general, but ��problems remain on some roads)
Lack of parking space for heavy ��goods vehicles (truck drivers are stopping on ramps when rest areas fill)Figure 15. Germany: temporary hard shoulder running impact on safety for A5.(8)

FREEWAY GEOMETRIC DESIGN FOR ACTIvE TRAFFIC MANAGEMENT IN EUROPE 19
Lane control systems have been in operation since 1994 and rerouting variable message signs have been in place since 2009. Hard shoulder running was permitted after 2002 when the restriction on crossing the solid white line was removed.
Line Control SystemsLine control systems in Rheinland-Pfalz include the following:
Dynamic speed limits��
Overtaking bans��
Warning signs��
Currently, Rheinland-Pfalz has three line control systems in operation. It reports good experiences with capacity and safety and has found the systems particularly useful for heavy truck traffic and in mountainous areas with bad weather.(12) It considers overtaking bans important. It limits truck speeds because trucks are not permitted to overtake. Trucks are estimated to be up to 30 percent of the traffic on the autobahn.
Mobile police rather than automated speed enforce-ment is used. An estimated 80 percent of motorists comply with the speed limit. When speeds are not restricted by a speed limit, the 85th percentile speed on the motorways is estimated at 150 km/h (93 mi/h). Most drivers will accept the dynamic speed limit when the need is apparent. Dynamic speed limits have been set as low as 80 km/h (50 mi/h). At a location with cross slope concerns, different speed limits by lane have been used. For example, the right most lane was signed at 80 km/h (50 mi/h) and the other lanes at 100 or 130 km/h (62 or 81 mi/h).(12) Crashes influenced by a lane control system dropped 30 percent, while all crashes dropped 20 percent.(13)
Loop detectors and gantries are located every 2 to 3 km (1.2 to 1.9 mi). Many motorways were designed for 130 km/h (81 mi/h).
Dynamic ReroutingRhineland-Pfalz also has a dynamic rerouting system in place, providing drivers with alternate route information during congested, incident, or weather-related conditions. Even though the
systems are not mandatory, they have experienced a high level of acceptance by drivers. Dynamic rerout-ing is particularly useful in urban areas and on dense roadway networks with available alternate routes.
Hard Shoulder RunningHard shoulder running can be either temporary or continuous. The temporary systems require less planning and fewer environmental evaluations, so they can be implemented faster. Rhineland-Pfalz has one temporary system under construction. Officials provided the following observations on hard shoulder running to the scan team:(12)
Noise level has been an issue, and officials have ��considered noise walls or a roof to encase the motorway to manage the noise.
If they implement hard shoulder running, they ��try to remove any cross slope breaks.
They have some permanent hard shoulder ��running, but not all have lane control.
They believe safety has been good. ��
In some locations, pavement reconstruction ��was required.
Minimum lane width is 3.25 m. ��
They have introduced speed limits (between ��100 and 130 km/h (62 and 81 mi/h)) with hard shoulder running.
Hard shoulder running sections have emer-��gency pullouts about every 1 km. These sections are more difficult to operate and maintain. Temporary hard shoulder running sections must have cameras.
Overview of Hard Shoulder RunningAccording to Lemke,(7) the first pilot dynamic hard shoulder running scheme was implemented in 1996 on 1.6 km (1 mi) of the A4 freeway near Cologne. The section is activated in response to traffic volumes as a running lane, usually between 6 and 10 a.m. The section has one emergency refuge area. The speed is limited to 100 km/h (62 mi/h) during the entire day. Travel lanes were narrowed to 3.25 m (10.7 ft) and the shoulder width is 3.5 m (11.5 ft). The annual

20 CHAPTER 2: EUROPEAN AGENCY APPROACHES TO MANAGED MOTORWAYS
average daily traffic (AADT) exceeds 40,000 vehicles per day with almost 10 percent heavy traffic.
Based on the experience of pilot measures of permanent and dynamic hard shoulder running, the Federal Ministry of Transport, Building, and Housing defined a set of guidelines for the implementation of such measures. These guidelines, summarized from Lemke’s paper, include the following:
According to the German�� Highway Capacity Manual, it must be demonstrated that level of service defined as “D” could not be reached during peak hours.
A width of at least 3.5 m (11.5 ft) must be ��provided for the heavy vehicle lane and at least 3.25 m (10.7 ft) for other lanes.
Emergency refuge areas must be located at ��intervals of 1,000 m (0.62 mi).
When hard shoulder running is intended to run ��through junctions, additional lanes must be provided in merge areas.
A speed limit of 100 km/h (62 mi/h) must be ��established if restriping leads to lane width of less than 3.5 m (11.5 ft). This speed limit is also advisable in times without hard shoulder running.
When paved shoulders are converted into travel ��lanes by restriping, a speed limit of 120 km/h (75 mi/h) should be considered.
Prohibition of overtaking could allow for rescue ��services to pass through in case of emergencies.
The signs for use in hard shoulder running sections are shown in figure 13. Around 200 km (124 mi) of German freeways have dynamic hard shoulder running (see table 2). Although Germany success-fully implemented measures of hard shoulder running, hard shoulders are still considered a vital element of freeway cross sections. Therefore, all cross section types of the new freeway design guidelines contain hard shoulders. The typical cross section for four-lane freeways (see figure 16), however, was designed so that hard shoulder running would be possible without restriping the roadway. The main design-relevant prerequisites of hard shoulder running were integrated into the design guidelines. The 0.75-m (2.5-ft) strips on both sides of the main carriageway shown in figure 16 are intended to stabilize the pavement and include the lane markings (shown as white squares in the figures). These strips are usually 0.5 m (1.6 ft) wide. On major motorways, their width is increased to 0.75 m (2.5 ft) to increase the sight distances in left curves and allow for more flexible planning of work zones (where lanes are shifted to the opposite carriageway).
Safety of Hard Shoulder RunningLemke(7) reported on a study on road safety for hard shoulder running. Table 3 lists the sections included in the safety study along with their characteristics. Before-and-after data were examined for each section with hard should running along with
Freeway Section Direction Length (kilometer) Lane no.A3 Offenbacher Kreuz–AS Obertshausen both 5.7 + 6.0 3 + 1
A3 Monchhofdreieck–AS Kelsterbach both 3.3 + 2.0 3 + 1
A4 AS Refrath-AS Köln-Merheim Köln 1.6 2 + 1
A5 AS Friedberg–Bad Homburger Kreuz both 7.2 + 8.9 3 + 1
A5 Bad Homburger Kreuz–Nordwestkreuz Frankfurt both 4.8 + 7.7 3 + 1
A7 Border HH–AS Kalten kirchen Flensburg 22.5 2 + 1
A7 AS Neümnster-Süd–AD Bordesholm Flensburg 14.0 2 + 1
A7 AS Soltau-Ost–Dreieck Walsrode both 32.4 + 31.8 2 + 1
A8 AS Hofolding–AS Holzkirchen Salzburg 9.8 + 9.8 3 + 1
A99 AK München Nord–AS Haar both 18.0 + 18.0 3 + 1
Table 2. Germany: sections with dynamic hard shoulder running in 2009.(7)
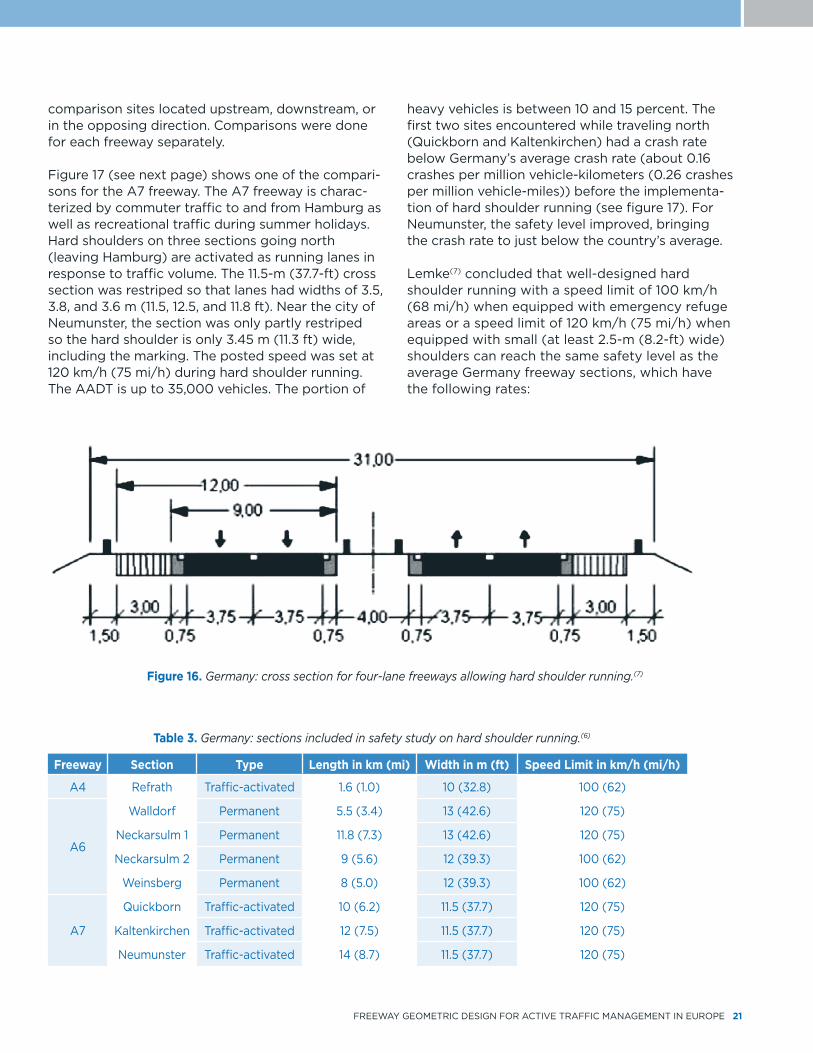
FREEWAY GEOMETRIC DESIGN FOR ACTIvE TRAFFIC MANAGEMENT IN EUROPE 21
comparison sites located upstream, downstream, or in the opposing direction. Comparisons were done for each freeway separately.
Figure 17 (see next page) shows one of the compari-sons for the A7 freeway. The A7 freeway is charac-terized by commuter traffic to and from Hamburg as well as recreational traffic during summer holidays. Hard shoulders on three sections going north (leaving Hamburg) are activated as running lanes in response to traffic volume. The 11.5-m (37.7-ft) cross section was restriped so that lanes had widths of 3.5, 3.8, and 3.6 m (11.5, 12.5, and 11.8 ft). Near the city of Neumunster, the section was only partly restriped so the hard shoulder is only 3.45 m (11.3 ft) wide, including the marking. The posted speed was set at 120 km/h (75 mi/h) during hard shoulder running. The AADT is up to 35,000 vehicles. The portion of
heavy vehicles is between 10 and 15 percent. The first two sites encountered while traveling north (Quickborn and Kaltenkirchen) had a crash rate below Germany’s average crash rate (about 0.16 crashes per million vehicle-kilometers (0.26 crashes per million vehicle-miles)) before the implementa-tion of hard shoulder running (see figure 17). For Neumunster, the safety level improved, bringing the crash rate to just below the country’s average.
Lemke(7) concluded that well-designed hard shoulder running with a speed limit of 100 km/h (68 mi/h) when equipped with emergency refuge areas or a speed limit of 120 km/h (75 mi/h) when equipped with small (at least 2.5-m (8.2-ft) wide) shoulders can reach the same safety level as the average Germany freeway sections, which have the following rates:
Table 3. Germany: sections included in safety study on hard shoulder running.(6)
Freeway Section Type Length in km (mi) Width in m (ft) Speed Limit in km/h (mi/h)
A4 Refrath Traffic-activated 1.6 (1.0) 10 (32.8) 100 (62)
A6
Walldorf Permanent 5.5 (3.4) 13 (42.6) 120 (75)
Neckarsulm 1 Permanent 11.8 (7.3) 13 (42.6) 120 (75)
Neckarsulm 2 Permanent 9 (5.6) 12 (39.3) 100 (62)
Weinsberg Permanent 8 (5.0) 12 (39.3) 100 (62)
A7
Quickborn Traffic-activated 10 (6.2) 11.5 (37.7) 120 (75)
Kaltenkirchen Traffic-activated 12 (7.5) 11.5 (37.7) 120 (75)
Neumunster Traffic-activated 14 (8.7) 11.5 (37.7) 120 (75)
Figure 16. Germany: cross section for four-lane freeways allowing hard shoulder running.(7)

22 CHAPTER 2: EUROPEAN AGENCY APPROACHES TO MANAGED MOTORWAYS
Fatal and severe injury crashes: 0.03 crashes ��per million vehicle-kilometers (0.05 crashes per million vehicle-miles)
Slight injury crashes and severe property- ��damage-only crashes: 0.13 crashes per million vehicle-kilometers (0.21 crashes per million vehicle-miles).
An important prerequisite for this assumption is a detailed safety analysis of the section at the planning stage to eliminate high-risk road sites (especially near junctions). When the safety level is already better than these values before any hard shoulder running is implemented, no change is expected.
German Lane Widths
The German design manual, Richtlinien fuer die Anlage von Autobahnen, includes standard cross sections.(14) The standard cross sections for interur-ban autobahn (freeways) are shown in figure 18. Figure 19 shows the standard cross section for four-lane highways, and figure 20 (see page 24) shows the standard cross section for intercity autobahns (freeways).
Left shoulder width is typically 0.5 to 0.75 m (1.6 to 2.5 ft). Previous design guidance called for a lane width of 3.75 m (12.3 ft). Current design guidance specifies lane widths of 3.5 m (11.5 ft) or 3.25 m (10.7 ft).
Figure 17. Germany: road safety on the A7 where AR(I) = fatal and severe injury crash rate and AR(II) = slight injury crash + severe
property damage-only crash rate.(6)

FREEWAY GEOMETRIC DESIGN FOR ACTIvE TRAFFIC MANAGEMENT IN EUROPE 23
Figure 18. Germany: standard cross sections for interurban autobahn (freeway).(14)
Standard cross sections for interurban freeways
Ranges of application for standard cross sections on interurban freeways (DTV=average daily traffic)
Figure 19. Germany: standard cross section for four-lane highways.(14)
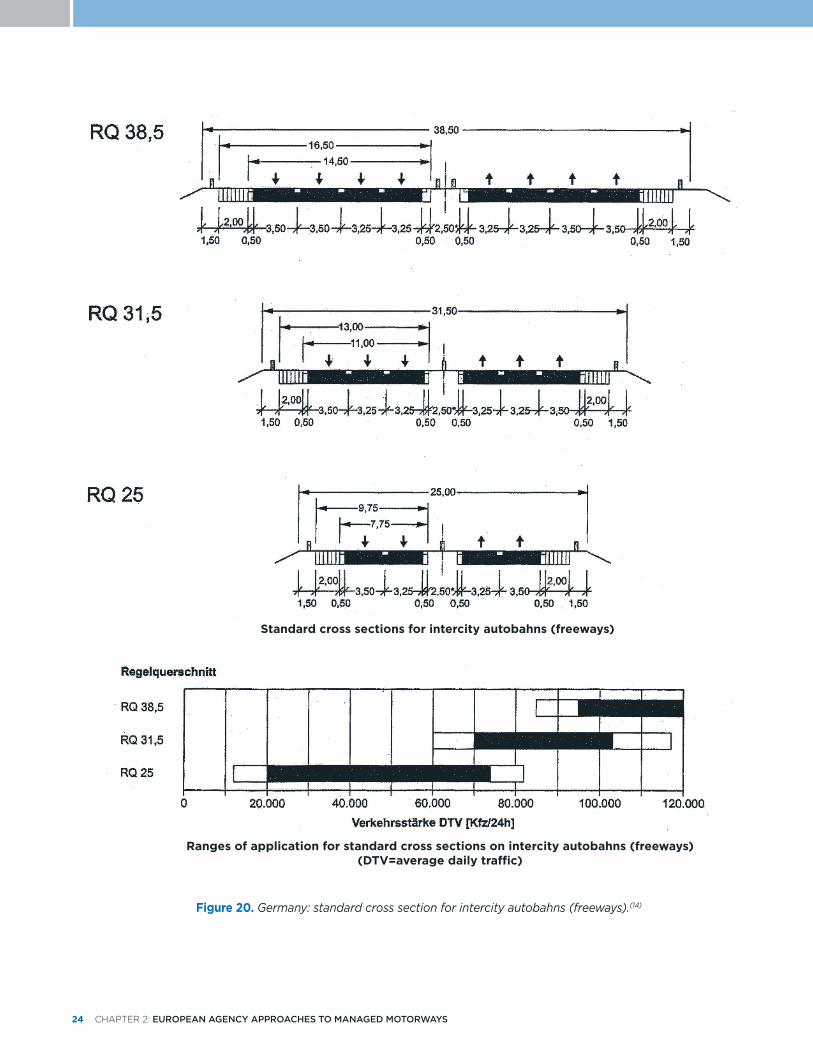
24 CHAPTER 2: EUROPEAN AGENCY APPROACHES TO MANAGED MOTORWAYS
Figure 20. Germany: standard cross section for intercity autobahns (freeways).(14)
Standard cross sections for intercity autobahns (freeways)
Ranges of application for standard cross sections on intercity autobahns (freeways)(DTV=average daily traffic)

FREEWAY GEOMETRIC DESIGN FOR ACTIvE TRAFFIC MANAGEMENT IN EUROPE 25
NETHERLANDS
Meetings and PresentationsThe scan team met with representatives of Rijkswaterstaat (Ministry of Transport, Public Works, and Water Management). The following made presentations to the scan team:
Aad Wilmink, director of traffic management, ��provided the welcome.
Alex van Loon discussed background informa-��tion on the Netherlands to help the scan team understand the evolution of design in the country.
Gerald Uittenbogerd presented on geometric ��design in the Netherlands.
Bert Helleman discussed hard shoulder running ��and traffic management issues.
Marthe van Dongen and Roel Nijsten discussed ��planning processes.
Alex van Loon talked about future road ��plans and accompanied the team to view sites in Utrecht.
National Mobility SchemeRijkswaterstaat is responsible for the national road network in the Netherlands. Helleman provided the team with background information on transport policy and the managed motorway concept in the Netherlands.(15) Dutch transport policy has three pillars for national mobility:
Limited extension of infrastructure��
Emphasis on better use of existing roads ��(Urgent Act on Road Widening)
Road pricing��
Dutch managed motorways have three key components:
Hard shoulder running��
variable speed limits��
Interchange lane control��
Hard Shoulder RunningThe first hard shoulder running project was conducted in 1996. The use of the hard shoulder as an additional lane can occur two ways: hard shoulder running and plus lanes.
Table 4 lists current and planned road projects in the Netherlands.
Table 4. Netherlands: road projects.(15)
Time Sections of Hard Shoulder Running
and Plus Lanes in km (mi)Hard Shoulder Running Plus Lanes
Current 72 (45) 108 (67)Planned
(2010–2014) 151 (94) 90 (56)
Total 223 (139) 198 (123)
In hard shoulder running, drivers can use the right shoulder as a travel lane. Refuge for vehicles is available at emergency refuge areas spaced every 1,000 m (0.62 mi). The speed limit is 100 km/h (62 mi/h) when hard shoulder running is permitted. The hard shoulder is used only during the peak period. This approach results in less noise and fewer environmental concerns. Figure 21 shows an example of hard shoulder running in which the left shoulder is 1.1 m (3.6 ft). The figure also shows the German sign adopted by the Nether-lands to communicate whether the shoulder lane
Figure 21. Netherlands: hard shoulder running.(15)

26 CHAPTER 2: EUROPEAN AGENCY APPROACHES TO MANAGED MOTORWAYS
is available. Figure 22 shows another example of hard shoulder running.
For plus lanes, the carriageway is restriped to reflect the permanent addition of another lane. Most of the additional lane width is from the left shoulder. The plus lane, the leftmost lane, is separated by typical lane lines and controlled by a lane control sign. The left lane is closed during offpeak times and the speed limit is higher. An advantage of the plus lane is at ramps (or junctions). The geometry is more conventional and familiar to drivers. The lane widths vary across the carriageway; the left lane is not as wide and has a width restriction (e.g., 2.3 m (7.5 ft)). Figure 23 shows an example of a plus lane. The photo, taken in 1998, does not include the pavement marking now used with plus lanes. Current markings are 9 m (29.5 ft) of stripe with a 3-m (9.8-ft) gap, commonly called 9-3. Figure 23 shows the typical lane marking of 3 m (9.8 ft) of stripes with a 9-m (29.5-ft) gap, called 3-9. Figure 24 shows plus lanes on A12 with current 9-3 lane markings and truck restriction signs. Figure 25 shows a closed plus lane.
Reasons hard shoulder running is used instead of permanently adding a lane include the following:
Additional environmental concerns ��
Noise��
Cost��
Need for more space for a permanent ��roadway expansion
When hard shoulder running was not in use and the lane control signals were blank, between 6 and 60 violations occurred per hour.(15) In November 2006 the Netherlands introduced the use of a red cross to commu-nicate that the hard shoulder is closed. Figure 26 shows the signs used when closing the hard shoulder. Figure 27 shows when hard shoulder running is not permitted, and figure 28 (see page 28) shows a closeup of a red cross indicating that hard shoulder running is not permitted.
Figure 22. Netherlands: hard shoulder running.
Figure 23. Netherlands: plus lane with former style of lane markings.(15)
Figure 24. Netherlands: A12 plus lane with current plus lane markings and truck restriction.(5)
SOU
RC
E: G
OO
GLE
EA
RT
H™

FREEWAY GEOMETRIC DESIGN FOR ACTIvE TRAFFIC MANAGEMENT IN EUROPE 27
Gantries are spaced at about 600-m (1,970-ft) intervals. Hard shoulder running does occur through on- and off-ramp junctions. Pavement markings with different gap patterns are used in the merge area, as shown in figure 29 (see page 28) for off-ramp and figure 30 (see page 28) for on-ramp.
When an on-ramp is in a hard shoulder running section (figure 30), a solid white line indicates the location of the hard shoulder. The stripe is 20 cm (0.7 ft) wide and about 100 m (330 ft) long. It follows the same dimensions as gore striping.
Truck overtaking bans are not used when the hard shoulder running area is short so trucks are not forced to make multiple lane changes.
Figure 31 (see page 29) shows the sequence followed before opening hard shoulder running.
Safety measures employed with hard shoulder running include the following:
Refuge havens (also known as ��emergency refuge areas)
Automatic incident detection to warn ��operator of starting congestion
Overhead signals and variable ��message signs
Dynamic speed reduction (maximum ��speed limit is 100 km/h (62 mi/h))
Roadway lighting��
Overtaking ban for trucks��
Incident management (maximum of 15 ��minutes for assistance to be on the scene)
Figure 32 (see page 29) shows traffic safety data. It is based on 3 years of before data and 2 years of after data. Improvements were observed at most sites, primarily because of reduced congestion. Two hard shoulder running sites did have slight increases in crashes. The increases were attributed to a closely spaced ramp and exit design (weaving). The overall conclusion is that safety has been predominantly positive, caused by strong reductions in congestion. The
Figure 25. Netherlands: A12 plus lane closed to traffic.(5)
SOURCE: GOOGLE EARTH™
Figure 26. Netherlands: signs used to indicate hard shoulder running is closing.
Hard shoulder running sign when lane is closing
Overhead lane signal when lane is closing
Figure 27. Netherlands: example of when hard shoulder running is not permitted.

28 CHAPTER 2: EUROPEAN AGENCY APPROACHES TO MANAGED MOTORWAYS
Dutch have not observed an increase in hard shoulder running-related crashes, such as vehicles running on the hard shoulder colliding with a vehicle that has sought refuge on the shoulder. They are continuously looking for methods to detect incidents faster and minimize the number of incidents or disabled vehicles.
Figure 33 (see page 30) shows traffic flow benefits. Only one location experienced an increase in delay. For some sites, delay decreased over 90 percent. Larger decreases in delay were found for plus lanes than hard shoulder running. Performance showed increases for all sites except one.
Dynamic Speed Limits The Dutch are examining speed limits through the Dynamic Speed Limits project, which was developed “to gain more insight into the impact of variable, tailor-made speed limits.”(16) A pamphlet on dynamic speed limits provides the following discussion on the benefits:
Adjusting speed limits to unexpected and varying situations such as weather conditions, congestion, or an incident can improve traffic flow. It will also enhance the safety and improve local air quality. By applying a flexible and wide range of speed limits (50 to 120 km/h (31 to 75 mi/h)), operators can influence the actual situation on the road. Thus road users can drive faster if possible and need to slow down if necessary.
Tests are being conducted on several roadways and evaluations are ongoing. The evaluation on permanent speed reduction found excellent compliance (about 1 percent violations) because of enforcement. Reductions in emissions and noise level were also identified. Residents along the sections also expressed appreciation for the change.
Evaluation of variable speed limits is ongoing, and the Dutch are also investi-
Figure 28. Netherlands: closeup of red cross used to indicate hard shoulder running is not permitted.
Figure 29. Netherlands: off-ramp design.(15)
Figure 30. Netherlands: on-ramp design.(15)

FREEWAY GEOMETRIC DESIGN FOR ACTIvE TRAFFIC MANAGEMENT IN EUROPE 29
gating how to use data from traffic monitoring equipment to detect shock-waves and manage upstream speeds to limit the impact of the shockwave. A system called SPECIALIST (speed-control-ling algorithm using shockwave theory) is being developed. Weather forecasts, such as a major rain storm, can also be consid-ered when setting variable speed limits.
Interchange Lane Control The host discussed an interchange junction where lane control is used to optimize the merging of two facilities. Figure 34 (see page 30) shows an aerial view of the interchange and a schematic of the merge area. The rightmost lane on the motorway is closed to facilitate the merging of two lanes from the ramp. Table 5 (see page 31) shows the results of the pilot study. Mean travel time was reduced and mean travel speed increased for both vehicles on the ramp (as expected) and vehicles on the main lanes of the motorway. Both approaches also experienced a decrease in vehicle-hours of delay, with ramp vehicles experiencing a slighter greater reduction.
Geometric Design The Netherlands has dealt with challenges similar to those in the United States. For example, after the postwar rebuilding period came a period in the 1970s of “not in my backyard” opposition to building roads in certain areas. Between 1978 and 2004, the ministry conducted planning, design, finance, and maintenance tasks. In 2004, a major reorganization resulted in contractors doing the design work along with construction and maintenance. The ministry now focuses on planning, finance, specification, and audits. The motivation for the change was so that Dutch consultants could develop skills they could export to other countries. They use a design speed of 120 km/h (75 mi/h) with 3.5-m (11.5-ft) lane widths, 750-m (2,460-ft) minimum curve radius, and 5 percent maximum superelevation. They use spirals for transitions on any
Figure 31. Netherlands: opening sequence for hard shoulder running.(15)
Figure 32. Netherlands: traffic safety at hard shoulder running and plus lane sites.(15)
Injury Crash Rate

30 CHAPTER 2: EUROPEAN AGENCY APPROACHES TO MANAGED MOTORWAYS
curves with radii of less than 2,000 m (1.24 mi). They use “Specific, Measurable, Achiev-able, Realistic, and Timely” (SMART) guide-lines for geometric design. As part of this, they do not use any left-side exit ramps.
A philosophy of their design approach is to create self-explaining roadways with sustainable safety. They monitor research efforts in Germany, such as a large research project on the effects of superelevation on driving during heavy rain. The Netherlands also must manage its system during heavy rainfall. Rain results in pavements being wet about 12 percent of time. The Dutch have developed porous asphalt to minimize splash on the pavement surface.
Examples of features of current documents include the following:
White (also known as black) spots, ��sight distance, distance between successive ramp terminals, design speed (now have 120-km/h (75-mi/h) design speed), transition supereleva-tion, and others
Special books for alignment, ��markings, etc.
Use of AASHTO’s �� A Policy on Geomet-ric Design of Highways and Streets, also known as the Green Book, for reference
The Dutch have debated lower design speed (politicians want lower design speed so roads take less space) versus higher design speed (drivers may be able to drive at 150 km/h (93 mi/h) in electric cars and not pollute the air).
International design law describes the minimum shoulder width of 2.5 m (8.2 ft), and a country must have good arguments to deviate from those standards.
Buses and trucks are 2.6 m (8.5 ft) wide, which is more or less the European standard.
The Dutch use a design speed of 120 km/h (75 mi/h) for rural areas. In urban areas the
Figure 34. Netherlands: interchange with interchange merge control.(15)
Figure 33. Netherlands: traffic benefits of hard shoulder running and plus lanes.(15)

FREEWAY GEOMETRIC DESIGN FOR ACTIvE TRAFFIC MANAGEMENT IN EUROPE 31
Table 5. Netherlands: results of pilot study on interchange merge control.(15)
Route Measure Free Flow Without Interchange Merge Control
With Interchange Merge Control Percent Change
Red Route (Ramp)Mean travel timeMean travel speedvehicle-hours of delay
4.7698
11.0341
1,558
10.4245
1,361
-8 percent+8 percent-13 percent
Blue Route (Main Lanes)Mean travel timeMean travel speedvehicle-hours of delay
2.78106
7.0742
1,455
6.5645
1,398
-7 percent+7 percent-4 percent
Table 6. Netherlands: cross section widths.(17)
Vehicle Type Function of * Width in m (ft) for design speedsSpace of Interest Space to left Space to right 120 km/h (75 mi/h) 100 km/h (62 mi/h) 80 km/h (50 mi/h)
Passenger Car
Driving Driving Driving 3.35 (11.0) 3.10 (10.2) 2.80 (9.2)
Emergency/ Recovery 3.25 (10.7) 3.05 (10.0) 2.75 (9.0)
Emergency/ Recovery
Driving 3.25 (10.7) 3.05 (10.0) 2.75 (9.0)
Emergency/ Recovery 3.30 (10.8) 3.10 (10.2) 2.80 (9.2)
Emergency Driving No lane 3.15 (10.3) 3.15 (10.3) 3.15 (10.3)
No lane Driving n.a. n.a. n.a.
Recovery Area Driving No lane 0.60 (2.0) 0.60 (2.0) 0.30 (1.0)
No lane Driving 0.60 (2.0) 0.60 (2.0) 0.30 (1.0)
Truck Driving Driving Driving 3.35 (11.0) 3.35 (11.0) 3.35 (11.0)
Emergency/Recovery 3.30 (10.8) 3.30 (10.8) 3.30 (10.8)
Emergency/ Recovery
Driving 3.30 (10.8) 3.30 (10.8) 3.30 (10.8)
Emergency/ Recovery 3.35 (11.0) 3.35 (11.0) 3.20 (10.5)
Emergency Driving No lane 3.15 (10.3) 3.15 (10.3) 3.15 (10.3)
No lane Driving n.a. n.a. n.a.
Recovery Area Driving No lane 0.60 (2.0) 0.60 (2.0) 0.30 (1.0)
No lane Driving 0.60 (2.0) 0.60 (2.0) 0.30 (1.0)
*Driving = driving lane Emergency = shoulder area or area for emergency use Recovery Area = between shoulder and barrier Emergency/Recovery = shoulder area or area for emergency use or area between shoulder and barrier
design speed is 90 km/h (56 mi/h), but the definition of an urban area is not always clear. They believe they have impressive decreases in crashes in sections where speeds were reduced to 80 km/h (50 mi/h).
Lane width is 3.5 m (11.5 ft), but some believe that is too wide. Narrowed lanes provide space for hard shoulder running through redivision of the carriage-
way. In other words, it can provide greater capacity for a section. The Dutch design manual has a table that shows which lane to reduce given the conditions present.(17) Table 6 shows an example of the dimen-sions for the width of cross-section elements.
Traffic behavior is different when there are three lanes with no shoulder versus two lanes with a

32 CHAPTER 2: EUROPEAN AGENCY APPROACHES TO MANAGED MOTORWAYS
shoulder, so speeds are reduced when hard shoulder running is permitted.
Comments on horizontal curvature included the following:
Minimum radius is 750 m (2,459 ft) for ��100 km/h (62 mi/h), based on comfort, and 1,500 m (4,918 ft), based on visibility or sight.
Research has shown a significant difference ��in crashes over and under 1,500 m (4,918 ft).
Maximum superelevation is 5 percent.��
When using a 750-m (2,459-ft) radius, ��compensation must be made for the tight radius, such as by widening the carriageway.
Under 2,000 m (6,557 ft), a spiral transition ��is used.
Meetings and PresentationsThe scan team had meetings over a 2-day period with the following:
Ruth Tilstone, Highways Agency��
Paul Johnson, Highways Agency��
Nick Hopcraft, Highways Agency��
Max Brown, Highways Agency��
Brian Barton, Highways Agency��
Andrew Page-Dove, Highways Agency��
Sarah Garland, Highways Agency��
Mike Wilson, Highways Agency��
David Grant, Highways Agency��
Paul Unwin, Highways Agency��
Lucy Wickham, technical director, Mouchel��
Highways Agency Strategic PlanThe Highways Agency is an executive agency of the Department for Transport responsible for operating, maintaining, and improving the strategic road network in England. Formed in 1994, the agency’s aims are safe roads, reliable journeys, and informed travelers.
In Strategic Plan 2010–15, the Highways Agency’s vision is “to be the world’s leading road operator.”(18) The strategic goals are as follows:
We provide a service our customers can trust.��
We set the standard for delivery.��
We deliver sustainable solutions.��
Our roads are the safest in the world.��
Our network is a dynamic and resilient asset.��
England faces constraints of space (land) and money and anticipates building few new roads. Officials are discussing how best to use existing assets, such as the hard shoulder, and how to minimize investment and maximize benefits. Wider challenges England faces include carbon emissions, financial constraints, and network resilience.
Controlled MotorwaysThe controlled motorway theory is based on rela-tionships between speed and flow. Better highway flow can be achieved at lower speeds, which results in higher throughput. Therefore, the idea is to control the speed to maintain the flow. The slogan “go slower to get there faster!” communicates the idea.(19) Another benefit is improving journey time reliability. Improved reliability was emphasized in many of the Highways Agency’s presentations. Using the controlled motorway concept results in fewer flow breakdowns and shockwaves, producing smoother journeys.
ENGLAND

FREEWAY GEOMETRIC DESIGN FOR ACTIvE TRAFFIC MANAGEMENT IN EUROPE 33
The controlled or managed motorway concept requires a different way of thinking about design and includes the following:(19)
Operation of the road space is fundamentally ��altered by inclusion of the hard shoulder run-ning concept.
Operational regimes, rather than strict design ��standards, must drive the design of the scheme.
The system must be operated and maintained.��
Understanding traffic flows and how a scheme ��will operate in all potential situations is needed.
A new way of operating can introduce new ��hazards or reduce existing hazards. This requires a completely new approach to assessing the design of a managed motorway scheme to ensure safety is maintained.
Keys to success include creating an intuitive environment and anticipatory behavior along with driver compliance.
Managed MotorwaysAn outgrowth of the controlled motorway concept is managed motorways. Managed motorways stemmed from detailed desk studies and an onroad trial. A pilot scheme was implemented on the M42 in 2004, with hard shoulder running from 2006. Whether managed motorways should have a wider rollout after publication of results from the M42 was presented in the March 2008 Advanced Motor-way Signaling and Traffic Management Feasibility Study.(20) Conclusions from the pilot and further analysis suggest the following about the managed motorways concept:
Has high value��
Offers high journey time reliability benefits��
Can be delivered at 60 percent of the capital ��cost of conventional widening
Shows safety benefits��
Shows environmental benefit�� (20)
M42 Pilot Study
In 2001, the secretary of state asked the Highways Agency to conduct a trial of hard shoulder running on the M42 between junctions 3A and 7 southeast of Birmingham (see figure 35), with the following objectives:
Optimize safety and performance, in accordance ��with the volume and makeup of the traffic.
Provide more consistent journey times.��
Minimize harmful emissions and fuel ��consumption.
Reduce delays and disruption from crashes ��and incidents.
Figure 35. England: location of pilot test of hard shoulder running on the M42 in Birmingham.(19)

34 CHAPTER 2: EUROPEAN AGENCY APPROACHES TO MANAGED MOTORWAYS
Provide improved warnings and traffic manage-��ment in association with routine maintenance operations.(19)
Phased operation began in January 2005 and dynamic peak period hard shoulder running was implemented in September 2006.
The M42 pilot provided the opportunity to demon-strate and test a number of dynamic traffic manage-ment tools, positioned and used according to best practices, comprehensive safety hazard analysis, and predetermined operational regimes. The system included the following:
Lightweight gantries with variable message ��signs about every 500 m (1,640 ft)
Emergency refuge areas about every 500 m ��(1,640 ft)
Appropriate road markings and fixed signing��
Continuous safety fencing��
Comprehensive closed-circuit television (CCTv) ��coverage with cameras typically at up to 250-m (820-ft) intervals
Motorway Incident Detection and Automatic ��Signaling (MIDAS) loops
Maximum 50-mi/h (80-km/h) speed limit ��(initially) for all lanes when the hard shoulder is in use
Highways Agency Digital Enforcement Camera ��System (HADECS) for speed limit enforcement
Lighting throughout the length of the scheme��
Necessary optical fiber cabling and ��communications links(19)
This infrastructure allows hard shoulders to be used as running lanes. Initially, this was imple-mented only during maintenance and incidents to prove that the concept was workable. It was followed by full-scale operation of peak-time hard shoulder running with the full involvement of emergency services.
The M42 active traffic management pilot accomplished the following:
Development of a design tool to further ��develop controlled motorways and automatic enforced mandatory speed control activated by onroad loops and control algorithms
Introduction of hard shoulder running and ��monitoring that has proved the validity of design and operation assumptions
Monitoring of safety, environmental impact, ��and journey times, with results used to inform decisions on rollout of the managed motorways program
Development of operation procedures to ��ensure safe use of the modified infrastructure (e.g., reduced barrier setbacks, narrow lanes with reduced sightlines that rely on driver compliance with speed and lane discipline).
Originally, the M42 pilot operated at a maximum of 50 mi/h (80.4 km/h) with the following results:(19)
Average journey time has improved up to 24 ��percent in the worst p.m. peak time.
Fewer vehicles experience speeds of less than ��45 mi/h (72.4 km/h).
Journey time variability during weekdays has ��dropped significantly, an average of 22 percent.
On average, compliance is 94 percent or better ��at 70-mi/h (112.6-km/h), 60-mi/h (96.5-km/h), and 50-mi/h (80.4-km/h) speed limits.
Personal injury crashes have declined from ��5.08 per month before to 1.83 per month after implementation.
Following detailed safety review, the maximum speed limit was increased to 60 mi/h (96.5 km/h) with the following results:(19)
Average journey times dropped ��(4 percent reduction).
Average traffic speed increased ��(about 5 mi/h (8 km/h)).

FREEWAY GEOMETRIC DESIGN FOR ACTIvE TRAFFIC MANAGEMENT IN EUROPE 35
Speed limit compliance was maintained.��
Incidents did not increase; safety was ��maintained.
The overall positive effect was that using a ��60-mi/h (96.5-km/h) speed limit with hard shoulder running helped maintain speeds at higher levels during periods of congestion, giving a better overall performance than 50 mi/h (80.4 km/h) with hard shoulder running.
Compliance With Variable Mandatory Speed Limits
Compliance with the variable mandatory speed limit between January 2006 and May 2009 is shown in figure 36.(21) From late 2007 to early 2009, the mandatory speed limit was 50 mi/h (80.4 km/h) when hard shoulder running was permitted. During this time, compliance was not as good as when the mandatory speed limit was 60 mi/h (96.5 km/h) during hard should running (started in early 2009). Drivers did not see the reason for the lower speed and responded by driving at higher speeds. This behavior is also shown in the compliance when the mandatory speed limit was 40 mi/h (64.3 km/h).
The managed motorway concept introduced a new approach to operations and design. Both had to be considered together, along with overall traffic flows and the driver environment. In January 2009, the Highways Agency announced a £6 billion investment in the trunk road network. An additional 520 lane-miles (836.8 kilometer-miles) of capacity will be
added, of which 340 lane-miles (547.1 kilometer-miles) will be managed motorways or hard shoulder running. The managed motorway program puts a stronger emphasis on the agency’s role to actively manage the motorway network using technology in control centers and on the network. The use of technology is key to improving the reliability of the strategic road network. The managed motorway (or active traffic management) concept provides a toolbox of integrated approaches to manage the motorway environment.
The success of active traffic management on the M42 resulted in the Highways Agency being asked to extend the concept to the motorways around Birmingham, known locally as the Birmingham Motorway Box. Phase 1 of the Birmingham Box rollout (M6, M42, and M40) opened to traffic in December 2009. Work on phase 2 (M6 J8-10a) started in 2009–10, and it was scheduled to open to traffic in 2010–11. A through junction running trial started in December 2009. Table 7 (see next page) lists the planned program.
Operating a managed motorway required a new delivery and procurement approach. Needed was seamless transition through development, construction, and commissioning into actively operating the network. During development of the managed motorway concept, briefing notes were produced on 31 topics, including the following:
Scenario options��
Case studies��
Driver demographics��
Figure 36. England: variable mandatory speed limit compliance.(21)
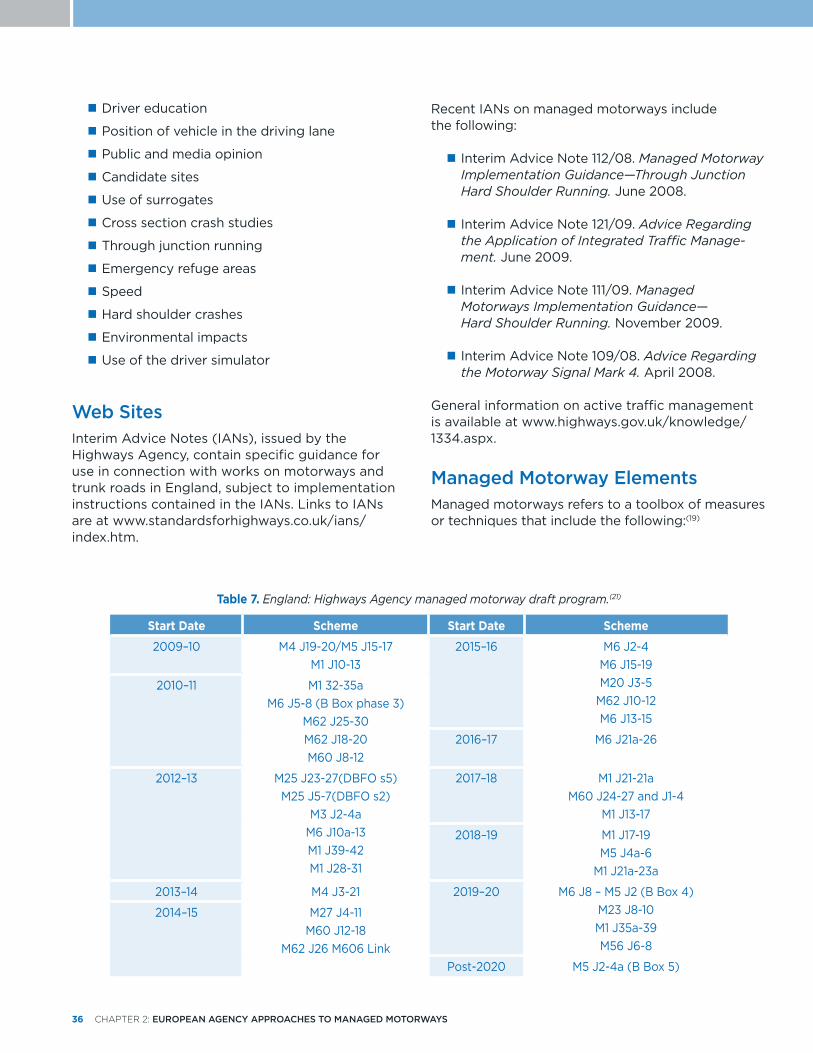
36 CHAPTER 2: EUROPEAN AGENCY APPROACHES TO MANAGED MOTORWAYS
Driver education��
Position of vehicle in the driving lane��
Public and media opinion��
Candidate sites��
Use of surrogates��
Cross section crash studies��
Through junction running��
Emergency refuge areas��
Speed��
Hard shoulder crashes��
Environmental impacts��
Use of the driver simulator��
Web SitesInterim Advice Notes (IANs), issued by the Highways Agency, contain specific guidance for use in connection with works on motorways and trunk roads in England, subject to implementation instructions contained in the IANs. Links to IANs are at www.standardsforhighways.co.uk/ians/ index.htm.
Recent IANs on managed motorways include the following:
Interim Advice Note 112/08. �� Managed Motorway Implementation Guidance—Through Junction Hard Shoulder Running. June 2008.
Interim Advice Note 121/09. �� Advice Regarding the Application of Integrated Traffic Manage-ment. June 2009.
Interim Advice Note 111/09. �� Managed Motorways Implementation Guidance— Hard Shoulder Running. November 2009.
Interim Advice Note 109/08. �� Advice Regarding the Motorway Signal Mark 4. April 2008.
General information on active traffic management is available at www.highways.gov.uk/knowledge/ 1334.aspx.
Managed Motorway ElementsManaged motorways refers to a toolbox of measures or techniques that include the following:(19)
Table 7. England: Highways Agency managed motorway draft program.(21)
Start Date Scheme Start Date Scheme2009–10 M4 J19-20/M5 J15-17
M1 J10-132015–16 M6 J2-4
M6 J15-19M20 J3-5
M62 J10-12M6 J13-15
2010–11 M1 32-35aM6 J5-8 (B Box phase 3)
M62 J25-30M62 J18-20M60 J8-12
2016–17 M6 J21a-26
2012–13 M25 J23-27(DBFO s5)M25 J5-7(DBFO s2)
M3 J2-4aM6 J10a-13M1 J39-42M1 J28-31
2017–18 M1 J21-21aM60 J24-27 and J1-4
M1 J13-17
2018–19 M1 J17-19M5 J4a-6
M1 J21a-23a
2013–14 M4 J3-21 2019–20 M6 J8 – M5 J2 (B Box 4)M23 J8-10M1 J35a-39M56 J6-8
2014–15 M27 J4-11M60 J12-18
M62 J26 M606 LinkPost-2020 M5 J2-4a (B Box 5)
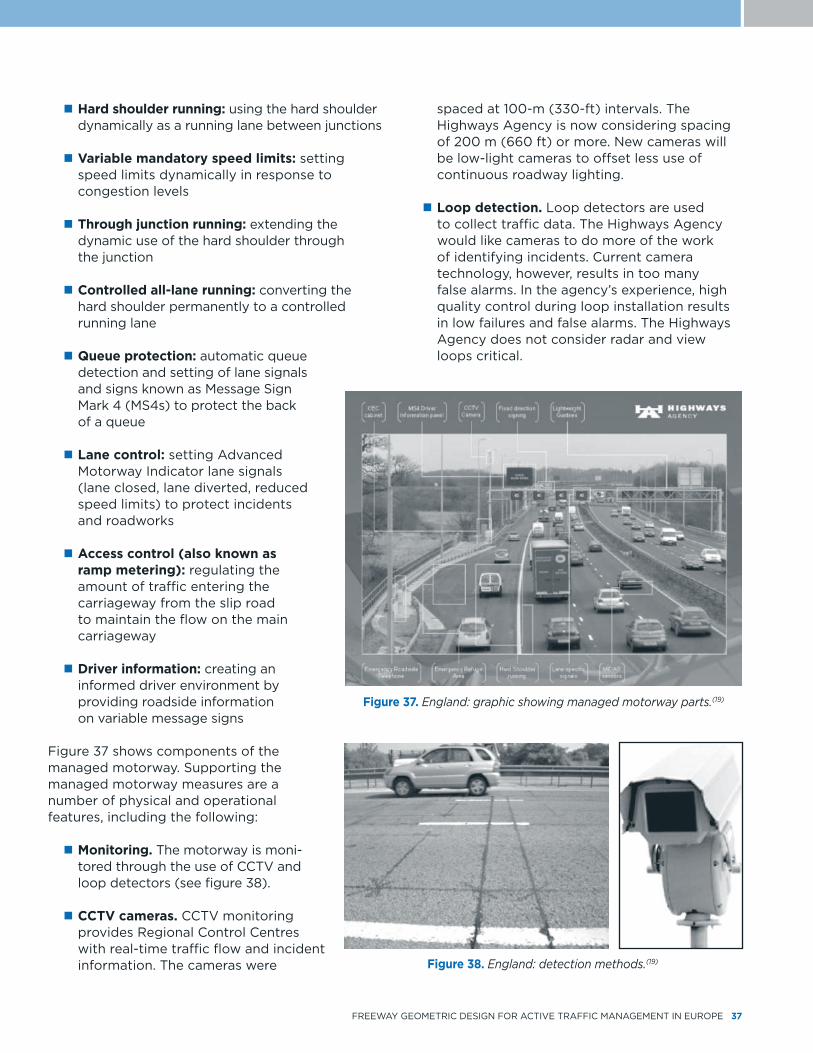
FREEWAY GEOMETRIC DESIGN FOR ACTIvE TRAFFIC MANAGEMENT IN EUROPE 37
Hard shoulder running:�� using the hard shoulder dynamically as a running lane between junctions
Variable mandatory speed limits:�� setting speed limits dynamically in response to congestion levels
Through junction running:�� extending the dynamic use of the hard shoulder through the junction
Controlled all-lane running: �� converting the hard shoulder permanently to a controlled running lane
Queue protection: �� automatic queue detection and setting of lane signals and signs known as Message Sign Mark 4 (MS4s) to protect the back of a queue
Lane control:�� setting Advanced Motorway Indicator lane signals (lane closed, lane diverted, reduced speed limits) to protect incidents and roadworks
Access control (also known as ��ramp metering): regulating the amount of traffic entering the carriageway from the slip road to maintain the flow on the main carriageway
Driver information: �� creating an informed driver environment by providing roadside information on variable message signs
Figure 37 shows components of the managed motorway. Supporting the managed motorway measures are a number of physical and operational features, including the following:
Monitoring. �� The motorway is moni-tored through the use of CCTv and loop detectors (see figure 38).
CCTV cameras. �� CCTv monitoring provides Regional Control Centres with real-time traffic flow and incident information. The cameras were
spaced at 100-m (330-ft) intervals. The Highways Agency is now considering spacing of 200 m (660 ft) or more. New cameras will be low-light cameras to offset less use of continuous roadway lighting.
Loop detection. �� Loop detectors are used to collect traffic data. The Highways Agency would like cameras to do more of the work of identifying incidents. Current camera technology, however, results in too many false alarms. In the agency’s experience, high quality control during loop installation results in low failures and false alarms. The Highways Agency does not consider radar and view loops critical.
Figure 38. England: detection methods.(19)
Figure 37. England: graphic showing managed motorway parts.(19)
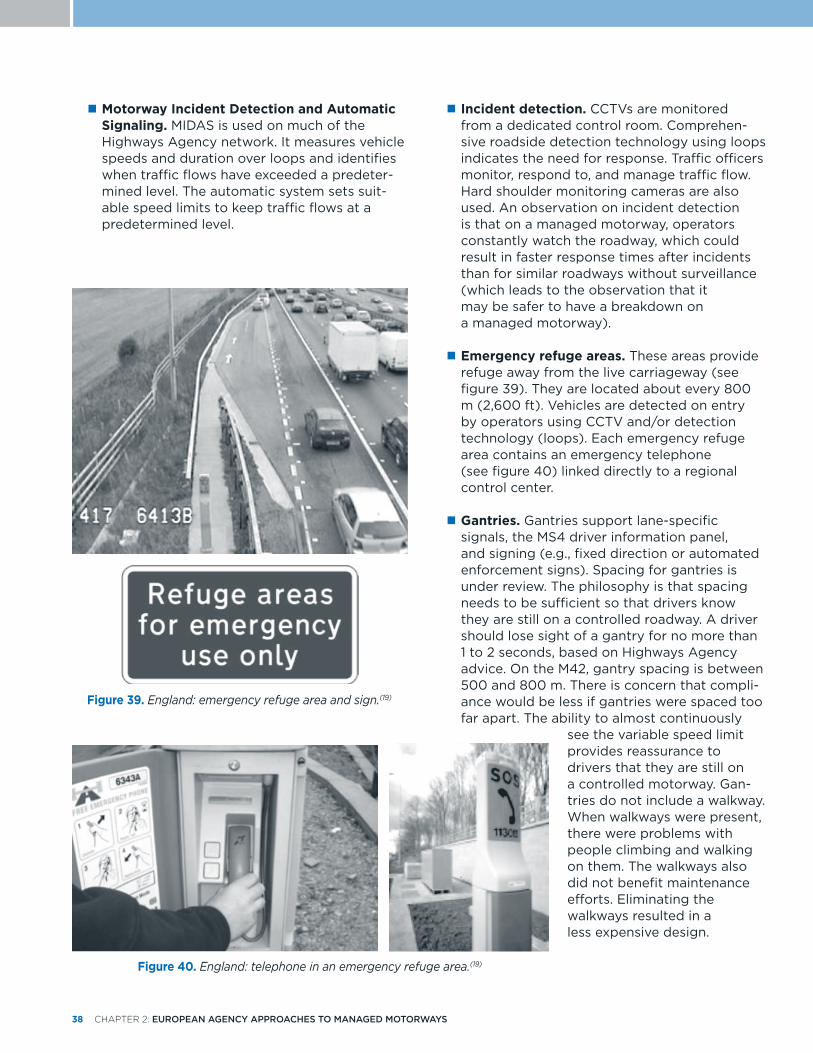
38 CHAPTER 2: EUROPEAN AGENCY APPROACHES TO MANAGED MOTORWAYS
Motorway Incident Detection and Automatic ��Signaling. MIDAS is used on much of the Highways Agency network. It measures vehicle speeds and duration over loops and identifies when traffic flows have exceeded a predeter-mined level. The automatic system sets suit-able speed limits to keep traffic flows at a predetermined level.
Incident detection. �� CCTvs are monitored from a dedicated control room. Comprehen-sive roadside detection technology using loops indicates the need for response. Traffic officers monitor, respond to, and manage traffic flow. Hard shoulder monitoring cameras are also used. An observation on incident detection is that on a managed motorway, operators constantly watch the roadway, which could result in faster response times after incidents than for similar roadways without surveillance (which leads to the observation that it may be safer to have a breakdown on a managed motorway).
Emergency refuge areas. �� These areas provide refuge away from the live carriageway (see figure 39). They are located about every 800 m (2,600 ft). vehicles are detected on entry by operators using CCTv and/or detection technology (loops). Each emergency refuge area contains an emergency telephone (see figure 40) linked directly to a regional control center.
Gantries. �� Gantries support lane-specific signals, the MS4 driver information panel, and signing (e.g., fixed direction or automated enforcement signs). Spacing for gantries is under review. The philosophy is that spacing needs to be sufficient so that drivers know they are still on a controlled roadway. A driver should lose sight of a gantry for no more than 1 to 2 seconds, based on Highways Agency advice. On the M42, gantry spacing is between 500 and 800 m. There is concern that compli-ance would be less if gantries were spaced too far apart. The ability to almost continuously
see the variable speed limit provides reassurance to drivers that they are still on a controlled motorway. Gan-tries do not include a walkway. When walkways were present, there were problems with people climbing and walking on them. The walkways also did not benefit maintenance efforts. Eliminating the walkways resulted in a less expensive design.
Figure 40. England: telephone in an emergency refuge area.(19)
Figure 39. England: emergency refuge area and sign.(19)

FREEWAY GEOMETRIC DESIGN FOR ACTIvE TRAFFIC MANAGEMENT IN EUROPE 39
Variable message signs. �� variable message signs provide road users with onroad informa-tion both for the wider network area and locally. The signs provide text and picture information (see figures 41 and 42). They are fixed to lightweight gantries.
Mandatory signals. �� Every usable lane has a signal indicator. The indicators depict speed limits (numbers) and driver instructions (arrows or Xs), as shown in figure 43 (see page 41). A red circle around the numbers indicates that the speed limit is enforceable. The signals are operated automatically by control system or manually by operators in the Regional Control Centre. When the signals are used to indicate an advisory speed limit, the beacons in the corner of the signal flash amber and the speed limit value does not have a red circle.
Speed limit. �� The maximum national speed limit is 70 mi/h (112.6 km/h). It applies at all times (i.e., it is not posted on signs) unless the vari-able speed limit is active. The speed limit is reduced before allowing hard shoulder running. Mandatory speed limits are set automatically using traffic data from MIDAS loop detectors embedded in the road surface. Speed limits of 60 mi/h (96.5 km/h) and 50 mi/h (80.4 km/h) are displayed on overhead gantries to address congestion in response to the traffic conditions on the motorway. When necessary to protect traffic from queues, 40-mi/h (64.3-km/h) speed limits can also be set.(20)
Enforcement. �� Automated enforcement is a component of the managed motorway system(19) The Highways Agency Digital Enforcement Camera System (HADECS) was “developed primarily to enforce the mandatory variable speed limits associated with schemes such as the M42 hard shoulder running and M25 controlled motorway schemes, whose safe and effective operation rely upon driver compliance with the displayed limits.”(20) The system uses radar-based speed detection by cameras mounted on overhead gantries, linked to the lane signals displaying the speed limit. The agency uses a mix of cameras and dum-mies. When in operation, all evidence is auto-matically retrieved and recorded at a secured police office. Officials observed that it is an onerous process to conduct automated
enforcement, including the part of the process involving the courts.(19) Compliance is impor-tant for managed motorways to function, and the agency conducts enforcement only to ensure compliance.
Roadway lighting. �� The amount of roadway lighting needed is under debate.
Managed Motorway SafetyThe safety objectives for managed motorways ��are as follows:(22)
Continue to contribute to the overall ��department’s casualty reduction targets set by ministers.
Use the procedures developed to assess ��road safety risk by detailed review of hazards and mitigations.
Develop site-specific operational procedures ��that will ensure safe operation and maintenance of the modified highway.
Figure 41. England: variable message signs.(19)
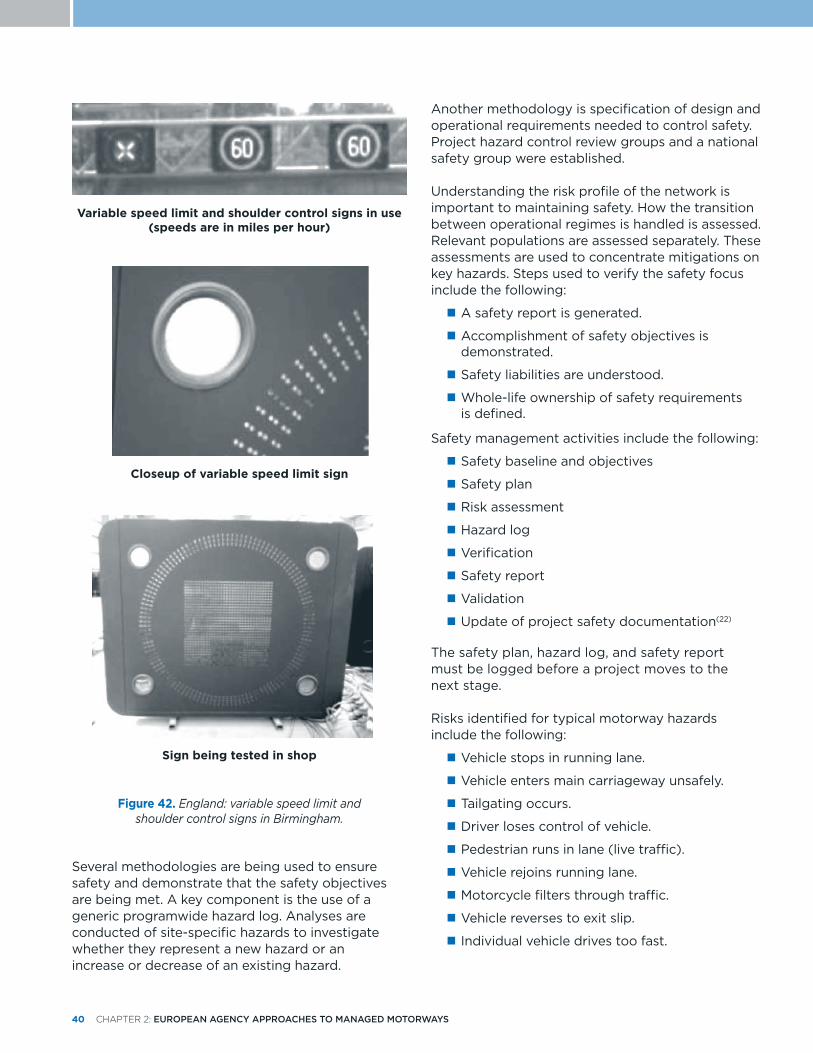
40 CHAPTER 2: EUROPEAN AGENCY APPROACHES TO MANAGED MOTORWAYS
Several methodologies are being used to ensure safety and demonstrate that the safety objectives are being met. A key component is the use of a generic programwide hazard log. Analyses are conducted of site-specific hazards to investigate whether they represent a new hazard or an increase or decrease of an existing hazard.
Another methodology is specification of design and operational requirements needed to control safety. Project hazard control review groups and a national safety group were established.
Understanding the risk profile of the network is important to maintaining safety. How the transition between operational regimes is handled is assessed. Relevant populations are assessed separately. These assessments are used to concentrate mitigations on key hazards. Steps used to verify the safety focus include the following:
A safety report is generated.��
Accomplishment of safety objectives is ��demonstrated.
Safety liabilities are understood.��
Whole-life ownership of safety requirements ��is defined.
Safety management activities include the following:
Safety baseline and objectives��
Safety plan��
Risk assessment��
Hazard log��
verification��
Safety report��
validation��
Update of project safety documentation�� (22)
The safety plan, hazard log, and safety report must be logged before a project moves to the next stage.
Risks identified for typical motorway hazards include the following:
vehicle stops in running lane.��
vehicle enters main carriageway unsafely.��
Tailgating occurs.��
Driver loses control of vehicle.��
Pedestrian runs in lane (live traffic).��
vehicle rejoins running lane.��
Motorcycle filters through traffic.��
vehicle reverses to exit slip.��
Individual vehicle drives too fast. ��
Variable speed limit and shoulder control signs in use (speeds are in miles per hour)
Closeup of variable speed limit sign
Sign being tested in shop
Figure 42. England: variable speed limit and shoulder control signs in Birmingham.

FREEWAY GEOMETRIC DESIGN FOR ACTIvE TRAFFIC MANAGEMENT IN EUROPE 41
vehicle stops on the hard shoulder when it ��is closed.
Debris is in the running lane.�� (22)
Anticipated hazards from hard shoulder running include the following:(22)
vehicles collide on hard shoulder while opening:��
Switching between three- and four-lane �running is excessive.
vehicle is stopped on hard shoulder as hard �shoulder opens.
Motorcycle is stopped on hard shoulder as �hard shoulder opens.
Crash occurs in or around emergency ��refuge area:
vehicle exits emergency refuge area during �four-lane running.
Heavy-goods vehicle exits emergency �refuge area during four-lane running.
vehicle is recovered from emergency refuge �area during four-lane running.
Figure 44 summarizes early safety trends from the M42 pilot study. Observations from the evaluation include a decline in the personal injury crash rate of 50 percent, based on 3 years of data. Also, no crashes involving fatalities or serious injuries have
Figure 43. England: mandatory lane signals.(19)
Figure 44. England: M42 pilot safety case study.(22)

42 CHAPTER 2: EUROPEAN AGENCY APPROACHES TO MANAGED MOTORWAYS
occurred during hard shoulder running. Overall, incidents have dropped 25 to 30 percent.(22)
Managed Motorway Hazard LogThe use of a generic programwide hazard log is a key element of the safety program in England. Because the concept of a managed motorway is new and evolving, sufficient data are not available for a crash-based evaluation. A risk-assessment methodology was developed to guide decisions. For managed motorways, this took the form of a generic hazard log.
To develop the hazard log, more than 140 hazards were identified and scores were applied. The development of the risk level estimates required an understanding of how the motorway works. A thorough understanding of the interaction between operational schemes and design was needed.(23)
The hazard log is prepopulated with the incidents, hazards, and causes known to be associated with such schemes. It is also prepopulated with the probability that a hazard leads to a crash and the severity of crashes. At the project level, the specific responsibility is to complete the entry of required information in the hazard log, including the project-specific frequency of different hazards.
Figure 45 shows a comparison of the types of crashes for the active traffic management site and other comparable sites.(22) The comparable sites use
data from STATS 19, the form used by police in the United Kingdom to record personal injury crash data. The observation from the comparison is that hazard logs can be used to help manage the safety of new schemes and that findings for the active traffic management site compare well with STATS 19 sites. Note that active traffic manage-ment-specific crash categories, such as crashes in or around emergency refuge areas, were removed from the generic hazard log analyses to make the analysis more readily comparable to the STATS 19 data. Figure 46 shows the hazards in order of frequency for the active traffic management site. The most common hazard, representing 41 percent of hazards, is vehicles colliding in the running lane. The six most common hazards represent more than 80 percent of the total risk in the hazard log. The data shown in figure 46 include active traffic management-specific crash categories, such as crashes in and around emergency refuge areas.(22)
Reported BenefitsSizable congestion and safety benefits have been realized with the active traffic management and managed motorway projects.(24) Figure 47 (see page 44) illustrates the change in average journey time profiles for the northbound direction between junctions 3A and 7. The time period for the before data was September to November 2005. The after period was for the same months in 2006. The change to four lanes with variable speed limits showed increased flows and reduced journey times. For example, the journey time for the Friday p.m.
Figure 45. England: comparison of hazards for active traffic management site and other comparable sites..(22)
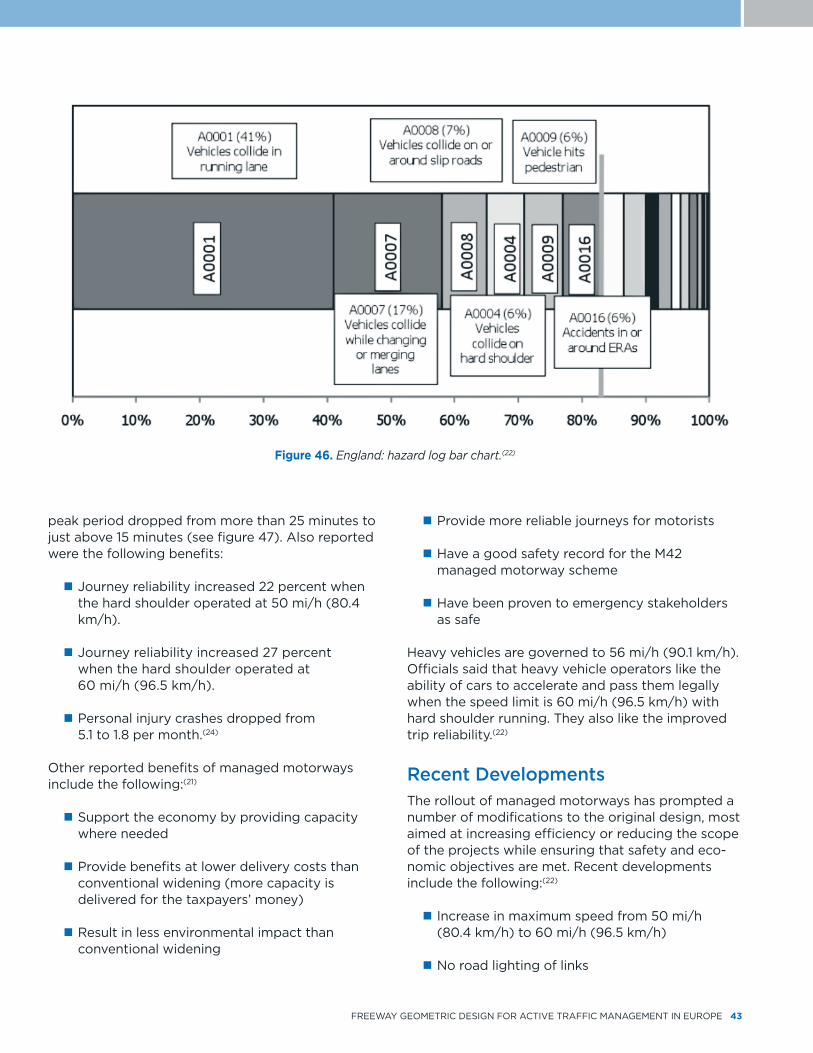
FREEWAY GEOMETRIC DESIGN FOR ACTIvE TRAFFIC MANAGEMENT IN EUROPE 43
peak period dropped from more than 25 minutes to just above 15 minutes (see figure 47). Also reported were the following benefits:
Journey reliability increased 22 percent when ��the hard shoulder operated at 50 mi/h (80.4 km/h).
Journey reliability increased 27 percent ��when the hard shoulder operated at 60 mi/h (96.5 km/h).
Personal injury crashes dropped from ��5.1 to 1.8 per month.(24)
Other reported benefits of managed motorways include the following:(21)
Support the economy by providing capacity ��where needed
Provide benefits at lower delivery costs than ��conventional widening (more capacity is delivered for the taxpayers’ money)
Result in less environmental impact than ��conventional widening
Provide more reliable journeys for motorists��
Have a good safety record for the M42 ��managed motorway scheme
Have been proven to emergency stakeholders ��as safe
Heavy vehicles are governed to 56 mi/h (90.1 km/h). Officials said that heavy vehicle operators like the ability of cars to accelerate and pass them legally when the speed limit is 60 mi/h (96.5 km/h) with hard shoulder running. They also like the improved trip reliability.(22)
Recent DevelopmentsThe rollout of managed motorways has prompted a number of modifications to the original design, most aimed at increasing efficiency or reducing the scope of the projects while ensuring that safety and eco-nomic objectives are met. Recent developments include the following:(22)
Increase in maximum speed from 50 mi/h ��(80.4 km/h) to 60 mi/h (96.5 km/h)
No road lighting of links��
Figure 46. England: hazard log bar chart.(22)

44 CHAPTER 2: EUROPEAN AGENCY APPROACHES TO MANAGED MOTORWAYS
Before: September–November 2005
After: September–November 2006
Figure 47. England: journey time improvements.(24)
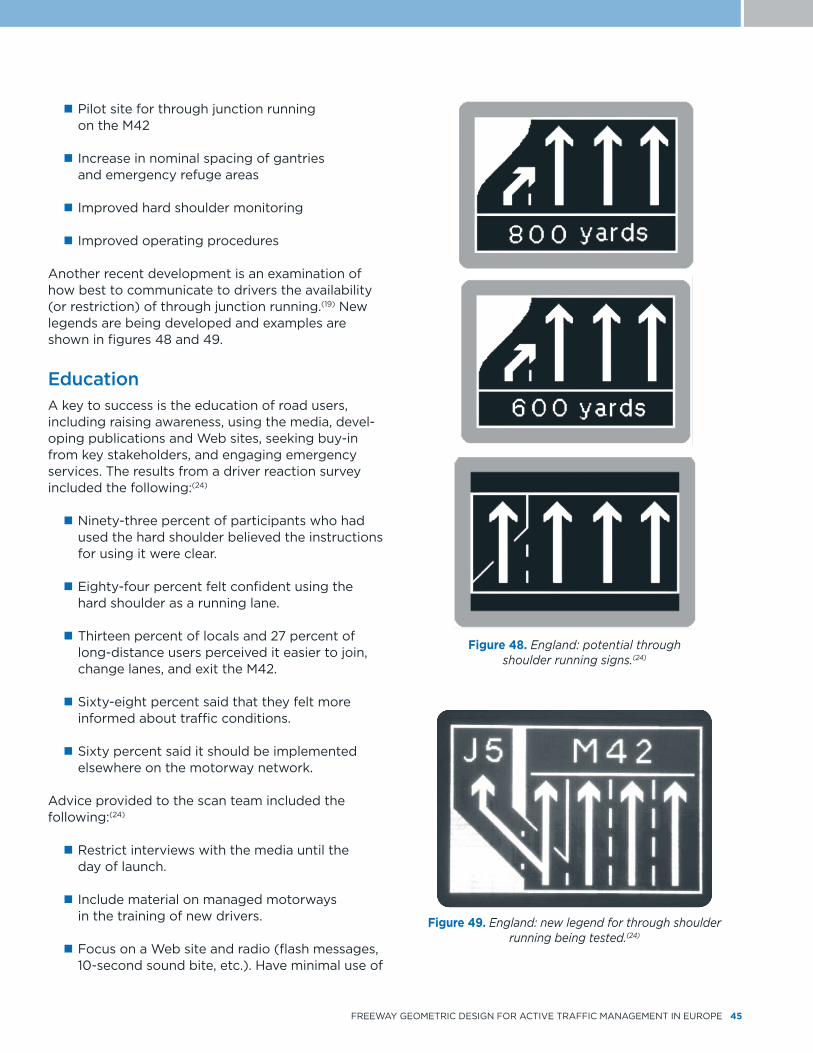
FREEWAY GEOMETRIC DESIGN FOR ACTIvE TRAFFIC MANAGEMENT IN EUROPE 45
Pilot site for through junction running ��on the M42
Increase in nominal spacing of gantries ��and emergency refuge areas
Improved hard shoulder monitoring��
Improved operating procedures��
Another recent development is an examination of how best to communicate to drivers the availability (or restriction) of through junction running.(19) New legends are being developed and examples are shown in figures 48 and 49.
EducationA key to success is the education of road users, including raising awareness, using the media, devel-oping publications and Web sites, seeking buy-in from key stakeholders, and engaging emergency services. The results from a driver reaction survey included the following:(24)
Ninety-three percent of participants who had ��used the hard shoulder believed the instructions for using it were clear.
Eighty-four percent felt confident using the ��hard shoulder as a running lane.
Thirteen percent of locals and 27 percent of ��long-distance users perceived it easier to join, change lanes, and exit the M42.
Sixty-eight percent said that they felt more ��informed about traffic conditions.
Sixty percent said it should be implemented ��elsewhere on the motorway network.
Advice provided to the scan team included the following:(24)
Restrict interviews with the media until the ��day of launch.
Include material on managed motorways ��in the training of new drivers.
Focus on a Web site and radio (flash messages, ��10-second sound bite, etc.). Have minimal use of
Figure 48. England: potential through shoulder running signs.(24)
Figure 49. England: new legend for through shoulder running being tested.(24)

46 CHAPTER 2: EUROPEAN AGENCY APPROACHES TO MANAGED MOTORWAYS
leaflets (experience has shown low value and they cannot be used while driving anyway).
Consider what highway codes may need to be ��altered (e.g., ability to cross solid white line).
Obtain early buy-in from key stakeholders, ��such as emergency services.
Traffic OfficersBefore 2004, police officers managed traffic incidents on motorways. To provide faster response time, the Traffic Officers Services group was initi-ated.(25) This group is a part of the Highways Agency and is responsible for managing traffic incidents. In 2010 the Traffic Officers Services group had about 1,600 on staff, with about 1,000 on the road and 600 in control rooms. Normally, traffic officers operate only on motorways, but they operate on other roadway classifications during major events (e.g., visits of dignitaries). As a service agency, the group has performance goals such as travel time to an incident. Traffic officers have the power to direct traffic and close the motorway, but they do not have criminal authority.
The training program for traffic officers lasts about 3 years and includes 5-week foundation training and 9-month classroom room training along with several months of on-the-job experience. Their vehicles have amber and red lights rather than blue lights. Patrol routes are structured so officers can respond within their 20-minute response time goal. Phone calls are to be answered within 20 seconds, and a typical phone call takes 5 minutes.

FREEWAY GEOMETRIC DESIGN FOR ACTIvE TRAFFIC MANAGEMENT IN EUROPE 47
Continued growth in travel on congested urban freeway corridors exceeds the ability of agencies to provide sufficient solutions and alternatives based on traditional roadway expansion and improvement projects. Several countries are implementing man-aged motorway concepts to improve the capacity of their freeways without acquiring more land and building large-scale infrastructure projects. Managed motorway concepts introduce new and revised operational activities that place greater reliance on technology than traditional roadway projects. Managed motorways combine actively or dynamically managed operational regimes, specific designs of infrastructure, and technology solutions. They use a range of traffic management measures to actively monitor the motorway and, based on the monitoring, dynamically control speeds, add capacity, and inform road users of conditions on the network to optimize traffic and safety performance. Examples of these measures include shoulder running, variable mandatory speed limits, lane control signals, dynamic rerouting, and the provision of driver information using variable message signs. Managed motorway concepts reduce collisions and improve journey reliability, travel time, and throughput on roadways through implementation of speed management and increase roadway capacity by allowing traffic to travel on the shoulder during peak periods. Other techniques can be used to reduce disruption from joining traffic (e.g., junction control and ramp metering) and to improve overall operations and safety (e.g., monitoring, detection, and emergency refuge areas).
Since a 2006 scanning study, active traffic management concepts have been implemented in Washington and Minnesota and are being considered in virginia. During these implementa-tions, several geometric design-related questions were voiced. In June 2010 a team of 10 U.S. transportation professionals with expertise in
planning, design, and operation of freeways visited England, Germany, the Netherlands, and Spain. The purpose of the scanning study was to examine active traffic management design practices used in other countries to improve the operational performance of congested freeway facilities without compromising safety.
Key findings from the 2010 scan include the following:
The European countries visited comprehen-��sively integrate a suite of complementary techniques to dynamically manage traffic flow in response to changing volumes, speeds, and incidents. The result is demonstrably improved safety, travel time reliability, and congestion relief on urban motorway sections. These strategies and techniques are likely to provide great benefit if applied in the United States.
The management strategies appropriate for ��a freeway corridor evolve as the needs and demands of the area change. In other words, transportation officials should recognize that freeways need a continuum of operational and management strategies that change as traffic needs and demands change.
European countries have safety concerns ��similar to those in the United States and have successfully addressed those concerns in managed motorway deployments. Managed motorways have contributed to substantial safety improvements in Europe.
Many European countries went through a ��paradigm shift in their design policies and practices by adopting risk- and performance-based approaches to making design choices on actively managed freeway facilities.
Chapter 3: Key Findings

48 CHAPTER 3: KEY FINDINGS
Successful active traffic management ��deployments require a well-planned interdisci-plinary collaboration of design with operations and enforcement. Successful implementation also needs the following:
High-level champions who lead a culture �change in an agency and institutionalize the agency’s commitment to prioritizing traffic management
Overcoming the “we never did this �before” attitude
Funding commitments for adequate �long-term operational maintenance
Advancing active traffic management in ��the United States will require evolution of long-standing design practices, collaboration of design and operations disciplines, and advances in techniques to communicate with motorists in real time.
FREEWAY GEOMETRIC DESIGN FOR ACTIvE TRAFFIC MANAGEMENT IN EUROPE 49
The scan team used findings from its study to develop recommended implementation actions, which are summarized in this section.
Dissemination of information and promotion ��of findings. The scan team believes that much can be gained in the United States by imple-menting several concepts and strategies observed and identified during the scanning study. To promote scan findings, team members have made technical presentations at several national meetings and conferences sponsored by FHWA, AASHTO, and other organizations to disseminate information from the scan. Team members also plan to make presentations to national and local meetings of the Institute of Transportation Engineers and other groups.
Research to support implementing recom-��mended actions. A research approach is needed to investigate the following issues:
Develop a synthesis of managed freeway �geometric design practices as well as associated operational and safety performance for both European and U.S. applications. Identify the characteristics of circumstances in which managed freeway treatments could be successful.
Coordinate the design efforts with ongoing �active traffic management research, syn-thesis, guidebook, and U.S. case study efforts underway by FHWA’s Office of Transportation Management.
Conduct research on signing and marking �needs in the United States for implementing shoulder running and assess the feasibility of implementing shoulder running in the United States.
Conduct research to assess if the hazard �index approach developed by the U.K. Highways Agency may be directly or indirectly applied to U.S. conditions.
Conduct research to assess the air quality �impacts of shoulder running and other managed motorway treatments.
varying lane widths in a cross section are �being used in Europe. Conduct research to investigate applications in the United States and address key questions: How should the presence of a horizontal curve affect lane widths? What vehicle restrictions are needed for various lane widths?
Conduct a synthesis of practice to identify �the best techniques to communicate with the public about the benefits and imple-mentation of managed freeway treatments.
Research program for managed freeway ��concepts. Also needed is a research program to investigate issues that are relevant to both managed freeways and all freeway design practices, such as the following:
Sign interpretation by the traveling public �
Driver understanding of symbols on �roadway signs
Stopping sight distance on horizontal �curves
Tort liability issues �
Dissemination of results from U.S. managed �lane pilot projects
Chapter 4: Implementation Strategy

50 CHAPTER 4: IMPLEMENTATION STRATEGY
Design guidelines. �� The following actions are suggested to assess the need to incorporate certain findings and recommendations of this scan into existing or proposed design guidance:
Query the AASHTO Technical Committee �on Geometric Design for potential future additions to the Green Book, such as general language on managed lanes and emergency refuge areas, as well as potential enhancements to its treatment of flexible design practice.
Assess the AASHTO � Guide for High- Occupancy Vehicle (HOV) Facilities for currency and consider broadening and updating it to include a managed freeway (active traffic management) focus.
Ask FHWA to clarify Federal policy and �its position on the eligibility and use of managed freeway tools.
Query FHWA and the National Committee �on Uniform Traffic Control Devices to determine possible updates needed to the Manual on Uniform Traffic Control Devices for managed freeway applications.

FREEWAY GEOMETRIC DESIGN FOR ACTIvE TRAFFIC MANAGEMENT IN EUROPE 51
Contact Information
Jeffrey (Jeff) C. Jones (AASHTO Cochair) Assistant Chief Engineer of Design Tennessee Department of Transportation James K. Polk Building, Suite 700 505 Deaderick St. Nashville, TN 37243-0349 Telephone: (615) 741-2831 Fax: (615) 741-0865 E-mail: [email protected]
Martin C. Knopp (FHWA Cochair) Division Administrator Florida and Puerto Rico Divisions Federal Highway Administration Florida Division 545 John Knox Rd., Suite 200 Tallahassee, FL 32303 Telephone: (850) 942-9650, ext. 3019 Fax: (850) 942-9691 E-mail: [email protected] Puerto Rico Division 350 Avenue Carlos Chardon, Suite 210 San Juan, PR 00918-2148 Telephone: (787) 766-5600 Fax: (787) 766-5924
Kay Fitzpatrick (Report Facilitator) Senior Research Engineer/Program Manager Roadway Design Program Texas Transportation Institute Texas A&M University System 3135 TAMU College Station, TX 77843-3135 Telephone: (979) 845-7321 Fax: (979) 845-6481 E-mail: [email protected]
Mark A. Doctor Safety and Design Engineer Federal Highway Administration Resource Center 61 Forsyth St., Suite 17T26 Atlanta, GA 30303-3104 Telephone: (404) 562-3732 Fax: (404) 562-3700 E-mail: [email protected]
Charles (Charlie) E. Howard Transportation Planning Director Puget Sound Regional Council 1011 Western Ave., Suite 500 Seattle, WA 98104 Telephone: (206) 464-7122 Fax: (206) 587-4825 E-mail: [email protected]
Gregory (Greg) M. Laragan Assistant Chief Engineer, Operations Idaho Transportation Department PO Box 7129 Boise, ID 83707-1129 Telephone: (208) 334-8535 Fax: (208) 334-8595 E-mail: [email protected]
James (Jim) A. Rosenow State Geometrics Engineer Geometric Design Support Unit Minnesota Department of Transportation Mail Stop 676 395 John Ireland Blvd. St. Paul, MN 55155-1899 Telephone: (651) 366-4673 Fax: (651) 366-4699 E-mail: [email protected]
Appendix A: Scan Team Members

52 APPENDIX A: TEAM MEMBERS
Brooke A. Struve Design Program Manager Federal Highway Administration Office of Infrastructure, Program Administration HIPA-20, Room E73-447 1200 New Jersey Ave., SE Washington, DC 20590-9898 Telephone: (202) 366-1317 Fax: (202) 366-3988 E-mail: [email protected]
Barton A. Thrasher Assistant State Location and Design Engineer virginia Department of Transportation 1401 East Broad St. Richmond, vA 23219 Telephone: (804) 786-5869 Fax: (804) 786-9311 E-mail: [email protected]
Elizabeth (Liz) G. Young Senior Supervising Transportation Planner Certified Project Manager Parsons Brinckerhoff 401 B St., Suite 1450 San Diego, CA 92101 Telephone: (619) 321-4181 Fax: (619) 338-8123 E-mail: [email protected]
Biographies
Jeffrey (Jeff) C. Jones (AASHTO cochair) is the assistant chief engineer of design for the Tennessee Department of Transportation (TDOT) in Nashville, TN. Before that, he served as the director of the TDOT Design Division for 11 years. In that capacity, Jones was responsible for the roadway design criteria and plan development procedures used for projects in Tennessee. Before joining TDOT, Jones served as an engineer with the Federal Highway Administration (FHWA) for more than 10 years, including assignments in the Georgia and Tennessee Divisions. Jones has a bachelor’s degree in civil engineering from the University of Tennessee at Knoxville. He is a licensed professional engineer in Tennessee. He serves on National Cooperative Highway Research Program (NCHRP) Technical Panels for Project 3-88 on Guidelines for Ramp and Interchange Spacing and Project 3-99 on Development and Application of Access
Management Guidelines. He is a member of the American Association of State Highway and Transportation Officials (AASHTO) Subcommittee on Design and Technical Committee on Geometric Design.
Martin C. Knopp (FHWA cochair) is the division administrator for FHWA’s divisions in Florida, Puerto Rico, and the U.S. virgin Islands. As a key member of FHWA’s management team, he exercises executive direction over one of the largest and most complex Federal-aid programs in the Nation. He leads a professional staff in providing guidance to the State of Florida and local officials in identifying surface transportation needs and implementing national transportation goals. He previously served as the FHWA Resource Center’s Operations Technical Services Team leader. In this position, he led a team of traffic operations experts to provide technical assistance, training, and technology transfer services for program and project needs. Before rejoining FHWA in 2003, Knopp served for 4 years as the director of the Intelligent Transportation Systems (ITS) Division at the Utah Department of Transporta-tion, where he led overall strategic direction of the ITS areas. He also chaired the ITS Subcommittee for the 2002 Winter Olympic Games in Salt Lake City and served as a consultant with the U.S. Department of State, assisting transportation and security organizers for the 2004 Summer Olympic Games in Athens, Greece. His FHWA assignments included traffic management engineer in the Georgia Division, traffic and safety engineer in the Utah Division, and ITS and Olympics operations engineer in the Utah Division. Knopp graduated from Pennsylvania State University in 1989 with a bachelor’s degree in civil engineering. He is a licensed professional engineer in Utah.
Dr. Kay Fitzpatrick (report facilitator) is a senior research engineer at the Texas Transporta-tion Institute. She has been the principal investiga-tor for numerous research projects for the Texas Department of Transportation (TxDOT), NCHRP, Transit Cooperative Research Program, and FHWA. Fitzpatrick conducted the TxDOT research project that developed new criteria for design speeds over 80 miles per hour (128 kilometers per hour) and another TxDOT project that evaluated best prac-tices on access to managed lanes in an existing freeway. She leads the FHWA project investigating engineering countermeasures for improving pedes-trian and bicycle safety. She has bachelor’s and
FREEWAY GEOMETRIC DESIGN FOR ACTIvE TRAFFIC MANAGEMENT IN EUROPE 53
master’s degrees from Texas A&M University and a doctor of philosophy degree from Pennsylvania State University. She is a registered professional engineer in Texas and Pennsylvania. Fitzpatrick is a member of the Transportation Research Board (TRB) Operations and Preservation Group and the Operational Effects of Geometric Design Commit-tee. She is a member of several Institute of Trans-portation Engineers (ITE) committees and wrote the chapter on intersection design for the ITE Urban Geometric Design Handbook.
Mark A. Doctor is a safety and geometric design engineer for FHWA’s Resource Center in Atlanta, GA. He advances the use of flexible and innovative geometric design practices on a national level and within FHWA’s design discipline. He also serves as the coteam leader of FHWA’s Design Focus Area Team on Interstate Access and Interchange Design and is responsible for coordinating the agency’s internal communication and technical capacity-building activities related to interchange design and interstate access requests. Doctor has served with FHWA for more than 21 years in a variety of posi-tions and geographic locations with responsibilities in project development, design, traffic engineering, and operations. He has a bachelor’s degree in civil engineering from Clemson University and a master’s degree in transportation engineering from the University of Florida. He is a licensed professional engineer in Georgia and serves on several TRB technical committees.
Charles (Charlie) E. Howard is the transporta-tion planning director for the Puget Sound Regional Council in Seattle, WA. He is responsible for devel-oping, updating, and implementing the long-range transportation plan for a metropolitan planning organization in a rapidly growing four-county region and directs the development of a regional congestion management process that is evaluating managed lane networks. Before joining the council, Howard worked for the Washington State Depart-ment of Transportation for 18 years, most recently as the director of strategic planning and program-ming in charge of statewide policy, planning, program development, and data functions. Howard is a graduate of Ohio State University and has a master’s degree in city and regional planning from Harvard University. He chairs the TRB Transporta-tion Systems Planning, Policy, and Process Section, is a member of the Future Strategic Highway Research Program capacity research development
panel and the Association of Metropolitan Planning Organizations Policy Committee, and serves on several NCHRP research project panels on planning issues.
Gregory (Greg) M. Laragan is the assistant chief engineer, operations, for the Idaho Transportation Department (ITD) in Boise, ID. He manages the statewide construction, mainte-nance, materials, traffic, ITS, highway safety, and technical training activities of ITD. In the past, Laragan served as roadway design engineer, assistant district engineer, State traffic engineer, and assistant maintenance engineer for ITD. He has a bachelor’s degree in civil engineering from Oregon State University and has been a registered professional engineer in Idaho since 1979. Laragan is a member of the Idaho Society of Professional Engineers, Intelligent Transportation Society of America, Women’s Transportation Seminar, and ITE. He represents ITD on the AASHTO Subcommittee on Systems Operation and Management and chairs the panel for NCHRP Project 20-86 on Attracting, Recruiting, and Retaining Skilled Staff for Transportation System Operations and Management.
James (Jim ) A. Rosenow is the State geometrics engineer for the Minnesota Department of Transportation (Mn/DOT) in St. Paul, MN. Rosenow leads the Geometric Design Support Unit, which is responsible for review and approval of preliminary engineering documents and geomet-ric design exceptions on State highway projects. He is also a key person in the development of geometric design policy and criteria for Mn/DOT, and he directs and develops geometric design training programs for statewide audiences. Before that, Rosenow worked for 15 years in various high-way design and project management capacities in the public and private sectors. He has a bachelor’s degree in civil engineering from the University of Minnesota and is a registered professional engineer in Minnesota. Rosenow is a member of the AASHTO Technical Committee on Geometric Design (Green Book committee) and a friend of the TRB Commit-tee on Geometric Design. He served as a member of the planning committee and as a small-group facilitator for Mn/DOT’s Flexible Design for 21st Century Challenges forum in February 2009, and he served as a panel presenter at the Oregon Department of Transportation Practical Solutions Peer Exchange Workshop in July 2009.
54 APPENDIX A: TEAM MEMBERS
Brooke A. Struve is a design program manager in the FHWA Office of Infrastructure. Her responsi-bilities include leading a team to develop tools and resources to advance expertise and practices on geometric design across the agency, participating on a similar team on the design of freeway inter-changes, and reviewing complex proposals for access to the Interstate System. Before her current job, she was a project manager with the FHWA Office of Federal Lands Highway, leading a team designing highway construction projects in national parks, wildlife refuges, and forest highways. Before joining FHWA, Struve was a design team leader with the Utah Department of Transportation, where she led teams designing highway construc-tion projects on freeways and urban arterials. Struve is a licensed professional engineer in Utah and is certified as a project management profes-sional by the Project Management Institute. She is a member of the AASHTO Technical Committee on Geometric Design and has participated on several NCHRP panels.
Barton (Bart) A. Thrasher is the assistant State location and design engineer for the virginia Department of Transportation in Richmond, vA. He is responsible for statewide oversight of all geometric and hydraulic design policies, standards, and technical guidelines. Thrasher has served with the virginia DOT for more than 13 years and has more than 16 years of progressive and varied experience in the design and management of highway projects. He has a bachelor’s degree and a master of business administration degree from Old Dominion University, as well as a bachelor’s degree from Emory and Henry College. He is a licensed professional engineer in virginia. He is a member of the AASHTO Highway Subcommit-tee on Design, AASHTO Technical Committee on Geometric Design, and TRB Committee on Geometric Design.
Elizabeth (Liz) G. Young is a senior supervising transportation planner for Parsons Brinckerhoff in San Diego, CA. Young works with FHWA to define the emerging practice of active traffic management (ATM) and develop a series of products that will guide ATM applications and practices in the United States. She works on a project team assessing the application of managed lanes, tolling, and ATM strategies for the Metropolitan Council, the metro-politan planning organization for the Minneapolis- St. Paul, MN, area. Young was the consultant project
manager for the Washington State Department of Transportation’s ATM Feasibility Study to assess the feasibility of implementing ATM strategies observed on the 2006 Planning and Designing Freeways for Congestion Management scanning study in the Puget Sound region. Young is a graduate of the University of Washington with a bachelor’s degree in geography and a master’s degree in transportation planning. She is an American Institute of Certified Planners certified planning professional and a member of the American Planning Association and Women’s Transportation Seminar.

FREEWAY GEOMETRIC DESIGN FOR ACTIvE TRAFFIC MANAGEMENT IN EUROPE 55
Overview
The scan team attended the 4th International Symposium on Highway Geometric Design in valencia, Spain, as well as a workshop on managed motorways held before the symposium. This appen-dix includes summaries of papers presented at the symposium and the workshop related to the issues examined by the scanning study. Also included are relevant findings from the desk scan.
4th International Symposium on Highway Geometric Design
The 4th International Symposium on Highway Geometric Design, held June 2 to 5, 2010, was sponsored by the Transportation Research Board. The symposium had 305 attendees representing 46 countries. The aim of the symposium was to stimulate continuous improvement in different areas of highway geometric design. It built on the success of symposiums held in Boston, MA, in 1995; Mainz, Germany, in 2000; and Chicago, IL, in 2005. They demonstrated that design practitioners, policymakers, and researchers worldwide face similar issues and can learn much by sharing their challenges and successes.
Workshop on Managed Motorways—Way Forward for the Future
John Smart of the Chartered Institution of Highways & Transportation and Jon Obenberger of the Federal Highway Administration coordinated the workshop on managed motorways. The presenters and their topics are in Appendix C. Smart and Obenberger provided the following introduction to the workshop:
With climate change on most countries’ agendas, emission targets being imposed, financial constrains being imposed due to the current global financial situation, and the need to improve performance, there is a growing need to better manage and make better use of the highway assets that authori-ties control. Limited public funding, increasing construction costs, restricted urban environ-ments, environmental constraints, and contin-ued growth in travel are further limiting the ability of agencies to construct new capacity on congested urban motorways.
Looking to actively manage the cross section and operation of a freeway or motorway is now becoming commonplace in a number of countries. Managed motorways is a context-sensitive solution countries are pursuing to mitigate the detrimental effects of congestion within these corridors while optimizing the investment that has or will be made in the roadway infrastructure. Agencies are using innovative geometric design treatments in an attempt to optimize the utilization of the roadway cross section in support of actively managing traffic and dynamically using different operational strategies (e.g., speed harmonization, vehicle restrictions (occu-pancy, trucks), pricing or tolling) to improve the performance of specific lanes of the entire motorway.
The workshop will explore the issues technical, behavioral, and political surrounding the introduction of managed motorways on a strategic road network. The workshop will also examine the use of innovative geometric design techniques that are being used in support of these managed motorways.
Appendix B: Symposium Findings

56 APPENDIX B: SYMPOSIUM FINDINGS
Australia
Coordinated Ramp Metering
J. Cunningham reported on the Australian M1 motorway, which has coordinated ramp metering along the entire corridor.(26) The M1 connects to privately operated segments with tolls. The system functions only when needed with startup and shutdown of the ramp metering based on algo-rithms. When the motorway is saturated and the ramp metering is functioning, the system allows only as many vehicles on the motorway as are leaving it. The Australians have developed the VicRoads Freeway Ramp Signals Handbook and technical specifications for ramp metering devices. In Cunningham’s words, unmanaged lanes are a chaotic system.
Sight Distance Around Concrete Barriers and Structures on Freeways and Interchanges
The provision of stopping sight distance around concrete barriers and structures on freeways and interchanges was examined by O.K. Arndt et al.(27)
They noted that strict application of the normal stopping sight distance model yields very wide shoulders that can act as parking areas and decrease barrier performance. Based on anecdotal evidence, ignoring sight distance requirements altogether is likely to decrease safety. Assuming a lower design speed can result in the design of inappropriate geometric features that violate driver expectations and degrade road safety, especially if the design speed chosen is too low. The criteria proposed for sight distance around concrete barriers and structures in this paper were devel-oped using less conservative, but realistic, values for many of the parameters in the stopping sight distance model. For example, the authors used a perception-reaction time of 1.5 seconds and noted that the value represents at least a mean value for surprise stopping for all drivers from several studies. Alternative deceleration rates and object heights were discussed, and higher deceleration and object heights than used in the current stop-ping sight distance procedure were considered in their sight distance calculations. Using these less conservative values was justified because the normal stopping condition that has been universally used is extremely conservative. The design stop-ping condition is a combination of several 85th percentile (or even higher) conditions. The use of
85th percentile conditions is common in road design. The combination of many 85th percentile values, however, can yield a very conservative value. The criteria developed by Arndt et al(27) retain the intents of the sight distance models by provid-ing reasonable stopping and maneuvering capabil-ity. They noted that when using these criteria, it is paramount to not underestimate the design speed because of the smaller latitude in the models. Their new criteria comprise two sections:
Sight distance over roadside safety barriers ��is possible.
Sight distance over roadside barriers and ��structures is not possible.
The new criteria have been incorporated into the latest Australian road design guidelines (Austroads, 2009, Guide to Road Design Series).
Denmark
Ghost Drivers In recent years, Denmark has seen a significant increase in the number of motorists driving against the traffic flow on motorways. The Danish name for these motorists is “ghost drivers.” Figure 50 shows the 80 locations in Denmark where untraditional ghost drivers initiatives were established on or at motorway ramps, as reported by K. Kjemtrup.(28) The number of ghost drivers was 91 in 2006, compared to 65 in 2005. Kjemtrup noted that only about every sixth ghost driver was stopped by the police. Drivers were often under the influ-ence of alcohol or confused (per police records), and the starting point of the ghost driver could not always be determined. Treatments used to minimize ghost drivers include the following.
Traditional measures: ��
“Ghost gates” consisting of an extra set �of “No Entry” road signs and two arrows marked on the ramp
Adjustment of the placement of road signs, �the cutting of plants in front of signs, and restoration of road markings and arrows on motorway ramps

FREEWAY GEOMETRIC DESIGN FOR ACTIvE TRAFFIC MANAGEMENT IN EUROPE 57
Untraditional measures:��
Special mandatory sign, “the Austrian �hand,” over a sign with the text “Turn Around” (see figure 51).
Flashing red lights beside the “No Entry” �road sign (figure 51). When driving down the ramp, the road user activates the flashing red lights to the right of the road above the “No Entry” sign. According to Kjemtrup,(28) the system has been used for some years on seven ramps and has been established on 11 additional ramps.
Road lighting to make the access ramp �more visible while the exit ramp remains in darkness. According to Kjemtrup,(28) the system is being tested at 14 selected access ramps.
Red flashing lane lights laid down in the �road on exit ramps (figure 51). According to Kjemtrup,(28) the system has been established on a ramp and is planned for 10 ramps within 6 months.
Chevron Markings
According to P. Greibe, 45 percent of all injury crashes on Danish freeways are categorized as crashes with vehicles driving in the same direction.(29) Rear-end crashes typically occur in situations with very short headways and/or in combination with high speeds. Inspired by positive results from the use of chevron markings in the United Kingdom and France, a trial of chevron markings on Danish
freeways was conducted in 2007. The markings were established on five road sections (each 4 kilometers (km) (2.5 miles (mi)) long) and consisted of a series of white arrowheads on the road surface at 36-meter (m) (118-foot (ft)) intervals. The chevron markings were accompanied by roadside signs advising drivers to keep a distance of two chevron markings from the vehicle in front. Figure 52 (see next page) shows photos of the markings and the signs.
Figure 50. Denmark: locations with ghost driver initiatives.(28)
Figure 51. Denmark: treatments for ghost drivers.(28)
“Austrian hand” Flashing lights on “No Entry” sign Red flashing lane lights

58 APPENDIX B: SYMPOSIUM FINDINGS
Two months after the markings were installed, significantly fewer vehicles had small gaps (less than 1 second). The largest reduction was in the left lane. The number of vehicles with gaps less than 2 seconds was also reduced, but the reduction was smaller. Speed was reduced slightly. Data were collected in 2010 to determine the long-term (2-year) effect. Telephone interviews were con-ducted 4 to 6 months after the chevron installa-tions. Of the 916 respondents, 80 percent noticed the chevron markings. Of those 80 percent, 96 percent knew the purpose of the markings.(29)
Netherlands
Sustainable SafetyRapid economic growth generated increased traffic demand in the 1980s and 1990s, which contributed to increased safety concerns on the Dutch roadway network. In 1998 the principles of sustainable safety were adopted in most of the design guidelines in the Netherlands. One method used to put the sustain-able safety concept into practice was establishment of three classes of roads:
Roads with a through function for rapid ��movement of through traffic
Roads with a distributor function��
Roads with an access function��
Each road class must comply with certain functional requirements, making each category different and readily recognizable to the road user. Pavement marking is an example of how the roads are to look different. As figure 53 shows, rural
Figure 52. Denmark: chevron markings.(29)
Figure 53. Netherlands: pavement markings for three road classes.(30)
Through road Distributor road Access road
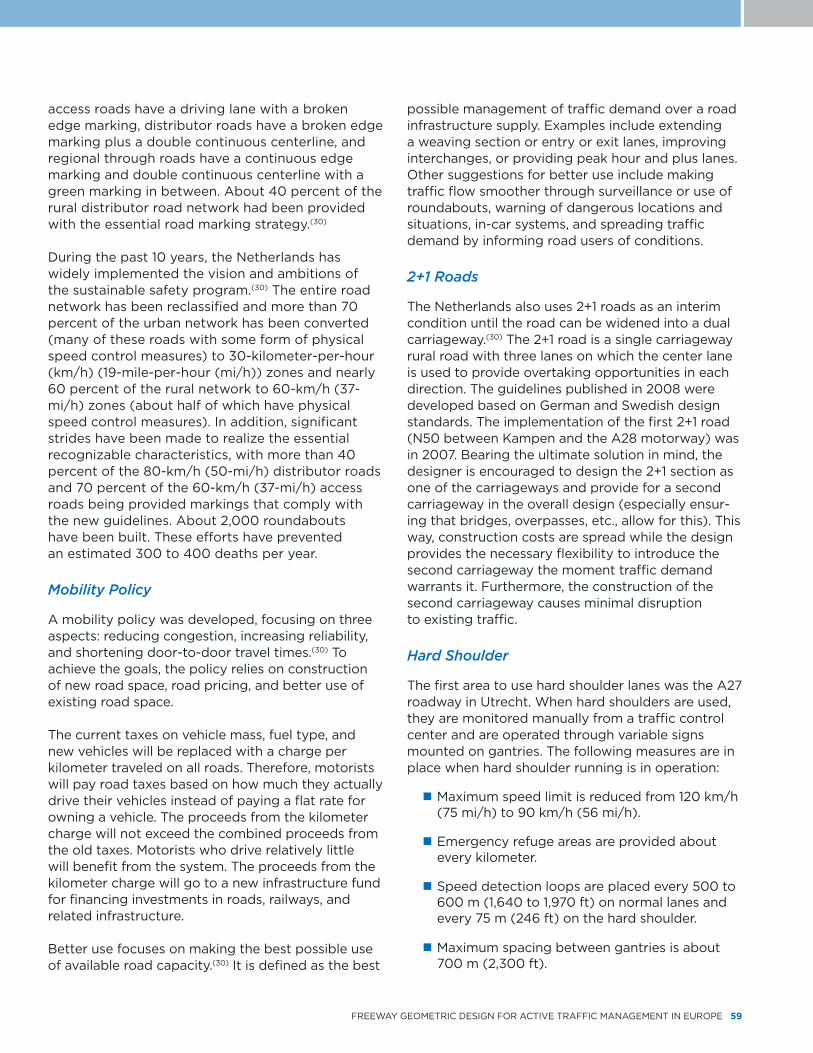
FREEWAY GEOMETRIC DESIGN FOR ACTIvE TRAFFIC MANAGEMENT IN EUROPE 59
access roads have a driving lane with a broken edge marking, distributor roads have a broken edge marking plus a double continuous centerline, and regional through roads have a continuous edge marking and double continuous centerline with a green marking in between. About 40 percent of the rural distributor road network had been provided with the essential road marking strategy.(30)
During the past 10 years, the Netherlands has widely implemented the vision and ambitions of the sustainable safety program.(30) The entire road network has been reclassified and more than 70 percent of the urban network has been converted (many of these roads with some form of physical speed control measures) to 30-kilometer-per-hour (km/h) (19-mile-per-hour (mi/h)) zones and nearly 60 percent of the rural network to 60-km/h (37-mi/h) zones (about half of which have physical speed control measures). In addition, significant strides have been made to realize the essential recognizable characteristics, with more than 40 percent of the 80-km/h (50-mi/h) distributor roads and 70 percent of the 60-km/h (37-mi/h) access roads being provided markings that comply with the new guidelines. About 2,000 roundabouts have been built. These efforts have prevented an estimated 300 to 400 deaths per year.
Mobility Policy
A mobility policy was developed, focusing on three aspects: reducing congestion, increasing reliability, and shortening door-to-door travel times.(30) To achieve the goals, the policy relies on construction of new road space, road pricing, and better use of existing road space.
The current taxes on vehicle mass, fuel type, and new vehicles will be replaced with a charge per kilometer traveled on all roads. Therefore, motorists will pay road taxes based on how much they actually drive their vehicles instead of paying a flat rate for owning a vehicle. The proceeds from the kilometer charge will not exceed the combined proceeds from the old taxes. Motorists who drive relatively little will benefit from the system. The proceeds from the kilometer charge will go to a new infrastructure fund for financing investments in roads, railways, and related infrastructure.
Better use focuses on making the best possible use of available road capacity.(30) It is defined as the best
possible management of traffic demand over a road infrastructure supply. Examples include extending a weaving section or entry or exit lanes, improving interchanges, or providing peak hour and plus lanes. Other suggestions for better use include making traffic flow smoother through surveillance or use of roundabouts, warning of dangerous locations and situations, in-car systems, and spreading traffic demand by informing road users of conditions.
2+1 Roads
The Netherlands also uses 2+1 roads as an interim condition until the road can be widened into a dual carriageway.(30) The 2+1 road is a single carriageway rural road with three lanes on which the center lane is used to provide overtaking opportunities in each direction. The guidelines published in 2008 were developed based on German and Swedish design standards. The implementation of the first 2+1 road (N50 between Kampen and the A28 motorway) was in 2007. Bearing the ultimate solution in mind, the designer is encouraged to design the 2+1 section as one of the carriageways and provide for a second carriageway in the overall design (especially ensur-ing that bridges, overpasses, etc., allow for this). This way, construction costs are spread while the design provides the necessary flexibility to introduce the second carriageway the moment traffic demand warrants it. Furthermore, the construction of the second carriageway causes minimal disruption to existing traffic.
Hard Shoulder
The first area to use hard shoulder lanes was the A27 roadway in Utrecht. When hard shoulders are used, they are monitored manually from a traffic control center and are operated through variable signs mounted on gantries. The following measures are in place when hard shoulder running is in operation:
Maximum speed limit is reduced from 120 km/h ��(75 mi/h) to 90 km/h (56 mi/h).
Emergency refuge areas are provided about ��every kilometer.
Speed detection loops are placed every 500 to ��600 m (1,640 to 1,970 ft) on normal lanes and every 75 m (246 ft) on the hard shoulder.
Maximum spacing between gantries is about ��700 m (2,300 ft).

60 APPENDIX B: SYMPOSIUM FINDINGS
A green arrow is displayed when the lane ��is available for use and a red cross when it is closed.
During hard shoulder running operation, ��the maximum speed limit is also displayed.
Rescue vehicles are placed at junctions for ��rapid deployment in the event of an incident.(31)
Plus Lanes
The Netherlands also uses plus lanes in many areas, which are narrow lanes on the inside of the roadway that are opened at peak times to create capacity while at the same time speed limits are reduced to improve safety.(32,33) The plus lane is provided by reconstructing the existing roadway while keeping the hard shoulder. It is opened for travel use when traffic volumes reach levels that indicate congestion is growing.
Sweden
Higher Speed Roads
In Sweden, the objective is to decrease the number of people killed in crashes by 50 percent and severely injured by 25 percent from 2007 to 2020. The long-term “Zero vision” is that nobody com-plying with system laws (e.g., driving while sober and using a seatbelt, a modern car, and no exces-sive speeding) should be killed or severely injured.(34) According to their report, T. Bergh and M. Petersson(34) reported that to a great extent the design debate has focused on how to contribute to the safety objectives in a cost-effective way. The following information on higher speed roadways was discussed:
The first Swedish motorway (Malmo-Lund) was ��about 20 km (12.4 mi) and was opened in 1953 with a prewar German design without outer hard shoulders, with a narrow median, and without tapers at entries and exits. Most of the normally 110-km/h (68-mi/h) rural motorway system has a 26.5-m (87-ft) cross section (see figure 54). The fatality rate for 110-km/h (68-mi/h) motorways has decreased because of heavy implementation of median and side fences on older motorways. A political interven-tion based on environmental impact concern triggered a number of four-lane projects in the
mid-1990s with an 18.5-m (61-ft) cross section (see figure 54). The crash rates for these proj-ects, some 100 km (62 mi), “have not redeemed our expectations on safety performance.” Figure 54 shows a compromise for new design with a 21.5-m (71-ft) cross section.
The 2+1 cable barrier design has a cross ��section that is normally within a 13-m (43-ft) paved width (see figure 55). The first project opened in 1998 and was judged a major success by politicians and public opinion. More than 2,000 km are now open with the following distribution:
About 30 percent are 110-km/h (68-mi/h) �semimotorways (i.e., grade separated, full access control).
About 30 percent are 90-km/h (56-mi/h) �semimotorways.
About 30 percent are normal 90-km/h �(56-mi/h) roads (i.e., with at-grade intersec-tions, accesses, and vulnerable road users and slow-moving vehicles permitted).
Speed limits were changed to 100 km/h (62 mi/h) in 2008–2009 in the speed limit overview. The crash evaluation found an overall fatality rate almost equal to motorways, giving a reduction for some projects of 80 percent and over 50 percent including severe injuries, resulting in a savings of 50 lives a year. Main disadvantages are major barrier crash repairs.
Major efforts are being concentrated on ��improved safety design on normal two-lane roads (6.6- to 11.5-m (21.6- to 37.7-ft) paved width) with a speed limit of 90 km/h (56 mi/h). These roads, some 10,000 km (6,213 mi), have about 90 fatalities a year, 40 percent in head-on and overtaking crashes and 25 percent in single roadway departure crashes. Average daily traffic is normally in the range of 1,000 to 5,000 vehicles. Three main alternatives are being examined:
Centerline rumble strips have been imple- �mented on 4,000 km (2,485 mi) since 2005. The anticipated effect on fatalities and severe injuries is estimated at 10 to 15 percent based on Finnish and U.S. results,

FREEWAY GEOMETRIC DESIGN FOR ACTIvE TRAFFIC MANAGEMENT IN EUROPE 61
but those results have not been achieved yet in Sweden. The noise disturbance distance to avoid levels above 45 A-weighted decibels (dBA) has been extended to 150 m (492 ft) to occupied houses, giving an average of some 60 to 70 percent rumble strips on a project.
The rumble median with overtaking lanes �concept includes the addition of overtaking sections at slightly longer intervals than in the 2+1 concept. A no-overtaking zone with a narrow rumble median is between the overtaking sections with information signs on the next overtaking opportunity.
Figure 56 illustrates the concept. Side safety fences are used in sharper outer bends. The costs of overlays, signs, and road markings are to be from maintenance money to facilitate a large-scale implementation over a reasonably short period.
A median barriers with overtaking lanes �project was implemented in December 2009 at National Road 26 outside vaxjo (see figure 57 on next page). The 1+1 sections are squeezed into the existing 9-m (30-ft) width, with 0.75-m (2.5-ft) outer shoulders, 3.25-m (10.7-ft) traffic lanes, and a 1-m (3.3-ft) median.
Figure 55. Sweden: typical 2+1 median barrier design on 13-m paved width.(34)
Figure 54. Sweden: motorway and alternative four-lane cross sections from the 1970s.(34)
Traditional 26.5 m:• 2.75-m outer shoulders• 3.75-m traffic lanes• 1.0-m inner shoulder• 4.0-m median with barrier
Alternative 18.5 m:• 0.5-m outer shoulders• 3.5-m traffic lanes• 0.5-m inner shoulder• 2.5-m median with barrier
Present design 21.5 m:• 2.0-m outer shoulders• 3.5-m traffic lanes• 0.5-m inner shoulder• 2.5-m median with barrier
Figure 56. Sweden: overtaking lane principles with rumble or barrier median.(34)

62 APPENDIX B: SYMPOSIUM FINDINGS
United Kingdom—England
Making Better UseIn his country report, J. Smart(35) discussed a strat-egy known as “Making Better Use.” In 2000, after a government review of transport policy in the United Kingdom, the Highways Agency (highway authority for the strategic road network) was asked to develop a roads improvement strategy that would speed up delivery of large-scale road construction schemes over 10 years. The strategy became known as the 10-Year Plan. One element of the strategy became known as the Making Better Use program, which has a goal of creating additional capacity without moving outside the existing footprint of a highway. In addition, safety should not be compro-mised and environmental impact should be minimal. In geometric terms, this meant looking at the exist-ing standard highway cross section and junction layouts to establish where additional lane widths could be developed or where using technology could assist in increasing capacity of existing lane configurations or enable lane control, lane entry, and lane designation changes to be made. This approach is to be considered for all levels of road hierarchy, whether the route is a single carriageway, dual carriageway, or motorway.
Wide Single 2+1
The wide single 2+1 is used when upgrading a single carriageway road into a dual carriageway is being considered. The single carriageway is marked in three lanes, with the center lane used for alternating directional overtaking sections (see figure 58). The existing 10-m (33-ft) width is used or combined with minor widening to 11 m (36 ft). Trials of this layout have been undertaken in the United Kingdom, and
similar layouts operate in Finland, Germany, Ireland, and Sweden.(35)
Active Traffic Management With Hard Shoulder Running
A trial project using the hard shoulders of the M42 roadway was conducted as a possible congestion relief solution. Motorists traveling southbound on the M42 at Junction 5 near Solihull were first to use the hard shoulder between motorway slip roads. The initiative created a continuous four-lane section of the motorway between Junctions 6 (Birmingham Airport) and 4 (Monkspath).(36) Initial results of the use of the shoulder on the M42 to relieve congestion showed that travel time was reduced by as much as 27 percent on weekdays.(37) Black and yellow electronic variable message signs inform motorists whether the hard shoulder is open to traffic and which lanes can be used to exit from or stay on the motorway.(36) The success of this trial resulted in the expansion of the program to the M6 roadway. Construction on the M6 to replace bridge joints, make surface repairs, and add lane markings are projected to be completed by spring 2011.(32)
Smart(35) provided additional details on the trial of the M42 section near Birmingham, England. The section is a three-lane motorway (six lanes plus full hard shoulders). Management techniques include mandatory variable speed limits, enhanced driver information signs, and a new congestion and incident management system. The system allows operators to open and close any lane on the motor-way to traffic to help manage congestion at busy times of the day or during traffic buildup from an incident. Eventually, this will include using the hard shoulder as a running lane between junctions under controlled conditions. The infrastructure includes new lighting, gantries, electronic and static signing, emergency roadside telephones, emergency refuge areas, cameras, and mandatory variable speed limits. Use of the hard shoulder as an extra running lane during busy peak periods or incidents was introduced in September 2006 as the final phase in the active traffic management (ATM) project (see figure 59).(35) The key aspects of ATM are the following:
Use of variable manda�� tory speed limits
Dynamic use of the hard shoulder during ��periods of congestion or incidents
Figure 57. Sweden: median barrier project.(34)

FREEWAY GEOMETRIC DESIGN FOR ACTIvE TRAFFIC MANAGEMENT IN EUROPE 63
Provision of dedicated emergency refuge ��areas for use when vehicles break down
Installation of gantries with signals and ��variable message signs(38)
A proposed method to compensate for the loss of the hard shoulder during certain times of the day is emergency refuge areas. Located next to the hard shoulder, emergency refuge areas are designed to be used in all cases of emergency or breakdown, not only when the hard shoulder is being used as a running lane. One is located about every 500 m (1,640 ft) along the length of the ATM section of the M42.(39)
In the first 12 months of the full M42 trial, use of the hard shoulder in peak periods was a success, with average journey times falling by more than a quarter on the northbound carriageway. A report on the trial, ATM Monitoring and Evaluation(38) is at www.dft.gov.uk/pgr/roads/tpm/m42activetrafficmanage-ment/atm12mthsumrep.pdf.
Managed Motorways
“Managed motorways” is a term used to encapsulate a range of techniques that can be employed to control the level and speed of traffic on a high-speed interurban route. According to Smart,(35) the managed motorway has developed in the United Kingdom from the successful trial of the ATM concept. The managed motorway concept is a context-sensitive solution being pursued to mitigate the detrimental effects of congestion while opti-mizing the investment that has or will be made in the roadway infrastructure. Agencies are using innovative geometric design treatments to optimize the use of the roadway cross section to actively manage traffic. They dynamically use operational strategies such as speed harmonization, vehicle restrictions (e.g., occupancy, trucks), or pricing and tolling to improve the performance of specific lanes or the entire motorway.
Truck Restrictions
The first truck restrictions in England were implemented on a pilot basis on northbound M42 near Warwickshire between 7 a.m. and 7 p.m. This 5-km (3-mi) stretch of roadway between Junction 10 (Tamworth) and Junction 11 (Appleby Magna) is only two lanes in each direction, and heavy vehicles,
which make up 17 percent of the traffic, must travel slowly up the steep grade.(40) The ban prevents heavy trucks from overtaking each other and restricts them to one lane, leaving the other lane for faster moving vehicles. The intent is to enhance operations and safety and reduce conges-tion along this part of the roadway. Results of the ban, including safety impacts and travel time savings, are still unknown.(40)
Exclusive Bus Lanes on M4
The first bus lane on a motorway opened in 1997 on the M4 Spur motorway to Heathrow Airport. The Central Bus Station at the airport serves more than 1,600 buses per day, and the traffic during peak periods can be backed up the entire 1.4-km
Figure 58. United Kingdom: WS2+1 layout.(35)
Figure 59. United Kingdom: hard shoulder use.(38)
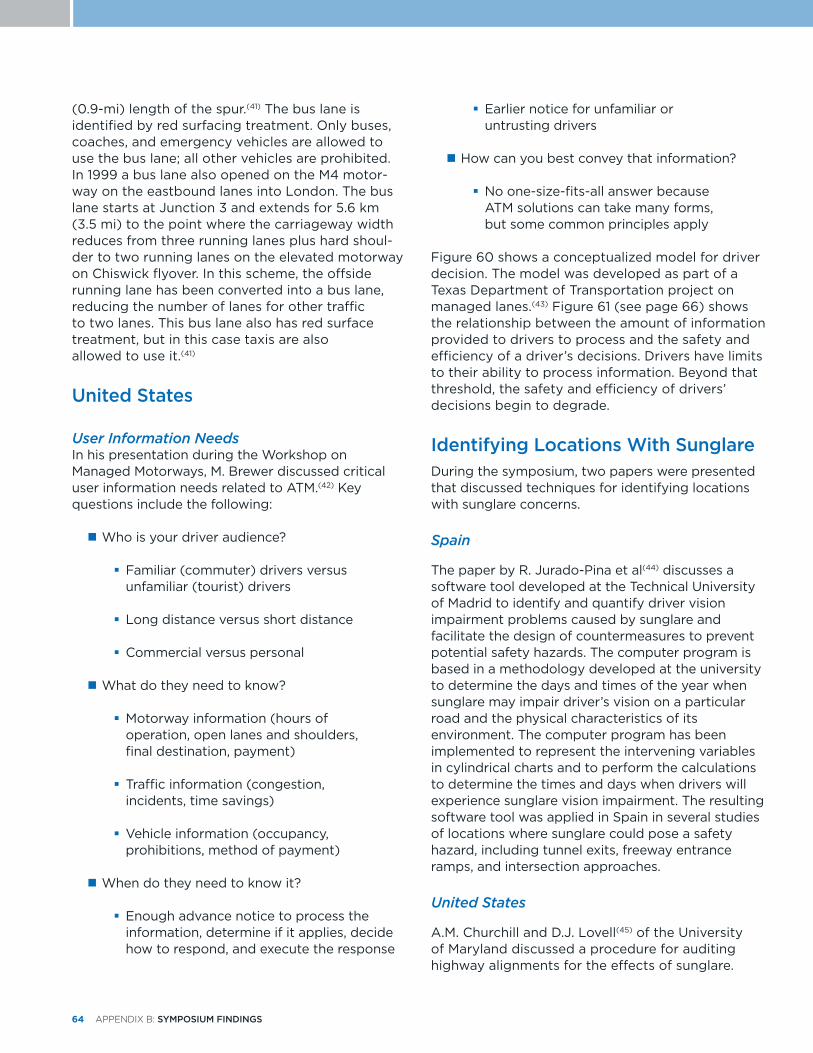
64 APPENDIX B: SYMPOSIUM FINDINGS
(0.9-mi) length of the spur.(41) The bus lane is identified by red surfacing treatment. Only buses, coaches, and emergency vehicles are allowed to use the bus lane; all other vehicles are prohibited. In 1999 a bus lane also opened on the M4 motor-way on the eastbound lanes into London. The bus lane starts at Junction 3 and extends for 5.6 km (3.5 mi) to the point where the carriageway width reduces from three running lanes plus hard shoul-der to two running lanes on the elevated motorway on Chiswick flyover. In this scheme, the offside running lane has been converted into a bus lane, reducing the number of lanes for other traffic to two lanes. This bus lane also has red surface treatment, but in this case taxis are also allowed to use it.(41)
United States
User Information NeedsIn his presentation during the Workshop on Managed Motorways, M. Brewer discussed critical user information needs related to ATM.(42) Key questions include the following:
Who is your driver audience?��
Familiar (commuter) drivers versus �unfamiliar (tourist) drivers
Long distance versus short distance �
Commercial versus personal �
What do they need to know?��
Motorway information (hours of �operation, open lanes and shoulders, final destination, payment)
Traffic information (congestion, �incidents, time savings)
vehicle information (occupancy, �prohibitions, method of payment)
When do they need to know it?��
Enough advance notice to process the �information, determine if it applies, decide how to respond, and execute the response
Earlier notice for unfamiliar or �untrusting drivers
How can you best convey that information?��
No one-size-fits-all answer because �ATM solutions can take many forms, but some common principles apply
Figure 60 shows a conceptualized model for driver decision. The model was developed as part of a Texas Department of Transportation project on managed lanes.(43) Figure 61 (see page 66) shows the relationship between the amount of information provided to drivers to process and the safety and efficiency of a driver’s decisions. Drivers have limits to their ability to process information. Beyond that threshold, the safety and efficiency of drivers’ decisions begin to degrade.
Identifying Locations With Sunglare During the symposium, two papers were presented that discussed techniques for identifying locations with sunglare concerns.
Spain
The paper by R. Jurado-Pina et al(44) discusses a software tool developed at the Technical University of Madrid to identify and quantify driver vision impairment problems caused by sunglare and facilitate the design of countermeasures to prevent potential safety hazards. The computer program is based in a methodology developed at the university to determine the days and times of the year when sunglare may impair driver’s vision on a particular road and the physical characteristics of its environment. The computer program has been implemented to represent the intervening variables in cylindrical charts and to perform the calculations to determine the times and days when drivers will experience sunglare vision impairment. The resulting software tool was applied in Spain in several studies of locations where sunglare could pose a safety hazard, including tunnel exits, freeway entrance ramps, and intersection approaches.
United States
A.M. Churchill and D.J. Lovell(45) of the University of Maryland discussed a procedure for auditing highway alignments for the effects of sunglare.

FREEWAY GEOMETRIC DESIGN FOR ACTIvE TRAFFIC MANAGEMENT IN EUROPE 65
Figure 60. Conceptualized driver decision model.(43)

66 APPENDIX B: SYMPOSIUM FINDINGS
They developed a mathematical method to determine, for a given geometrical description of a highway alignment, at what locations and times that alignment might be susceptible to sunglare problems. The calculations include astronomical algorithms to determine the vector direction of the sun from a given location on the highway at any time during the year, as well as the optical refinements necessary to account for atmospheric refraction. Essentially, the output of the model is a list of locations and times expected to suffer from sunglare effects. They noted that the algorithm could serve as one of a number of road safety audits conducted in a safety review for a given alignment, or it could serve as an input to an automated highway design process to account for safety deficiencies of candidate alignments.
Figure 61. Relationship between efficiency and information to process.(42)
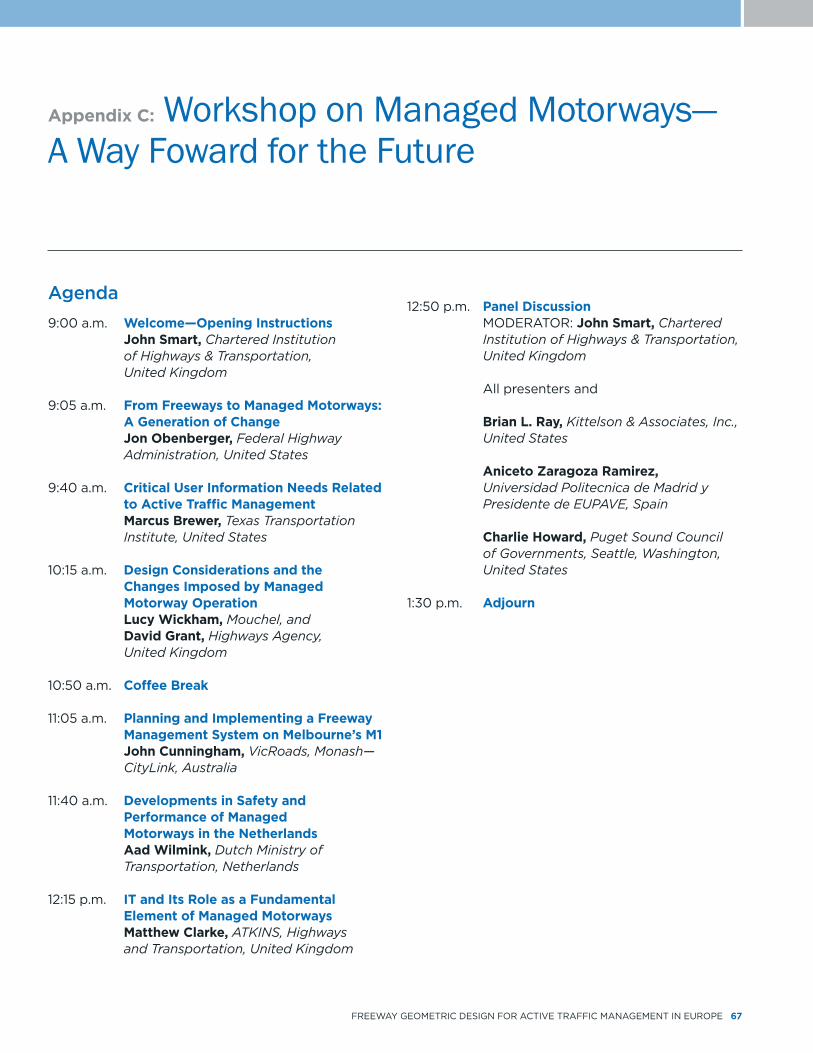
FREEWAY GEOMETRIC DESIGN FOR ACTIvE TRAFFIC MANAGEMENT IN EUROPE 67
Appendix C: Workshop on Managed Motorways— A Way Foward for the Future
Agenda 9:00 a.m. Welcome—Opening Instructions John Smart, Chartered Institution of Highways & Transportation, United Kingdom
9:05 a.m. From Freeways to Managed Motorways: A Generation of Change Jon Obenberger, Federal Highway Administration, United States
9:40 a.m. Critical User Information Needs Related to Active Traffic Management Marcus Brewer, Texas Transportation Institute, United States
10:15 a.m. Design Considerations and the Changes Imposed by Managed Motorway Operation Lucy Wickham, Mouchel, and David Grant, Highways Agency, United Kingdom
10:50 a.m. Coffee Break
11:05 a.m. Planning and Implementing a Freeway Management System on Melbourne’s M1 John Cunningham, VicRoads, Monash— CityLink, Australia
11:40 a.m. Developments in Safety and Performance of Managed Motorways in the Netherlands Aad Wilmink, Dutch Ministry of Transportation, Netherlands
12:15 p.m. IT and Its Role as a Fundamental Element of Managed Motorways Matthew Clarke, ATKINS, Highways and Transportation, United Kingdom
12:50 p.m. Panel Discussion MODERATOR: John Smart, Chartered Institution of Highways & Transportation, United Kingdom
All presenters and Brian L. Ray, Kittelson & Associates, Inc., United States
Aniceto Zaragoza Ramirez, Universidad Politecnica de Madrid y Presidente de EUPAVE, Spain
Charlie Howard, Puget Sound Council of Governments, Seattle, Washington, United States
1:30 p.m. Adjourn

Appendix D: Host Country Contacts
68 APPENDIX D: HOST COUNTRY CONTACTS
Spain
Alfredo García, Ph.D.Department of TransportationPolytechnic University of valenciaCamino de vera, s/n46071-valencia, SpainTelephone: 011+34 963 871 374Fax: 011+34 963 877 379E-mail: [email protected]
Ana YagoPolytech University of valenciaCamino De vera, s/n46071-valencia, SpainTelephone: 011+34 963 871 374Fax: 011+34 963 877 379E-mail: [email protected]
Jose A. HinojosaTelephone: 011+34 915 977 822E-mail: [email protected]
Vicente Ferrer PerezCivil EngineerMinisterio De Fomentovalencia, SpainTelephone: 011+34 963 079 525E-mail: [email protected]
Jose Yuste Maizal Civil EngineerMinistry of Public Worksvalencia, SpainTelephone: 011+34 963 079 538Fax: 011+34 963 079 511E-mail: [email protected]
Minguel Mondria GarciaIngeniero do Caminos y PuertosDirector de Produccion y Calidadvalencia, SpainTelephone: 011+34 963 379 220Fax: 011+34 963 371 429E-mail: [email protected]
GermanyUlfert JoopInternational Affairs OfficeFederal Ministry of Transport, Construction, and Urban DevelopmentRobert-Schuman-Platz 1 D-53175 Bonn, GermanyTelephone: 011+49 228 300 5401E-mail: [email protected]
Konstantin SauerReferat StB 12Federal Ministry of Transport, Construction, and Urban DevelopmentRobert-Schuman-Platz 1 D-53175 Bonn, GermanyTelephone: 011+49 228 300 5120 or 5121E-mail: [email protected]
Prof. Dr. Justin Geistefeldt Institute for Traffic Engineering and Management Ruhr-University Bochum Universitaetsstr. 150D-44801 Bochum, Germany Telephone: +49 234 32-25936 Fax: +49 234 32-14151 E-mail: [email protected]
Kerstin LemkeFederal Highway Research Institute (BASt)Bruderstrabe 53D-51427 Bergisch Gladbach, GermanyTelephone: 011+49 2204 43-510Fax: 011+49 2204 43-683E-mail: [email protected]
Reiner Dolger Referat fur verkehrsanalyse und ForschungRheinland-Pfalz Ministerium fur Wirstschaft, verkehr, Landwirtschaft und Weinbau Stiftsstrasse 9D-55116 Mainz, GermanyTelephone: 011+49 06 130 162 283Fax: 011+49 06 131 162 449E-mail: reiner.doelger.mwvlw.rlp.de
Klaus NollReferent fur Strassenplanungen Rheinland-PfalzMinisterium fur Wirtschaft, verkehrLandwirtschaft und WeinbauStiftsstrasse 955116 Mainz, GermanyTelephone: 011+49 06 131 162 209Fax: 011+49 06 131 164 044E-mail: [email protected]
FREEWAY GEOMETRIC DESIGN FOR ACTIvE TRAFFIC MANAGEMENT IN EUROPE 69
Helga RottenauReferat fur verkehrsanalyse und-forschungverkehrsinformationssysteme, verkehrstelematikRheinland-PfalzMinisterium fur Wirtschaftverkehr, Landwirtschaft Und WeinbauStiftsstrasse 955116 Mainz, GermanyTelephone: 011+49 06 131 162 171Fax: 011+49 06 131 162 449E-mail: [email protected]
NetherlandsRichard van der Elburg Senior Advisor Policy Analysis and ForecastsMinistry of Transport, Public Works, and Water Management Rijkswaterstaat Centre for Transport and NavigationSchoemakerstraat 97, PO Box 5044 2600 GA Delft, NetherlandsTelephone: 011+31 887 982 372Fax: 011+31 887 982 999E-mail: [email protected]
Bert HellermanSenior AdvisorRijkswaterstaatMinistry of Transport, Public Works, and Water ManagementRijkswaterstaat Center for Transport and NavigationSchoemaderstraat 97c2628 vk DelftPO Box 50442600 GA Delft, NetherlandsTelephone: 011+31 08 87 98 24 78Fax: 011+31 08 87 98 29 99E-mail: [email protected]
Alex van Loon Advisor, Policy Analysis and ForecastsMinistry of Transport, Public Works, and Water Management Rijkswaterstaat Centre for Transport and NavigationSchoemakerstraat 97, PO Box 5044 2600 GA Delft, NetherlandsTelephone: 011+31 08 87 98 22 90Fax: 011+31 08 87 98 29 99E-mail: [email protected]
Marthe van Dongen, Ph.D.Senior adviseur Trace m.e.r.-centrumAfdeling Inpassing NetwerkenRijkswaterstaatDienst verkeer en Scheepvaartvan der Burghweg 1Postbus 50442600 GA Delft, NetherlandsTelephone: 011+31 08 87 98 23 45Fax: 011+31 08 87 89 29 99E-mail: [email protected]
Gerald UittenbogerdDvS ConsultantE-mail: [email protected] Huib KwintAdvisorRijkswaterstaatMinistry of Transport, Public Works, and Water ManagementRijkswaterstaat Center for Transport and Navigationvan der Burghweg 12628 CS Delft, NetherlandsPO Box 50442600 GA Delft, NetherlandsTelephone: 011+31 08 87 98 22 89Fax: 011+31 08 87 98 29 99E-mail: [email protected]
Roel NijstenTeam Leader Transportation/ EIA centreSection Landscaping and EnvironmentRijkswaterstaatCentre for Transport and Navigationvan der Burghweg 1PO Box 50442600 GA Delft, NetherlandsTelephone: 011+31 08 87 98 23 57Fax: 011+31 08 87 98 29 99E-mail: [email protected]
United KingdomPaul Johnson Head of Research Strategy Network Services DirectorateHighways AgencyThe Cube, 199 Wharfside St. Birmingham B1 1RN, United KingdomTelephone: 011+44 121 678 8275E-mail: paul.johnson@highways. gsi.gov.uk
Clair Griffin Highways AgencyThe Cube, 199 Wharfside St. Birmingham B1 1RN, United KingdomTelephone: 011+44 121 678 8480Fax: 011+44 121 678 8108E-mail: [email protected]. gov.uk
David Grant Group ManagerHighways Agency, The Cube199 Wharfside St. Birmingham B1 1RN, United KingdomTelephone: 011+44 07 802 919 582E-mail: [email protected]. gov.uk

70 APPENDIX D: HOST COUNTRY CONTACTS
Martin Stott Operations ManagerHighways Agency West Midlands Regional Control CenterQuinton Business Park, 1 Ridgeway Birmingham B32 1AF, United KingdomTelephone: 011+44 121 421 8851Fax: 011+44 121 421 8849E-mail: martin.stott@highways. gsi.gov.uk
Mike WilsonRegional Director–East MidlandsTelephone: 011+44 121 678 8055E-mail: [email protected]. gov.uk
Nick HopcraftDivisional Director, Managed MotorwaysHighways AgencyC3 5 BroadwayBirmingham, B15 1 BL, United KingdomTelephone: 011+44 121 678 8342Fax: 011+44 121 678 8211E-mail: nick.hopcraft@highways. gsi.gov.uk
Max BrownSenior Traffic Technology Officer Network Services Directorate, Research and Operational Guidance DivisionHighways AgencyTemple Quay House2 Square Temple QuayBristol BS1 6HA, United KingdomTelephone: 011+44 117 372 8541Fax: 011+44 117 372 8810E-mail: [email protected]. gov.uk
Vicky BowdenAssistant Knowledge Strategy CoordinatorHighways Agency403 City Tower, Piccadilly PlazaManchester, M1 4BE, United KingdomTelephone: 011+44 161 930 5809Fax: 011+44 161 930 5256E-mail: vicky.bowden@highways. gsi.gov.uk
Ruth Tilstone Highways Agency 403 City Tower, Piccadilly Plaza Manchester, M1 4BE, United KingdomTelephone: 011+44 161 930 5809Fax: 011+161 930 5256E-mail: ruth.tilstone@highways. gsi.gov.uk
Paul Unwin Senior Project ManagerHighways Agency The Cube, 199 Wharfside St. Birmingham B1 1RN, United KingdomTelephone: 011+44 121 678 8180 E-mail: [email protected]. gov.uk
Brian Barton, Bsc. CEng.MICENetServ, Technical Services DivisionHighways Agency3C Federated House London Road, Dorking Surrey RH4 1SZ, United KingdomTelephone: 011+44 130 687 8292Fax: 011+44 130 687 8301E-mail: brian.barton@highways. gsi.gov.uk
Sarah GarlandManaged MotorwayDelivery Office (Operations and HOv Lanes)Telephone: 011+44 121 087 4161E-mail: sarah.garland@highways. gsi.gov.uk
Andrew Page-DoveProgram Manager–Managed Motorways (Operations)Telephone: 011+44 781 807 7913E-mail: andrew.page-dove@ highways.gsi.gov.uk
Lucy Wickham, CEng MICE MIHTTechnical Director–Transport Operations & TechnologyMouchelExport House, Cawsey Way WokingSurrey GU21 6QX, United KingdomTelephone: 011+44 148 373 1122E-mail: www.mouchel.com

FREEWAY GEOMETRIC DESIGN FOR ACTIvE TRAFFIC MANAGEMENT IN EUROPE 71
Appendix E: Amplifying Questions
Scan Purpose
Continued growth in travel along congested urban freeway corridors exceeds the ability of agencies to provide sufficient roadway capacity in major metro-politan areas based on limited public funding for roadway expansion and improvement projects. High construction costs, constrained right-of-way, and environmental factors are pushing agencies to explore solutions, such as active traffic management or managed lanes, to maximize throughput under congested conditions and improve safety to reduce collisions and nonrecurring congestion.
The purpose of this scan is to examine innovative geometric design practices and techniques used in other countries to improve the operational perfor-mance of congested freeway facilities without compromising safety. Finding cost-effective options to mitigate traffic congestion on urban freeway facilities is one of the most significant challenges State departments of transportation and regional transportation organizations face. Internationally, transport agencies are using geometric design treatments linked to operational strategies, such as reassigning the roadway cross section, to dynamically reduce congestion while maintaining or improving the safety performance of freeways in congested urban freeway corridors.
Amplifying Questions
A. Geometric Design PracticesThe questions in this section are targeted to geometric design practices used to optimize the performance of existing or future freeway capacity. Examples of geometric design practices include special-use lanes, such as high-occupancy vehicle (HOv) or exclusive truck lanes; value-priced or high-occupancy toll (HOT) lanes; and reserved areas for vehicle refuge, enforcement, or incident response
and recovery. Other examples of geometric design practices include temporary use of shoulders, lane restrictions, and access control. Also to be reviewed during the scanning study are signing, pavement marking, traffic control, lighting, speed, and other elements considered in the design.
In the United States, the prevailing document 1. used for highway geometrics is the American Association of State Highway and Transporta-tion Officials (AASHTO) A Policy on Geometric Design of Highways and Streets, also known as the Green Book.
What document is established that sets your a. national design criteria?
Do you recognize AASHTO and the guidance b. given in the Green Book and, if so, in what capacity?
What practices have been used in your 2. country to support active traffic management? Were they successful or unsuccessful? Why?
What cross sections and dimensions are used 3. for the different geometric design practices? Can you provide example schematics?
For example, what are the acceptable a. shoulder widths? Does it vary based on the length of the shoulder encroachment? In other words, can you get by with a narrower shoulder for a short distance (such as a bridge), but need wider shoulders for longer roadway segments? Are there any incre-ments of shoulder width that are avoided (such as avoiding a 6 foot (1.83 meter) inside shoulder because it is too narrow to safely accommodate a disabled motorist, but not narrow enough to discourage motorists to move to the outside shoulder for refuge)?
72 APPENDIX E: AMPLIFYING QUESTIONS
For example, when considering lane width b. reductions below standard values, what geometric factors and other elements are reviewed to make the decision, (e.g., tangent-versus-curvy alignment, percent trucks)?
Where constraints require the use of dimensions 4. for cross section elements that are less than desired, is there an order in which the elements are prioritized for reduction? For example, one might reduce a buffer width between mixed and managed lanes first, reduce left shoulder width second, reduce lane width third, etc.
What types of geometric modifications to 5. other-than-cross-section features of existing freeways have proven necessary where active traffic management is deployed? For example, how is ramp design affected (i.e., acceleration or deceleration lengths, location of junctions, where and how an HOv lane is accessed, changes needed because ramp is located along side of a dynamic shoulder)? Another example could be overhead or roadside sign support locations. Specific geometric details and/or specific roadway examples would be of interest.
Is it inherent with the use of alternative 6. geometric design practices—particularly dynamic shoulder use and managed lanes— that features such as lighting, signing, and delineation need to be enhanced beyond typical provision? If so, to what extent?
Is enforcement provided in a separate area for 7. monitoring and citation issuance?
What are practitioners’ thoughts and practices 8. on the use of less-than-desired dimensions, such as the use of narrower-than-standard lane widths? These practices are likely to be pro-posed as retrofits to existing corridors with space restrictions. The navigational and deci-sion demands associated with them would most likely compound demands related to substandard geometric elements.
Under what circumstances has or would 9. dynamic shoulder use be considered? Adding lane capacity to main lanes is the obvious application, but has or can the strategy be
used to optimize operations in other ways (e.g., a one-lane versus two-lane ramp exit for offpeak versus peak-hour demand conditions)?
Are weather issues such as rainwater runoff a. or spread and snowmelt considered before running traffic on shoulders?
Is traffic running on the shoulders allowed b. during daylight hours only? If it is allowed at night, are these sections lighted?
Has deployment of the alternative geometric 10. design practices caused designers and jurisdic-tions to reduce design speeds in these corridors?
For restriping retrofit applications, is cross slope 11. broken on lane lines or in between?
Have there been any studies or simulations to 12. evaluate driver reading comprehension of complex signing? Do you have examples of signing (both static and dynamic) used with active traffic management?
Please address the following on vehicle type:13.
What kind of vehicle-type restrictions, if any, a. have been instituted on corridors where these treatments have been employed?
Have any geometric design strategies (e.g., b. narrow lanes) been particularly problematic for trucks?
Are there any innovative design practices to c. accommodate operation of buses?
Are there any innovative design practices to 14. accommodate congestion pricing facilities?
B. Performance Measures
The following questions focus on performance measures (and/or metrics) to evaluate, monitor, and report on the performance of geometric design alternatives aimed at improving the performance and flexible use of freeway facilities (e.g., full-time capac-ity addition, part-time capacity addition). The scan team seeks information on existing and proposed methods, procedures, tools, public outreach, and techniques used to assess safety and operational implications or compare geometric design alterna-

FREEWAY GEOMETRIC DESIGN FOR ACTIvE TRAFFIC MANAGEMENT IN EUROPE 73
tives, active traffic management strategies, and innovative uses of the cross section of a freeway.
Before implementing new geometric design 1. practices, did your agency undertake any formal or informal evaluation of the potential risks in the design process? If so, please explain the evaluation process used.
Have any studies been performed to evaluate 2. the operational and safety changes experienced after implementing active traffic management and/or specific geometric design alternatives (e.g., cross section tradeoffs that support active traffic management)? If so, please describe.
For example, if you have tried strategies that a. involve using the shoulder as an additional travel lane during certain peak times, have you performed any safety studies to assess the effects of such strategies?
What relationships have you found between 3. geometric design practices and active traffic management or operational strategies?
Has your agency developed any specific 4. performance goals for evaluating active traffic management and/or specific geometric design practices?
What performance measures do you use to 5. evaluate the effects of geometric design alter-natives used in active traffic management on your roadways?
Do you use some form of level of service, a. such as number of congested hours, travel speed, or amount of delay?
Do these measures show clear improvements b. in safety, operations, and maintenance?
What types of alternatives appear to provide c. the best benefits?
Do you apply a lessons-learned approach to d. help refine existing alternatives and develop new ones?
How do you face the challenge of balancing your 6. project between designing for safety and designing for increased mobility?
Do the decisions you make have differing a. effects on safety and mobility?
How do you quantify the effects on safety b. and mobility?
What risk management tools and processes c. have been used to understand these tradeoffs in planning and design and make decisions?
Have you been successful in implementing 7. innovative technologies into your overall traffic operations program? Specifically, have you developed control devices other than the traditional items, such as signs, markings, and signals?
What role do traffic signal control, signage, 8. metering of roadways, and alternate route selection play in managing your overall capacity?
How do you relate traveler information or 9. mobility management to the placement of traffic restrictions or pricing in dealing with operational strategies?
How are speed limits determined? 10.
How are speed limits determined for sections a. with geometric designs that have been modified to accommodate active traffic management?
Are speed limits considered when selecting b. or developing geometric design alternatives?
Is compliance with speed limits good or c. poor?
Where local laws do not allow dynamic d. signing to dictate regulated speed posting, have advisory speed messages been effective in controlling or influencing travel speeds?
C. Planning
The following questions focus on the planning components used to integrate geometric design practices for active traffic management strategies. The scan team is interested in institutional issues experienced, such as political involvement; public acceptance or controversy; and organizational

74 APPENDIX E: AMPLIFYING QUESTIONS
impacts, such as the need for addressing competencies, processes, structures, or other resource and leadership matters.
What are the typical steps in initiating your 1. project development process?
Please describe the procedures used for defin-2. ing and developing projects from a conceptual through final design stage?
How are improvements to motorway lanes 3. planned? Who undertakes that planning? At what points in your plan development process do you begin to look at various forms of active management strategies? When do you consider the geometric design alternatives that need to be in place to use the active management strategies?
Have you made changes in your planning or 4. design process to better accommodate active traffic management?
Please describe how policy decisions are made 5. when using geometric design criteria to fit the overall context of a project.
How do you address public involvement in your 6. project development?
Specifically, how do you articulate the a. benefits of alternative geometric design techniques?
What role do both the public and media play b. in political perceptions?
Are particular issues raised by decisionmakers c. and, if so, how have they been addressed?
Have these corridorwide applications been 7. deployed as a limited-length interim approach to getting more life out of existing roads in advance of a larger fix, or are they used as long-term, permanent corridor reinventions— or both?
Is there an institutional process to ensure the 8. consideration or inclusion of active traffic management in developing long-range regional plans?
What techniques have been used to integrate 9. enforcement and traffic incident management needs into planning and design?
What specialized training programs have you 10. developed to accommodate your innovative projects or technologies?
Active traffic management requires a long-term 11. commitment to operations, as well as to maintenance, enforcement and patrolling, and traffic management. How has this commit-ment been planned and budgeted for?
D. Benefits and Lessons Learned
The following questions focus on the benefits of and lessons learned from different types of geometric design practices used to optimize the performance and flexible use of existing or future expanded freeway capacity.
What types of mitigation measures to minimize 1. safety risks were implemented in conjunction with geometric design practices implemented as part of active traffic management strategies?
What tools and methods of communicating the 2. benefits have been developed and how have they been implemented?
In planning or after the fact, have the owning 3. agencies explored the life-cycle costs of these alternatives (including management, mainte-nance, increased enforcement), and have they computed life-cycle benefit/cost ratios for comparison with more conventional freeway strategies?
Should agencies consider these types of inno-4. vative strategies for deployment only selectively on their cities’ freeway systems, or are they considered viable for application systemwide?
For the concept of self-explaining roads, what 5. level of study and research has been completed in your country to demonstrate which geomet-ric design elements and traffic control devices are most effective at conveying the proper message to drivers?
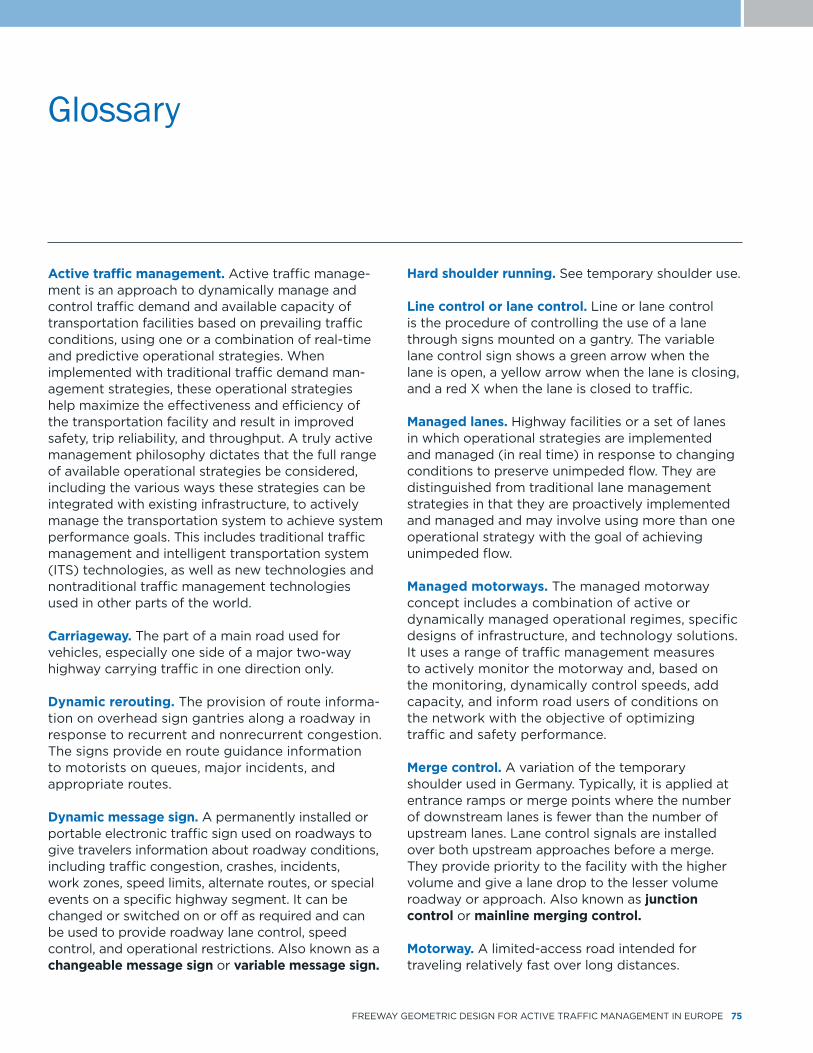
FREEWAY GEOMETRIC DESIGN FOR ACTIvE TRAFFIC MANAGEMENT IN EUROPE 75
Glossary
Active traffic management. Active traffic manage-ment is an approach to dynamically manage and control traffic demand and available capacity of transportation facilities based on prevailing traffic conditions, using one or a combination of real-time and predictive operational strategies. When implemented with traditional traffic demand man-agement strategies, these operational strategies help maximize the effectiveness and efficiency of the transportation facility and result in improved safety, trip reliability, and throughput. A truly active management philosophy dictates that the full range of available operational strategies be considered, including the various ways these strategies can be integrated with existing infrastructure, to actively manage the transportation system to achieve system performance goals. This includes traditional traffic management and intelligent transportation system (ITS) technologies, as well as new technologies and nontraditional traffic management technologies used in other parts of the world.
Carriageway. The part of a main road used for vehicles, especially one side of a major two-way highway carrying traffic in one direction only.
Dynamic rerouting. The provision of route informa-tion on overhead sign gantries along a roadway in response to recurrent and nonrecurrent congestion. The signs provide en route guidance information to motorists on queues, major incidents, and appropriate routes.
Dynamic message sign. A permanently installed or portable electronic traffic sign used on roadways to give travelers information about roadway conditions, including traffic congestion, crashes, incidents, work zones, speed limits, alternate routes, or special events on a specific highway segment. It can be changed or switched on or off as required and can be used to provide roadway lane control, speed control, and operational restrictions. Also known as a changeable message sign or variable message sign.
Hard shoulder running. See temporary shoulder use.
Line control or lane control. Line or lane control is the procedure of controlling the use of a lane through signs mounted on a gantry. The variable lane control sign shows a green arrow when the lane is open, a yellow arrow when the lane is closing, and a red X when the lane is closed to traffic.
Managed lanes. Highway facilities or a set of lanes in which operational strategies are implemented and managed (in real time) in response to changing conditions to preserve unimpeded flow. They are distinguished from traditional lane management strategies in that they are proactively implemented and managed and may involve using more than one operational strategy with the goal of achieving unimpeded flow.
Managed motorways. The managed motorway concept includes a combination of active or dynamically managed operational regimes, specific designs of infrastructure, and technology solutions. It uses a range of traffic management measures to actively monitor the motorway and, based on the monitoring, dynamically control speeds, add capacity, and inform road users of conditions on the network with the objective of optimizing traffic and safety performance.
Merge control. A variation of the temporary shoulder used in Germany. Typically, it is applied at entrance ramps or merge points where the number of downstream lanes is fewer than the number of upstream lanes. Lane control signals are installed over both upstream approaches before a merge. They provide priority to the facility with the higher volume and give a lane drop to the lesser volume roadway or approach. Also known as junction control or mainline merging control.
Motorway. A limited-access road intended for traveling relatively fast over long distances.

76 GLOSSARY
A term commonly used in Europe, a motorway in the United States is known as a freeway.
Plus lane. The practice of opening up the shoulder next to the inside lane of traffic for temporary use to address capacity bottlenecks on the freeway network during times of congestion and reduced travel speeds. Travel on the shoulder is permitted only when speed harmonization is active and speed limits are reduced. Signs indicate when travel on the shoulder is permitted.
Queue warning. The display of warning signs and flashing lights along a roadway to alert that congestion and queues are ahead.
Ramp metering. Procedures used to reduce congestion by managing vehicle flow from local-access on-ramps. The entrance ramp is equipped with a traffic signal that allows vehicles to enter the freeway at predetermined intervals.
Smarter highways. Term used by the Washington State Department of Transportation to describe implementation of active traffic management to increase roadway efficiency and help drivers travel in a safer and smarter manner. Smarter highways include overhead signs that display variable speed limits, lane status, and real-time traffic information.
Speed harmonization. The practice of using an expert system to monitor data coming from field-deployed sensors on a roadway and automatically adjust speed limits when congestion thresholds are exceeded and congestion and queue formation are impending. Sign gantries that span the facility provide speed limits and additional information, depending on roadway conditions.
Symbology. The use of graphic symbols to represent information pertinent to roadway users. The European practice of using symbology follows the vienna Convention.
Temporary shoulder use. The practice of opening up the shoulder next to the outside lane of traffic for temporary use to address capacity bottlenecks on the freeway network during times of congestion and reduced travel speeds. Travel on the shoulder is permitted only when speed harmonization is active and speed limits are reduced. Signs indicate when travel on the shoulder is permitted. Also known as hard shoulder running or a rush-hour lane.
Truck restrictions. Any restrictions along a roadway on the operation of trucks or heavy goods vehicles. Examples include restricting trucks to specific lanes, prohibiting them from using particular lanes, limiting their operating speed, or prohibiting their use of the entire facility during specific periods of the day.
Variable speed limits. Speed limits that change based on road, traffic, or weather conditions. Also known as dynamic speed limits.

FREEWAY GEOMETRIC DESIGN FOR ACTIvE TRAFFIC MANAGEMENT IN EUROPE 77
Endnotes
1. “International Programs” (2008). Federal Highway Administration Web site. Available at http://international.fhwa.dot.gov/tmpl.cfm?title=scanning.
2. “International Technology Scanning Programs” (2010). Federal Highway Administration Web site. Available at http://international.fhwa.dot.gov/scan/.
3. Clark, E. I. M. “IT and Its Role as a Fundamental Element of Managed Motorways” (2010). Transportation Research Board 4th International Symposium on Highway Geometric Design, Managed Motorway Workshop. valencia, Spain.
4. Hinojosa, J. A., v. F. Perez, and J. Y. Maical. “Gestion De Autopistas.” Presentation to Free-way Geometric Design Scan Team, June 4, 2010.
5. Google Earth. Map Data. (2010).
6. Lemke, K. “Hard Shoulder Running as a Short-Term Measure to Reduce Congestion” (2010). Transportation Research Board 4th International Symposium on Highway Geometric Design. valencia, Spain.
7. Lemke, K. “Hard Shoulder Running as a Short-Term Measure to Reduce Congestion” (2010). Transportation Research Board 4th International Symposium on Highway Geometric Design. valencia, Spain.
8. Geistefeldt, J. “Traffic Management and ITS in Hessen.” Hessian Road and Traffic Authority. Presentation to Freeway Geometric Design Scan Team, June 2010. Frankfurt, Germany.
9. Hessian State Office for Road and Traffic Affairs. “Congestion-Free Hessen 2015: A Success Story” (2009). Available at www.staufreieshessen2015.de/irj/servlet/prt/portal/prtroot/slimp. CMReader/ HMWvL_15/Staufrei_Internet/med/9da/9da0999c-199c-021f-3efe-f91921321b2c,22222222-2222-2222- 2222-222222222222.
10. German “Duration of Congestion on Motorways in Hessen” pamphlet (undated). Project Management, Congestion-Free Hessen 2015.
11. Hessisches Landesamt fur StraBen- und verkehrswesen “Temporary use of hard shoulders” (2010). Staufreies Hessen 2015. Available at www.staufreieshessen2015.de/irj/Staufrei_Internet?rid=HMWvL_15/Staufrei_ Internet/nav/09f/09f20b18-af71-ff11-f3ef-ef91921321b2,f4c7b18a-f71f-f11f-3efe-f91921321b2c,,,11111111-2222-3333-4444-100000005003 percent26overview=true.htm&uid= 09f20b18-af71-ff11-f3ef-ef91921321b2.
12. Dolger, R. “FGD Scanning Tour, Welcome to Rheinland-Pfalz!” Referat fur verkehrsanalyse und Forschung, Rheinland-Pfalz Ministerium fur Wirstschaft. Presentation to Freeway Geometric Design Scan Team, June 2010. Mainz, Germany.
13. Federal Ministry of Transport. Unfallgeschehen im Bereich von Streckenbeeinflussungsanlagen unter besonderer Berücksichtigung der verkehrsbelastung. (2000).
14. RAA. Richtlinien fuer die Anlage von Autobahnen. (2008).

78 ENDNOTES
15. Hellernan, B. “Managed Motorways in the Netherlands.” Centre for Transport and Navigation. Presentation to Freeway Geometric Design Scan Team, June 8, 2010.
16. Rijkswaterstaat. “Dynamic Speed Limits” pamphlet. (undated).
17. Strookbreedtes voor gestrekte wegvakken (hoofdrijbanen en parallelrijbanen). (2007).
18. Johnson, P. “Welcome and Introduction.” Presentation to Freeway Geometric Design Scan Team, June 10, 2010.
19. Brown, M. “Managed Motorways: Design Standards and Technology.” Presentation to Freeway Geometric Design Scan Team, June 10, 2010.
20. Advanced Motorway Signaling and Traffic Management Feasibility Study: A Report to the Secretary of State for Transport. (March 2008). Available at www.dft.gov.uk/pgr/roads/network/policy/mtorsigntrafmanagement/ advancedmotorwaysignal.pdf.
21. Hopcraft, N. “Managed Motorways Overview and Introduction.” Presentation to Freeway Geometric Design Scan Team, June 10, 2010.
22. Barton, B. “Procedures, Tools, Public Outreach Tools to Assess Safety or Compare Design Alternatives.” Presentation to Freeway Geometric Design Scan Team, June 10, 2010.
23. Wickham, L. “Questions and Answers Session.” Discussion with Freeway Geometric Design Scan Team, June 10, 2010.
24. Unwin, P. “Managed Motorways.” Presentation to Freeway Geometric Design Scan Team, June 11, 2010.
25. Stott, M. “Traffic Officers.” Presentation to Free-way Geometric Design Scan Team, June 11, 2010.
26. Cunningham, J. “Planning and Implementing a Freeway Management System on Melbourne’s M1.” Presentation to Freeway Geometric Design Scan Team During Workshop on Managed Motorways—A Way Forward for the Future, June 2, 2010. valencia, Spain.
27. Arndt, O. K., R. L. Cox, S. C. Lennie, and M. T. Whitehead. “Provision of Sight Distance Around Concrete Barriers and Structures on Freeways and Interchanges” (2010). Transportation Research Board 4th International Symposium on Highway Geometric Design. valencia, Spain.
28. Kjemtrup, K. “Country Report—Denmark” (2010). Transportation Research Board 4th International Symposium on Highway Geometric Design. valencia, Spain.
29. Greibe, P. “Chevron Markings on Freeways: Effect on Speed, Gap, and Safety” (2010). Transportation Research Board 4th Interna-tional Symposium on Highway Geometric Design. valencia, Spain.
30. Schermers, G., F. Wegman, P. van vliet, R. van der Horst, and J. Boender. “Country Report— the Netherlands” (2010). Transportation Research Board 4th International Symposium on Highway Geometric Design. valencia, Spain.
31. Department for Transport. Annex to the Department for Transport Advanced Motorway Signaling and Traffic Management Feasibility Study Report. (undated). Accessed at Department for Transport Web site: www.dft.gov.uk/pgr/.
32. Whitelaw, J. “Managed Motorways: Refining the Art” (September 24, 2009). The New Civil Engineer. Accessed at New Civil Engineer Web site: www.nce.co.uk.
33. Mirshahi, M., J. Obenberer, C. Fuhs, C. E. Howard, R. A. Krammes, B. T. Kuhn, R. M. Mayhew, M. A. Moore, K. Sahebjam, C. J. Stone, and J. L. Yung. Active Traffic Management: The Next Step in Congestion Management (2007). FHWA-PL-07-012, Federal Highway Administration, U.S. Department of Transportation, Washington, DC.
34. Bergh, T., and M. Petersson. “Country Report—Sweden” (2010). Transportation Research Board 4th International Symposium on Highway Geometric Design. valencia, Spain.
35. Smart, J. “Country Report—United Kingdom” (2010). Transportation Research Board 4th International Symposium on Highway Geometric Design. valencia, Spain.

FREEWAY GEOMETRIC DESIGN FOR ACTIvE TRAFFIC MANAGEMENT IN EUROPE 79
36. Transport News. “Drivers to use M6 hard shoulder to ease congestion” (Sept. 10, 2008). Birmingham Post. Accessed at www.birminghampost.net.
37. “Public Exhibitions Announced for M1 J10 to J13 Improvement Scheme” (March 19, 2009). COI News Distribution Service Release. Accessed at www.highways.gov.uk/ news/pressrelease.aspx?pressreleaseid=171923.
38. MacDonald, M. “ATM Monitoring and Evaluation, 4-Lane variable Mandatory Speed Limits, 12-Month Report (Primary and Secondary Indicator)” (June 30, 2008). Highways Agency. Accessed at www.dft.gov.uk/pgr/roads/tpm/m42activetrafficmanagement/ atm12mthsumrep.pdf.
39. “What Happens If I Break Down.” Highways Agency Web site: www.highways.gov.uk/ roads/projects/4690.aspx.
40. “Lorries banned from overtaking to cut congestion on three miles of the northbound M42 in Warwiskchire” (undated). Highways Agency Web site: www.highways.gov.uk/news/press_releases /general/2005_10_03d.htm.
41. White, C., and M. MacDonald. “Motorway Bus Lanes—A False Dawn or the Start of A Revolution” (1999). UK 249, poster session of the European Transport Conference.
42. Brewer, M. “Critical User Information Needs Related to Active Traffic Management.” Presentation to Freeway Geometric Design Scan Team, June 1, 2010.
43. Kuhn, B., G. D. Goodin, A. Ballard, M. Brewer, R. Brydia, J. Carson, S. Chrysler, T. Collier, W. Eisele, D. Fenno, K. Fitzpatrick, B. Ullman, G. Ullman, and S. venglar. Findings from Texas: Five Years of Research on Managed Lanes. (2005). FHWA/TX-06/0-4160-25.
44. Jurado-Pina, R., J. M. Pardillo-Mayora, and J. Puy-Huarte. “Software Tool for the Analysis of Highway Alignments to Detect and Prevent Sun Glare vision Impairment Hazards” (2010). Transportation Research Board 4th International Symposium on Highway Geometric Design. valencia, Spain.
45. Churchill, A. M., and D. J. Lovell. “A Procedure for Auditing Highway Alignments for the Effects of Sun Glare” (2010). Transportation Research Board 4th International Symposium on Highway Geometric Design. valencia, Spain.


OFFICE OF INTERNATIONAL PROGRAMS
FHWA/US DOT (HPIP)
1200 New Jersey Avenue, SE
Washington, DC 20590
Tel: (202) 366-9636
Fax: (202) 366-9626
www.international.fhwa.dot.gov
Publication No. FHWA-PL-11-004
HPIP/3-11(3.5)EW