Embed Size (px)
Citation preview
Balancing Functionality and LivabilityTraffic Engineering l Transportation Planning
Traffic Impact Study for the Altura Apartments
Prepared for the
City of Petaluma
July 2, 2015
Submitted byWhitlock & Weinberger Transportation, Inc.
490 Mendocino AvenueSuite 201Santa Rosa, CA 95401
voice 707.542.9500
475 14th StreetSuite 290Oakland, CA 94612
voice 510.444.2600
web www.w-trans.com


Traffic Impact Study for the Altura Apartments in the City of Petaluma July 2, 2015 Page i
Table of Contents
Page
Executive Summary .......................................................................................................................................... 1
Introduction ....................................................................................................................................................... 2
Transportation Setting ..................................................................................................................................... 4
Capacity Analysis .............................................................................................................................................. 9
Alternative Modes ..........................................................................................................................................26
Access and Circulation ..................................................................................................................................27
Conclusions and Recommendations ..........................................................................................................28
Study Participants and References ..............................................................................................................29
Figures
1 Study Area and Lane Configurations.............................................................................................................. 3 2 Existing Traffic Volumes .................................................................................................................................. 12 3 Baseline Traffic Volumes ................................................................................................................................. 15 4 Future Traffic Volumes .................................................................................................................................... 18 5 Site Plan ............................................................................................................................................................... 20 6 Project Traffic Volumes ................................................................................................................................... 22
Tables
1 Collision Rates at the Study Intersections .................................................................................................... 6 2 Bicycle Facility Summary ................................................................................................................................... 8 3 Intersection Level of Service Criteria .......................................................................................................... 10 4 Existing Peak Hour Intersection Levels of Service ................................................................................... 13 5 Existing Highway Segment Peak Period Volumes ..................................................................................... 13 6 Baseline Peak Hour Intersection Levels of Service................................................................................... 16 7 Future Peak Hour Intersection Levels of Service ..................................................................................... 17 8 Trip Generation Summary .............................................................................................................................. 19 9 Trip Distribution Assumptions ...................................................................................................................... 21 10 Existing and Existing plus Project Peak Hour Levels of Service ............................................................ 21 11 Existing and Existing plus Project Highway Segment Peak Period Volumes ....................................... 23 12 Baseline and Baseline plus Project Peak Hour Levels of Service ........................................................... 24 13 Future and Future plus Project Peak Hour Levels of Service ................................................................ 25
Appendices
A Collision Rate Calculations B Intersection Level of Service Calculations

Traffic Impact Study for the Altura Apartments in the City of Petaluma July 2, 2015 Page 1
Executive Summary
The proposed Altura Apartments project would result in construction of 150 apartment units on an existing vacant lot. The project’s anticipated trip generation includes 988 daily trips on average during a weekday, with 77 trips during the a.m. peak hour and 93 during the p.m. peak hour.
The study area was established by the City and includes intersections along Baywood Drive and Lakeville Street-Lakeville Highway. Analysis indicates that the eleven study intersections are operating acceptably under Existing conditions both with and without project. Under the Baseline and Baseline plus Project scenarios, which include trips from projects that have already been approved and are likely to be occupied within the next few years, the study intersections are projected to continue operating acceptably, except Lakeville Street/East Washington Street and Lakeville Highway/McDowell Boulevard South, which are expected to operate at LOS E during the p.m. peak hour and a.m. peak hour, respectively. With the project, the deficiently operating intersections continue to operate at LOS E, which has been defined as being less than significant under the standards applied.
Three of the study intersections are expected to operate unacceptably under projected Future volumes. The City’s General Plan indicates that Lakeville Street/East D Street and Lakeville Street/Caulfield Lane are expected to operate unacceptably and this has been deemed significant and unavoidable in the City’s General Plan, and no improvements such as roadway widening are suggested. With the project, Lakeville Street/Caulfield Lane is expected to continue operating unacceptably at LOS E which is a less-than-significant impact under the applied standards.
The East Washington Street approaches to Lakeville Street were recently modified to have protected-only left-turn phasing to address safety concerns. While this operation is safer, it is also less efficient, and results in deficient operation under projected Future volumes. With the addition of one through lane in both the eastbound and westbound directions this intersection would be expected to operate acceptably at LOS D. However, the addition of capacity is contrary to policy in the General Plan.
Because the project does not cause East Washington Street/Lakeville Street and Caulfield Lane/Lakeville Street to deteriorate to LOS F, the impact of the project on the future unacceptable operating conditions is less-than-significant. Similarly, the project is expected to have a less-than-significant impact on US 101 as it increases volumes by less than one percent and the project residents will pay sales tax in the area, helping to fund planned future improvements as needed.
Vehicles will access the project via a full access driveway on Baywood Drive north of its intersection with Perry Lane. A center turn lane on Baywood Drive is available for left turns into and out of the site. Additionally, a driveway on Perry Lane west of Baywood Drive would also provide access for vehicles. Sight distance at the project driveway locations for both entering and exiting drivers is adequate.
Upon the construction of sidewalks along the site’s Perry Lane frontage and contribution toward enhancement of bus stops at Lakeville Highway/Baywood Drive, facilities for alternative modes will be adequate.
Traffic Impact Study for the Altura Apartments in the City of Petaluma July 2, 2015 Page 2
Introduction
Introduction
This report presents an analysis of the potential traffic impacts that would be associated with development of a proposed apartment complex to be located on the northwest corner of Baywood Drive and Perry Lane in the City of Petaluma. The traffic study was completed in accordance with the criteria established by the City of Petaluma, and is consistent with standard traffic engineering techniques.
Prelude
The purpose of a traffic impact study is to provide City of Petaluma staff and policy makers with data that they can use to make an informed decision regarding the potential traffic impacts of a proposed project, and any associated improvements that would be required in order to mitigate these impacts to a level of insignificance as defined by the City of Petaluma’s General Plan or other policies. Vehicular traffic impacts are typically evaluated by determining the number of new trips that the proposed use would be expected to generate, distributing these trips to the surrounding street system based on existing travel patterns or anticipated travel patterns specific to the proposed project, then analyzing the impact the new traffic would be expected to have on critical intersections or roadway segments. Impacts relative to access for pedestrians, bicyclists, and to transit are also addressed.
Project Profile
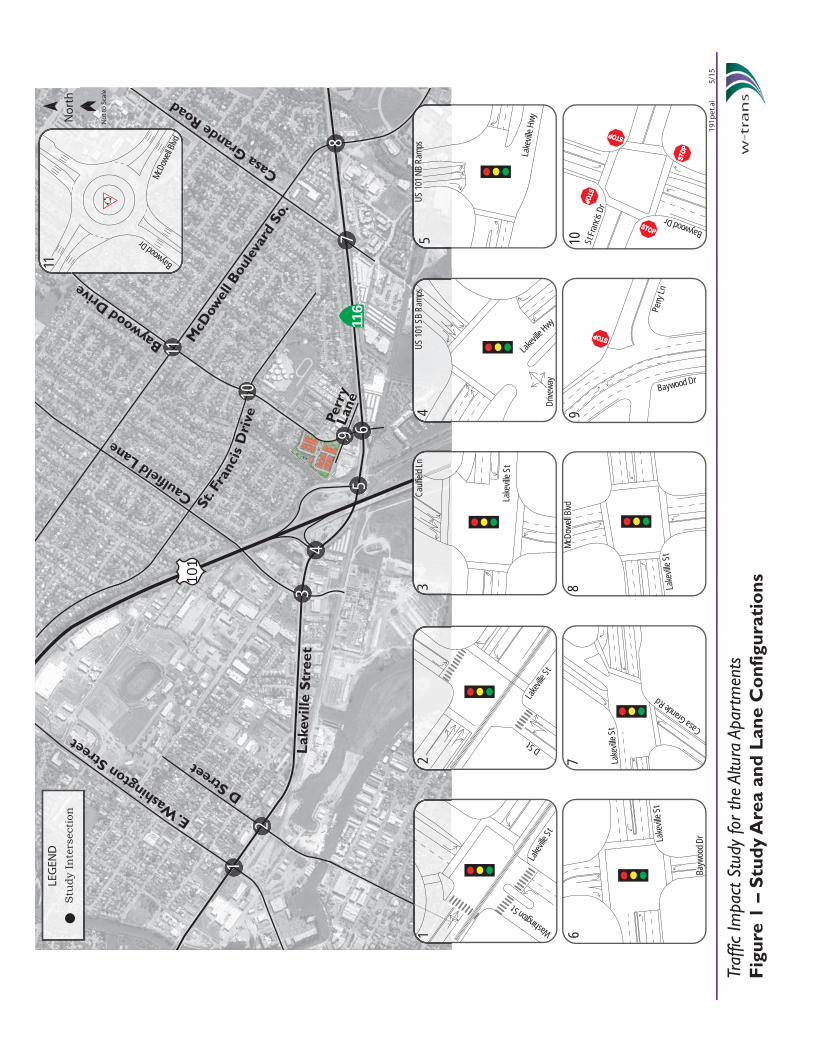
The project consists of an apartment complex that would consist of 150 dwelling units. The project site is currently vacant and is bounded by Baywood Drive to the east, Perry Lane to the south, single-family homes on Alderwood Court to the northeast, and open space to the northwest, as shown in Figure 1.
No
rth
No
t to
Sca
le
St. F
ranc
is D
rive
101
116
11
10
9 67
8
34
5
12
Lak
evill
e S
tree
t
E. Wash
ington Street
D Street
Caulfield Lane
Perr
yLa
ne
McD
owel
l Bou
leva
rd S
o.
Casa Grande Road
Baywood D
rive
Fig
ure
1 –
Stu
dy
Are
a an
d L
ane
Co
nfig
ura
tio
ns
191p
et.a
i 5/
15
Traf
fic Im
pact
Stu
dy fo
r th
e Al
tura
Apa
rtm
ents
LEG
END
Stu
dy I
nte
rsec
tion
5
Lake
ville H
wy
US 10
1 NB
Ramp
s2
Lakev
ille St
D St
11 Baywood
Dr
McDo
well B
lvd
9
Baywood Dr
Perry
Ln
10 St Fra
ncis
Dr
Baywood Dr
7 Lake
ville S
t Casa Grande Rd
6
Bayw
ood D
rLake
ville S
t
3
Lake
ville
St
Caulf
ield L
n1
Lakev
ille St
Washington St
8Mc
Dowe
ll Blvd
Lake
ville S
t
4
Lakevil
le Hwy
US 10
1 SB
Ramp
s
Drive
way

Traffic Impact Study for the Altura Apartments in the City of Petaluma July 2, 2015 Page 4
Transportation Setting
Operational Analysis
Study Area and Periods
The study area as selected with input from City staff consists of the following eleven intersections:
1. Lakeville Street/East Washington Street 2. Lakeville Street/D Street 3. Lakeville Street/Caulfield Lane 4. Lakeville Highway/US 101 South Ramps 5. Lakeville Highway/US 101 North Ramps 6. Lakeville Highway/Baywood Drive 7. Lakeville Highway/Casa Grande Road 8. Lakeville Highway/McDowell Boulevard South 9. Baywood Drive/Perry Lane 10. Baywood Drive/St. Francis Drive 11. Baywood Drive/McDowell Boulevard South
Operating conditions during the a.m. and p.m. peak periods were evaluated to capture the highest potential impacts for the proposed project as well as the highest volumes on the local transportation network. The morning peak hour occurs between 7:00 and 9:00 a.m. and reflects conditions during the home to work or school commute, while the p.m. peak hour occurs between 4:00 and 6:00 p.m. and typically reflects the highest level of congestion during the homeward bound commute.
Study Intersections
Because of the skewed nature of the street system in Petaluma, the streets are described using US 101 and East Washington Street as north-south streets within the study area, and Lakeville Highway (SR 116) as an east-west street.
Lakeville Street/East Washington Street is a signalized, four-legged intersection with split phasing on the Lakeville Street approaches (in other words, the two approaches operate separately) and protected left-turn phasing on the East Washington Street approaches (protected/permitted left-turn phasing is being replaced by protected only left-turn phasing). The SMART/Northwest Pacific Railroad tracks run parallel to and along the south side of Lakeville Street and pass through the southern East Washington Street leg of the intersection. Railroad signal infrastructure and crossing arms are located across the East Washington Street legs. Marked crosswalks and pedestrian signals are provided on all legs of the intersection.
Lakeville Street/D Street is a four-legged signalized intersection with protected left-turn phasing on the westbound Lakeville Street approach, permitted left-turn phasing on the eastbound Lakeville Street approach and split phasing of the D Street approaches as well as a right-turn overlap on the northbound D Street approach. The SMART/Northwest Pacific Railroad tracks run parallel to and along the south side of Lakeville Street and pass through the southern leg of the intersection. Railroad signal infrastructure and crossing arms are located across the intersection’s northern and southern D Street legs. Marked crosswalks and pedestrian signals are provided for all four legs of the intersection.
Lakeville Street/Caulfield Lane is a four-legged, signalized intersection. The Lakeville Street approaches have protected left-turn phasing and the Caulfield Lane approaches are split phased. Marked crosswalks and pedestrian phasing are provided across all but the eastern leg of the intersection.
Traffic Impact Study for the Altura Apartments in the City of Petaluma July 2, 2015 Page 5
Lakeville Highway (SR 116) /US 101 Southbound Ramps is a four-legged, signalized intersection with the north leg the US 101 Southbound on- and off-ramps and the south leg a parking lot driveway. Protected left-turn phasing is provided on the highway, while the ramp and driveway approaches are split-phased. Crosswalks are provided across the northern and western legs of the intersection.
Lakeville Highway (SR 116)/US 101 Northbound Ramps is a three-legged, signalized intersection with protected left-turn phasing on the highway. A marked crosswalk is provided across the western leg of the intersection.
Lakeville Highway (SR 116)/Baywood Drive is a signalized, four-legged intersection with protected left turns on all four approaches. Marked crosswalks and pedestrian phasing are provided across all but the western leg of the intersection.
Lakeville Highway (SR 116)/Casa Grande Road is a signalized, four-legged intersection with protected left-turn phasing on the Lakeville Highway approaches and permitted left turns on Casa Grande Road, which intersects the highway at a skewed angle. Marked crosswalks and pedestrian phasing are provided across the eastern and southern legs of the intersection.
Lakeville Highway (SR 116)/McDowell Boulevard South is a four-legged, signalized intersection with protected left-turn phasing on all approaches.
Baywood Drive/Perry Lane is a four-legged intersection with a public driveway forming the fourth leg. The eastbound and westbound approaches are stop-controlled while the northbound and southbound approaches are uncontrolled. No marked crosswalks are provided at this intersection.
Baywood Drive/St. Francis Drive is a four-legged all-way stop-controlled intersection with marked crosswalks across all legs.
Baywood Drive/McDowell Boulevard South is a four-legged roundabout intersection with marked crosswalks across all legs.
The locations of the study intersections and the existing lane configurations and controls are shown in Figure 1.
Collision History
The collision histories for the study intersections were reviewed to determine any trends or patterns that may indicate a safety issue. Collision rates were calculated based on records available from the California Highway Patrol as published in their Statewide Integrated Traffic Records System (SWITRS) reports. The most current five-year period available is July 1, 2007 through June 30, 2012.
As presented in Table 1, the calculated collision rates for the study intersections were compared to average collision rates for similar facilities statewide, as indicated in 2010 Collision Data on California State Highways, California Department of Transportation. Nine of the 11 intersections have rates that are higher than the statewide average.

Traffic Impact Study for the Altura Apartments in the City of Petaluma July 2, 2015 Page 6
Table 1 Collision Rates at the Study Intersections
Study Intersection Number of Collisions
(2007-2012)
Calculated Collision Rate
(c/mve)
Statewide Average
Collision Rate (c/mve)
1. Lakeville St/East Washington St 47 0.95 0.27
2. Lakeville St/D St 4 0.10 0.27
3. Lakeville St/Caulfield Ln 14 0.31 0.27
4. Lakeville Hwy/US 101 South Ramps 17 0.35 0.27
5. Lakeville Hwy/US 101 North Ramps 14 0.23 0.21
6. Lakeville Hwy/Baywood Dr 25 0.44 0.27
7. Lakeville Hwy/Casa Grande Rd 17 0.34 0.27
8. Lakeville Hwy/McDowell Blvd South 19 0.36 0.27
9. Baywood Dr/Perry Ln 3 0.36 0.15
10. Baywood Dr/St. Francis Dr 1 0.08 0.21
11. Baywood Dr/McDowell Blvd South 14 0.57 0.15
Note: c/mve = collisions per million vehicles entering; Bold text = higher collision rate than statewide average
While Lakeville Street/East Washington Street had an above-average calculated collision rate, the City is in the process of replacing the protected-permissive left-turn phasing at the intersection with protected only phasing. This change is expected to reduce collisions.
The collision rates for Lakeville Street/Caulfield Lane and Lakeville Highway/US 101 North Ramps were only slightly over the statewide average, so still within the range that would be considered typical.
The most common type of collision at both Lakeville Highway/US 101 South Ramps and Lakeville Highway/Baywood Drive was rear-end crashes due to speeding. Rear-ends were also the most prevalent collision type at Lakeville Highway/Casa Grande Road due to speeding and improper turning. Increased enforcement on Lakeville Highway may help to reduce unsafe speeding, or changes to improve coordination and reduce queuing could also help address the incidence of collisions.
Lakeville Highway/McDowell Boulevard South had “broadside” as the most common type of collision and sideswipe second most common, with a majority due to right-of-way violations and improper turning. With a long cycle length at this intersection, drivers familiar with the area may be more inclined to enter at the very end of the yellow clearance interval, or even after the light turns red, in order to avoid the long wait for the next green light. Increased enforcement may decrease collisions.
While the calculated collision rate at Baywood Drive/Perry Lane is higher than the Statewide average, the collisions occurred due to improper turning and speeding. A decrease in collisions may occur with increased enforcement.
The intersection of Baywood Drive/McDowell Boulevard South was converted from all-way stop control to a roundabout in 2008. Of the 14 reported collisions, half occurred between 2007 and 2008, while the roundabout either had not been built or construction had just finished. If only the time period since the
Traffic Impact Study for the Altura Apartments in the City of Petaluma July 2, 2015 Page 7
roundabout was completed and drivers had a chance to familiarize themselves with the new controls is evaluated, approximately one collision occurs per year, with the exception of 2010, when there was an unusual spike in collisions.
Alternative Modes
Pedestrian Facilities
Pedestrian facilities include sidewalks, crosswalks, pedestrian signal phases, curb ramps, curb extensions, and various streetscape amenities such as lighting, benches, etc. In general, a network of sidewalks, crosswalks, pedestrian signals, and curb ramps provide access for pedestrians in the vicinity of the proposed project site; however, sidewalk gaps, obstacles, and barriers can be found along some of the roadways connecting to the project site. Existing gaps and obstacles along the connecting roadways impact convenient and continuous access for pedestrians and present safety concerns in those locations where appropriate pedestrian infrastructure would address potential conflict points.
• Perry Lane – Intermittent sidewalk coverage is provided on Perry Lane east of Baywood Drive with significant gaps on both sides of the street. No sidewalks are provided along Perry Lane west of Baywood Drive.
• Baywood Drive – Continuous sidewalks are provided on the east side of Baywood Drive in the vicinity of the project site, between Lakeville Highway and South McDowell Boulevard. An existing gap in sidewalk connectivity exists north of Perry Lane, along the proposed project frontage. Lighting is provided by overhead street lights.
Bicycle Facilities
The Highway Design Manual, California Department of Transportation (Caltrans), 2012, classifies bikeways into three categories:
• Class I Multi-Use Path: a completely separated right-of-way for the exclusive use of bicycles and pedestrians with cross flows of motorized traffic minimized.
• Class II Bike Lane: a striped and signed lane for one-way bike travel on a street or highway.
• Class III Bike Route: signing only for shared use with motor vehicles within the same travel lane on a street or highway.
In the project area, Class II bike lanes exist on Baywood Drive between Lakeville Highway and South McDowell Boulevard. Bicyclists ride in the roadway and/or on sidewalks along all other streets within the project study area. Table 2 summarizes the existing and planned bicycle facilities in the project vicinity, as contained in the City of Petaluma Proposed and Existing Bicycle and Pedestrian Facilities map dated February 2014 and prepared by Sonoma County Transportation Authority (SCTA).

Traffic Impact Study for the Altura Apartments in the City of Petaluma July 2, 2015 Page 8
Table 2 Bicycle Facility Summary
Status Facility
Class Length (miles)
Begin Point End Point
Existing
Petaluma River Trail 1 3.11 Marina Ave Shollenberger Park
NWP Trail I 0.22 US 101 Ramps Baywood Dr
Baywood Dr II 0.57 Lakeville Hwy S McDowell Blvd
Planned
NWP Trail I 1.2 D Street Baywood Dr
NWP Trail I 0.9 Baywood Dr Adobe Creek
Lakeville Hwy II 5.00 D St City Limits
St. Francis Dr/Stuart Dr III 1.60 S McDowell Blvd Maria Dr
Source: City of Petaluma Proposed and Existing Bicycle and Pedestrian Facilities, SCTA, February 2014 Transit Facilities
Petaluma Transit provides fixed route bus service in the City of Petaluma. Petaluma Transit Route 24 provides loop service to destinations throughout the City with stops near the project site at Lakeville Highway/Marina Avenue and Baywood Drive/St. Francis Drive. Route 24 operates Monday through Friday with approximately one hour headways between 7:00 a.m. and 7:00 p.m.
Sonoma County Transit provides regional service between Petaluma and surrounding communities. Route 40, which travels between the City of Petaluma and City of Sonoma, has stops on Lakeville Highway at Baywood Drive and operates Monday through Friday during morning and evening peak hours with approximately 30 to 90 minute headways between 6:00 a.m. and 6:30 p.m.
Golden Gate Transit provides regional service between communities in the North Bay Area and San Francisco. Route 76 is a commuter bus route operating Monday through Friday that heads toward San Francisco during the morning peak period and toward Petaluma during the evening commute with approximately one-half-hour headways and has stops at Lakewood Highway Park and Ride.
Two bicycles can be carried on most Petaluma Transit, Sonoma County and Golden Gate Transit buses. Bike rack space is on a first come, first served basis. Additional bicycles are allowed on Petaluma Transit buses at the discretion of the driver.
Dial-a-ride, also known as paratransit, or door-to-door service, is available for those who are unable to independently use the transit system due to a physical or mental disability. Paratransit is designed to serve the needs of individuals with disabilities within Petaluma and the greater Petaluma area.
Traffic Impact Study for the Altura Apartments in the City of Petaluma July 2, 2015 Page 9
Capacity Analysis
Intersection Level of Service Methodologies
Level of Service (LOS) is used to rank traffic operation on various types of facilities based on traffic volumes and roadway capacity using a series of letter designations ranging from A to F. Generally, Level of Service A represents free flow conditions and Level of Service F represents forced flow or breakdown conditions. A unit of measure that indicates a level of delay generally accompanies the LOS designation.
The study intersections were analyzed using methodologies published in the Highway Capacity Manual (HCM), Transportation Research Board, 2000 for signalized and two-way stop-controlled intersections and methodologies published in the HCM 2010 for all-way stop-controlled and roundabout intersections. These sources contain methodologies for various types of intersection control, all of which are related to a measurement of delay in average number of seconds per vehicle.
The Levels of Service for Baywood Drive/Perry Lane, which has side-street stop controls, or is unsignalized and has two approaches stop controlled, were analyzed using the “Two-Way Stop-Controlled” intersection capacity method from the HCM 2000. This methodology determines a level of service for each minor turning movement by estimating the level of average delay in seconds per vehicle. Results are presented for individual movements together with the weighted overall average delay for the intersection.
The study intersection of Baywood Drive/St. Francis Drive, which has stop signs on all approaches, was analyzed using the “All-Way Stop-Controlled” Intersection methodology from the HCM 2010. This methodology evaluates delay for each approach based on turning movements, opposing and conflicting traffic volumes, and the number of lanes. Average vehicle delay is computed for the intersection as a whole, and is then related to a Level of Service.
The study intersections that are controlled by a traffic signal were evaluated using the signalized methodology from the HCM 2000. This methodology is based on factors including traffic volumes, green time for each movement, phasing, whether or not the signals are coordinated, truck traffic, and pedestrian activity. Average stopped delay per vehicle in seconds is used as the basis for evaluation in this LOS methodology. For purposes of this study, delays were calculated using actual signal timing for existing and baseline conditions and optimized signal timing for future conditions.
The intersection of Baywood Drive/McDowell Boulevard South is controlled by a modern roundabout and was evaluated using the FHWA Roundabout Method, also contained within the Unsignalized Methodology of the HCM 2010. This methodology determines intersection operation using the gap acceptance method using basic geometric and volume data to calculate entering and circulating flows. This information is then translated to an overall average vehicle delay, with LOS break points at the same delays as used in the signalized methodology. Because the HCM roundabout methodology is relatively unsophisticated, the much more advanced SIDRA roundabout analysis software was utilized in any cases where the basic HCM methodology predicts operation worse than LOS B.
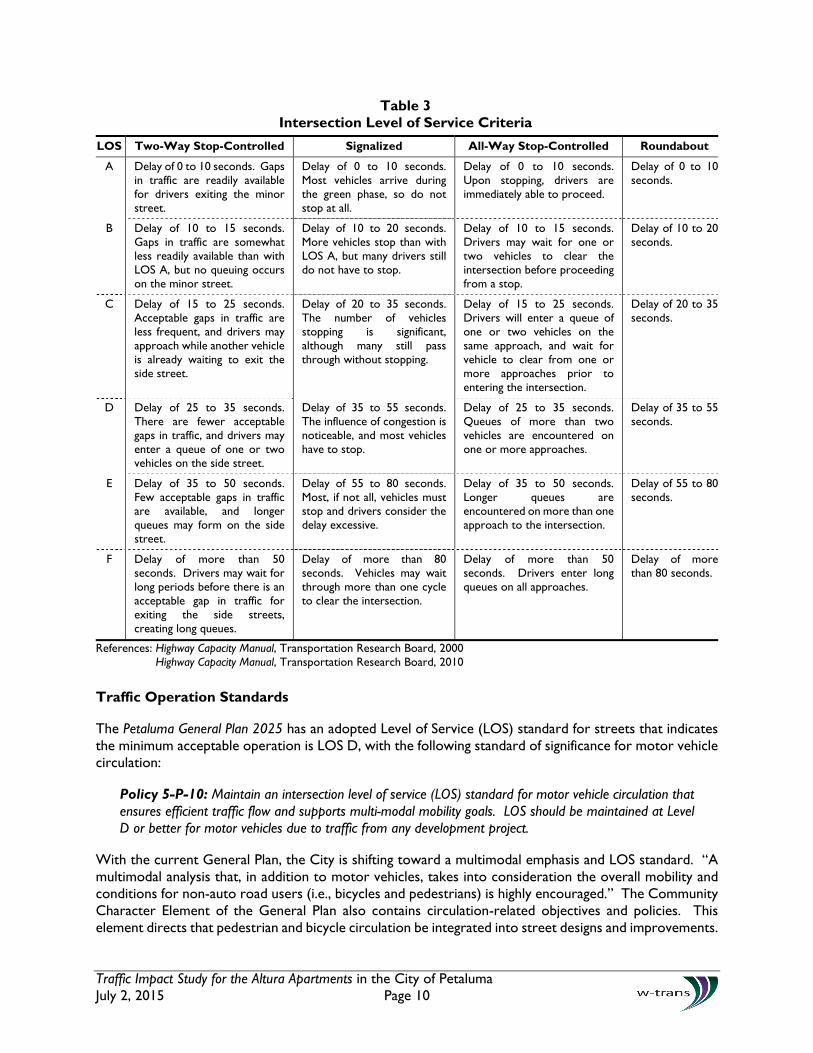
The ranges of delay associated with the various levels of service are indicated in Table 3.
Traffic Impact Study for the Altura Apartments in the City of Petaluma July 2, 2015 Page 10
Table 3 Intersection Level of Service Criteria
LOS Two-Way Stop-Controlled Signalized All-Way Stop-Controlled Roundabout
A Delay of 0 to 10 seconds. Gaps in traffic are readily available for drivers exiting the minor street.
Delay of 0 to 10 seconds. Most vehicles arrive during the green phase, so do not stop at all.
Delay of 0 to 10 seconds. Upon stopping, drivers are immediately able to proceed.
Delay of 0 to 10 seconds.
B Delay of 10 to 15 seconds. Gaps in traffic are somewhat less readily available than with LOS A, but no queuing occurs on the minor street.
Delay of 10 to 20 seconds. More vehicles stop than with LOS A, but many drivers still do not have to stop.
Delay of 10 to 15 seconds. Drivers may wait for one or two vehicles to clear the intersection before proceeding from a stop.
Delay of 10 to 20 seconds.
C Delay of 15 to 25 seconds. Acceptable gaps in traffic are less frequent, and drivers may approach while another vehicle is already waiting to exit the side street.
Delay of 20 to 35 seconds. The number of vehicles stopping is significant, although many still pass through without stopping.
Delay of 15 to 25 seconds. Drivers will enter a queue of one or two vehicles on the same approach, and wait for vehicle to clear from one or more approaches prior to entering the intersection.
Delay of 20 to 35 seconds.
D Delay of 25 to 35 seconds. There are fewer acceptable gaps in traffic, and drivers may enter a queue of one or two vehicles on the side street.
Delay of 35 to 55 seconds. The influence of congestion is noticeable, and most vehicles have to stop.
Delay of 25 to 35 seconds. Queues of more than two vehicles are encountered on one or more approaches.
Delay of 35 to 55 seconds.
E Delay of 35 to 50 seconds. Few acceptable gaps in traffic are available, and longer queues may form on the side street.
Delay of 55 to 80 seconds. Most, if not all, vehicles must stop and drivers consider the delay excessive.
Delay of 35 to 50 seconds. Longer queues are encountered on more than one approach to the intersection.
Delay of 55 to 80 seconds.
F Delay of more than 50 seconds. Drivers may wait for long periods before there is an acceptable gap in traffic for exiting the side streets, creating long queues.
Delay of more than 80 seconds. Vehicles may wait through more than one cycle to clear the intersection.
Delay of more than 50 seconds. Drivers enter long queues on all approaches.
Delay of more than 80 seconds.
References: Highway Capacity Manual, Transportation Research Board, 2000 Highway Capacity Manual, Transportation Research Board, 2010
Traffic Operation Standards
The Petaluma General Plan 2025 has an adopted Level of Service (LOS) standard for streets that indicates the minimum acceptable operation is LOS D, with the following standard of significance for motor vehicle circulation:
Policy 5-P-10: Maintain an intersection level of service (LOS) standard for motor vehicle circulation that ensures efficient traffic flow and supports multi-modal mobility goals. LOS should be maintained at Level D or better for motor vehicles due to traffic from any development project.
With the current General Plan, the City is shifting toward a multimodal emphasis and LOS standard. “A multimodal analysis that, in addition to motor vehicles, takes into consideration the overall mobility and conditions for non-auto road users (i.e., bicycles and pedestrians) is highly encouraged.” The Community Character Element of the General Plan also contains circulation-related objectives and policies. This element directs that pedestrian and bicycle circulation be integrated into street designs and improvements.
Traffic Impact Study for the Altura Apartments in the City of Petaluma July 2, 2015 Page 11
It also states that the amount of paving and the apparent width of streets should be reduced where possible.
The Petaluma General Plan 2025 Draft Environmental Impact Report, 2006, included cumulative analysis of major intersections in Petaluma. On pages 3.2-34 and 3.2-35 of the DEIR, it is acknowledged that buildout of the General Plan would result in unacceptable operations at the intersection of Lakeville Street/D Street. The DEIR found these impacts to be significant and unavoidable, citing that the addition of new lanes and/or expanded capacity would be in conflict with the Plan’s policies relating to improving multi-modal circulation.
Per the General Plan, the project would have a significant impact if it causes the average delay at an intersection already operating or expected to operate at LOS D or E to deteriorate to the next lower level of service.
The General Plan indicates that Baywood Drive, along with several other roadways, have excess capacity, both currently and in the future, and would benefit from a “road diet.” A road diet may provide social, aesthetic, multi-modal and/or safety benefits.
Caltrans
Although located within Petaluma city limits, Caltrans has jurisdiction over the study intersections of Lakeville Highway (SR 116) with US 101 South Ramps, US 101 North Ramps, Baywood Drive, Casa Grande Road and South McDowell Boulevard. Caltrans indicates that they endeavor to maintain operation at the transition from LOS C to LOS D. Where intersections are integral to a local jurisdictions transportation system, Caltrans often accepts the operational standard applied by the local agency, in this case, the City of Petaluma.
Existing Conditions
The Existing Conditions scenario provides an evaluation of current operation based on existing traffic volumes during the a.m. and p.m. peak periods. This condition does not include project-generated traffic volumes. Volume data was collected on March 27, 2014, August 26, 2014, and August 28, 2014 while local schools were in session.
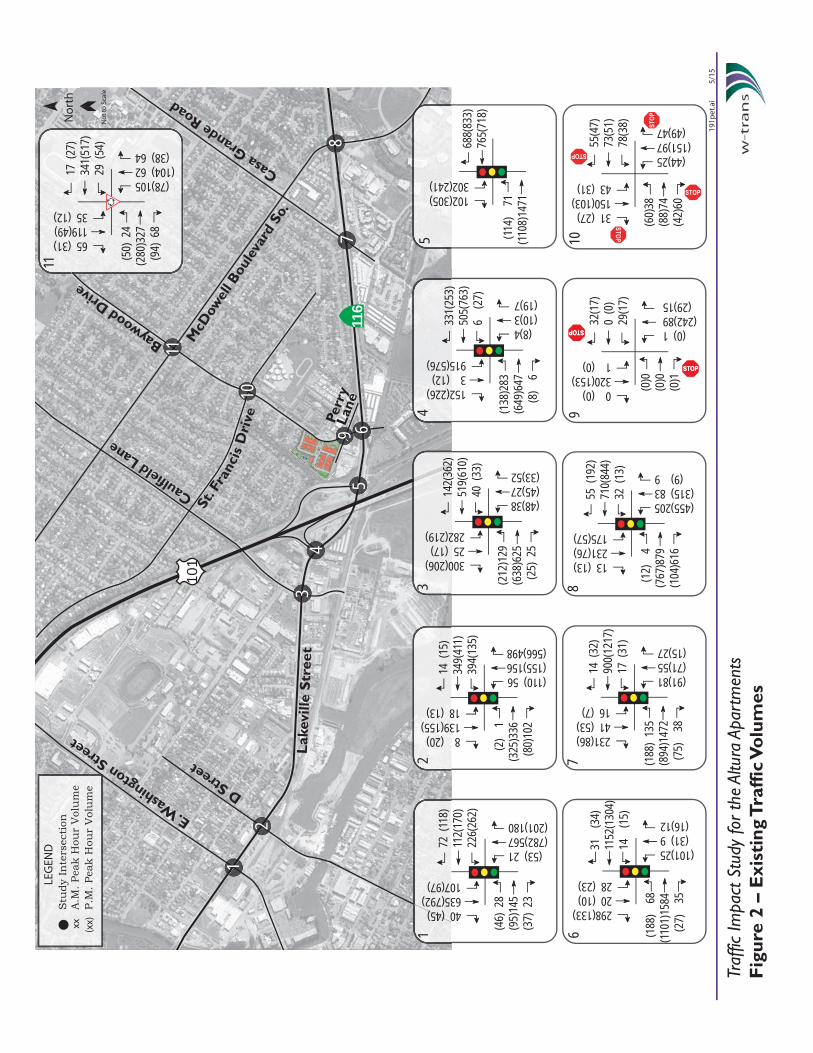
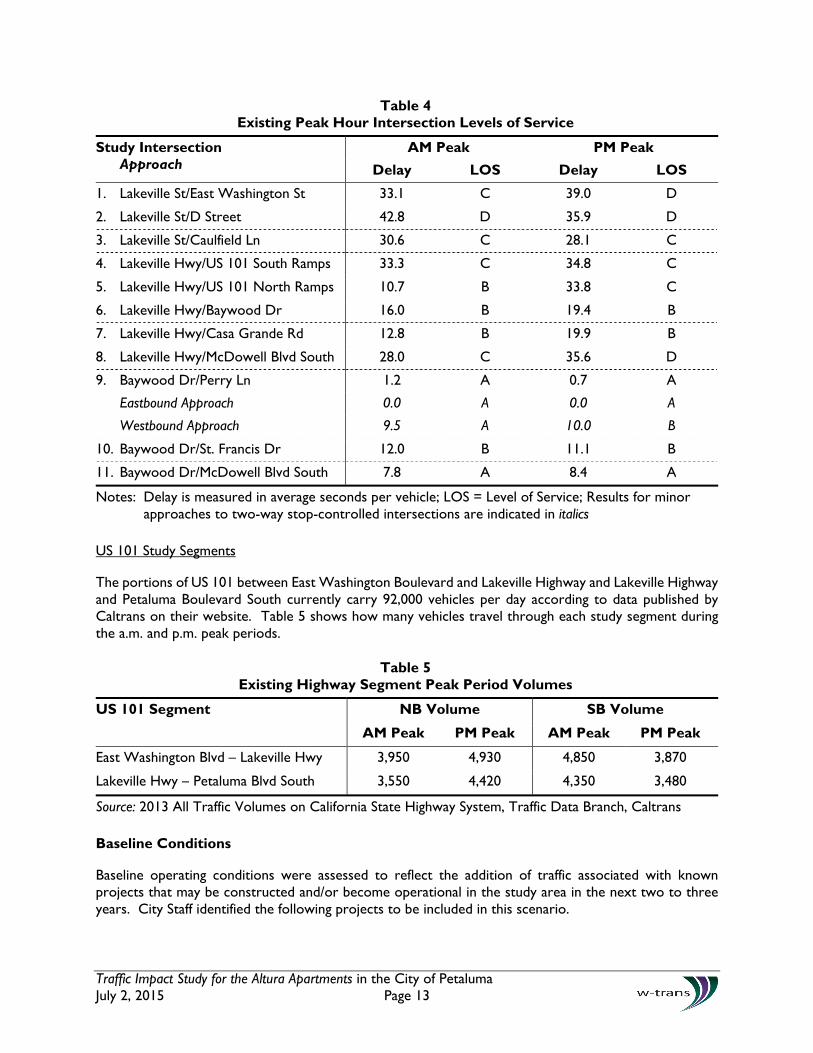
Intersection Levels of Service
Under existing conditions, all intersections are operating acceptably at LOS D or better. The existing traffic volumes are shown in Figure 2. A summary of the intersection level of service calculations is contained in Table 4, and copies of the Level of Service calculations are provided in Appendix A.
No
rth
No
t to
Sca
le
St. F
ranc
is D
rive
101
116
11
10
9 67
8
34
5
12
Lak
evill
e S
tree
t
E. Wash
ington Street
D Street
Caulfield Lane
Perr
yLa
ne
McD
owel
l Bou
leva
rd S
o.
Casa Grande Road
Baywood D
rive
LEG
END
xx
(xx)
A.M
. Pea
k H
our
Vol
um
eS
tudy
In
ters
ecti
on
P.M
. Pea
k H
our
Vol
um
e
Fig
ure
2 –
Exi
stin
g T
raff
ic V
olu
mes
191p
et.a
i 5/
15
Traf
fic Im
pact
Stu
dy fo
r th
e Al
tura
Apa
rtm
ents
1117
(27
)34
1(51
7)29
(54
)
(50
) 24
(280
)327
(94
) 68
(78)105(104) 62 (38) 64
65 (31)119(49)35 (12)
5
688(
833)
765(
718)
(11
4)
71(11
08)1
471102(305)
302(241)
4
331(
253)
505(
763)
6 (
27)
(138
)283
(649
)647
(8
) 6
(8)4(10)3(19)7
152(226)3 (12)915(576)
314
2(36
2)51
9(61
0)40
(33
)
(212
)129
(638
)625
(25
) 25
(48)38(45)27(33)52
300(206)25 (17)282(219)
214
(15
)34
9(41
1)39
4(13
5)
(2
) 1
(325
)336
(80
)102
(110) 56(155)156(566)498
8 (20)139(155)18 (13)
172
(11
8)11
2(17
0)22
6(26
2)
(46)
28
(95)
145
(37)
23
(53) 21(782)567(201)180
40 (45)635(792)107(97)
631
(3
4)11
52(1
304)
14
(15)
(18
8)
68(11
01)1
584
(2
7)
35
(101)25 (31) 9 (16)12
298(133)20 (10)28 (23)
714
(32
)90
0(12
17)
17 (
31)
(188
) 13
5(8
94)1
472
(75
) 3
8
(91)81(71)55(15)27
231(86)41 (53)16 (7)
855
(19
2)71
0(84
4)32
(13
)
(12
) 4
(767
)879
(104
)616
(455)205(315) 83 (9) 9
13 (13)231(76)175(57)
1055
(47)
73(5
1)78
(38)
(60)
38(8
8)74
(42)
60
(44)25(151)97 (49)47
31 (27)150(103)43 (31)
932
(17)
0 (0
)29
(17)
(0)0
(0)0
(0)1
(0) 1(242)89 (29)15
0 (0)320(153)1 (0)
Traffic Impact Study for the Altura Apartments in the City of Petaluma July 2, 2015 Page 13
Table 4 Existing Peak Hour Intersection Levels of Service
Study Intersection Approach
AM Peak PM Peak
Delay LOS Delay LOS
1. Lakeville St/East Washington St 33.1 C 39.0 D
2. Lakeville St/D Street 42.8 D 35.9 D
3. Lakeville St/Caulfield Ln 30.6 C 28.1 C
4. Lakeville Hwy/US 101 South Ramps 33.3 C 34.8 C
5. Lakeville Hwy/US 101 North Ramps 10.7 B 33.8 C
6. Lakeville Hwy/Baywood Dr 16.0 B 19.4 B
7. Lakeville Hwy/Casa Grande Rd 12.8 B 19.9 B
8. Lakeville Hwy/McDowell Blvd South 28.0 C 35.6 D
9. Baywood Dr/Perry Ln 1.2 A 0.7 A
Eastbound Approach 0.0 A 0.0 A
Westbound Approach 9.5 A 10.0 B
10. Baywood Dr/St. Francis Dr 12.0 B 11.1 B
11. Baywood Dr/McDowell Blvd South 7.8 A 8.4 A
Notes: Delay is measured in average seconds per vehicle; LOS = Level of Service; Results for minor approaches to two-way stop-controlled intersections are indicated in italics
US 101 Study Segments
The portions of US 101 between East Washington Boulevard and Lakeville Highway and Lakeville Highway and Petaluma Boulevard South currently carry 92,000 vehicles per day according to data published by Caltrans on their website. Table 5 shows how many vehicles travel through each study segment during the a.m. and p.m. peak periods.
Table 5 Existing Highway Segment Peak Period Volumes
US 101 Segment NB Volume SB Volume
AM Peak PM Peak AM Peak PM Peak
East Washington Blvd – Lakeville Hwy 3,950 4,930 4,850 3,870
Lakeville Hwy – Petaluma Blvd South 3,550 4,420 4,350 3,480
Source: 2013 All Traffic Volumes on California State Highway System, Traffic Data Branch, Caltrans Baseline Conditions
Baseline operating conditions were assessed to reflect the addition of traffic associated with known projects that may be constructed and/or become operational in the study area in the next two to three years. City Staff identified the following projects to be included in this scenario.
Traffic Impact Study for the Altura Apartments in the City of Petaluma July 2, 2015 Page 14
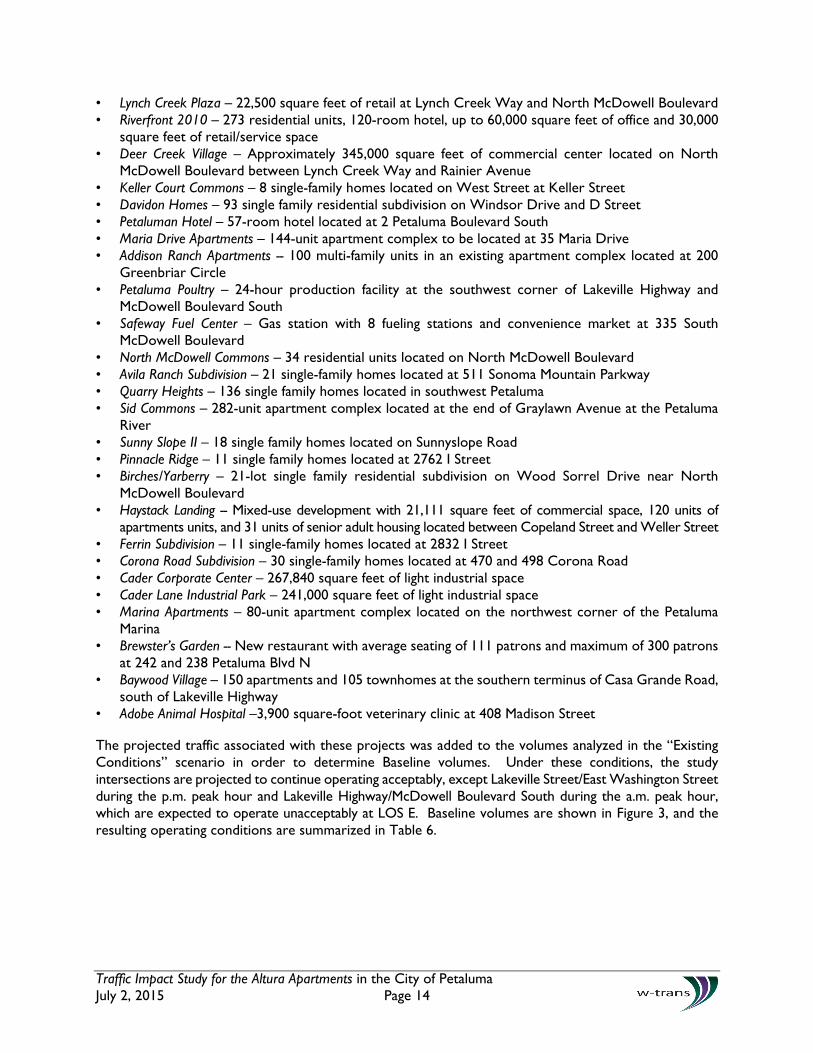
• Lynch Creek Plaza – 22,500 square feet of retail at Lynch Creek Way and North McDowell Boulevard • Riverfront 2010 – 273 residential units, 120-room hotel, up to 60,000 square feet of office and 30,000
square feet of retail/service space • Deer Creek Village – Approximately 345,000 square feet of commercial center located on North
McDowell Boulevard between Lynch Creek Way and Rainier Avenue • Keller Court Commons – 8 single-family homes located on West Street at Keller Street • Davidon Homes – 93 single family residential subdivision on Windsor Drive and D Street • Petaluman Hotel – 57-room hotel located at 2 Petaluma Boulevard South • Maria Drive Apartments – 144-unit apartment complex to be located at 35 Maria Drive • Addison Ranch Apartments -- 100 multi-family units in an existing apartment complex located at 200
Greenbriar Circle • Petaluma Poultry – 24-hour production facility at the southwest corner of Lakeville Highway and
McDowell Boulevard South • Safeway Fuel Center – Gas station with 8 fueling stations and convenience market at 335 South
McDowell Boulevard • North McDowell Commons – 34 residential units located on North McDowell Boulevard • Avila Ranch Subdivision – 21 single-family homes located at 511 Sonoma Mountain Parkway • Quarry Heights – 136 single family homes located in southwest Petaluma • Sid Commons – 282-unit apartment complex located at the end of Graylawn Avenue at the Petaluma
River • Sunny Slope II – 18 single family homes located on Sunnyslope Road • Pinnacle Ridge – 11 single family homes located at 2762 I Street • Birches/Yarberry – 21-lot single family residential subdivision on Wood Sorrel Drive near North
McDowell Boulevard • Haystack Landing -- Mixed-use development with 21,111 square feet of commercial space, 120 units of
apartments units, and 31 units of senior adult housing located between Copeland Street and Weller Street • Ferrin Subdivision – 11 single-family homes located at 2832 I Street • Corona Road Subdivision – 30 single-family homes located at 470 and 498 Corona Road • Cader Corporate Center – 267,840 square feet of light industrial space • Cader Lane Industrial Park – 241,000 square feet of light industrial space • Marina Apartments – 80-unit apartment complex located on the northwest corner of the Petaluma
Marina • Brewster’s Garden -- New restaurant with average seating of 111 patrons and maximum of 300 patrons
at 242 and 238 Petaluma Blvd N • Baywood Village – 150 apartments and 105 townhomes at the southern terminus of Casa Grande Road,
south of Lakeville Highway • Adobe Animal Hospital –3,900 square-foot veterinary clinic at 408 Madison Street
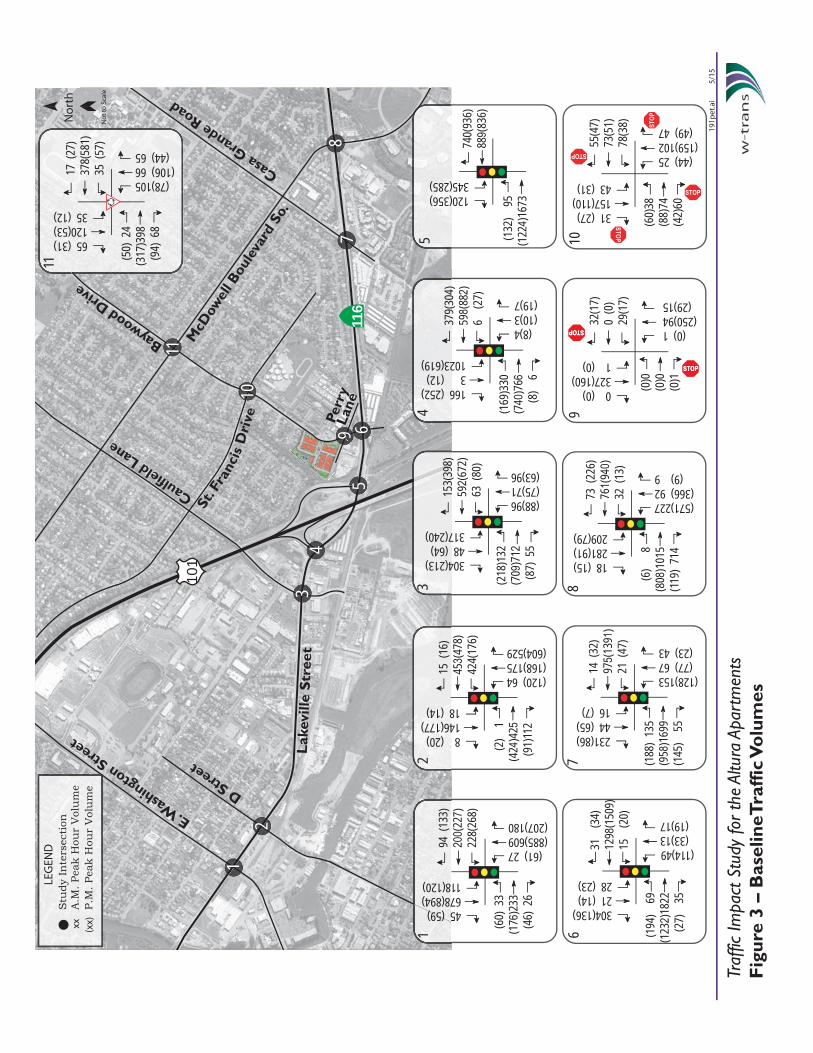
The projected traffic associated with these projects was added to the volumes analyzed in the “Existing Conditions” scenario in order to determine Baseline volumes. Under these conditions, the study intersections are projected to continue operating acceptably, except Lakeville Street/East Washington Street during the p.m. peak hour and Lakeville Highway/McDowell Boulevard South during the a.m. peak hour, which are expected to operate unacceptably at LOS E. Baseline volumes are shown in Figure 3, and the resulting operating conditions are summarized in Table 6.
No
rth
No
t to
Sca
le
St. F
ranc
is D
rive
101
116
11
10
9 67
8
34
5
12
Lak
evill
e S
tree
t
E. Wash
ington Street
D Street
Caulfield Lane
Perr
yLa
ne
McD
owel
l Bou
leva
rd S
o.
Casa Grande Road
Baywood D
rive
LEG
END
xx
(xx)
A.M
. Pea
k H
our
Vol
um
eS
tudy
In
ters
ecti
on
P.M
. Pea
k H
our
Vol
um
e
Fig
ure
3 –
Bas
elin
eTra
ffic
Vo
lum
es
191p
et.a
i 5/
15
Traf
fic Im
pact
Stu
dy fo
r th
e Al
tura
Apa
rtm
ents
1117
(27
)37
8(58
1)35
(57
)
(50
) 24
(317
)398
(94
) 68
(78)105(106) 66 (44) 65
65 (31)120(53)35 (12)
5
740(
936)
889(
836)
(13
2)
95(1
224)
1673
120(356)345(285)
4
379(
304)
598(
882)
6 (
27)
(169
)330
(740
)766
(8
) 6
(8)4(10)3(19)7
166 (252)3 (12)1023(619)
315
3(39
8)592(
672)
63 (
80)
(218
)132
(709
)712
(87
) 55
(88)96(75)71(63)96
304(213)48 (64)317(240)
215
(16
)453(
478)
424(
176)
(2
) 1
(424
)425
(91
)112
(120) 64(168)175(604)529
8 (20)146(177)18 (14)
194
(13
3)200(
227)
228(
268)
(60
) 33
(176
)233
(46
) 26
(61) 27(885)609(207)180
45 (59)678(894)118(120)
631
(3
4)12
98(1
509)
15
(20)
(19
4)
69(1
232)
1822
(2
7)
35
(114)49 (33)13 (19)17
304(136)21 (14)28 (23)
714
(32
)975(
1391
)21
(47
)
(188
) 13
5(9
58)1
699
(145
) 5
5
(128)153 (77) 67 (23) 43
231(86)44 (65)16 (7)
873
(22
6)761(
940)
32 (
13)
(6
)
8(8
08)1
015
(119)
714
(571)227(366) 92 (9) 9
18 (15)281(91)209(79)
932
(17)
0 (0
)29
(17)
(0)0
(0)0
(0)1
(0) 1(250)94 (29)15
0 (0)327(160)1 (0)
1055
(47)
73(5
1)78
(38)
(60)
38(8
8)74
(42)
60
(44) 25(159)102 (49) 47
31 (27)157(110)43 (31)
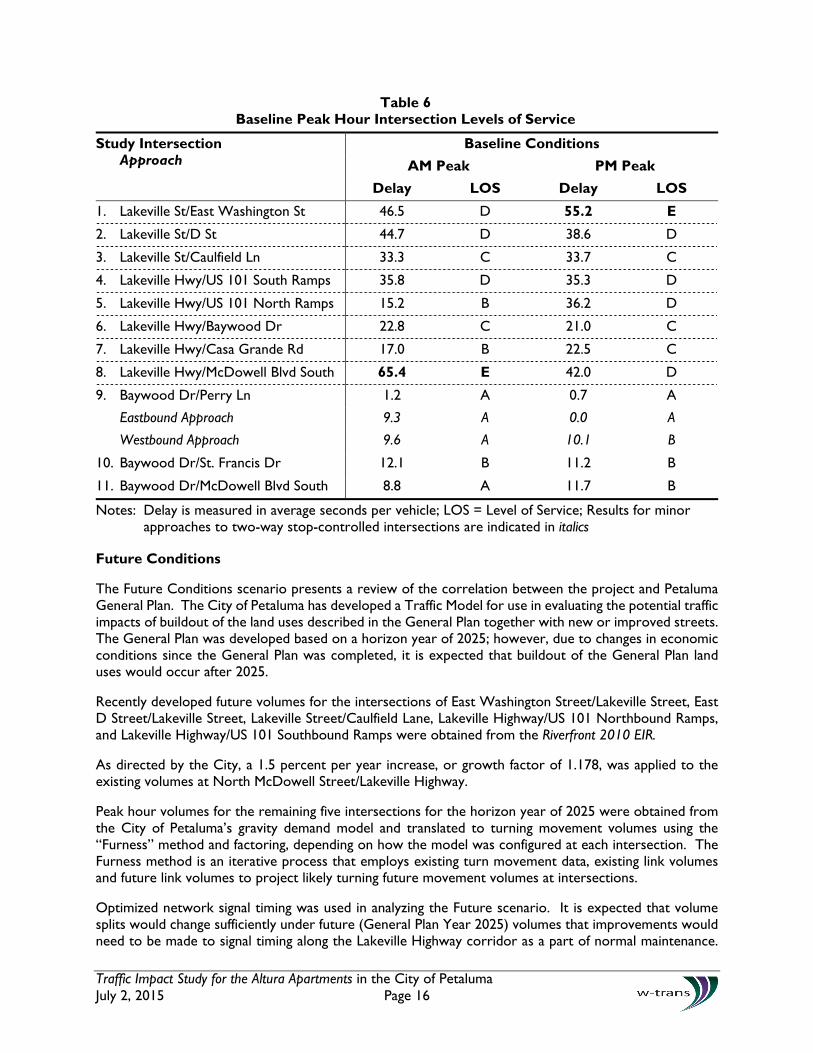
Traffic Impact Study for the Altura Apartments in the City of Petaluma July 2, 2015 Page 16
Table 6 Baseline Peak Hour Intersection Levels of Service
Study Intersection Approach
Baseline Conditions
AM Peak PM Peak
Delay LOS Delay LOS
1. Lakeville St/East Washington St 46.5 D 55.2 E
2. Lakeville St/D St 44.7 D 38.6 D
3. Lakeville St/Caulfield Ln 33.3 C 33.7 C
4. Lakeville Hwy/US 101 South Ramps 35.8 D 35.3 D
5. Lakeville Hwy/US 101 North Ramps 15.2 B 36.2 D
6. Lakeville Hwy/Baywood Dr 22.8 C 21.0 C
7. Lakeville Hwy/Casa Grande Rd 17.0 B 22.5 C
8. Lakeville Hwy/McDowell Blvd South 65.4 E 42.0 D
9. Baywood Dr/Perry Ln 1.2 A 0.7 A
Eastbound Approach 9.3 A 0.0 A
Westbound Approach 9.6 A 10.1 B
10. Baywood Dr/St. Francis Dr 12.1 B 11.2 B
11. Baywood Dr/McDowell Blvd South 8.8 A 11.7 B
Notes: Delay is measured in average seconds per vehicle; LOS = Level of Service; Results for minor approaches to two-way stop-controlled intersections are indicated in italics
Future Conditions
The Future Conditions scenario presents a review of the correlation between the project and Petaluma General Plan. The City of Petaluma has developed a Traffic Model for use in evaluating the potential traffic impacts of buildout of the land uses described in the General Plan together with new or improved streets. The General Plan was developed based on a horizon year of 2025; however, due to changes in economic conditions since the General Plan was completed, it is expected that buildout of the General Plan land uses would occur after 2025.
Recently developed future volumes for the intersections of East Washington Street/Lakeville Street, East D Street/Lakeville Street, Lakeville Street/Caulfield Lane, Lakeville Highway/US 101 Northbound Ramps, and Lakeville Highway/US 101 Southbound Ramps were obtained from the Riverfront 2010 EIR.
As directed by the City, a 1.5 percent per year increase, or growth factor of 1.178, was applied to the existing volumes at North McDowell Street/Lakeville Highway.
Peak hour volumes for the remaining five intersections for the horizon year of 2025 were obtained from the City of Petaluma’s gravity demand model and translated to turning movement volumes using the “Furness” method and factoring, depending on how the model was configured at each intersection. The Furness method is an iterative process that employs existing turn movement data, existing link volumes and future link volumes to project likely turning future movement volumes at intersections.
Optimized network signal timing was used in analyzing the Future scenario. It is expected that volume splits would change sufficiently under future (General Plan Year 2025) volumes that improvements would need to be made to signal timing along the Lakeville Highway corridor as a part of normal maintenance.
Traffic Impact Study for the Altura Apartments in the City of Petaluma July 2, 2015 Page 17
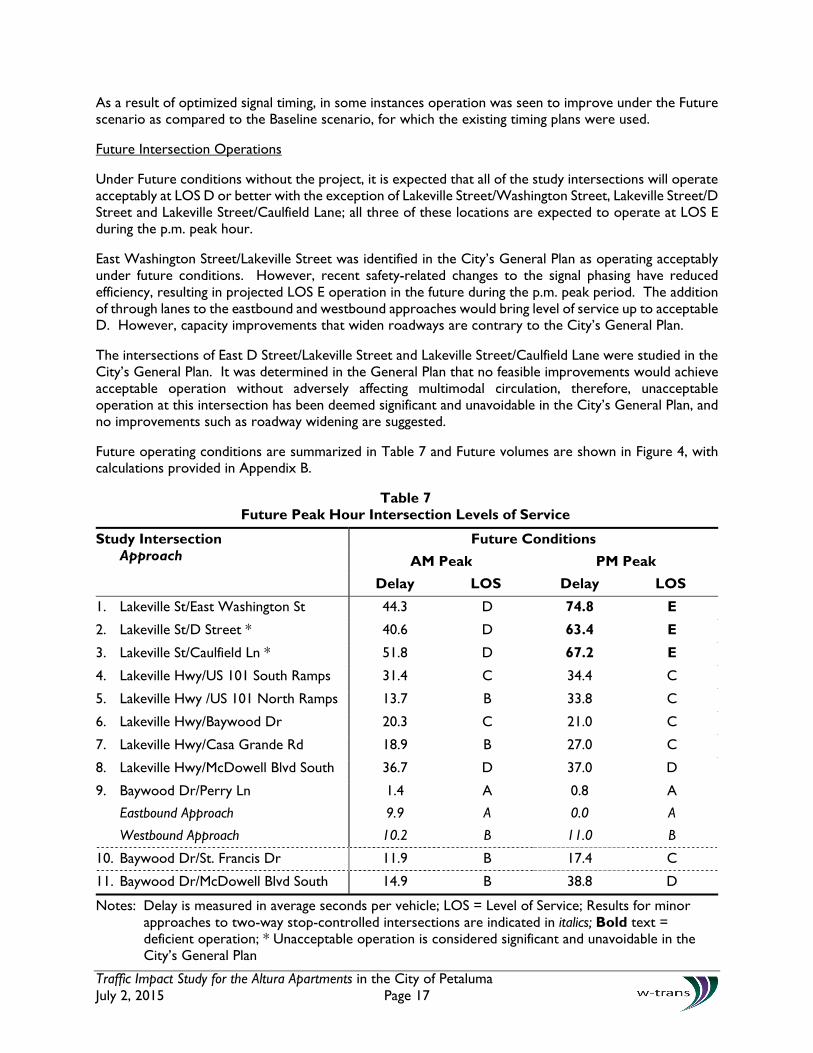
As a result of optimized signal timing, in some instances operation was seen to improve under the Future scenario as compared to the Baseline scenario, for which the existing timing plans were used.
Future Intersection Operations
Under Future conditions without the project, it is expected that all of the study intersections will operate acceptably at LOS D or better with the exception of Lakeville Street/Washington Street, Lakeville Street/D Street and Lakeville Street/Caulfield Lane; all three of these locations are expected to operate at LOS E during the p.m. peak hour.
East Washington Street/Lakeville Street was identified in the City’s General Plan as operating acceptably under future conditions. However, recent safety-related changes to the signal phasing have reduced efficiency, resulting in projected LOS E operation in the future during the p.m. peak period. The addition of through lanes to the eastbound and westbound approaches would bring level of service up to acceptable D. However, capacity improvements that widen roadways are contrary to the City’s General Plan.
The intersections of East D Street/Lakeville Street and Lakeville Street/Caulfield Lane were studied in the City’s General Plan. It was determined in the General Plan that no feasible improvements would achieve acceptable operation without adversely affecting multimodal circulation, therefore, unacceptable operation at this intersection has been deemed significant and unavoidable in the City’s General Plan, and no improvements such as roadway widening are suggested.
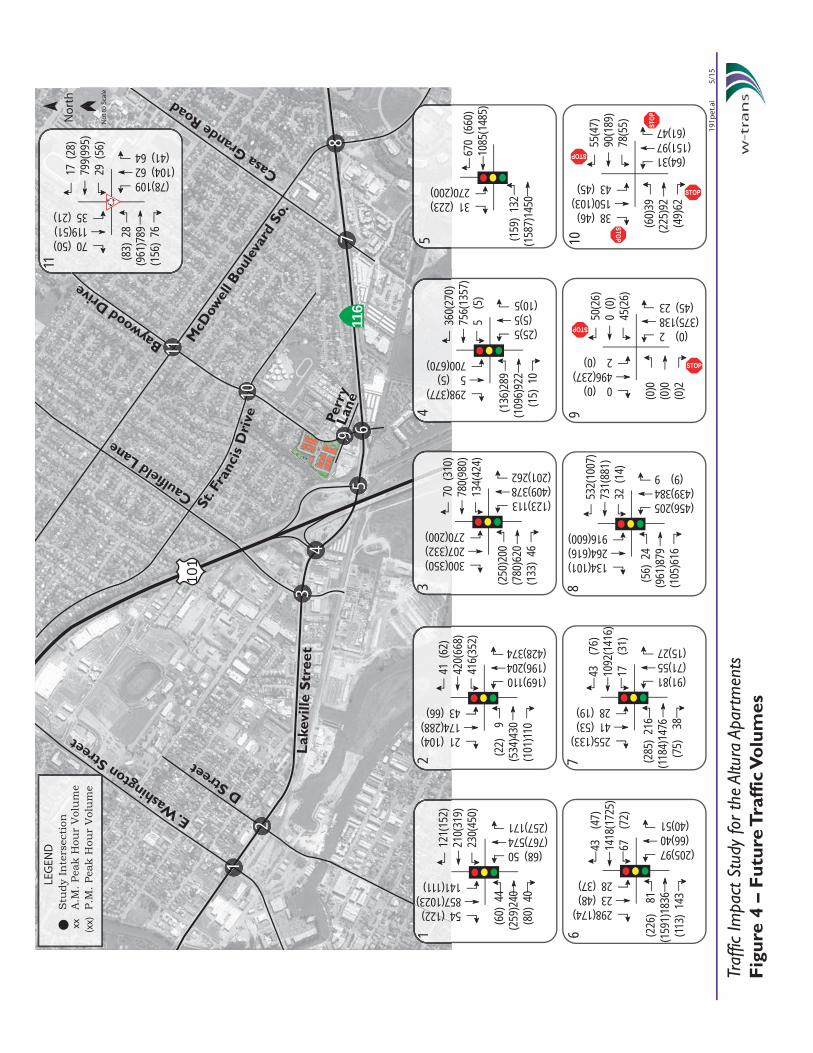
Future operating conditions are summarized in Table 7 and Future volumes are shown in Figure 4, with calculations provided in Appendix B.
Table 7 Future Peak Hour Intersection Levels of Service
Study Intersection Approach
Future Conditions
AM Peak PM Peak
Delay LOS Delay LOS
1. Lakeville St/East Washington St 44.3 D 74.8 E
2. Lakeville St/D Street * 40.6 D 63.4 E
3. Lakeville St/Caulfield Ln * 51.8 D 67.2 E
4. Lakeville Hwy/US 101 South Ramps 31.4 C 34.4 C
5. Lakeville Hwy /US 101 North Ramps 13.7 B 33.8 C
6. Lakeville Hwy/Baywood Dr 20.3 C 21.0 C
7. Lakeville Hwy/Casa Grande Rd 18.9 B 27.0 C
8. Lakeville Hwy/McDowell Blvd South 36.7 D 37.0 D
9. Baywood Dr/Perry Ln 1.4 A 0.8 A
Eastbound Approach 9.9 A 0.0 A
Westbound Approach 10.2 B 11.0 B
10. Baywood Dr/St. Francis Dr 11.9 B 17.4 C
11. Baywood Dr/McDowell Blvd South 14.9 B 38.8 D
Notes: Delay is measured in average seconds per vehicle; LOS = Level of Service; Results for minor approaches to two-way stop-controlled intersections are indicated in italics; Bold text = deficient operation; * Unacceptable operation is considered significant and unavoidable in the City’s General Plan
No
rth
No
t to
Sca
le
St. F
ranc
is D
rive
101
116
11
10
9 67
8
34
5
12
Lak
evill
e S
tree
t
E. Wash
ington Street
D Street
Caulfield Lane
Perr
yLa
ne
McD
owel
l Bou
leva
rd S
o.
Casa Grande Road
Baywood D
rive
LEG
END
xx
(xx)
A.M
. Pea
k H
our
Vol
um
eS
tudy
In
ters
ecti
on
P.M
. Pea
k H
our
Vol
um
e
Fig
ure
4 –
Fu
ture
Tra
ffic
Vo
lum
es
191p
et.a
i 5/
15
Traf
fic Im
pact
Stu
dy fo
r th
e Al
tura
Apa
rtm
ents
1117
(28
)79
9(99
5)29
(56
)
(83
) 28
(961
)789
(156
) 76
(78)109(104) 62 (41) 64
70 (50)119(51)35 (21)
5
670
(660
)10
85(1
485)
(15
9) 1
32(1
587)
145031 (223)
270(200)
4
360(
270)
756(
1357
)5
(5)
(13
6)28
9(1
096)
922
(1
5) 1
0
(25)5 (5)5(10)5
298(377)5 (5)700(670)
370
(31
0)78
0(98
0)13
4(42
4)
(250
)200
(780
)620
(133
) 46
(123)113(409)378(201)262
300(350)207(332)270(200)
241
(62
)42
0(66
8)41
6(35
2)
(22
) 9
(534
)430
(101
)110
(169)110(196)204(428)374
21 (104)174(288)43 (66)
112
1(15
2)21
0(31
9)23
0(45
0)
(60
) 44
(259
)240
(80
) 40
(68) 50(767)574(257)171
54 (122)857(1023)141(111)
643
(4
7)14
18(1
725)
67
(72)
(22
6)
81(1
591)
1836
(11
3) 1
43
(205)97 (66)40 (40)51
298(174)23 (48)28 (37)
743
(7
6)10
92(1
416)
17
(31)
(28
5) 2
16(11
84)1
476
(7
5)
38
(91)81(71)55(15)27
255(133)41 (53)28 (19)
853
2(10
07)
731(
881)
32 (
14)
(56
) 24
(961
)879
(105
)616
(456)205(439)384 (9) 9
134(101)264(616)916(600)
1055
(47)
90(1
89)
78(5
5)
(60
)39
(225
)92
(49
)62
(64)31(151)97 (61)47
38 (46)150(103)43 (45)
950
(26)
0 (0
)45
(26)
(0)0
(0)0
(0)2
(0) 2(375)138 (45) 23
0 (0)496(237)2 (0)

Traffic Impact Study for the Altura Apartments in the City of Petaluma July 2, 2015 Page 19
Project Description
The proposed project consists of a 150-dwelling-unit apartment building. The project site is currently vacant and is bounded by Baywood Drive to the east, Perry Lane to the south, single-family homes on Alderwood Court to the northeast, and single-family homes and US 101 to the northwest.
Baywood Drive Road Diet
As requested by City staff, a road diet on Baywood Drive would be implemented between Alderwood Court and Perry Lane, where the existing four-lane section would be converted to a three-lane section including one through lane in each direction plus a center turn lane, leaving adequate width for bike lanes in both directions as well as parking along both sides. It is noted that this results in an increase in the parking supply as parking is current allowed on only one side of this section of Baywood Drive. The road diet would change the lane configuration on the southbound Baywood Drive approach to a left-turn lane and through-right lane, by removing one southbound through lane. The remaining Baywood Drive intersections would not be affected by the road diet.
The proposed project site plan is shown in Figure 5.
Trip Generation
The anticipated trip generation for the proposed project was estimated using standard rates published by the Institute of Transportation Engineers (ITE) in Trip Generation Manual, 9th Edition, 2012 for “Apartment” (ITE LU 220). Because the site is currently unoccupied, the trip generation of the existing use was not considered.
The expected trip generation potential for the proposed project is indicated in Table 8. The proposed project is expected to generate an average of 998 trips per day, including 77 trips during the a.m. peak hour and 93 during the p.m. peak hour. These new trips represent the increase in traffic associated with the project compared to existing volumes.
Table 8 Trip Generation Summary
Land Use Units Daily AM Peak Hour PM Peak Hour
Rate Trips Rate Trips In Out Rate Trips In Out
Proposed
Apartment 150 du 6.65 998 0.51 77 15 62 0.62 93 60 33
Note: du = dwelling unit Trip Distribution
The patterns used to allocate new commercial and residential project trips to the street network were based on the adjacent roadway network, likely origin/destination points and current traffic patterns. These assumptions are consistent with assumptions applied to other recent traffic impact studies for projects in the area. The applied distribution assumptions and resulting trips are shown in Table 9.

Fig
ure
5 –
Sit
e P
lan
191p
et.a
i 5/
15
Traf
fic Im
pact
Stu
dy fo
r th
e Al
tura
Apa
rtm
ents
Sour
ce:
TSD
Eng
inee
ring
, Inc
. 4/
15
Traffic Impact Study for the Altura Apartments in the City of Petaluma July 2, 2015 Page 21
Table 9 Trip Distribution Assumptions
Route Percent Daily Trips AM Trips PM Trips
To/from the south via US 101 30% 299 23 28
To/from the north via US 101 18% 180 14 17
To/from the west via Lakeville Hwy 22% 220 17 20
To/from the east via Lakeville Hwy 15% 150 12 14
To/from the north via McDowell Blvd 11% 109 7 10
To/from the south via McDowell Blvd 2% 20 2 2
To/from the east via Baywood Dr 2% 20 2 2
TOTAL 100% 998 77 93
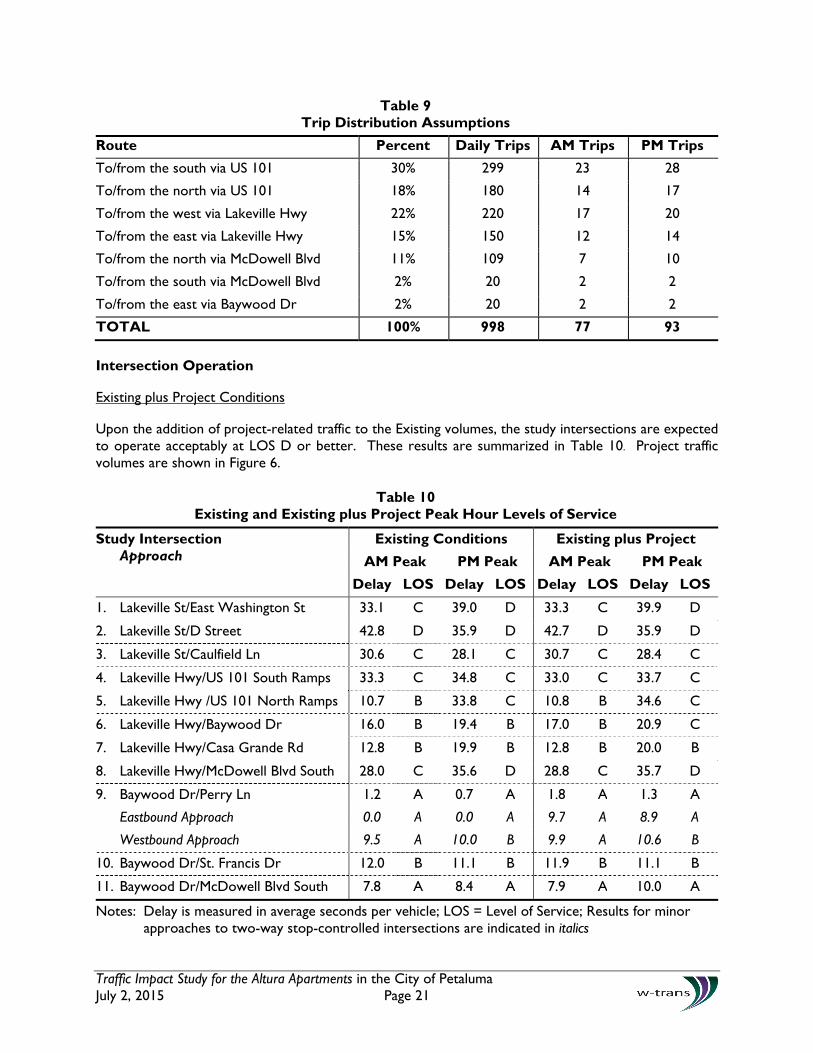
Intersection Operation
Existing plus Project Conditions
Upon the addition of project-related traffic to the Existing volumes, the study intersections are expected to operate acceptably at LOS D or better. These results are summarized in Table 10. Project traffic volumes are shown in Figure 6.
Table 10 Existing and Existing plus Project Peak Hour Levels of Service
Study Intersection Approach
Existing Conditions Existing plus Project
AM Peak PM Peak AM Peak PM Peak
Delay LOS Delay LOS Delay LOS Delay LOS
1. Lakeville St/East Washington St 33.1 C 39.0 D 33.3 C 39.9 D
2. Lakeville St/D Street 42.8 D 35.9 D 42.7 D 35.9 D
3. Lakeville St/Caulfield Ln 30.6 C 28.1 C 30.7 C 28.4 C
4. Lakeville Hwy/US 101 South Ramps 33.3 C 34.8 C 33.0 C 33.7 C
5. Lakeville Hwy /US 101 North Ramps 10.7 B 33.8 C 10.8 B 34.6 C
6. Lakeville Hwy/Baywood Dr 16.0 B 19.4 B 17.0 B 20.9 C
7. Lakeville Hwy/Casa Grande Rd 12.8 B 19.9 B 12.8 B 20.0 B
8. Lakeville Hwy/McDowell Blvd South 28.0 C 35.6 D 28.8 C 35.7 D
9. Baywood Dr/Perry Ln 1.2 A 0.7 A 1.8 A 1.3 A
Eastbound Approach 0.0 A 0.0 A 9.7 A 8.9 A
Westbound Approach 9.5 A 10.0 B 9.9 A 10.6 B
10. Baywood Dr/St. Francis Dr 12.0 B 11.1 B 11.9 B 11.1 B
11. Baywood Dr/McDowell Blvd South 7.8 A 8.4 A 7.9 A 10.0 A
Notes: Delay is measured in average seconds per vehicle; LOS = Level of Service; Results for minor approaches to two-way stop-controlled intersections are indicated in italics

No
rth
No
t to
Sca
le
St. F
ranc
is D
rive
101
116
11
10
9 67
8
34
5
12
Lak
evill
e S
tree
t
E. Wash
ington Street
D Street
Caulfield Lane
Perr
yLa
ne
McD
owel
l Bou
leva
rd S
o.
Casa Grande Road
Baywood D
rive
LEG
END
xx
(xx)
A.M
. Pea
k H
our
Vol
um
eS
tudy
In
ters
ecti
on
P.M
. Pea
k H
our
Vol
um
e
Fig
ure
6 –
Pro
ject
Tra
ffic
Vo
lum
es
191p
et.a
i 9/
14
Traf
fic Im
pact
Stu
dy fo
r th
e Al
tura
Apa
rtm
ents
110(
0)7(
4)0(
0)
(0)0
(7)2
(0)0
(0)0(1)1(0)0
0(0)0(1)0(0)
5
11(6
)32
(17)
(0)
0(2
4)60(0)
5(18)
4
18(1
0)13
(7)
0 (0
)
(0)
0(1
3)3
(0)
0
(0)0(0)0(0)0
0(0)0(0)3(11)
31
(0)
13(7
)0
(0)
(0)
0(1
3)3
(0)
0(0)0(0)0(0)0
0(0)0(0)0(1)
21
(0)
11(6
)1
(1)
(0)
0(11
)3 (
0)0
(0)0(0)0(1)0
0(0)0(0)0(1)
17(
4)3(
2)1(
1)
(0)0
(3)1
(0)0
(0)0(0)0(1)0
0(0)0(0)2(7)
64(
17)
0(0)
0(0)
(42)
10 (
0) 0
(0)
0
(0)0(0)0(0)0
43(23)0 (0)17(9)
70(
0)4(
17)
0(0)
(0)
0(9
)17
(0)
0
(0)0(0)0(0)0
0(0)0(0)0(0)
80(
0)2(
9)0(
0)
(4)7
(5)9
(1)1
(1)0(0)0(0)0
2(7)0(0)0(0)
100(
0)0(
0)0(
0)
(0)0
(0)0
(0)0
(0)0(1)1(0)0
0(0)0(1)0(0)
90(
0)0(
0)0(
0)
(0)
1 (
0) 0
(16)
30
(29)7(29)7 (0)0
0 (1)30(16)0 (0)

Traffic Impact Study for the Altura Apartments in the City of Petaluma July 2, 2015 Page 23
Finding: The study intersections are expected to continue operating acceptably at the same levels of service upon the addition of project-generated traffic to Existing volumes.
US 101 Study Segments
The portions of US 101 between East Washington Boulevard and Lakeville Highway and Lakeville Highway and Petaluma Boulevard South currently carry 92,000 vehicles per day. The Existing plus Project scenario represents the most conservative scenario of project-related impacts since project trips make up a larger percentage of the existing overall volumes on the highway compared to future scenarios. Table 11 shows how many vehicles travel through each study segment during the a.m. and p.m. peak periods under Existing and Existing plus Project conditions.
Table 11 Existing and Existing plus Project Highway Segment Peak Period Volumes
US 101 Segment Scenario
NB Volume SB Volume
AM Peak PM Peak AM Peak PM Peak
Vol. % Inc. Vol. % Inc. Vol. % Inc. Vol. % Inc.
E Washington Blvd – Lakeville Hwy
Existing 3,950 4,930 4,850 3,870
Existing + Project 3,961 0.2% 4,936 0.1% 4,853 0.1% 3,881 0.3%
Lakeville Hwy – Petaluma Blvd S
Existing 3,550 4,420 4,350 3,480
Existing + Project 3,555 0.1% 4,438 0.4% 4,368 0.4% 3,490 0.3%
Improvements are currently under construction along various portions of US 101, including between Lakeville Highway and Petaluma Boulevard South, to add one travel lane in each direction. These lanes will serve as High Occupancy Vehicle (HOV) lanes during the morning and evening peak periods. These improvements are funded in part by a quarter-cent sales tax approved by Sonoma County voters. The added lanes and associated interchange improvements are the only improvements currently planned along US 101 with the exception of the future interchange at Rainier Avenue, though this latter project is currently unfunded.
Finding: Project trips would increase overall directional volumes on either of the two freeway study segments during the peak hours by no more than 0.4 percent. In addition, both of these segments are slated for widening with the Marin Sonoma Narrows project under way. Given the increased capacity available once construction has completed and that the project would increase volumes on the freeway segments by less than one percent, the project-related impacts are less-than-significant.
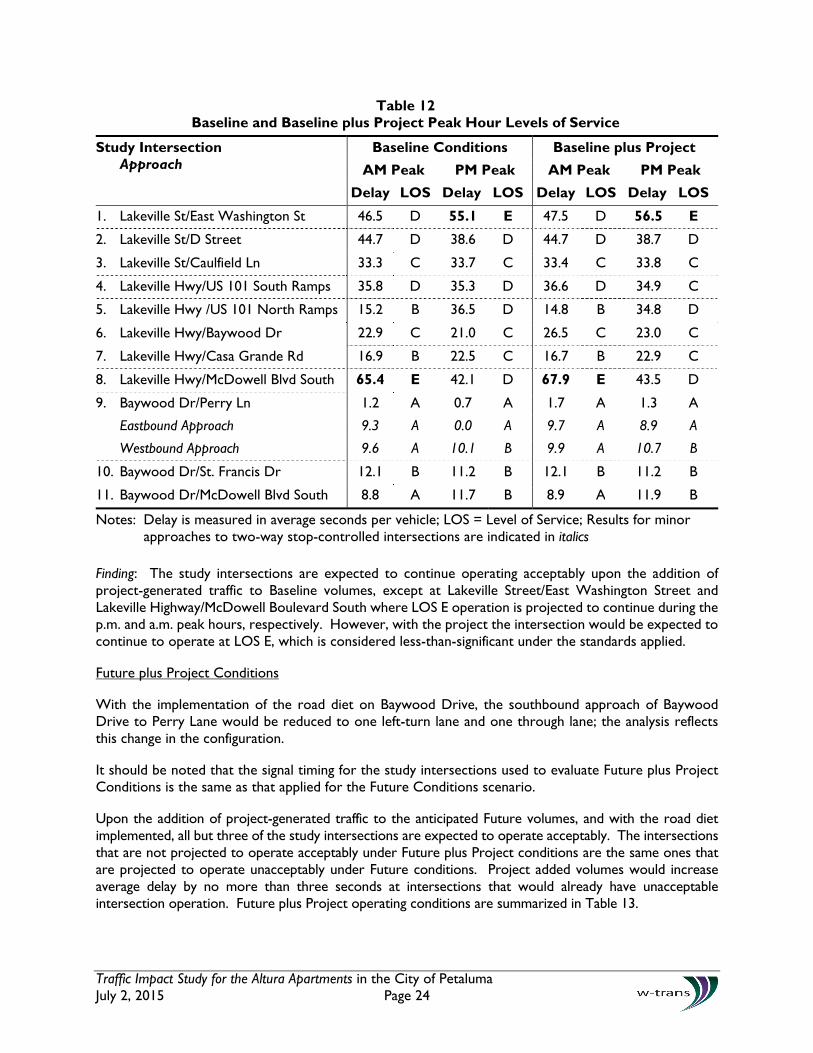
Baseline plus Project Conditions
With project-related traffic added to Baseline volumes, the study intersections are expected to operate acceptably at LOS D or better, except Lakeville Street/East Washington Street, which is expected to continue operating at LOS E during the p.m. peak hour and Lakeville Highway/McDowell Boulevard South, which is expected to continue operating at LOS E during the a.m. peak hour. These results are summarized in Table 12.
Traffic Impact Study for the Altura Apartments in the City of Petaluma July 2, 2015 Page 24
Table 12 Baseline and Baseline plus Project Peak Hour Levels of Service
Study Intersection Approach
Baseline Conditions Baseline plus Project
AM Peak PM Peak AM Peak PM Peak
Delay LOS Delay LOS Delay LOS Delay LOS
1. Lakeville St/East Washington St 46.5 D 55.1 E 47.5 D 56.5 E
2. Lakeville St/D Street 44.7 D 38.6 D 44.7 D 38.7 D
3. Lakeville St/Caulfield Ln 33.3 C 33.7 C 33.4 C 33.8 C
4. Lakeville Hwy/US 101 South Ramps 35.8 D 35.3 D 36.6 D 34.9 C
5. Lakeville Hwy /US 101 North Ramps 15.2 B 36.5 D 14.8 B 34.8 D
6. Lakeville Hwy/Baywood Dr 22.9 C 21.0 C 26.5 C 23.0 C
7. Lakeville Hwy/Casa Grande Rd 16.9 B 22.5 C 16.7 B 22.9 C
8. Lakeville Hwy/McDowell Blvd South 65.4 E 42.1 D 67.9 E 43.5 D
9. Baywood Dr/Perry Ln 1.2 A 0.7 A 1.7 A 1.3 A
Eastbound Approach 9.3 A 0.0 A 9.7 A 8.9 A
Westbound Approach 9.6 A 10.1 B 9.9 A 10.7 B
10. Baywood Dr/St. Francis Dr 12.1 B 11.2 B 12.1 B 11.2 B
11. Baywood Dr/McDowell Blvd South 8.8 A 11.7 B 8.9 A 11.9 B
Notes: Delay is measured in average seconds per vehicle; LOS = Level of Service; Results for minor approaches to two-way stop-controlled intersections are indicated in italics
Finding: The study intersections are expected to continue operating acceptably upon the addition of project-generated traffic to Baseline volumes, except at Lakeville Street/East Washington Street and Lakeville Highway/McDowell Boulevard South where LOS E operation is projected to continue during the p.m. and a.m. peak hours, respectively. However, with the project the intersection would be expected to continue to operate at LOS E, which is considered less-than-significant under the standards applied.
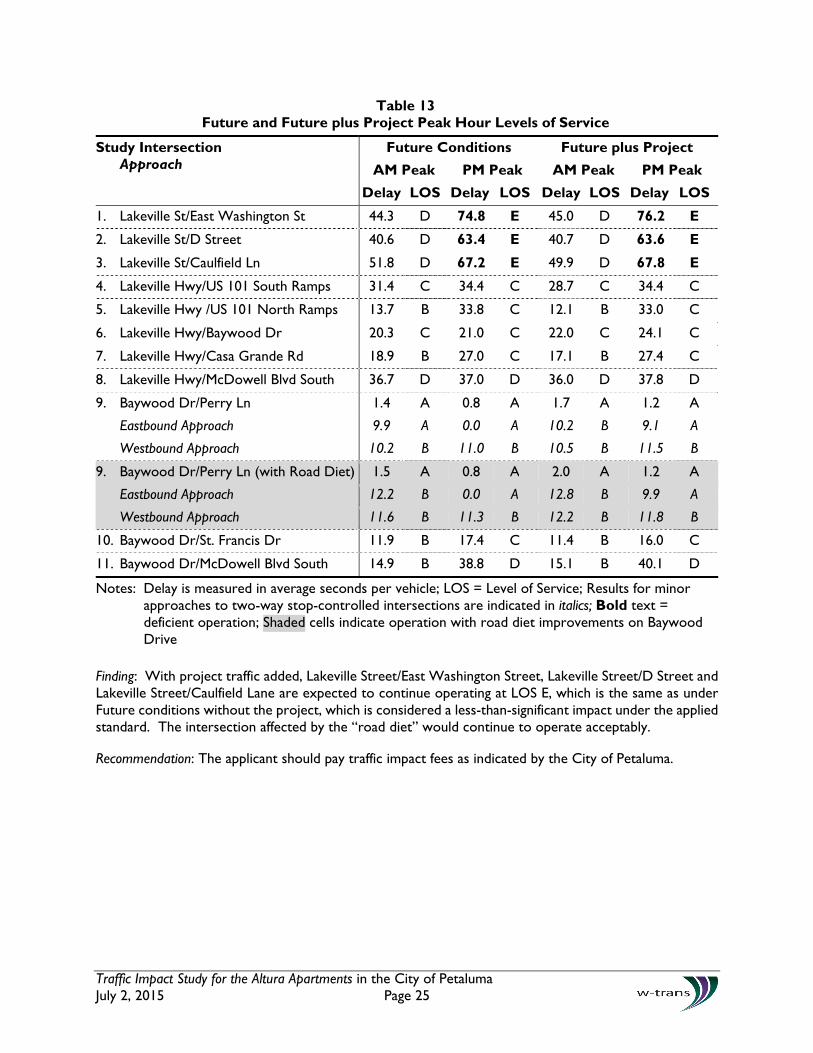
Future plus Project Conditions
With the implementation of the road diet on Baywood Drive, the southbound approach of Baywood Drive to Perry Lane would be reduced to one left-turn lane and one through lane; the analysis reflects this change in the configuration.
It should be noted that the signal timing for the study intersections used to evaluate Future plus Project Conditions is the same as that applied for the Future Conditions scenario.
Upon the addition of project-generated traffic to the anticipated Future volumes, and with the road diet implemented, all but three of the study intersections are expected to operate acceptably. The intersections that are not projected to operate acceptably under Future plus Project conditions are the same ones that are projected to operate unacceptably under Future conditions. Project added volumes would increase average delay by no more than three seconds at intersections that would already have unacceptable intersection operation. Future plus Project operating conditions are summarized in Table 13.
Traffic Impact Study for the Altura Apartments in the City of Petaluma July 2, 2015 Page 25
Table 13 Future and Future plus Project Peak Hour Levels of Service
Study Intersection Approach
Future Conditions Future plus Project
AM Peak PM Peak AM Peak PM Peak
Delay LOS Delay LOS Delay LOS Delay LOS
1. Lakeville St/East Washington St 44.3 D 74.8 E 45.0 D 76.2 E
2. Lakeville St/D Street 40.6 D 63.4 E 40.7 D 63.6 E
3. Lakeville St/Caulfield Ln 51.8 D 67.2 E 49.9 D 67.8 E
4. Lakeville Hwy/US 101 South Ramps 31.4 C 34.4 C 28.7 C 34.4 C
5. Lakeville Hwy /US 101 North Ramps 13.7 B 33.8 C 12.1 B 33.0 C
6. Lakeville Hwy/Baywood Dr 20.3 C 21.0 C 22.0 C 24.1 C
7. Lakeville Hwy/Casa Grande Rd 18.9 B 27.0 C 17.1 B 27.4 C
8. Lakeville Hwy/McDowell Blvd South 36.7 D 37.0 D 36.0 D 37.8 D
9. Baywood Dr/Perry Ln 1.4 A 0.8 A 1.7 A 1.2 A
Eastbound Approach 9.9 A 0.0 A 10.2 B 9.1 A
Westbound Approach 10.2 B 11.0 B 10.5 B 11.5 B
9. Baywood Dr/Perry Ln (with Road Diet) 1.5 A 0.8 A 2.0 A 1.2 A
Eastbound Approach 12.2 B 0.0 A 12.8 B 9.9 A
Westbound Approach 11.6 B 11.3 B 12.2 B 11.8 B
10. Baywood Dr/St. Francis Dr 11.9 B 17.4 C 11.4 B 16.0 C
11. Baywood Dr/McDowell Blvd South 14.9 B 38.8 D 15.1 B 40.1 D
Notes: Delay is measured in average seconds per vehicle; LOS = Level of Service; Results for minor approaches to two-way stop-controlled intersections are indicated in italics; Bold text = deficient operation; Shaded cells indicate operation with road diet improvements on Baywood Drive
Finding: With project traffic added, Lakeville Street/East Washington Street, Lakeville Street/D Street and Lakeville Street/Caulfield Lane are expected to continue operating at LOS E, which is the same as under Future conditions without the project, which is considered a less-than-significant impact under the applied standard. The intersection affected by the “road diet” would continue to operate acceptably.
Recommendation: The applicant should pay traffic impact fees as indicated by the City of Petaluma.
Traffic Impact Study for the Altura Apartments in the City of Petaluma July 2, 2015 Page 26
Alternative Modes
Alternative Modes
Pedestrian Facilities
Given the proximity of residences to the north and west and retail areas to the south and east of the site, it is reasonable to assume that some project patrons and employees will want to walk, bicycle, and/or utilize transit for trips to and from the Altura Apartments.
Project Site – Sidewalks are provided along the project’s frontage on Baywood Drive. The site plan indicates that sidewalks will be installed along the north side of Perry Lane.
Finding: Pedestrian facilities serving the project site are adequate with the proposed improvements.
Bicycle Facilities
Existing bicycle facilities, including bike lanes on Baywood Drive and South McDowell Boulevard together with shared use of minor streets, provide adequate access to the site for bicyclists.
Bicycle Storage
The Petaluma Zoning Code (Standard 11.090) requires that bicycle parking be provided at a rate of 10 percent of automobile parking spaces required. The site requires 225 automobile parking spaces, therefore a minimum of 23 bicycle parking spaces should be provided.
Recommendation: A minimum of 23 bicycle parking spaces should be provided.
Transit
Existing transit routes are adequate to accommodate project-generated transit trips. Existing stops are within acceptable walking distance of the site. As part of the project, installation of a solar-powered bus shelter on westbound Lakeville Highway just east of its intersection with Baywood Drive is proposed.
Finding: Transit facilities serving the project site while adequate, would benefit from enhancements.
Recommendation: It is recommended that the City of Petaluma accept the applicant's proposal to install a solar-powered bus shelter on Lakeville Highway.
Traffic Impact Study for the Altura Apartments in the City of Petaluma July 2, 2015 Page 27
Access and Circulation
Site Access
The project would have four driveways for both ingress and egress. Two driveways would be located approximately 200 feet and 500 feet north of Perry Lane on the west side of Baywood Drive, which has a center turn lane to accommodate left turns into and out of the site. The additional two driveways would be located on the north side of Perry Lane approximately 275 feet and 540 feet west of Baywood Drive.
Sight Distance
At driveways a substantially clear line of sight should be maintained between the driver of a vehicle waiting to cross or enter the street and the driver of a vehicle approaching on that street. Adequate time must be provided for the waiting vehicle to either cross, turn left, or turn right, without requiring the through traffic to radically alter their speed. Sight distances along Baywood Drive and Perry Lane at the project driveway locations were evaluated based on sight distance criteria contained in the Highway Design Manual published by Caltrans. The recommended sight distances for driveways are based on stopping sight distance, which use the approach travel speed as the basis for determining the recommended sight distance.
Sight distance at the proposed driveways was measured on the project site plan. Although sight distance requirements are not technically applicable to urban driveways, the stopping sight distance criterion for private street intersections was applied for evaluation purposes. Based on a design speed of 35 mph for Baywood Drive, the minimum stopping sight distance needed is 250 feet, and a review of the site plan showed that the sight distance from the Baywood Drive project driveway locations is adequate. Based on the prima facie speed of 25 mph for Perry Lane, the minimum stopping sight distance needed is 150 feet, and a review of the site plan shows that the sight distance from the Perry Lane project driveways is adequate.
Adequate sight lines are also required for drivers following a vehicle entering the site via either a left or right turn. Visibility approaching the driveway, which is located on the outside of a curve, will be more than adequate for following drivers. The existing center turn lane on Baywood Drive will accommodate left turns into the site, allowing drivers to make the move without impeding through traffic.
In order to maintain adequate sight lines for vehicles leaving the site, it is recommended that landscaping be trimmed such that tree canopies are at least seven feet above the ground; other landscaping should be limited to low-lying vegetation no greater than three feet in height. In addition, signs and monuments planned along the project’s frontage should be placed in a manner that does not obstruct sight distance at the project driveways.
Finding: Adequate sight distance is available provided that trees and other landscaping are trimmed to maintain clear sight lines.
Recommendation: Landscaping should be maintained such that foliage stays above seven feet and below three feet from the ground. Signs or monuments to be installed along the project frontage should be placed so that sight distance is not obstructed at the project driveway.
Traffic Impact Study for the Altura Apartments in the City of Petaluma July 2, 2015 Page 28
Conclusions and Recommendations
Conclusions
• Nine out of eleven study intersections had collision rates that are higher than the statewide average for similar facilities, though most are only marginally higher. The City has recently completed improvements at East Washington Street/Lakeville Highway which are expected to reduce the incidence of collisions. Also, conversion of the all-way stop-controlled intersection at McDowell Boulevard South/Baywood Drive has reduced crashes at this location. Speed enforcement could address trends along Lakeville Highway.
• Currently, all eleven study intersections operate acceptably during the a.m. and p.m. peak hours.
• Under Baseline conditions, the study intersections are expected to continue to operate acceptably during both peak periods, except Lakeville Street/East Washington Street during the p.m. peak hour and Lakeville Highway/McDowell Boulevard South during the a.m. peak hour, which are expected to operate unacceptably at LOS E.
• Under Future conditions, East D Street/Lakeville Street and Caulfield Lane/Lakeville Street are expected to operate at LOS E; however, in the City’s General Plan, unacceptable operations at this location were found to be significant and unavoidable.
• East Washington Street/Lakeville Street was identified in the City’s General Plan as operating acceptably under future conditions. However, recently completed safety-related changes to the signal phasing have reduced efficiency, resulting in projected LOS E operation in the future.
• The proposed project would generate 998 new daily trips, of which 77 trips would be generated during the a.m. peak hour and 93 trips would be generated during the p.m. peak hour.
• With the addition of project-generated traffic, there would be no change in the acceptability of intersection operations under Existing, Baseline or Future Conditions as the intersections are projected to continue operating at the same levels of service.
• Trips associated with the project are expected to increase total traffic volumes on the two US 101 study segments by less than one percent; therefore, the project is expected to have a less-than-significant impact to the US 101 study segments.
• The intersection of Baywood Drive/Perry Lane, which will have reduced capacity as a result of the road diet on Baywood Drive between Perry Lane and Alderwood Court as requested by City staff, will continue to operate acceptably under all scenarios evaluated.
• With the implementation of the recommended improvements, pedestrian, bicycle and transit facilities are expected to adequately serve the project site.
Recommendations
• The applicant should pay applicable fees to address cumulative traffic impacts.
• The City of Petaluma should accept the proposed installation of a solar-powered bus shelter on Lakeville Highway.
• A minimum of 23 bicycle parking spaces should be provided in order to meet City requirements.
• Landscaping and signs or monuments should be maintained such that sight distance is not obstructed at the project driveway.

Traffic Impact Study for the Altura Apartments in the City of Petaluma July 2, 2015 Page 29
Study Participants and References
Study Participants
Principal in Charge: Dalene J. Whitlock, PE, PTOE Associate Engineer: Smadar Boardman, EIT Assistant Engineer: Lauren Davini, EIT Technician/Graphics: Deborah J. Mizell Editing/Formatting: Angela McCoy
References
2010 Collision Data on California State Highways, California Department of Transportation, 2010 All Traffic Volumes on CSHS, Traffic Data Branch, Caltrans, 2013, http://traffic-
counts.dot.ca.gov/2013all/Route101.html City of Petaluma Proposed and Existing Bicycle and Pedestrian Facilities Map, Sonoma County Transportation
Authority, 2014 City of Petaluma: Bicycle and Pedestrian Plan: an Appendix to the General Plan 2025, City of Petaluma, 2008 City of Petaluma: General Plan 2025, City of Petaluma, 2008 Golden Gate Transit, http://goldengatetransit.org/schedules/pages/Bus-Schedules.php Highway Capacity Manual, Transportation Research Board, 2000 Highway Capacity Manual, Transportation Research Board, 2010 Highway Design Manual, 6th Edition, California Department of Transportation, 2012 Implementing Zoning Ordinance (IZO): Chapter 11 – Parking and Loading Facilities, Off-Street, City of Petaluma,
2008, http://cityofpetaluma.net/cdd/pdf/izo/chapter11-off-street-parking-and-loading-facilities.pdf Petaluma General Plan 2025 Draft Environmental Impact Report, Dyett & Bhatia, 2006 Petaluma Municipal Code, Code Publishing Company, 2014 Petaluma Transit, http://cityofpetaluma.net/pubworks/schedules.html Riverfront Mixed-Use Project EIR, Strelow Consulting, 2014 Sonoma County Transit, http://www.sctransit.com/SchedulesMaps.aspx Statewide Integrated Traffic Records System (SWITRS), California Highway Patrol, 2007-2012 Trip Generation Manual, 9th Edition, Institute of Transportation Engineers, 2012
Communications
Telephone conversation regarding future volumes with Curt Bates and Gian Aggarwal, October 16, 2014
PET191

Traffic Impact Study for Altura Apartments in the City of Petaluma July 2015
Appendix A
Collision Rate Calculations


Date of Count:
Number of Collisions: 47Number of Injuries: 14
Number of Fatalities: 0ADT: 27000
Start Date: End Date:
Number of Years: 5
Intersection Type: Four-LeggedControl Type: Signals
Area: Urban
47 x27,000 x x 5
Study Intersection 0.95 c/mveStatewide Average* 0.27 c/mve
c/mve = collisions per million vehicles entering intersection* 2010 Collision Data on California State Highways, Caltrans
Date of Count:
Number of Collisions: 4Number of Injuries: 1
Number of Fatalities: 0ADT: 22900
Start Date: End Date:
Number of Years: 5
Intersection Type: Four-LeggedControl Type: Signals
Area: Urban
4 x22,900 x x 5
Study Intersection 0.10 c/mveStatewide Average* 0.27 c/mve
c/mve = collisions per million vehicles entering intersection* 2010 Collision Data on California State Highways, Caltrans
25.0%Collision Rate Fatality Rate
collision rate = 365
2:
Number of Collisions x 1 Million
0.4%
collision rate = ADT x 365 Days per Year x Number of Years
29.8%
1,000,000
Injury Rate
Fatality Rate0.0%
ADT x 365 Days per Year x Number of Years
0.0%
ADT = average daily total vehicles entering intersection
0.4%
Collision Rate Injury Rate
Intersection Collision Rate Calculaions
July 1, 2007June 30, 2012
Intersection # Lakeville Street & E Washington Street
collision rate = 1,000,000
Lakeville Street & D Street
41.9%
ADT = average daily total vehicles entering intersection
July 1, 2007
365
Intersection #
June 30, 2012
Number of Collisions x 1 Millioncollision rate =
1:
Altura Apartments
Thursday, March 27, 2014
Thursday, March 27, 2014
41.9%
Whitlock & Weinberger Transportation, Inc.10/21/2014Page 1 of 6
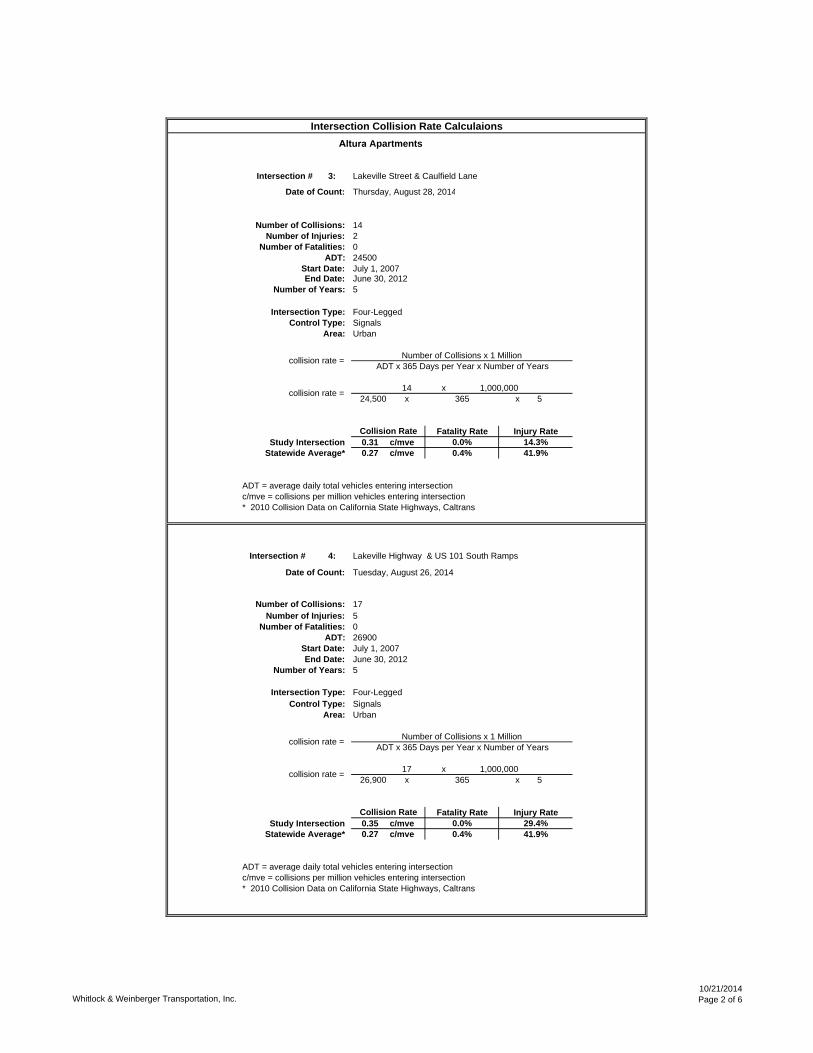
Date of Count:
Number of Collisions: 14Number of Injuries: 2
Number of Fatalities: 0ADT: 24500
Start Date: End Date:
Number of Years: 5
Intersection Type: Four-LeggedControl Type: Signals
Area: Urban
14 x24,500 x x 5
Study Intersection 0.31 c/mveStatewide Average* 0.27 c/mve
c/mve = collisions per million vehicles entering intersection* 2010 Collision Data on California State Highways, Caltrans
Date of Count:
Number of Collisions: 17Number of Injuries: 5
Number of Fatalities: 0ADT: 26900
Start Date: End Date:
Number of Years: 5
Intersection Type: Four-LeggedControl Type: Signals
Area: Urban
17 x26,900 x x 5
Study Intersection 0.35 c/mveStatewide Average* 0.27 c/mve
c/mve = collisions per million vehicles entering intersection* 2010 Collision Data on California State Highways, Caltrans
41.9%
Altura Apartments
July 1, 2007
41.9%
Fatality Rate Injury Rate
July 1, 2007
collision rate =
Intersection #
0.0%
June 30, 2012
collision rate =
ADT = average daily total vehicles entering intersection
Intersection Collision Rate Calculaions
Intersection #
Fatality Rate
365
Collision Rate
3: Lakeville Street & Caulfield Lane
collision rate = 1,000,000
Number of Collisions x 1 MillionADT x 365 Days per Year x Number of Years
Injury Rate
June 30, 2012
Lakeville Highway & US 101 South Ramps
ADT = average daily total vehicles entering intersection
0.4%
Thursday, August 28, 2014
14.3%
4:
Number of Collisions x 1 Million
0.4%0.0% 29.4%
1,000,000365
ADT x 365 Days per Year x Number of Years
Tuesday, August 26, 2014
collision rate =
Collision Rate
Whitlock & Weinberger Transportation, Inc.10/21/2014Page 2 of 6
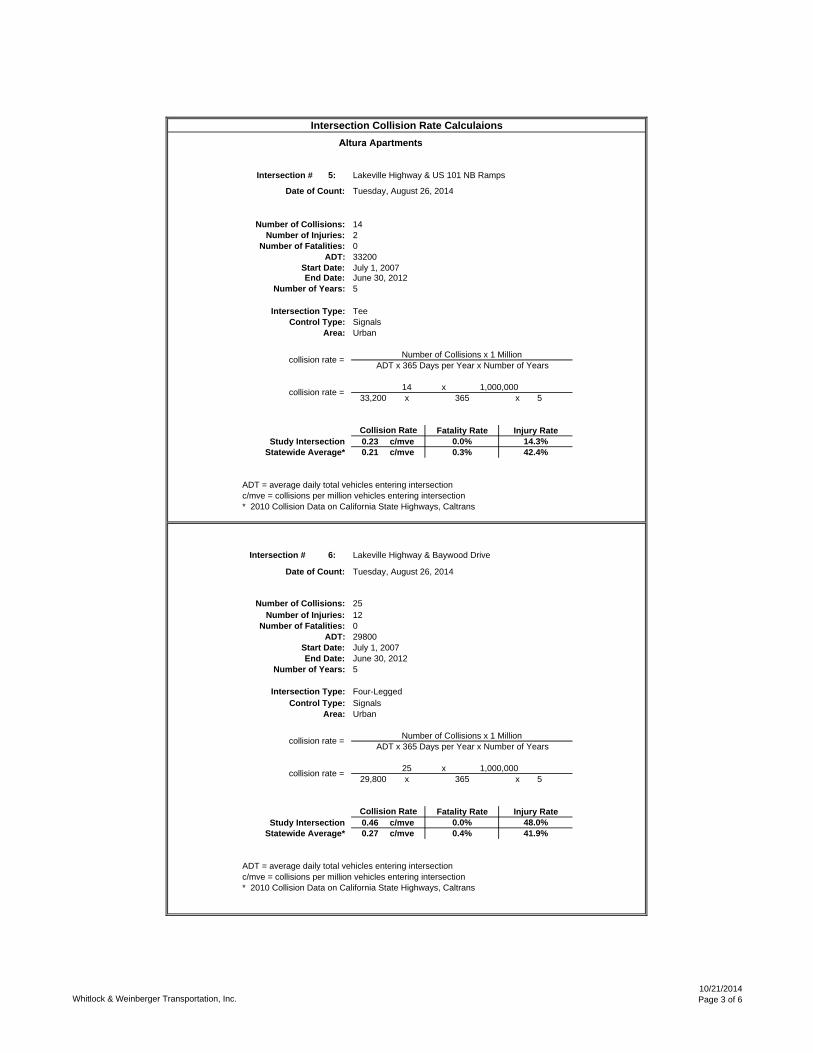
Date of Count:
Number of Collisions: 14Number of Injuries: 2
Number of Fatalities: 0ADT: 33200
Start Date: End Date:
Number of Years: 5
Intersection Type: TeeControl Type: Signals
Area: Urban
14 x33,200 x x 5
Study Intersection 0.23 c/mveStatewide Average* 0.21 c/mve
c/mve = collisions per million vehicles entering intersection* 2010 Collision Data on California State Highways, Caltrans
Date of Count:
Number of Collisions: 25Number of Injuries: 12
Number of Fatalities: 0ADT: 29800
Start Date: End Date:
Number of Years: 5
Intersection Type: Four-LeggedControl Type: Signals
Area: Urban
25 x29,800 x x 5
Study Intersection 0.46 c/mveStatewide Average* 0.27 c/mve
c/mve = collisions per million vehicles entering intersection* 2010 Collision Data on California State Highways, Caltrans
July 1, 2007June 30, 2012
collision rate =
Intersection Collision Rate CalculaionsAltura Apartments
July 1, 2007June 30, 2012
0.0%
collision rate = Number of Collisions x 1 Million
48.0%
ADT x 365 Days per Year x Number of Years
0.4% 41.9%
collision rate = 1,000,000365
ADT = average daily total vehicles entering intersection
Collision Rate Fatality Rate Injury Rate
Tuesday, August 26, 2014
Intersection # 5:
Tuesday, August 26, 2014
ADT = average daily total vehicles entering intersection
0.0%Injury Rate
14.3%
ADT x 365 Days per Year x Number of Years
collision rate = 1,000,000365
Collision Rate Fatality Rate
42.4%
Intersection # 6: Lakeville Highway & Baywood Drive
0.3%
Lakeville Highway & US 101 NB Ramps
Number of Collisions x 1 Million
Whitlock & Weinberger Transportation, Inc.10/21/2014Page 3 of 6
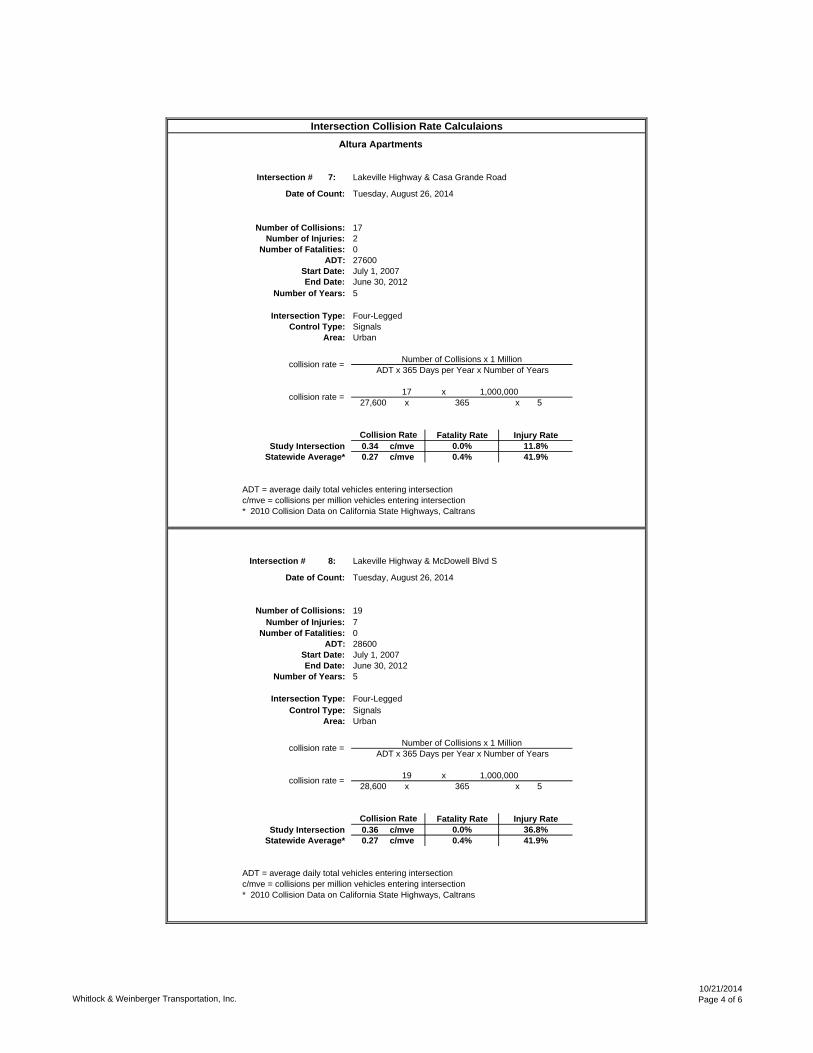
Date of Count:
Number of Collisions: 17Number of Injuries: 2
Number of Fatalities: 0ADT: 27600
Start Date: End Date:
Number of Years: 5
Intersection Type: Four-LeggedControl Type: Signals
Area: Urban
17 x27,600 x x 5
Study Intersection 0.34 c/mveStatewide Average* 0.27 c/mve
c/mve = collisions per million vehicles entering intersection* 2010 Collision Data on California State Highways, Caltrans
Date of Count:
Number of Collisions: 19Number of Injuries: 7
Number of Fatalities: 0ADT: 28600
Start Date: End Date:
Number of Years: 5
Intersection Type: Four-LeggedControl Type: Signals
Area: Urban
19 x28,600 x x 5
Study Intersection 0.36 c/mveStatewide Average* 0.27 c/mve
c/mve = collisions per million vehicles entering intersection* 2010 Collision Data on California State Highways, Caltrans
Intersection Collision Rate CalculaionsAltura Apartments
Intersection # 7: Lakeville Highway & Casa Grande Road
Tuesday, August 26, 2014
July 1, 2007June 30, 2012
collision rate = Number of Collisions x 1 MillionADT x 365 Days per Year x Number of Years
collision rate = 1,000,000365
Collision Rate Fatality Rate Injury Rate0.0% 11.8%0.4% 41.9%
ADT = average daily total vehicles entering intersection
Intersection # 8: Lakeville Highway & McDowell Blvd S
Tuesday, August 26, 2014
July 1, 2007June 30, 2012
collision rate = Number of Collisions x 1 MillionADT x 365 Days per Year x Number of Years
collision rate = 1,000,000365
Collision Rate Fatality Rate Injury Rate0.0% 36.8%0.4% 41.9%
ADT = average daily total vehicles entering intersection
Whitlock & Weinberger Transportation, Inc.10/21/2014Page 4 of 6

Date of Count:
Number of Collisions: 3Number of Injuries: 1
Number of Fatalities: 0ADT: 4600
Start Date: End Date:
Number of Years: 5
Intersection Type: Four-LeggedControl Type: Stop & Yield Controls
Area: Urban
3 x4,600 x x 5
Study Intersection 0.36 c/mveStatewide Average* 0.15 c/mve
c/mve = collisions per million vehicles entering intersection* 2010 Collision Data on California State Highways, Caltrans
Date of Count:
Number of Collisions: 1Number of Injuries: 1
Number of Fatalities: 0ADT: 7300
Start Date: End Date:
Number of Years: 5
Intersection Type: Four-LeggedControl Type: 4 Way Stop
Area: Urban
1 x7,300 x x 5
Study Intersection 0.08 c/mveStatewide Average* 0.21 c/mve
c/mve = collisions per million vehicles entering intersection* 2010 Collision Data on California State Highways, Caltrans
Intersection Collision Rate CalculaionsAltura Apartments
Intersection # 9: Baywood Drive & Perry Lane
Tuesday, August 26, 2014
July 1, 2007June 30, 2012
collision rate = Number of Collisions x 1 MillionADT x 365 Days per Year x Number of Years
collision rate = 1,000,000365
Collision Rate Fatality Rate Injury Rate0.0% 33.3%1.0% 41.9%
ADT = average daily total vehicles entering intersection
Intersection # 10: Baywood Drive & St. Francis Drive
Tuesday, August 26, 2014
July 1, 2007June 30, 2012
collision rate = Number of Collisions x 1 MillionADT x 365 Days per Year x Number of Years
collision rate = 1,000,000365
Collision Rate Fatality Rate Injury Rate0.0% 100.0%0.4% 35.6%
ADT = average daily total vehicles entering intersection
Whitlock & Weinberger Transportation, Inc.10/21/2014Page 5 of 6
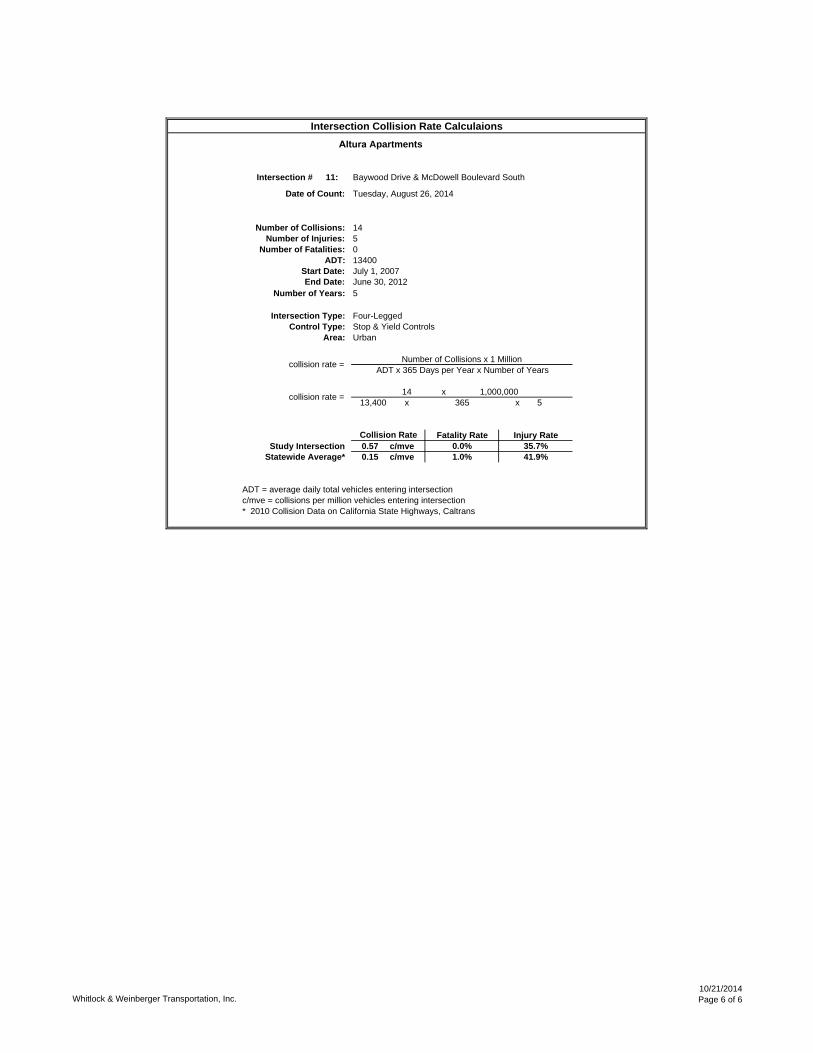
Date of Count:
Number of Collisions: 14Number of Injuries: 5
Number of Fatalities: 0ADT: 13400
Start Date: End Date:
Number of Years: 5
Intersection Type: Four-LeggedControl Type: Stop & Yield Controls
Area: Urban
14 x13,400 x x 5
Study Intersection 0.57 c/mveStatewide Average* 0.15 c/mve
c/mve = collisions per million vehicles entering intersection* 2010 Collision Data on California State Highways, Caltrans
Intersection Collision Rate CalculaionsAltura Apartments
Intersection # 11: Baywood Drive & McDowell Boulevard South
Tuesday, August 26, 2014
July 1, 2007June 30, 2012
collision rate = Number of Collisions x 1 MillionADT x 365 Days per Year x Number of Years
collision rate = 1,000,000365
Collision Rate Fatality Rate Injury Rate0.0% 35.7%1.0% 41.9%
ADT = average daily total vehicles entering intersection
Whitlock & Weinberger Transportation, Inc.10/21/2014Page 6 of 6

Traffic Impact Study for Altura Apartments in the City of Petaluma July 2015
Appendix B
Intersection Level of Service Calculations


HC
M S
igna
lized
Inte
rsec
tion
Cap
acity
Ana
lysi
s1:
Was
hing
ton
St &
Lak
evill
e S
t10
/17/20
14
Sync
hro 8
Rep
ort
Altur
a Apa
rtmen
ts Tr
affic
Impa
ct St
udy
Exist
ing A
M Pe
ak H
our -
No P
rojec
tW
-Tra
ns
Move
ment
EBL
EBT
EBR
WBL
WBT
WBR
NBL
NBT
NBR
SBL
SBT
SBR
Lane
Con
figur
ation
sVo
lume (
vph)
2814
523
226
112
7221
567
180
107
635
40Ide
al Flo
w (vp
hpl)
1900
1900
1900
1900
1900
1900
1900
1900
1900
1900
1900
1900
Total
Lost
time (
s)4.2
4.24.2
4.04.2
4.04.2
Lane
Util.
Fac
tor1.0
01.0
01.0
01.0
00.9
51.0
00.9
5Fr
pb, p
ed/bi
kes
1.00
1.00
0.99
1.00
0.98
1.00
1.00
Flpb,
ped/b
ikes
1.00
1.00
1.00
1.00
1.00
1.00
1.00
Frt
0.98
1.00
0.94
1.00
0.96
1.00
0.99
Flt P
rotec
ted0.9
90.9
51.0
00.9
51.0
00.9
51.0
0Sa
td. F
low (p
rot)
1715
1770
1643
1770
3349
1770
3499
Flt P
ermi
tted
0.99
0.95
1.00
0.95
1.00
0.95
1.00
Satd.
Flow
(per
m)17
1517
7016
4317
7033
4917
7034
99Pe
ak-h
our f
actor
, PHF
0.91
0.91
0.91
0.91
0.91
0.91
0.91
0.91
0.91
0.91
0.91
0.91
Adj. F
low (v
ph)
3115
925
248
123
7923
623
198
118
698
44RT
OR R
educ
tion (
vph)
00
00
170
020
00
30
Lane
Gro
up F
low (v
ph)
021
50
248
185
023
801
011
873
90
Confl
. Ped
s. (#
/hr)
67
76
418
184
Confl
. Bike
s (#/h
r)8
1320
12He
avy V
ehicl
es (%
)2%
10%
2%2%
11%
2%2%
2%2%
2%2%
2%Tu
rn T
ype
Split
NASp
litNA
Prot
NAPr
otNA
Prote
cted P
hase
s7
78
85
21
6Pe
rmitte
d Pha
ses
Actua
ted G
reen
, G (s
)18
.921
.321
.33.7
38.5
11.8
46.6
Effec
tive G
reen
, g (s
)18
.921
.321
.33.7
38.5
11.8
46.6
Actua
ted g/
C Ra
tio0.1
80.2
00.2
00.0
30.3
60.1
10.4
4Cl
eara
nce T
ime (
s)4.2
4.24.2
4.04.2
4.04.2
Vehic
le Ex
tensio
n (s)
2.52.5
2.52.0
4.02.0
4.0La
ne G
rp C
ap (v
ph)
302
352
326
6112
0319
515
22v/s
Rati
o Pro
tc0
.13c0
.140.1
10.0
1c0
.24c0
.070.2
1v/s
Rati
o Per
mv/c
Rati
o0.7
10.7
00.5
70.3
80.6
70.6
10.4
9Un
iform
Dela
y, d1
41.5
40.0
38.7
50.6
28.9
45.4
21.7
Prog
ress
ion F
actor
1.00
1.00
1.00
1.00
1.00
1.00
1.00
Incre
menta
l Dela
y, d2
7.25.8
1.81.4
1.53.6
0.3De
lay (s
)48
.745
.840
.652
.030
.449
.022
.0Le
vel o
f Ser
vice
DD
DD
CD
CAp
proa
ch D
elay (
s)48
.743
.531
.025
.7Ap
proa
ch LO
SD
DC
C
Inter
secti
on S
umma
ryHC
M 20
00 C
ontro
l Dela
y33
.1HC
M 20
00 Le
vel o
f Ser
vice
CHC
M 20
00 V
olume
to C
apac
ity ra
tio0.6
8Ac
tuated
Cyc
le Le
ngth
(s)
107.1
Sum
of los
t time
(s)
16.6
Inter
secti
on C
apac
ity U
tiliza
tion
69.7%
ICU
Leve
l of S
ervic
eC
Analy
sis P
eriod
(min)
15c
Criti
cal L
ane G
roup
HC
M S
igna
lized
Inte
rsec
tion
Cap
acity
Ana
lysi
s1:
Was
hing
ton
St &
Lak
evill
e S
t10
/17/20
14
Sync
hro 8
Rep
ort
Altur
a Apa
rtmen
ts Tr
affic
Impa
ct St
udy
Exist
ing P
M Pe
ak H
our -
No P
rojec
tW
-Tra
ns
Move
ment
EBL
EBT
EBR
WBL
WBT
WBR
NBL
NBT
NBR
SBL
SBT
SBR
Lane
Con
figur
ation
sVo
lume (
vph)
4695
3726
217
011
853
782
201
9779
245
Ideal
Flow
(vphp
l)19
0019
0019
0019
0019
0019
0019
0019
0019
0019
0019
0019
00To
tal Lo
st tim
e (s)
4.24.2
4.24.0
4.24.0
4.2La
ne U
til. F
actor
1.00
1.00
1.00
1.00
0.95
1.00
0.95
Frpb
, ped
/bike
s0.9
91.0
00.9
81.0
00.9
81.0
01.0
0Flp
b, pe
d/bike
s1.0
01.0
01.0
01.0
01.0
01.0
01.0
0Fr
t0.9
71.0
00.9
41.0
00.9
71.0
00.9
9Flt
Pro
tected
0.99
0.95
1.00
0.95
1.00
0.95
1.00
Satd.
Flow
(pro
t)17
3317
7016
6017
7033
5517
7035
01Flt
Per
mitte
d0.9
90.9
51.0
00.9
51.0
00.9
51.0
0Sa
td. F
low (p
erm)
1733
1770
1660
1770
3355
1770
3501
Peak
-hou
r fac
tor, P
HF0.9
60.9
60.9
60.9
60.9
60.9
60.9
60.9
60.9
60.9
60.9
60.9
6Ad
j. Flow
(vph
)48
9939
273
177
123
5581
520
910
182
547
RTOR
Red
uctio
n (vp
h)0
00
018
00
150
03
0La
ne G
roup
Flow
(vph
)0
186
027
328
20
5510
090
101
869
0Co
nfl. P
eds.
(#/hr
)28
1818
287
3232
7Co
nfl. B
ikes (
#/hr)
813
2012
Heav
y Veh
icles
(%)
2%6%
2%2%
7%2%
2%2%
2%2%
2%2%
Turn
Typ
eSp
litNA
Split
NAPr
otNA
Prot
NAPr
otecte
d Pha
ses
77
88
52
16
Perm
itted P
hase
sAc
tuated
Gre
en, G
(s)
18.1
25.5
25.5
12.6
46.2
11.3
44.9
Effec
tive G
reen
, g (s
)18
.125
.525
.512
.646
.211
.344
.9Ac
tuated
g/C
Ratio
0.15
0.22
0.22
0.11
0.39
0.10
0.38
Clea
ranc
e Tim
e (s)
4.24.2
4.24.0
4.24.0
4.2Ve
hicle
Exten
sion (
s)2.5
2.52.5
2.04.0
2.04.0
Lane
Grp
Cap
(vph
)26
638
335
918
913
1616
913
35v/s
Rati
o Pro
tc0
.110.1
5c0
.170.0
3c0
.300.0
6c0
.25v/s
Rati
o Per
mv/c
Rati
o0.7
00.7
10.7
90.2
90.7
70.6
00.6
5Un
iform
Dela
y, d1
47.2
42.7
43.5
48.4
31.1
51.0
30.0
Prog
ress
ion F
actor
1.00
1.00
1.00
1.00
1.00
1.00
1.00
Incre
menta
l Dela
y, d2
7.25.8
10.4
0.32.9
3.81.3
Delay
(s)
54.4
48.5
53.9
48.7
34.0
54.8
31.2
Leve
l of S
ervic
eD
DD
DC
DC
Appr
oach
Dela
y (s)
54.4
51.3
34.7
33.7
Appr
oach
LOS
DD
CC
Inter
secti
on S
umma
ryHC
M 20
00 C
ontro
l Dela
y39
.0HC
M 20
00 Le
vel o
f Ser
vice
DHC
M 20
00 V
olume
to C
apac
ity ra
tio0.7
6Ac
tuated
Cyc
le Le
ngth
(s)
117.7
Sum
of los
t time
(s)
16.6
Inter
secti
on C
apac
ity U
tiliza
tion
86.0%
ICU
Leve
l of S
ervic
eE
Analy
sis P
eriod
(min)
15c
Criti
cal L
ane G
roup
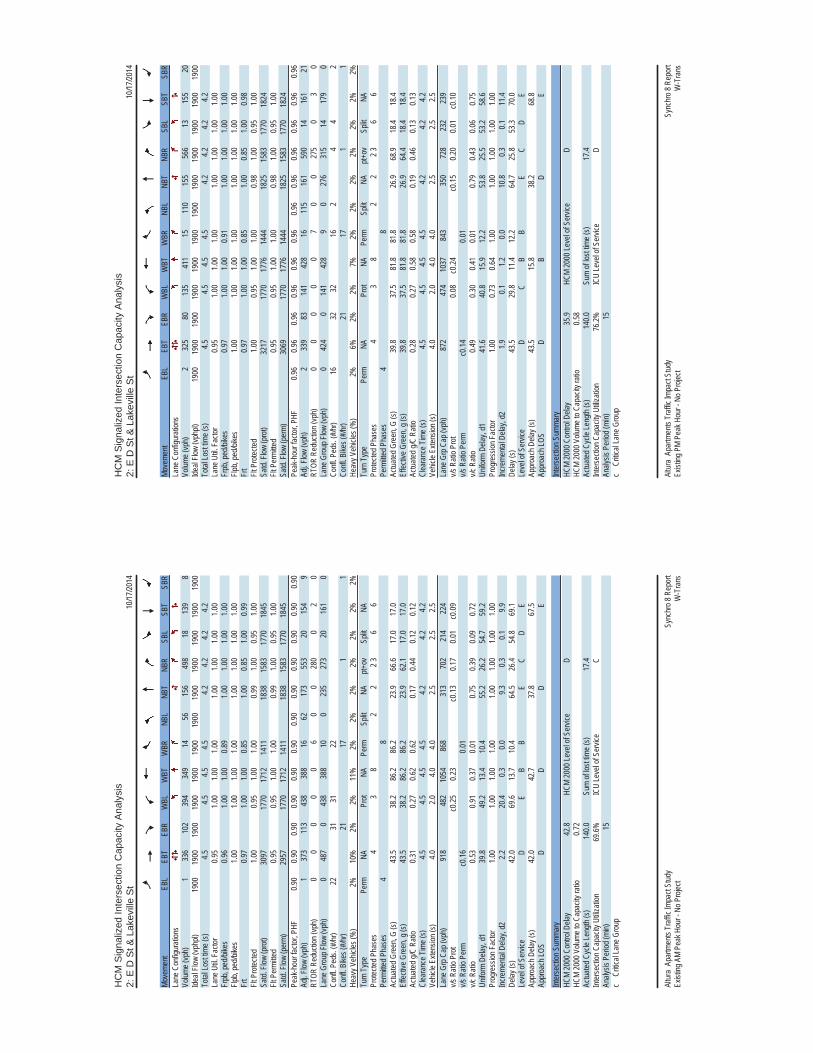
HC
M S
igna
lized
Inte
rsec
tion
Cap
acity
Ana
lysi
s2:
E D
St &
Lak
evill
e S
t10
/17/20
14
Sync
hro 8
Rep
ort
Altur
a Ap
artm
ents
Traff
ic Im
pact
Stud
y Ex
isting
AM
Peak
Hou
r - N
o Pro
ject
W-T
rans
Move
ment
EBL
EBT
EBR
WBL
WBT
WBR
NBL
NBT
NBR
SBL
SBT
SBR
Lane
Con
figur
ation
sVo
lume (
vph)
133
610
239
434
914
5615
649
818
139
8Ide
al Flo
w (vp
hpl)
1900
1900
1900
1900
1900
1900
1900
1900
1900
1900
1900
1900
Total
Lost
time (
s)4.5
4.54.5
4.54.2
4.24.2
4.2La
ne U
til. F
actor
0.95
1.00
1.00
1.00
1.00
1.00
1.00
1.00
Frpb
, ped
/bike
s0.9
61.0
01.0
00.8
91.0
01.0
01.0
01.0
0Flp
b, pe
d/bike
s1.0
01.0
01.0
01.0
01.0
01.0
01.0
01.0
0Fr
t0.9
71.0
01.0
00.8
51.0
00.8
51.0
00.9
9Flt
Pro
tected
1.00
0.95
1.00
1.00
0.99
1.00
0.95
1.00
Satd.
Flow
(pro
t)30
9717
7017
1214
1118
3815
8317
7018
45Flt
Per
mitte
d0.9
50.9
51.0
01.0
00.9
91.0
00.9
51.0
0Sa
td. F
low (p
erm)
2957
1770
1712
1411
1838
1583
1770
1845
Peak
-hou
r fac
tor, P
HF0.9
00.9
00.9
00.9
00.9
00.9
00.9
00.9
00.9
00.9
00.9
00.9
0Ad
j. Flow
(vph
)1
373
113
438
388
1662
173
553
2015
49
RTOR
Red
uctio
n (vp
h)0
00
00
60
028
00
20
Lane
Gro
up F
low (v
ph)
048
70
438
388
100
235
273
2016
10
Confl
. Ped
s. (#
/hr)
2231
3122
Confl
. Bike
s (#/h
r)21
171
1He
avy V
ehicl
es (%
)2%
10%
2%2%
11%
2%2%
2%2%
2%2%
2%Tu
rn T
ype
Perm
NAPr
otNA
Perm
Split
NApt+
ovSp
litNA
Prote
cted P
hase
s4
38
22
2 36
6Pe
rmitte
d Pha
ses
48
Actua
ted G
reen
, G (s
)43
.538
.286
.286
.223
.966
.617
.017
.0Ef
fectiv
e Gre
en, g
(s)
43.5
38.2
86.2
86.2
23.9
62.1
17.0
17.0
Actua
ted g/
C Ra
tio0.3
10.2
70.6
20.6
20.1
70.4
40.1
20.1
2Cl
eara
nce T
ime (
s)4.5
4.54.5
4.54.2
4.24.2
Vehic
le Ex
tensio
n (s)
4.02.0
4.04.0
2.52.5
2.5La
ne G
rp C
ap (v
ph)
918
482
1054
868
313
702
214
224
v/s R
atio P
rot
c0.25
0.23
c0.13
0.17
0.01
c0.09
v/s R
atio P
erm
c0.16
0.01
v/c R
atio
0.53
0.91
0.37
0.01
0.75
0.39
0.09
0.72
Unifo
rm D
elay,
d139
.849
.213
.410
.455
.226
.254
.759
.2Pr
ogre
ssion
Fac
tor1.0
01.0
01.0
01.0
01.0
01.0
01.0
01.0
0Inc
reme
ntal D
elay,
d22.2
20.4
0.30.0
9.30.3
0.19.9
Delay
(s)
42.0
69.6
13.7
10.4
64.5
26.4
54.8
69.1
Leve
l of S
ervic
eD
EB
BE
CD
EAp
proa
ch D
elay (
s)42
.042
.737
.867
.5Ap
proa
ch LO
SD
DD
E
Inter
secti
on S
umma
ryHC
M 20
00 C
ontro
l Dela
y42
.8HC
M 20
00 Le
vel o
f Ser
vice
DHC
M 20
00 V
olume
to C
apac
ity ra
tio0.7
2Ac
tuated
Cyc
le Le
ngth
(s)
140.0
Sum
of los
t time
(s)
17.4
Inter
secti
on C
apac
ity U
tiliza
tion
69.6%
ICU
Leve
l of S
ervic
eC
Analy
sis P
eriod
(min)
15c
Criti
cal L
ane G
roup
HC
M S
igna
lized
Inte
rsec
tion
Cap
acity
Ana
lysi
s2:
E D
St &
Lak
evill
e S
t10
/17/20
14
Sync
hro 8
Rep
ort
Altur
a Ap
artm
ents
Traff
ic Im
pact
Stud
y Ex
isting
PM
Peak
Hou
r - N
o Pro
ject
W-T
rans
Move
ment
EBL
EBT
EBR
WBL
WBT
WBR
NBL
NBT
NBR
SBL
SBT
SBR
Lane
Con
figur
ation
sVo
lume (
vph)
232
580
135
411
1511
015
556
613
155
20Ide
al Flo
w (vp
hpl)
1900
1900
1900
1900
1900
1900
1900
1900
1900
1900
1900
1900
Total
Lost
time (
s)4.5
4.54.5
4.54.2
4.24.2
4.2La
ne U
til. F
actor
0.95
1.00
1.00
1.00
1.00
1.00
1.00
1.00
Frpb
, ped
/bike
s0.9
71.0
01.0
00.9
11.0
01.0
01.0
01.0
0Flp
b, pe
d/bike
s1.0
01.0
01.0
01.0
01.0
01.0
01.0
01.0
0Fr
t0.9
71.0
01.0
00.8
51.0
00.8
51.0
00.9
8Flt
Pro
tected
1.00
0.95
1.00
1.00
0.98
1.00
0.95
1.00
Satd.
Flow
(pro
t)32
1717
7017
7614
4418
2515
8317
7018
24Flt
Per
mitte
d0.9
50.9
51.0
01.0
00.9
81.0
00.9
51.0
0Sa
td. F
low (p
erm)
3069
1770
1776
1444
1825
1583
1770
1824
Peak
-hou
r fac
tor, P
HF0.9
60.9
60.9
60.9
60.9
60.9
60.9
60.9
60.9
60.9
60.9
60.9
6Ad
j. Flow
(vph
)2
339
8314
142
816
115
161
590
1416
121
RTOR
Red
uctio
n (vp
h)0
00
00
70
027
50
30
Lane
Gro
up F
low (v
ph)
042
40
141
428
90
276
315
1417
90
Confl
. Ped
s. (#
/hr)
1632
3216
24
42
Confl
. Bike
s (#/h
r)21
171
1He
avy V
ehicl
es (%
)2%
6%2%
2%7%
2%2%
2%2%
2%2%
2%Tu
rn T
ype
Perm
NAPr
otNA
Perm
Split
NApt+
ovSp
litNA
Prote
cted P
hase
s4
38
22
2 36
6Pe
rmitte
d Pha
ses
48
Actua
ted G
reen
, G (s
)39
.837
.581
.881
.826
.968
.918
.418
.4Ef
fectiv
e Gre
en, g
(s)
39.8
37.5
81.8
81.8
26.9
64.4
18.4
18.4
Actua
ted g/
C Ra
tio0.2
80.2
70.5
80.5
80.1
90.4
60.1
30.1
3Cl
eara
nce T
ime (
s)4.5
4.54.5
4.54.2
4.24.2
Vehic
le Ex
tensio
n (s)
4.02.0
4.04.0
2.52.5
2.5La
ne G
rp C
ap (v
ph)
872
474
1037
843
350
728
232
239
v/s R
atio P
rot
0.08
c0.24
c0.15
0.20
0.01
c0.10
v/s R
atio P
erm
c0.14
0.01
v/c R
atio
0.49
0.30
0.41
0.01
0.79
0.43
0.06
0.75
Unifo
rm D
elay,
d141
.640
.815
.912
.253
.825
.553
.258
.6Pr
ogre
ssion
Fac
tor1.0
00.7
30.6
41.0
01.0
01.0
01.0
01.0
0Inc
reme
ntal D
elay,
d21.9
0.11.2
0.010
.80.3
0.111
.4De
lay (s
)43
.529
.811
.412
.264
.725
.853
.370
.0Le
vel o
f Ser
vice
DC
BB
EC
DE
Appr
oach
Dela
y (s)
43.5
15.8
38.2
68.8
Appr
oach
LOS
DB
DE
Inter
secti
on S
umma
ryHC
M 20
00 C
ontro
l Dela
y35
.9HC
M 20
00 Le
vel o
f Ser
vice
DHC
M 20
00 V
olume
to C
apac
ity ra
tio0.5
8Ac
tuated
Cyc
le Le
ngth
(s)
140.0
Sum
of los
t time
(s)
17.4
Inter
secti
on C
apac
ity U
tiliza
tion
76.2%
ICU
Leve
l of S
ervic
eD
Analy
sis P
eriod
(min)
15c
Criti
cal L
ane G
roup
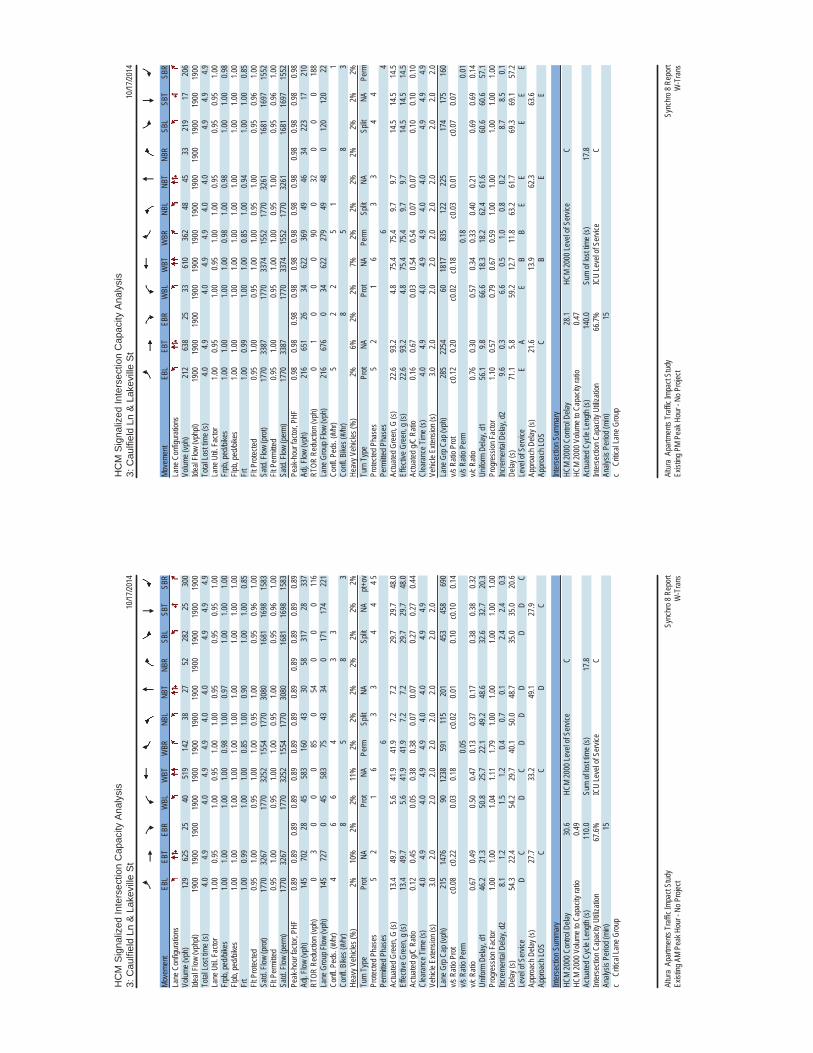
HC
M S
igna
lized
Inte
rsec
tion
Cap
acity
Ana
lysi
s3:
Cau
lfiel
d Ln
& L
akev
ille
St
10/17
/2014
Sync
hro 8
Rep
ort
Altur
a Ap
artm
ents
Traff
ic Im
pact
Stud
y Ex
isting
AM
Peak
Hou
r - N
o Pro
ject
W-T
rans
Move
ment
EBL
EBT
EBR
WBL
WBT
WBR
NBL
NBT
NBR
SBL
SBT
SBR
Lane
Con
figur
ation
sVo
lume (
vph)
129
625
2540
519
142
3827
5228
225
300
Ideal
Flow
(vphp
l)19
0019
0019
0019
0019
0019
0019
0019
0019
0019
0019
0019
00To
tal Lo
st tim
e (s)
4.04.9
4.04.9
4.94.0
4.04.9
4.94.9
Lane
Util.
Fac
tor1.0
00.9
51.0
00.9
51.0
01.0
00.9
50.9
50.9
51.0
0Fr
pb, p
ed/bi
kes
1.00
1.00
1.00
1.00
0.98
1.00
0.97
1.00
1.00
1.00
Flpb,
ped/b
ikes
1.00
1.00
1.00
1.00
1.00
1.00
1.00
1.00
1.00
1.00
Frt
1.00
0.99
1.00
1.00
0.85
1.00
0.90
1.00
1.00
0.85
Flt P
rotec
ted0.9
51.0
00.9
51.0
01.0
00.9
51.0
00.9
50.9
61.0
0Sa
td. F
low (p
rot)
1770
3267
1770
3252
1554
1770
3080
1681
1698
1583
Flt P
ermi
tted
0.95
1.00
0.95
1.00
1.00
0.95
1.00
0.95
0.96
1.00
Satd.
Flow
(per
m)17
7032
6717
7032
5215
5417
7030
8016
8116
9815
83Pe
ak-h
our f
actor
, PHF
0.89
0.89
0.89
0.89
0.89
0.89
0.89
0.89
0.89
0.89
0.89
0.89
Adj. F
low (v
ph)
145
702
2845
583
160
4330
5831
728
337
RTOR
Red
uctio
n (vp
h)0
30
00
850
540
00
116
Lane
Gro
up F
low (v
ph)
145
727
045
583
7543
340
171
174
221
Confl
. Ped
s. (#
/hr)
46
64
33
Confl
. Bike
s (#/h
r)8
58
3He
avy V
ehicl
es (%
)2%
10%
2%2%
11%
2%2%
2%2%
2%2%
2%Tu
rn T
ype
Prot
NAPr
otNA
Perm
Split
NASp
litNA
pt+ov
Prote
cted P
hase
s5
21
63
34
44 5
Perm
itted P
hase
s6
Actua
ted G
reen
, G (s
)13
.449
.75.6
41.9
41.9
7.27.2
29.7
29.7
48.0
Effec
tive G
reen
, g (s
)13
.449
.75.6
41.9
41.9
7.27.2
29.7
29.7
48.0
Actua
ted g/
C Ra
tio0.1
20.4
50.0
50.3
80.3
80.0
70.0
70.2
70.2
70.4
4Cl
eara
nce T
ime (
s)4.0
4.94.0
4.94.9
4.04.0
4.94.9
Vehic
le Ex
tensio
n (s)
3.02.0
2.02.0
2.02.0
2.02.0
2.0La
ne G
rp C
ap (v
ph)
215
1476
9012
3859
111
520
145
345
869
0v/s
Rati
o Pro
tc0
.08c0
.220.0
30.1
8c0
.020.0
10.1
0c0
.100.1
4v/s
Rati
o Per
m0.0
5v/c
Rati
o0.6
70.4
90.5
00.4
70.1
30.3
70.1
70.3
80.3
80.3
2Un
iform
Dela
y, d1
46.2
21.3
50.8
25.7
22.1
49.2
48.6
32.6
32.7
20.3
Prog
ress
ion F
actor
1.00
1.00
1.04
1.11
1.79
1.00
1.00
1.00
1.00
1.00
Incre
menta
l Dela
y, d2
8.11.2
1.51.2
0.40.7
0.12.4
2.40.3
Delay
(s)
54.3
22.4
54.2
29.7
40.1
50.0
48.7
35.0
35.0
20.6
Leve
l of S
ervic
eD
CD
CD
DD
DD
CAp
proa
ch D
elay (
s)27
.733
.249
.127
.9Ap
proa
ch LO
SC
CD
C
Inter
secti
on S
umma
ryHC
M 20
00 C
ontro
l Dela
y30
.6HC
M 20
00 Le
vel o
f Ser
vice
CHC
M 20
00 V
olume
to C
apac
ity ra
tio0.4
9Ac
tuated
Cyc
le Le
ngth
(s)
110.0
Sum
of los
t time
(s)
17.8
Inter
secti
on C
apac
ity U
tiliza
tion
67.6%
ICU
Leve
l of S
ervic
eC
Analy
sis P
eriod
(min)
15c
Criti
cal L
ane G
roup
HC
M S
igna
lized
Inte
rsec
tion
Cap
acity
Ana
lysi
s3:
Cau
lfiel
d Ln
& L
akev
ille
St
10/17
/2014
Sync
hro 8
Rep
ort
Altur
a Ap
artm
ents
Traff
ic Im
pact
Stud
y Ex
isting
PM
Peak
Hou
r - N
o Pro
ject
W-T
rans
Move
ment
EBL
EBT
EBR
WBL
WBT
WBR
NBL
NBT
NBR
SBL
SBT
SBR
Lane
Con
figur
ation
sVo
lume (
vph)
212
638
2533
610
362
4845
3321
917
206
Ideal
Flow
(vphp
l)19
0019
0019
0019
0019
0019
0019
0019
0019
0019
0019
0019
00To
tal Lo
st tim
e (s)
4.04.9
4.04.9
4.94.0
4.04.9
4.94.9
Lane
Util.
Fac
tor1.0
00.9
51.0
00.9
51.0
01.0
00.9
50.9
50.9
51.0
0Fr
pb, p
ed/bi
kes
1.00
1.00
1.00
1.00
0.98
1.00
0.98
1.00
1.00
0.98
Flpb,
ped/b
ikes
1.00
1.00
1.00
1.00
1.00
1.00
1.00
1.00
1.00
1.00
Frt
1.00
0.99
1.00
1.00
0.85
1.00
0.94
1.00
1.00
0.85
Flt P
rotec
ted0.9
51.0
00.9
51.0
01.0
00.9
51.0
00.9
50.9
61.0
0Sa
td. F
low (p
rot)
1770
3387
1770
3374
1552
1770
3261
1681
1697
1552
Flt P
ermi
tted
0.95
1.00
0.95
1.00
1.00
0.95
1.00
0.95
0.96
1.00
Satd.
Flow
(per
m)17
7033
8717
7033
7415
5217
7032
6116
8116
9715
52Pe
ak-h
our f
actor
, PHF
0.98
0.98
0.98
0.98
0.98
0.98
0.98
0.98
0.98
0.98
0.98
0.98
Adj. F
low (v
ph)
216
651
2634
622
369
4946
3422
317
210
RTOR
Red
uctio
n (vp
h)0
10
00
900
320
00
188
Lane
Gro
up F
low (v
ph)
216
676
034
622
279
4948
012
012
022
Confl
. Ped
s. (#
/hr)
52
25
11
Confl
. Bike
s (#/h
r)8
58
3He
avy V
ehicl
es (%
)2%
6%2%
2%7%
2%2%
2%2%
2%2%
2%Tu
rn T
ype
Prot
NAPr
otNA
Perm
Split
NASp
litNA
Perm
Prote
cted P
hase
s5
21
63
34
4Pe
rmitte
d Pha
ses
64
Actua
ted G
reen
, G (s
)22
.693
.24.8
75.4
75.4
9.79.7
14.5
14.5
14.5
Effec
tive G
reen
, g (s
)22
.693
.24.8
75.4
75.4
9.79.7
14.5
14.5
14.5
Actua
ted g/
C Ra
tio0.1
60.6
70.0
30.5
40.5
40.0
70.0
70.1
00.1
00.1
0Cl
eara
nce T
ime (
s)4.0
4.94.0
4.94.9
4.04.0
4.94.9
4.9Ve
hicle
Exten
sion (
s)3.0
2.02.0
2.02.0
2.02.0
2.02.0
2.0La
ne G
rp C
ap (v
ph)
285
2254
6018
1783
512
222
517
417
516
0v/s
Rati
o Pro
tc0
.120.2
0c0
.02c0
.18c0
.030.0
1c0
.070.0
7v/s
Rati
o Per
m0.1
80.0
1v/c
Rati
o0.7
60.3
00.5
70.3
40.3
30.4
00.2
10.6
90.6
90.1
4Un
iform
Dela
y, d1
56.1
9.866
.618
.318
.262
.461
.660
.660
.657
.1Pr
ogre
ssion
Fac
tor1.1
00.5
70.7
90.6
70.5
91.0
01.0
01.0
01.0
01.0
0Inc
reme
ntal D
elay,
d29.6
0.36.6
0.51.0
0.80.2
8.78.5
0.1De
lay (s
)71
.15.8
59.2
12.7
11.8
63.2
61.7
69.3
69.1
57.2
Leve
l of S
ervic
eE
AE
BB
EE
EE
EAp
proa
ch D
elay (
s)21
.613
.962
.363
.6Ap
proa
ch LO
SC
BE
E
Inter
secti
on S
umma
ryHC
M 20
00 C
ontro
l Dela
y28
.1HC
M 20
00 Le
vel o
f Ser
vice
CHC
M 20
00 V
olume
to C
apac
ity ra
tio0.4
7Ac
tuated
Cyc
le Le
ngth
(s)
140.0
Sum
of los
t time
(s)
17.8
Inter
secti
on C
apac
ity U
tiliza
tion
66.7%
ICU
Leve
l of S
ervic
eC
Analy
sis P
eriod
(min)
15c
Criti
cal L
ane G
roup
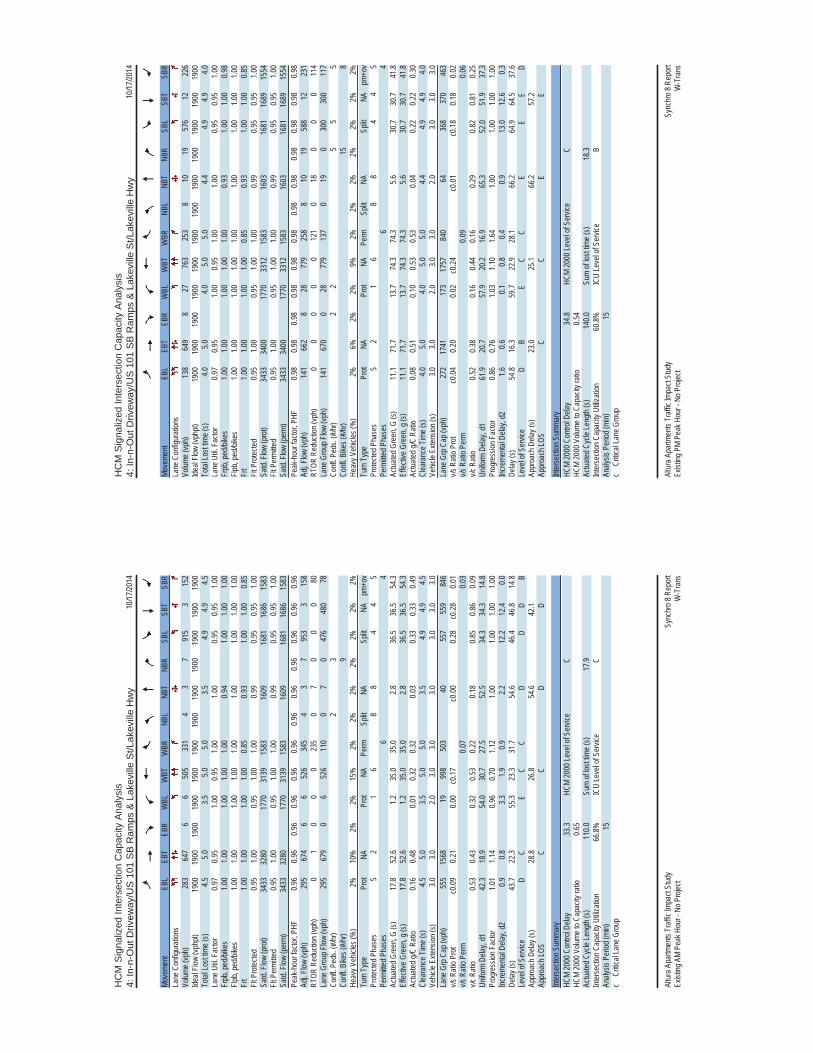
HC
M S
igna
lized
Inte
rsec
tion
Cap
acity
Ana
lysi
s4:
In-n
-Out
Driv
eway
/US
101
SB
Ram
ps &
Lak
evill
e S
t/Lak
evill
e H
wy
10/17
/2014
Sync
hro 8
Rep
ort
Altur
a Apa
rtmen
ts Tr
affic
Impa
ct St
udy
Exist
ing A
M Pe
ak H
our -
No P
rojec
tW
-Tra
ns
Move
ment
EBL
EBT
EBR
WBL
WBT
WBR
NBL
NBT
NBR
SBL
SBT
SBR
Lane
Con
figur
ation
sVo
lume (
vph)
283
647
66
505
331
43
791
53
152
Ideal
Flow
(vphp
l)19
0019
0019
0019
0019
0019
0019
0019
0019
0019
0019
0019
00To
tal Lo
st tim
e (s)
4.55.0
3.55.0
5.03.5
4.94.9
4.5La
ne U
til. F
actor
0.97
0.95
1.00
0.95
1.00
1.00
0.95
0.95
1.00
Frpb
, ped
/bike
s1.0
01.0
01.0
01.0
01.0
00.9
41.0
01.0
01.0
0Flp
b, pe
d/bike
s1.0
01.0
01.0
01.0
01.0
01.0
01.0
01.0
01.0
0Fr
t1.0
01.0
01.0
01.0
00.8
50.9
31.0
01.0
00.8
5Flt
Pro
tected
0.95
1.00
0.95
1.00
1.00
0.99
0.95
0.95
1.00
Satd.
Flow
(pro
t)34
3332
8017
7031
3915
8316
0916
8116
8615
83Flt
Per
mitte
d0.9
51.0
00.9
51.0
01.0
00.9
90.9
50.9
51.0
0Sa
td. F
low (p
erm)
3433
3280
1770
3139
1583
1609
1681
1686
1583
Peak
-hou
r fac
tor, P
HF0.9
60.9
60.9
60.9
60.9
60.9
60.9
60.9
60.9
60.9
60.9
60.9
6Ad
j. Flow
(vph
)29
567
46
652
634
54
37
953
315
8RT
OR R
educ
tion (
vph)
01
00
023
50
70
00
80La
ne G
roup
Flow
(vph
)29
567
90
652
611
00
70
476
480
78Co
nfl. P
eds.
(#/hr
)2
3Co
nfl. B
ikes (
#/hr)
9He
avy V
ehicl
es (%
)2%
10%
2%2%
15%
2%2%
2%2%
2%2%
2%Tu
rn T
ype
Prot
NAPr
otNA
Perm
Split
NASp
litNA
pm+o
vPr
otecte
d Pha
ses
52
16
88
44
5Pe
rmitte
d Pha
ses
64
Actua
ted G
reen
, G (s
)17
.852
.61.2
35.0
35.0
2.836
.536
.554
.3Ef
fectiv
e Gre
en, g
(s)
17.8
52.6
1.235
.035
.02.8
36.5
36.5
54.3
Actua
ted g/
C Ra
tio0.1
60.4
80.0
10.3
20.3
20.0
30.3
30.3
30.4
9Cl
eara
nce T
ime (
s)4.5
5.03.5
5.05.0
3.54.9
4.94.5
Vehic
le Ex
tensio
n (s)
3.03.0
2.03.0
3.03.0
3.03.0
3.0La
ne G
rp C
ap (v
ph)
555
1568
1999
850
340
557
559
846
v/s R
atio P
rot
c0.09
0.21
0.00
c0.17
c0.00
0.28
c0.28
0.01
v/s R
atio P
erm
0.07
0.03
v/c R
atio
0.53
0.43
0.32
0.53
0.22
0.18
0.85
0.86
0.09
Unifo
rm D
elay,
d142
.318
.954
.030
.727
.552
.534
.334
.314
.8Pr
ogre
ssion
Fac
tor1.0
11.1
40.9
60.7
01.1
21.0
01.0
01.0
01.0
0Inc
reme
ntal D
elay,
d20.9
0.83.3
1.90.9
2.212
.212
.40.0
Delay
(s)
43.7
22.3
55.3
23.3
31.7
54.6
46.4
46.8
14.8
Leve
l of S
ervic
eD
CE
CC
DD
DB
Appr
oach
Dela
y (s)
28.8
26.8
54.6
42.1
Appr
oach
LOS
CC
DD
Inter
secti
on S
umma
ryHC
M 20
00 C
ontro
l Dela
y33
.3HC
M 20
00 Le
vel o
f Ser
vice
CHC
M 20
00 V
olume
to C
apac
ity ra
tio0.6
5Ac
tuated
Cyc
le Le
ngth
(s)
110.0
Sum
of los
t time
(s)
17.9
Inter
secti
on C
apac
ity U
tiliza
tion
66.8%
ICU
Leve
l of S
ervic
eC
Analy
sis P
eriod
(min)
15c
Criti
cal L
ane G
roup
HC
M S
igna
lized
Inte
rsec
tion
Cap
acity
Ana
lysi
s4:
In-n
-Out
Driv
eway
/US
101
SB
Ram
ps &
Lak
evill
e S
t/Lak
evill
e H
wy
10/17
/2014
Sync
hro 8
Rep
ort
Altur
a Apa
rtmen
ts Tr
affic
Impa
ct St
udy
Exist
ing P
M Pe
ak H
our -
No P
rojec
tW
-Tra
ns
Move
ment
EBL
EBT
EBR
WBL
WBT
WBR
NBL
NBT
NBR
SBL
SBT
SBR
Lane
Con
figur
ation
sVo
lume (
vph)
138
649
827
763
253
810
1957
612
226
Ideal
Flow
(vphp
l)19
0019
0019
0019
0019
0019
0019
0019
0019
0019
0019
0019
00To
tal Lo
st tim
e (s)
4.05.0
4.05.0
5.04.4
4.94.9
4.0La
ne U
til. F
actor
0.97
0.95
1.00
0.95
1.00
1.00
0.95
0.95
1.00
Frpb
, ped
/bike
s1.0
01.0
01.0
01.0
01.0
00.9
31.0
01.0
00.9
8Flp
b, pe
d/bike
s1.0
01.0
01.0
01.0
01.0
01.0
01.0
01.0
01.0
0Fr
t1.0
01.0
01.0
01.0
00.8
50.9
31.0
01.0
00.8
5Flt
Pro
tected
0.95
1.00
0.95
1.00
1.00
0.99
0.95
0.95
1.00
Satd.
Flow
(pro
t)34
3334
0017
7033
1215
8316
0316
8116
8915
54Flt
Per
mitte
d0.9
51.0
00.9
51.0
01.0
00.9
90.9
50.9
51.0
0Sa
td. F
low (p
erm)
3433
3400
1770
3312
1583
1603
1681
1689
1554
Peak
-hou
r fac
tor, P
HF0.9
80.9
80.9
80.9
80.9
80.9
80.9
80.9
80.9
80.9
80.9
80.9
8Ad
j. Flow
(vph
)14
166
28
2877
925
88
1019
588
1223
1RT
OR R
educ
tion (
vph)
00
00
012
10
180
00
114
Lane
Gro
up F
low (v
ph)
141
670
028
779
137
019
030
030
011
7Co
nfl. P
eds.
(#/hr
)2
25
55
Confl
. Bike
s (#/h
r)15
8He
avy V
ehicl
es (%
)2%
6%2%
2%9%
2%2%
2%2%
2%2%
2%Tu
rn T
ype
Prot
NAPr
otNA
Perm
Split
NASp
litNA
pm+o
vPr
otecte
d Pha
ses
52
16
88
44
5Pe
rmitte
d Pha
ses
64
Actua
ted G
reen
, G (s
)11
.171
.713
.774
.374
.35.6
30.7
30.7
41.8
Effec
tive G
reen
, g (s
)11
.171
.713
.774
.374
.35.6
30.7
30.7
41.8
Actua
ted g/
C Ra
tio0.0
80.5
10.1
00.5
30.5
30.0
40.2
20.2
20.3
0Cl
eara
nce T
ime (
s)4.0
5.04.0
5.05.0
4.44.9
4.94.0
Vehic
le Ex
tensio
n (s)
3.03.0
2.03.0
3.02.0
3.03.0
3.0La
ne G
rp C
ap (v
ph)
272
1741
173
1757
840
6436
837
046
3v/s
Rati
o Pro
tc0
.040.2
00.0
2c0
.24c0
.01c0
.180.1
80.0
2v/s
Rati
o Per
m0.0
90.0
6v/c
Rati
o0.5
20.3
80.1
60.4
40.1
60.2
90.8
20.8
10.2
5Un
iform
Dela
y, d1
61.9
20.7
57.9
20.2
16.9
65.3
52.0
51.9
37.3
Prog
ress
ion F
actor
0.86
0.76
1.03
1.10
1.64
1.00
1.00
1.00
1.00
Incre
menta
l Dela
y, d2
1.60.6
0.10.8
0.40.9
13.0
12.6
0.3De
lay (s
)54
.816
.359
.722
.928
.166
.264
.964
.537
.6Le
vel o
f Ser
vice
DB
EC
CE
EE
DAp
proa
ch D
elay (
s)23
.025
.166
.257
.2Ap
proa
ch LO
SC
CE
E
Inter
secti
on S
umma
ryHC
M 20
00 C
ontro
l Dela
y34
.8HC
M 20
00 Le
vel o
f Ser
vice
CHC
M 20
00 V
olume
to C
apac
ity ra
tio0.5
4Ac
tuated
Cyc
le Le
ngth
(s)
140.0
Sum
of los
t time
(s)
18.3
Inter
secti
on C
apac
ity U
tiliza
tion
60.8%
ICU
Leve
l of S
ervic
eB
Analy
sis P
eriod
(min)
15c
Criti
cal L
ane G
roup

HC
M S
igna
lized
Inte
rsec
tion
Cap
acity
Ana
lysi
s5:
Lak
evill
e H
wy
& U
S 1
01 N
B R
amps
10/17
/2014
Sync
hro 8
Rep
ort
Altur
a Ap
artm
ents
Traff
ic Im
pact
Stud
y Ex
isting
AM
Peak
Hou
r - N
o Pro
ject
W-T
rans
Move
ment
EBL
EBT
WBT
WBR
SBL
SBR
Lane
Con
figur
ation
sVo
lume (
vph)
7114
7176
568
830
210
2Ide
al Flo
w (vp
hpl)
1900
1900
1900
1900
1900
1900
Total
Lost
time (
s)4.0
5.05.0
5.04.4
4.4La
ne U
til. F
actor
1.00
0.95
0.95
1.00
0.97
1.00
Frpb
, ped
/bike
s1.0
01.0
01.0
00.9
81.0
01.0
0Flp
b, pe
d/bike
s1.0
01.0
01.0
01.0
01.0
01.0
0Fr
t1.0
01.0
01.0
00.8
51.0
00.8
5Flt
Pro
tected
0.95
1.00
1.00
1.00
0.95
1.00
Satd.
Flow
(pro
t)17
7031
1231
3915
4734
3315
83Flt
Per
mitte
d0.9
51.0
01.0
01.0
00.9
51.0
0Sa
td. F
low (p
erm)
1770
3112
3139
1547
3433
1583
Peak
-hou
r fac
tor, P
HF0.9
50.9
50.9
50.9
50.9
50.9
5Ad
j. Flow
(vph
)75
1548
805
724
318
107
RTOR
Red
uctio
n (vp
h)0
00
248
079
Lane
Gro
up F
low (v
ph)
7515
4880
547
631
828
Confl
. Ped
s. (#
/hr)
44
42
Heav
y Veh
icles
(%)
2%16
%15
%2%
2%2%
Turn
Typ
ePr
otNA
NAPe
rmPr
otpt+
ovPr
otecte
d Pha
ses
52
64
4 5Pe
rmitte
d Pha
ses
6Ac
tuated
Gre
en, G
(s)
9.786
.072
.372
.314
.628
.7Ef
fectiv
e Gre
en, g
(s)
9.786
.072
.372
.314
.628
.7Ac
tuated
g/C
Ratio
0.09
0.78
0.66
0.66
0.13
0.26
Clea
ranc
e Tim
e (s)
4.05.0
5.05.0
4.4Ve
hicle
Exten
sion (
s)2.0
3.03.0
3.02.0
Lane
Grp
Cap
(vph
)15
624
3320
6310
1645
541
3v/s
Rati
o Pro
t0.0
4c0
.500.2
6c0
.090.0
2v/s
Rati
o Per
m0.3
1v/c
Rati
o0.4
80.6
40.3
90.4
70.7
00.0
7Un
iform
Dela
y, d1
47.8
5.28.7
9.345
.630
.6Pr
ogre
ssion
Fac
tor1.1
31.0
50.5
20.0
01.0
01.0
0Inc
reme
ntal D
elay,
d20.7
1.00.5
1.33.8
0.0De
lay (s
)54
.56.5
5.01.4
49.4
30.6
Leve
l of S
ervic
eD
AA
AD
CAp
proa
ch D
elay (
s)8.8
3.344
.6Ap
proa
ch LO
SA
AD
Inter
secti
on S
umma
ryHC
M 20
00 C
ontro
l Dela
y10
.7HC
M 20
00 Le
vel o
f Ser
vice
BHC
M 20
00 V
olume
to C
apac
ity ra
tio0.6
7Ac
tuated
Cyc
le Le
ngth
(s)
110.0
Sum
of los
t time
(s)
13.4
Inter
secti
on C
apac
ity U
tiliza
tion
58.0%
ICU
Leve
l of S
ervic
eB
Analy
sis P
eriod
(min)
15c
Criti
cal L
ane G
roup
HC
M S
igna
lized
Inte
rsec
tion
Cap
acity
Ana
lysi
s5:
Lak
evill
e H
wy
& U
S 1
01 N
B R
amps
10/17
/2014
Sync
hro 8
Rep
ort
Altur
a Apa
rtmen
ts Tr
affic
Impa
ct St
udy
Exist
ing P
M Pe
ak H
our -
No P
rojec
tW
-Tra
ns
Move
ment
EBL
EBT
WBT
WBR
SBL
SBR
Lane
Con
figur
ation
sVo
lume (
vph)
114
1108
718
833
241
305
Ideal
Flow
(vphp
l)19
0019
0019
0019
0019
0019
00To
tal Lo
st tim
e (s)
4.05.0
5.05.0
4.54.5
Lane
Util.
Fac
tor1.0
00.9
50.9
51.0
00.9
71.0
0Fr
pb, p
ed/bi
kes
1.00
1.00
1.00
0.98
1.00
1.00
Flpb,
ped/b
ikes
1.00
1.00
1.00
1.00
1.00
1.00
Frt
1.00
1.00
1.00
0.85
1.00
0.85
Flt P
rotec
ted0.9
51.0
01.0
01.0
00.9
51.0
0Sa
td. F
low (p
rot)
1770
3374
3312
1550
3433
1583
Flt P
ermi
tted
0.95
1.00
1.00
1.00
0.95
1.00
Satd.
Flow
(per
m)17
7033
7433
1215
5034
3315
83Pe
ak-h
our f
actor
, PHF
0.97
0.97
0.97
0.97
0.97
0.97
Adj. F
low (v
ph)
118
1142
740
859
248
314
RTOR
Red
uctio
n (vp
h)0
00
417
015
Lane
Gro
up F
low (v
ph)
118
1142
740
442
248
299
Confl
. Ped
s. (#
/hr)
11
33
Heav
y Veh
icles
(%)
2%7%
9%2%
2%2%
Turn
Typ
ePr
otNA
NAPe
rmPr
otpt+
ovPr
otecte
d Pha
ses
52
64
4 5Pe
rmitte
d Pha
ses
6Ac
tuated
Gre
en, G
(s)
9.849
.836
.036
.010
.724
.5Ef
fectiv
e Gre
en, g
(s)
9.849
.836
.036
.010
.720
.5Ac
tuated
g/C
Ratio
0.14
0.71
0.51
0.51
0.15
0.29
Clea
ranc
e Tim
e (s)
4.05.0
5.05.0
4.5Ve
hicle
Exten
sion (
s)2.0
3.03.0
3.02.0
Lane
Grp
Cap
(vph
)24
724
0017
0379
752
446
3v/s
Rati
o Pro
t0.0
70.3
40.2
20.0
7c0
.19v/s
Rati
o Per
mc0
.28v/c
Rati
o0.4
80.4
80.4
30.5
50.4
70.6
5Un
iform
Dela
y, d1
27.7
4.410
.611
.527
.121
.6Pr
ogre
ssion
Fac
tor1.1
21.8
60.9
27.8
31.0
01.0
0Inc
reme
ntal D
elay,
d20.5
0.60.7
2.30.2
2.3De
lay (s
)31
.68.8
10.4
92.8
27.3
23.9
Leve
l of S
ervic
eC
AB
FC
CAp
proa
ch D
elay (
s)10
.954
.725
.4Ap
proa
ch LO
SB
DC
Inter
secti
on S
umma
ryHC
M 20
00 C
ontro
l Dela
y33
.8HC
M 20
00 Le
vel o
f Ser
vice
CHC
M 20
00 V
olume
to C
apac
ity ra
tio0.5
9Ac
tuated
Cyc
le Le
ngth
(s)
70.0
Sum
of los
t time
(s)
13.5
Inter
secti
on C
apac
ity U
tiliza
tion
65.9%
ICU
Leve
l of S
ervic
eC
Analy
sis P
eriod
(min)
15c
Criti
cal L
ane G
roup
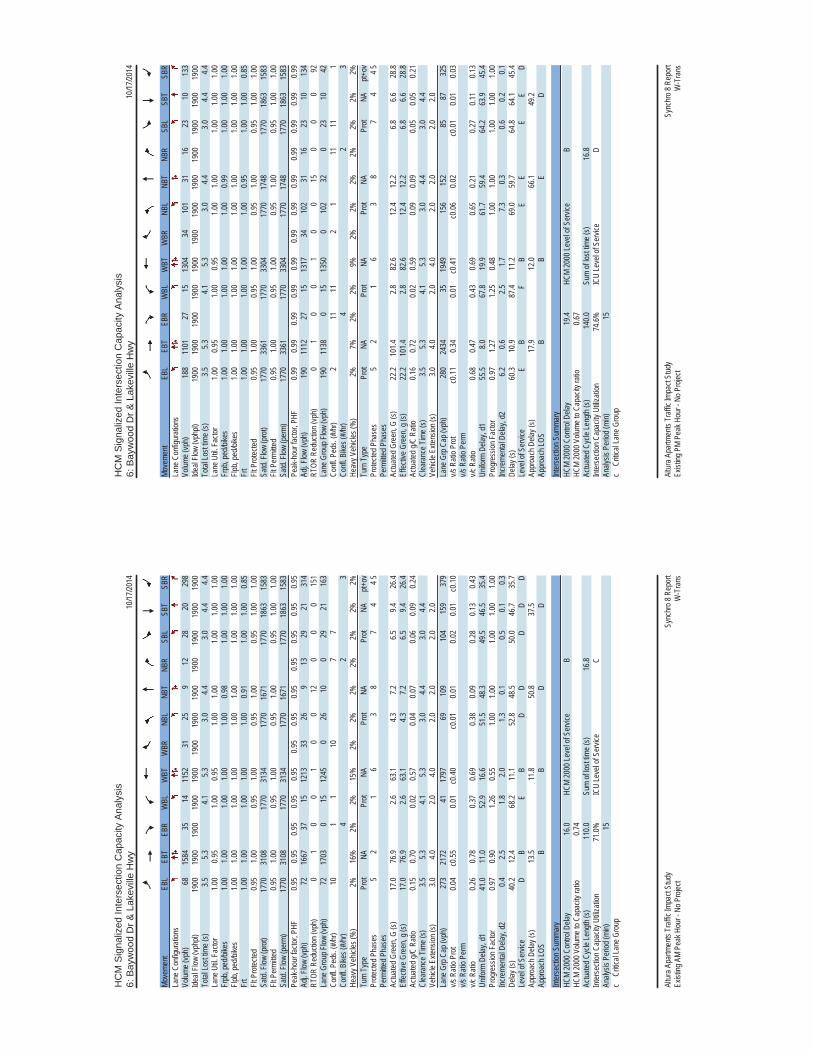
HC
M S
igna
lized
Inte
rsec
tion
Cap
acity
Ana
lysi
s6:
Bay
woo
d D
r & L
akev
ille
Hw
y10
/17/20
14
Sync
hro 8
Rep
ort
Altur
a Apa
rtmen
ts Tr
affic
Impa
ct St
udy
Exist
ing A
M Pe
ak H
our -
No P
rojec
tW
-Tra
ns
Move
ment
EBL
EBT
EBR
WBL
WBT
WBR
NBL
NBT
NBR
SBL
SBT
SBR
Lane
Con
figur
ation
sVo
lume (
vph)
6815
8435
1411
5231
259
1228
2029
8Ide
al Flo
w (vp
hpl)
1900
1900
1900
1900
1900
1900
1900
1900
1900
1900
1900
1900
Total
Lost
time (
s)3.5
5.34.1
5.33.0
4.43.0
4.44.4
Lane
Util.
Fac
tor1.0
00.9
51.0
00.9
51.0
01.0
01.0
01.0
01.0
0Fr
pb, p
ed/bi
kes
1.00
1.00
1.00
1.00
1.00
0.98
1.00
1.00
1.00
Flpb,
ped/b
ikes
1.00
1.00
1.00
1.00
1.00
1.00
1.00
1.00
1.00
Frt
1.00
1.00
1.00
1.00
1.00
0.91
1.00
1.00
0.85
Flt P
rotec
ted0.9
51.0
00.9
51.0
00.9
51.0
00.9
51.0
01.0
0Sa
td. F
low (p
rot)
1770
3108
1770
3134
1770
1671
1770
1863
1583
Flt P
ermi
tted
0.95
1.00
0.95
1.00
0.95
1.00
0.95
1.00
1.00
Satd.
Flow
(per
m)17
7031
0817
7031
3417
7016
7117
7018
6315
83Pe
ak-h
our f
actor
, PHF
0.95
0.95
0.95
0.95
0.95
0.95
0.95
0.95
0.95
0.95
0.95
0.95
Adj. F
low (v
ph)
7216
6737
1512
1333
269
1329
2131
4RT
OR R
educ
tion (
vph)
01
00
10
012
00
015
1La
ne G
roup
Flow
(vph
)72
1703
015
1245
026
100
2921
163
Confl
. Ped
s. (#
/hr)
101
110
77
Confl
. Bike
s (#/h
r)4
23
Heav
y Veh
icles
(%)
2%16
%2%
2%15
%2%
2%2%
2%2%
2%2%
Turn
Typ
ePr
otNA
Prot
NAPr
otNA
Prot
NApt+
ovPr
otecte
d Pha
ses
52
16
38
74
4 5Pe
rmitte
d Pha
ses
Actua
ted G
reen
, G (s
)17
.076
.92.6
63.1
4.37.2
6.59.4
26.4
Effec
tive G
reen
, g (s
)17
.076
.92.6
63.1
4.37.2
6.59.4
26.4
Actua
ted g/
C Ra
tio0.1
50.7
00.0
20.5
70.0
40.0
70.0
60.0
90.2
4Cl
eara
nce T
ime (
s)3.5
5.34.1
5.33.0
4.43.0
4.4Ve
hicle
Exten
sion (
s)3.0
4.02.0
4.02.0
2.02.0
2.0La
ne G
rp C
ap (v
ph)
273
2172
4117
9769
109
104
159
379
v/s R
atio P
rot
0.04
c0.55
0.01
c0.40
c0.01
0.01
0.02
0.01
c0.10
v/s R
atio P
erm
v/c R
atio
0.26
0.78
0.37
0.69
0.38
0.09
0.28
0.13
0.43
Unifo
rm D
elay,
d141
.011
.052
.916
.651
.548
.349
.546
.535
.4Pr
ogre
ssion
Fac
tor0.9
70.9
01.2
60.5
51.0
01.0
01.0
01.0
01.0
0Inc
reme
ntal D
elay,
d20.4
2.51.8
2.01.3
0.10.5
0.10.3
Delay
(s)
40.2
12.4
68.2
11.1
52.8
48.5
50.0
46.7
35.7
Leve
l of S
ervic
eD
BE
BD
DD
DD
Appr
oach
Dela
y (s)
13.5
11.8
50.8
37.5
Appr
oach
LOS
BB
DD
Inter
secti
on S
umma
ryHC
M 20
00 C
ontro
l Dela
y16
.0HC
M 20
00 Le
vel o
f Ser
vice
BHC
M 20
00 V
olume
to C
apac
ity ra
tio0.7
4Ac
tuated
Cyc
le Le
ngth
(s)
110.0
Sum
of los
t time
(s)
16.8
Inter
secti
on C
apac
ity U
tiliza
tion
71.0%
ICU
Leve
l of S
ervic
eC
Analy
sis P
eriod
(min)
15c
Criti
cal L
ane G
roup
HC
M S
igna
lized
Inte
rsec
tion
Cap
acity
Ana
lysi
s6:
Bay
woo
d D
r & L
akev
ille
Hw
y10
/17/20
14
Sync
hro 8
Rep
ort
Altur
a Apa
rtmen
ts Tr
affic
Impa
ct St
udy
Exist
ing P
M Pe
ak H
our -
No P
rojec
tW
-Tra
ns
Move
ment
EBL
EBT
EBR
WBL
WBT
WBR
NBL
NBT
NBR
SBL
SBT
SBR
Lane
Con
figur
ation
sVo
lume (
vph)
188
1101
2715
1304
3410
131
1623
1013
3Ide
al Flo
w (vp
hpl)
1900
1900
1900
1900
1900
1900
1900
1900
1900
1900
1900
1900
Total
Lost
time (
s)3.5
5.34.1
5.33.0
4.43.0
4.44.4
Lane
Util.
Fac
tor1.0
00.9
51.0
00.9
51.0
01.0
01.0
01.0
01.0
0Fr
pb, p
ed/bi
kes
1.00
1.00
1.00
1.00
1.00
0.99
1.00
1.00
1.00
Flpb,
ped/b
ikes
1.00
1.00
1.00
1.00
1.00
1.00
1.00
1.00
1.00
Frt
1.00
1.00
1.00
1.00
1.00
0.95
1.00
1.00
0.85
Flt P
rotec
ted0.9
51.0
00.9
51.0
00.9
51.0
00.9
51.0
01.0
0Sa
td. F
low (p
rot)
1770
3361
1770
3304
1770
1748
1770
1863
1583
Flt P
ermi
tted
0.95
1.00
0.95
1.00
0.95
1.00
0.95
1.00
1.00
Satd.
Flow
(per
m)17
7033
6117
7033
0417
7017
4817
7018
6315
83Pe
ak-h
our f
actor
, PHF
0.99
0.99
0.99
0.99
0.99
0.99
0.99
0.99
0.99
0.99
0.99
0.99
Adj. F
low (v
ph)
190
1112
2715
1317
3410
231
1623
1013
4RT
OR R
educ
tion (
vph)
01
00
10
015
00
092
Lane
Gro
up F
low (v
ph)
190
1138
015
1350
010
232
023
1042
Confl
. Ped
s. (#
/hr)
211
112
111
111
Confl
. Bike
s (#/h
r)4
23
Heav
y Veh
icles
(%)
2%7%
2%2%
9%2%
2%2%
2%2%
2%2%
Turn
Typ
ePr
otNA
Prot
NAPr
otNA
Prot
NApt+
ovPr
otecte
d Pha
ses
52
16
38
74
4 5Pe
rmitte
d Pha
ses
Actua
ted G
reen
, G (s
)22
.210
1.42.8
82.6
12.4
12.2
6.86.6
28.8
Effec
tive G
reen
, g (s
)22
.210
1.42.8
82.6
12.4
12.2
6.86.6
28.8
Actua
ted g/
C Ra
tio0.1
60.7
20.0
20.5
90.0
90.0
90.0
50.0
50.2
1Cl
eara
nce T
ime (
s)3.5
5.34.1
5.33.0
4.43.0
4.4Ve
hicle
Exten
sion (
s)3.0
4.02.0
4.02.0
2.02.0
2.0La
ne G
rp C
ap (v
ph)
280
2434
3519
4915
615
285
8732
5v/s
Rati
o Pro
tc0
.110.3
40.0
1c0
.41c0
.060.0
2c0
.010.0
10.0
3v/s
Rati
o Per
mv/c
Rati
o0.6
80.4
70.4
30.6
90.6
50.2
10.2
70.1
10.1
3Un
iform
Dela
y, d1
55.5
8.067
.819
.961
.759
.464
.263
.945
.4Pr
ogre
ssion
Fac
tor0.9
71.2
71.2
50.4
81.0
01.0
01.0
01.0
01.0
0Inc
reme
ntal D
elay,
d26.2
0.62.5
1.77.3
0.30.6
0.20.1
Delay
(s)
60.3
10.9
87.4
11.2
69.0
59.7
64.8
64.1
45.4
Leve
l of S
ervic
eE
BF
BE
EE
ED
Appr
oach
Dela
y (s)
17.9
12.0
66.1
49.2
Appr
oach
LOS
BB
ED
Inter
secti
on S
umma
ryHC
M 20
00 C
ontro
l Dela
y19
.4HC
M 20
00 Le
vel o
f Ser
vice
BHC
M 20
00 V
olume
to C
apac
ity ra
tio0.6
7Ac
tuated
Cyc
le Le
ngth
(s)
140.0
Sum
of los
t time
(s)
16.8
Inter
secti
on C
apac
ity U
tiliza
tion
74.6%
ICU
Leve
l of S
ervic
eD
Analy
sis P
eriod
(min)
15c
Criti
cal L
ane G
roup
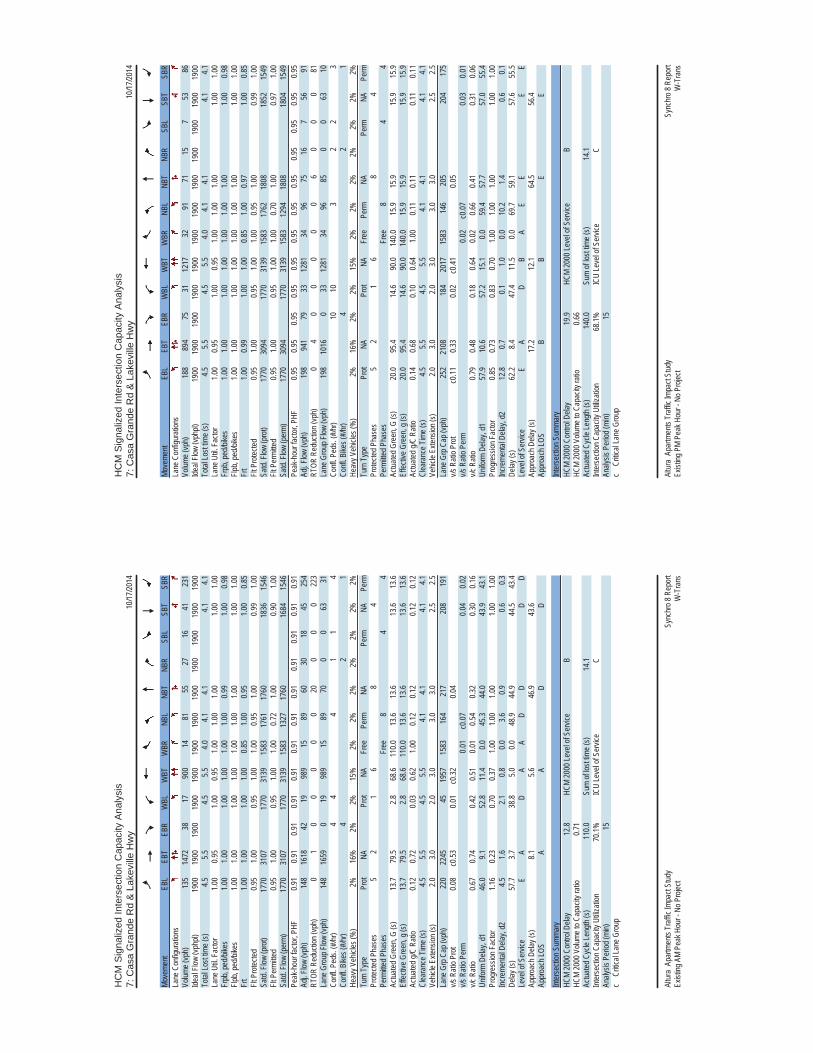
HC
M S
igna
lized
Inte
rsec
tion
Cap
acity
Ana
lysi
s7:
Cas
a G
rand
e R
d &
Lak
evill
e H
wy
10/17
/2014
Sync
hro 8
Rep
ort
Altur
a Ap
artm
ents
Traff
ic Im
pact
Stud
y Ex
isting
AM
Peak
Hou
r - N
o Pro
ject
W-T
rans
Move
ment
EBL
EBT
EBR
WBL
WBT
WBR
NBL
NBT
NBR
SBL
SBT
SBR
Lane
Con
figur
ation
sVo
lume (
vph)
135
1472
3817
900
1481
5527
1641
231
Ideal
Flow
(vphp
l)19
0019
0019
0019
0019
0019
0019
0019
0019
0019
0019
0019
00To
tal Lo
st tim
e (s)
4.55.5
4.55.5
4.04.1
4.14.1
4.1La
ne U
til. F
actor
1.00
0.95
1.00
0.95
1.00
1.00
1.00
1.00
1.00
Frpb
, ped
/bike
s1.0
01.0
01.0
01.0
01.0
01.0
00.9
91.0
00.9
8Flp
b, pe
d/bike
s1.0
01.0
01.0
01.0
01.0
01.0
01.0
01.0
01.0
0Fr
t1.0
01.0
01.0
01.0
00.8
51.0
00.9
51.0
00.8
5Flt
Pro
tected
0.95
1.00
0.95
1.00
1.00
0.95
1.00
0.99
1.00
Satd.
Flow
(pro
t)17
7031
0717
7031
3915
8317
6117
6018
3615
46Flt
Per
mitte
d0.9
51.0
00.9
51.0
01.0
00.7
21.0
00.9
01.0
0Sa
td. F
low (p
erm)
1770
3107
1770
3139
1583
1327
1760
1684
1546
Peak
-hou
r fac
tor, P
HF0.9
10.9
10.9
10.9
10.9
10.9
10.9
10.9
10.9
10.9
10.9
10.9
1Ad
j. Flow
(vph
)14
816
1842
1998
915
8960
3018
4525
4RT
OR R
educ
tion (
vph)
01
00
00
020
00
022
3La
ne G
roup
Flow
(vph
)14
816
590
1998
915
8970
00
6331
Confl
. Ped
s. (#
/hr)
44
41
14
Confl
. Bike
s (#/h
r)4
21
Heav
y Veh
icles
(%)
2%16
%2%
2%15
%2%
2%2%
2%2%
2%2%
Turn
Typ
ePr
otNA
Prot
NAFr
eePe
rmNA
Perm
NAPe
rmPr
otecte
d Pha
ses
52
16
84
Perm
itted P
hase
sFr
ee8
44
Actua
ted G
reen
, G (s
)13
.779
.52.8
68.6
110.0
13.6
13.6
13.6
13.6
Effec
tive G
reen
, g (s
)13
.779
.52.8
68.6
110.0
13.6
13.6
13.6
13.6
Actua
ted g/
C Ra
tio0.1
20.7
20.0
30.6
21.0
00.1
20.1
20.1
20.1
2Cl
eara
nce T
ime (
s)4.5
5.54.5
5.54.1
4.14.1
4.1Ve
hicle
Exten
sion (
s)2.0
3.02.0
3.03.0
3.02.5
2.5La
ne G
rp C
ap (v
ph)
220
2245
4519
5715
8316
421
720
819
1v/s
Rati
o Pro
t0.0
8c0
.530.0
1c0
.320.0
4v/s
Rati
o Per
m0.0
1c0
.070.0
40.0
2v/c
Rati
o0.6
70.7
40.4
20.5
10.0
10.5
40.3
20.3
00.1
6Un
iform
Dela
y, d1
46.0
9.152
.811
.40.0
45.3
44.0
43.9
43.1
Prog
ress
ion F
actor
1.16
0.23
0.70
0.37
1.00
1.00
1.00
1.00
1.00
Incre
menta
l Dela
y, d2
4.51.6
2.10.8
0.03.6
0.90.6
0.3De
lay (s
)57
.73.7
38.8
5.00.0
48.9
44.9
44.5
43.4
Leve
l of S
ervic
eE
AD
AA
DD
DD
Appr
oach
Dela
y (s)
8.15.6
46.9
43.6
Appr
oach
LOS
AA
DD
Inter
secti
on S
umma
ryHC
M 20
00 C
ontro
l Dela
y12
.8HC
M 20
00 Le
vel o
f Ser
vice
BHC
M 20
00 V
olume
to C
apac
ity ra
tio0.7
1Ac
tuated
Cyc
le Le
ngth
(s)
110.0
Sum
of los
t time
(s)
14.1
Inter
secti
on C
apac
ity U
tiliza
tion
70.1%
ICU
Leve
l of S
ervic
eC
Analy
sis P
eriod
(min)
15c
Criti
cal L
ane G
roup
HC
M S
igna
lized
Inte
rsec
tion
Cap
acity
Ana
lysi
s7:
Cas
a G
rand
e R
d &
Lak
evill
e H
wy
10/17
/2014
Sync
hro 8
Rep
ort
Altur
a Ap
artm
ents
Traff
ic Im
pact
Stud
y Ex
isting
PM
Peak
Hou
r - N
o Pro
ject
W-T
rans
Move
ment
EBL
EBT
EBR
WBL
WBT
WBR
NBL
NBT
NBR
SBL
SBT
SBR
Lane
Con
figur
ation
sVo
lume (
vph)
188
894
7531
1217
3291
7115
753
86Ide
al Flo
w (vp
hpl)
1900
1900
1900
1900
1900
1900
1900
1900
1900
1900
1900
1900
Total
Lost
time (
s)4.5
5.54.5
5.54.0
4.14.1
4.14.1
Lane
Util.
Fac
tor1.0
00.9
51.0
00.9
51.0
01.0
01.0
01.0
01.0
0Fr
pb, p
ed/bi
kes
1.00
1.00
1.00
1.00
1.00
1.00
1.00
1.00
0.98
Flpb,
ped/b
ikes
1.00
1.00
1.00
1.00
1.00
1.00
1.00
1.00
1.00
Frt
1.00
0.99
1.00
1.00
0.85
1.00
0.97
1.00
0.85
Flt P
rotec
ted0.9
51.0
00.9
51.0
01.0
00.9
51.0
00.9
91.0
0Sa
td. F
low (p
rot)
1770
3094
1770
3139
1583
1762
1808
1852
1549
Flt P
ermi
tted
0.95
1.00
0.95
1.00
1.00
0.70
1.00
0.97
1.00
Satd.
Flow
(per
m)17
7030
9417
7031
3915
8312
9418
0818
0415
49Pe
ak-h
our f
actor
, PHF
0.95
0.95
0.95
0.95
0.95
0.95
0.95
0.95
0.95
0.95
0.95
0.95
Adj. F
low (v
ph)
198
941
7933
1281
3496
7516
756
91RT
OR R
educ
tion (
vph)
04
00
00
06
00
081
Lane
Gro
up F
low (v
ph)
198
1016
033
1281
3496
850
063
10Co
nfl. P
eds.
(#/hr
)10
103
22
3Co
nfl. B
ikes (
#/hr)
42
1He
avy V
ehicl
es (%
)2%
16%
2%2%
15%
2%2%
2%2%
2%2%
2%Tu
rn T
ype
Prot
NAPr
otNA
Free
Perm
NAPe
rmNA
Perm
Prote
cted P
hase
s5
21
68
4Pe
rmitte
d Pha
ses
Free
84
4Ac
tuated
Gre
en, G
(s)
20.0
95.4
14.6
90.0
140.0
15.9
15.9
15.9
15.9
Effec
tive G
reen
, g (s
)20
.095
.414
.690
.014
0.015
.915
.915
.915
.9Ac
tuated
g/C
Ratio
0.14
0.68
0.10
0.64
1.00
0.11
0.11
0.11
0.11
Clea
ranc
e Tim
e (s)
4.55.5
4.55.5
4.14.1
4.14.1
Vehic
le Ex
tensio
n (s)
2.03.0
2.03.0
3.03.0
2.52.5
Lane
Grp
Cap
(vph
)25
221
0818
420
1715
8314
620
520
417
5v/s
Rati
o Pro
tc0
.110.3
30.0
2c0
.410.0
5v/s
Rati
o Per
m0.0
2c0
.070.0
30.0
1v/c
Rati
o0.7
90.4
80.1
80.6
40.0
20.6
60.4
10.3
10.0
6Un
iform
Dela
y, d1
57.9
10.6
57.2
15.1
0.059
.457
.757
.055
.4Pr
ogre
ssion
Fac
tor0.8
50.7
30.8
30.7
01.0
01.0
01.0
01.0
01.0
0Inc
reme
ntal D
elay,
d212
.80.7
0.11.0
0.010
.21.4
0.60.1
Delay
(s)
62.2
8.447
.411
.50.0
69.7
59.1
57.6
55.5
Leve
l of S
ervic
eE
AD
BA
EE
EE
Appr
oach
Dela
y (s)
17.2
12.1
64.5
56.4
Appr
oach
LOS
BB
EE
Inter
secti
on S
umma
ryHC
M 20
00 C
ontro
l Dela
y19
.9HC
M 20
00 Le
vel o
f Ser
vice
BHC
M 20
00 V
olume
to C
apac
ity ra
tio0.6
6Ac
tuated
Cyc
le Le
ngth
(s)
140.0
Sum
of los
t time
(s)
14.1
Inter
secti
on C
apac
ity U
tiliza
tion
68.1%
ICU
Leve
l of S
ervic
eC
Analy
sis P
eriod
(min)
15c
Criti
cal L
ane G
roup

HC
M S
igna
lized
Inte
rsec
tion
Cap
acity
Ana
lysi
s8:
McD
owel
l Bl &
Lak
evill
e H
wy
10/17
/2014
Sync
hro 8
Rep
ort
Altur
a Ap
artm
ents
Traff
ic Im
pact
Stud
y Ex
isting
AM
Peak
Hou
r - N
o Pro
ject
W-T
rans
Move
ment
EBL
EBT
EBR
WBL
WBT
WBR
NBL
NBT
NBR
SBL
SBT
SBR
Lane
Con
figur
ation
sVo
lume (
vph)
487
961
632
710
5520
583
917
523
113
Ideal
Flow
(vphp
l)19
0019
0019
0019
0019
0019
0019
0019
0019
0019
0019
0019
00To
tal Lo
st tim
e (s)
3.05.5
3.05.5
3.04.8
3.04.8
Lane
Util.
Fac
tor1.0
00.9
51.0
00.9
51.0
00.9
51.0
00.9
5Fr
pb, p
ed/bi
kes
1.00
1.00
1.00
1.00
1.00
1.00
1.00
1.00
Flpb,
ped/b
ikes
1.00
1.00
1.00
1.00
1.00
1.00
1.00
1.00
Frt
1.00
0.94
1.00
0.99
1.00
0.98
1.00
0.99
Flt P
rotec
ted0.9
51.0
00.9
51.0
00.9
51.0
00.9
51.0
0Sa
td. F
low (p
rot)
1770
3073
1770
3128
1770
3479
1770
3508
Flt P
ermi
tted
0.95
1.00
0.95
1.00
0.95
1.00
0.95
1.00
Satd.
Flow
(per
m)17
7030
7317
7031
2817
7034
7917
7035
08Pe
ak-h
our f
actor
, PHF
0.93
0.93
0.93
0.93
0.93
0.93
0.93
0.93
0.93
0.93
0.93
0.93
Adj. F
low (v
ph)
494
566
234
763
5922
089
1018
824
814
RTOR
Red
uctio
n (vp
h)0
770
03
00
90
04
0La
ne G
roup
Flow
(vph
)4
1530
034
819
022
090
018
825
80
Confl
. Ped
s. (#
/hr)
11
Confl
. Bike
s (#/h
r)1
52
Heav
y Veh
icles
(%)
2%16
%2%
2%15
%2%
2%2%
2%2%
2%2%
Turn
Typ
ePr
otNA
Prot
NAPr
otNA
Prot
NAPr
otecte
d Pha
ses
52
16
38
74
Perm
itted P
hase
sAc
tuated
Gre
en, G
(s)
2.457
.84.6
60.0
18.8
15.9
15.4
12.5
Effec
tive G
reen
, g (s
)2.4
57.8
4.660
.018
.815
.915
.412
.5Ac
tuated
g/C
Ratio
0.02
0.53
0.04
0.55
0.17
0.14
0.14
0.11
Clea
ranc
e Tim
e (s)
3.05.5
3.05.5
3.04.8
3.04.8
Vehic
le Ex
tensio
n (s)
2.03.0
2.03.0
3.02.0
2.02.0
Lane
Grp
Cap
(vph
)38
1614
7417
0630
250
224
739
8v/s
Rati
o Pro
tc0
.00c0
.500.0
2c0
.26c0
.120.0
3c0
.110.0
7v/s
Rati
o Per
mv/c
Rati
o0.1
10.9
50.4
60.4
80.7
30.1
80.7
60.6
5Un
iform
Dela
y, d1
52.7
24.7
51.5
15.4
43.2
41.3
45.5
46.6
Prog
ress
ion F
actor
0.77
0.51
1.00
1.00
1.00
1.00
1.00
1.00
Incre
menta
l Dela
y, d2
0.310
.01.6
1.08.5
0.111
.72.7
Delay
(s)
40.7
22.5
53.1
16.4
51.7
41.4
57.3
49.3
Leve
l of S
ervic
eD
CD
BD
DE
DAp
proa
ch D
elay (
s)22
.517
.848
.552
.7Ap
proa
ch LO
SC
BD
D
Inter
secti
on S
umma
ryHC
M 20
00 C
ontro
l Dela
y28
.0HC
M 20
00 Le
vel o
f Ser
vice
CHC
M 20
00 V
olume
to C
apac
ity ra
tio0.8
5Ac
tuated
Cyc
le Le
ngth
(s)
110.0
Sum
of los
t time
(s)
16.3
Inter
secti
on C
apac
ity U
tiliza
tion
74.7%
ICU
Leve
l of S
ervic
eD
Analy
sis P
eriod
(min)
15c
Criti
cal L
ane G
roup
HC
M S
igna
lized
Inte
rsec
tion
Cap
acity
Ana
lysi
s8:
McD
owel
l Bl &
Lak
evill
e H
wy
10/17
/2014
Sync
hro 8
Rep
ort
Altur
a Apa
rtmen
ts Tr
affic
Impa
ct St
udy
Exist
ing P
M Pe
ak H
our -
No P
rojec
tW
-Tra
ns
Move
ment
EBL
EBT
EBR
WBL
WBT
WBR
NBL
NBT
NBR
SBL
SBT
SBR
Lane
Con
figur
ation
sVo
lume (
vph)
1276
710
413
844
192
455
315
957
7613
Ideal
Flow
(vphp
l)19
0019
0019
0019
0019
0019
0019
0019
0019
0019
0019
0019
00To
tal Lo
st tim
e (s)
3.05.5
3.05.5
3.04.8
3.04.8
Lane
Util.
Fac
tor1.0
00.9
51.0
00.9
51.0
00.9
51.0
00.9
5Fr
pb, p
ed/bi
kes
1.00
1.00
1.00
1.00
1.00
1.00
1.00
1.00
Flpb,
ped/b
ikes
1.00
1.00
1.00
1.00
1.00
1.00
1.00
1.00
Frt
1.00
0.98
1.00
0.97
1.00
1.00
1.00
0.98
Flt P
rotec
ted0.9
51.0
00.9
51.0
00.9
51.0
00.9
51.0
0Sa
td. F
low (p
rot)
1770
3327
1770
3248
1770
3520
1770
3452
Flt P
ermi
tted
0.95
1.00
0.95
1.00
0.95
1.00
0.95
1.00
Satd.
Flow
(per
m)17
7033
2717
7032
4817
7035
2017
7034
52Pe
ak-h
our f
actor
, PHF
0.93
0.93
0.93
0.93
0.93
0.93
0.93
0.93
0.93
0.93
0.93
0.93
Adj. F
low (v
ph)
1382
511
214
908
206
489
339
1061
8214
RTOR
Red
uctio
n (vp
h)0
70
012
00
10
011
0La
ne G
roup
Flow
(vph
)13
930
014
1102
048
934
80
6185
0Co
nfl. P
eds.
(#/hr
)3
11
316
16Co
nfl. B
ikes (
#/hr)
15
2He
avy V
ehicl
es (%
)2%
7%2%
2%9%
2%2%
2%2%
2%2%
2%Tu
rn T
ype
Prot
NAPr
otNA
Prot
NAPr
otNA
Prote
cted P
hase
s5
21
63
87
4Pe
rmitte
d Pha
ses
Actua
ted G
reen
, G (s
)2.7
59.4
4.260
.951
.451
.98.2
8.7Ef
fectiv
e Gre
en, g
(s)
2.759
.44.2
60.9
51.4
51.9
8.28.7
Actua
ted g/
C Ra
tio0.0
20.4
20.0
30.4
30.3
70.3
70.0
60.0
6Cl
eara
nce T
ime (
s)3.0
5.53.0
5.53.0
4.83.0
4.8Ve
hicle
Exten
sion (
s)2.0
3.02.0
3.03.0
2.02.0
2.0La
ne G
rp C
ap (v
ph)
3414
1153
1412
649
1304
103
214
v/s R
atio P
rot
0.01
c0.28
0.01
c0.34
c0.28
0.10
c0.03
0.02
v/s R
atio P
erm
v/c R
atio
0.38
0.66
0.26
0.78
0.75
0.27
0.59
0.40
Unifo
rm D
elay,
d167
.832
.266
.433
.838
.830
.864
.363
.1Pr
ogre
ssion
Fac
tor1.0
40.6
81.0
01.0
01.0
01.0
01.0
01.0
0Inc
reme
ntal D
elay,
d22.4
2.21.0
4.34.9
0.05.9
0.4De
lay (s
)73
.124
.167
.438
.243
.730
.870
.263
.6Le
vel o
f Ser
vice
EC
ED
DC
EE
Appr
oach
Dela
y (s)
24.7
38.5
38.3
66.1
Appr
oach
LOS
CD
DE
Inter
secti
on S
umma
ryHC
M 20
00 C
ontro
l Dela
y35
.6HC
M 20
00 Le
vel o
f Ser
vice
DHC
M 20
00 V
olume
to C
apac
ity ra
tio0.7
5Ac
tuated
Cyc
le Le
ngth
(s)
140.0
Sum
of los
t time
(s)
16.3
Inter
secti
on C
apac
ity U
tiliza
tion
73.3%
ICU
Leve
l of S
ervic
eD
Analy
sis P
eriod
(min)
15c
Criti
cal L
ane G
roup

HC
M U
nsig
naliz
ed In
ters
ectio
n C
apac
ity A
naly
sis
9: B
ayw
ood
Dr &
Per
ry L
n10
/17/20
14
Sync
hro 8
Rep
ort
Altur
a Apa
rtmen
ts Tr
affic
Impa
ct St
udy
Exist
ing A
M Pe
ak H
our -
No P
rojec
tW
-Tra
ns
Move
ment
EBL
EBT
EBR
WBL
WBT
WBR
NBL
NBT
NBR
SBL
SBT
SBR
Lane
Con
figur
ation
sVo
lume (
veh/h
)0
00
290
320
8915
132
00
Sign
Con
trol
Stop
Stop
Free
Free
Grad
e0%
0%0%
0%Pe
ak H
our F
actor
0.90
0.90
0.90
0.91
0.90
0.91
0.90
0.91
0.91
0.91
0.91
0.90
Hour
ly flo
w ra
te (vp
h)0
00
320
350
9816
135
20
Pede
strian
sLa
ne W
idth (
ft)W
alking
Spe
ed (f
t/s)
Perce
nt Bl
ocka
geRi
ght tu
rn fla
re (v
eh)
Media
n typ
eTW
LTL
TWLT
LMe
dian s
torag
e veh
)2
2Up
strea
m sig
nal (f
t)27
0pX
, plat
oon u
nbloc
ked
vC, c
onflic
ting v
olume
438
468
176
284
460
5735
211
4vC
1, sta
ge 1
conf
vol
354
354
106
106
vC2,
stage
2 co
nf vo
l84
114
178
354
vCu,
unblo
cked
vol
438
468
176
284
460
5735
211
4tC
, sing
le (s)
7.56.5
6.97.5
6.56.9
4.14.1
tC, 2
stag
e (s)
6.55.5
6.55.5
tF (s
)3.5
4.03.3
3.54.0
3.32.2
2.2p0
queu
e fre
e %10
010
010
096
100
9610
010
0cM
capa
city (
veh/h
)60
759
783
775
459
999
712
0414
73
Dire
ction
, Lan
e #EB
1W
B 1
NB 1
NB 2
NB 3
SB 1
SB 2
SB 3
Volum
e Tota
l0
670
6549
123
411
7Vo
lume L
eft0
320
00
10
0Vo
lume R
ight
035
00
160
00
cSH
1700
865
1700
1700
1700
1473
1700
1700
Volum
e to C
apac
ity0.0
00.0
80.0
00.0
40.0
30.0
00.1
40.0
7Qu
eue L
ength
95th
(ft)
06
00
00
00
Contr
ol De
lay (s
)0.0
9.50.0
0.00.0
7.40.0
0.0La
ne LO
SA
AA
Appr
oach
Dela
y (s)
0.09.5
0.00.0
Appr
oach
LOS
AA
Inter
secti
on S
umma
ryAv
erag
e Dela
y 1.2
Inter
secti
on C
apac
ity U
tiliza
tion
19.1%
ICU
Leve
l of S
ervic
e A
Analy
sis P
eriod
(min)
15
HC
M U
nsig
naliz
ed In
ters
ectio
n C
apac
ity A
naly
sis
9: B
ayw
ood
Dr &
Per
ry L
n10
/17/20
14
Sync
hro 8
Rep
ort
Altur
a Ap
artm
ents
Traff
ic Im
pact
Stud
y Ex
isting
PM
Peak
Hou
r - N
o Pro
ject
W-T
rans
Move
ment
EBL
EBT
EBR
WBL
WBT
WBR
NBL
NBT
NBR
SBL
SBT
SBR
Lane
Con
figur
ation
sVo
lume (
veh/h
)0
00
170
170
242
290
153
0Si
gn C
ontro
lSt
opSt
opFr
eeFr
eeGr
ade
0%0%
0%0%
Peak
Hou
r Fac
tor0.9
00.9
00.9
00.9
00.9
00.9
00.9
00.9
00.9
00.9
00.9
00.9
0Ho
urly
flow
rate
(vph)
00
019
019
026
932
017
00
Pede
strian
sLa
ne W
idth (
ft)W
alking
Spe
ed (f
t/s)
Perce
nt Bl
ocka
geRi
ght tu
rn fla
re (v
eh)
Media
n typ
eTW
LTL
TWLT
LMe
dian s
torag
e veh
)2
2Up
strea
m sig
nal (f
t)27
0pX
, plat
oon u
nbloc
ked
vC, c
onflic
ting v
olume
323
471
8537
045
515
117
030
1vC
1, sta
ge 1
conf
vol
170
170
285
285
vC2,
stage
2 co
nf vo
l15
330
185
170
vCu,
unblo
cked
vol
323
471
8537
045
515
117
030
1tC
, sing
le (s)
7.56.5
6.97.5
6.56.9
4.14.1
tC, 2
stag
e (s)
6.55.5
6.55.5
tF (s
)3.5
4.03.3
3.54.0
3.32.2
2.2p0
queu
e fre
e %10
010
010
097
100
9810
010
0cM
capa
city (
veh/h
)72
461
395
766
962
286
914
0512
57
Dire
ction
, Lan
e #EB
1W
B 1
NB 1
NB 2
NB 3
SB 1
SB 2
SB 3
Volum
e Tota
l0
380
179
122
011
357
Volum
e Left
019
00
00
00
Volum
e Righ
t0
190
032
00
0cS
H17
0075
617
0017
0017
0017
0017
0017
00Vo
lume t
o Cap
acity
0.00
0.05
0.00
0.11
0.07
0.00
0.07
0.03
Queu
e Len
gth 95
th (ft
)0
40
00
00
0Co
ntrol
Delay
(s)
0.010
.00.0
0.00.0
0.00.0
0.0La
ne LO
SA
BAp
proa
ch D
elay (
s)0.0
10.0
0.00.0
Appr
oach
LOS
AB
Inter
secti
on S
umma
ryAv
erag
e Dela
y 0.7
Inter
secti
on C
apac
ity U
tiliza
tion
17.6%
ICU
Leve
l of S
ervic
e A
Analy
sis P
eriod
(min)
15
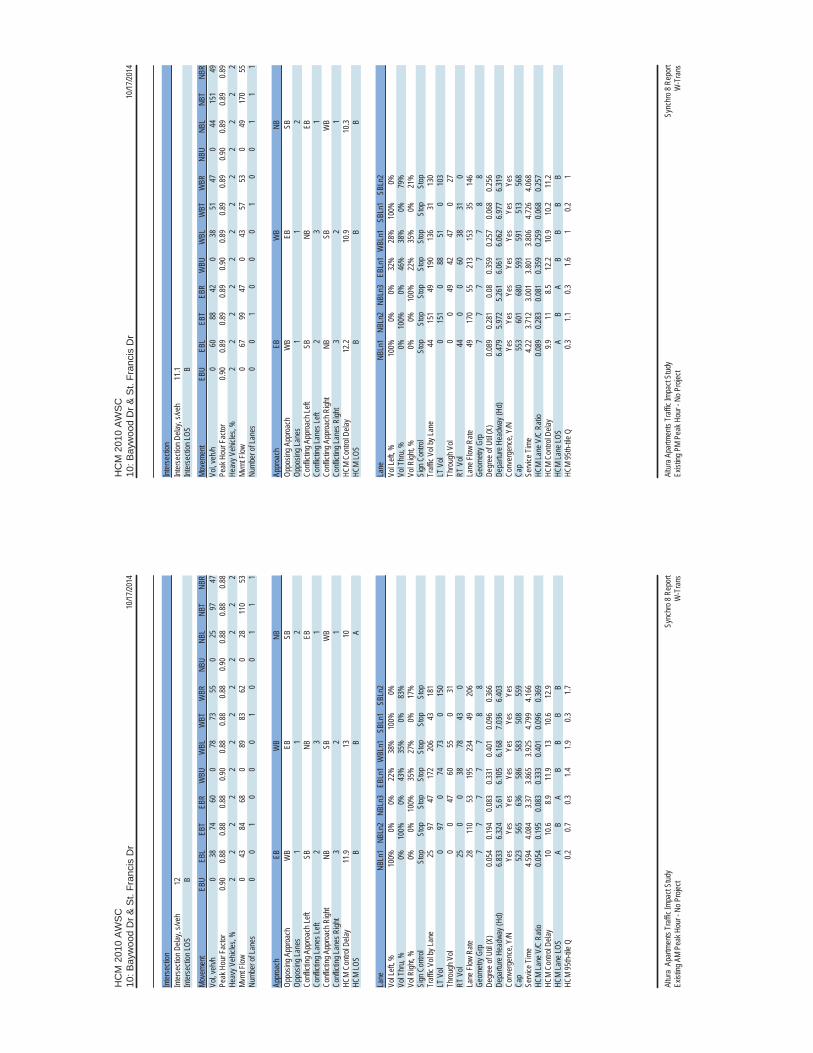
HC
M 2
010
AW
SC
10: B
ayw
ood
Dr &
St.
Fran
cis
Dr
10/17
/2014
Sync
hro 8
Rep
ort
Altur
a Ap
artm
ents
Traff
ic Im
pact
Stud
y Ex
isting
AM
Peak
Hou
r - N
o Pro
ject
W-T
rans
Inter
secti
onInt
erse
ction
Dela
y, s/v
eh12
Inter
secti
on LO
SB
Move
ment
EBU
EBL
EBT
EBR
WBU
WBL
WBT
WBR
NBU
NBL
NBT
NBR
Vol, v
eh/h
038
7460
078
7355
025
9747
Peak
Hou
r Fac
tor0.9
00.8
80.8
80.8
80.9
00.8
80.8
80.8
80.9
00.8
80.8
80.8
8He
avy V
ehicl
es, %
22
22
22
22
22
22
Mvmt
Flow
043
8468
089
8362
028
110
53Nu
mber
of La
nes
00
10
00
10
01
11
Appr
oach
EBW
BNB
Oppo
sing A
ppro
ach
WB
EBSB
Oppo
sing L
anes
11
2Co
nflict
ing A
ppro
ach L
eftSB
NBEB
Confl
icting
Lane
s Left
23
1Co
nflict
ing A
ppro
ach R
ight
NBSB
WB
Confl
icting
Lane
s Righ
t3
21
HCM
Contr
ol De
lay11
.913
10HC
M LO
SB
BA
Lane
NBLn
1NB
Ln2
NBLn
3EB
Ln1
WBL
n1SB
Ln1
SBLn
2Vo
l Left
, %10
0%0%
0%22
%38
%10
0%0%
Vol T
hru,
%0%
100%
0%43
%35
%0%
83%
Vol R
ight, %
0%0%
100%
35%
27%
0%17
%Si
gn C
ontro
lSt
opSt
opSt
opSt
opSt
opSt
opSt
opTr
affic
Vol b
y Lan
e25
9747
172
206
4318
1LT
Vol
097
074
730
150
Thro
ugh V
ol0
047
6055
031
RT V
ol25
00
3878
430
Lane
Flow
Rate
2811
053
195
234
4920
6Ge
ometr
y Grp
77
77
78
8De
gree
of U
til (X
)0.0
540.1
940.0
830.3
310.4
010.0
960.3
66De
partu
re H
eadw
ay (H
d)6.8
336.3
245.6
16.1
056.1
687.0
366.4
03Co
nver
genc
e, Y/
NYe
sYe
sYe
sYe
sYe
sYe
sYe
sCa
p52
356
563
658
658
350
855
9Se
rvice
Tim
e4.5
944.0
843.3
73.8
653.9
254.7
994.1
66HC
M La
ne V
/C R
atio
0.054
0.195
0.083
0.333
0.401
0.096
0.369
HCM
Contr
ol De
lay10
10.6
8.911
.913
10.6
12.9
HCM
Lane
LOS
AB
AB
BB
BHC
M 95
th-tile
Q0.2
0.70.3
1.41.9
0.31.7
HC
M 2
010
AW
SC
10: B
ayw
ood
Dr &
St.
Fran
cis
Dr
10/17
/2014
Sync
hro 8
Rep
ort
Altur
a Apa
rtmen
ts Tr
affic
Impa
ct St
udy
Exist
ing P
M Pe
ak H
our -
No P
rojec
tW
-Tra
ns
Inter
secti
onInt
erse
ction
Dela
y, s/v
eh11
.1Int
erse
ction
LOS
B
Move
ment
EBU
EBL
EBT
EBR
WBU
WBL
WBT
WBR
NBU
NBL
NBT
NBR
Vol, v
eh/h
060
8842
038
5147
044
151
49Pe
ak H
our F
actor
0.90
0.89
0.89
0.89
0.90
0.89
0.89
0.89
0.90
0.89
0.89
0.89
Heav
y Veh
icles
, %2
22
22
22
22
22
2Mv
mt F
low0
6799
470
4357
530
4917
055
Numb
er of
Lane
s0
01
00
01
00
11
1
Appr
oach
EBW
BNB
Oppo
sing A
ppro
ach
WB
EBSB
Oppo
sing L
anes
11
2Co
nflict
ing A
ppro
ach L
eftSB
NBEB
Confl
icting
Lane
s Left
23
1Co
nflict
ing A
ppro
ach R
ight
NBSB
WB
Confl
icting
Lane
s Righ
t3
21
HCM
Contr
ol De
lay12
.210
.910
.3HC
M LO
SB
BB
Lane
NBLn
1NB
Ln2
NBLn
3EB
Ln1
WBL
n1SB
Ln1
SBLn
2Vo
l Left
, %10
0%0%
0%32
%28
%10
0%0%
Vol T
hru,
%0%
100%
0%46
%38
%0%
79%
Vol R
ight, %
0%0%
100%
22%
35%
0%21
%Si
gn C
ontro
lSt
opSt
opSt
opSt
opSt
opSt
opSt
opTr
affic
Vol b
y Lan
e44
151
4919
013
631
130
LT V
ol0
151
088
510
103
Thro
ugh V
ol0
049
4247
027
RT V
ol44
00
6038
310
Lane
Flow
Rate
4917
055
213
153
3514
6Ge
ometr
y Grp
77
77
78
8De
gree
of U
til (X
)0.0
890.2
810.0
80.3
590.2
570.0
680.2
56De
partu
re H
eadw
ay (H
d)6.4
795.9
725.2
616.0
616.0
626.9
776.3
19Co
nver
genc
e, Y/
NYe
sYe
sYe
sYe
sYe
sYe
sYe
sCa
p55
360
168
059
359
151
356
8Se
rvice
Tim
e4.2
23.7
123.0
013.8
013.8
064.7
264.0
68HC
M La
ne V
/C R
atio
0.089
0.283
0.081
0.359
0.259
0.068
0.257
HCM
Contr
ol De
lay9.9
118.5
12.2
10.9
10.2
11.2
HCM
Lane
LOS
AB
AB
BB
BHC
M 95
th-tile
Q0.3
1.10.3
1.61
0.21
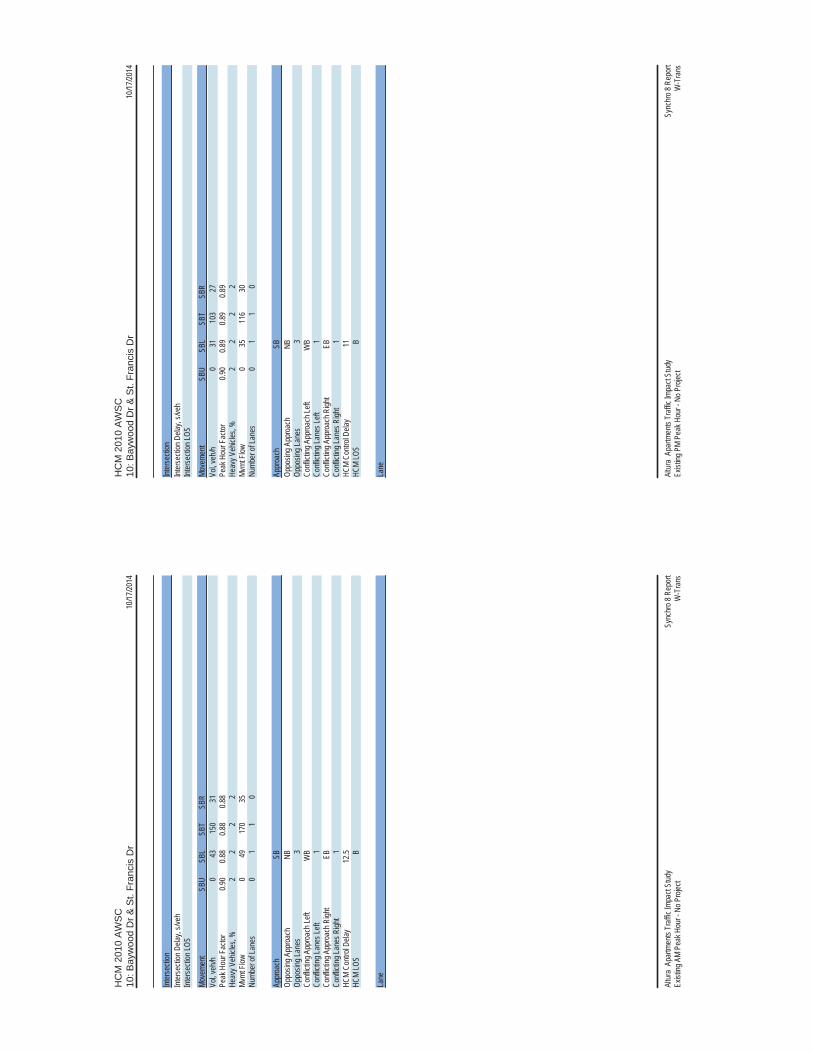
HC
M 2
010
AW
SC
10: B
ayw
ood
Dr &
St.
Fran
cis
Dr
10/17
/2014
Sync
hro 8
Rep
ort
Altur
a Ap
artm
ents
Traff
ic Im
pact
Stud
y Ex
isting
AM
Peak
Hou
r - N
o Pro
ject
W-T
rans
Inter
secti
onInt
erse
ction
Dela
y, s/v
ehInt
erse
ction
LOS
Move
ment
SBU
SBL
SBT
SBR
Vol, v
eh/h
043
150
31Pe
ak H
our F
actor
0.90
0.88
0.88
0.88
Heav
y Veh
icles
, %2
22
2Mv
mt F
low0
4917
035
Numb
er of
Lane
s0
11
0
Appr
oach
SBOp
posin
g App
roac
hNB
Oppo
sing L
anes
3Co
nflict
ing A
ppro
ach L
eftW
BCo
nflict
ing La
nes L
eft1
Confl
icting
App
roac
h Righ
tEB
Confl
icting
Lane
s Righ
t1
HCM
Contr
ol De
lay12
.5HC
M LO
SB
Lane
HC
M 2
010
AW
SC
10: B
ayw
ood
Dr &
St.
Fran
cis
Dr
10/17
/2014
Sync
hro 8
Rep
ort
Altur
a Ap
artm
ents
Traff
ic Im
pact
Stud
y Ex
isting
PM
Peak
Hou
r - N
o Pro
ject
W-T
rans
Inter
secti
onInt
erse
ction
Dela
y, s/v
ehInt
erse
ction
LOS
Move
ment
SBU
SBL
SBT
SBR
Vol, v
eh/h
031
103
27Pe
ak H
our F
actor
0.90
0.89
0.89
0.89
Heav
y Veh
icles
, %2
22
2Mv
mt F
low0
3511
630
Numb
er of
Lane
s0
11
0
Appr
oach
SBOp
posin
g App
roac
hNB
Oppo
sing L
anes
3Co
nflict
ing A
ppro
ach L
eftW
BCo
nflict
ing La
nes L
eft1
Confl
icting
App
roac
h Righ
tEB
Confl
icting
Lane
s Righ
t1
HCM
Contr
ol De
lay11
HCM
LOS
B
Lane
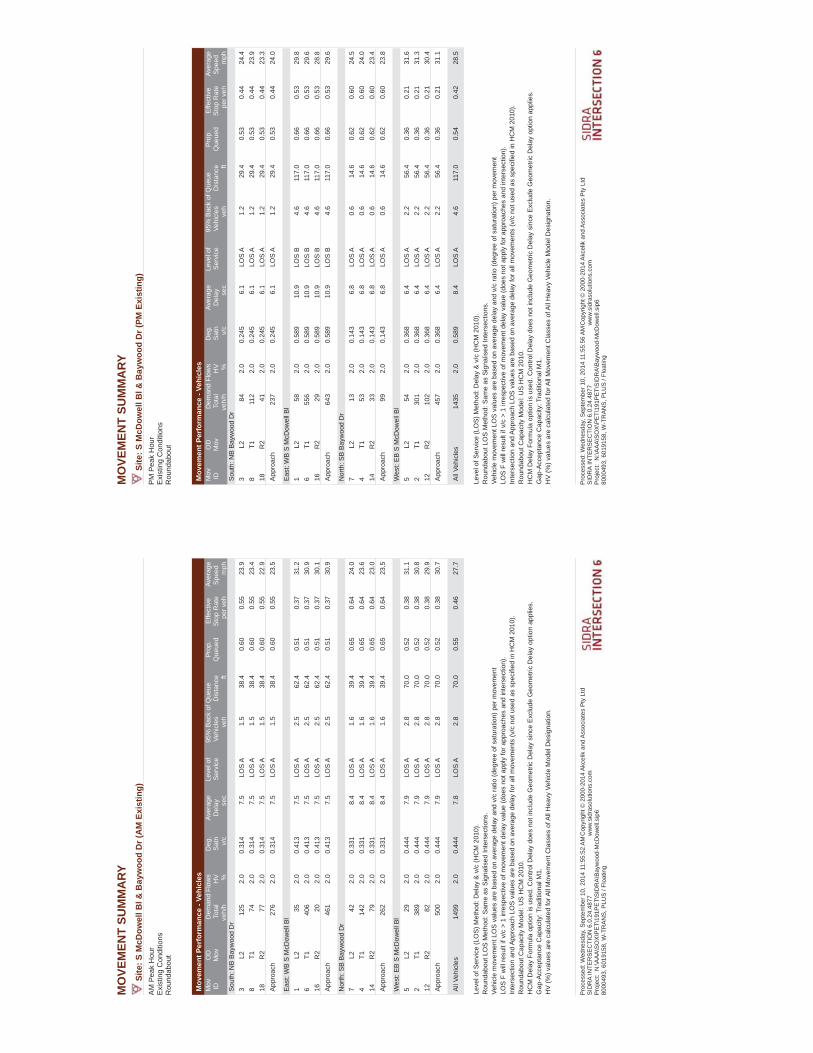
MO
VEM
ENT
SUM
MA
RYSi
te:S
McD
owel
l Bl &
Bay
woo
d D
r (A
M E
xist
ing)
AM
Pea
k H
our
Exi
stin
g C
ondi
tions
Rou
ndab
out
Mov
emen
t Per
form
ance
-Ve
hicl
esD
eman
d Fl
ows
95%
Bac
k of
Que
ueM
ov IDO
DM
ovD
eg.
Satn
Aver
age
Del
ay
Leve
l of
Serv
ice
Prop
. Q
ueue
dEf
fect
ive
Stop
Rat
eAv
erag
eSp
eed
To
tal
HV
Vehi
cles
Dis
tanc
eve
h/h
%v/
cse
cve
hft
per v
ehm
phSo
uth:
NB
Bay
woo
d D
r3
L212
52.
00.
314
7.5
LOS
A1.
538
.40.
600.
5523
.98
T174
2.0
0.31
47.
5LO
S A
1.5
38.4
0.60
0.55
23.4
18R
277
2.0
0.31
47.
5LO
S A
1.5
38.4
0.60
0.55
22.9
Appr
oach
276
2.0
0.31
47.
5LO
S A
1.5
38.4
0.60
0.55
23.5
East
: WB
S M
cDow
ell B
l1
L235
2.0
0.41
37.
5LO
S A
2.5
62.4
0.51
0.37
31.2
6T1
406
2.0
0.41
37.
5LO
S A
2.5
62.4
0.51
0.37
30.9
16R
220
2.0
0.41
37.
5LO
S A
2.5
62.4
0.51
0.37
30.1
Appr
oach
461
2.0
0.41
37.
5LO
S A
2.5
62.4
0.51
0.37
30.9
Nor
th: S
B B
ayw
ood
Dr
7L2
422.
00.
331
8.4
LOS
A1.
639
.40.
650.
6424
.04
T114
22.
00.
331
8.4
LOS
A1.
639
.40.
650.
6423
.614
R2
792.
00.
331
8.4
LOS
A1.
639
.40.
650.
6423
.0Ap
proa
ch26
22.
00.
331
8.4
LOS
A1.
639
.40.
650.
6423
.5
Wes
t: E
B S
McD
owel
l Bl
5L2
292.
00.
444
7.9
LOS
A2.
870
.00.
520.
3831
.12
T138
92.
00.
444
7.9
LOS
A2.
870
.00.
520.
3830
.812
R2
822.
00.
444
7.9
LOS
A2.
870
.00.
520.
3829
.9Ap
proa
ch50
02.
00.
444
7.9
LOS
A2.
870
.00.
520.
3830
.7
All V
ehic
les
1499
2.0
0.44
47.
8LO
S A
2.8
70.0
0.55
0.46
27.7
Leve
l of S
ervi
ce (L
OS)
Met
hod:
Del
ay &
v/c
(HC
M 2
010)
. R
ound
abou
t LO
S M
etho
d: S
ame
as S
igna
lised
Inte
rsec
tions
.Ve
hicl
e m
ovem
ent L
OS
val
ues
are
base
d on
ave
rage
del
ay a
nd v
/c ra
tio (d
egre
e of
sat
urat
ion)
per
mov
emen
tLO
S F
will
resu
lt if
v/c
> 1
irres
pect
ive
of m
ovem
ent d
elay
val
ue (d
oes
not a
pply
for a
ppro
ache
s an
d in
ters
ectio
n).
Inte
rsec
tion
and
Appr
oach
LO
S va
lues
are
bas
ed o
n av
erag
e de
lay
for a
ll m
ovem
ents
(v/c
not
use
d as
spe
cifie
d in
HC
M 2
010)
.R
ound
abou
t Cap
acity
Mod
el: U
S H
CM
201
0.H
CM
Del
ay F
orm
ula
optio
n is
use
d. C
ontro
l Del
ay d
oes
not i
nclu
de G
eom
etric
Del
ay s
ince
Exc
lude
Geo
met
ric D
elay
opt
ion
appl
ies.
Gap
-Acc
epta
nce
Cap
acity
: Tra
ditio
nal M
1.H
V (%
) val
ues
are
calc
ulat
ed fo
r All
Mov
emen
t Cla
sses
of A
ll H
eavy
Veh
icle
Mod
el D
esig
natio
n.
Pro
cess
ed: W
edne
sday
, Sep
tem
ber 1
0, 2
014
11:5
5:52
AM
SID
RA
INTE
RSE
CTI
ON
6.0
.24.
4877
Cop
yrig
ht ©
200
0-20
14 A
kcel
ik a
nd A
ssoc
iate
s Pt
y Lt
dw
ww
.sid
raso
lutio
ns.c
omP
roje
ct:
N:\A
AA\S
OX\
PET\
191P
ET\S
IDR
A\Ba
ywoo
d-M
cDow
ell.s
ip6
8000
493,
601
9158
, W-T
RAN
S, P
LUS
/ Fl
oatin
g
MO
VEM
ENT
SUM
MA
RYSi
te:S
McD
owel
l Bl &
Bay
woo
d D
r (PM
Exi
stin
g)P
M P
eak
Hou
rE
xist
ing
Con
ditio
nsR
ound
abou
t
Mov
emen
t Per
form
ance
-Ve
hicl
esD
eman
d Fl
ows
95%
Bac
k of
Que
ueM
ov IDO
DM
ovD
eg.
Satn
Aver
age
Del
ay
Leve
l of
Serv
ice
Prop
. Q
ueue
dEf
fect
ive
Stop
Rat
eAv
erag
eSp
eed
To
tal
HV
Vehi
cles
Dis
tanc
eve
h/h
%v/
cse
cve
hft
per v
ehm
phSo
uth:
NB
Bay
woo
d D
r3
L284
2.0
0.24
56.
1LO
S A
1.2
29.4
0.53
0.44
24.4
8T1
112
2.0
0.24
56.
1LO
S A
1.2
29.4
0.53
0.44
23.9
18R
241
2.0
0.24
56.
1LO
S A
1.2
29.4
0.53
0.44
23.3
Appr
oach
237
2.0
0.24
56.
1LO
S A
1.2
29.4
0.53
0.44
24.0
East
: WB
S M
cDow
ell B
l1
L258
2.0
0.58
910
.9LO
S B
4.6
117.
00.
660.
5329
.86
T155
62.
00.
589
10.9
LOS
B4.
611
7.0
0.66
0.53
29.6
16R
229
2.0
0.58
910
.9LO
S B
4.6
117.
00.
660.
5328
.8Ap
proa
ch64
32.
00.
589
10.9
LOS
B4.
611
7.0
0.66
0.53
29.6
Nor
th: S
B B
ayw
ood
Dr
7L2
132.
00.
143
6.8
LOS
A0.
614
.60.
620.
6024
.54
T153
2.0
0.14
36.
8LO
S A
0.6
14.6
0.62
0.60
24.0
14R
233
2.0
0.14
36.
8LO
S A
0.6
14.6
0.62
0.60
23.4
Appr
oach
992.
00.
143
6.8
LOS
A0.
614
.60.
620.
6023
.8
Wes
t: E
B S
McD
owel
l Bl
5L2
542.
00.
368
6.4
LOS
A2.
256
.40.
360.
2131
.62
T130
12.
00.
368
6.4
LOS
A2.
256
.40.
360.
2131
.312
R2
102
2.0
0.36
86.
4LO
S A
2.2
56.4
0.36
0.21
30.4
Appr
oach
457
2.0
0.36
86.
4LO
S A
2.2
56.4
0.36
0.21
31.1
All V
ehic
les
1435
2.0
0.58
98.
4LO
S A
4.6
117.
00.
540.
4228
.5
Leve
l of S
ervi
ce (L
OS)
Met
hod:
Del
ay &
v/c
(HC
M 2
010)
. R
ound
abou
t LO
S M
etho
d: S
ame
as S
igna
lised
Inte
rsec
tions
.Ve
hicl
e m
ovem
ent L
OS
val
ues
are
base
d on
ave
rage
del
ay a
nd v
/c ra
tio (d
egre
e of
sat
urat
ion)
per
mov
emen
tLO
S F
will
resu
lt if
v/c
> 1
irres
pect
ive
of m
ovem
ent d
elay
val
ue (d
oes
not a
pply
for a
ppro
ache
s an
d in
ters
ectio
n).
Inte
rsec
tion
and
Appr
oach
LO
S va
lues
are
bas
ed o
n av
erag
e de
lay
for a
ll m
ovem
ents
(v/c
not
use
d as
spe
cifie
d in
HC
M 2
010)
.R
ound
abou
t Cap
acity
Mod
el: U
S H
CM
201
0.H
CM
Del
ay F
orm
ula
optio
n is
use
d. C
ontro
l Del
ay d
oes
not i
nclu
de G
eom
etric
Del
ay s
ince
Exc
lude
Geo
met
ric D
elay
opt
ion
appl
ies.
Gap
-Acc
epta
nce
Cap
acity
: Tra
ditio
nal M
1.H
V (%
) val
ues
are
calc
ulat
ed fo
r All
Mov
emen
t Cla
sses
of A
ll H
eavy
Veh
icle
Mod
el D
esig
natio
n.
Pro
cess
ed: W
edne
sday
, Sep
tem
ber 1
0, 2
014
11:5
5:56
AM
SID
RA
INTE
RSE
CTI
ON
6.0
.24.
4877
Cop
yrig
ht ©
200
0-20
14 A
kcel
ik a
nd A
ssoc
iate
s Pt
y Lt
dw
ww
.sid
raso
lutio
ns.c
omP
roje
ct:
N:\A
AA\S
OX\
PET\
191P
ET\S
IDR
A\Ba
ywoo
d-M
cDow
ell.s
ip6
8000
493,
601
9158
, W-T
RAN
S, P
LUS
/ Fl
oatin
g
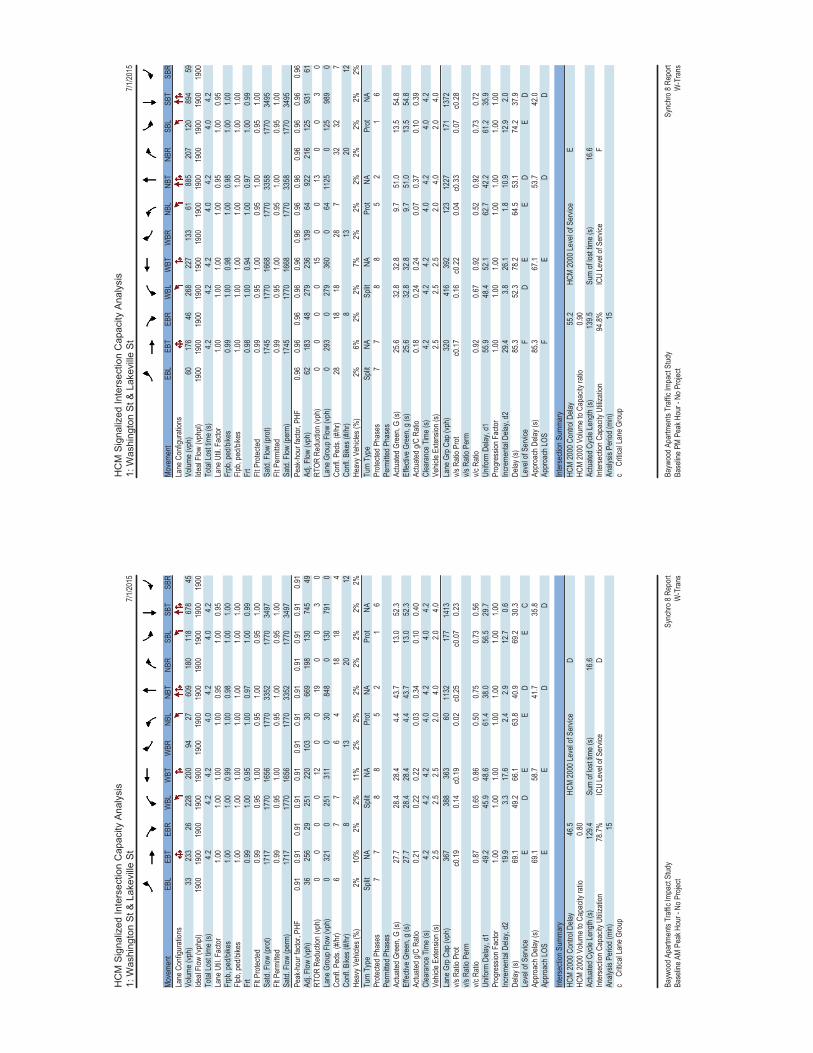
HC
M S
igna
lized
Inte
rsec
tion
Cap
acity
Ana
lysi
s1:
Was
hing
ton
St &
Lak
evill
e S
t7/1
/2015
Bayw
ood A
partm
ents
Traff
ic Im
pact
Stud
ySy
nchr
o 8 R
epor
tBa
selin
e AM
Peak
Hou
r - N
o Pro
ject
W-T
rans
Move
ment
EBL
EBT
EBR
WBL
WBT
WBR
NBL
NBT
NBR
SBL
SBT
SBR
Lane
Con
figur
ation
sVo
lume (
vph)
3323
326
228
200
9427
609
180
118
678
45Ide
al Flo
w (vp
hpl)
1900
1900
1900
1900
1900
1900
1900
1900
1900
1900
1900
1900
Total
Lost
time (
s)4.2
4.24.2
4.04.2
4.04.2
Lane
Util.
Fac
tor1.0
01.0
01.0
01.0
00.9
51.0
00.9
5Fr
pb, p
ed/bi
kes
1.00
1.00
0.99
1.00
0.98
1.00
1.00
Flpb,
ped/b
ikes
1.00
1.00
1.00
1.00
1.00
1.00
1.00
Frt
0.99
1.00
0.95
1.00
0.97
1.00
0.99
Flt P
rotec
ted0.9
90.9
51.0
00.9
51.0
00.9
51.0
0Sa
td. F
low (p
rot)
1717
1770
1656
1770
3352
1770
3497
Flt P
ermi
tted
0.99
0.95
1.00
0.95
1.00
0.95
1.00
Satd.
Flow
(per
m)17
1717
7016
5617
7033
5217
7034
97Pe
ak-h
our f
actor
, PHF
0.91
0.91
0.91
0.91
0.91
0.91
0.91
0.91
0.91
0.91
0.91
0.91
Adj. F
low (v
ph)
3625
629
251
220
103
3066
919
813
074
549
RTOR
Red
uctio
n (vp
h)0
00
012
00
190
03
0La
ne G
roup
Flow
(vph
)0
321
025
131
10
3084
80
130
791
0Co
nfl. P
eds.
(#/hr
)6
77
64
1818
4Co
nfl. B
ikes (
#/hr)
813
2012
Heav
y Veh
icles
(%)
2%10
%2%
2%11
%2%
2%2%
2%2%
2%2%
Turn
Typ
eSp
litNA
Split
NAPr
otNA
Prot
NAPr
otecte
d Pha
ses
77
88
52
16
Perm
itted P
hase
sAc
tuated
Gre
en, G
(s)
27.7
28.4
28.4
4.443
.713
.052
.3Ef
fectiv
e Gre
en, g
(s)
27.7
28.4
28.4
4.443
.713
.052
.3Ac
tuated
g/C
Ratio
0.21
0.22
0.22
0.03
0.34
0.10
0.40
Clea
ranc
e Tim
e (s)
4.24.2
4.24.0
4.24.0
4.2Ve
hicle
Exten
sion (
s)2.5
2.52.5
2.04.0
2.04.0
Lane
Grp
Cap
(vph
)36
738
836
360
1132
177
1413
v/s R
atio P
rot
c0.19
0.14
c0.19
0.02
c0.25
c0.07
0.23
v/s R
atio P
erm
v/c R
atio
0.87
0.65
0.86
0.50
0.75
0.73
0.56
Unifo
rm D
elay,
d149
.245
.948
.661
.438
.056
.529
.7Pr
ogre
ssion
Fac
tor1.0
01.0
01.0
01.0
01.0
01.0
01.0
0Inc
reme
ntal D
elay,
d219
.93.3
17.6
2.42.9
12.7
0.6De
lay (s
)69
.149
.266
.163
.840
.969
.230
.3Le
vel o
f Ser
vice
ED
EE
DE
CAp
proa
ch D
elay (
s)69
.158
.741
.735
.8Ap
proa
ch LO
SE
ED
D
Inter
secti
on S
umma
ryHC
M 20
00 C
ontro
l Dela
y46
.5HC
M 20
00 Le
vel o
f Ser
vice
DHC
M 20
00 V
olume
to C
apac
ity ra
tio0.8
0Ac
tuated
Cyc
le Le
ngth
(s)
129.4
Sum
of los
t time
(s)
16.6
Inter
secti
on C
apac
ity U
tiliza
tion
78.7%
ICU
Leve
l of S
ervic
eD
Analy
sis P
eriod
(min)
15c
Criti
cal L
ane G
roup
HC
M S
igna
lized
Inte
rsec
tion
Cap
acity
Ana
lysi
s1:
Was
hing
ton
St &
Lak
evill
e S
t7/1
/2015
Bayw
ood A
partm
ents
Traff
ic Im
pact
Stud
ySy
nchr
o 8 R
epor
tBa
selin
e PM
Peak
Hou
r - N
o Pro
ject
W-T
rans
Move
ment
EBL
EBT
EBR
WBL
WBT
WBR
NBL
NBT
NBR
SBL
SBT
SBR
Lane
Con
figur
ation
sVo
lume (
vph)
6017
646
268
227
133
6188
520
712
089
459
Ideal
Flow
(vphp
l)19
0019
0019
0019
0019
0019
0019
0019
0019
0019
0019
0019
00To
tal Lo
st tim
e (s)
4.24.2
4.24.0
4.24.0
4.2La
ne U
til. F
actor
1.00
1.00
1.00
1.00
0.95
1.00
0.95
Frpb
, ped
/bike
s0.9
91.0
00.9
81.0
00.9
81.0
01.0
0Flp
b, pe
d/bike
s1.0
01.0
01.0
01.0
01.0
01.0
01.0
0Fr
t0.9
81.0
00.9
41.0
00.9
71.0
00.9
9Flt
Pro
tected
0.99
0.95
1.00
0.95
1.00
0.95
1.00
Satd.
Flow
(pro
t)17
4517
7016
6817
7033
5817
7034
95Flt
Per
mitte
d0.9
90.9
51.0
00.9
51.0
00.9
51.0
0Sa
td. F
low (p
erm)
1745
1770
1668
1770
3358
1770
3495
Peak
-hou
r fac
tor, P
HF0.9
60.9
60.9
60.9
60.9
60.9
60.9
60.9
60.9
60.9
60.9
60.9
6Ad
j. Flow
(vph
)62
183
4827
923
613
964
922
216
125
931
61RT
OR R
educ
tion (
vph)
00
00
150
013
00
30
Lane
Gro
up F
low (v
ph)
029
30
279
360
064
1125
012
598
90
Confl
. Ped
s. (#
/hr)
2818
1828
732
327
Confl
. Bike
s (#/h
r)8
1320
12He
avy V
ehicl
es (%
)2%
6%2%
2%7%
2%2%
2%2%
2%2%
2%Tu
rn T
ype
Split
NASp
litNA
Prot
NAPr
otNA
Prote
cted P
hase
s7
78
85
21
6Pe
rmitte
d Pha
ses
Actua
ted G
reen
, G (s
)25
.632
.832
.89.7
51.0
13.5
54.8
Effec
tive G
reen
, g (s
)25
.632
.832
.89.7
51.0
13.5
54.8
Actua
ted g/
C Ra
tio0.1
80.2
40.2
40.0
70.3
70.1
00.3
9Cl
eara
nce T
ime (
s)4.2
4.24.2
4.04.2
4.04.2
Vehic
le Ex
tensio
n (s)
2.52.5
2.52.0
4.02.0
4.0La
ne G
rp C
ap (v
ph)
320
416
392
123
1227
171
1372
v/s R
atio P
rot
c0.17
0.16
c0.22
0.04
c0.33
0.07
c0.28
v/s R
atio P
erm
v/c R
atio
0.92
0.67
0.92
0.52
0.92
0.73
0.72
Unifo
rm D
elay,
d155
.948
.452
.162
.742
.261
.235
.9Pr
ogre
ssion
Fac
tor1.0
01.0
01.0
01.0
01.0
01.0
01.0
0Inc
reme
ntal D
elay,
d229
.43.8
26.1
1.810
.912
.92.0
Delay
(s)
85.3
52.3
78.2
64.5
53.1
74.2
37.9
Leve
l of S
ervic
eF
DE
ED
ED
Appr
oach
Dela
y (s)
85.3
67.1
53.7
42.0
Appr
oach
LOS
FE
DD
Inter
secti
on S
umma
ryHC
M 20
00 C
ontro
l Dela
y55
.2HC
M 20
00 Le
vel o
f Ser
vice
EHC
M 20
00 V
olume
to C
apac
ity ra
tio0.9
0Ac
tuated
Cyc
le Le
ngth
(s)
139.5
Sum
of los
t time
(s)
16.6
Inter
secti
on C
apac
ity U
tiliza
tion
94.8%
ICU
Leve
l of S
ervic
eF
Analy
sis P
eriod
(min)
15c
Criti
cal L
ane G
roup

HC
M S
igna
lized
Inte
rsec
tion
Cap
acity
Ana
lysi
s2:
E D
St &
Lak
evill
e S
t7/1
/2015
Bayw
ood A
partm
ents
Traff
ic Im
pact
Stud
ySy
nchr
o 8 R
epor
tBa
selin
e AM
Peak
Hou
r - N
o Pro
ject
W-T
rans
Move
ment
EBL
EBT
EBR
WBL
WBT
WBR
NBL
NBT
NBR
SBL
SBT
SBR
Lane
Con
figur
ation
sVo
lume (
vph)
142
511
242
445
315
6417
552
918
146
8Ide
al Flo
w (vp
hpl)
1900
1900
1900
1900
1900
1900
1900
1900
1900
1900
1900
1900
Total
Lost
time (
s)4.5
4.54.5
4.54.2
4.24.2
4.2La
ne U
til. F
actor
0.95
1.00
1.00
1.00
1.00
1.00
1.00
1.00
Frpb
, ped
/bike
s0.9
61.0
01.0
00.8
91.0
01.0
01.0
01.0
0Flp
b, pe
d/bike
s1.0
01.0
01.0
01.0
01.0
01.0
01.0
01.0
0Fr
t0.9
71.0
01.0
00.8
51.0
00.8
51.0
00.9
9Flt
Pro
tected
1.00
0.95
1.00
1.00
0.99
1.00
0.95
1.00
Satd.
Flow
(pro
t)31
1517
7017
1214
1118
3815
8317
7018
46Flt
Per
mitte
d0.9
50.9
51.0
01.0
00.9
91.0
00.9
51.0
0Sa
td. F
low (p
erm)
2973
1770
1712
1411
1838
1583
1770
1846
Peak
-hou
r fac
tor, P
HF0.9
00.9
00.9
00.9
00.9
00.9
00.9
00.9
00.9
00.9
00.9
00.9
0Ad
j. Flow
(vph
)1
472
124
471
503
1771
194
588
2016
29
RTOR
Red
uctio
n (vp
h)0
00
00
70
026
30
20
Lane
Gro
up F
low (v
ph)
059
70
471
503
100
265
325
2016
90
Confl
. Ped
s. (#
/hr)
2231
3122
Confl
. Bike
s (#/h
r)21
171
1He
avy V
ehicl
es (%
)2%
10%
2%2%
11%
2%2%
2%2%
2%2%
2%Tu
rn T
ype
Perm
NAPr
otNA
Perm
Split
NApt+
ovSp
litNA
Prote
cted P
hase
s4
38
22
2 36
6Pe
rmitte
d Pha
ses
48
Actua
ted G
reen
, G (s
)38
.940
.183
.583
.526
.070
.617
.617
.6Ef
fectiv
e Gre
en, g
(s)
38.9
40.1
83.5
83.5
26.0
66.1
17.6
17.6
Actua
ted g/
C Ra
tio0.2
80.2
90.6
00.6
00.1
90.4
70.1
30.1
3Cl
eara
nce T
ime (
s)4.5
4.54.5
4.54.2
4.24.2
Vehic
le Ex
tensio
n (s)
4.02.0
4.04.0
2.52.5
2.5La
ne G
rp C
ap (v
ph)
826
506
1021
841
341
747
222
232
v/s R
atio P
rot
c0.27
0.29
c0.14
0.21
0.01
c0.09
v/s R
atio P
erm
c0.20
0.01
v/c R
atio
0.72
0.93
0.49
0.01
0.78
0.44
0.09
0.73
Unifo
rm D
elay,
d145
.748
.616
.111
.554
.224
.554
.158
.9Pr
ogre
ssion
Fac
tor1.0
01.0
01.0
01.0
01.0
01.0
01.0
01.0
0Inc
reme
ntal D
elay,
d25.4
23.7
0.50.0
10.2
0.30.1
10.3
Delay
(s)
51.1
72.3
16.7
11.5
64.5
24.8
54.2
69.2
Leve
l of S
ervic
eD
EB
BE
CD
EAp
proa
ch D
elay (
s)51
.143
.037
.267
.6Ap
proa
ch LO
SD
DD
E
Inter
secti
on S
umma
ryHC
M 20
00 C
ontro
l Dela
y44
.7HC
M 20
00 Le
vel o
f Ser
vice
DHC
M 20
00 V
olume
to C
apac
ity ra
tio0.8
0Ac
tuated
Cyc
le Le
ngth
(s)
140.0
Sum
of los
t time
(s)
17.4
Inter
secti
on C
apac
ity U
tiliza
tion
75.2%
ICU
Leve
l of S
ervic
eD
Analy
sis P
eriod
(min)
15c
Criti
cal L
ane G
roup
HC
M S
igna
lized
Inte
rsec
tion
Cap
acity
Ana
lysi
s2:
E D
St &
Lak
evill
e S
t7/1
/2015
Bayw
ood A
partm
ents
Traff
ic Im
pact
Stud
ySy
nchr
o 8 R
epor
tBa
selin
e PM
Peak
Hou
r - N
o Pro
ject
W-T
rans
Move
ment
EBL
EBT
EBR
WBL
WBT
WBR
NBL
NBT
NBR
SBL
SBT
SBR
Lane
Con
figur
ation
sVo
lume (
vph)
242
491
176
478
1612
016
860
414
177
20Ide
al Flo
w (vp
hpl)
1900
1900
1900
1900
1900
1900
1900
1900
1900
1900
1900
1900
Total
Lost
time (
s)4.5
4.54.5
4.54.2
4.24.2
4.2La
ne U
til. F
actor
0.95
1.00
1.00
1.00
1.00
1.00
1.00
1.00
Frpb
, ped
/bike
s0.9
71.0
01.0
00.9
11.0
01.0
01.0
01.0
0Flp
b, pe
d/bike
s1.0
01.0
01.0
01.0
01.0
01.0
01.0
01.0
0Fr
t0.9
71.0
01.0
00.8
51.0
00.8
51.0
00.9
8Flt
Pro
tected
1.00
0.95
1.00
1.00
0.98
1.00
0.95
1.00
Satd.
Flow
(pro
t)32
3517
7017
7614
4418
2515
8317
7018
29Flt
Per
mitte
d0.9
50.9
51.0
01.0
00.9
81.0
00.9
51.0
0Sa
td. F
low (p
erm)
3086
1770
1776
1444
1825
1583
1770
1829
Peak
-hou
r fac
tor, P
HF0.9
60.9
60.9
60.9
60.9
60.9
60.9
60.9
60.9
60.9
60.9
60.9
6Ad
j. Flow
(vph
)2
442
9518
349
817
125
175
629
1518
421
RTOR
Red
uctio
n (vp
h)0
00
00
70
025
80
30
Lane
Gro
up F
low (v
ph)
053
90
183
498
100
300
371
1520
20
Confl
. Ped
s. (#
/hr)
1632
3216
24
42
Confl
. Bike
s (#/h
r)21
171
1He
avy V
ehicl
es (%
)2%
6%2%
2%7%
2%2%
2%2%
2%2%
2%Tu
rn T
ype
Perm
NAPr
otNA
Perm
Split
NApt+
ovSp
litNA
Prote
cted P
hase
s4
38
22
2 36
6Pe
rmitte
d Pha
ses
48
Actua
ted G
reen
, G (s
)36
.837
.578
.878
.828
.670
.619
.719
.7Ef
fectiv
e Gre
en, g
(s)
36.8
37.5
78.8
78.8
28.6
66.1
19.7
19.7
Actua
ted g/
C Ra
tio0.2
60.2
70.5
60.5
60.2
00.4
70.1
40.1
4Cl
eara
nce T
ime (
s)4.5
4.54.5
4.54.2
4.24.2
Vehic
le Ex
tensio
n (s)
4.02.0
4.04.0
2.52.5
2.5La
ne G
rp C
ap (v
ph)
811
474
999
812
372
747
249
257
v/s R
atio P
rot
0.10
c0.28
c0.16
0.23
0.01
c0.11
v/s R
atio P
erm
c0.17
0.01
v/c R
atio
0.66
0.39
0.50
0.01
0.81
0.50
0.06
0.78
Unifo
rm D
elay,
d146
.141
.918
.613
.553
.125
.552
.158
.1Pr
ogre
ssion
Fac
tor1.0
00.7
60.7
02.0
71.0
01.0
01.0
01.0
0Inc
reme
ntal D
elay,
d24.3
0.21.6
0.011
.70.4
0.114
.0De
lay (s
)50
.432
.114
.727
.964
.825
.952
.272
.1Le
vel o
f Ser
vice
DC
BC
EC
DE
Appr
oach
Dela
y (s)
50.4
19.6
38.4
70.7
Appr
oach
LOS
DB
DE
Inter
secti
on S
umma
ryHC
M 20
00 C
ontro
l Dela
y38
.6HC
M 20
00 Le
vel o
f Ser
vice
DHC
M 20
00 V
olume
to C
apac
ity ra
tio0.6
8Ac
tuated
Cyc
le Le
ngth
(s)
140.0
Sum
of los
t time
(s)
17.4
Inter
secti
on C
apac
ity U
tiliza
tion
82.9%
ICU
Leve
l of S
ervic
eE
Analy
sis P
eriod
(min)
15c
Criti
cal L
ane G
roup
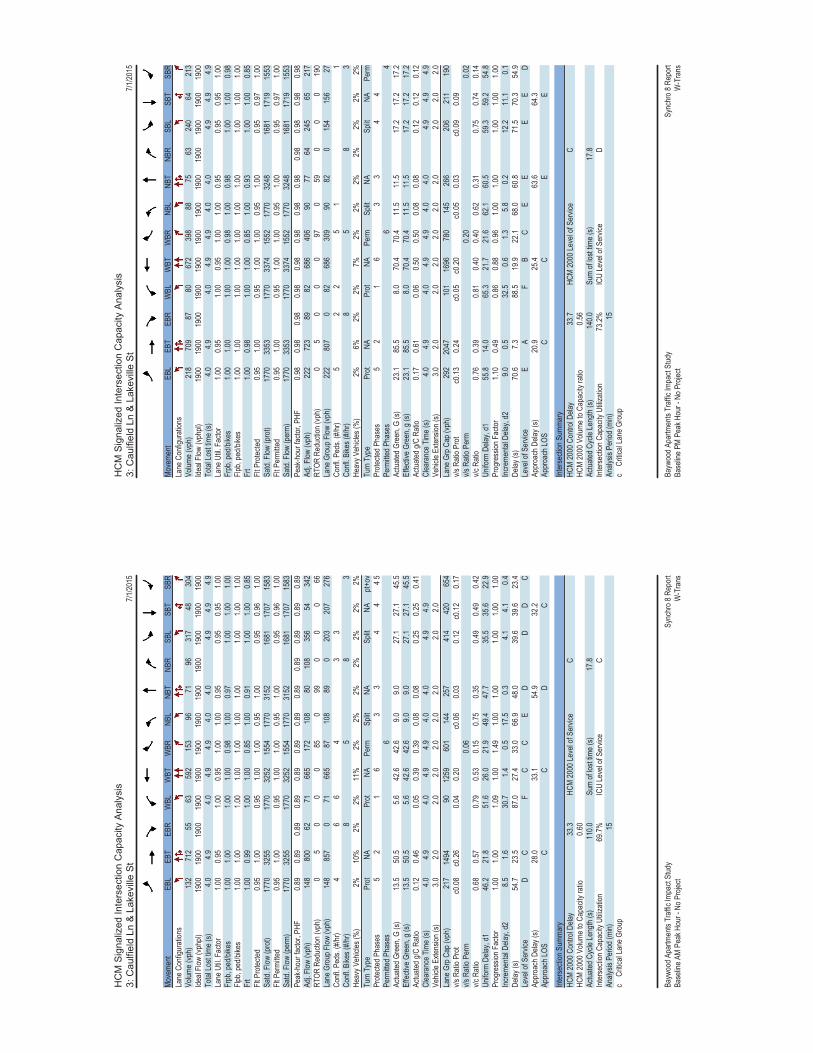
HC
M S
igna
lized
Inte
rsec
tion
Cap
acity
Ana
lysi
s3:
Cau
lfiel
d Ln
& L
akev
ille
St
7/1/20
15
Bayw
ood A
partm
ents
Traff
ic Im
pact
Stud
ySy
nchr
o 8 R
epor
tBa
selin
e AM
Peak
Hou
r - N
o Pro
ject
W-T
rans
Move
ment
EBL
EBT
EBR
WBL
WBT
WBR
NBL
NBT
NBR
SBL
SBT
SBR
Lane
Con
figur
ation
sVo
lume (
vph)
132
712
5563
592
153
9671
9631
748
304
Ideal
Flow
(vphp
l)19
0019
0019
0019
0019
0019
0019
0019
0019
0019
0019
0019
00To
tal Lo
st tim
e (s)
4.04.9
4.04.9
4.94.0
4.04.9
4.94.9
Lane
Util.
Fac
tor1.0
00.9
51.0
00.9
51.0
01.0
00.9
50.9
50.9
51.0
0Fr
pb, p
ed/bi
kes
1.00
1.00
1.00
1.00
0.98
1.00
0.97
1.00
1.00
1.00
Flpb,
ped/b
ikes
1.00
1.00
1.00
1.00
1.00
1.00
1.00
1.00
1.00
1.00
Frt
1.00
0.99
1.00
1.00
0.85
1.00
0.91
1.00
1.00
0.85
Flt P
rotec
ted0.9
51.0
00.9
51.0
01.0
00.9
51.0
00.9
50.9
61.0
0Sa
td. F
low (p
rot)
1770
3255
1770
3252
1554
1770
3152
1681
1707
1583
Flt P
ermi
tted
0.95
1.00
0.95
1.00
1.00
0.95
1.00
0.95
0.96
1.00
Satd.
Flow
(per
m)17
7032
5517
7032
5215
5417
7031
5216
8117
0715
83Pe
ak-h
our f
actor
, PHF
0.89
0.89
0.89
0.89
0.89
0.89
0.89
0.89
0.89
0.89
0.89
0.89
Adj. F
low (v
ph)
148
800
6271
665
172
108
8010
835
654
342
RTOR
Red
uctio
n (vp
h)0
50
00
850
990
00
66La
ne G
roup
Flow
(vph
)14
885
70
7166
587
108
890
203
207
276
Confl
. Ped
s. (#
/hr)
46
64
33
Confl
. Bike
s (#/h
r)8
58
3He
avy V
ehicl
es (%
)2%
10%
2%2%
11%
2%2%
2%2%
2%2%
2%Tu
rn T
ype
Prot
NAPr
otNA
Perm
Split
NASp
litNA
pt+ov
Prote
cted P
hase
s5
21
63
34
44 5
Perm
itted P
hase
s6
Actua
ted G
reen
, G (s
)13
.550
.55.6
42.6
42.6
9.09.0
27.1
27.1
45.5
Effec
tive G
reen
, g (s
)13
.550
.55.6
42.6
42.6
9.09.0
27.1
27.1
45.5
Actua
ted g/
C Ra
tio0.1
20.4
60.0
50.3
90.3
90.0
80.0
80.2
50.2
50.4
1Cl
eara
nce T
ime (
s)4.0
4.94.0
4.94.9
4.04.0
4.94.9
Vehic
le Ex
tensio
n (s)
3.02.0
2.02.0
2.02.0
2.02.0
2.0La
ne G
rp C
ap (v
ph)
217
1494
9012
5960
114
425
741
442
065
4v/s
Rati
o Pro
tc0
.08c0
.260.0
40.2
0c0
.060.0
30.1
2c0
.120.1
7v/s
Rati
o Per
m0.0
6v/c
Rati
o0.6
80.5
70.7
90.5
30.1
50.7
50.3
50.4
90.4
90.4
2Un
iform
Dela
y, d1
46.2
21.8
51.6
26.0
21.9
49.4
47.7
35.5
35.6
22.9
Prog
ress
ion F
actor
1.00
1.00
1.09
1.00
1.49
1.00
1.00
1.00
1.00
1.00
Incre
menta
l Dela
y, d2
8.51.6
30.7
1.40.5
17.5
0.34.1
4.10.4
Delay
(s)
54.7
23.5
87.0
27.4
33.0
66.9
48.0
39.6
39.6
23.4
Leve
l of S
ervic
eD
CF
CC
ED
DD
CAp
proa
ch D
elay (
s)28
.033
.154
.932
.2Ap
proa
ch LO
SC
CD
C
Inter
secti
on S
umma
ryHC
M 20
00 C
ontro
l Dela
y33
.3HC
M 20
00 Le
vel o
f Ser
vice
CHC
M 20
00 V
olume
to C
apac
ity ra
tio0.6
0Ac
tuated
Cyc
le Le
ngth
(s)
110.0
Sum
of los
t time
(s)
17.8
Inter
secti
on C
apac
ity U
tiliza
tion
69.7%
ICU
Leve
l of S
ervic
eC
Analy
sis P
eriod
(min)
15c
Criti
cal L
ane G
roup
HC
M S
igna
lized
Inte
rsec
tion
Cap
acity
Ana
lysi
s3:
Cau
lfiel
d Ln
& L
akev
ille
St
7/1/20
15
Bayw
ood A
partm
ents
Traff
ic Im
pact
Stud
ySy
nchr
o 8 R
epor
tBa
selin
e PM
Peak
Hou
r - N
o Pro
ject
W-T
rans
Move
ment
EBL
EBT
EBR
WBL
WBT
WBR
NBL
NBT
NBR
SBL
SBT
SBR
Lane
Con
figur
ation
sVo
lume (
vph)
218
709
8780
672
398
8875
6324
064
213
Ideal
Flow
(vphp
l)19
0019
0019
0019
0019
0019
0019
0019
0019
0019
0019
0019
00To
tal Lo
st tim
e (s)
4.04.9
4.04.9
4.94.0
4.04.9
4.94.9
Lane
Util.
Fac
tor1.0
00.9
51.0
00.9
51.0
01.0
00.9
50.9
50.9
51.0
0Fr
pb, p
ed/bi
kes
1.00
1.00
1.00
1.00
0.98
1.00
0.98
1.00
1.00
0.98
Flpb,
ped/b
ikes
1.00
1.00
1.00
1.00
1.00
1.00
1.00
1.00
1.00
1.00
Frt
1.00
0.98
1.00
1.00
0.85
1.00
0.93
1.00
1.00
0.85
Flt P
rotec
ted0.9
51.0
00.9
51.0
01.0
00.9
51.0
00.9
50.9
71.0
0Sa
td. F
low (p
rot)
1770
3353
1770
3374
1552
1770
3248
1681
1719
1553
Flt P
ermi
tted
0.95
1.00
0.95
1.00
1.00
0.95
1.00
0.95
0.97
1.00
Satd.
Flow
(per
m)17
7033
5317
7033
7415
5217
7032
4816
8117
1915
53Pe
ak-h
our f
actor
, PHF
0.98
0.98
0.98
0.98
0.98
0.98
0.98
0.98
0.98
0.98
0.98
0.98
Adj. F
low (v
ph)
222
723
8982
686
406
9077
6424
565
217
RTOR
Red
uctio
n (vp
h)0
50
00
970
590
00
190
Lane
Gro
up F
low (v
ph)
222
807
082
686
309
9082
015
415
627
Confl
. Ped
s. (#
/hr)
52
25
11
Confl
. Bike
s (#/h
r)8
58
3He
avy V
ehicl
es (%
)2%
6%2%
2%7%
2%2%
2%2%
2%2%
2%Tu
rn T
ype
Prot
NAPr
otNA
Perm
Split
NASp
litNA
Perm
Prote
cted P
hase
s5
21
63
34
4Pe
rmitte
d Pha
ses
64
Actua
ted G
reen
, G (s
)23
.185
.58.0
70.4
70.4
11.5
11.5
17.2
17.2
17.2
Effec
tive G
reen
, g (s
)23
.185
.58.0
70.4
70.4
11.5
11.5
17.2
17.2
17.2
Actua
ted g/
C Ra
tio0.1
70.6
10.0
60.5
00.5
00.0
80.0
80.1
20.1
20.1
2Cl
eara
nce T
ime (
s)4.0
4.94.0
4.94.9
4.04.0
4.94.9
4.9Ve
hicle
Exten
sion (
s)3.0
2.02.0
2.02.0
2.02.0
2.02.0
2.0La
ne G
rp C
ap (v
ph)
292
2047
101
1696
780
145
266
206
211
190
v/s R
atio P
rot
c0.13
0.24
c0.05
c0.20
c0.05
0.03
c0.09
0.09
v/s R
atio P
erm
0.20
0.02
v/c R
atio
0.76
0.39
0.81
0.40
0.40
0.62
0.31
0.75
0.74
0.14
Unifo
rm D
elay,
d155
.814
.065
.321
.721
.662
.160
.559
.359
.254
.8Pr
ogre
ssion
Fac
tor1.1
00.4
90.8
60.8
80.9
61.0
01.0
01.0
01.0
01.0
0Inc
reme
ntal D
elay,
d29.0
0.532
.50.6
1.35.8
0.212
.211
.10.1
Delay
(s)
70.6
7.388
.519
.922
.168
.060
.871
.570
.354
.9Le
vel o
f Ser
vice
EA
FB
CE
EE
ED
Appr
oach
Dela
y (s)
20.9
25.4
63.6
64.3
Appr
oach
LOS
CC
EE
Inter
secti
on S
umma
ryHC
M 20
00 C
ontro
l Dela
y33
.7HC
M 20
00 Le
vel o
f Ser
vice
CHC
M 20
00 V
olume
to C
apac
ity ra
tio0.5
6Ac
tuated
Cyc
le Le
ngth
(s)
140.0
Sum
of los
t time
(s)
17.8
Inter
secti
on C
apac
ity U
tiliza
tion
73.2%
ICU
Leve
l of S
ervic
eD
Analy
sis P
eriod
(min)
15c
Criti
cal L
ane G
roup

HC
M S
igna
lized
Inte
rsec
tion
Cap
acity
Ana
lysi
s4:
In-n
-Out
Driv
eway
/US
101
SB
Ram
ps &
Lak
evill
e S
t/Lak
evill
e H
wy
7/1/20
15
Bayw
ood A
partm
ents
Traff
ic Im
pact
Stud
ySy
nchr
o 8 R
epor
tBa
selin
e AM
Peak
Hou
r - N
o Pro
ject
W-T
rans
Move
ment
EBL
EBT
EBR
WBL
WBT
WBR
NBL
NBT
NBR
SBL
SBT
SBR
Lane
Con
figur
ation
sVo
lume (
vph)
330
766
66
598
379
43
710
233
166
Ideal
Flow
(vphp
l)19
0019
0019
0019
0019
0019
0019
0019
0019
0019
0019
0019
00To
tal Lo
st tim
e (s)
4.55.0
3.55.0
5.03.5
4.94.9
4.5La
ne U
til. F
actor
0.97
0.95
1.00
0.95
1.00
1.00
0.95
0.95
1.00
Frpb
, ped
/bike
s1.0
01.0
01.0
01.0
01.0
00.9
41.0
01.0
01.0
0Flp
b, pe
d/bike
s1.0
01.0
01.0
01.0
01.0
01.0
01.0
01.0
01.0
0Fr
t1.0
01.0
01.0
01.0
00.8
50.9
31.0
01.0
00.8
5Flt
Pro
tected
0.95
1.00
0.95
1.00
1.00
0.99
0.95
0.95
1.00
Satd.
Flow
(pro
t)34
3332
8017
7031
3915
8316
0916
8116
8615
83Flt
Per
mitte
d0.9
51.0
00.9
51.0
01.0
00.9
90.9
50.9
51.0
0Sa
td. F
low (p
erm)
3433
3280
1770
3139
1583
1609
1681
1686
1583
Peak
-hou
r fac
tor, P
HF0.9
60.9
60.9
60.9
60.9
60.9
60.9
60.9
60.9
60.9
60.9
60.9
6Ad
j. Flow
(vph
)34
479
86
662
339
54
37
1066
317
3RT
OR R
educ
tion (
vph)
01
00
028
50
70
00
81La
ne G
roup
Flow
(vph
)34
480
30
662
311
00
70
533
536
92Co
nfl. P
eds.
(#/hr
)2
3Co
nfl. B
ikes (
#/hr)
9He
avy V
ehicl
es (%
)2%
10%
2%2%
15%
2%2%
2%2%
2%2%
2%Tu
rn T
ype
Prot
NAPr
otNA
Perm
Split
NASp
litNA
pm+o
vPr
otecte
d Pha
ses
52
16
88
44
5Pe
rmitte
d Pha
ses
64
Actua
ted G
reen
, G (s
)18
.949
.31.2
30.6
30.6
2.839
.839
.858
.7Ef
fectiv
e Gre
en, g
(s)
18.9
49.3
1.230
.630
.62.8
39.8
39.8
58.7
Actua
ted g/
C Ra
tio0.1
70.4
50.0
10.2
80.2
80.0
30.3
60.3
60.5
3Cl
eara
nce T
ime (
s)4.5
5.03.5
5.05.0
3.54.9
4.94.5
Vehic
le Ex
tensio
n (s)
3.03.0
2.03.0
3.03.0
3.03.0
3.0La
ne G
rp C
ap (v
ph)
589
1470
1987
344
040
608
610
909
v/s R
atio P
rot
0.10
c0.24
0.00
c0.20
c0.00
0.32
c0.32
0.02
v/s R
atio P
erm
0.07
0.04
v/c R
atio
0.58
0.55
0.32
0.71
0.25
0.18
0.88
0.88
0.10
Unifo
rm D
elay,
d141
.922
.254
.035
.830
.852
.532
.832
.812
.6Pr
ogre
ssion
Fac
tor1.0
21.1
21.2
60.7
31.1
61.0
01.0
01.0
01.0
0Inc
reme
ntal D
elay,
d21.3
1.23.2
4.51.2
2.213
.413
.60.0
Delay
(s)
43.9
26.2
71.3
30.6
37.1
54.6
46.2
46.4
12.7
Leve
l of S
ervic
eD
CE
CD
DD
DB
Appr
oach
Dela
y (s)
31.5
33.4
54.6
41.6
Appr
oach
LOS
CC
DD
Inter
secti
on S
umma
ryHC
M 20
00 C
ontro
l Dela
y35
.8HC
M 20
00 Le
vel o
f Ser
vice
DHC
M 20
00 V
olume
to C
apac
ity ra
tio0.7
5Ac
tuated
Cyc
le Le
ngth
(s)
110.0
Sum
of los
t time
(s)
17.9
Inter
secti
on C
apac
ity U
tiliza
tion
73.0%
ICU
Leve
l of S
ervic
eD
Analy
sis P
eriod
(min)
15c
Criti
cal L
ane G
roup
HC
M S
igna
lized
Inte
rsec
tion
Cap
acity
Ana
lysi
s4:
In-n
-Out
Driv
eway
/US
101
SB
Ram
ps &
Lak
evill
e S
t/Lak
evill
e H
wy
7/1/20
15
Bayw
ood A
partm
ents
Traff
ic Im
pact
Stud
ySy
nchr
o 8 R
epor
tBa
selin
e PM
Peak
Hou
r - N
o Pro
ject
W-T
rans
Move
ment
EBL
EBT
EBR
WBL
WBT
WBR
NBL
NBT
NBR
SBL
SBT
SBR
Lane
Con
figur
ation
sVo
lume (
vph)
169
740
827
882
304
810
1961
912
252
Ideal
Flow
(vphp
l)19
0019
0019
0019
0019
0019
0019
0019
0019
0019
0019
0019
00To
tal Lo
st tim
e (s)
4.05.0
4.05.0
5.04.4
4.94.9
4.0La
ne U
til. F
actor
0.97
0.95
1.00
0.95
1.00
1.00
0.95
0.95
1.00
Frpb
, ped
/bike
s1.0
01.0
01.0
01.0
01.0
00.9
31.0
01.0
00.9
8Flp
b, pe
d/bike
s1.0
01.0
01.0
01.0
01.0
01.0
01.0
01.0
01.0
0Fr
t1.0
01.0
01.0
01.0
00.8
50.9
31.0
01.0
00.8
5Flt
Pro
tected
0.95
1.00
0.95
1.00
1.00
0.99
0.95
0.95
1.00
Satd.
Flow
(pro
t)34
3334
0117
7033
1215
8316
0216
8116
8815
55Flt
Per
mitte
d0.9
51.0
00.9
51.0
01.0
00.9
90.9
50.9
51.0
0Sa
td. F
low (p
erm)
3433
3401
1770
3312
1583
1602
1681
1688
1555
Peak
-hou
r fac
tor, P
HF0.9
80.9
80.9
80.9
80.9
80.9
80.9
80.9
80.9
80.9
80.9
80.9
8Ad
j. Flow
(vph
)17
275
58
2890
031
08
1019
632
1225
7RT
OR R
educ
tion (
vph)
01
00
015
20
180
00
98La
ne G
roup
Flow
(vph
)17
276
20
2890
015
80
190
322
322
159
Confl
. Ped
s. (#
/hr)
22
55
5Co
nfl. B
ikes (
#/hr)
158
Heav
y Veh
icles
(%)
2%6%
2%2%
9%2%
2%2%
2%2%
2%2%
Turn
Typ
ePr
otNA
Prot
NAPe
rmSp
litNA
Split
NApm
+ov
Prote
cted P
hase
s5
21
68
84
45
Perm
itted P
hase
s6
4Ac
tuated
Gre
en, G
(s)
12.3
69.7
14.0
71.4
71.4
5.532
.532
.544
.8Ef
fectiv
e Gre
en, g
(s)
12.3
69.7
14.0
71.4
71.4
5.532
.532
.544
.8Ac
tuated
g/C
Ratio
0.09
0.50
0.10
0.51
0.51
0.04
0.23
0.23
0.32
Clea
ranc
e Tim
e (s)
4.05.0
4.05.0
5.04.4
4.94.9
4.0Ve
hicle
Exten
sion (
s)3.0
3.02.0
3.03.0
2.03.0
3.03.0
Lane
Grp
Cap
(vph
)30
116
9317
716
8980
762
390
391
497
v/s R
atio P
rot
c0.05
0.22
0.02
c0.27
c0.01
c0.19
0.19
0.03
v/s R
atio P
erm
0.10
0.07
v/c R
atio
0.57
0.45
0.16
0.53
0.20
0.30
0.83
0.82
0.32
Unifo
rm D
elay,
d161
.322
.857
.623
.118
.765
.451
.151
.036
.1Pr
ogre
ssion
Fac
tor0.8
60.8
01.0
01.0
31.4
91.0
01.0
01.0
01.0
0Inc
reme
ntal D
elay,
d22.4
0.80.1
1.10.5
1.013
.313
.10.4
Delay
(s)
54.9
19.1
57.8
24.8
28.2
66.4
64.4
64.2
36.4
Leve
l of S
ervic
eD
BE
CC
EE
ED
Appr
oach
Dela
y (s)
25.7
26.4
66.4
56.3
Appr
oach
LOS
CC
EE
Inter
secti
on S
umma
ryHC
M 20
00 C
ontro
l Dela
y35
.3HC
M 20
00 Le
vel o
f Ser
vice
DHC
M 20
00 V
olume
to C
apac
ity ra
tio0.6
0Ac
tuated
Cyc
le Le
ngth
(s)
140.0
Sum
of los
t time
(s)
18.3
Inter
secti
on C
apac
ity U
tiliza
tion
65.1%
ICU
Leve
l of S
ervic
eC
Analy
sis P
eriod
(min)
15c
Criti
cal L
ane G
roup
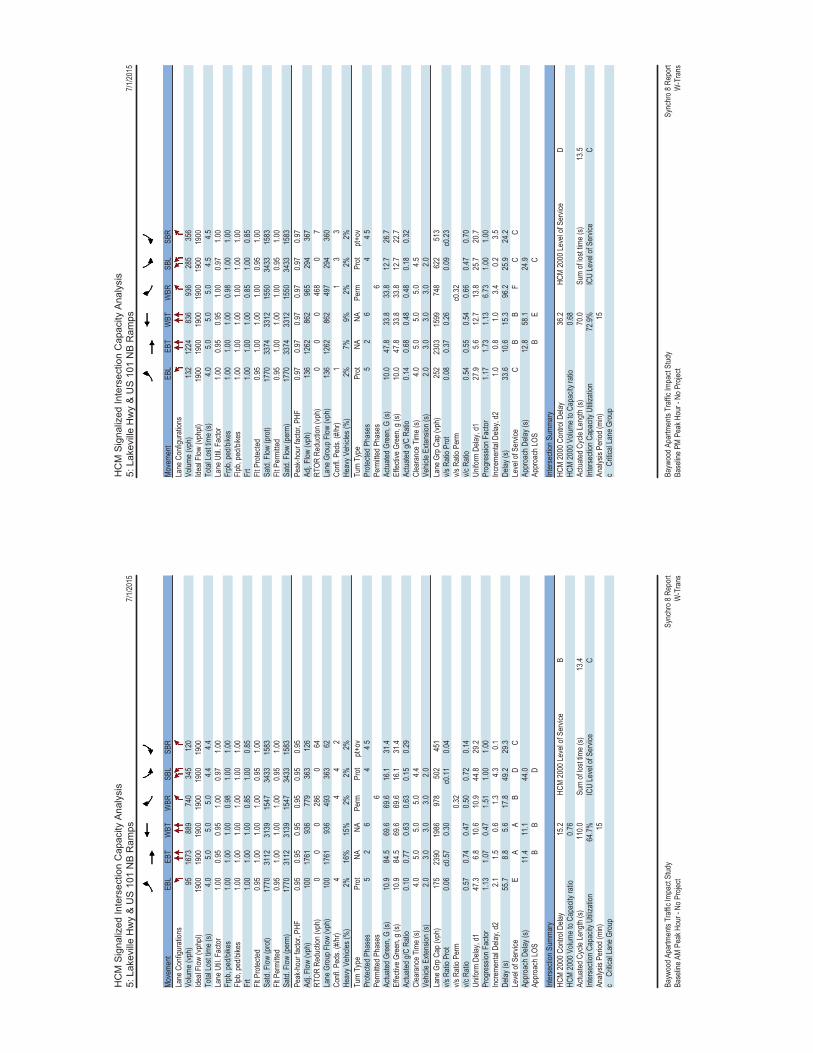
HC
M S
igna
lized
Inte
rsec
tion
Cap
acity
Ana
lysi
s5:
Lak
evill
e H
wy
& U
S 1
01 N
B R
amps
7/1/20
15
Bayw
ood A
partm
ents
Traff
ic Im
pact
Stud
ySy
nchr
o 8 R
epor
tBa
selin
e AM
Peak
Hou
r - N
o Pro
ject
W-T
rans
Move
ment
EBL
EBT
WBT
WBR
SBL
SBR
Lane
Con
figur
ation
sVo
lume (
vph)
9516
7388
974
034
512
0Ide
al Flo
w (vp
hpl)
1900
1900
1900
1900
1900
1900
Total
Lost
time (
s)4.0
5.05.0
5.04.4
4.4La
ne U
til. F
actor
1.00
0.95
0.95
1.00
0.97
1.00
Frpb
, ped
/bike
s1.0
01.0
01.0
00.9
81.0
01.0
0Flp
b, pe
d/bike
s1.0
01.0
01.0
01.0
01.0
01.0
0Fr
t1.0
01.0
01.0
00.8
51.0
00.8
5Flt
Pro
tected
0.95
1.00
1.00
1.00
0.95
1.00
Satd.
Flow
(pro
t)17
7031
1231
3915
4734
3315
83Flt
Per
mitte
d0.9
51.0
01.0
01.0
00.9
51.0
0Sa
td. F
low (p
erm)
1770
3112
3139
1547
3433
1583
Peak
-hou
r fac
tor, P
HF0.9
50.9
50.9
50.9
50.9
50.9
5Ad
j. Flow
(vph
)10
017
6193
677
936
312
6RT
OR R
educ
tion (
vph)
00
028
60
64La
ne G
roup
Flow
(vph
)10
017
6193
649
336
362
Confl
. Ped
s. (#
/hr)
44
42
Heav
y Veh
icles
(%)
2%16
%15
%2%
2%2%
Turn
Typ
ePr
otNA
NAPe
rmPr
otpt+
ovPr
otecte
d Pha
ses
52
64
4 5Pe
rmitte
d Pha
ses
6Ac
tuated
Gre
en, G
(s)
10.9
84.5
69.6
69.6
16.1
31.4
Effec
tive G
reen
, g (s
)10
.984
.569
.669
.616
.131
.4Ac
tuated
g/C
Ratio
0.10
0.77
0.63
0.63
0.15
0.29
Clea
ranc
e Tim
e (s)
4.05.0
5.05.0
4.4Ve
hicle
Exten
sion (
s)2.0
3.03.0
3.02.0
Lane
Grp
Cap
(vph
)17
523
9019
8697
850
245
1v/s
Rati
o Pro
t0.0
6c0
.570.3
0c0
.110.0
4v/s
Rati
o Per
m0.3
2v/c
Rati
o0.5
70.7
40.4
70.5
00.7
20.1
4Un
iform
Dela
y, d1
47.3
6.810
.610
.944
.829
.2Pr
ogre
ssion
Fac
tor1.1
31.0
70.4
71.5
11.0
01.0
0Inc
reme
ntal D
elay,
d22.1
1.50.6
1.34.3
0.1De
lay (s
)55
.78.8
5.617
.849
.229
.3Le
vel o
f Ser
vice
EA
AB
DC
Appr
oach
Dela
y (s)
11.4
11.1
44.0
Appr
oach
LOS
BB
D
Inter
secti
on S
umma
ryHC
M 20
00 C
ontro
l Dela
y15
.2HC
M 20
00 Le
vel o
f Ser
vice
BHC
M 20
00 V
olume
to C
apac
ity ra
tio0.7
6Ac
tuated
Cyc
le Le
ngth
(s)
110.0
Sum
of los
t time
(s)
13.4
Inter
secti
on C
apac
ity U
tiliza
tion
64.7%
ICU
Leve
l of S
ervic
eC
Analy
sis P
eriod
(min)
15c
Criti
cal L
ane G
roup
HC
M S
igna
lized
Inte
rsec
tion
Cap
acity
Ana
lysi
s5:
Lak
evill
e H
wy
& U
S 1
01 N
B R
amps
7/1/20
15
Bayw
ood A
partm
ents
Traff
ic Im
pact
Stud
ySy
nchr
o 8 R
epor
tBa
selin
e PM
Peak
Hou
r - N
o Pro
ject
W-T
rans
Move
ment
EBL
EBT
WBT
WBR
SBL
SBR
Lane
Con
figur
ation
sVo
lume (
vph)
132
1224
836
936
285
356
Ideal
Flow
(vphp
l)19
0019
0019
0019
0019
0019
00To
tal Lo
st tim
e (s)
4.05.0
5.05.0
4.54.5
Lane
Util.
Fac
tor1.0
00.9
50.9
51.0
00.9
71.0
0Fr
pb, p
ed/bi
kes
1.00
1.00
1.00
0.98
1.00
1.00
Flpb,
ped/b
ikes
1.00
1.00
1.00
1.00
1.00
1.00
Frt
1.00
1.00
1.00
0.85
1.00
0.85
Flt P
rotec
ted0.9
51.0
01.0
01.0
00.9
51.0
0Sa
td. F
low (p
rot)
1770
3374
3312
1550
3433
1583
Flt P
ermi
tted
0.95
1.00
1.00
1.00
0.95
1.00
Satd.
Flow
(per
m)17
7033
7433
1215
5034
3315
83Pe
ak-h
our f
actor
, PHF
0.97
0.97
0.97
0.97
0.97
0.97
Adj. F
low (v
ph)
136
1262
862
965
294
367
RTOR
Red
uctio
n (vp
h)0
00
468
07
Lane
Gro
up F
low (v
ph)
136
1262
862
497
294
360
Confl
. Ped
s. (#
/hr)
11
33
Heav
y Veh
icles
(%)
2%7%
9%2%
2%2%
Turn
Typ
ePr
otNA
NAPe
rmPr
otpt+
ovPr
otecte
d Pha
ses
52
64
4 5Pe
rmitte
d Pha
ses
6Ac
tuated
Gre
en, G
(s)
10.0
47.8
33.8
33.8
12.7
26.7
Effec
tive G
reen
, g (s
)10
.047
.833
.833
.812
.722
.7Ac
tuated
g/C
Ratio
0.14
0.68
0.48
0.48
0.18
0.32
Clea
ranc
e Tim
e (s)
4.05.0
5.05.0
4.5Ve
hicle
Exten
sion (
s)2.0
3.03.0
3.02.0
Lane
Grp
Cap
(vph
)25
223
0315
9974
862
251
3v/s
Rati
o Pro
t0.0
80.3
70.2
60.0
9c0
.23v/s
Rati
o Per
mc0
.32v/c
Rati
o0.5
40.5
50.5
40.6
60.4
70.7
0Un
iform
Dela
y, d1
27.9
5.612
.713
.825
.720
.7Pr
ogre
ssion
Fac
tor1.1
71.7
31.1
36.7
31.0
01.0
0Inc
reme
ntal D
elay,
d21.0
0.81.0
3.40.2
3.5De
lay (s
)33
.610
.615
.396
.225
.924
.2Le
vel o
f Ser
vice
CB
BF
CC
Appr
oach
Dela
y (s)
12.8
58.1
24.9
Appr
oach
LOS
BE
C
Inter
secti
on S
umma
ryHC
M 20
00 C
ontro
l Dela
y36
.2HC
M 20
00 Le
vel o
f Ser
vice
DHC
M 20
00 V
olume
to C
apac
ity ra
tio0.6
8Ac
tuated
Cyc
le Le
ngth
(s)
70.0
Sum
of los
t time
(s)
13.5
Inter
secti
on C
apac
ity U
tiliza
tion
72.9%
ICU
Leve
l of S
ervic
eC
Analy
sis P
eriod
(min)
15c
Criti
cal L
ane G
roup

HC
M S
igna
lized
Inte
rsec
tion
Cap
acity
Ana
lysi
s6:
Bay
woo
d D
r & L
akev
ille
Hw
y7/1
/2015
Bayw
ood A
partm
ents
Traff
ic Im
pact
Stud
ySy
nchr
o 8 R
epor
tBa
selin
e AM
Peak
Hou
r - N
o Pro
ject
W-T
rans
Move
ment
EBL
EBT
EBR
WBL
WBT
WBR
NBL
NBT
NBR
SBL
SBT
SBR
Lane
Con
figur
ation
sVo
lume (
vph)
6918
2235
1512
9831
4913
1728
2130
4Ide
al Flo
w (vp
hpl)
1900
1900
1900
1900
1900
1900
1900
1900
1900
1900
1900
1900
Total
Lost
time (
s)3.5
5.34.1
5.33.0
4.43.0
4.44.4
Lane
Util.
Fac
tor1.0
00.9
51.0
00.9
51.0
01.0
01.0
01.0
01.0
0Fr
pb, p
ed/bi
kes
1.00
1.00
1.00
1.00
1.00
0.99
1.00
1.00
1.00
Flpb,
ped/b
ikes
1.00
1.00
1.00
1.00
1.00
1.00
1.00
1.00
1.00
Frt
1.00
1.00
1.00
1.00
1.00
0.92
1.00
1.00
0.85
Flt P
rotec
ted0.9
51.0
00.9
51.0
00.9
51.0
00.9
51.0
01.0
0Sa
td. F
low (p
rot)
1770
3109
1770
3135
1770
1682
1770
1863
1583
Flt P
ermi
tted
0.95
1.00
0.95
1.00
0.95
1.00
0.95
1.00
1.00
Satd.
Flow
(per
m)17
7031
0917
7031
3517
7016
8217
7018
6315
83Pe
ak-h
our f
actor
, PHF
0.95
0.95
0.95
0.95
0.95
0.95
0.95
0.95
0.95
0.95
0.95
0.95
Adj. F
low (v
ph)
7319
1837
1613
6633
5214
1829
2232
0RT
OR R
educ
tion (
vph)
01
00
10
016
00
010
7La
ne G
roup
Flow
(vph
)73
1954
016
1398
052
160
2922
213
Confl
. Ped
s. (#
/hr)
101
110
77
Confl
. Bike
s (#/h
r)4
23
Heav
y Veh
icles
(%)
2%16
%2%
2%15
%2%
2%2%
2%2%
2%2%
Turn
Typ
ePr
otNA
Prot
NAPr
otNA
Prot
NApt+
ovPr
otecte
d Pha
ses
52
16
38
74
4 5Pe
rmitte
d Pha
ses
Actua
ted G
reen
, G (s
)17
.073
.92.7
60.2
6.810
.26.4
9.826
.8Ef
fectiv
e Gre
en, g
(s)
17.0
73.9
2.760
.26.8
10.2
6.49.8
26.8
Actua
ted g/
C Ra
tio0.1
50.6
70.0
20.5
50.0
60.0
90.0
60.0
90.2
4Cl
eara
nce T
ime (
s)3.5
5.34.1
5.33.0
4.43.0
4.4Ve
hicle
Exten
sion (
s)3.0
4.02.0
4.02.0
2.02.0
2.0La
ne G
rp C
ap (v
ph)
273
2088
4317
1510
915
510
216
538
5v/s
Rati
o Pro
t0.0
4c0
.630.0
1c0
.45c0
.030.0
10.0
20.0
1c0
.13v/s
Rati
o Per
mv/c
Rati
o0.2
70.9
40.3
70.8
20.4
80.1
00.2
80.1
30.5
5Un
iform
Dela
y, d1
41.0
16.0
52.8
20.4
49.9
45.7
49.6
46.2
36.4
Prog
ress
ion F
actor
0.95
0.88
1.23
0.62
1.00
1.00
1.00
1.00
1.00
Incre
menta
l Dela
y, d2
0.48.3
1.73.7
1.20.1
0.60.1
1.0De
lay (s
)39
.522
.366
.916
.351
.145
.850
.246
.337
.4Le
vel o
f Ser
vice
DC
EB
DD
DD
DAp
proa
ch D
elay (
s)22
.916
.949
.138
.9Ap
proa
ch LO
SC
BD
D
Inter
secti
on S
umma
ryHC
M 20
00 C
ontro
l Dela
y22
.8HC
M 20
00 Le
vel o
f Ser
vice
CHC
M 20
00 V
olume
to C
apac
ity ra
tio0.8
7Ac
tuated
Cyc
le Le
ngth
(s)
110.0
Sum
of los
t time
(s)
16.8
Inter
secti
on C
apac
ity U
tiliza
tion
77.7%
ICU
Leve
l of S
ervic
eD
Analy
sis P
eriod
(min)
15c
Criti
cal L
ane G
roup
HC
M S
igna
lized
Inte
rsec
tion
Cap
acity
Ana
lysi
s6:
Bay
woo
d D
r & L
akev
ille
Hw
y7/1
/2015
Bayw
ood A
partm
ents
Traff
ic Im
pact
Stud
ySy
nchr
o 8 R
epor
tBa
selin
e PM
Peak
Hou
r - N
o Pro
ject
W-T
rans
Move
ment
EBL
EBT
EBR
WBL
WBT
WBR
NBL
NBT
NBR
SBL
SBT
SBR
Lane
Con
figur
ation
sVo
lume (
vph)
194
1232
2720
1509
3411
433
1923
1413
6Ide
al Flo
w (vp
hpl)
1900
1900
1900
1900
1900
1900
1900
1900
1900
1900
1900
1900
Total
Lost
time (
s)3.5
5.34.1
5.33.0
4.43.0
4.44.4
Lane
Util.
Fac
tor1.0
00.9
51.0
00.9
51.0
01.0
01.0
01.0
01.0
0Fr
pb, p
ed/bi
kes
1.00
1.00
1.00
1.00
1.00
0.99
1.00
1.00
1.00
Flpb,
ped/b
ikes
1.00
1.00
1.00
1.00
1.00
1.00
1.00
1.00
1.00
Frt
1.00
1.00
1.00
1.00
1.00
0.95
1.00
1.00
0.85
Flt P
rotec
ted0.9
51.0
00.9
51.0
00.9
51.0
00.9
51.0
01.0
0Sa
td. F
low (p
rot)
1770
3362
1770
3305
1770
1739
1770
1863
1583
Flt P
ermi
tted
0.95
1.00
0.95
1.00
0.95
1.00
0.95
1.00
1.00
Satd.
Flow
(per
m)17
7033
6217
7033
0517
7017
3917
7018
6315
83Pe
ak-h
our f
actor
, PHF
0.99
0.99
0.99
0.99
0.99
0.99
0.99
0.99
0.99
0.99
0.99
0.99
Adj. F
low (v
ph)
196
1244
2720
1524
3411
533
1923
1413
7RT
OR R
educ
tion (
vph)
01
00
10
017
00
077
Lane
Gro
up F
low (v
ph)
196
1270
020
1557
011
535
023
1460
Confl
. Ped
s. (#
/hr)
211
112
111
111
Confl
. Bike
s (#/h
r)4
23
Heav
y Veh
icles
(%)
2%7%
2%2%
9%2%
2%2%
2%2%
2%2%
Turn
Typ
ePr
otNA
Prot
NAPr
otNA
Prot
NApt+
ovPr
otecte
d Pha
ses
52
16
38
74
4 5Pe
rmitte
d Pha
ses
Actua
ted G
reen
, G (s
)19
.298
.74.2
84.3
13.4
12.7
7.66.9
26.1
Effec
tive G
reen
, g (s
)19
.298
.74.2
84.3
13.4
12.7
7.66.9
26.1
Actua
ted g/
C Ra
tio0.1
40.7
10.0
30.6
00.1
00.0
90.0
50.0
50.1
9Cl
eara
nce T
ime (
s)3.5
5.34.1
5.33.0
4.43.0
4.4Ve
hicle
Exten
sion (
s)3.0
4.02.0
4.02.0
2.02.0
2.0La
ne G
rp C
ap (v
ph)
242
2370
5319
9016
915
796
9129
5v/s
Rati
o Pro
tc0
.110.3
80.0
1c0
.47c0
.060.0
2c0
.010.0
10.0
4v/s
Rati
o Per
mv/c
Rati
o0.8
10.5
40.3
80.7
80.6
80.2
20.2
40.1
50.2
0Un
iform
Dela
y, d1
58.6
9.866
.621
.061
.259
.163
.463
.848
.1Pr
ogre
ssion
Fac
tor0.9
01.0
81.2
70.5
51.0
01.0
01.0
01.0
01.0
0Inc
reme
ntal D
elay,
d216
.70.8
1.12.2
8.60.3
0.50.3
0.1De
lay (s
)69
.311
.485
.813
.669
.959
.363
.964
.048
.3Le
vel o
f Ser
vice
EB
FB
EE
EE
DAp
proa
ch D
elay (
s)19
.214
.566
.651
.6Ap
proa
ch LO
SB
BE
D
Inter
secti
on S
umma
ryHC
M 20
00 C
ontro
l Dela
y21
.0HC
M 20
00 Le
vel o
f Ser
vice
CHC
M 20
00 V
olume
to C
apac
ity ra
tio0.7
5Ac
tuated
Cyc
le Le
ngth
(s)
140.0
Sum
of los
t time
(s)
16.8
Inter
secti
on C
apac
ity U
tiliza
tion
81.1%
ICU
Leve
l of S
ervic
eD
Analy
sis P
eriod
(min)
15c
Criti
cal L
ane G
roup

HC
M S
igna
lized
Inte
rsec
tion
Cap
acity
Ana
lysi
s7:
Cas
a G
rand
e R
d &
Lak
evill
e H
wy
7/1/20
15
Bayw
ood A
partm
ents
Traff
ic Im
pact
Stud
ySy
nchr
o 8 R
epor
tBa
selin
e AM
Peak
Hou
r - N
o Pro
ject
W-T
rans
Move
ment
EBL
EBT
EBR
WBL
WBT
WBR
NBL
NBT
NBR
SBL
SBT
SBR
Lane
Con
figur
ation
sVo
lume (
vph)
135
1699
5521
975
1415
367
4316
4423
1Ide
al Flo
w (vp
hpl)
1900
1900
1900
1900
1900
1900
1900
1900
1900
1900
1900
1900
Total
Lost
time (
s)4.5
5.54.5
5.54.0
4.14.1
4.14.1
Lane
Util.
Fac
tor1.0
00.9
51.0
00.9
51.0
01.0
01.0
01.0
01.0
0Fr
pb, p
ed/bi
kes
1.00
1.00
1.00
1.00
1.00
1.00
0.99
1.00
0.98
Flpb,
ped/b
ikes
1.00
1.00
1.00
1.00
1.00
1.00
1.00
1.00
1.00
Frt
1.00
1.00
1.00
1.00
0.85
1.00
0.94
1.00
0.85
Flt P
rotec
ted0.9
51.0
00.9
51.0
01.0
00.9
51.0
00.9
91.0
0Sa
td. F
low (p
rot)
1770
3106
1770
3139
1583
1761
1743
1837
1552
Flt P
ermi
tted
0.95
1.00
0.95
1.00
1.00
0.71
1.00
0.91
1.00
Satd.
Flow
(per
m)17
7031
0617
7031
3915
8313
2417
4316
9915
52Pe
ak-h
our f
actor
, PHF
0.91
0.91
0.91
0.91
0.91
0.91
0.91
0.91
0.91
0.91
0.91
0.91
Adj. F
low (v
ph)
148
1867
6023
1071
1516
874
4718
4825
4RT
OR R
educ
tion (
vph)
01
00
00
024
00
020
9La
ne G
roup
Flow
(vph
)14
819
260
2310
7115
168
970
066
45Co
nfl. P
eds.
(#/hr
)4
44
11
4Co
nfl. B
ikes (
#/hr)
42
1He
avy V
ehicl
es (%
)2%
16%
2%2%
15%
2%2%
2%2%
2%2%
2%Tu
rn T
ype
Prot
NAPr
otNA
Free
Perm
NAPe
rmNA
Perm
Prote
cted P
hase
s5
21
68
4Pe
rmitte
d Pha
ses
Free
84
4Ac
tuated
Gre
en, G
(s)
13.4
73.0
3.663
.211
0.019
.319
.319
.319
.3Ef
fectiv
e Gre
en, g
(s)
13.4
73.0
3.663
.211
0.019
.319
.319
.319
.3Ac
tuated
g/C
Ratio
0.12
0.66
0.03
0.57
1.00
0.18
0.18
0.18
0.18
Clea
ranc
e Tim
e (s)
4.55.5
4.55.5
4.14.1
4.14.1
Vehic
le Ex
tensio
n (s)
2.03.0
2.03.0
3.03.0
2.52.5
Lane
Grp
Cap
(vph
)21
520
6157
1803
1583
232
305
298
272
v/s R
atio P
rot
0.08
c0.62
0.01
c0.34
0.06
v/s R
atio P
erm
0.01
c0.13
0.04
0.03
v/c R
atio
0.69
0.93
0.40
0.59
0.01
0.72
0.32
0.22
0.16
Unifo
rm D
elay,
d146
.316
.452
.115
.10.0
42.8
39.6
38.9
38.5
Prog
ress
ion F
actor
1.12
0.36
0.68
0.36
1.00
1.00
1.00
1.00
1.00
Incre
menta
l Dela
y, d2
3.95.6
1.51.2
0.010
.70.6
0.30.2
Delay
(s)
55.6
11.5
37.0
6.70.0
53.5
40.2
39.2
38.7
Leve
l of S
ervic
eE
BD
AA
DD
DD
Appr
oach
Dela
y (s)
14.6
7.347
.938
.8Ap
proa
ch LO
SB
AD
D
Inter
secti
on S
umma
ryHC
M 20
00 C
ontro
l Dela
y17
.0HC
M 20
00 Le
vel o
f Ser
vice
BHC
M 20
00 V
olume
to C
apac
ity ra
tio0.8
9Ac
tuated
Cyc
le Le
ngth
(s)
110.0
Sum
of los
t time
(s)
14.1
Inter
secti
on C
apac
ity U
tiliza
tion
80.8%
ICU
Leve
l of S
ervic
eD
Analy
sis P
eriod
(min)
15c
Criti
cal L
ane G
roup
HC
M S
igna
lized
Inte
rsec
tion
Cap
acity
Ana
lysi
s7:
Cas
a G
rand
e R
d &
Lak
evill
e H
wy
7/1/20
15
Bayw
ood A
partm
ents
Traff
ic Im
pact
Stud
ySy
nchr
o 8 R
epor
tBa
selin
e PM
Peak
Hou
r - N
o Pro
ject
W-T
rans
Move
ment
EBL
EBT
EBR
WBL
WBT
WBR
NBL
NBT
NBR
SBL
SBT
SBR
Lane
Con
figur
ation
sVo
lume (
vph)
188
958
145
4713
9132
128
7723
765
86Ide
al Flo
w (vp
hpl)
1900
1900
1900
1900
1900
1900
1900
1900
1900
1900
1900
1900
Total
Lost
time (
s)4.5
5.54.5
5.54.0
4.14.1
4.14.1
Lane
Util.
Fac
tor1.0
00.9
51.0
00.9
51.0
01.0
01.0
01.0
01.0
0Fr
pb, p
ed/bi
kes
1.00
0.99
1.00
1.00
1.00
1.00
1.00
1.00
0.98
Flpb,
ped/b
ikes
1.00
1.00
1.00
1.00
1.00
1.00
1.00
1.00
1.00
Frt
1.00
0.98
1.00
1.00
0.85
1.00
0.97
1.00
0.85
Flt P
rotec
ted0.9
51.0
00.9
51.0
01.0
00.9
51.0
01.0
01.0
0Sa
td. F
low (p
rot)
1770
3082
1770
3139
1583
1762
1791
1854
1552
Flt P
ermi
tted
0.95
1.00
0.95
1.00
1.00
0.67
1.00
0.97
1.00
Satd.
Flow
(per
m)17
7030
8217
7031
3915
8312
3717
9118
1615
52Pe
ak-h
our f
actor
, PHF
0.95
0.95
0.95
0.95
0.95
0.95
0.95
0.95
0.95
0.95
0.95
0.95
Adj. F
low (v
ph)
198
1008
153
4914
6434
135
8124
768
91RT
OR R
educ
tion (
vph)
09
00
00
08
00
078
Lane
Gro
up F
low (v
ph)
198
1152
049
1464
3413
597
00
7513
Confl
. Ped
s. (#
/hr)
1010
32
23
Confl
. Bike
s (#/h
r)4
21
Heav
y Veh
icles
(%)
2%16
%2%
2%15
%2%
2%2%
2%2%
2%2%
Turn
Typ
ePr
otNA
Prot
NAFr
eePe
rmNA
Perm
NAPe
rmPr
otecte
d Pha
ses
52
16
84
Perm
itted P
hase
sFr
ee8
44
Actua
ted G
reen
, G (s
)19
.190
.016
.387
.214
0.019
.619
.619
.619
.6Ef
fectiv
e Gre
en, g
(s)
19.1
90.0
16.3
87.2
140.0
19.6
19.6
19.6
19.6
Actua
ted g/
C Ra
tio0.1
40.6
40.1
20.6
21.0
00.1
40.1
40.1
40.1
4Cl
eara
nce T
ime (
s)4.5
5.54.5
5.54.1
4.14.1
4.1Ve
hicle
Exten
sion (
s)2.0
3.02.0
3.03.0
3.02.5
2.5La
ne G
rp C
ap (v
ph)
241
1981
206
1955
1583
173
250
254
217
v/s R
atio P
rot
c0.11
0.37
0.03
c0.47
0.05
v/s R
atio P
erm
0.02
c0.11
0.04
0.01
v/c R
atio
0.82
0.58
0.24
0.75
0.02
0.78
0.39
0.30
0.06
Unifo
rm D
elay,
d158
.814
.356
.218
.70.0
58.1
54.8
54.0
52.2
Prog
ress
ion F
actor
0.88
0.88
0.74
0.59
1.00
1.00
1.00
1.00
1.00
Incre
menta
l Dela
y, d2
17.1
1.10.1
1.20.0
20.0
1.00.5
0.1De
lay (s
)68
.613
.641
.812
.20.0
78.2
55.8
54.5
52.3
Leve
l of S
ervic
eE
BD
BA
EE
DD
Appr
oach
Dela
y (s)
21.6
12.9
68.4
53.3
Appr
oach
LOS
CB
ED
Inter
secti
on S
umma
ryHC
M 20
00 C
ontro
l Dela
y22
.5HC
M 20
00 Le
vel o
f Ser
vice
CHC
M 20
00 V
olume
to C
apac
ity ra
tio0.7
6Ac
tuated
Cyc
le Le
ngth
(s)
140.0
Sum
of los
t time
(s)
14.1
Inter
secti
on C
apac
ity U
tiliza
tion
74.8%
ICU
Leve
l of S
ervic
eD
Analy
sis P
eriod
(min)
15c
Criti
cal L
ane G
roup
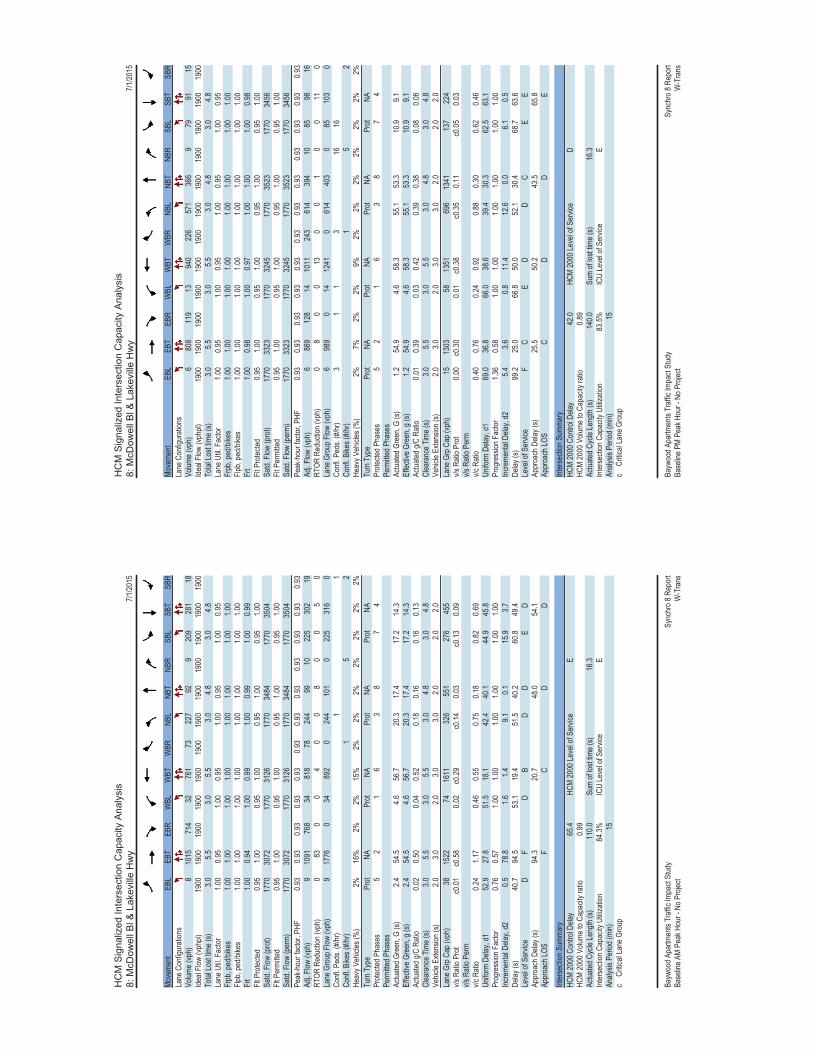
HC
M S
igna
lized
Inte
rsec
tion
Cap
acity
Ana
lysi
s8:
McD
owel
l Bl &
Lak
evill
e H
wy
7/1/20
15
Bayw
ood A
partm
ents
Traff
ic Im
pact
Stud
ySy
nchr
o 8 R
epor
tBa
selin
e AM
Peak
Hou
r - N
o Pro
ject
W-T
rans
Move
ment
EBL
EBT
EBR
WBL
WBT
WBR
NBL
NBT
NBR
SBL
SBT
SBR
Lane
Con
figur
ation
sVo
lume (
vph)
810
1571
432
761
7322
792
920
928
118
Ideal
Flow
(vphp
l)19
0019
0019
0019
0019
0019
0019
0019
0019
0019
0019
0019
00To
tal Lo
st tim
e (s)
3.05.5
3.05.5
3.04.8
3.04.8
Lane
Util.
Fac
tor1.0
00.9
51.0
00.9
51.0
00.9
51.0
00.9
5Fr
pb, p
ed/bi
kes
1.00
1.00
1.00
1.00
1.00
1.00
1.00
1.00
Flpb,
ped/b
ikes
1.00
1.00
1.00
1.00
1.00
1.00
1.00
1.00
Frt
1.00
0.94
1.00
0.99
1.00
0.99
1.00
0.99
Flt P
rotec
ted0.9
51.0
00.9
51.0
00.9
51.0
00.9
51.0
0Sa
td. F
low (p
rot)
1770
3072
1770
3126
1770
3484
1770
3504
Flt P
ermi
tted
0.95
1.00
0.95
1.00
0.95
1.00
0.95
1.00
Satd.
Flow
(per
m)17
7030
7217
7031
2617
7034
8417
7035
04Pe
ak-h
our f
actor
, PHF
0.93
0.93
0.93
0.93
0.93
0.93
0.93
0.93
0.93
0.93
0.93
0.93
Adj. F
low (v
ph)
910
9176
834
818
7824
499
1022
530
219
RTOR
Red
uctio
n (vp
h)0
830
04
00
80
05
0La
ne G
roup
Flow
(vph
)9
1776
034
892
024
410
10
225
316
0Co
nfl. P
eds.
(#/hr
)1
1Co
nfl. B
ikes (
#/hr)
15
2He
avy V
ehicl
es (%
)2%
16%
2%2%
15%
2%2%
2%2%
2%2%
2%Tu
rn T
ype
Prot
NAPr
otNA
Prot
NAPr
otNA
Prote
cted P
hase
s5
21
63
87
4Pe
rmitte
d Pha
ses
Actua
ted G
reen
, G (s
)2.4
54.5
4.656
.720
.317
.417
.214
.3Ef
fectiv
e Gre
en, g
(s)
2.454
.54.6
56.7
20.3
17.4
17.2
14.3
Actua
ted g/
C Ra
tio0.0
20.5
00.0
40.5
20.1
80.1
60.1
60.1
3Cl
eara
nce T
ime (
s)3.0
5.53.0
5.53.0
4.83.0
4.8Ve
hicle
Exten
sion (
s)2.0
3.02.0
3.03.0
2.02.0
2.0La
ne G
rp C
ap (v
ph)
3815
2274
1611
326
551
276
455
v/s R
atio P
rot
c0.01
c0.58
0.02
c0.29
c0.14
0.03
c0.13
0.09
v/s R
atio P
erm
v/c R
atio
0.24
1.17
0.46
0.55
0.75
0.18
0.82
0.69
Unifo
rm D
elay,
d152
.927
.851
.518
.142
.440
.144
.945
.8Pr
ogre
ssion
Fac
tor0.7
60.5
71.0
01.0
01.0
01.0
01.0
01.0
0Inc
reme
ntal D
elay,
d20.5
78.8
1.61.4
9.10.1
15.9
3.7De
lay (s
)40
.794
.553
.119
.451
.540
.260
.849
.4Le
vel o
f Ser
vice
DF
DB
DD
ED
Appr
oach
Dela
y (s)
94.3
20.7
48.0
54.1
Appr
oach
LOS
FC
DD
Inter
secti
on S
umma
ryHC
M 20
00 C
ontro
l Dela
y65
.4HC
M 20
00 Le
vel o
f Ser
vice
EHC
M 20
00 V
olume
to C
apac
ity ra
tio0.9
9Ac
tuated
Cyc
le Le
ngth
(s)
110.0
Sum
of los
t time
(s)
16.3
Inter
secti
on C
apac
ity U
tiliza
tion
84.3%
ICU
Leve
l of S
ervic
eE
Analy
sis P
eriod
(min)
15c
Criti
cal L
ane G
roup
HC
M S
igna
lized
Inte
rsec
tion
Cap
acity
Ana
lysi
s8:
McD
owel
l Bl &
Lak
evill
e H
wy
7/1/20
15
Bayw
ood A
partm
ents
Traff
ic Im
pact
Stud
ySy
nchr
o 8 R
epor
tBa
selin
e PM
Peak
Hou
r - N
o Pro
ject
W-T
rans
Move
ment
EBL
EBT
EBR
WBL
WBT
WBR
NBL
NBT
NBR
SBL
SBT
SBR
Lane
Con
figur
ation
sVo
lume (
vph)
680
811
913
940
226
571
366
979
9115
Ideal
Flow
(vphp
l)19
0019
0019
0019
0019
0019
0019
0019
0019
0019
0019
0019
00To
tal Lo
st tim
e (s)
3.05.5
3.05.5
3.04.8
3.04.8
Lane
Util.
Fac
tor1.0
00.9
51.0
00.9
51.0
00.9
51.0
00.9
5Fr
pb, p
ed/bi
kes
1.00
1.00
1.00
1.00
1.00
1.00
1.00
1.00
Flpb,
ped/b
ikes
1.00
1.00
1.00
1.00
1.00
1.00
1.00
1.00
Frt
1.00
0.98
1.00
0.97
1.00
1.00
1.00
0.98
Flt P
rotec
ted0.9
51.0
00.9
51.0
00.9
51.0
00.9
51.0
0Sa
td. F
low (p
rot)
1770
3323
1770
3245
1770
3523
1770
3456
Flt P
ermi
tted
0.95
1.00
0.95
1.00
0.95
1.00
0.95
1.00
Satd.
Flow
(per
m)17
7033
2317
7032
4517
7035
2317
7034
56Pe
ak-h
our f
actor
, PHF
0.93
0.93
0.93
0.93
0.93
0.93
0.93
0.93
0.93
0.93
0.93
0.93
Adj. F
low (v
ph)
686
912
814
1011
243
614
394
1085
9816
RTOR
Red
uctio
n (vp
h)0
80
013
00
10
011
0La
ne G
roup
Flow
(vph
)6
989
014
1241
061
440
30
8510
30
Confl
. Ped
s. (#
/hr)
31
13
1616
Confl
. Bike
s (#/h
r)1
52
Heav
y Veh
icles
(%)
2%7%
2%2%
9%2%
2%2%
2%2%
2%2%
Turn
Typ
ePr
otNA
Prot
NAPr
otNA
Prot
NAPr
otecte
d Pha
ses
52
16
38
74
Perm
itted P
hase
sAc
tuated
Gre
en, G
(s)
1.254
.94.6
58.3
55.1
53.3
10.9
9.1Ef
fectiv
e Gre
en, g
(s)
1.254
.94.6
58.3
55.1
53.3
10.9
9.1Ac
tuated
g/C
Ratio
0.01
0.39
0.03
0.42
0.39
0.38
0.08
0.06
Clea
ranc
e Tim
e (s)
3.05.5
3.05.5
3.04.8
3.04.8
Vehic
le Ex
tensio
n (s)
2.03.0
2.03.0
3.02.0
2.02.0
Lane
Grp
Cap
(vph
)15
1303
5813
5169
613
4113
722
4v/s
Rati
o Pro
t0.0
0c0
.300.0
1c0
.38c0
.350.1
1c0
.050.0
3v/s
Rati
o Per
mv/c
Rati
o0.4
00.7
60.2
40.9
20.8
80.3
00.6
20.4
6Un
iform
Dela
y, d1
69.0
36.8
66.0
38.6
39.4
30.3
62.5
63.1
Prog
ress
ion F
actor
1.36
0.58
1.00
1.00
1.00
1.00
1.00
1.00
Incre
menta
l Dela
y, d2
5.43.6
0.811
.412
.60.0
6.10.5
Delay
(s)
99.2
25.0
66.8
50.0
52.1
30.4
68.7
63.6
Leve
l of S
ervic
eF
CE
DD
CE
EAp
proa
ch D
elay (
s)25
.550
.243
.565
.8Ap
proa
ch LO
SC
DD
E
Inter
secti
on S
umma
ryHC
M 20
00 C
ontro
l Dela
y42
.0HC
M 20
00 Le
vel o
f Ser
vice
DHC
M 20
00 V
olume
to C
apac
ity ra
tio0.8
9Ac
tuated
Cyc
le Le
ngth
(s)
140.0
Sum
of los
t time
(s)
16.3
Inter
secti
on C
apac
ity U
tiliza
tion
83.5%
ICU
Leve
l of S
ervic
eE
Analy
sis P
eriod
(min)
15c
Criti
cal L
ane G
roup
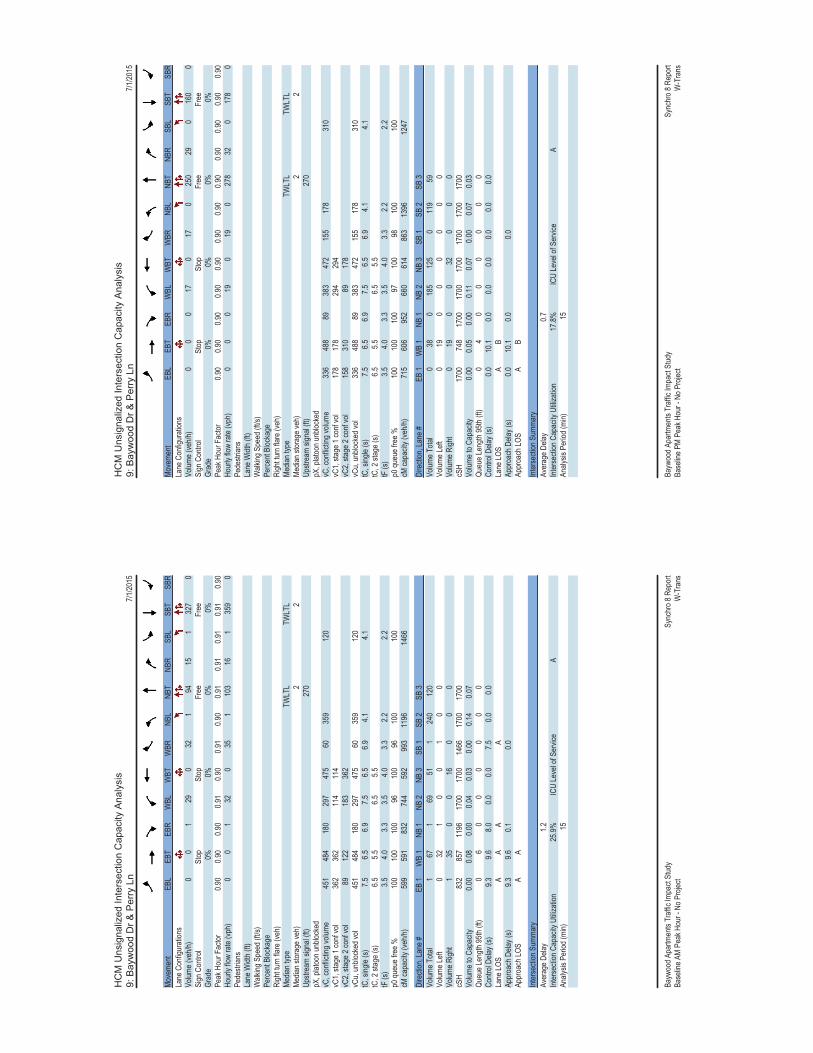
HC
M U
nsig
naliz
ed In
ters
ectio
n C
apac
ity A
naly
sis
9: B
ayw
ood
Dr &
Per
ry L
n7/1
/2015
Bayw
ood A
partm
ents
Traff
ic Im
pact
Stud
ySy
nchr
o 8 R
epor
tBa
selin
e AM
Peak
Hou
r - N
o Pro
ject
W-T
rans
Move
ment
EBL
EBT
EBR
WBL
WBT
WBR
NBL
NBT
NBR
SBL
SBT
SBR
Lane
Con
figur
ation
sVo
lume (
veh/h
)0
01
290
321
9415
132
70
Sign
Con
trol
Stop
Stop
Free
Free
Grad
e0%
0%0%
0%Pe
ak H
our F
actor
0.90
0.90
0.90
0.91
0.90
0.91
0.90
0.91
0.91
0.91
0.91
0.90
Hour
ly flo
w ra
te (vp
h)0
01
320
351
103
161
359
0Pe
destr
ians
Lane
Widt
h (ft)
Walk
ing S
peed
(ft/s
)Pe
rcent
Bloc
kage
Righ
t turn
flare
(veh
)Me
dian t
ype
TWLT
LTW
LTL
Media
n stor
age v
eh)
22
Upstr
eam
signa
l (ft)
270
pX, p
latoo
n unb
locke
dvC
, con
flictin
g volu
me45
148
418
029
747
560
359
120
vC1,
stage
1 co
nf vo
l36
236
211
411
4vC
2, sta
ge 2
conf
vol
8912
218
336
2vC
u, un
block
ed vo
l45
148
418
029
747
560
359
120
tC, s
ingle
(s)7.5
6.56.9
7.56.5
6.94.1
4.1tC
, 2 st
age (
s)6.5
5.56.5
5.5tF
(s)
3.54.0
3.33.5
4.03.3
2.22.2
p0 qu
eue f
ree %
100
100
100
9610
096
100
100
cM ca
pacit
y (ve
h/h)
599
591
832
744
592
993
1196
1466
Dire
ction
, Lan
e #EB
1W
B 1
NB 1
NB 2
NB 3
SB 1
SB 2
SB 3
Volum
e Tota
l1
671
6951
124
012
0Vo
lume L
eft0
321
00
10
0Vo
lume R
ight
135
00
160
00
cSH
832
857
1196
1700
1700
1466
1700
1700
Volum
e to C
apac
ity0.0
00.0
80.0
00.0
40.0
30.0
00.1
40.0
7Qu
eue L
ength
95th
(ft)
06
00
00
00
Contr
ol De
lay (s
)9.3
9.68.0
0.00.0
7.50.0
0.0La
ne LO
SA
AA
AAp
proa
ch D
elay (
s)9.3
9.60.1
0.0Ap
proa
ch LO
SA
A
Inter
secti
on S
umma
ryAv
erag
e Dela
y 1.2
Inter
secti
on C
apac
ity U
tiliza
tion
25.9%
ICU
Leve
l of S
ervic
e A
Analy
sis P
eriod
(min)
15
HC
M U
nsig
naliz
ed In
ters
ectio
n C
apac
ity A
naly
sis
9: B
ayw
ood
Dr &
Per
ry L
n7/1
/2015
Bayw
ood A
partm
ents
Traff
ic Im
pact
Stud
ySy
nchr
o 8 R
epor
tBa
selin
e PM
Peak
Hou
r - N
o Pro
ject
W-T
rans
Move
ment
EBL
EBT
EBR
WBL
WBT
WBR
NBL
NBT
NBR
SBL
SBT
SBR
Lane
Con
figur
ation
sVo
lume (
veh/h
)0
00
170
170
250
290
160
0Si
gn C
ontro
lSt
opSt
opFr
eeFr
eeGr
ade
0%0%
0%0%
Peak
Hou
r Fac
tor0.9
00.9
00.9
00.9
00.9
00.9
00.9
00.9
00.9
00.9
00.9
00.9
0Ho
urly
flow
rate
(vph)
00
019
019
027
832
017
80
Pede
strian
sLa
ne W
idth (
ft)W
alking
Spe
ed (f
t/s)
Perce
nt Bl
ocka
geRi
ght tu
rn fla
re (v
eh)
Media
n typ
eTW
LTL
TWLT
LMe
dian s
torag
e veh
)2
2Up
strea
m sig
nal (f
t)27
0pX
, plat
oon u
nbloc
ked
vC, c
onflic
ting v
olume
336
488
8938
347
215
517
831
0vC
1, sta
ge 1
conf
vol
178
178
294
294
vC2,
stage
2 co
nf vo
l15
831
089
178
vCu,
unblo
cked
vol
336
488
8938
347
215
517
831
0tC
, sing
le (s)
7.56.5
6.97.5
6.56.9
4.14.1
tC, 2
stag
e (s)
6.55.5
6.55.5
tF (s
)3.5
4.03.3
3.54.0
3.32.2
2.2p0
queu
e fre
e %10
010
010
097
100
9810
010
0cM
capa
city (
veh/h
)71
560
695
266
061
486
313
9612
47
Dire
ction
, Lan
e #EB
1W
B 1
NB 1
NB 2
NB 3
SB 1
SB 2
SB 3
Volum
e Tota
l0
380
185
125
011
959
Volum
e Left
019
00
00
00
Volum
e Righ
t0
190
032
00
0cS
H17
0074
817
0017
0017
0017
0017
0017
00Vo
lume t
o Cap
acity
0.00
0.05
0.00
0.11
0.07
0.00
0.07
0.03
Queu
e Len
gth 95
th (ft
)0
40
00
00
0Co
ntrol
Delay
(s)
0.010
.10.0
0.00.0
0.00.0
0.0La
ne LO
SA
BAp
proa
ch D
elay (
s)0.0
10.1
0.00.0
Appr
oach
LOS
AB
Inter
secti
on S
umma
ryAv
erag
e Dela
y 0.7
Inter
secti
on C
apac
ity U
tiliza
tion
17.8%
ICU
Leve
l of S
ervic
e A
Analy
sis P
eriod
(min)
15

HC
M 2
010
AW
SC
10: B
ayw
ood
Dr &
St.
Fran
cis
Dr
7/1/20
15
Bayw
ood A
partm
ents
Traff
ic Im
pact
Stud
ySy
nchr
o 8 R
epor
tBa
selin
e AM
Peak
Hou
r - N
o Pro
ject
W-T
rans
Inter
secti
onInt
erse
ction
Dela
y, s/v
eh12
.1Int
erse
ction
LOS
B
Move
ment
EBU
EBL
EBT
EBR
WBU
WBL
WBT
WBR
NBU
NBL
NBT
NBR
Vol, v
eh/h
038
7460
078
7355
025
102
47Pe
ak H
our F
actor
0.90
0.88
0.88
0.88
0.90
0.88
0.88
0.88
0.90
0.88
0.88
0.88
Heav
y Veh
icles
, %2
22
22
22
22
22
2Mv
mt F
low0
4384
680
8983
620
2811
653
Numb
er of
Lane
s0
01
00
01
00
11
1
Appr
oach
EBW
BNB
Oppo
sing A
ppro
ach
WB
EBSB
Oppo
sing L
anes
11
2Co
nflict
ing A
ppro
ach L
eftSB
NBEB
Confl
icting
Lane
s Left
23
1Co
nflict
ing A
ppro
ach R
ight
NBSB
WB
Confl
icting
Lane
s Righ
t3
21
HCM
Contr
ol De
lay12
13.2
10.1
HCM
LOS
BB
B
Lane
NBLn
1NB
Ln2
NBLn
3EB
Ln1
WBL
n1SB
Ln1
SBLn
2Vo
l Left
, %10
0%0%
0%22
%38
%10
0%0%
Vol T
hru,
%0%
100%
0%43
%35
%0%
84%
Vol R
ight, %
0%0%
100%
35%
27%
0%16
%Si
gn C
ontro
lSt
opSt
opSt
opSt
opSt
opSt
opSt
opTr
affic
Vol b
y Lan
e25
102
4717
220
643
188
LT V
ol25
00
3878
430
Thro
ugh V
ol0
102
074
730
157
RT V
ol0
047
6055
031
Lane
Flow
Rate
2811
653
195
234
4921
4Ge
ometr
y Grp
77
77
78
8De
gree
of U
til (X
)0.0
540.2
040.0
840.3
340.4
040.0
960.3
82De
partu
re H
eadw
ay (H
d)6.8
596.3
55.6
366.1
576.2
187.0
646.4
35Co
nver
genc
e, Y/
NYe
sYe
sYe
sYe
sYe
sYe
sYe
sCa
p52
056
363
258
257
850
655
8Se
rvice
Tim
e4.6
234.1
133.3
993.9
183.9
764.8
284.1
99HC
M La
ne V
/C R
atio
0.054
0.206
0.084
0.335
0.405
0.097
0.384
HCM
Contr
ol De
lay10
10.7
8.912
13.2
10.6
13.2
HCM
Lane
LOS
AB
AB
BB
BHC
M 95
th-tile
Q0.2
0.80.3
1.51.9
0.31.8
HC
M 2
010
AW
SC
10: B
ayw
ood
Dr &
St.
Fran
cis
Dr
7/1/20
15
Bayw
ood A
partm
ents
Traff
ic Im
pact
Stud
ySy
nchr
o 8 R
epor
tBa
selin
e PM
Peak
Hou
r - N
o Pro
ject
W-T
rans
Inter
secti
onInt
erse
ction
Dela
y, s/v
eh11
.2Int
erse
ction
LOS
B
Move
ment
EBU
EBL
EBT
EBR
WBU
WBL
WBT
WBR
NBU
NBL
NBT
NBR
Vol, v
eh/h
060
8842
038
5147
044
159
49Pe
ak H
our F
actor
0.90
0.89
0.89
0.89
0.90
0.89
0.89
0.89
0.90
0.89
0.89
0.89
Heav
y Veh
icles
, %2
22
22
22
22
22
2Mv
mt F
low0
6799
470
4357
530
4917
955
Numb
er of
Lane
s0
01
00
01
00
11
1
Appr
oach
EBW
BNB
Oppo
sing A
ppro
ach
WB
EBSB
Oppo
sing L
anes
11
2Co
nflict
ing A
ppro
ach L
eftSB
NBEB
Confl
icting
Lane
s Left
23
1Co
nflict
ing A
ppro
ach R
ight
NBSB
WB
Confl
icting
Lane
s Righ
t3
21
HCM
Contr
ol De
lay12
.311
10.5
HCM
LOS
BB
B
Lane
NBLn
1NB
Ln2
NBLn
3EB
Ln1
WBL
n1SB
Ln1
SBLn
2Vo
l Left
, %10
0%0%
0%32
%28
%10
0%0%
Vol T
hru,
%0%
100%
0%46
%38
%0%
80%
Vol R
ight, %
0%0%
100%
22%
35%
0%20
%Si
gn C
ontro
lSt
opSt
opSt
opSt
opSt
opSt
opSt
opTr
affic
Vol b
y Lan
e44
159
4919
013
631
137
LT V
ol44
00
6038
310
Thro
ugh V
ol0
159
088
510
110
RT V
ol0
049
4247
027
Lane
Flow
Rate
4917
955
213
153
3515
4Ge
ometr
y Grp
77
77
78
8De
gree
of U
til (X
)0.0
890.2
980.0
810.3
630.2
60.0
680.2
72De
partu
re H
eadw
ay (H
d)6.5
065.9
985.2
876.1
176.1
217.0
136.3
62Co
nver
genc
e, Y/
NYe
sYe
sYe
sYe
sYe
sYe
sYe
sCa
p55
059
867
658
758
551
056
3Se
rvice
Tim
e4.2
53.7
423.0
313.8
623.8
714.7
674.1
16HC
M La
ne V
/C R
atio
0.089
0.299
0.081
0.363
0.262
0.069
0.274
HCM
Contr
ol De
lay9.9
11.3
8.512
.311
10.3
11.5
HCM
Lane
LOS
AB
AB
BB
BHC
M 95
th-tile
Q0.3
1.20.3
1.71
0.21.1

HC
M 2
010
AW
SC
10: B
ayw
ood
Dr &
St.
Fran
cis
Dr
7/1/20
15
Bayw
ood A
partm
ents
Traff
ic Im
pact
Stud
ySy
nchr
o 8 R
epor
tBa
selin
e AM
Peak
Hou
r - N
o Pro
ject
W-T
rans
Inter
secti
onInt
erse
ction
Dela
y, s/v
ehInt
erse
ction
LOS
Move
ment
SBU
SBL
SBT
SBR
Vol, v
eh/h
043
157
31Pe
ak H
our F
actor
0.90
0.88
0.88
0.88
Heav
y Veh
icles
, %2
22
2Mv
mt F
low0
4917
835
Numb
er of
Lane
s0
11
0
Appr
oach
SBOp
posin
g App
roac
hNB
Oppo
sing L
anes
3Co
nflict
ing A
ppro
ach L
eftW
BCo
nflict
ing La
nes L
eft1
Confl
icting
App
roac
h Righ
tEB
Confl
icting
Lane
s Righ
t1
HCM
Contr
ol De
lay12
.7HC
M LO
SB
Lane
HC
M 2
010
AW
SC
10: B
ayw
ood
Dr &
St.
Fran
cis
Dr
7/1/20
15
Bayw
ood A
partm
ents
Traff
ic Im
pact
Stud
ySy
nchr
o 8 R
epor
tBa
selin
e PM
Peak
Hou
r - N
o Pro
ject
W-T
rans
Inter
secti
onInt
erse
ction
Dela
y, s/v
ehInt
erse
ction
LOS
Move
ment
SBU
SBL
SBT
SBR
Vol, v
eh/h
031
110
27Pe
ak H
our F
actor
0.90
0.89
0.89
0.89
Heav
y Veh
icles
, %2
22
2Mv
mt F
low0
3512
430
Numb
er of
Lane
s0
11
0
Appr
oach
SBOp
posin
g App
roac
hNB
Oppo
sing L
anes
3Co
nflict
ing A
ppro
ach L
eftW
BCo
nflict
ing La
nes L
eft1
Confl
icting
App
roac
h Righ
tEB
Confl
icting
Lane
s Righ
t1
HCM
Contr
ol De
lay11
.3HC
M LO
SB
Lane

MO
VEM
ENT
SUM
MA
RYSi
te:S
McD
owel
l Bl &
Bay
woo
d D
r (A
M B
asel
ine)
A
M P
eak
Hou
rB
asel
ine
Con
ditio
nsR
ound
abou
t
Mov
emen
t Per
form
ance
-Ve
hicl
esD
eman
d Fl
ows
95%
Bac
k of
Que
ueM
ov IDO
DM
ovD
eg.
Satn
Aver
age
Del
ay
Leve
l of
Serv
ice
Prop
. Q
ueue
dEf
fect
ive
Stop
Rat
eAv
erag
eSp
eed
To
tal
HV
Vehi
cles
Dis
tanc
eve
h/h
%v/
cse
cve
hft
per v
ehm
phSo
uth:
NB
Bay
woo
d D
r3
L212
52.
00.
348
8.5
LOS
A1.
742
.20.
650.
6423
.78
T179
2.0
0.34
88.
5LO
S A
1.7
42.2
0.65
0.64
23.2
18R
277
2.0
0.34
88.
5LO
S A
1.7
42.2
0.65
0.64
22.6
Appr
oach
281
2.0
0.34
88.
5LO
S A
1.7
42.2
0.65
0.64
23.2
East
: WB
S M
cDow
ell B
l1
L242
2.0
0.46
18.
3LO
S A
2.9
73.5
0.54
0.41
30.9
6T1
450
2.0
0.46
18.
3LO
S A
2.9
73.5
0.54
0.41
30.6
16R
220
2.0
0.46
18.
3LO
S A
2.9
73.5
0.54
0.41
29.8
Appr
oach
512
2.0
0.46
18.
3LO
S A
2.9
73.5
0.54
0.41
30.6
Nor
th: S
B B
ayw
ood
Dr
7L2
422.
00.
349
9.1
LOS
A1.
641
.80.
670.
6823
.94
T114
32.
00.
349
9.1
LOS
A1.
641
.80.
670.
6823
.414
R2
772.
00.
349
9.1
LOS
A1.
641
.80.
670.
6822
.8Ap
proa
ch26
22.
00.
349
9.1
LOS
A1.
641
.80.
670.
6823
.3
Wes
t: E
B S
McD
owel
l Bl
5L2
292.
00.
522
9.3
LOS
A3.
690
.20.
580.
4430
.52
T147
42.
00.
522
9.3
LOS
A3.
690
.20.
580.
4430
.312
R2
812.
00.
522
9.3
LOS
A3.
690
.20.
580.
4429
.4Ap
proa
ch58
32.
00.
522
9.3
LOS
A3.
690
.20.
580.
4430
.2
All V
ehic
les
1638
2.0
0.52
28.
8LO
S A
3.6
90.2
0.59
0.50
27.6
Leve
l of S
ervi
ce (L
OS)
Met
hod:
Del
ay &
v/c
(HC
M 2
010)
. R
ound
abou
t LO
S M
etho
d: S
ame
as S
igna
lised
Inte
rsec
tions
.Ve
hicl
e m
ovem
ent L
OS
val
ues
are
base
d on
ave
rage
del
ay a
nd v
/c ra
tio (d
egre
e of
sat
urat
ion)
per
mov
emen
tLO
S F
will
resu
lt if
v/c
> 1
irres
pect
ive
of m
ovem
ent d
elay
val
ue (d
oes
not a
pply
for a
ppro
ache
s an
d in
ters
ectio
n).
Inte
rsec
tion
and
Appr
oach
LO
S va
lues
are
bas
ed o
n av
erag
e de
lay
for a
ll m
ovem
ents
(v/c
not
use
d as
spe
cifie
d in
HC
M 2
010)
.R
ound
abou
t Cap
acity
Mod
el: U
S H
CM
201
0.H
CM
Del
ay F
orm
ula
optio
n is
use
d. C
ontro
l Del
ay d
oes
not i
nclu
de G
eom
etric
Del
ay s
ince
Exc
lude
Geo
met
ric D
elay
opt
ion
appl
ies.
Gap
-Acc
epta
nce
Cap
acity
: Tra
ditio
nal M
1.H
V (%
) val
ues
are
calc
ulat
ed fo
r All
Mov
emen
t Cla
sses
of A
ll H
eavy
Veh
icle
Mod
el D
esig
natio
n.
Pro
cess
ed: F
riday
, May
22,
201
5 2:
11:4
1 PM
SID
RA
INTE
RSE
CTI
ON
6.0
.24.
4877
Cop
yrig
ht ©
200
0-20
14 A
kcel
ik a
nd A
ssoc
iate
s Pt
y Lt
dw
ww
.sid
raso
lutio
ns.c
omP
roje
ct:
N:\A
AA\S
OX\
PET\
191P
ET\S
IDR
A\Ba
ywoo
d-M
cDow
ell.s
ip6
8000
493,
601
9158
, W-T
RAN
S, P
LUS
/ Fl
oatin
g
MO
VEM
ENT
SUM
MA
RYSi
te:S
McD
owel
l Bl &
Bay
woo
d D
r (PM
Bas
elin
e)P
M P
eak
Hou
rB
asel
ine
Con
ditio
nsR
ound
abou
t
Mov
emen
t Per
form
ance
-Ve
hicl
esD
eman
d Fl
ows
95%
Bac
k of
Que
ueM
ov IDO
DM
ovD
eg.
Satn
Aver
age
Del
ay
Leve
l of
Serv
ice
Prop
. Q
ueue
dEf
fect
ive
Stop
Rat
eAv
erag
eSp
eed
To
tal
HV
Vehi
cles
Dis
tanc
eve
h/h
%v/
cse
cve
hft
per v
ehm
phSo
uth:
NB
Bay
woo
d D
r3
L293
2.0
0.30
67.
4LO
S A
1.5
37.3
0.59
0.54
24.1
8T1
126
2.0
0.30
67.
4LO
S A
1.5
37.3
0.59
0.54
23.6
18R
252
2.0
0.30
67.
4LO
S A
1.5
37.3
0.59
0.54
23.0
Appr
oach
271
2.0
0.30
67.
4LO
S A
1.5
37.3
0.59
0.54
23.7
East
: WB
S M
cDow
ell B
l1
L268
2.0
0.74
716
.4LO
S B
9.0
228.
20.
850.
8227
.86
T169
22.
00.
747
16.4
LOS
B9.
022
8.2
0.85
0.82
27.6
16R
232
2.0
0.74
716
.4LO
S B
9.0
228.
20.
850.
8226
.9Ap
proa
ch79
22.
00.
747
16.4
LOS
B9.
022
8.2
0.85
0.82
27.6
Nor
th: S
B B
ayw
ood
Dr
7L2
142.
00.
194
8.5
LOS
A0.
819
.50.
670.
6724
.14
T163
2.0
0.19
48.
5LO
S A
0.8
19.5
0.67
0.67
23.6
14R
237
2.0
0.19
48.
5LO
S A
0.8
19.5
0.67
0.67
23.0
Appr
oach
114
2.0
0.19
48.
5LO
S A
0.8
19.5
0.67
0.67
23.4
Wes
t: E
B S
McD
owel
l Bl
5L2
602.
00.
452
7.7
LOS
A3.
076
.10.
440.
2831
.12
T137
72.
00.
452
7.7
LOS
A3.
076
.10.
440.
2830
.812
R2
112
2.0
0.45
27.
7LO
S A
3.0
76.1
0.44
0.28
29.9
Appr
oach
549
2.0
0.45
27.
7LO
S A
3.0
76.1
0.44
0.28
30.6
All V
ehic
les
1726
2.0
0.74
711
.7LO
S B
9.0
228.
20.
670.
5927
.4
Leve
l of S
ervi
ce (L
OS)
Met
hod:
Del
ay &
v/c
(HC
M 2
010)
. R
ound
abou
t LO
S M
etho
d: S
ame
as S
igna
lised
Inte
rsec
tions
.Ve
hicl
e m
ovem
ent L
OS
val
ues
are
base
d on
ave
rage
del
ay a
nd v
/c ra
tio (d
egre
e of
sat
urat
ion)
per
mov
emen
tLO
S F
will
resu
lt if
v/c
> 1
irres
pect
ive
of m
ovem
ent d
elay
val
ue (d
oes
not a
pply
for a
ppro
ache
s an
d in
ters
ectio
n).
Inte
rsec
tion
and
Appr
oach
LO
S va
lues
are
bas
ed o
n av
erag
e de
lay
for a
ll m
ovem
ents
(v/c
not
use
d as
spe
cifie
d in
HC
M 2
010)
.R
ound
abou
t Cap
acity
Mod
el: U
S H
CM
201
0.H
CM
Del
ay F
orm
ula
optio
n is
use
d. C
ontro
l Del
ay d
oes
not i
nclu
de G
eom
etric
Del
ay s
ince
Exc
lude
Geo
met
ric D
elay
opt
ion
appl
ies.
Gap
-Acc
epta
nce
Cap
acity
: Tra
ditio
nal M
1.H
V (%
) val
ues
are
calc
ulat
ed fo
r All
Mov
emen
t Cla
sses
of A
ll H
eavy
Veh
icle
Mod
el D
esig
natio
n.
Pro
cess
ed: F
riday
, May
22,
201
5 2:
11:4
6 PM
SID
RA
INTE
RSE
CTI
ON
6.0
.24.
4877
Cop
yrig
ht ©
200
0-20
14 A
kcel
ik a
nd A
ssoc
iate
s Pt
y Lt
dw
ww
.sid
raso
lutio
ns.c
omP
roje
ct:
N:\A
AA\S
OX\
PET\
191P
ET\S
IDR
A\Ba
ywoo
d-M
cDow
ell.s
ip6
8000
493,
601
9158
, W-T
RAN
S, P
LUS
/ Fl
oatin
g
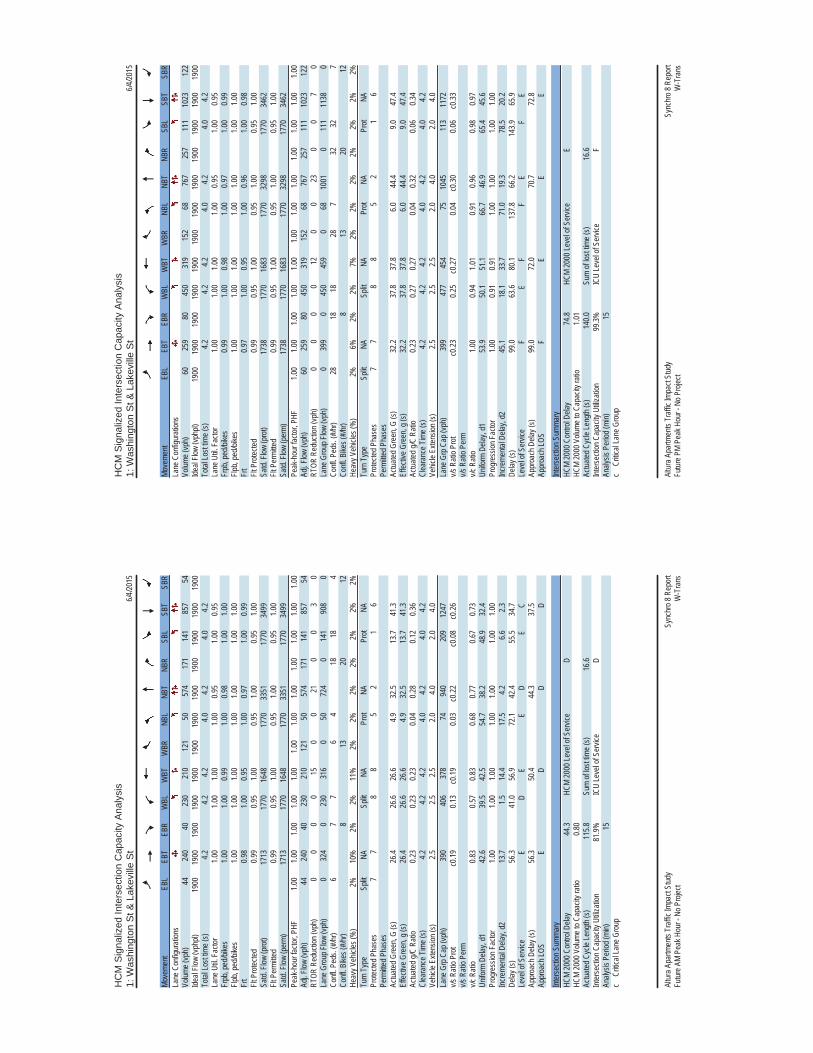
HC
M S
igna
lized
Inte
rsec
tion
Cap
acity
Ana
lysi
s1:
Was
hing
ton
St &
Lak
evill
e S
t6/4
/2015
Sync
hro 8
Rep
ort
Altur
a Apa
rtmen
ts Tr
affic
Impa
ct St
udy
Futur
e AM
Peak
Hou
r - N
o Pro
ject
W-T
rans
Move
ment
EBL
EBT
EBR
WBL
WBT
WBR
NBL
NBT
NBR
SBL
SBT
SBR
Lane
Con
figur
ation
sVo
lume (
vph)
4424
040
230
210
121
5057
417
114
185
754
Ideal
Flow
(vphp
l)19
0019
0019
0019
0019
0019
0019
0019
0019
0019
0019
0019
00To
tal Lo
st tim
e (s)
4.24.2
4.24.0
4.24.0
4.2La
ne U
til. F
actor
1.00
1.00
1.00
1.00
0.95
1.00
0.95
Frpb
, ped
/bike
s1.0
01.0
00.9
91.0
00.9
81.0
01.0
0Flp
b, pe
d/bike
s1.0
01.0
01.0
01.0
01.0
01.0
01.0
0Fr
t0.9
81.0
00.9
51.0
00.9
71.0
00.9
9Flt
Pro
tected
0.99
0.95
1.00
0.95
1.00
0.95
1.00
Satd.
Flow
(pro
t)17
1317
7016
4817
7033
5117
7034
99Flt
Per
mitte
d0.9
90.9
51.0
00.9
51.0
00.9
51.0
0Sa
td. F
low (p
erm)
1713
1770
1648
1770
3351
1770
3499
Peak
-hou
r fac
tor, P
HF1.0
01.0
01.0
01.0
01.0
01.0
01.0
01.0
01.0
01.0
01.0
01.0
0Ad
j. Flow
(vph
)44
240
4023
021
012
150
574
171
141
857
54RT
OR R
educ
tion (
vph)
00
00
150
021
00
30
Lane
Gro
up F
low (v
ph)
032
40
230
316
050
724
014
190
80
Confl
. Ped
s. (#
/hr)
67
76
418
184
Confl
. Bike
s (#/h
r)8
1320
12He
avy V
ehicl
es (%
)2%
10%
2%2%
11%
2%2%
2%2%
2%2%
2%Tu
rn T
ype
Split
NASp
litNA
Prot
NAPr
otNA
Prote
cted P
hase
s7
78
85
21
6Pe
rmitte
d Pha
ses
Actua
ted G
reen
, G (s
)26
.426
.626
.64.9
32.5
13.7
41.3
Effec
tive G
reen
, g (s
)26
.426
.626
.64.9
32.5
13.7
41.3
Actua
ted g/
C Ra
tio0.2
30.2
30.2
30.0
40.2
80.1
20.3
6Cl
eara
nce T
ime (
s)4.2
4.24.2
4.04.2
4.04.2
Vehic
le Ex
tensio
n (s)
2.52.5
2.52.0
4.02.0
4.0La
ne G
rp C
ap (v
ph)
390
406
378
7494
020
912
47v/s
Rati
o Pro
tc0
.190.1
3c0
.190.0
3c0
.22c0
.08c0
.26v/s
Rati
o Per
mv/c
Rati
o0.8
30.5
70.8
30.6
80.7
70.6
70.7
3Un
iform
Dela
y, d1
42.6
39.5
42.5
54.7
38.2
48.9
32.4
Prog
ress
ion F
actor
1.00
1.00
1.00
1.00
1.00
1.00
1.00
Incre
menta
l Dela
y, d2
13.7
1.514
.417
.54.2
6.62.3
Delay
(s)
56.3
41.0
56.9
72.1
42.4
55.5
34.7
Leve
l of S
ervic
eE
DE
ED
EC
Appr
oach
Dela
y (s)
56.3
50.4
44.3
37.5
Appr
oach
LOS
ED
DD
Inter
secti
on S
umma
ryHC
M 20
00 C
ontro
l Dela
y44
.3HC
M 20
00 Le
vel o
f Ser
vice
DHC
M 20
00 V
olume
to C
apac
ity ra
tio0.8
0Ac
tuated
Cyc
le Le
ngth
(s)
115.8
Sum
of los
t time
(s)
16.6
Inter
secti
on C
apac
ity U
tiliza
tion
81.9%
ICU
Leve
l of S
ervic
eD
Analy
sis P
eriod
(min)
15c
Criti
cal L
ane G
roup
HC
M S
igna
lized
Inte
rsec
tion
Cap
acity
Ana
lysi
s1:
Was
hing
ton
St &
Lak
evill
e S
t6/4
/2015
Sync
hro 8
Rep
ort
Altur
a Apa
rtmen
ts Tr
affic
Impa
ct St
udy
Futur
e PM
Peak
Hou
r - N
o Pro
ject
W-T
rans
Move
ment
EBL
EBT
EBR
WBL
WBT
WBR
NBL
NBT
NBR
SBL
SBT
SBR
Lane
Con
figur
ation
sVo
lume (
vph)
6025
980
450
319
152
6876
725
711
110
2312
2Ide
al Flo
w (vp
hpl)
1900
1900
1900
1900
1900
1900
1900
1900
1900
1900
1900
1900
Total
Lost
time (
s)4.2
4.24.2
4.04.2
4.04.2
Lane
Util.
Fac
tor1.0
01.0
01.0
01.0
00.9
51.0
00.9
5Fr
pb, p
ed/bi
kes
0.99
1.00
0.98
1.00
0.97
1.00
0.99
Flpb,
ped/b
ikes
1.00
1.00
1.00
1.00
1.00
1.00
1.00
Frt
0.97
1.00
0.95
1.00
0.96
1.00
0.98
Flt P
rotec
ted0.9
90.9
51.0
00.9
51.0
00.9
51.0
0Sa
td. F
low (p
rot)
1738
1770
1683
1770
3298
1770
3462
Flt P
ermi
tted
0.99
0.95
1.00
0.95
1.00
0.95
1.00
Satd.
Flow
(per
m)17
3817
7016
8317
7032
9817
7034
62Pe
ak-h
our f
actor
, PHF
1.00
1.00
1.00
1.00
1.00
1.00
1.00
1.00
1.00
1.00
1.00
1.00
Adj. F
low (v
ph)
6025
980
450
319
152
6876
725
711
110
2312
2RT
OR R
educ
tion (
vph)
00
00
120
023
00
70
Lane
Gro
up F
low (v
ph)
039
90
450
459
068
1001
011
111
380
Confl
. Ped
s. (#
/hr)
2818
1828
732
327
Confl
. Bike
s (#/h
r)8
1320
12He
avy V
ehicl
es (%
)2%
6%2%
2%7%
2%2%
2%2%
2%2%
2%Tu
rn T
ype
Split
NASp
litNA
Prot
NAPr
otNA
Prote
cted P
hase
s7
78
85
21
6Pe
rmitte
d Pha
ses
Actua
ted G
reen
, G (s
)32
.237
.837
.86.0
44.4
9.047
.4Ef
fectiv
e Gre
en, g
(s)
32.2
37.8
37.8
6.044
.49.0
47.4
Actua
ted g/
C Ra
tio0.2
30.2
70.2
70.0
40.3
20.0
60.3
4Cl
eara
nce T
ime (
s)4.2
4.24.2
4.04.2
4.04.2
Vehic
le Ex
tensio
n (s)
2.52.5
2.52.0
4.02.0
4.0La
ne G
rp C
ap (v
ph)
399
477
454
7510
4511
311
72v/s
Rati
o Pro
tc0
.230.2
5c0
.270.0
4c0
.300.0
6c0
.33v/s
Rati
o Per
mv/c
Rati
o1.0
00.9
41.0
10.9
10.9
60.9
80.9
7Un
iform
Dela
y, d1
53.9
50.1
51.1
66.7
46.9
65.4
45.6
Prog
ress
ion F
actor
1.00
0.91
0.91
1.00
1.00
1.00
1.00
Incre
menta
l Dela
y, d2
45.1
18.1
33.7
71.0
19.3
78.5
20.2
Delay
(s)
99.0
63.6
80.1
137.8
66.2
143.9
65.9
Leve
l of S
ervic
eF
EF
FE
FE
Appr
oach
Dela
y (s)
99.0
72.0
70.7
72.8
Appr
oach
LOS
FE
EE
Inter
secti
on S
umma
ryHC
M 20
00 C
ontro
l Dela
y74
.8HC
M 20
00 Le
vel o
f Ser
vice
EHC
M 20
00 V
olume
to C
apac
ity ra
tio1.0
1Ac
tuated
Cyc
le Le
ngth
(s)
140.0
Sum
of los
t time
(s)
16.6
Inter
secti
on C
apac
ity U
tiliza
tion
99.3%
ICU
Leve
l of S
ervic
eF
Analy
sis P
eriod
(min)
15c
Criti
cal L
ane G
roup
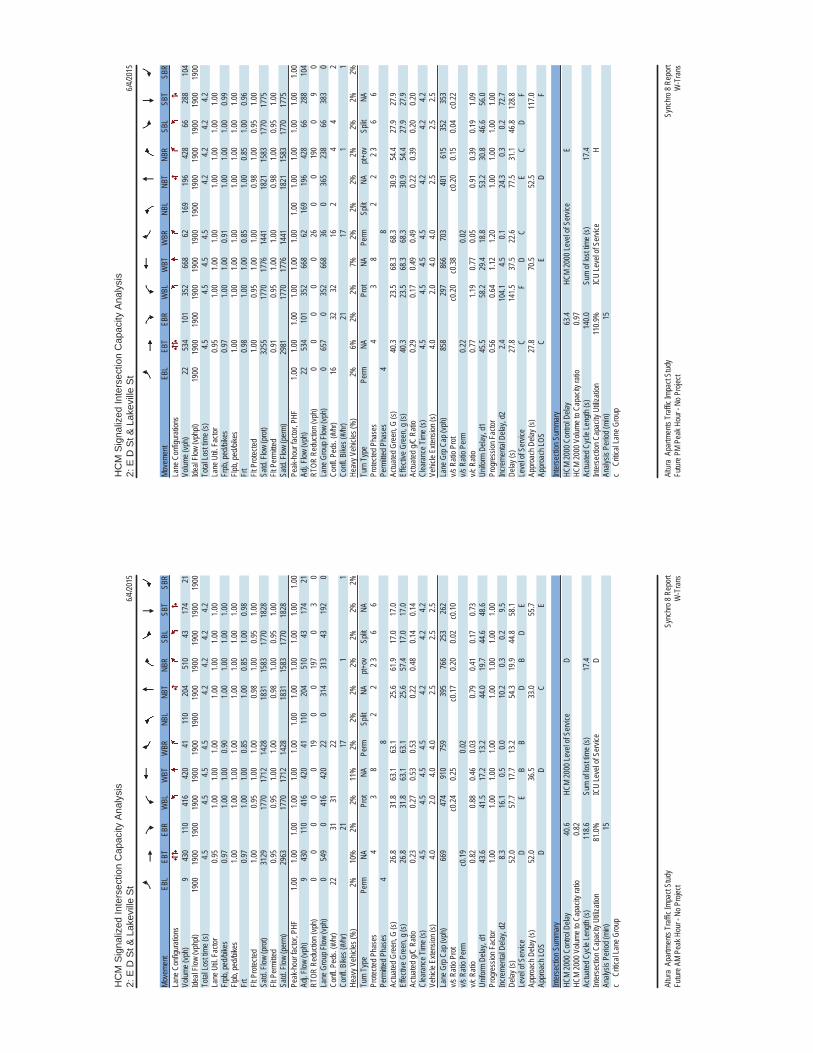
HC
M S
igna
lized
Inte
rsec
tion
Cap
acity
Ana
lysi
s2:
E D
St &
Lak
evill
e S
t6/4
/2015
Sync
hro 8
Rep
ort
Altur
a Ap
artm
ents
Traff
ic Im
pact
Stud
y Fu
ture A
M Pe
ak H
our -
No P
rojec
tW
-Tra
ns
Move
ment
EBL
EBT
EBR
WBL
WBT
WBR
NBL
NBT
NBR
SBL
SBT
SBR
Lane
Con
figur
ation
sVo
lume (
vph)
943
011
041
642
041
110
204
510
4317
421
Ideal
Flow
(vphp
l)19
0019
0019
0019
0019
0019
0019
0019
0019
0019
0019
0019
00To
tal Lo
st tim
e (s)
4.54.5
4.54.5
4.24.2
4.24.2
Lane
Util.
Fac
tor0.9
51.0
01.0
01.0
01.0
01.0
01.0
01.0
0Fr
pb, p
ed/bi
kes
0.97
1.00
1.00
0.90
1.00
1.00
1.00
1.00
Flpb,
ped/b
ikes
1.00
1.00
1.00
1.00
1.00
1.00
1.00
1.00
Frt
0.97
1.00
1.00
0.85
1.00
0.85
1.00
0.98
Flt P
rotec
ted1.0
00.9
51.0
01.0
00.9
81.0
00.9
51.0
0Sa
td. F
low (p
rot)
3129
1770
1712
1428
1831
1583
1770
1828
Flt P
ermi
tted
0.95
0.95
1.00
1.00
0.98
1.00
0.95
1.00
Satd.
Flow
(per
m)29
6317
7017
1214
2818
3115
8317
7018
28Pe
ak-h
our f
actor
, PHF
1.00
1.00
1.00
1.00
1.00
1.00
1.00
1.00
1.00
1.00
1.00
1.00
Adj. F
low (v
ph)
943
011
041
642
041
110
204
510
4317
421
RTOR
Red
uctio
n (vp
h)0
00
00
190
019
70
30
Lane
Gro
up F
low (v
ph)
054
90
416
420
220
314
313
4319
20
Confl
. Ped
s. (#
/hr)
2231
3122
Confl
. Bike
s (#/h
r)21
171
1He
avy V
ehicl
es (%
)2%
10%
2%2%
11%
2%2%
2%2%
2%2%
2%Tu
rn T
ype
Perm
NAPr
otNA
Perm
Split
NApt+
ovSp
litNA
Prote
cted P
hase
s4
38
22
2 36
6Pe
rmitte
d Pha
ses
48
Actua
ted G
reen
, G (s
)26
.831
.863
.163
.125
.661
.917
.017
.0Ef
fectiv
e Gre
en, g
(s)
26.8
31.8
63.1
63.1
25.6
57.4
17.0
17.0
Actua
ted g/
C Ra
tio0.2
30.2
70.5
30.5
30.2
20.4
80.1
40.1
4Cl
eara
nce T
ime (
s)4.5
4.54.5
4.54.2
4.24.2
Vehic
le Ex
tensio
n (s)
4.02.0
4.04.0
2.52.5
2.5La
ne G
rp C
ap (v
ph)
669
474
910
759
395
766
253
262
v/s R
atio P
rot
c0.24
0.25
c0.17
0.20
0.02
c0.10
v/s R
atio P
erm
c0.19
0.02
v/c R
atio
0.82
0.88
0.46
0.03
0.79
0.41
0.17
0.73
Unifo
rm D
elay,
d143
.641
.517
.213
.244
.019
.744
.648
.6Pr
ogre
ssion
Fac
tor1.0
01.0
01.0
01.0
01.0
01.0
01.0
01.0
0Inc
reme
ntal D
elay,
d28.3
16.1
0.50.0
10.2
0.30.2
9.5De
lay (s
)52
.057
.717
.713
.254
.319
.944
.858
.1Le
vel o
f Ser
vice
DE
BB
DB
DE
Appr
oach
Dela
y (s)
52.0
36.5
33.0
55.7
Appr
oach
LOS
DD
CE
Inter
secti
on S
umma
ryHC
M 20
00 C
ontro
l Dela
y40
.6HC
M 20
00 Le
vel o
f Ser
vice
DHC
M 20
00 V
olume
to C
apac
ity ra
tio0.8
2Ac
tuated
Cyc
le Le
ngth
(s)
118.6
Sum
of los
t time
(s)
17.4
Inter
secti
on C
apac
ity U
tiliza
tion
81.0%
ICU
Leve
l of S
ervic
eD
Analy
sis P
eriod
(min)
15c
Criti
cal L
ane G
roup
HC
M S
igna
lized
Inte
rsec
tion
Cap
acity
Ana
lysi
s2:
E D
St &
Lak
evill
e S
t6/4
/2015
Sync
hro 8
Rep
ort
Altur
a Ap
artm
ents
Traff
ic Im
pact
Stud
y Fu
ture P
M Pe
ak H
our -
No P
rojec
tW
-Tra
ns
Move
ment
EBL
EBT
EBR
WBL
WBT
WBR
NBL
NBT
NBR
SBL
SBT
SBR
Lane
Con
figur
ation
sVo
lume (
vph)
2253
410
135
266
862
169
196
428
6628
810
4Ide
al Flo
w (vp
hpl)
1900
1900
1900
1900
1900
1900
1900
1900
1900
1900
1900
1900
Total
Lost
time (
s)4.5
4.54.5
4.54.2
4.24.2
4.2La
ne U
til. F
actor
0.95
1.00
1.00
1.00
1.00
1.00
1.00
1.00
Frpb
, ped
/bike
s0.9
71.0
01.0
00.9
11.0
01.0
01.0
00.9
9Flp
b, pe
d/bike
s1.0
01.0
01.0
01.0
01.0
01.0
01.0
01.0
0Fr
t0.9
81.0
01.0
00.8
51.0
00.8
51.0
00.9
6Flt
Pro
tected
1.00
0.95
1.00
1.00
0.98
1.00
0.95
1.00
Satd.
Flow
(pro
t)32
5517
7017
7614
4118
2115
8317
7017
75Flt
Per
mitte
d0.9
10.9
51.0
01.0
00.9
81.0
00.9
51.0
0Sa
td. F
low (p
erm)
2981
1770
1776
1441
1821
1583
1770
1775
Peak
-hou
r fac
tor, P
HF1.0
01.0
01.0
01.0
01.0
01.0
01.0
01.0
01.0
01.0
01.0
01.0
0Ad
j. Flow
(vph
)22
534
101
352
668
6216
919
642
866
288
104
RTOR
Red
uctio
n (vp
h)0
00
00
260
019
00
90
Lane
Gro
up F
low (v
ph)
065
70
352
668
360
365
238
6638
30
Confl
. Ped
s. (#
/hr)
1632
3216
24
42
Confl
. Bike
s (#/h
r)21
171
1He
avy V
ehicl
es (%
)2%
6%2%
2%7%
2%2%
2%2%
2%2%
2%Tu
rn T
ype
Perm
NAPr
otNA
Perm
Split
NApt+
ovSp
litNA
Prote
cted P
hase
s4
38
22
2 36
6Pe
rmitte
d Pha
ses
48
Actua
ted G
reen
, G (s
)40
.323
.568
.368
.330
.954
.427
.927
.9Ef
fectiv
e Gre
en, g
(s)
40.3
23.5
68.3
68.3
30.9
54.4
27.9
27.9
Actua
ted g/
C Ra
tio0.2
90.1
70.4
90.4
90.2
20.3
90.2
00.2
0Cl
eara
nce T
ime (
s)4.5
4.54.5
4.54.2
4.24.2
Vehic
le Ex
tensio
n (s)
4.02.0
4.04.0
2.52.5
2.5La
ne G
rp C
ap (v
ph)
858
297
866
703
401
615
352
353
v/s R
atio P
rot
c0.20
c0.38
c0.20
0.15
0.04
c0.22
v/s R
atio P
erm
0.22
0.02
v/c R
atio
0.77
1.19
0.77
0.05
0.91
0.39
0.19
1.09
Unifo
rm D
elay,
d145
.558
.229
.418
.853
.230
.846
.656
.0Pr
ogre
ssion
Fac
tor0.5
60.6
41.1
21.2
01.0
01.0
01.0
01.0
0Inc
reme
ntal D
elay,
d22.4
104.1
4.50.1
24.3
0.30.2
72.7
Delay
(s)
27.8
141.5
37.5
22.6
77.5
31.1
46.8
128.8
Leve
l of S
ervic
eC
FD
CE
CD
FAp
proa
ch D
elay (
s)27
.870
.552
.511
7.0Ap
proa
ch LO
SC
ED
F
Inter
secti
on S
umma
ryHC
M 20
00 C
ontro
l Dela
y63
.4HC
M 20
00 Le
vel o
f Ser
vice
EHC
M 20
00 V
olume
to C
apac
ity ra
tio0.9
7Ac
tuated
Cyc
le Le
ngth
(s)
140.0
Sum
of los
t time
(s)
17.4
Inter
secti
on C
apac
ity U
tiliza
tion
110.9
%IC
U Le
vel o
f Ser
vice
HAn
alysis
Per
iod (m
in)15
c C
ritica
l Lan
e Gro
up
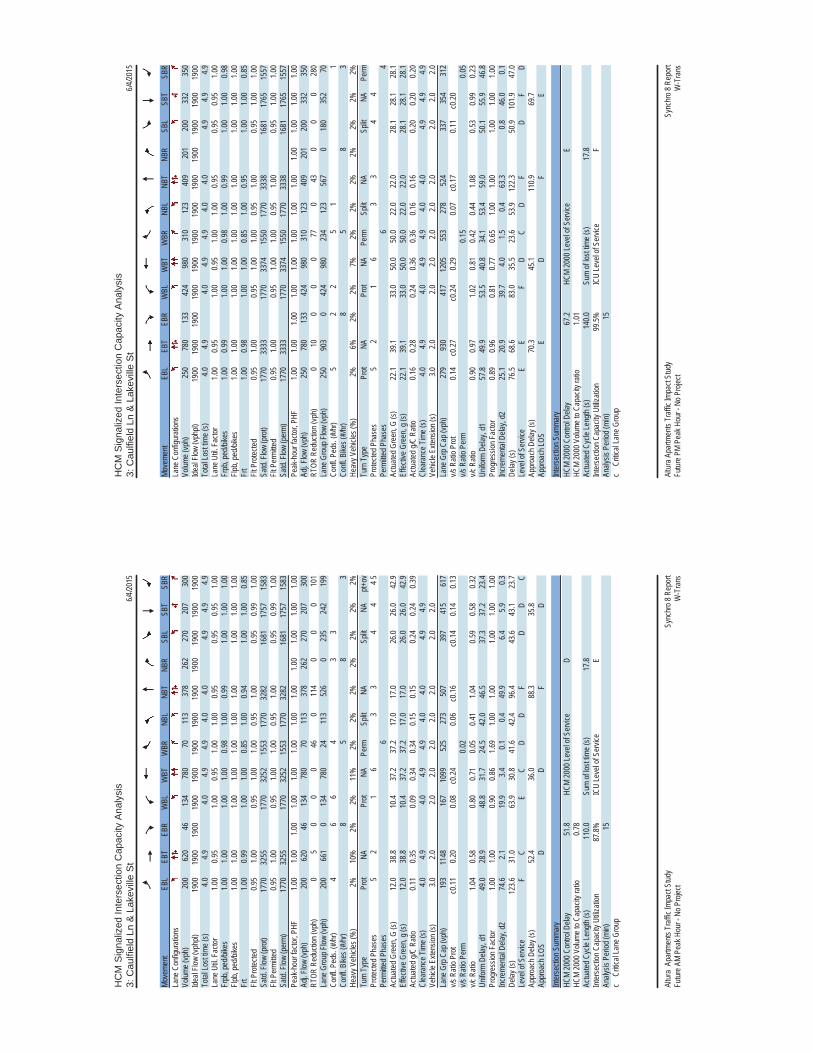
HC
M S
igna
lized
Inte
rsec
tion
Cap
acity
Ana
lysi
s3:
Cau
lfiel
d Ln
& L
akev
ille
St
6/4/20
15
Sync
hro 8
Rep
ort
Altur
a Ap
artm
ents
Traff
ic Im
pact
Stud
y Fu
ture A
M Pe
ak H
our -
No P
rojec
tW
-Tra
ns
Move
ment
EBL
EBT
EBR
WBL
WBT
WBR
NBL
NBT
NBR
SBL
SBT
SBR
Lane
Con
figur
ation
sVo
lume (
vph)
200
620
4613
478
070
113
378
262
270
207
300
Ideal
Flow
(vphp
l)19
0019
0019
0019
0019
0019
0019
0019
0019
0019
0019
0019
00To
tal Lo
st tim
e (s)
4.04.9
4.04.9
4.94.0
4.04.9
4.94.9
Lane
Util.
Fac
tor1.0
00.9
51.0
00.9
51.0
01.0
00.9
50.9
50.9
51.0
0Fr
pb, p
ed/bi
kes
1.00
1.00
1.00
1.00
0.98
1.00
0.99
1.00
1.00
1.00
Flpb,
ped/b
ikes
1.00
1.00
1.00
1.00
1.00
1.00
1.00
1.00
1.00
1.00
Frt
1.00
0.99
1.00
1.00
0.85
1.00
0.94
1.00
1.00
0.85
Flt P
rotec
ted0.9
51.0
00.9
51.0
01.0
00.9
51.0
00.9
50.9
91.0
0Sa
td. F
low (p
rot)
1770
3255
1770
3252
1553
1770
3282
1681
1757
1583
Flt P
ermi
tted
0.95
1.00
0.95
1.00
1.00
0.95
1.00
0.95
0.99
1.00
Satd.
Flow
(per
m)17
7032
5517
7032
5215
5317
7032
8216
8117
5715
83Pe
ak-h
our f
actor
, PHF
1.00
1.00
1.00
1.00
1.00
1.00
1.00
1.00
1.00
1.00
1.00
1.00
Adj. F
low (v
ph)
200
620
4613
478
070
113
378
262
270
207
300
RTOR
Red
uctio
n (vp
h)0
50
00
460
114
00
010
1La
ne G
roup
Flow
(vph
)20
066
10
134
780
2411
352
60
235
242
199
Confl
. Ped
s. (#
/hr)
46
64
33
Confl
. Bike
s (#/h
r)8
58
3He
avy V
ehicl
es (%
)2%
10%
2%2%
11%
2%2%
2%2%
2%2%
2%Tu
rn T
ype
Prot
NAPr
otNA
Perm
Split
NASp
litNA
pt+ov
Prote
cted P
hase
s5
21
63
34
44 5
Perm
itted P
hase
s6
Actua
ted G
reen
, G (s
)12
.038
.810
.437
.237
.217
.017
.026
.026
.042
.9Ef
fectiv
e Gre
en, g
(s)
12.0
38.8
10.4
37.2
37.2
17.0
17.0
26.0
26.0
42.9
Actua
ted g/
C Ra
tio0.1
10.3
50.0
90.3
40.3
40.1
50.1
50.2
40.2
40.3
9Cl
eara
nce T
ime (
s)4.0
4.94.0
4.94.9
4.04.0
4.94.9
Vehic
le Ex
tensio
n (s)
3.02.0
2.02.0
2.02.0
2.02.0
2.0La
ne G
rp C
ap (v
ph)
193
1148
167
1099
525
273
507
397
415
617
v/s R
atio P
rot
c0.11
0.20
0.08
c0.24
0.06
c0.16
c0.14
0.14
0.13
v/s R
atio P
erm
0.02
v/c R
atio
1.04
0.58
0.80
0.71
0.05
0.41
1.04
0.59
0.58
0.32
Unifo
rm D
elay,
d149
.028
.948
.831
.724
.542
.046
.537
.337
.223
.4Pr
ogre
ssion
Fac
tor1.0
01.0
00.9
00.8
61.6
91.0
01.0
01.0
01.0
01.0
0Inc
reme
ntal D
elay,
d274
.62.1
19.9
3.40.1
0.449
.96.4
5.90.3
Delay
(s)
123.6
31.0
63.9
30.8
41.6
42.4
96.4
43.6
43.1
23.7
Leve
l of S
ervic
eF
CE
CD
DF
DD
CAp
proa
ch D
elay (
s)52
.436
.088
.335
.8Ap
proa
ch LO
SD
DF
D
Inter
secti
on S
umma
ryHC
M 20
00 C
ontro
l Dela
y51
.8HC
M 20
00 Le
vel o
f Ser
vice
DHC
M 20
00 V
olume
to C
apac
ity ra
tio0.7
8Ac
tuated
Cyc
le Le
ngth
(s)
110.0
Sum
of los
t time
(s)
17.8
Inter
secti
on C
apac
ity U
tiliza
tion
87.8%
ICU
Leve
l of S
ervic
eE
Analy
sis P
eriod
(min)
15c
Criti
cal L
ane G
roup
HC
M S
igna
lized
Inte
rsec
tion
Cap
acity
Ana
lysi
s3:
Cau
lfiel
d Ln
& L
akev
ille
St
6/4/20
15
Sync
hro 8
Rep
ort
Altur
a Apa
rtmen
ts Tr
affic
Impa
ct St
udy
Futur
e PM
Peak
Hou
r - N
o Pro
ject
W-T
rans
Move
ment
EBL
EBT
EBR
WBL
WBT
WBR
NBL
NBT
NBR
SBL
SBT
SBR
Lane
Con
figur
ation
sVo
lume (
vph)
250
780
133
424
980
310
123
409
201
200
332
350
Ideal
Flow
(vphp
l)19
0019
0019
0019
0019
0019
0019
0019
0019
0019
0019
0019
00To
tal Lo
st tim
e (s)
4.04.9
4.04.9
4.94.0
4.04.9
4.94.9
Lane
Util.
Fac
tor1.0
00.9
51.0
00.9
51.0
01.0
00.9
50.9
50.9
51.0
0Fr
pb, p
ed/bi
kes
1.00
0.99
1.00
1.00
0.98
1.00
0.99
1.00
1.00
0.98
Flpb,
ped/b
ikes
1.00
1.00
1.00
1.00
1.00
1.00
1.00
1.00
1.00
1.00
Frt
1.00
0.98
1.00
1.00
0.85
1.00
0.95
1.00
1.00
0.85
Flt P
rotec
ted0.9
51.0
00.9
51.0
01.0
00.9
51.0
00.9
51.0
01.0
0Sa
td. F
low (p
rot)
1770
3333
1770
3374
1550
1770
3338
1681
1765
1557
Flt P
ermi
tted
0.95
1.00
0.95
1.00
1.00
0.95
1.00
0.95
1.00
1.00
Satd.
Flow
(per
m)17
7033
3317
7033
7415
5017
7033
3816
8117
6515
57Pe
ak-h
our f
actor
, PHF
1.00
1.00
1.00
1.00
1.00
1.00
1.00
1.00
1.00
1.00
1.00
1.00
Adj. F
low (v
ph)
250
780
133
424
980
310
123
409
201
200
332
350
RTOR
Red
uctio
n (vp
h)0
100
00
770
430
00
280
Lane
Gro
up F
low (v
ph)
250
903
042
498
023
412
356
70
180
352
70Co
nfl. P
eds.
(#/hr
)5
22
51
1Co
nfl. B
ikes (
#/hr)
85
83
Heav
y Veh
icles
(%)
2%6%
2%2%
7%2%
2%2%
2%2%
2%2%
Turn
Typ
ePr
otNA
Prot
NAPe
rmSp
litNA
Split
NAPe
rmPr
otecte
d Pha
ses
52
16
33
44
Perm
itted P
hase
s6
4Ac
tuated
Gre
en, G
(s)
22.1
39.1
33.0
50.0
50.0
22.0
22.0
28.1
28.1
28.1
Effec
tive G
reen
, g (s
)22
.139
.133
.050
.050
.022
.022
.028
.128
.128
.1Ac
tuated
g/C
Ratio
0.16
0.28
0.24
0.36
0.36
0.16
0.16
0.20
0.20
0.20
Clea
ranc
e Tim
e (s)
4.04.9
4.04.9
4.94.0
4.04.9
4.94.9
Vehic
le Ex
tensio
n (s)
3.02.0
2.02.0
2.02.0
2.02.0
2.02.0
Lane
Grp
Cap
(vph
)27
993
041
712
0555
327
852
433
735
431
2v/s
Rati
o Pro
t0.1
4c0
.27c0
.240.2
90.0
7c0
.170.1
1c0
.20v/s
Rati
o Per
m0.1
50.0
5v/c
Rati
o0.9
00.9
71.0
20.8
10.4
20.4
41.0
80.5
30.9
90.2
3Un
iform
Dela
y, d1
57.8
49.9
53.5
40.8
34.1
53.4
59.0
50.1
55.9
46.8
Prog
ress
ion F
actor
0.89
0.96
0.81
0.77
0.65
1.00
1.00
1.00
1.00
1.00
Incre
menta
l Dela
y, d2
25.1
20.9
39.7
4.01.5
0.463
.30.8
46.0
0.1De
lay (s
)76
.568
.683
.035
.523
.653
.912
2.350
.910
1.947
.0Le
vel o
f Ser
vice
EE
FD
CD
FD
FD
Appr
oach
Dela
y (s)
70.3
45.1
110.9
69.7
Appr
oach
LOS
ED
FE
Inter
secti
on S
umma
ryHC
M 20
00 C
ontro
l Dela
y67
.2HC
M 20
00 Le
vel o
f Ser
vice
EHC
M 20
00 V
olume
to C
apac
ity ra
tio1.0
1Ac
tuated
Cyc
le Le
ngth
(s)
140.0
Sum
of los
t time
(s)
17.8
Inter
secti
on C
apac
ity U
tiliza
tion
99.5%
ICU
Leve
l of S
ervic
eF
Analy
sis P
eriod
(min)
15c
Criti
cal L
ane G
roup

HC
M S
igna
lized
Inte
rsec
tion
Cap
acity
Ana
lysi
s4:
In-n
-Out
Driv
eway
/US
101
SB
Ram
ps &
Lak
evill
e S
t/Lak
evill
e H
wy
10/17
/2014
Sync
hro 8
Rep
ort
Altur
a Ap
artm
ents
Traff
ic Im
pact
Stud
y Fu
ture A
M Pe
ak H
our -
No P
rojec
tW
-Tra
ns
Move
ment
EBL
EBT
EBR
WBL
WBT
WBR
NBL
NBT
NBR
SBL
SBT
SBR
Lane
Con
figur
ation
sVo
lume (
vph)
310
922
106
756
360
55
792
05
298
Ideal
Flow
(vphp
l)19
0019
0019
0019
0019
0019
0019
0019
0019
0019
0019
0019
00To
tal Lo
st tim
e (s)
4.55.0
3.55.0
5.03.5
4.94.9
4.5La
ne U
til. F
actor
0.97
0.95
1.00
0.95
1.00
1.00
0.95
0.95
1.00
Frpb
, ped
/bike
s1.0
01.0
01.0
01.0
01.0
00.9
31.0
01.0
01.0
0Flp
b, pe
d/bike
s1.0
01.0
01.0
01.0
01.0
01.0
01.0
01.0
01.0
0Fr
t1.0
01.0
01.0
01.0
00.8
50.9
41.0
01.0
00.8
5Flt
Pro
tected
0.95
1.00
0.95
1.00
1.00
0.99
0.95
0.95
1.00
Satd.
Flow
(pro
t)34
3332
7917
7031
3915
8316
1816
8116
8615
83Flt
Per
mitte
d0.9
51.0
00.9
51.0
01.0
00.9
90.9
50.9
51.0
0Sa
td. F
low (p
erm)
3433
3279
1770
3139
1583
1618
1681
1686
1583
Peak
-hou
r fac
tor, P
HF1.0
01.0
01.0
01.0
01.0
01.0
01.0
01.0
01.0
01.0
01.0
01.0
0Ad
j. Flow
(vph
)31
092
210
675
636
05
57
920
529
8RT
OR R
educ
tion (
vph)
00
00
023
00
70
00
93La
ne G
roup
Flow
(vph
)31
093
20
675
613
00
100
460
465
205
Confl
. Ped
s. (#
/hr)
23
Confl
. Bike
s (#/h
r)9
Heav
y Veh
icles
(%)
2%10
%2%
2%15
%2%
2%2%
2%2%
2%2%
Turn
Typ
ePr
otNA
Prot
NAPe
rmSp
litNA
Split
NApm
+ov
Prote
cted P
hase
s5
21
68
84
45
Perm
itted P
hase
s6
4Ac
tuated
Gre
en, G
(s)
16.8
56.4
1.239
.839
.82.0
33.5
33.5
50.3
Effec
tive G
reen
, g (s
)16
.856
.41.2
39.8
39.8
2.033
.533
.550
.3Ac
tuated
g/C
Ratio
0.15
0.51
0.01
0.36
0.36
0.02
0.30
0.30
0.46
Clea
ranc
e Tim
e (s)
4.55.0
3.55.0
5.03.5
4.94.9
4.5Ve
hicle
Exten
sion (
s)3.0
3.02.0
3.03.0
3.03.0
3.03.0
Lane
Grp
Cap
(vph
)52
416
8119
1135
572
2951
151
378
8v/s
Rati
o Pro
t0.0
9c0
.280.0
0c0
.24c0
.010.2
7c0
.280.0
4v/s
Rati
o Per
m0.0
80.0
9v/c
Rati
o0.5
90.5
50.3
20.6
70.2
30.3
50.9
00.9
10.2
6Un
iform
Dela
y, d1
43.4
18.2
54.0
29.5
24.4
53.4
36.6
36.7
18.4
Prog
ress
ion F
actor
1.03
1.15
1.20
0.47
0.80
1.00
1.00
1.00
1.00
Incre
menta
l Dela
y, d2
1.41.0
3.02.7
0.87.2
18.8
19.5
0.2De
lay (s
)46
.222
.067
.816
.620
.260
.555
.556
.318
.6Le
vel o
f Ser
vice
DC
EB
CE
EE
BAp
proa
ch D
elay (
s)28
.018
.160
.546
.8Ap
proa
ch LO
SC
BE
D
Inter
secti
on S
umma
ryHC
M 20
00 C
ontro
l Dela
y31
.4HC
M 20
00 Le
vel o
f Ser
vice
CHC
M 20
00 V
olume
to C
apac
ity ra
tio0.7
4Ac
tuated
Cyc
le Le
ngth
(s)
110.0
Sum
of los
t time
(s)
17.9
Inter
secti
on C
apac
ity U
tiliza
tion
74.7%
ICU
Leve
l of S
ervic
eD
Analy
sis P
eriod
(min)
15c
Criti
cal L
ane G
roup
HC
M S
igna
lized
Inte
rsec
tion
Cap
acity
Ana
lysi
s4:
In-n
-Out
Driv
eway
/US
101
SB
Ram
ps &
Lak
evill
e S
t/Lak
evill
e H
wy
10/17
/2014
Sync
hro 8
Rep
ort
Altur
a Ap
artm
ents
Traff
ic Im
pact
Stud
y Fu
ture P
M Pe
ak H
our -
No P
rojec
tW
-Tra
ns
Move
ment
EBL
EBT
EBR
WBL
WBT
WBR
NBL
NBT
NBR
SBL
SBT
SBR
Lane
Con
figur
ation
sVo
lume (
vph)
160
1096
1532
1357
270
255
1067
05
377
Ideal
Flow
(vphp
l)19
0019
0019
0019
0019
0019
0019
0019
0019
0019
0019
0019
00To
tal Lo
st tim
e (s)
4.05.0
4.05.0
5.04.4
4.94.9
4.0La
ne U
til. F
actor
0.97
0.95
1.00
0.95
1.00
1.00
0.95
0.95
1.00
Frpb
, ped
/bike
s1.0
01.0
01.0
01.0
01.0
00.9
71.0
01.0
00.9
8Flp
b, pe
d/bike
s1.0
01.0
01.0
01.0
01.0
01.0
01.0
01.0
01.0
0Fr
t1.0
01.0
01.0
01.0
00.8
50.9
71.0
01.0
00.8
5Flt
Pro
tected
0.95
1.00
0.95
1.00
1.00
0.97
0.95
0.95
1.00
Satd.
Flow
(pro
t)34
3333
9917
7033
1215
8316
9216
8116
8715
55Flt
Per
mitte
d0.9
51.0
00.9
51.0
01.0
00.9
70.9
50.9
51.0
0Sa
td. F
low (p
erm)
3433
3399
1770
3312
1583
1692
1681
1687
1555
Peak
-hou
r fac
tor, P
HF1.0
01.0
01.0
01.0
01.0
01.0
01.0
01.0
01.0
01.0
01.0
01.0
0Ad
j. Flow
(vph
)16
010
9615
3213
5727
025
510
670
537
7RT
OR R
educ
tion (
vph)
00
00
013
50
90
00
60La
ne G
roup
Flow
(vph
)16
011
110
3213
5713
50
310
335
340
317
Confl
. Ped
s. (#
/hr)
22
55
5Co
nfl. B
ikes (
#/hr)
158
Heav
y Veh
icles
(%)
2%6%
2%2%
9%2%
2%2%
2%2%
2%2%
Turn
Typ
ePr
otNA
Prot
NAPe
rmSp
litNA
Split
NApm
+ov
Prote
cted P
hase
s5
21
68
84
45
Perm
itted P
hase
s6
4Ac
tuated
Gre
en, G
(s)
11.9
72.2
9.870
.170
.15.8
33.9
33.9
45.8
Effec
tive G
reen
, g (s
)11
.972
.29.8
70.1
70.1
5.833
.933
.945
.8Ac
tuated
g/C
Ratio
0.09
0.52
0.07
0.50
0.50
0.04
0.24
0.24
0.33
Clea
ranc
e Tim
e (s)
4.05.0
4.05.0
5.04.4
4.94.9
4.0Ve
hicle
Exten
sion (
s)3.0
3.02.0
3.03.0
2.03.0
3.03.0
Lane
Grp
Cap
(vph
)29
117
5212
316
5879
270
407
408
508
v/s R
atio P
rot
0.05
c0.33
0.02
c0.41
c0.02
0.20
c0.20
0.05
v/s R
atio P
erm
0.09
0.15
v/c R
atio
0.55
0.63
0.26
0.82
0.17
0.45
0.82
0.83
0.62
Unifo
rm D
elay,
d161
.524
.461
.729
.619
.165
.550
.250
.439
.8Pr
ogre
ssion
Fac
tor1.2
00.4
70.9
70.9
41.4
91.0
01.0
01.0
01.0
0Inc
reme
ntal D
elay,
d21.0
0.90.3
2.90.3
1.712
.613
.62.4
Delay
(s)
74.9
12.4
59.8
30.6
28.8
67.2
62.9
64.0
42.2
Leve
l of S
ervic
eE
BE
CC
EE
ED
Appr
oach
Dela
y (s)
20.3
30.9
67.2
55.8
Appr
oach
LOS
CC
EE
Inter
secti
on S
umma
ryHC
M 20
00 C
ontro
l Dela
y34
.4HC
M 20
00 Le
vel o
f Ser
vice
CHC
M 20
00 V
olume
to C
apac
ity ra
tio0.7
9Ac
tuated
Cyc
le Le
ngth
(s)
140.0
Sum
of los
t time
(s)
18.3
Inter
secti
on C
apac
ity U
tiliza
tion
79.5%
ICU
Leve
l of S
ervic
eD
Analy
sis P
eriod
(min)
15c
Criti
cal L
ane G
roup
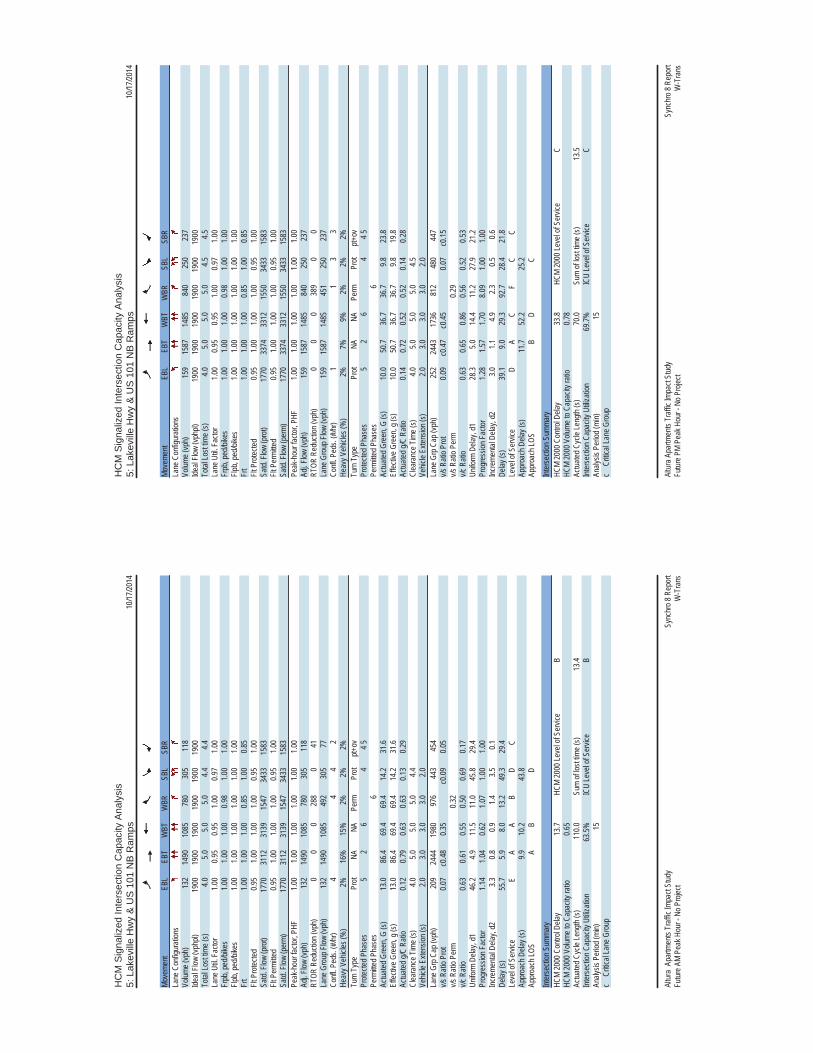
HC
M S
igna
lized
Inte
rsec
tion
Cap
acity
Ana
lysi
s5:
Lak
evill
e H
wy
& U
S 1
01 N
B R
amps
10/17
/2014
Sync
hro 8
Rep
ort
Altur
a Ap
artm
ents
Traff
ic Im
pact
Stud
y Fu
ture A
M Pe
ak H
our -
No P
rojec
tW
-Tra
ns
Move
ment
EBL
EBT
WBT
WBR
SBL
SBR
Lane
Con
figur
ation
sVo
lume (
vph)
132
1490
1085
780
305
118
Ideal
Flow
(vphp
l)19
0019
0019
0019
0019
0019
00To
tal Lo
st tim
e (s)
4.05.0
5.05.0
4.44.4
Lane
Util.
Fac
tor1.0
00.9
50.9
51.0
00.9
71.0
0Fr
pb, p
ed/bi
kes
1.00
1.00
1.00
0.98
1.00
1.00
Flpb,
ped/b
ikes
1.00
1.00
1.00
1.00
1.00
1.00
Frt
1.00
1.00
1.00
0.85
1.00
0.85
Flt P
rotec
ted0.9
51.0
01.0
01.0
00.9
51.0
0Sa
td. F
low (p
rot)
1770
3112
3139
1547
3433
1583
Flt P
ermi
tted
0.95
1.00
1.00
1.00
0.95
1.00
Satd.
Flow
(per
m)17
7031
1231
3915
4734
3315
83Pe
ak-h
our f
actor
, PHF
1.00
1.00
1.00
1.00
1.00
1.00
Adj. F
low (v
ph)
132
1490
1085
780
305
118
RTOR
Red
uctio
n (vp
h)0
00
288
041
Lane
Gro
up F
low (v
ph)
132
1490
1085
492
305
77Co
nfl. P
eds.
(#/hr
)4
44
2He
avy V
ehicl
es (%
)2%
16%
15%
2%2%
2%Tu
rn T
ype
Prot
NANA
Perm
Prot
pt+ov
Prote
cted P
hase
s5
26
44 5
Perm
itted P
hase
s6
Actua
ted G
reen
, G (s
)13
.086
.469
.469
.414
.231
.6Ef
fectiv
e Gre
en, g
(s)
13.0
86.4
69.4
69.4
14.2
31.6
Actua
ted g/
C Ra
tio0.1
20.7
90.6
30.6
30.1
30.2
9Cl
eara
nce T
ime (
s)4.0
5.05.0
5.04.4
Vehic
le Ex
tensio
n (s)
2.03.0
3.03.0
2.0La
ne G
rp C
ap (v
ph)
209
2444
1980
976
443
454
v/s R
atio P
rot
0.07
c0.48
0.35
c0.09
0.05
v/s R
atio P
erm
0.32
v/c R
atio
0.63
0.61
0.55
0.50
0.69
0.17
Unifo
rm D
elay,
d146
.24.9
11.5
11.0
45.8
29.4
Prog
ress
ion F
actor
1.14
1.04
0.62
1.07
1.00
1.00
Incre
menta
l Dela
y, d2
3.30.8
0.91.4
3.50.1
Delay
(s)
55.7
5.98.0
13.2
49.3
29.4
Leve
l of S
ervic
eE
AA
BD
CAp
proa
ch D
elay (
s)9.9
10.2
43.8
Appr
oach
LOS
AB
D
Inter
secti
on S
umma
ryHC
M 20
00 C
ontro
l Dela
y13
.7HC
M 20
00 Le
vel o
f Ser
vice
BHC
M 20
00 V
olume
to C
apac
ity ra
tio0.6
5Ac
tuated
Cyc
le Le
ngth
(s)
110.0
Sum
of los
t time
(s)
13.4
Inter
secti
on C
apac
ity U
tiliza
tion
63.5%
ICU
Leve
l of S
ervic
eB
Analy
sis P
eriod
(min)
15c
Criti
cal L
ane G
roup
HC
M S
igna
lized
Inte
rsec
tion
Cap
acity
Ana
lysi
s5:
Lak
evill
e H
wy
& U
S 1
01 N
B R
amps
10/17
/2014
Sync
hro 8
Rep
ort
Altur
a Apa
rtmen
ts Tr
affic
Impa
ct St
udy
Futur
e PM
Peak
Hou
r - N
o Pro
ject
W-T
rans
Move
ment
EBL
EBT
WBT
WBR
SBL
SBR
Lane
Con
figur
ation
sVo
lume (
vph)
159
1587
1485
840
250
237
Ideal
Flow
(vphp
l)19
0019
0019
0019
0019
0019
00To
tal Lo
st tim
e (s)
4.05.0
5.05.0
4.54.5
Lane
Util.
Fac
tor1.0
00.9
50.9
51.0
00.9
71.0
0Fr
pb, p
ed/bi
kes
1.00
1.00
1.00
0.98
1.00
1.00
Flpb,
ped/b
ikes
1.00
1.00
1.00
1.00
1.00
1.00
Frt
1.00
1.00
1.00
0.85
1.00
0.85
Flt P
rotec
ted0.9
51.0
01.0
01.0
00.9
51.0
0Sa
td. F
low (p
rot)
1770
3374
3312
1550
3433
1583
Flt P
ermi
tted
0.95
1.00
1.00
1.00
0.95
1.00
Satd.
Flow
(per
m)17
7033
7433
1215
5034
3315
83Pe
ak-h
our f
actor
, PHF
1.00
1.00
1.00
1.00
1.00
1.00
Adj. F
low (v
ph)
159
1587
1485
840
250
237
RTOR
Red
uctio
n (vp
h)0
00
389
00
Lane
Gro
up F
low (v
ph)
159
1587
1485
451
250
237
Confl
. Ped
s. (#
/hr)
11
33
Heav
y Veh
icles
(%)
2%7%
9%2%
2%2%
Turn
Typ
ePr
otNA
NAPe
rmPr
otpt+
ovPr
otecte
d Pha
ses
52
64
4 5Pe
rmitte
d Pha
ses
6Ac
tuated
Gre
en, G
(s)
10.0
50.7
36.7
36.7
9.823
.8Ef
fectiv
e Gre
en, g
(s)
10.0
50.7
36.7
36.7
9.819
.8Ac
tuated
g/C
Ratio
0.14
0.72
0.52
0.52
0.14
0.28
Clea
ranc
e Tim
e (s)
4.05.0
5.05.0
4.5Ve
hicle
Exten
sion (
s)2.0
3.03.0
3.02.0
Lane
Grp
Cap
(vph
)25
224
4317
3681
248
044
7v/s
Rati
o Pro
t0.0
9c0
.47c0
.450.0
7c0
.15v/s
Rati
o Per
m0.2
9v/c
Rati
o0.6
30.6
50.8
60.5
60.5
20.5
3Un
iform
Dela
y, d1
28.3
5.014
.411
.227
.921
.2Pr
ogre
ssion
Fac
tor1.2
81.5
71.7
08.0
91.0
01.0
0Inc
reme
ntal D
elay,
d23.0
1.14.9
2.30.5
0.6De
lay (s
)39
.19.0
29.3
92.7
28.4
21.8
Leve
l of S
ervic
eD
AC
FC
CAp
proa
ch D
elay (
s)11
.752
.225
.2Ap
proa
ch LO
SB
DC
Inter
secti
on S
umma
ryHC
M 20
00 C
ontro
l Dela
y33
.8HC
M 20
00 Le
vel o
f Ser
vice
CHC
M 20
00 V
olume
to C
apac
ity ra
tio0.7
8Ac
tuated
Cyc
le Le
ngth
(s)
70.0
Sum
of los
t time
(s)
13.5
Inter
secti
on C
apac
ity U
tiliza
tion
69.7%
ICU
Leve
l of S
ervic
eC
Analy
sis P
eriod
(min)
15c
Criti
cal L
ane G
roup

HC
M S
igna
lized
Inte
rsec
tion
Cap
acity
Ana
lysi
s6:
Bay
woo
d D
r & L
akev
ille
Hw
y10
/17/20
14
Sync
hro 8
Rep
ort
Altur
a Ap
artm
ents
Traff
ic Im
pact
Stud
y Fu
ture A
M Pe
ak H
our -
No P
rojec
tW
-Tra
ns
Move
ment
EBL
EBT
EBR
WBL
WBT
WBR
NBL
NBT
NBR
SBL
SBT
SBR
Lane
Con
figur
ation
sVo
lume (
vph)
7717
8239
1612
9635
2810
1432
2333
5Ide
al Flo
w (vp
hpl)
1900
1900
1900
1900
1900
1900
1900
1900
1900
1900
1900
1900
Total
Lost
time (
s)3.5
5.34.1
5.33.0
4.43.0
4.44.4
Lane
Util.
Fac
tor1.0
00.9
51.0
00.9
51.0
01.0
01.0
01.0
01.0
0Fr
pb, p
ed/bi
kes
1.00
1.00
1.00
1.00
1.00
0.99
1.00
1.00
1.00
Flpb,
ped/b
ikes
1.00
1.00
1.00
1.00
1.00
1.00
1.00
1.00
1.00
Frt
1.00
1.00
1.00
1.00
1.00
0.91
1.00
1.00
0.85
Flt P
rotec
ted0.9
51.0
00.9
51.0
00.9
51.0
00.9
51.0
01.0
0Sa
td. F
low (p
rot)
1770
3108
1770
3134
1770
1675
1770
1863
1583
Flt P
ermi
tted
0.95
1.00
0.95
1.00
0.95
1.00
0.95
1.00
1.00
Satd.
Flow
(per
m)17
7031
0817
7031
3417
7016
7517
7018
6315
83Pe
ak-h
our f
actor
, PHF
1.00
1.00
1.00
1.00
1.00
1.00
1.00
1.00
1.00
1.00
1.00
1.00
Adj. F
low (v
ph)
7717
8239
1612
9635
2810
1432
2333
5RT
OR R
educ
tion (
vph)
01
00
10
013
00
064
Lane
Gro
up F
low (v
ph)
7718
200
1613
300
2811
032
2327
1Co
nfl. P
eds.
(#/hr
)10
11
107
7Co
nfl. B
ikes (
#/hr)
42
3He
avy V
ehicl
es (%
)2%
16%
2%2%
15%
2%2%
2%2%
2%2%
2%Tu
rn T
ype
Prot
NAPr
otNA
Prot
NAPr
otNA
pt+ov
Prote
cted P
hase
s5
21
63
87
44 5
Perm
itted P
hase
sAc
tuated
Gre
en, G
(s)
19.4
73.2
2.456
.83.0
9.08.6
14.6
34.0
Effec
tive G
reen
, g (s
)19
.473
.22.4
56.8
3.09.0
8.614
.634
.0Ac
tuated
g/C
Ratio
0.18
0.67
0.02
0.52
0.03
0.08
0.08
0.13
0.31
Clea
ranc
e Tim
e (s)
3.55.3
4.15.3
3.04.4
3.04.4
Vehic
le Ex
tensio
n (s)
3.04.0
2.04.0
2.02.0
2.02.0
Lane
Grp
Cap
(vph
)31
220
6838
1618
4813
713
824
748
9v/s
Rati
o Pro
t0.0
4c0
.590.0
1c0
.42c0
.020.0
10.0
20.0
1c0
.17v/s
Rati
o Per
mv/c
Rati
o0.2
50.8
80.4
20.8
20.5
80.0
80.2
30.0
90.5
5Un
iform
Dela
y, d1
39.0
14.9
53.1
22.3
52.9
46.7
47.6
41.9
31.7
Prog
ress
ion F
actor
0.89
0.78
1.22
0.64
1.00
1.00
1.00
1.00
1.00
Incre
menta
l Dela
y, d2
0.45.2
2.23.9
11.1
0.10.3
0.10.8
Delay
(s)
35.1
16.8
66.9
18.2
64.0
46.8
47.9
41.9
32.4
Leve
l of S
ervic
eD
BE
BE
DD
DC
Appr
oach
Dela
y (s)
17.6
18.7
56.0
34.3
Appr
oach
LOS
BB
EC
Inter
secti
on S
umma
ryHC
M 20
00 C
ontro
l Dela
y20
.3HC
M 20
00 Le
vel o
f Ser
vice
CHC
M 20
00 V
olume
to C
apac
ity ra
tio0.8
3Ac
tuated
Cyc
le Le
ngth
(s)
110.0
Sum
of los
t time
(s)
16.8
Inter
secti
on C
apac
ity U
tiliza
tion
76.7%
ICU
Leve
l of S
ervic
eD
Analy
sis P
eriod
(min)
15c
Criti
cal L
ane G
roup
HC
M S
igna
lized
Inte
rsec
tion
Cap
acity
Ana
lysi
s6:
Bay
woo
d D
r & L
akev
ille
Hw
y10
/17/20
14
Sync
hro 8
Rep
ort
Altur
a Ap
artm
ents
Traff
ic Im
pact
Stud
y Fu
ture P
M Pe
ak H
our -
No P
rojec
tW
-Tra
ns
Move
ment
EBL
EBT
EBR
WBL
WBT
WBR
NBL
NBT
NBR
SBL
SBT
SBR
Lane
Con
figur
ation
sVo
lume (
vph)
221
1297
3218
1536
4011
937
1927
1215
7Ide
al Flo
w (vp
hpl)
1900
1900
1900
1900
1900
1900
1900
1900
1900
1900
1900
1900
Total
Lost
time (
s)3.5
5.34.1
5.33.0
4.43.0
4.44.4
Lane
Util.
Fac
tor1.0
00.9
51.0
00.9
51.0
01.0
01.0
01.0
01.0
0Fr
pb, p
ed/bi
kes
1.00
1.00
1.00
1.00
1.00
0.99
1.00
1.00
1.00
Flpb,
ped/b
ikes
1.00
1.00
1.00
1.00
1.00
1.00
1.00
1.00
1.00
Frt
1.00
1.00
1.00
1.00
1.00
0.95
1.00
1.00
0.85
Flt P
rotec
ted0.9
51.0
00.9
51.0
00.9
51.0
00.9
51.0
01.0
0Sa
td. F
low (p
rot)
1770
3361
1770
3303
1770
1749
1770
1863
1583
Flt P
ermi
tted
0.95
1.00
0.95
1.00
0.95
1.00
0.95
1.00
1.00
Satd.
Flow
(per
m)17
7033
6117
7033
0317
7017
4917
7018
6315
83Pe
ak-h
our f
actor
, PHF
1.00
1.00
1.00
1.00
1.00
1.00
1.00
1.00
1.00
1.00
1.00
1.00
Adj. F
low (v
ph)
221
1297
3218
1536
4011
937
1927
1215
7RT
OR R
educ
tion (
vph)
01
00
10
015
00
062
Lane
Gro
up F
low (v
ph)
221
1328
018
1575
011
941
027
1295
Confl
. Ped
s. (#
/hr)
211
112
111
111
Confl
. Bike
s (#/h
r)4
23
Heav
y Veh
icles
(%)
2%7%
2%2%
9%2%
2%2%
2%2%
2%2%
Turn
Typ
ePr
otNA
Prot
NAPr
otNA
Prot
NApt+
ovPr
otecte
d Pha
ses
52
16
38
74
4 5Pe
rmitte
d Pha
ses
Actua
ted G
reen
, G (s
)21
.894
.28.3
81.3
13.7
16.1
4.67.0
28.8
Effec
tive G
reen
, g (s
)21
.894
.28.3
81.3
13.7
16.1
4.67.0
28.8
Actua
ted g/
C Ra
tio0.1
60.6
70.0
60.5
80.1
00.1
20.0
30.0
50.2
1Cl
eara
nce T
ime (
s)3.5
5.34.1
5.33.0
4.43.0
4.4Ve
hicle
Exten
sion (
s)3.0
4.02.0
4.02.0
2.02.0
2.0La
ne G
rp C
ap (v
ph)
275
2261
104
1918
173
201
5893
325
v/s R
atio P
rot
c0.12
0.40
0.01
c0.48
c0.07
0.02
0.02
0.01
c0.06
v/s R
atio P
erm
v/c R
atio
0.80
0.59
0.17
0.82
0.69
0.20
0.47
0.13
0.29
Unifo
rm D
elay,
d157
.012
.462
.623
.561
.156
.166
.563
.647
.0Pr
ogre
ssion
Fac
tor1.0
20.8
30.8
70.4
51.0
01.0
01.0
01.0
01.0
0Inc
reme
ntal D
elay,
d212
.90.9
0.22.5
8.70.2
2.10.2
0.2De
lay (s
)71
.211
.254
.813
.269
.856
.368
.663
.847
.2Le
vel o
f Ser
vice
EB
DB
EE
EE
DAp
proa
ch D
elay (
s)19
.713
.665
.551
.1Ap
proa
ch LO
SB
BE
D
Inter
secti
on S
umma
ryHC
M 20
00 C
ontro
l Dela
y21
.0HC
M 20
00 Le
vel o
f Ser
vice
CHC
M 20
00 V
olume
to C
apac
ity ra
tio0.7
8Ac
tuated
Cyc
le Le
ngth
(s)
140.0
Sum
of los
t time
(s)
16.8
Inter
secti
on C
apac
ity U
tiliza
tion
83.7%
ICU
Leve
l of S
ervic
eE
Analy
sis P
eriod
(min)
15c
Criti
cal L
ane G
roup

HC
M S
igna
lized
Inte
rsec
tion
Cap
acity
Ana
lysi
s7:
Cas
a G
rand
e R
d &
Lak
evill
e H
wy
10/17
/2014
Sync
hro 8
Rep
ort
Altur
a Apa
rtmen
ts Tr
affic
Impa
ct St
udy
Futur
e AM
Peak
Hou
r - N
o Pro
ject
W-T
rans
Move
ment
EBL
EBT
EBR
WBL
WBT
WBR
NBL
NBT
NBR
SBL
SBT
SBR
Lane
Con
figur
ation
sVo
lume (
vph)
227
1550
4018
1147
4585
5828
2943
268
Ideal
Flow
(vphp
l)19
0019
0019
0019
0019
0019
0019
0019
0019
0019
0019
0019
00To
tal Lo
st tim
e (s)
4.55.5
4.55.5
4.04.1
4.14.1
4.1La
ne U
til. F
actor
1.00
0.95
1.00
0.95
1.00
1.00
1.00
1.00
1.00
Frpb
, ped
/bike
s1.0
01.0
01.0
01.0
01.0
01.0
00.9
91.0
00.9
8Flp
b, pe
d/bike
s1.0
01.0
01.0
01.0
01.0
01.0
01.0
01.0
01.0
0Fr
t1.0
01.0
01.0
01.0
00.8
51.0
00.9
51.0
00.8
5Flt
Pro
tected
0.95
1.00
0.95
1.00
1.00
0.95
1.00
0.98
1.00
Satd.
Flow
(pro
t)17
7031
0817
7031
3915
8317
6117
6218
2515
46Flt
Per
mitte
d0.9
51.0
00.9
51.0
01.0
00.7
11.0
00.8
61.0
0Sa
td. F
low (p
erm)
1770
3108
1770
3139
1583
1316
1762
1592
1546
Peak
-hou
r fac
tor, P
HF1.0
01.0
01.0
01.0
01.0
01.0
01.0
01.0
01.0
01.0
01.0
01.0
0Ad
j. Flow
(vph
)22
715
5040
1811
4745
8558
2829
4326
8RT
OR R
educ
tion (
vph)
01
00
00
019
00
023
5La
ne G
roup
Flow
(vph
)22
715
890
1811
4745
8567
00
7233
Confl
. Ped
s. (#
/hr)
44
41
14
Confl
. Bike
s (#/h
r)4
21
Heav
y Veh
icles
(%)
2%16
%2%
2%15
%2%
2%2%
2%2%
2%2%
Turn
Typ
ePr
otNA
Prot
NAFr
eePe
rmNA
Perm
NAPe
rmPr
otecte
d Pha
ses
52
16
84
Perm
itted P
hase
sFr
ee8
44
Actua
ted G
reen
, G (s
)22
.278
.83.6
60.2
110.0
13.5
13.5
13.5
13.5
Effec
tive G
reen
, g (s
)22
.278
.83.6
60.2
110.0
13.5
13.5
13.5
13.5
Actua
ted g/
C Ra
tio0.2
00.7
20.0
30.5
51.0
00.1
20.1
20.1
20.1
2Cl
eara
nce T
ime (
s)4.5
5.54.5
5.54.1
4.14.1
4.1Ve
hicle
Exten
sion (
s)2.0
3.02.0
3.03.0
3.02.5
2.5La
ne G
rp C
ap (v
ph)
357
2226
5717
1715
8316
121
619
518
9v/s
Rati
o Pro
t0.1
3c0
.510.0
1c0
.370.0
4v/s
Rati
o Per
m0.0
3c0
.060.0
50.0
2v/c
Rati
o0.6
40.7
10.3
20.6
70.0
30.5
30.3
10.3
70.1
7Un
iform
Dela
y, d1
40.2
9.152
.017
.80.0
45.3
44.0
44.3
43.3
Prog
ress
ion F
actor
1.03
0.62
1.00
1.00
1.00
1.00
1.00
1.00
1.00
Incre
menta
l Dela
y, d2
1.51.1
1.22.1
0.03.1
0.80.9
0.3De
lay (s
)43
.06.7
53.2
19.8
0.048
.444
.845
.243
.6Le
vel o
f Ser
vice
DA
DB
AD
DD
DAp
proa
ch D
elay (
s)11
.219
.646
.643
.9Ap
proa
ch LO
SB
BD
D
Inter
secti
on S
umma
ryHC
M 20
00 C
ontro
l Dela
y18
.9HC
M 20
00 Le
vel o
f Ser
vice
BHC
M 20
00 V
olume
to C
apac
ity ra
tio0.7
0Ac
tuated
Cyc
le Le
ngth
(s)
110.0
Sum
of los
t time
(s)
14.1
Inter
secti
on C
apac
ity U
tiliza
tion
72.6%
ICU
Leve
l of S
ervic
eC
Analy
sis P
eriod
(min)
15c
Criti
cal L
ane G
roup
HC
M S
igna
lized
Inte
rsec
tion
Cap
acity
Ana
lysi
s7:
Cas
a G
rand
e R
d &
Lak
evill
e H
wy
10/17
/2014
Sync
hro 8
Rep
ort
Altur
a Ap
artm
ents
Traff
ic Im
pact
Stud
y Fu
ture P
M Pe
ak H
our -
No P
rojec
tW
-Tra
ns
Move
ment
EBL
EBT
EBR
WBL
WBT
WBR
NBL
NBT
NBR
SBL
SBT
SBR
Lane
Con
figur
ation
sVo
lume (
vph)
299
1243
7933
1487
8096
7516
2056
140
Ideal
Flow
(vphp
l)19
0019
0019
0019
0019
0019
0019
0019
0019
0019
0019
0019
00To
tal Lo
st tim
e (s)
4.55.5
4.55.5
4.04.1
4.14.1
4.1La
ne U
til. F
actor
1.00
0.95
1.00
0.95
1.00
1.00
1.00
1.00
1.00
Frpb
, ped
/bike
s1.0
01.0
01.0
01.0
01.0
01.0
01.0
01.0
00.9
8Flp
b, pe
d/bike
s1.0
01.0
01.0
01.0
01.0
01.0
01.0
01.0
01.0
0Fr
t1.0
00.9
91.0
01.0
00.8
51.0
00.9
71.0
00.8
5Flt
Pro
tected
0.95
1.00
0.95
1.00
1.00
0.95
1.00
0.99
1.00
Satd.
Flow
(pro
t)17
7030
9817
7031
3915
8317
6218
0818
3715
49Flt
Per
mitte
d0.9
51.0
00.9
51.0
01.0
00.6
51.0
00.9
11.0
0Sa
td. F
low (p
erm)
1770
3098
1770
3139
1583
1203
1808
1690
1549
Peak
-hou
r fac
tor, P
HF1.0
01.0
01.0
01.0
01.0
01.0
01.0
01.0
01.0
01.0
01.0
01.0
0Ad
j. Flow
(vph
)29
912
4379
3314
8780
9675
1620
5614
0RT
OR R
educ
tion (
vph)
03
00
00
06
00
012
4La
ne G
roup
Flow
(vph
)29
913
190
3314
8780
9685
00
7616
Confl
. Ped
s. (#
/hr)
1010
32
23
Confl
. Bike
s (#/h
r)4
21
Heav
y Veh
icles
(%)
2%16
%2%
2%15
%2%
2%2%
2%2%
2%2%
Turn
Typ
ePr
otNA
Prot
NAFr
eePe
rmNA
Perm
NAPe
rmPr
otecte
d Pha
ses
52
16
84
Perm
itted P
hase
sFr
ee8
44
Actua
ted G
reen
, G (s
)30
.497
.512
.179
.214
0.016
.316
.316
.316
.3Ef
fectiv
e Gre
en, g
(s)
30.4
97.5
12.1
79.2
140.0
16.3
16.3
16.3
16.3
Actua
ted g/
C Ra
tio0.2
20.7
00.0
90.5
71.0
00.1
20.1
20.1
20.1
2Cl
eara
nce T
ime (
s)4.5
5.54.5
5.54.1
4.14.1
4.1Ve
hicle
Exten
sion (
s)2.0
3.02.0
3.03.0
3.02.5
2.5La
ne G
rp C
ap (v
ph)
384
2157
152
1775
1583
140
210
196
180
v/s R
atio P
rot
c0.17
0.43
0.02
c0.47
0.05
v/s R
atio P
erm
0.05
c0.08
0.04
0.01
v/c R
atio
0.78
0.61
0.22
0.84
0.05
0.69
0.40
0.39
0.09
Unifo
rm D
elay,
d151
.611
.259
.525
.10.0
59.4
57.3
57.2
55.2
Prog
ress
ion F
actor
0.77
0.74
1.00
1.00
1.00
1.00
1.00
1.00
1.00
Incre
menta
l Dela
y, d2
8.01.2
0.34.9
0.113
.01.3
0.90.2
Delay
(s)
47.9
9.559
.830
.00.1
72.4
58.6
58.2
55.4
Leve
l of S
ervic
eD
AE
CA
EE
EE
Appr
oach
Dela
y (s)
16.6
29.1
65.7
56.4
Appr
oach
LOS
BC
EE
Inter
secti
on S
umma
ryHC
M 20
00 C
ontro
l Dela
y27
.0HC
M 20
00 Le
vel o
f Ser
vice
CHC
M 20
00 V
olume
to C
apac
ity ra
tio0.8
0Ac
tuated
Cyc
le Le
ngth
(s)
140.0
Sum
of los
t time
(s)
14.1
Inter
secti
on C
apac
ity U
tiliza
tion
82.0%
ICU
Leve
l of S
ervic
eD
Analy
sis P
eriod
(min)
15c
Criti
cal L
ane G
roup
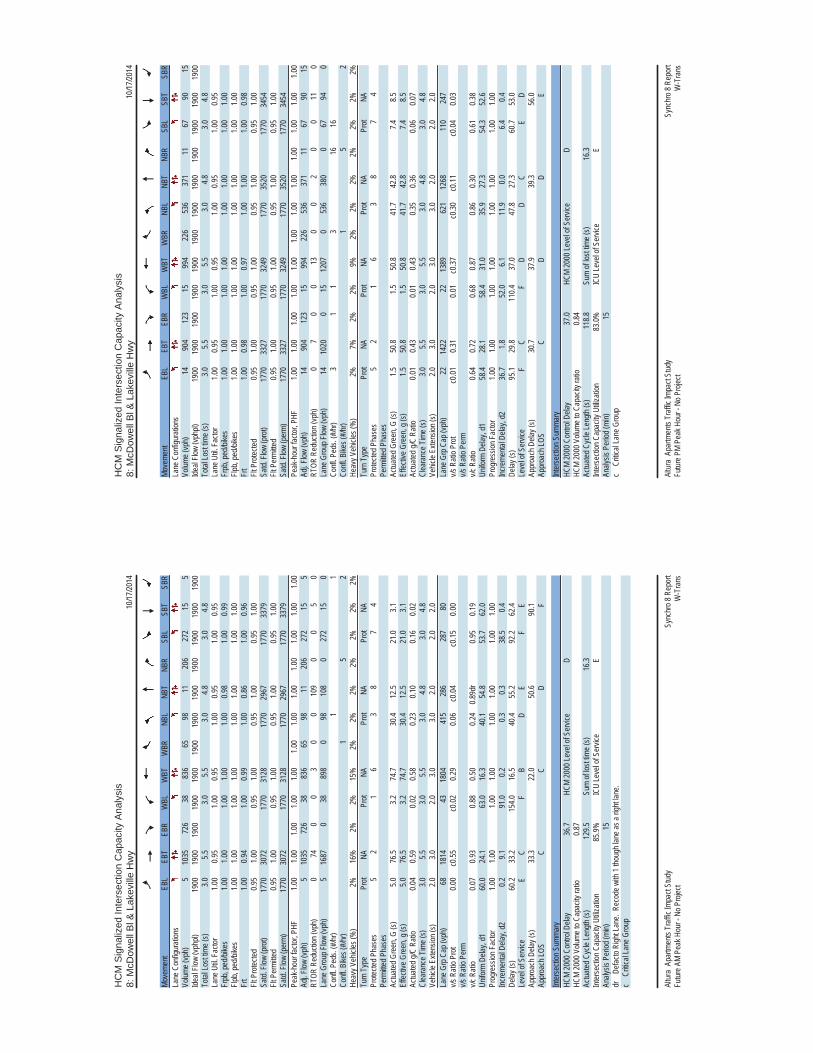
HC
M S
igna
lized
Inte
rsec
tion
Cap
acity
Ana
lysi
s8:
McD
owel
l Bl &
Lak
evill
e H
wy
10/17
/2014
Sync
hro 8
Rep
ort
Altur
a Ap
artm
ents
Traff
ic Im
pact
Stud
y Fu
ture A
M Pe
ak H
our -
No P
rojec
tW
-Tra
ns
Move
ment
EBL
EBT
EBR
WBL
WBT
WBR
NBL
NBT
NBR
SBL
SBT
SBR
Lane
Con
figur
ation
sVo
lume (
vph)
510
3572
638
836
6598
1120
627
215
5Ide
al Flo
w (vp
hpl)
1900
1900
1900
1900
1900
1900
1900
1900
1900
1900
1900
1900
Total
Lost
time (
s)3.0
5.53.0
5.53.0
4.83.0
4.8La
ne U
til. F
actor
1.00
0.95
1.00
0.95
1.00
0.95
1.00
0.95
Frpb
, ped
/bike
s1.0
01.0
01.0
01.0
01.0
00.9
81.0
00.9
9Flp
b, pe
d/bike
s1.0
01.0
01.0
01.0
01.0
01.0
01.0
01.0
0Fr
t1.0
00.9
41.0
00.9
91.0
00.8
61.0
00.9
6Flt
Pro
tected
0.95
1.00
0.95
1.00
0.95
1.00
0.95
1.00
Satd.
Flow
(pro
t)17
7030
7217
7031
2817
7029
6717
7033
79Flt
Per
mitte
d0.9
51.0
00.9
51.0
00.9
51.0
00.9
51.0
0Sa
td. F
low (p
erm)
1770
3072
1770
3128
1770
2967
1770
3379
Peak
-hou
r fac
tor, P
HF1.0
01.0
01.0
01.0
01.0
01.0
01.0
01.0
01.0
01.0
01.0
01.0
0Ad
j. Flow
(vph
)5
1035
726
3883
665
9811
206
272
155
RTOR
Red
uctio
n (vp
h)0
740
03
00
109
00
50
Lane
Gro
up F
low (v
ph)
516
870
3889
80
9810
80
272
150
Confl
. Ped
s. (#
/hr)
11
Confl
. Bike
s (#/h
r)1
52
Heav
y Veh
icles
(%)
2%16
%2%
2%15
%2%
2%2%
2%2%
2%2%
Turn
Typ
ePr
otNA
Prot
NAPr
otNA
Prot
NAPr
otecte
d Pha
ses
52
16
38
74
Perm
itted P
hase
sAc
tuated
Gre
en, G
(s)
5.076
.53.2
74.7
30.4
12.5
21.0
3.1Ef
fectiv
e Gre
en, g
(s)
5.076
.53.2
74.7
30.4
12.5
21.0
3.1Ac
tuated
g/C
Ratio
0.04
0.59
0.02
0.58
0.23
0.10
0.16
0.02
Clea
ranc
e Tim
e (s)
3.05.5
3.05.5
3.04.8
3.04.8
Vehic
le Ex
tensio
n (s)
2.03.0
2.03.0
3.02.0
2.02.0
Lane
Grp
Cap
(vph
)68
1814
4318
0441
528
628
780
v/s R
atio P
rot
0.00
c0.55
c0.02
0.29
0.06
c0.04
c0.15
0.00
v/s R
atio P
erm
v/c R
atio
0.07
0.93
0.88
0.50
0.24
0.89d
r0.9
50.1
9Un
iform
Dela
y, d1
60.0
24.1
63.0
16.3
40.1
54.8
53.7
62.0
Prog
ress
ion F
actor
1.00
1.00
1.00
1.00
1.00
1.00
1.00
1.00
Incre
menta
l Dela
y, d2
0.29.1
91.0
0.20.3
0.338
.50.4
Delay
(s)
60.2
33.2
154.0
16.5
40.4
55.2
92.2
62.4
Leve
l of S
ervic
eE
CF
BD
EF
EAp
proa
ch D
elay (
s)33
.322
.050
.690
.1Ap
proa
ch LO
SC
CD
F
Inter
secti
on S
umma
ryHC
M 20
00 C
ontro
l Dela
y36
.7HC
M 20
00 Le
vel o
f Ser
vice
DHC
M 20
00 V
olume
to C
apac
ity ra
tio0.8
7Ac
tuated
Cyc
le Le
ngth
(s)
129.5
Sum
of los
t time
(s)
16.3
Inter
secti
on C
apac
ity U
tiliza
tion
85.9%
ICU
Leve
l of S
ervic
eE
Analy
sis P
eriod
(min)
15dr
De
facto
Righ
t Lan
e. R
ecod
e with
1 tho
ugh l
ane a
s a rig
ht lan
e.c
Criti
cal L
ane G
roup
HC
M S
igna
lized
Inte
rsec
tion
Cap
acity
Ana
lysi
s8:
McD
owel
l Bl &
Lak
evill
e H
wy
10/17
/2014
Sync
hro 8
Rep
ort
Altur
a Ap
artm
ents
Traff
ic Im
pact
Stud
y Fu
ture P
M Pe
ak H
our -
No P
rojec
tW
-Tra
ns
Move
ment
EBL
EBT
EBR
WBL
WBT
WBR
NBL
NBT
NBR
SBL
SBT
SBR
Lane
Con
figur
ation
sVo
lume (
vph)
1490
412
315
994
226
536
371
1167
9015
Ideal
Flow
(vphp
l)19
0019
0019
0019
0019
0019
0019
0019
0019
0019
0019
0019
00To
tal Lo
st tim
e (s)
3.05.5
3.05.5
3.04.8
3.04.8
Lane
Util.
Fac
tor1.0
00.9
51.0
00.9
51.0
00.9
51.0
00.9
5Fr
pb, p
ed/bi
kes
1.00
1.00
1.00
1.00
1.00
1.00
1.00
1.00
Flpb,
ped/b
ikes
1.00
1.00
1.00
1.00
1.00
1.00
1.00
1.00
Frt
1.00
0.98
1.00
0.97
1.00
1.00
1.00
0.98
Flt P
rotec
ted0.9
51.0
00.9
51.0
00.9
51.0
00.9
51.0
0Sa
td. F
low (p
rot)
1770
3327
1770
3249
1770
3520
1770
3454
Flt P
ermi
tted
0.95
1.00
0.95
1.00
0.95
1.00
0.95
1.00
Satd.
Flow
(per
m)17
7033
2717
7032
4917
7035
2017
7034
54Pe
ak-h
our f
actor
, PHF
1.00
1.00
1.00
1.00
1.00
1.00
1.00
1.00
1.00
1.00
1.00
1.00
Adj. F
low (v
ph)
1490
412
315
994
226
536
371
1167
9015
RTOR
Red
uctio
n (vp
h)0
70
013
00
20
011
0La
ne G
roup
Flow
(vph
)14
1020
015
1207
053
638
00
6794
0Co
nfl. P
eds.
(#/hr
)3
11
316
16Co
nfl. B
ikes (
#/hr)
15
2He
avy V
ehicl
es (%
)2%
7%2%
2%9%
2%2%
2%2%
2%2%
2%Tu
rn T
ype
Prot
NAPr
otNA
Prot
NAPr
otNA
Prote
cted P
hase
s5
21
63
87
4Pe
rmitte
d Pha
ses
Actua
ted G
reen
, G (s
)1.5
50.8
1.550
.841
.742
.87.4
8.5Ef
fectiv
e Gre
en, g
(s)
1.550
.81.5
50.8
41.7
42.8
7.48.5
Actua
ted g/
C Ra
tio0.0
10.4
30.0
10.4
30.3
50.3
60.0
60.0
7Cl
eara
nce T
ime (
s)3.0
5.53.0
5.53.0
4.83.0
4.8Ve
hicle
Exten
sion (
s)2.0
3.02.0
3.03.0
2.02.0
2.0La
ne G
rp C
ap (v
ph)
2214
2222
1389
621
1268
110
247
v/s R
atio P
rot
c0.01
0.31
0.01
c0.37
c0.30
c0.11
c0.04
0.03
v/s R
atio P
erm
v/c R
atio
0.64
0.72
0.68
0.87
0.86
0.30
0.61
0.38
Unifo
rm D
elay,
d158
.428
.158
.431
.035
.927
.354
.352
.6Pr
ogre
ssion
Fac
tor1.0
01.0
01.0
01.0
01.0
01.0
01.0
01.0
0Inc
reme
ntal D
elay,
d236
.71.8
52.0
6.111
.90.0
6.40.4
Delay
(s)
95.1
29.8
110.4
37.0
47.8
27.3
60.7
53.0
Leve
l of S
ervic
eF
CF
DD
CE
DAp
proa
ch D
elay (
s)30
.737
.939
.356
.0Ap
proa
ch LO
SC
DD
E
Inter
secti
on S
umma
ryHC
M 20
00 C
ontro
l Dela
y37
.0HC
M 20
00 Le
vel o
f Ser
vice
DHC
M 20
00 V
olume
to C
apac
ity ra
tio0.8
4Ac
tuated
Cyc
le Le
ngth
(s)
118.8
Sum
of los
t time
(s)
16.3
Inter
secti
on C
apac
ity U
tiliza
tion
83.0%
ICU
Leve
l of S
ervic
eE
Analy
sis P
eriod
(min)
15c
Criti
cal L
ane G
roup
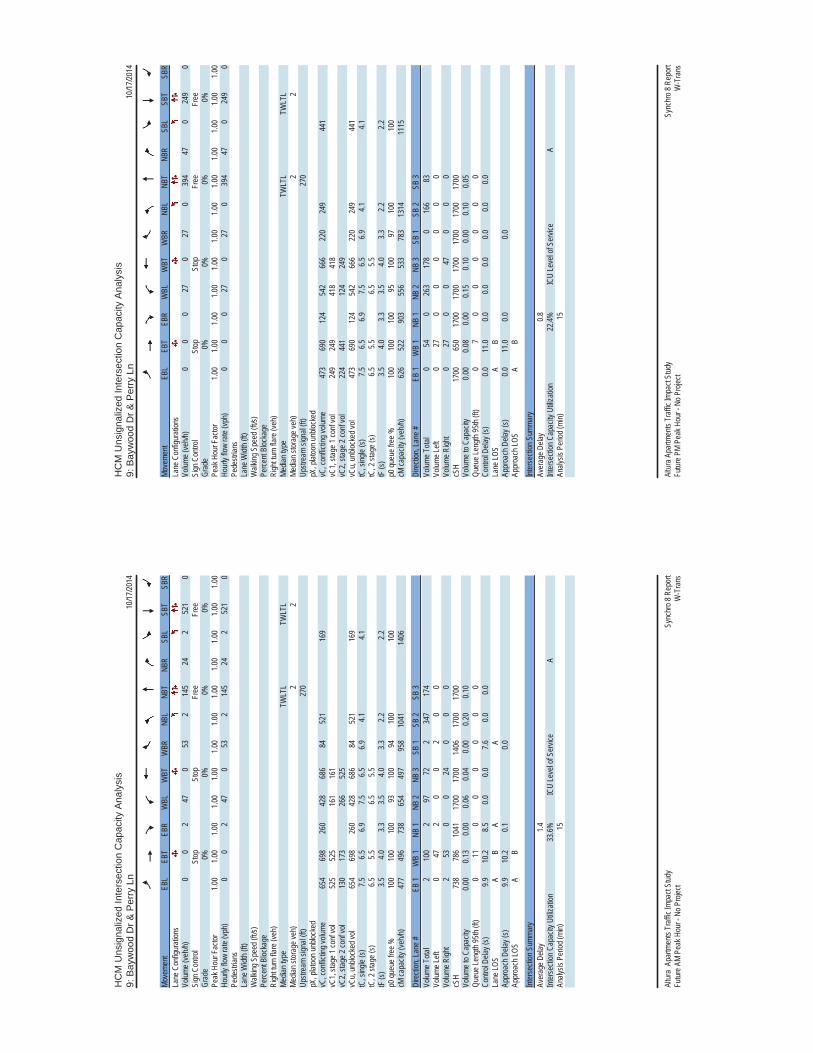
HC
M U
nsig
naliz
ed In
ters
ectio
n C
apac
ity A
naly
sis
9: B
ayw
ood
Dr &
Per
ry L
n10
/17/20
14
Sync
hro 8
Rep
ort
Altur
a Ap
artm
ents
Traff
ic Im
pact
Stud
y Fu
ture A
M Pe
ak H
our -
No P
rojec
tW
-Tra
ns
Move
ment
EBL
EBT
EBR
WBL
WBT
WBR
NBL
NBT
NBR
SBL
SBT
SBR
Lane
Con
figur
ation
sVo
lume (
veh/h
)0
02
470
532
145
242
521
0Si
gn C
ontro
lSt
opSt
opFr
eeFr
eeGr
ade
0%0%
0%0%
Peak
Hou
r Fac
tor1.0
01.0
01.0
01.0
01.0
01.0
01.0
01.0
01.0
01.0
01.0
01.0
0Ho
urly
flow
rate
(vph)
00
247
053
214
524
252
10
Pede
strian
sLa
ne W
idth (
ft)W
alking
Spe
ed (f
t/s)
Perce
nt Bl
ocka
geRi
ght tu
rn fla
re (v
eh)
Media
n typ
eTW
LTL
TWLT
LMe
dian s
torag
e veh
)2
2Up
strea
m sig
nal (f
t)27
0pX
, plat
oon u
nbloc
ked
vC, c
onflic
ting v
olume
654
698
260
428
686
8452
116
9vC
1, sta
ge 1
conf
vol
525
525
161
161
vC2,
stage
2 co
nf vo
l13
017
326
652
5vC
u, un
block
ed vo
l65
469
826
042
868
684
521
169
tC, s
ingle
(s)7.5
6.56.9
7.56.5
6.94.1
4.1tC
, 2 st
age (
s)6.5
5.56.5
5.5tF
(s)
3.54.0
3.33.5
4.03.3
2.22.2
p0 qu
eue f
ree %
100
100
100
9310
094
100
100
cM ca
pacit
y (ve
h/h)
477
496
738
654
497
958
1041
1406
Dire
ction
, Lan
e #EB
1W
B 1
NB 1
NB 2
NB 3
SB 1
SB 2
SB 3
Volum
e Tota
l2
100
297
722
347
174
Volum
e Left
047
20
02
00
Volum
e Righ
t2
530
024
00
0cS
H73
878
610
4117
0017
0014
0617
0017
00Vo
lume t
o Cap
acity
0.00
0.13
0.00
0.06
0.04
0.00
0.20
0.10
Queu
e Len
gth 95
th (ft
)0
110
00
00
0Co
ntrol
Delay
(s)
9.910
.28.5
0.00.0
7.60.0
0.0La
ne LO
SA
BA
AAp
proa
ch D
elay (
s)9.9
10.2
0.10.0
Appr
oach
LOS
AB
Inter
secti
on S
umma
ryAv
erag
e Dela
y 1.4
Inter
secti
on C
apac
ity U
tiliza
tion
33.6%
ICU
Leve
l of S
ervic
e A
Analy
sis P
eriod
(min)
15
HC
M U
nsig
naliz
ed In
ters
ectio
n C
apac
ity A
naly
sis
9: B
ayw
ood
Dr &
Per
ry L
n10
/17/20
14
Sync
hro 8
Rep
ort
Altur
a Apa
rtmen
ts Tr
affic
Impa
ct St
udy
Futur
e PM
Peak
Hou
r - N
o Pro
ject
W-T
rans
Move
ment
EBL
EBT
EBR
WBL
WBT
WBR
NBL
NBT
NBR
SBL
SBT
SBR
Lane
Con
figur
ation
sVo
lume (
veh/h
)0
00
270
270
394
470
249
0Si
gn C
ontro
lSt
opSt
opFr
eeFr
eeGr
ade
0%0%
0%0%
Peak
Hou
r Fac
tor1.0
01.0
01.0
01.0
01.0
01.0
01.0
01.0
01.0
01.0
01.0
01.0
0Ho
urly
flow
rate
(vph)
00
027
027
039
447
024
90
Pede
strian
sLa
ne W
idth (
ft)W
alking
Spe
ed (f
t/s)
Perce
nt Bl
ocka
geRi
ght tu
rn fla
re (v
eh)
Media
n typ
eTW
LTL
TWLT
LMe
dian s
torag
e veh
)2
2Up
strea
m sig
nal (f
t)27
0pX
, plat
oon u
nbloc
ked
vC, c
onflic
ting v
olume
473
690
124
542
666
220
249
441
vC1,
stage
1 co
nf vo
l24
924
941
841
8vC
2, sta
ge 2
conf
vol
224
441
124
249
vCu,
unblo
cked
vol
473
690
124
542
666
220
249
441
tC, s
ingle
(s)7.5
6.56.9
7.56.5
6.94.1
4.1tC
, 2 st
age (
s)6.5
5.56.5
5.5tF
(s)
3.54.0
3.33.5
4.03.3
2.22.2
p0 qu
eue f
ree %
100
100
100
9510
097
100
100
cM ca
pacit
y (ve
h/h)
626
522
903
556
533
783
1314
1115
Dire
ction
, Lan
e #EB
1W
B 1
NB 1
NB 2
NB 3
SB 1
SB 2
SB 3
Volum
e Tota
l0
540
263
178
016
683
Volum
e Left
027
00
00
00
Volum
e Righ
t0
270
047
00
0cS
H17
0065
017
0017
0017
0017
0017
0017
00Vo
lume t
o Cap
acity
0.00
0.08
0.00
0.15
0.10
0.00
0.10
0.05
Queu
e Len
gth 95
th (ft
)0
70
00
00
0Co
ntrol
Delay
(s)
0.011
.00.0
0.00.0
0.00.0
0.0La
ne LO
SA
BAp
proa
ch D
elay (
s)0.0
11.0
0.00.0
Appr
oach
LOS
AB
Inter
secti
on S
umma
ryAv
erag
e Dela
y 0.8
Inter
secti
on C
apac
ity U
tiliza
tion
22.4%
ICU
Leve
l of S
ervic
e A
Analy
sis P
eriod
(min)
15
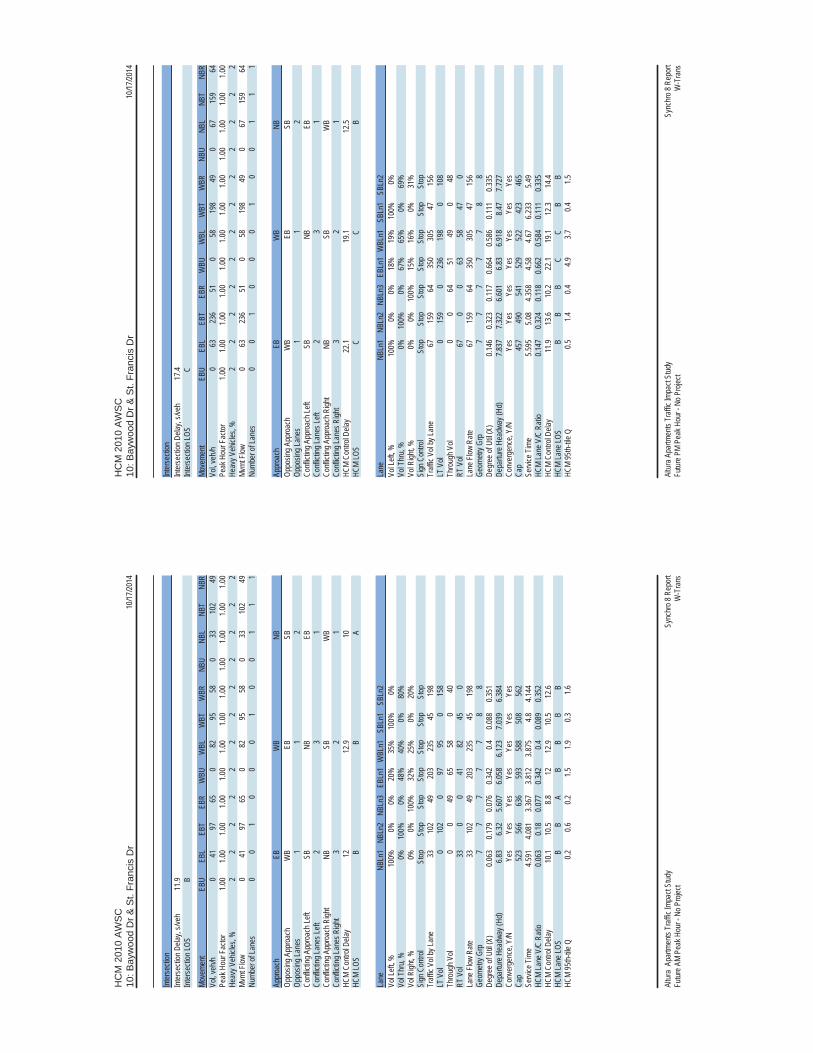
HC
M 2
010
AW
SC
10: B
ayw
ood
Dr &
St.
Fran
cis
Dr
10/17
/2014
Sync
hro 8
Rep
ort
Altur
a Ap
artm
ents
Traff
ic Im
pact
Stud
y Fu
ture A
M Pe
ak H
our -
No P
rojec
tW
-Tra
ns
Inter
secti
onInt
erse
ction
Dela
y, s/v
eh11
.9Int
erse
ction
LOS
B
Move
ment
EBU
EBL
EBT
EBR
WBU
WBL
WBT
WBR
NBU
NBL
NBT
NBR
Vol, v
eh/h
041
9765
082
9558
033
102
49Pe
ak H
our F
actor
1.00
1.00
1.00
1.00
1.00
1.00
1.00
1.00
1.00
1.00
1.00
1.00
Heav
y Veh
icles
, %2
22
22
22
22
22
2Mv
mt F
low0
4197
650
8295
580
3310
249
Numb
er of
Lane
s0
01
00
01
00
11
1
Appr
oach
EBW
BNB
Oppo
sing A
ppro
ach
WB
EBSB
Oppo
sing L
anes
11
2Co
nflict
ing A
ppro
ach L
eftSB
NBEB
Confl
icting
Lane
s Left
23
1Co
nflict
ing A
ppro
ach R
ight
NBSB
WB
Confl
icting
Lane
s Righ
t3
21
HCM
Contr
ol De
lay12
12.9
10HC
M LO
SB
BA
Lane
NBLn
1NB
Ln2
NBLn
3EB
Ln1
WBL
n1SB
Ln1
SBLn
2Vo
l Left
, %10
0%0%
0%20
%35
%10
0%0%
Vol T
hru,
%0%
100%
0%48
%40
%0%
80%
Vol R
ight, %
0%0%
100%
32%
25%
0%20
%Si
gn C
ontro
lSt
opSt
opSt
opSt
opSt
opSt
opSt
opTr
affic
Vol b
y Lan
e33
102
4920
323
545
198
LT V
ol0
102
097
950
158
Thro
ugh V
ol0
049
6558
040
RT V
ol33
00
4182
450
Lane
Flow
Rate
3310
249
203
235
4519
8Ge
ometr
y Grp
77
77
78
8De
gree
of U
til (X
)0.0
630.1
790.0
760.3
420.4
0.088
0.351
Depa
rture
Hea
dway
(Hd)
6.83
6.32
5.607
6.058
6.123
7.039
6.384
Conv
erge
nce,
Y/N
Yes
Yes
Yes
Yes
Yes
Yes
Yes
Cap
523
566
636
593
588
508
562
Servi
ce T
ime
4.591
4.081
3.367
3.812
3.875
4.84.1
44HC
M La
ne V
/C R
atio
0.063
0.18
0.077
0.342
0.40.0
890.3
52HC
M Co
ntrol
Delay
10.1
10.5
8.812
12.9
10.5
12.6
HCM
Lane
LOS
BB
AB
BB
BHC
M 95
th-tile
Q0.2
0.60.2
1.51.9
0.31.6
HC
M 2
010
AW
SC
10: B
ayw
ood
Dr &
St.
Fran
cis
Dr
10/17
/2014
Sync
hro 8
Rep
ort
Altur
a Apa
rtmen
ts Tr
affic
Impa
ct St
udy
Futur
e PM
Peak
Hou
r - N
o Pro
ject
W-T
rans
Inter
secti
onInt
erse
ction
Dela
y, s/v
eh17
.4Int
erse
ction
LOS
C
Move
ment
EBU
EBL
EBT
EBR
WBU
WBL
WBT
WBR
NBU
NBL
NBT
NBR
Vol, v
eh/h
063
236
510
5819
849
067
159
64Pe
ak H
our F
actor
1.00
1.00
1.00
1.00
1.00
1.00
1.00
1.00
1.00
1.00
1.00
1.00
Heav
y Veh
icles
, %2
22
22
22
22
22
2Mv
mt F
low0
6323
651
058
198
490
6715
964
Numb
er of
Lane
s0
01
00
01
00
11
1
Appr
oach
EBW
BNB
Oppo
sing A
ppro
ach
WB
EBSB
Oppo
sing L
anes
11
2Co
nflict
ing A
ppro
ach L
eftSB
NBEB
Confl
icting
Lane
s Left
23
1Co
nflict
ing A
ppro
ach R
ight
NBSB
WB
Confl
icting
Lane
s Righ
t3
21
HCM
Contr
ol De
lay22
.119
.112
.5HC
M LO
SC
CB
Lane
NBLn
1NB
Ln2
NBLn
3EB
Ln1
WBL
n1SB
Ln1
SBLn
2Vo
l Left
, %10
0%0%
0%18
%19
%10
0%0%
Vol T
hru,
%0%
100%
0%67
%65
%0%
69%
Vol R
ight, %
0%0%
100%
15%
16%
0%31
%Si
gn C
ontro
lSt
opSt
opSt
opSt
opSt
opSt
opSt
opTr
affic
Vol b
y Lan
e67
159
6435
030
547
156
LT V
ol0
159
023
619
80
108
Thro
ugh V
ol0
064
5149
048
RT V
ol67
00
6358
470
Lane
Flow
Rate
6715
964
350
305
4715
6Ge
ometr
y Grp
77
77
78
8De
gree
of U
til (X
)0.1
460.3
230.1
170.6
640.5
860.1
110.3
35De
partu
re H
eadw
ay (H
d)7.8
377.3
226.6
016.8
36.9
188.4
77.7
27Co
nver
genc
e, Y/
NYe
sYe
sYe
sYe
sYe
sYe
sYe
sCa
p45
749
054
152
952
242
346
5Se
rvice
Tim
e5.5
955.0
84.3
584.5
84.6
76.2
335.4
9HC
M La
ne V
/C R
atio
0.147
0.324
0.118
0.662
0.584
0.111
0.335
HCM
Contr
ol De
lay11
.913
.610
.222
.119
.112
.314
.4HC
M La
ne LO
SB
BB
CC
BB
HCM
95th-
tile Q
0.51.4
0.44.9
3.70.4
1.5

HC
M 2
010
AW
SC
10: B
ayw
ood
Dr &
St.
Fran
cis
Dr
10/17
/2014
Sync
hro 8
Rep
ort
Altur
a Ap
artm
ents
Traff
ic Im
pact
Stud
y Fu
ture A
M Pe
ak H
our -
No P
rojec
tW
-Tra
ns
Inter
secti
onInt
erse
ction
Dela
y, s/v
ehInt
erse
ction
LOS
Move
ment
SBU
SBL
SBT
SBR
Vol, v
eh/h
045
158
40Pe
ak H
our F
actor
1.00
1.00
1.00
1.00
Heav
y Veh
icles
, %2
22
2Mv
mt F
low0
4515
840
Numb
er of
Lane
s0
11
0
Appr
oach
SBOp
posin
g App
roac
hNB
Oppo
sing L
anes
3Co
nflict
ing A
ppro
ach L
eftW
BCo
nflict
ing La
nes L
eft1
Confl
icting
App
roac
h Righ
tEB
Confl
icting
Lane
s Righ
t1
HCM
Contr
ol De
lay12
.2HC
M LO
SB
Lane
HC
M 2
010
AW
SC
10: B
ayw
ood
Dr &
St.
Fran
cis
Dr
10/17
/2014
Sync
hro 8
Rep
ort
Altur
a Apa
rtmen
ts Tr
affic
Impa
ct St
udy
Futur
e PM
Peak
Hou
r - N
o Pro
ject
W-T
rans
Inter
secti
onInt
erse
ction
Dela
y, s/v
ehInt
erse
ction
LOS
Move
ment
SBU
SBL
SBT
SBR
Vol, v
eh/h
047
108
48Pe
ak H
our F
actor
1.00
1.00
1.00
1.00
Heav
y Veh
icles
, %2
22
2Mv
mt F
low0
4710
848
Numb
er of
Lane
s0
11
0
Appr
oach
SBOp
posin
g App
roac
hNB
Oppo
sing L
anes
3Co
nflict
ing A
ppro
ach L
eftW
BCo
nflict
ing La
nes L
eft1
Confl
icting
App
roac
h Righ
tEB
Confl
icting
Lane
s Righ
t1
HCM
Contr
ol De
lay13
.9HC
M LO
SB
Lane
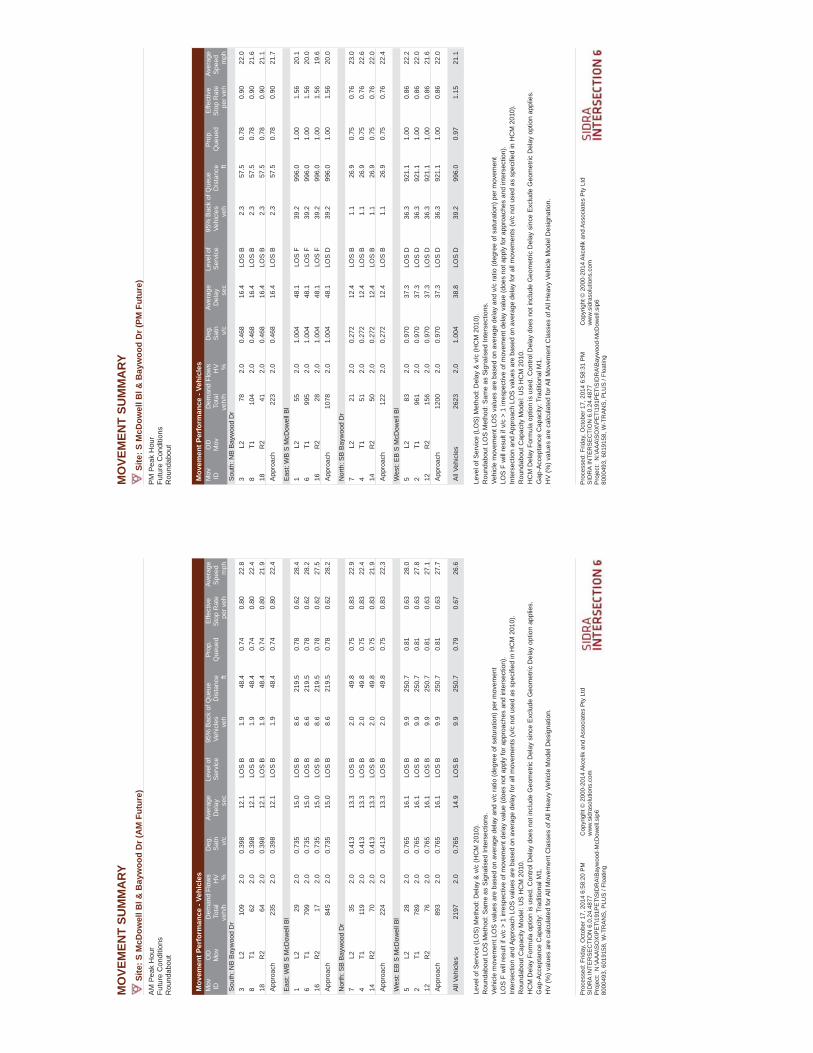
MO
VEM
ENT
SUM
MA
RYSi
te:S
McD
owel
l Bl &
Bay
woo
d D
r (A
M F
utur
e)A
M P
eak
Hou
rFu
ture
Con
ditio
nsR
ound
abou
t
Mov
emen
t Per
form
ance
-Ve
hicl
esD
eman
d Fl
ows
95%
Bac
k of
Que
ueM
ov IDO
DM
ovD
eg.
Satn
Aver
age
Del
ay
Leve
l of
Serv
ice
Prop
. Q
ueue
dEf
fect
ive
Stop
Rat
eAv
erag
eSp
eed
To
tal
HV
Vehi
cles
Dis
tanc
eve
h/h
%v/
cse
cve
hft
per v
ehm
phSo
uth:
NB
Bay
woo
d D
r3
L210
92.
00.
398
12.1
LOS
B1.
948
.40.
740.
8022
.88
T162
2.0
0.39
812
.1LO
S B
1.9
48.4
0.74
0.80
22.4
18R
264
2.0
0.39
812
.1LO
S B
1.9
48.4
0.74
0.80
21.9
Appr
oach
235
2.0
0.39
812
.1LO
S B
1.9
48.4
0.74
0.80
22.4
East
: WB
S M
cDow
ell B
l1
L229
2.0
0.73
515
.0LO
S B
8.6
219.
50.
780.
6228
.46
T179
92.
00.
735
15.0
LOS
B8.
621
9.5
0.78
0.62
28.2
16R
217
2.0
0.73
515
.0LO
S B
8.6
219.
50.
780.
6227
.5Ap
proa
ch84
52.
00.
735
15.0
LOS
B8.
621
9.5
0.78
0.62
28.2
Nor
th: S
B B
ayw
ood
Dr
7L2
352.
00.
413
13.3
LOS
B2.
049
.80.
750.
8322
.94
T111
92.
00.
413
13.3
LOS
B2.
049
.80.
750.
8322
.414
R2
702.
00.
413
13.3
LOS
B2.
049
.80.
750.
8321
.9Ap
proa
ch22
42.
00.
413
13.3
LOS
B2.
049
.80.
750.
8322
.3
Wes
t: E
B S
McD
owel
l Bl
5L2
282.
00.
765
16.1
LOS
B9.
925
0.7
0.81
0.63
28.0
2T1
789
2.0
0.76
516
.1LO
S B
9.9
250.
70.
810.
6327
.812
R2
762.
00.
765
16.1
LOS
B9.
925
0.7
0.81
0.63
27.1
Appr
oach
893
2.0
0.76
516
.1LO
S B
9.9
250.
70.
810.
6327
.7
All V
ehic
les
2197
2.0
0.76
514
.9LO
S B
9.9
250.
70.
790.
6726
.6
Leve
l of S
ervi
ce (L
OS)
Met
hod:
Del
ay &
v/c
(HC
M 2
010)
. R
ound
abou
t LO
S M
etho
d: S
ame
as S
igna
lised
Inte
rsec
tions
.Ve
hicl
e m
ovem
ent L
OS
val
ues
are
base
d on
ave
rage
del
ay a
nd v
/c ra
tio (d
egre
e of
sat
urat
ion)
per
mov
emen
tLO
S F
will
resu
lt if
v/c
> 1
irres
pect
ive
of m
ovem
ent d
elay
val
ue (d
oes
not a
pply
for a
ppro
ache
s an
d in
ters
ectio
n).
Inte
rsec
tion
and
Appr
oach
LO
S va
lues
are
bas
ed o
n av
erag
e de
lay
for a
ll m
ovem
ents
(v/c
not
use
d as
spe
cifie
d in
HC
M 2
010)
.R
ound
abou
t Cap
acity
Mod
el: U
S H
CM
201
0.H
CM
Del
ay F
orm
ula
optio
n is
use
d. C
ontro
l Del
ay d
oes
not i
nclu
de G
eom
etric
Del
ay s
ince
Exc
lude
Geo
met
ric D
elay
opt
ion
appl
ies.
Gap
-Acc
epta
nce
Cap
acity
: Tra
ditio
nal M
1.H
V (%
) val
ues
are
calc
ulat
ed fo
r All
Mov
emen
t Cla
sses
of A
ll H
eavy
Veh
icle
Mod
el D
esig
natio
n.
Pro
cess
ed: F
riday
, Oct
ober
17,
201
4 6:
58:2
0 PM
SID
RA
INTE
RSE
CTI
ON
6.0
.24.
4877
Cop
yrig
ht ©
200
0-20
14 A
kcel
ik a
nd A
ssoc
iate
s Pt
y Lt
dw
ww
.sid
raso
lutio
ns.c
omP
roje
ct:
N:\A
AA\S
OX\
PET\
191P
ET\S
IDR
A\Ba
ywoo
d-M
cDow
ell.s
ip6
8000
493,
601
9158
, W-T
RAN
S, P
LUS
/ Fl
oatin
g
MO
VEM
ENT
SUM
MA
RYSi
te:S
McD
owel
l Bl &
Bay
woo
d D
r (PM
Fut
ure)
PM
Pea
k H
our
Futu
re C
ondi
tions
Rou
ndab
out
Mov
emen
t Per
form
ance
-Ve
hicl
esD
eman
d Fl
ows
95%
Bac
k of
Que
ueM
ov IDO
DM
ovD
eg.
Satn
Aver
age
Del
ay
Leve
l of
Serv
ice
Prop
. Q
ueue
dEf
fect
ive
Stop
Rat
eAv
erag
eSp
eed
To
tal
HV
Vehi
cles
Dis
tanc
eve
h/h
%v/
cse
cve
hft
per v
ehm
phSo
uth:
NB
Bay
woo
d D
r3
L278
2.0
0.46
816
.4LO
S B
2.3
57.5
0.78
0.90
22.0
8T1
104
2.0
0.46
816
.4LO
S B
2.3
57.5
0.78
0.90
21.6
18R
241
2.0
0.46
816
.4LO
S B
2.3
57.5
0.78
0.90
21.1
Appr
oach
223
2.0
0.46
816
.4LO
S B
2.3
57.5
0.78
0.90
21.7
East
: WB
S M
cDow
ell B
l1
L255
2.0
1.00
448
.1LO
S F
39.2
996.
01.
001.
5620
.16
T199
52.
01.
004
48.1
LOS
F39
.299
6.0
1.00
1.56
20.0
16R
228
2.0
1.00
448
.1LO
S F
39.2
996.
01.
001.
5619
.6Ap
proa
ch10
782.
01.
004
48.1
LOS
D39
.299
6.0
1.00
1.56
20.0
Nor
th: S
B B
ayw
ood
Dr
7L2
212.
00.
272
12.4
LOS
B1.
126
.90.
750.
7623
.04
T151
2.0
0.27
212
.4LO
S B
1.1
26.9
0.75
0.76
22.6
14R
250
2.0
0.27
212
.4LO
S B
1.1
26.9
0.75
0.76
22.0
Appr
oach
122
2.0
0.27
212
.4LO
S B
1.1
26.9
0.75
0.76
22.4
Wes
t: E
B S
McD
owel
l Bl
5L2
832.
00.
970
37.3
LOS
D36
.392
1.1
1.00
0.86
22.2
2T1
961
2.0
0.97
037
.3LO
S D
36.3
921.
11.
000.
8622
.012
R2
156
2.0
0.97
037
.3LO
S D
36.3
921.
11.
000.
8621
.6Ap
proa
ch12
002.
00.
970
37.3
LOS
D36
.392
1.1
1.00
0.86
22.0
All V
ehic
les
2623
2.0
1.00
438
.8LO
S D
39.2
996.
00.
971.
1521
.1
Leve
l of S
ervi
ce (L
OS)
Met
hod:
Del
ay &
v/c
(HC
M 2
010)
. R
ound
abou
t LO
S M
etho
d: S
ame
as S
igna
lised
Inte
rsec
tions
.Ve
hicl
e m
ovem
ent L
OS
val
ues
are
base
d on
ave
rage
del
ay a
nd v
/c ra
tio (d
egre
e of
sat
urat
ion)
per
mov
emen
tLO
S F
will
resu
lt if
v/c
> 1
irres
pect
ive
of m
ovem
ent d
elay
val
ue (d
oes
not a
pply
for a
ppro
ache
s an
d in
ters
ectio
n).
Inte
rsec
tion
and
Appr
oach
LO
S va
lues
are
bas
ed o
n av
erag
e de
lay
for a
ll m
ovem
ents
(v/c
not
use
d as
spe
cifie
d in
HC
M 2
010)
.R
ound
abou
t Cap
acity
Mod
el: U
S H
CM
201
0.H
CM
Del
ay F
orm
ula
optio
n is
use
d. C
ontro
l Del
ay d
oes
not i
nclu
de G
eom
etric
Del
ay s
ince
Exc
lude
Geo
met
ric D
elay
opt
ion
appl
ies.
Gap
-Acc
epta
nce
Cap
acity
: Tra
ditio
nal M
1.H
V (%
) val
ues
are
calc
ulat
ed fo
r All
Mov
emen
t Cla
sses
of A
ll H
eavy
Veh
icle
Mod
el D
esig
natio
n.
Pro
cess
ed: F
riday
, Oct
ober
17,
201
4 6:
58:3
1 PM
SID
RA
INTE
RSE
CTI
ON
6.0
.24.
4877
Cop
yrig
ht ©
200
0-20
14 A
kcel
ik a
nd A
ssoc
iate
s Pt
y Lt
dw
ww
.sid
raso
lutio
ns.c
omP
roje
ct:
N:\A
AA\S
OX\
PET\
191P
ET\S
IDR
A\Ba
ywoo
d-M
cDow
ell.s
ip6
8000
493,
601
9158
, W-T
RAN
S, P
LUS
/ Fl
oatin
g

HC
M S
igna
lized
Inte
rsec
tion
Cap
acity
Ana
lysi
s1:
Was
hing
ton
St &
Lak
evill
e S
t5/2
2/201
5
Sync
hro 8
Rep
ort
Altur
a Apa
rtmen
ts Tr
affic
Impa
ct St
udy
Exist
ing A
M Pe
ak H
our p
lus P
rojec
tW
-Tra
ns
Move
ment
EBL
EBT
EBR
WBL
WBT
WBR
NBL
NBT
NBR
SBL
SBT
SBR
Lane
Con
figur
ation
sVo
lume (
vph)
2814
623
227
115
7921
567
180
109
635
40Ide
al Flo
w (vp
hpl)
1900
1900
1900
1900
1900
1900
1900
1900
1900
1900
1900
1900
Total
Lost
time (
s)4.2
4.24.2
4.04.2
4.04.2
Lane
Util.
Fac
tor1.0
01.0
01.0
01.0
00.9
51.0
00.9
5Fr
pb, p
ed/bi
kes
1.00
1.00
0.99
1.00
0.98
1.00
1.00
Flpb,
ped/b
ikes
1.00
1.00
1.00
1.00
1.00
1.00
1.00
Frt
0.98
1.00
0.94
1.00
0.96
1.00
0.99
Flt P
rotec
ted0.9
90.9
51.0
00.9
51.0
00.9
51.0
0Sa
td. F
low (p
rot)
1715
1770
1640
1770
3348
1770
3499
Flt P
ermi
tted
0.99
0.95
1.00
0.95
1.00
0.95
1.00
Satd.
Flow
(per
m)17
1517
7016
4017
7033
4817
7034
99Pe
ak-h
our f
actor
, PHF
0.91
0.91
0.91
0.91
0.91
0.91
0.91
0.91
0.91
0.91
0.91
0.91
Adj. F
low (v
ph)
3116
025
249
126
8723
623
198
120
698
44RT
OR R
educ
tion (
vph)
00
00
180
021
00
30
Lane
Gro
up F
low (v
ph)
021
60
249
195
023
800
012
073
90
Confl
. Ped
s. (#
/hr)
67
76
418
184
Confl
. Bike
s (#/h
r)8
1320
12He
avy V
ehicl
es (%
)2%
10%
2%2%
11%
2%2%
2%2%
2%2%
2%Tu
rn T
ype
Split
NASp
litNA
Prot
NAPr
otNA
Prote
cted P
hase
s7
78
85
21
6Pe
rmitte
d Pha
ses
Actua
ted G
reen
, G (s
)18
.921
.521
.53.7
38.6
11.9
46.8
Effec
tive G
reen
, g (s
)18
.921
.521
.53.7
38.6
11.9
46.8
Actua
ted g/
C Ra
tio0.1
80.2
00.2
00.0
30.3
60.1
10.4
4Cl
eara
nce T
ime (
s)4.2
4.24.2
4.04.2
4.04.2
Vehic
le Ex
tensio
n (s)
2.52.5
2.52.0
4.02.0
4.0La
ne G
rp C
ap (v
ph)
301
354
328
6012
0219
515
23v/s
Rati
o Pro
tc0
.13c0
.140.1
20.0
1c0
.24c0
.070.2
1v/s
Rati
o Per
mv/c
Rati
o0.7
20.7
00.5
90.3
80.6
70.6
20.4
9Un
iform
Dela
y, d1
41.8
40.0
39.0
50.8
29.0
45.6
21.7
Prog
ress
ion F
actor
1.00
1.00
1.00
1.00
1.00
1.00
1.00
Incre
menta
l Dela
y, d2
7.45.8
2.41.5
1.54.0
0.3De
lay (s
)49
.245
.841
.452
.330
.649
.622
.1Le
vel o
f Ser
vice
DD
DD
CD
CAp
proa
ch D
elay (
s)49
.243
.831
.225
.9Ap
proa
ch LO
SD
DC
C
Inter
secti
on S
umma
ryHC
M 20
00 C
ontro
l Dela
y33
.3HC
M 20
00 Le
vel o
f Ser
vice
CHC
M 20
00 V
olume
to C
apac
ity ra
tio0.6
8Ac
tuated
Cyc
le Le
ngth
(s)
107.5
Sum
of los
t time
(s)
16.6
Inter
secti
on C
apac
ity U
tiliza
tion
69.9%
ICU
Leve
l of S
ervic
eC
Analy
sis P
eriod
(min)
15c
Criti
cal L
ane G
roup
HC
M S
igna
lized
Inte
rsec
tion
Cap
acity
Ana
lysi
s1:
Was
hing
ton
St &
Lak
evill
e S
t5/2
2/201
5
Sync
hro 8
Rep
ort
Altur
a Ap
artm
ents
Traff
ic Im
pact
Stud
y Ex
isting
PM
Peak
Hou
r plus
Pro
ject
W-T
rans
Move
ment
EBL
EBT
EBR
WBL
WBT
WBR
NBL
NBT
NBR
SBL
SBT
SBR
Lane
Con
figur
ation
sVo
lume (
vph)
4698
3726
317
212
253
782
202
104
792
45Ide
al Flo
w (vp
hpl)
1900
1900
1900
1900
1900
1900
1900
1900
1900
1900
1900
1900
Total
Lost
time (
s)4.2
4.24.2
4.04.2
4.04.2
Lane
Util.
Fac
tor1.0
01.0
01.0
01.0
00.9
51.0
00.9
5Fr
pb, p
ed/bi
kes
0.99
1.00
0.98
1.00
0.98
1.00
1.00
Flpb,
ped/b
ikes
1.00
1.00
1.00
1.00
1.00
1.00
1.00
Frt
0.97
1.00
0.94
1.00
0.97
1.00
0.99
Flt P
rotec
ted0.9
90.9
51.0
00.9
51.0
00.9
51.0
0Sa
td. F
low (p
rot)
1734
1770
1659
1770
3354
1770
3501
Flt P
ermi
tted
0.99
0.95
1.00
0.95
1.00
0.95
1.00
Satd.
Flow
(per
m)17
3417
7016
5917
7033
5417
7035
01Pe
ak-h
our f
actor
, PHF
0.96
0.96
0.96
0.96
0.96
0.96
0.96
0.96
0.96
0.96
0.96
0.96
Adj. F
low (v
ph)
4810
239
274
179
127
5581
521
010
882
547
RTOR
Red
uctio
n (vp
h)0
00
018
00
150
03
0La
ne G
roup
Flow
(vph
)0
189
027
428
80
5510
100
108
869
0Co
nfl. P
eds.
(#/hr
)28
1818
287
3232
7Co
nfl. B
ikes (
#/hr)
813
2012
Heav
y Veh
icles
(%)
2%6%
2%2%
7%2%
2%2%
2%2%
2%2%
Turn
Typ
eSp
litNA
Split
NAPr
otNA
Prot
NAPr
otecte
d Pha
ses
77
88
52
16
Perm
itted P
hase
sAc
tuated
Gre
en, G
(s)
18.4
26.0
26.0
12.7
46.3
11.7
45.3
Effec
tive G
reen
, g (s
)18
.426
.026
.012
.746
.311
.745
.3Ac
tuated
g/C
Ratio
0.15
0.22
0.22
0.11
0.39
0.10
0.38
Clea
ranc
e Tim
e (s)
4.24.2
4.24.0
4.24.0
4.2Ve
hicle
Exten
sion (
s)2.5
2.52.5
2.04.0
2.04.0
Lane
Grp
Cap
(vph
)26
838
636
218
813
0417
413
32v/s
Rati
o Pro
tc0
.110.1
5c0
.170.0
3c0
.300.0
6c0
.25v/s
Rati
o Per
mv/c
Rati
o0.7
10.7
10.8
00.2
90.7
70.6
20.6
5Un
iform
Dela
y, d1
47.7
43.0
44.0
49.0
31.8
51.5
30.4
Prog
ress
ion F
actor
1.00
1.00
1.00
1.00
1.00
1.00
1.00
Incre
menta
l Dela
y, d2
7.65.5
11.1
0.33.1
4.91.3
Delay
(s)
55.3
48.5
55.1
49.3
34.9
56.4
31.6
Leve
l of S
ervic
eE
DE
DC
EC
Appr
oach
Dela
y (s)
55.3
52.0
35.6
34.4
Appr
oach
LOS
ED
DC
Inter
secti
on S
umma
ryHC
M 20
00 C
ontro
l Dela
y39
.9HC
M 20
00 Le
vel o
f Ser
vice
DHC
M 20
00 V
olume
to C
apac
ity ra
tio0.7
6Ac
tuated
Cyc
le Le
ngth
(s)
119.0
Sum
of los
t time
(s)
16.6
Inter
secti
on C
apac
ity U
tiliza
tion
86.6%
ICU
Leve
l of S
ervic
eE
Analy
sis P
eriod
(min)
15c
Criti
cal L
ane G
roup
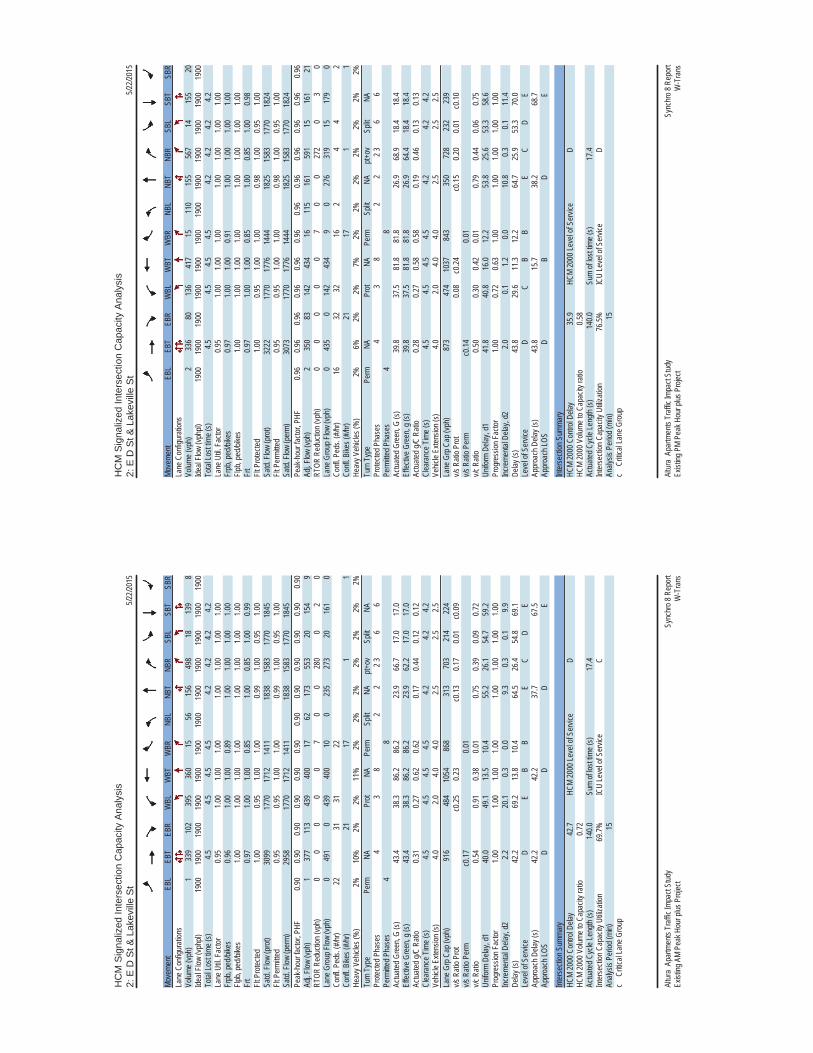
HC
M S
igna
lized
Inte
rsec
tion
Cap
acity
Ana
lysi
s2:
E D
St &
Lak
evill
e S
t5/2
2/201
5
Sync
hro 8
Rep
ort
Altur
a Ap
artm
ents
Traff
ic Im
pact
Stud
y Ex
isting
AM
Peak
Hou
r plus
Pro
ject
W-T
rans
Move
ment
EBL
EBT
EBR
WBL
WBT
WBR
NBL
NBT
NBR
SBL
SBT
SBR
Lane
Con
figur
ation
sVo
lume (
vph)
133
910
239
536
015
5615
649
818
139
8Ide
al Flo
w (vp
hpl)
1900
1900
1900
1900
1900
1900
1900
1900
1900
1900
1900
1900
Total
Lost
time (
s)4.5
4.54.5
4.54.2
4.24.2
4.2La
ne U
til. F
actor
0.95
1.00
1.00
1.00
1.00
1.00
1.00
1.00
Frpb
, ped
/bike
s0.9
61.0
01.0
00.8
91.0
01.0
01.0
01.0
0Flp
b, pe
d/bike
s1.0
01.0
01.0
01.0
01.0
01.0
01.0
01.0
0Fr
t0.9
71.0
01.0
00.8
51.0
00.8
51.0
00.9
9Flt
Pro
tected
1.00
0.95
1.00
1.00
0.99
1.00
0.95
1.00
Satd.
Flow
(pro
t)30
9917
7017
1214
1118
3815
8317
7018
45Flt
Per
mitte
d0.9
50.9
51.0
01.0
00.9
91.0
00.9
51.0
0Sa
td. F
low (p
erm)
2958
1770
1712
1411
1838
1583
1770
1845
Peak
-hou
r fac
tor, P
HF0.9
00.9
00.9
00.9
00.9
00.9
00.9
00.9
00.9
00.9
00.9
00.9
0Ad
j. Flow
(vph
)1
377
113
439
400
1762
173
553
2015
49
RTOR
Red
uctio
n (vp
h)0
00
00
70
028
00
20
Lane
Gro
up F
low (v
ph)
049
10
439
400
100
235
273
2016
10
Confl
. Ped
s. (#
/hr)
2231
3122
Confl
. Bike
s (#/h
r)21
171
1He
avy V
ehicl
es (%
)2%
10%
2%2%
11%
2%2%
2%2%
2%2%
2%Tu
rn T
ype
Perm
NAPr
otNA
Perm
Split
NApt+
ovSp
litNA
Prote
cted P
hase
s4
38
22
2 36
6Pe
rmitte
d Pha
ses
48
Actua
ted G
reen
, G (s
)43
.438
.386
.286
.223
.966
.717
.017
.0Ef
fectiv
e Gre
en, g
(s)
43.4
38.3
86.2
86.2
23.9
62.2
17.0
17.0
Actua
ted g/
C Ra
tio0.3
10.2
70.6
20.6
20.1
70.4
40.1
20.1
2Cl
eara
nce T
ime (
s)4.5
4.54.5
4.54.2
4.24.2
Vehic
le Ex
tensio
n (s)
4.02.0
4.04.0
2.52.5
2.5La
ne G
rp C
ap (v
ph)
916
484
1054
868
313
703
214
224
v/s R
atio P
rot
c0.25
0.23
c0.13
0.17
0.01
c0.09
v/s R
atio P
erm
c0.17
0.01
v/c R
atio
0.54
0.91
0.38
0.01
0.75
0.39
0.09
0.72
Unifo
rm D
elay,
d140
.049
.113
.510
.455
.226
.154
.759
.2Pr
ogre
ssion
Fac
tor1.0
01.0
01.0
01.0
01.0
01.0
01.0
01.0
0Inc
reme
ntal D
elay,
d22.2
20.1
0.30.0
9.30.3
0.19.9
Delay
(s)
42.2
69.2
13.8
10.4
64.5
26.4
54.8
69.1
Leve
l of S
ervic
eD
EB
BE
CD
EAp
proa
ch D
elay (
s)42
.242
.237
.767
.5Ap
proa
ch LO
SD
DD
E
Inter
secti
on S
umma
ryHC
M 20
00 C
ontro
l Dela
y42
.7HC
M 20
00 Le
vel o
f Ser
vice
DHC
M 20
00 V
olume
to C
apac
ity ra
tio0.7
2Ac
tuated
Cyc
le Le
ngth
(s)
140.0
Sum
of los
t time
(s)
17.4
Inter
secti
on C
apac
ity U
tiliza
tion
69.7%
ICU
Leve
l of S
ervic
eC
Analy
sis P
eriod
(min)
15c
Criti
cal L
ane G
roup
HC
M S
igna
lized
Inte
rsec
tion
Cap
acity
Ana
lysi
s2:
E D
St &
Lak
evill
e S
t5/2
2/201
5
Sync
hro 8
Rep
ort
Altur
a Ap
artm
ents
Traff
ic Im
pact
Stud
y Ex
isting
PM
Peak
Hou
r plus
Pro
ject
W-T
rans
Move
ment
EBL
EBT
EBR
WBL
WBT
WBR
NBL
NBT
NBR
SBL
SBT
SBR
Lane
Con
figur
ation
sVo
lume (
vph)
233
680
136
417
1511
015
556
714
155
20Ide
al Flo
w (vp
hpl)
1900
1900
1900
1900
1900
1900
1900
1900
1900
1900
1900
1900
Total
Lost
time (
s)4.5
4.54.5
4.54.2
4.24.2
4.2La
ne U
til. F
actor
0.95
1.00
1.00
1.00
1.00
1.00
1.00
1.00
Frpb
, ped
/bike
s0.9
71.0
01.0
00.9
11.0
01.0
01.0
01.0
0Flp
b, pe
d/bike
s1.0
01.0
01.0
01.0
01.0
01.0
01.0
01.0
0Fr
t0.9
71.0
01.0
00.8
51.0
00.8
51.0
00.9
8Flt
Pro
tected
1.00
0.95
1.00
1.00
0.98
1.00
0.95
1.00
Satd.
Flow
(pro
t)32
2217
7017
7614
4418
2515
8317
7018
24Flt
Per
mitte
d0.9
50.9
51.0
01.0
00.9
81.0
00.9
51.0
0Sa
td. F
low (p
erm)
3073
1770
1776
1444
1825
1583
1770
1824
Peak
-hou
r fac
tor, P
HF0.9
60.9
60.9
60.9
60.9
60.9
60.9
60.9
60.9
60.9
60.9
60.9
6Ad
j. Flow
(vph
)2
350
8314
243
416
115
161
591
1516
121
RTOR
Red
uctio
n (vp
h)0
00
00
70
027
20
30
Lane
Gro
up F
low (v
ph)
043
50
142
434
90
276
319
1517
90
Confl
. Ped
s. (#
/hr)
1632
3216
24
42
Confl
. Bike
s (#/h
r)21
171
1He
avy V
ehicl
es (%
)2%
6%2%
2%7%
2%2%
2%2%
2%2%
2%Tu
rn T
ype
Perm
NAPr
otNA
Perm
Split
NApt+
ovSp
litNA
Prote
cted P
hase
s4
38
22
2 36
6Pe
rmitte
d Pha
ses
48
Actua
ted G
reen
, G (s
)39
.837
.581
.881
.826
.968
.918
.418
.4Ef
fectiv
e Gre
en, g
(s)
39.8
37.5
81.8
81.8
26.9
64.4
18.4
18.4
Actua
ted g/
C Ra
tio0.2
80.2
70.5
80.5
80.1
90.4
60.1
30.1
3Cl
eara
nce T
ime (
s)4.5
4.54.5
4.54.2
4.24.2
Vehic
le Ex
tensio
n (s)
4.02.0
4.04.0
2.52.5
2.5La
ne G
rp C
ap (v
ph)
873
474
1037
843
350
728
232
239
v/s R
atio P
rot
0.08
c0.24
c0.15
0.20
0.01
c0.10
v/s R
atio P
erm
c0.14
0.01
v/c R
atio
0.50
0.30
0.42
0.01
0.79
0.44
0.06
0.75
Unifo
rm D
elay,
d141
.840
.816
.012
.253
.825
.653
.358
.6Pr
ogre
ssion
Fac
tor1.0
00.7
20.6
31.0
01.0
01.0
01.0
01.0
0Inc
reme
ntal D
elay,
d22.0
0.11.2
0.010
.80.3
0.111
.4De
lay (s
)43
.829
.611
.312
.264
.725
.953
.370
.0Le
vel o
f Ser
vice
DC
BB
EC
DE
Appr
oach
Dela
y (s)
43.8
15.7
38.2
68.7
Appr
oach
LOS
DB
DE
Inter
secti
on S
umma
ryHC
M 20
00 C
ontro
l Dela
y35
.9HC
M 20
00 Le
vel o
f Ser
vice
DHC
M 20
00 V
olume
to C
apac
ity ra
tio0.5
8Ac
tuated
Cyc
le Le
ngth
(s)
140.0
Sum
of los
t time
(s)
17.4
Inter
secti
on C
apac
ity U
tiliza
tion
76.5%
ICU
Leve
l of S
ervic
eD
Analy
sis P
eriod
(min)
15c
Criti
cal L
ane G
roup

HC
M S
igna
lized
Inte
rsec
tion
Cap
acity
Ana
lysi
s3:
Cau
lfiel
d Ln
& L
akev
ille
St
5/22/2
015
Sync
hro 8
Rep
ort
Altur
a Apa
rtmen
ts Tr
affic
Impa
ct St
udy
Exist
ing A
M Pe
ak H
our p
lus P
rojec
tW
-Tra
ns
Move
ment
EBL
EBT
EBR
WBL
WBT
WBR
NBL
NBT
NBR
SBL
SBT
SBR
Lane
Con
figur
ation
sVo
lume (
vph)
129
628
2540
532
143
3827
5228
225
300
Ideal
Flow
(vphp
l)19
0019
0019
0019
0019
0019
0019
0019
0019
0019
0019
0019
00To
tal Lo
st tim
e (s)
4.04.9
4.04.9
4.94.0
4.04.9
4.94.9
Lane
Util.
Fac
tor1.0
00.9
51.0
00.9
51.0
01.0
00.9
50.9
50.9
51.0
0Fr
pb, p
ed/bi
kes
1.00
1.00
1.00
1.00
0.98
1.00
0.97
1.00
1.00
1.00
Flpb,
ped/b
ikes
1.00
1.00
1.00
1.00
1.00
1.00
1.00
1.00
1.00
1.00
Frt
1.00
0.99
1.00
1.00
0.85
1.00
0.90
1.00
1.00
0.85
Flt P
rotec
ted0.9
51.0
00.9
51.0
01.0
00.9
51.0
00.9
50.9
61.0
0Sa
td. F
low (p
rot)
1770
3267
1770
3252
1554
1770
3080
1681
1698
1583
Flt P
ermi
tted
0.95
1.00
0.95
1.00
1.00
0.95
1.00
0.95
0.96
1.00
Satd.
Flow
(per
m)17
7032
6717
7032
5215
5417
7030
8016
8116
9815
83Pe
ak-h
our f
actor
, PHF
0.89
0.89
0.89
0.89
0.89
0.89
0.89
0.89
0.89
0.89
0.89
0.89
Adj. F
low (v
ph)
145
706
2845
598
161
4330
5831
728
337
RTOR
Red
uctio
n (vp
h)0
30
00
850
540
00
113
Lane
Gro
up F
low (v
ph)
145
731
045
598
7643
340
171
174
224
Confl
. Ped
s. (#
/hr)
46
64
33
Confl
. Bike
s (#/h
r)8
58
3He
avy V
ehicl
es (%
)2%
10%
2%2%
11%
2%2%
2%2%
2%2%
2%Tu
rn T
ype
Prot
NAPr
otNA
Perm
Split
NASp
litNA
pt+ov
Prote
cted P
hase
s5
21
63
34
44 5
Perm
itted P
hase
s6
Actua
ted G
reen
, G (s
)13
.449
.75.6
41.9
41.9
7.27.2
29.7
29.7
48.0
Effec
tive G
reen
, g (s
)13
.449
.75.6
41.9
41.9
7.27.2
29.7
29.7
48.0
Actua
ted g/
C Ra
tio0.1
20.4
50.0
50.3
80.3
80.0
70.0
70.2
70.2
70.4
4Cl
eara
nce T
ime (
s)4.0
4.94.0
4.94.9
4.04.0
4.94.9
Vehic
le Ex
tensio
n (s)
3.02.0
2.02.0
2.02.0
2.02.0
2.0La
ne G
rp C
ap (v
ph)
215
1476
9012
3859
111
520
145
345
869
0v/s
Rati
o Pro
tc0
.08c0
.220.0
30.1
8c0
.020.0
10.1
0c0
.100.1
4v/s
Rati
o Per
m0.0
5v/c
Rati
o0.6
70.5
00.5
00.4
80.1
30.3
70.1
70.3
80.3
80.3
3Un
iform
Dela
y, d1
46.2
21.3
50.8
25.8
22.2
49.2
48.6
32.6
32.7
20.4
Prog
ress
ion F
actor
1.00
1.00
1.04
1.11
1.79
1.00
1.00
1.00
1.00
1.00
Incre
menta
l Dela
y, d2
8.11.2
1.51.3
0.40.7
0.12.4
2.40.3
Delay
(s)
54.3
22.5
54.4
29.9
40.1
50.0
48.7
35.0
35.0
20.6
Leve
l of S
ervic
eD
CD
CD
DD
DD
CAp
proa
ch D
elay (
s)27
.733
.349
.127
.9Ap
proa
ch LO
SC
CD
C
Inter
secti
on S
umma
ryHC
M 20
00 C
ontro
l Dela
y30
.7HC
M 20
00 Le
vel o
f Ser
vice
CHC
M 20
00 V
olume
to C
apac
ity ra
tio0.4
9Ac
tuated
Cyc
le Le
ngth
(s)
110.0
Sum
of los
t time
(s)
17.8
Inter
secti
on C
apac
ity U
tiliza
tion
67.6%
ICU
Leve
l of S
ervic
eC
Analy
sis P
eriod
(min)
15c
Criti
cal L
ane G
roup
HC
M S
igna
lized
Inte
rsec
tion
Cap
acity
Ana
lysi
s3:
Cau
lfiel
d Ln
& L
akev
ille
St
5/22/2
015
Sync
hro 8
Rep
ort
Altur
a Apa
rtmen
ts Tr
affic
Impa
ct St
udy
Exist
ing P
M Pe
ak H
our p
lus P
rojec
tW
-Tra
ns
Move
ment
EBL
EBT
EBR
WBL
WBT
WBR
NBL
NBT
NBR
SBL
SBT
SBR
Lane
Con
figur
ation
sVo
lume (
vph)
212
651
2533
617
362
4845
3322
017
206
Ideal
Flow
(vphp
l)19
0019
0019
0019
0019
0019
0019
0019
0019
0019
0019
0019
00To
tal Lo
st tim
e (s)
4.04.9
4.04.9
4.94.0
4.04.9
4.94.9
Lane
Util.
Fac
tor1.0
00.9
51.0
00.9
51.0
01.0
00.9
50.9
50.9
51.0
0Fr
pb, p
ed/bi
kes
1.00
1.00
1.00
1.00
0.98
1.00
0.98
1.00
1.00
0.98
Flpb,
ped/b
ikes
1.00
1.00
1.00
1.00
1.00
1.00
1.00
1.00
1.00
1.00
Frt
1.00
0.99
1.00
1.00
0.85
1.00
0.94
1.00
1.00
0.85
Flt P
rotec
ted0.9
51.0
00.9
51.0
01.0
00.9
51.0
00.9
50.9
61.0
0Sa
td. F
low (p
rot)
1770
3388
1770
3374
1552
1770
3261
1681
1697
1552
Flt P
ermi
tted
0.95
1.00
0.95
1.00
1.00
0.95
1.00
0.95
0.96
1.00
Satd.
Flow
(per
m)17
7033
8817
7033
7415
5217
7032
6116
8116
9715
52Pe
ak-h
our f
actor
, PHF
0.98
0.98
0.98
0.98
0.98
0.98
0.98
0.98
0.98
0.98
0.98
0.98
Adj. F
low (v
ph)
216
664
2634
630
369
4946
3422
417
210
RTOR
Red
uctio
n (vp
h)0
10
00
890
320
00
188
Lane
Gro
up F
low (v
ph)
216
689
034
630
280
4948
012
112
022
Confl
. Ped
s. (#
/hr)
52
25
11
Confl
. Bike
s (#/h
r)8
58
3He
avy V
ehicl
es (%
)2%
6%2%
2%7%
2%2%
2%2%
2%2%
2%Tu
rn T
ype
Prot
NAPr
otNA
Perm
Split
NASp
litNA
Perm
Prote
cted P
hase
s5
21
63
34
4Pe
rmitte
d Pha
ses
64
Actua
ted G
reen
, G (s
)22
.693
.14.8
75.3
75.3
9.79.7
14.6
14.6
14.6
Effec
tive G
reen
, g (s
)22
.693
.14.8
75.3
75.3
9.79.7
14.6
14.6
14.6
Actua
ted g/
C Ra
tio0.1
60.6
60.0
30.5
40.5
40.0
70.0
70.1
00.1
00.1
0Cl
eara
nce T
ime (
s)4.0
4.94.0
4.94.9
4.04.0
4.94.9
4.9Ve
hicle
Exten
sion (
s)3.0
2.02.0
2.02.0
2.02.0
2.02.0
2.0La
ne G
rp C
ap (v
ph)
285
2253
6018
1483
412
222
517
517
616
1v/s
Rati
o Pro
tc0
.120.2
0c0
.02c0
.19c0
.030.0
1c0
.070.0
7v/s
Rati
o Per
m0.1
80.0
1v/c
Rati
o0.7
60.3
10.5
70.3
50.3
40.4
00.2
10.6
90.6
80.1
4Un
iform
Dela
y, d1
56.1
9.966
.618
.418
.262
.461
.660
.560
.557
.0Pr
ogre
ssion
Fac
tor1.1
00.5
60.8
10.7
00.6
71.0
01.0
01.0
01.0
01.0
0Inc
reme
ntal D
elay,
d29.6
0.36.6
0.51.0
0.80.2
9.18.4
0.1De
lay (s
)71
.55.8
60.5
13.4
13.2
63.2
61.7
69.7
68.8
57.1
Leve
l of S
ervic
eE
AE
BB
EE
EE
EAp
proa
ch D
elay (
s)21
.514
.962
.363
.6Ap
proa
ch LO
SC
BE
E
Inter
secti
on S
umma
ryHC
M 20
00 C
ontro
l Dela
y28
.4HC
M 20
00 Le
vel o
f Ser
vice
CHC
M 20
00 V
olume
to C
apac
ity ra
tio0.4
7Ac
tuated
Cyc
le Le
ngth
(s)
140.0
Sum
of los
t time
(s)
17.8
Inter
secti
on C
apac
ity U
tiliza
tion
66.7%
ICU
Leve
l of S
ervic
eC
Analy
sis P
eriod
(min)
15c
Criti
cal L
ane G
roup
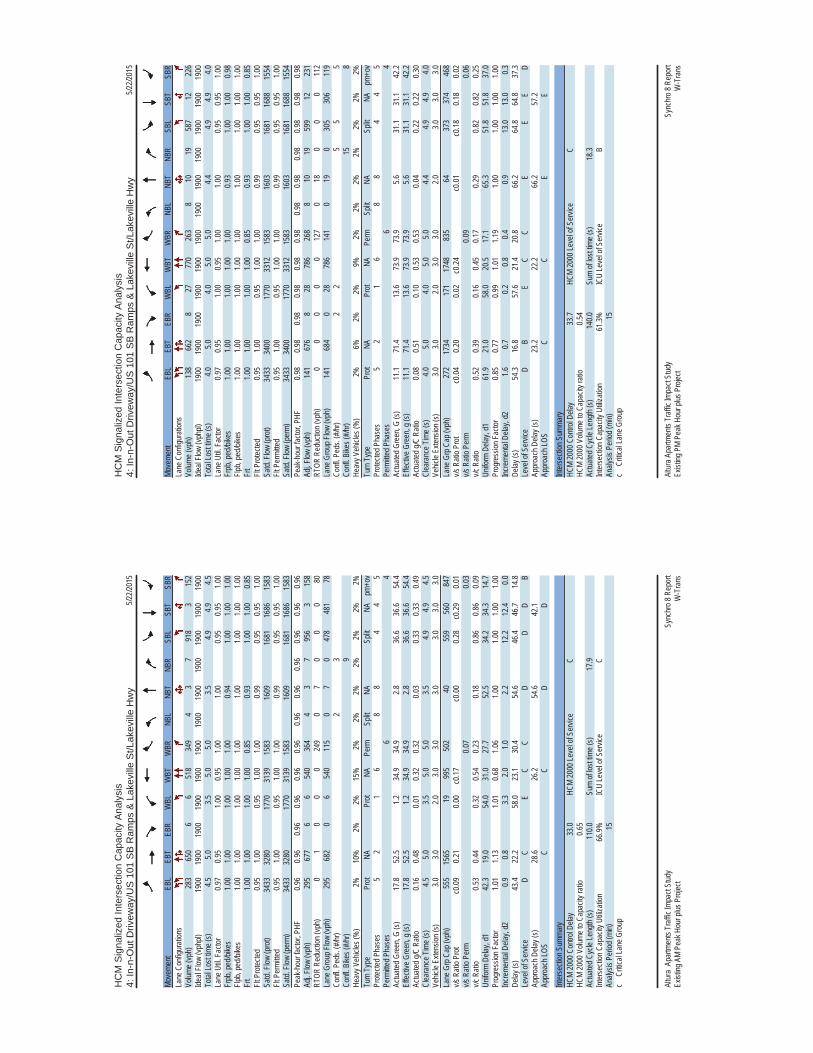
HC
M S
igna
lized
Inte
rsec
tion
Cap
acity
Ana
lysi
s4:
In-n
-Out
Driv
eway
/US
101
SB
Ram
ps &
Lak
evill
e S
t/Lak
evill
e H
wy
5/22/2
015
Sync
hro 8
Rep
ort
Altur
a Ap
artm
ents
Traff
ic Im
pact
Stud
y Ex
isting
AM
Peak
Hou
r plus
Pro
ject
W-T
rans
Move
ment
EBL
EBT
EBR
WBL
WBT
WBR
NBL
NBT
NBR
SBL
SBT
SBR
Lane
Con
figur
ation
sVo
lume (
vph)
283
650
66
518
349
43
791
83
152
Ideal
Flow
(vphp
l)19
0019
0019
0019
0019
0019
0019
0019
0019
0019
0019
0019
00To
tal Lo
st tim
e (s)
4.55.0
3.55.0
5.03.5
4.94.9
4.5La
ne U
til. F
actor
0.97
0.95
1.00
0.95
1.00
1.00
0.95
0.95
1.00
Frpb
, ped
/bike
s1.0
01.0
01.0
01.0
01.0
00.9
41.0
01.0
01.0
0Flp
b, pe
d/bike
s1.0
01.0
01.0
01.0
01.0
01.0
01.0
01.0
01.0
0Fr
t1.0
01.0
01.0
01.0
00.8
50.9
31.0
01.0
00.8
5Flt
Pro
tected
0.95
1.00
0.95
1.00
1.00
0.99
0.95
0.95
1.00
Satd.
Flow
(pro
t)34
3332
8017
7031
3915
8316
0916
8116
8615
83Flt
Per
mitte
d0.9
51.0
00.9
51.0
01.0
00.9
90.9
50.9
51.0
0Sa
td. F
low (p
erm)
3433
3280
1770
3139
1583
1609
1681
1686
1583
Peak
-hou
r fac
tor, P
HF0.9
60.9
60.9
60.9
60.9
60.9
60.9
60.9
60.9
60.9
60.9
60.9
6Ad
j. Flow
(vph
)29
567
76
654
036
44
37
956
315
8RT
OR R
educ
tion (
vph)
01
00
024
90
70
00
80La
ne G
roup
Flow
(vph
)29
568
20
654
011
50
70
478
481
78Co
nfl. P
eds.
(#/hr
)2
3Co
nfl. B
ikes (
#/hr)
9He
avy V
ehicl
es (%
)2%
10%
2%2%
15%
2%2%
2%2%
2%2%
2%Tu
rn T
ype
Prot
NAPr
otNA
Perm
Split
NASp
litNA
pm+o
vPr
otecte
d Pha
ses
52
16
88
44
5Pe
rmitte
d Pha
ses
64
Actua
ted G
reen
, G (s
)17
.852
.51.2
34.9
34.9
2.836
.636
.654
.4Ef
fectiv
e Gre
en, g
(s)
17.8
52.5
1.234
.934
.92.8
36.6
36.6
54.4
Actua
ted g/
C Ra
tio0.1
60.4
80.0
10.3
20.3
20.0
30.3
30.3
30.4
9Cl
eara
nce T
ime (
s)4.5
5.03.5
5.05.0
3.54.9
4.94.5
Vehic
le Ex
tensio
n (s)
3.03.0
2.03.0
3.03.0
3.03.0
3.0La
ne G
rp C
ap (v
ph)
555
1565
1999
550
240
559
560
847
v/s R
atio P
rot
c0.09
0.21
0.00
c0.17
c0.00
0.28
c0.29
0.01
v/s R
atio P
erm
0.07
0.03
v/c R
atio
0.53
0.44
0.32
0.54
0.23
0.18
0.86
0.86
0.09
Unifo
rm D
elay,
d142
.319
.054
.031
.027
.752
.534
.234
.314
.7Pr
ogre
ssion
Fac
tor1.0
11.1
31.0
10.6
81.0
61.0
01.0
01.0
01.0
0Inc
reme
ntal D
elay,
d20.9
0.83.3
2.01.0
2.212
.212
.40.0
Delay
(s)
43.4
22.2
58.0
23.1
30.4
54.6
46.4
46.7
14.8
Leve
l of S
ervic
eD
CE
CC
DD
DB
Appr
oach
Dela
y (s)
28.6
26.2
54.6
42.1
Appr
oach
LOS
CC
DD
Inter
secti
on S
umma
ryHC
M 20
00 C
ontro
l Dela
y33
.0HC
M 20
00 Le
vel o
f Ser
vice
CHC
M 20
00 V
olume
to C
apac
ity ra
tio0.6
5Ac
tuated
Cyc
le Le
ngth
(s)
110.0
Sum
of los
t time
(s)
17.9
Inter
secti
on C
apac
ity U
tiliza
tion
66.9%
ICU
Leve
l of S
ervic
eC
Analy
sis P
eriod
(min)
15c
Criti
cal L
ane G
roup
HC
M S
igna
lized
Inte
rsec
tion
Cap
acity
Ana
lysi
s4:
In-n
-Out
Driv
eway
/US
101
SB
Ram
ps &
Lak
evill
e S
t/Lak
evill
e H
wy
5/22/2
015
Sync
hro 8
Rep
ort
Altur
a Apa
rtmen
ts Tr
affic
Impa
ct St
udy
Exist
ing P
M Pe
ak H
our p
lus P
rojec
tW
-Tra
ns
Move
ment
EBL
EBT
EBR
WBL
WBT
WBR
NBL
NBT
NBR
SBL
SBT
SBR
Lane
Con
figur
ation
sVo
lume (
vph)
138
662
827
770
263
810
1958
712
226
Ideal
Flow
(vphp
l)19
0019
0019
0019
0019
0019
0019
0019
0019
0019
0019
0019
00To
tal Lo
st tim
e (s)
4.05.0
4.05.0
5.04.4
4.94.9
4.0La
ne U
til. F
actor
0.97
0.95
1.00
0.95
1.00
1.00
0.95
0.95
1.00
Frpb
, ped
/bike
s1.0
01.0
01.0
01.0
01.0
00.9
31.0
01.0
00.9
8Flp
b, pe
d/bike
s1.0
01.0
01.0
01.0
01.0
01.0
01.0
01.0
01.0
0Fr
t1.0
01.0
01.0
01.0
00.8
50.9
31.0
01.0
00.8
5Flt
Pro
tected
0.95
1.00
0.95
1.00
1.00
0.99
0.95
0.95
1.00
Satd.
Flow
(pro
t)34
3334
0017
7033
1215
8316
0316
8116
8815
54Flt
Per
mitte
d0.9
51.0
00.9
51.0
01.0
00.9
90.9
50.9
51.0
0Sa
td. F
low (p
erm)
3433
3400
1770
3312
1583
1603
1681
1688
1554
Peak
-hou
r fac
tor, P
HF0.9
80.9
80.9
80.9
80.9
80.9
80.9
80.9
80.9
80.9
80.9
80.9
8Ad
j. Flow
(vph
)14
167
68
2878
626
88
1019
599
1223
1RT
OR R
educ
tion (
vph)
00
00
012
70
180
00
112
Lane
Gro
up F
low (v
ph)
141
684
028
786
141
019
030
530
611
9Co
nfl. P
eds.
(#/hr
)2
25
55
Confl
. Bike
s (#/h
r)15
8He
avy V
ehicl
es (%
)2%
6%2%
2%9%
2%2%
2%2%
2%2%
2%Tu
rn T
ype
Prot
NAPr
otNA
Perm
Split
NASp
litNA
pm+o
vPr
otecte
d Pha
ses
52
16
88
44
5Pe
rmitte
d Pha
ses
64
Actua
ted G
reen
, G (s
)11
.171
.413
.673
.973
.95.6
31.1
31.1
42.2
Effec
tive G
reen
, g (s
)11
.171
.413
.673
.973
.95.6
31.1
31.1
42.2
Actua
ted g/
C Ra
tio0.0
80.5
10.1
00.5
30.5
30.0
40.2
20.2
20.3
0Cl
eara
nce T
ime (
s)4.0
5.04.0
5.05.0
4.44.9
4.94.0
Vehic
le Ex
tensio
n (s)
3.03.0
2.03.0
3.02.0
3.03.0
3.0La
ne G
rp C
ap (v
ph)
272
1734
171
1748
835
6437
337
446
8v/s
Rati
o Pro
tc0
.040.2
00.0
2c0
.24c0
.01c0
.180.1
80.0
2v/s
Rati
o Per
m0.0
90.0
6v/c
Rati
o0.5
20.3
90.1
60.4
50.1
70.2
90.8
20.8
20.2
5Un
iform
Dela
y, d1
61.9
21.0
58.0
20.5
17.1
65.3
51.8
51.8
37.0
Prog
ress
ion F
actor
0.85
0.77
0.99
1.01
1.19
1.00
1.00
1.00
1.00
Incre
menta
l Dela
y, d2
1.60.7
0.20.8
0.40.9
13.0
13.0
0.3De
lay (s
)54
.316
.857
.621
.420
.866
.264
.864
.837
.3Le
vel o
f Ser
vice
DB
EC
CE
EE
DAp
proa
ch D
elay (
s)23
.222
.266
.257
.2Ap
proa
ch LO
SC
CE
E
Inter
secti
on S
umma
ryHC
M 20
00 C
ontro
l Dela
y33
.7HC
M 20
00 Le
vel o
f Ser
vice
CHC
M 20
00 V
olume
to C
apac
ity ra
tio0.5
4Ac
tuated
Cyc
le Le
ngth
(s)
140.0
Sum
of los
t time
(s)
18.3
Inter
secti
on C
apac
ity U
tiliza
tion
61.3%
ICU
Leve
l of S
ervic
eB
Analy
sis P
eriod
(min)
15c
Criti
cal L
ane G
roup
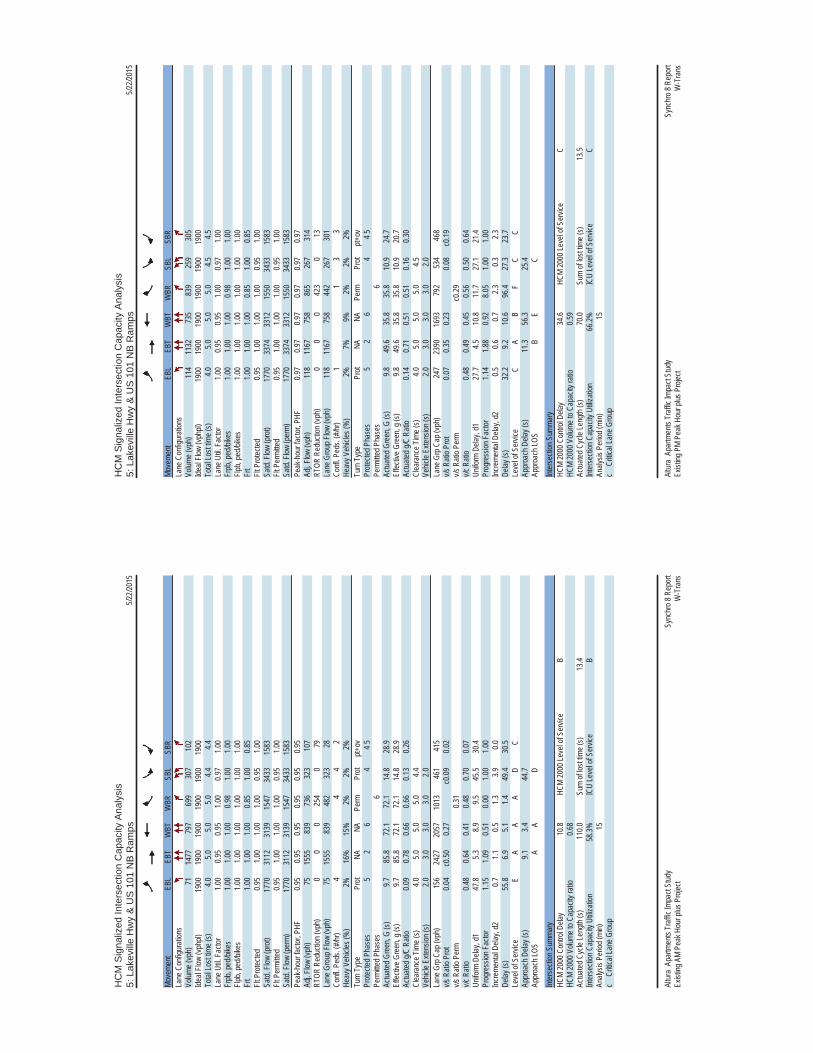
HC
M S
igna
lized
Inte
rsec
tion
Cap
acity
Ana
lysi
s5:
Lak
evill
e H
wy
& U
S 1
01 N
B R
amps
5/22/2
015
Sync
hro 8
Rep
ort
Altur
a Ap
artm
ents
Traff
ic Im
pact
Stud
y Ex
isting
AM
Peak
Hou
r plus
Pro
ject
W-T
rans
Move
ment
EBL
EBT
WBT
WBR
SBL
SBR
Lane
Con
figur
ation
sVo
lume (
vph)
7114
7779
769
930
710
2Ide
al Flo
w (vp
hpl)
1900
1900
1900
1900
1900
1900
Total
Lost
time (
s)4.0
5.05.0
5.04.4
4.4La
ne U
til. F
actor
1.00
0.95
0.95
1.00
0.97
1.00
Frpb
, ped
/bike
s1.0
01.0
01.0
00.9
81.0
01.0
0Flp
b, pe
d/bike
s1.0
01.0
01.0
01.0
01.0
01.0
0Fr
t1.0
01.0
01.0
00.8
51.0
00.8
5Flt
Pro
tected
0.95
1.00
1.00
1.00
0.95
1.00
Satd.
Flow
(pro
t)17
7031
1231
3915
4734
3315
83Flt
Per
mitte
d0.9
51.0
01.0
01.0
00.9
51.0
0Sa
td. F
low (p
erm)
1770
3112
3139
1547
3433
1583
Peak
-hou
r fac
tor, P
HF0.9
50.9
50.9
50.9
50.9
50.9
5Ad
j. Flow
(vph
)75
1555
839
736
323
107
RTOR
Red
uctio
n (vp
h)0
00
254
079
Lane
Gro
up F
low (v
ph)
7515
5583
948
232
328
Confl
. Ped
s. (#
/hr)
44
42
Heav
y Veh
icles
(%)
2%16
%15
%2%
2%2%
Turn
Typ
ePr
otNA
NAPe
rmPr
otpt+
ovPr
otecte
d Pha
ses
52
64
4 5Pe
rmitte
d Pha
ses
6Ac
tuated
Gre
en, G
(s)
9.785
.872
.172
.114
.828
.9Ef
fectiv
e Gre
en, g
(s)
9.785
.872
.172
.114
.828
.9Ac
tuated
g/C
Ratio
0.09
0.78
0.66
0.66
0.13
0.26
Clea
ranc
e Tim
e (s)
4.05.0
5.05.0
4.4Ve
hicle
Exten
sion (
s)2.0
3.03.0
3.02.0
Lane
Grp
Cap
(vph
)15
624
2720
5710
1346
141
5v/s
Rati
o Pro
t0.0
4c0
.500.2
7c0
.090.0
2v/s
Rati
o Per
m0.3
1v/c
Rati
o0.4
80.6
40.4
10.4
80.7
00.0
7Un
iform
Dela
y, d1
47.8
5.38.9
9.545
.530
.4Pr
ogre
ssion
Fac
tor1.1
51.0
90.5
10.0
01.0
01.0
0Inc
reme
ntal D
elay,
d20.7
1.10.5
1.33.9
0.0De
lay (s
)55
.86.9
5.11.4
49.4
30.5
Leve
l of S
ervic
eE
AA
AD
CAp
proa
ch D
elay (
s)9.1
3.444
.7Ap
proa
ch LO
SA
AD
Inter
secti
on S
umma
ryHC
M 20
00 C
ontro
l Dela
y10
.8HC
M 20
00 Le
vel o
f Ser
vice
BHC
M 20
00 V
olume
to C
apac
ity ra
tio0.6
8Ac
tuated
Cyc
le Le
ngth
(s)
110.0
Sum
of los
t time
(s)
13.4
Inter
secti
on C
apac
ity U
tiliza
tion
58.3%
ICU
Leve
l of S
ervic
eB
Analy
sis P
eriod
(min)
15c
Criti
cal L
ane G
roup
HC
M S
igna
lized
Inte
rsec
tion
Cap
acity
Ana
lysi
s5:
Lak
evill
e H
wy
& U
S 1
01 N
B R
amps
5/22/2
015
Sync
hro 8
Rep
ort
Altur
a Ap
artm
ents
Traff
ic Im
pact
Stud
y Ex
isting
PM
Peak
Hou
r plus
Pro
ject
W-T
rans
Move
ment
EBL
EBT
WBT
WBR
SBL
SBR
Lane
Con
figur
ation
sVo
lume (
vph)
114
1132
735
839
259
305
Ideal
Flow
(vphp
l)19
0019
0019
0019
0019
0019
00To
tal Lo
st tim
e (s)
4.05.0
5.05.0
4.54.5
Lane
Util.
Fac
tor1.0
00.9
50.9
51.0
00.9
71.0
0Fr
pb, p
ed/bi
kes
1.00
1.00
1.00
0.98
1.00
1.00
Flpb,
ped/b
ikes
1.00
1.00
1.00
1.00
1.00
1.00
Frt
1.00
1.00
1.00
0.85
1.00
0.85
Flt P
rotec
ted0.9
51.0
01.0
01.0
00.9
51.0
0Sa
td. F
low (p
rot)
1770
3374
3312
1550
3433
1583
Flt P
ermi
tted
0.95
1.00
1.00
1.00
0.95
1.00
Satd.
Flow
(per
m)17
7033
7433
1215
5034
3315
83Pe
ak-h
our f
actor
, PHF
0.97
0.97
0.97
0.97
0.97
0.97
Adj. F
low (v
ph)
118
1167
758
865
267
314
RTOR
Red
uctio
n (vp
h)0
00
423
013
Lane
Gro
up F
low (v
ph)
118
1167
758
442
267
301
Confl
. Ped
s. (#
/hr)
11
33
Heav
y Veh
icles
(%)
2%7%
9%2%
2%2%
Turn
Typ
ePr
otNA
NAPe
rmPr
otpt+
ovPr
otecte
d Pha
ses
52
64
4 5Pe
rmitte
d Pha
ses
6Ac
tuated
Gre
en, G
(s)
9.849
.635
.835
.810
.924
.7Ef
fectiv
e Gre
en, g
(s)
9.849
.635
.835
.810
.920
.7Ac
tuated
g/C
Ratio
0.14
0.71
0.51
0.51
0.16
0.30
Clea
ranc
e Tim
e (s)
4.05.0
5.05.0
4.5Ve
hicle
Exten
sion (
s)2.0
3.03.0
3.02.0
Lane
Grp
Cap
(vph
)24
723
9016
9379
253
446
8v/s
Rati
o Pro
t0.0
70.3
50.2
30.0
8c0
.19v/s
Rati
o Per
mc0
.29v/c
Rati
o0.4
80.4
90.4
50.5
60.5
00.6
4Un
iform
Dela
y, d1
27.7
4.510
.811
.727
.121
.4Pr
ogre
ssion
Fac
tor1.1
41.8
80.9
28.0
51.0
01.0
0Inc
reme
ntal D
elay,
d20.5
0.60.7
2.30.3
2.3De
lay (s
)32
.29.2
10.6
96.4
27.3
23.7
Leve
l of S
ervic
eC
AB
FC
CAp
proa
ch D
elay (
s)11
.356
.325
.4Ap
proa
ch LO
SB
EC
Inter
secti
on S
umma
ryHC
M 20
00 C
ontro
l Dela
y34
.6HC
M 20
00 Le
vel o
f Ser
vice
CHC
M 20
00 V
olume
to C
apac
ity ra
tio0.5
9Ac
tuated
Cyc
le Le
ngth
(s)
70.0
Sum
of los
t time
(s)
13.5
Inter
secti
on C
apac
ity U
tiliza
tion
66.2%
ICU
Leve
l of S
ervic
eC
Analy
sis P
eriod
(min)
15c
Criti
cal L
ane G
roup

HC
M S
igna
lized
Inte
rsec
tion
Cap
acity
Ana
lysi
s6:
Bay
woo
d D
r & L
akev
ille
Hw
y5/2
2/201
5
Sync
hro 8
Rep
ort
Altur
a Ap
artm
ents
Traff
ic Im
pact
Stud
y Ex
isting
AM
Peak
Hou
r plus
Pro
ject
W-T
rans
Move
ment
EBL
EBT
EBR
WBL
WBT
WBR
NBL
NBT
NBR
SBL
SBT
SBR
Lane
Con
figur
ation
sVo
lume (
vph)
7815
8435
1411
5235
259
1245
2034
1Ide
al Flo
w (vp
hpl)
1900
1900
1900
1900
1900
1900
1900
1900
1900
1900
1900
1900
Total
Lost
time (
s)3.5
5.34.1
5.33.0
4.43.0
4.44.4
Lane
Util.
Fac
tor1.0
00.9
51.0
00.9
51.0
01.0
01.0
01.0
01.0
0Fr
pb, p
ed/bi
kes
1.00
1.00
1.00
1.00
1.00
0.98
1.00
1.00
1.00
Flpb,
ped/b
ikes
1.00
1.00
1.00
1.00
1.00
1.00
1.00
1.00
1.00
Frt
1.00
1.00
1.00
1.00
1.00
0.91
1.00
1.00
0.85
Flt P
rotec
ted0.9
51.0
00.9
51.0
00.9
51.0
00.9
51.0
01.0
0Sa
td. F
low (p
rot)
1770
3108
1770
3134
1770
1669
1770
1863
1583
Flt P
ermi
tted
0.95
1.00
0.95
1.00
0.95
1.00
0.95
1.00
1.00
Satd.
Flow
(per
m)17
7031
0817
7031
3417
7016
6917
7018
6315
83Pe
ak-h
our f
actor
, PHF
0.95
0.95
0.95
0.95
0.95
0.95
0.95
0.95
0.95
0.95
0.95
0.95
Adj. F
low (v
ph)
8216
6737
1512
1337
269
1347
2135
9RT
OR R
educ
tion (
vph)
01
00
10
012
00
015
0La
ne G
roup
Flow
(vph
)82
1703
015
1249
026
100
4721
209
Confl
. Ped
s. (#
/hr)
101
110
77
Confl
. Bike
s (#/h
r)4
23
Heav
y Veh
icles
(%)
2%16
%2%
2%15
%2%
2%2%
2%2%
2%2%
Turn
Typ
ePr
otNA
Prot
NAPr
otNA
Prot
NApt+
ovPr
otecte
d Pha
ses
52
16
38
74
4 5Pe
rmitte
d Pha
ses
Actua
ted G
reen
, G (s
)16
.976
.02.6
62.3
4.35.4
9.210
.327
.2Ef
fectiv
e Gre
en, g
(s)
16.9
76.0
2.662
.34.3
5.49.2
10.3
27.2
Actua
ted g/
C Ra
tio0.1
50.6
90.0
20.5
70.0
40.0
50.0
80.0
90.2
5Cl
eara
nce T
ime (
s)3.5
5.34.1
5.33.0
4.43.0
4.4Ve
hicle
Exten
sion (
s)3.0
4.02.0
4.02.0
2.02.0
2.0La
ne G
rp C
ap (v
ph)
271
2147
4117
7469
8114
817
439
1v/s
Rati
o Pro
t0.0
5c0
.550.0
1c0
.40c0
.010.0
10.0
30.0
1c0
.13v/s
Rati
o Per
mv/c
Rati
o0.3
00.7
90.3
70.7
00.3
80.1
20.3
20.1
20.5
4Un
iform
Dela
y, d1
41.3
11.6
52.9
17.2
51.5
50.0
47.4
45.7
35.9
Prog
ress
ion F
actor
0.95
0.89
1.31
0.56
1.00
1.00
1.00
1.00
1.00
Incre
menta
l Dela
y, d2
0.52.7
1.82.1
1.30.2
0.50.1
0.7De
lay (s
)39
.813
.171
.011
.752
.850
.347
.945
.836
.6Le
vel o
f Ser
vice
DB
EB
DD
DD
DAp
proa
ch D
elay (
s)14
.312
.451
.638
.3Ap
proa
ch LO
SB
BD
D
Inter
secti
on S
umma
ryHC
M 20
00 C
ontro
l Dela
y17
.0HC
M 20
00 Le
vel o
f Ser
vice
BHC
M 20
00 V
olume
to C
apac
ity ra
tio0.7
5Ac
tuated
Cyc
le Le
ngth
(s)
110.0
Sum
of los
t time
(s)
16.8
Inter
secti
on C
apac
ity U
tiliza
tion
71.0%
ICU
Leve
l of S
ervic
eC
Analy
sis P
eriod
(min)
15c
Criti
cal L
ane G
roup
HC
M S
igna
lized
Inte
rsec
tion
Cap
acity
Ana
lysi
s6:
Bay
woo
d D
r & L
akev
ille
Hw
y5/2
2/201
5
Sync
hro 8
Rep
ort
Altur
a Ap
artm
ents
Traff
ic Im
pact
Stud
y Ex
isting
PM
Peak
Hou
r plus
Pro
ject
W-T
rans
Move
ment
EBL
EBT
EBR
WBL
WBT
WBR
NBL
NBT
NBR
SBL
SBT
SBR
Lane
Con
figur
ation
sVo
lume (
vph)
230
1101
2715
1304
5110
131
1632
1015
6Ide
al Flo
w (vp
hpl)
1900
1900
1900
1900
1900
1900
1900
1900
1900
1900
1900
1900
Total
Lost
time (
s)3.5
5.34.1
5.33.0
4.43.0
4.44.4
Lane
Util.
Fac
tor1.0
00.9
51.0
00.9
51.0
01.0
01.0
01.0
01.0
0Fr
pb, p
ed/bi
kes
1.00
1.00
1.00
1.00
1.00
0.99
1.00
1.00
1.00
Flpb,
ped/b
ikes
1.00
1.00
1.00
1.00
1.00
1.00
1.00
1.00
1.00
Frt
1.00
1.00
1.00
0.99
1.00
0.95
1.00
1.00
0.85
Flt P
rotec
ted0.9
51.0
00.9
51.0
00.9
51.0
00.9
51.0
01.0
0Sa
td. F
low (p
rot)
1770
3361
1770
3299
1770
1748
1770
1863
1583
Flt P
ermi
tted
0.95
1.00
0.95
1.00
0.95
1.00
0.95
1.00
1.00
Satd.
Flow
(per
m)17
7033
6117
7032
9917
7017
4817
7018
6315
83Pe
ak-h
our f
actor
, PHF
0.99
0.99
0.99
0.99
0.99
0.99
0.99
0.99
0.99
0.99
0.99
0.99
Adj. F
low (v
ph)
232
1112
2715
1317
5210
231
1632
1015
8RT
OR R
educ
tion (
vph)
01
00
20
015
00
087
Lane
Gro
up F
low (v
ph)
232
1138
015
1367
010
232
032
1071
Confl
. Ped
s. (#
/hr)
211
112
111
111
Confl
. Bike
s (#/h
r)4
23
Heav
y Veh
icles
(%)
2%7%
2%2%
9%2%
2%2%
2%2%
2%2%
Turn
Typ
ePr
otNA
Prot
NAPr
otNA
Prot
NApt+
ovPr
otecte
d Pha
ses
52
16
38
74
4 5Pe
rmitte
d Pha
ses
Actua
ted G
reen
, G (s
)27
.910
1.42.8
76.9
12.4
12.2
6.86.6
34.5
Effec
tive G
reen
, g (s
)27
.910
1.42.8
76.9
12.4
12.2
6.86.6
34.5
Actua
ted g/
C Ra
tio0.2
00.7
20.0
20.5
50.0
90.0
90.0
50.0
50.2
5Cl
eara
nce T
ime (
s)3.5
5.34.1
5.33.0
4.43.0
4.4Ve
hicle
Exten
sion (
s)3.0
4.02.0
4.02.0
2.02.0
2.0La
ne G
rp C
ap (v
ph)
352
2434
3518
1215
615
285
8739
0v/s
Rati
o Pro
tc0
.130.3
40.0
1c0
.41c0
.060.0
2c0
.020.0
10.0
4v/s
Rati
o Per
mv/c
Rati
o0.6
60.4
70.4
30.7
50.6
50.2
10.3
80.1
10.1
8Un
iform
Dela
y, d1
51.7
8.067
.824
.361
.759
.464
.563
.941
.6Pr
ogre
ssion
Fac
tor0.8
81.0
91.2
30.5
71.0
01.0
01.0
01.0
01.0
0Inc
reme
ntal D
elay,
d24.2
0.62.4
2.47.3
0.31.0
0.20.1
Delay
(s)
49.7
9.486
.016
.169
.059
.765
.664
.141
.7Le
vel o
f Ser
vice
DA
FB
EE
EE
DAp
proa
ch D
elay (
s)16
.216
.966
.146
.6Ap
proa
ch LO
SB
BE
D
Inter
secti
on S
umma
ryHC
M 20
00 C
ontro
l Dela
y20
.9HC
M 20
00 Le
vel o
f Ser
vice
CHC
M 20
00 V
olume
to C
apac
ity ra
tio0.7
1Ac
tuated
Cyc
le Le
ngth
(s)
140.0
Sum
of los
t time
(s)
16.8
Inter
secti
on C
apac
ity U
tiliza
tion
77.5%
ICU
Leve
l of S
ervic
eD
Analy
sis P
eriod
(min)
15c
Criti
cal L
ane G
roup
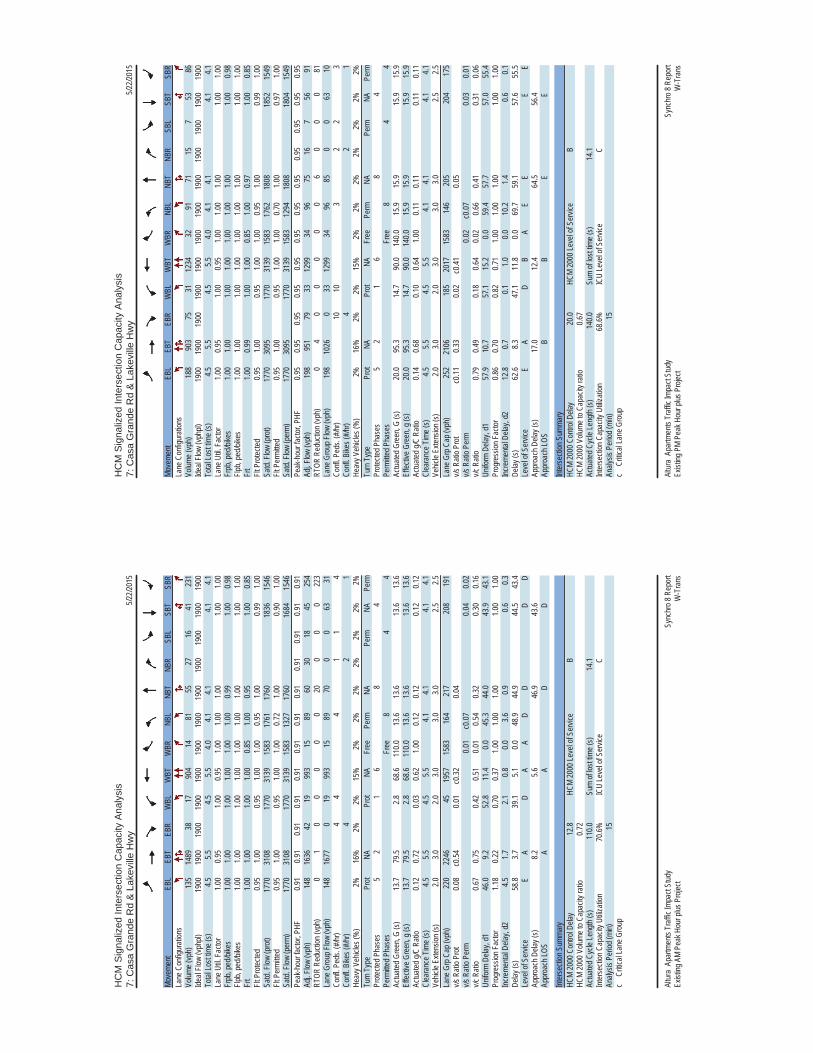
HC
M S
igna
lized
Inte
rsec
tion
Cap
acity
Ana
lysi
s7:
Cas
a G
rand
e R
d &
Lak
evill
e H
wy
5/22/2
015
Sync
hro 8
Rep
ort
Altur
a Ap
artm
ents
Traff
ic Im
pact
Stud
y Ex
isting
AM
Peak
Hou
r plus
Pro
ject
W-T
rans
Move
ment
EBL
EBT
EBR
WBL
WBT
WBR
NBL
NBT
NBR
SBL
SBT
SBR
Lane
Con
figur
ation
sVo
lume (
vph)
135
1489
3817
904
1481
5527
1641
231
Ideal
Flow
(vphp
l)19
0019
0019
0019
0019
0019
0019
0019
0019
0019
0019
0019
00To
tal Lo
st tim
e (s)
4.55.5
4.55.5
4.04.1
4.14.1
4.1La
ne U
til. F
actor
1.00
0.95
1.00
0.95
1.00
1.00
1.00
1.00
1.00
Frpb
, ped
/bike
s1.0
01.0
01.0
01.0
01.0
01.0
00.9
91.0
00.9
8Flp
b, pe
d/bike
s1.0
01.0
01.0
01.0
01.0
01.0
01.0
01.0
01.0
0Fr
t1.0
01.0
01.0
01.0
00.8
51.0
00.9
51.0
00.8
5Flt
Pro
tected
0.95
1.00
0.95
1.00
1.00
0.95
1.00
0.99
1.00
Satd.
Flow
(pro
t)17
7031
0817
7031
3915
8317
6117
6018
3615
46Flt
Per
mitte
d0.9
51.0
00.9
51.0
01.0
00.7
21.0
00.9
01.0
0Sa
td. F
low (p
erm)
1770
3108
1770
3139
1583
1327
1760
1684
1546
Peak
-hou
r fac
tor, P
HF0.9
10.9
10.9
10.9
10.9
10.9
10.9
10.9
10.9
10.9
10.9
10.9
1Ad
j. Flow
(vph
)14
816
3642
1999
315
8960
3018
4525
4RT
OR R
educ
tion (
vph)
01
00
00
020
00
022
3La
ne G
roup
Flow
(vph
)14
816
770
1999
315
8970
00
6331
Confl
. Ped
s. (#
/hr)
44
41
14
Confl
. Bike
s (#/h
r)4
21
Heav
y Veh
icles
(%)
2%16
%2%
2%15
%2%
2%2%
2%2%
2%2%
Turn
Typ
ePr
otNA
Prot
NAFr
eePe
rmNA
Perm
NAPe
rmPr
otecte
d Pha
ses
52
16
84
Perm
itted P
hase
sFr
ee8
44
Actua
ted G
reen
, G (s
)13
.779
.52.8
68.6
110.0
13.6
13.6
13.6
13.6
Effec
tive G
reen
, g (s
)13
.779
.52.8
68.6
110.0
13.6
13.6
13.6
13.6
Actua
ted g/
C Ra
tio0.1
20.7
20.0
30.6
21.0
00.1
20.1
20.1
20.1
2Cl
eara
nce T
ime (
s)4.5
5.54.5
5.54.1
4.14.1
4.1Ve
hicle
Exten
sion (
s)2.0
3.02.0
3.03.0
3.02.5
2.5La
ne G
rp C
ap (v
ph)
220
2246
4519
5715
8316
421
720
819
1v/s
Rati
o Pro
t0.0
8c0
.540.0
1c0
.320.0
4v/s
Rati
o Per
m0.0
1c0
.070.0
40.0
2v/c
Rati
o0.6
70.7
50.4
20.5
10.0
10.5
40.3
20.3
00.1
6Un
iform
Dela
y, d1
46.0
9.252
.811
.40.0
45.3
44.0
43.9
43.1
Prog
ress
ion F
actor
1.18
0.22
0.70
0.37
1.00
1.00
1.00
1.00
1.00
Incre
menta
l Dela
y, d2
4.51.7
2.10.8
0.03.6
0.90.6
0.3De
lay (s
)58
.83.7
39.1
5.10.0
48.9
44.9
44.5
43.4
Leve
l of S
ervic
eE
AD
AA
DD
DD
Appr
oach
Dela
y (s)
8.25.6
46.9
43.6
Appr
oach
LOS
AA
DD
Inter
secti
on S
umma
ryHC
M 20
00 C
ontro
l Dela
y12
.8HC
M 20
00 Le
vel o
f Ser
vice
BHC
M 20
00 V
olume
to C
apac
ity ra
tio0.7
2Ac
tuated
Cyc
le Le
ngth
(s)
110.0
Sum
of los
t time
(s)
14.1
Inter
secti
on C
apac
ity U
tiliza
tion
70.6%
ICU
Leve
l of S
ervic
eC
Analy
sis P
eriod
(min)
15c
Criti
cal L
ane G
roup
HC
M S
igna
lized
Inte
rsec
tion
Cap
acity
Ana
lysi
s7:
Cas
a G
rand
e R
d &
Lak
evill
e H
wy
5/22/2
015
Sync
hro 8
Rep
ort
Altur
a Ap
artm
ents
Traff
ic Im
pact
Stud
y Ex
isting
PM
Peak
Hou
r plus
Pro
ject
W-T
rans
Move
ment
EBL
EBT
EBR
WBL
WBT
WBR
NBL
NBT
NBR
SBL
SBT
SBR
Lane
Con
figur
ation
sVo
lume (
vph)
188
903
7531
1234
3291
7115
753
86Ide
al Flo
w (vp
hpl)
1900
1900
1900
1900
1900
1900
1900
1900
1900
1900
1900
1900
Total
Lost
time (
s)4.5
5.54.5
5.54.0
4.14.1
4.14.1
Lane
Util.
Fac
tor1.0
00.9
51.0
00.9
51.0
01.0
01.0
01.0
01.0
0Fr
pb, p
ed/bi
kes
1.00
1.00
1.00
1.00
1.00
1.00
1.00
1.00
0.98
Flpb,
ped/b
ikes
1.00
1.00
1.00
1.00
1.00
1.00
1.00
1.00
1.00
Frt
1.00
0.99
1.00
1.00
0.85
1.00
0.97
1.00
0.85
Flt P
rotec
ted0.9
51.0
00.9
51.0
01.0
00.9
51.0
00.9
91.0
0Sa
td. F
low (p
rot)
1770
3095
1770
3139
1583
1762
1808
1852
1549
Flt P
ermi
tted
0.95
1.00
0.95
1.00
1.00
0.70
1.00
0.97
1.00
Satd.
Flow
(per
m)17
7030
9517
7031
3915
8312
9418
0818
0415
49Pe
ak-h
our f
actor
, PHF
0.95
0.95
0.95
0.95
0.95
0.95
0.95
0.95
0.95
0.95
0.95
0.95
Adj. F
low (v
ph)
198
951
7933
1299
3496
7516
756
91RT
OR R
educ
tion (
vph)
04
00
00
06
00
081
Lane
Gro
up F
low (v
ph)
198
1026
033
1299
3496
850
063
10Co
nfl. P
eds.
(#/hr
)10
103
22
3Co
nfl. B
ikes (
#/hr)
42
1He
avy V
ehicl
es (%
)2%
16%
2%2%
15%
2%2%
2%2%
2%2%
2%Tu
rn T
ype
Prot
NAPr
otNA
Free
Perm
NAPe
rmNA
Perm
Prote
cted P
hase
s5
21
68
4Pe
rmitte
d Pha
ses
Free
84
4Ac
tuated
Gre
en, G
(s)
20.0
95.3
14.7
90.0
140.0
15.9
15.9
15.9
15.9
Effec
tive G
reen
, g (s
)20
.095
.314
.790
.014
0.015
.915
.915
.915
.9Ac
tuated
g/C
Ratio
0.14
0.68
0.10
0.64
1.00
0.11
0.11
0.11
0.11
Clea
ranc
e Tim
e (s)
4.55.5
4.55.5
4.14.1
4.14.1
Vehic
le Ex
tensio
n (s)
2.03.0
2.03.0
3.03.0
2.52.5
Lane
Grp
Cap
(vph
)25
221
0618
520
1715
8314
620
520
417
5v/s
Rati
o Pro
tc0
.110.3
30.0
2c0
.410.0
5v/s
Rati
o Per
m0.0
2c0
.070.0
30.0
1v/c
Rati
o0.7
90.4
90.1
80.6
40.0
20.6
60.4
10.3
10.0
6Un
iform
Dela
y, d1
57.9
10.7
57.1
15.2
0.059
.457
.757
.055
.4Pr
ogre
ssion
Fac
tor0.8
60.7
00.8
20.7
11.0
01.0
01.0
01.0
01.0
0Inc
reme
ntal D
elay,
d212
.80.7
0.11.0
0.010
.21.4
0.60.1
Delay
(s)
62.6
8.347
.111
.80.0
69.7
59.1
57.6
55.5
Leve
l of S
ervic
eE
AD
BA
EE
EE
Appr
oach
Dela
y (s)
17.0
12.4
64.5
56.4
Appr
oach
LOS
BB
EE
Inter
secti
on S
umma
ryHC
M 20
00 C
ontro
l Dela
y20
.0HC
M 20
00 Le
vel o
f Ser
vice
BHC
M 20
00 V
olume
to C
apac
ity ra
tio0.6
7Ac
tuated
Cyc
le Le
ngth
(s)
140.0
Sum
of los
t time
(s)
14.1
Inter
secti
on C
apac
ity U
tiliza
tion
68.6%
ICU
Leve
l of S
ervic
eC
Analy
sis P
eriod
(min)
15c
Criti
cal L
ane G
roup

HC
M S
igna
lized
Inte
rsec
tion
Cap
acity
Ana
lysi
s8:
McD
owel
l Bl &
Lak
evill
e H
wy
5/22/2
015
Sync
hro 8
Rep
ort
Altur
a Apa
rtmen
ts Tr
affic
Impa
ct St
udy
Exist
ing A
M Pe
ak H
our p
lus P
rojec
tW
-Tra
ns
Move
ment
EBL
EBT
EBR
WBL
WBT
WBR
NBL
NBT
NBR
SBL
SBT
SBR
Lane
Con
figur
ation
sVo
lume (
vph)
1188
861
732
712
5520
583
917
523
115
Ideal
Flow
(vphp
l)19
0019
0019
0019
0019
0019
0019
0019
0019
0019
0019
0019
00To
tal Lo
st tim
e (s)
3.05.5
3.05.5
3.04.8
3.04.8
Lane
Util.
Fac
tor1.0
00.9
51.0
00.9
51.0
00.9
51.0
00.9
5Fr
pb, p
ed/bi
kes
1.00
1.00
1.00
1.00
1.00
1.00
1.00
1.00
Flpb,
ped/b
ikes
1.00
1.00
1.00
1.00
1.00
1.00
1.00
1.00
Frt
1.00
0.94
1.00
0.99
1.00
0.98
1.00
0.99
Flt P
rotec
ted0.9
51.0
00.9
51.0
00.9
51.0
00.9
51.0
0Sa
td. F
low (p
rot)
1770
3073
1770
3128
1770
3479
1770
3503
Flt P
ermi
tted
0.95
1.00
0.95
1.00
0.95
1.00
0.95
1.00
Satd.
Flow
(per
m)17
7030
7317
7031
2817
7034
7917
7035
03Pe
ak-h
our f
actor
, PHF
0.93
0.93
0.93
0.93
0.93
0.93
0.93
0.93
0.93
0.93
0.93
0.93
Adj. F
low (v
ph)
1295
566
334
766
5922
089
1018
824
816
RTOR
Red
uctio
n (vp
h)0
770
03
00
90
05
0La
ne G
roup
Flow
(vph
)12
1541
034
822
022
090
018
825
90
Confl
. Ped
s. (#
/hr)
11
Confl
. Bike
s (#/h
r)1
52
Heav
y Veh
icles
(%)
2%16
%2%
2%15
%2%
2%2%
2%2%
2%2%
Turn
Typ
ePr
otNA
Prot
NAPr
otNA
Prot
NAPr
otecte
d Pha
ses
52
16
38
74
Perm
itted P
hase
sAc
tuated
Gre
en, G
(s)
2.457
.74.6
59.9
18.9
16.0
15.4
12.5
Effec
tive G
reen
, g (s
)2.4
57.7
4.659
.918
.916
.015
.412
.5Ac
tuated
g/C
Ratio
0.02
0.52
0.04
0.54
0.17
0.15
0.14
0.11
Clea
ranc
e Tim
e (s)
3.05.5
3.05.5
3.04.8
3.04.8
Vehic
le Ex
tensio
n (s)
2.03.0
2.03.0
3.02.0
2.02.0
Lane
Grp
Cap
(vph
)38
1611
7417
0330
450
624
739
8v/s
Rati
o Pro
tc0
.01c0
.500.0
2c0
.26c0
.120.0
3c0
.110.0
7v/s
Rati
o Per
mv/c
Rati
o0.3
20.9
60.4
60.4
80.7
20.1
80.7
60.6
5Un
iform
Dela
y, d1
53.0
25.0
51.5
15.5
43.1
41.2
45.5
46.7
Prog
ress
ion F
actor
0.77
0.52
1.00
1.00
1.00
1.00
1.00
1.00
Incre
menta
l Dela
y, d2
1.211
.01.6
1.08.3
0.111
.72.7
Delay
(s)
41.8
24.0
53.1
16.5
51.3
41.3
57.3
49.4
Leve
l of S
ervic
eD
CD
BD
DE
DAp
proa
ch D
elay (
s)24
.117
.948
.252
.7Ap
proa
ch LO
SC
BD
D
Inter
secti
on S
umma
ryHC
M 20
00 C
ontro
l Dela
y28
.8HC
M 20
00 Le
vel o
f Ser
vice
CHC
M 20
00 V
olume
to C
apac
ity ra
tio0.8
6Ac
tuated
Cyc
le Le
ngth
(s)
110.0
Sum
of los
t time
(s)
16.3
Inter
secti
on C
apac
ity U
tiliza
tion
75.0%
ICU
Leve
l of S
ervic
eD
Analy
sis P
eriod
(min)
15c
Criti
cal L
ane G
roup
HC
M S
igna
lized
Inte
rsec
tion
Cap
acity
Ana
lysi
s8:
McD
owel
l Bl &
Lak
evill
e H
wy
5/22/2
015
Sync
hro 8
Rep
ort
Altur
a Ap
artm
ents
Traff
ic Im
pact
Stud
y Ex
isting
PM
Peak
Hou
r plus
Pro
ject
W-T
rans
Move
ment
EBL
EBT
EBR
WBL
WBT
WBR
NBL
NBT
NBR
SBL
SBT
SBR
Lane
Con
figur
ation
sVo
lume (
vph)
1677
210
513
853
192
456
315
957
7620
Ideal
Flow
(vphp
l)19
0019
0019
0019
0019
0019
0019
0019
0019
0019
0019
0019
00To
tal Lo
st tim
e (s)
3.05.5
3.05.5
3.04.8
3.04.8
Lane
Util.
Fac
tor1.0
00.9
51.0
00.9
51.0
00.9
51.0
00.9
5Fr
pb, p
ed/bi
kes
1.00
1.00
1.00
1.00
1.00
1.00
1.00
1.00
Flpb,
ped/b
ikes
1.00
1.00
1.00
1.00
1.00
1.00
1.00
1.00
Frt
1.00
0.98
1.00
0.97
1.00
1.00
1.00
0.97
Flt P
rotec
ted0.9
51.0
00.9
51.0
00.9
51.0
00.9
51.0
0Sa
td. F
low (p
rot)
1770
3326
1770
3249
1770
3520
1770
3413
Flt P
ermi
tted
0.95
1.00
0.95
1.00
0.95
1.00
0.95
1.00
Satd.
Flow
(per
m)17
7033
2617
7032
4917
7035
2017
7034
13Pe
ak-h
our f
actor
, PHF
0.93
0.93
0.93
0.93
0.93
0.93
0.93
0.93
0.93
0.93
0.93
0.93
Adj. F
low (v
ph)
1783
011
314
917
206
490
339
1061
8222
RTOR
Red
uctio
n (vp
h)0
70
012
00
10
020
0La
ne G
roup
Flow
(vph
)17
936
014
1111
049
034
80
6184
0Co
nfl. P
eds.
(#/hr
)3
11
316
16Co
nfl. B
ikes (
#/hr)
15
2He
avy V
ehicl
es (%
)2%
7%2%
2%9%
2%2%
2%2%
2%2%
2%Tu
rn T
ype
Prot
NAPr
otNA
Prot
NAPr
otNA
Prote
cted P
hase
s5
21
63
87
4Pe
rmitte
d Pha
ses
Actua
ted G
reen
, G (s
)2.9
59.3
4.160
.551
.652
.18.2
8.7Ef
fectiv
e Gre
en, g
(s)
2.959
.34.1
60.5
51.6
52.1
8.28.7
Actua
ted g/
C Ra
tio0.0
20.4
20.0
30.4
30.3
70.3
70.0
60.0
6Cl
eara
nce T
ime (
s)3.0
5.53.0
5.53.0
4.83.0
4.8Ve
hicle
Exten
sion (
s)2.0
3.02.0
3.03.0
2.02.0
2.0La
ne G
rp C
ap (v
ph)
3614
0851
1404
652
1309
103
212
v/s R
atio P
rot
0.01
c0.28
0.01
c0.34
c0.28
0.10
c0.03
0.02
v/s R
atio P
erm
v/c R
atio
0.47
0.66
0.27
0.79
0.75
0.27
0.59
0.40
Unifo
rm D
elay,
d167
.832
.466
.534
.338
.630
.664
.363
.1Pr
ogre
ssion
Fac
tor1.0
50.6
51.0
01.0
01.0
01.0
01.0
01.0
0Inc
reme
ntal D
elay,
d23.2
2.31.1
4.64.9
0.05.9
0.4De
lay (s
)74
.423
.367
.638
.943
.530
.770
.263
.6Le
vel o
f Ser
vice
EC
ED
DC
EE
Appr
oach
Dela
y (s)
24.2
39.3
38.1
66.0
Appr
oach
LOS
CD
DE
Inter
secti
on S
umma
ryHC
M 20
00 C
ontro
l Dela
y35
.7HC
M 20
00 Le
vel o
f Ser
vice
DHC
M 20
00 V
olume
to C
apac
ity ra
tio0.7
6Ac
tuated
Cyc
le Le
ngth
(s)
140.0
Sum
of los
t time
(s)
16.3
Inter
secti
on C
apac
ity U
tiliza
tion
73.6%
ICU
Leve
l of S
ervic
eD
Analy
sis P
eriod
(min)
15c
Criti
cal L
ane G
roup
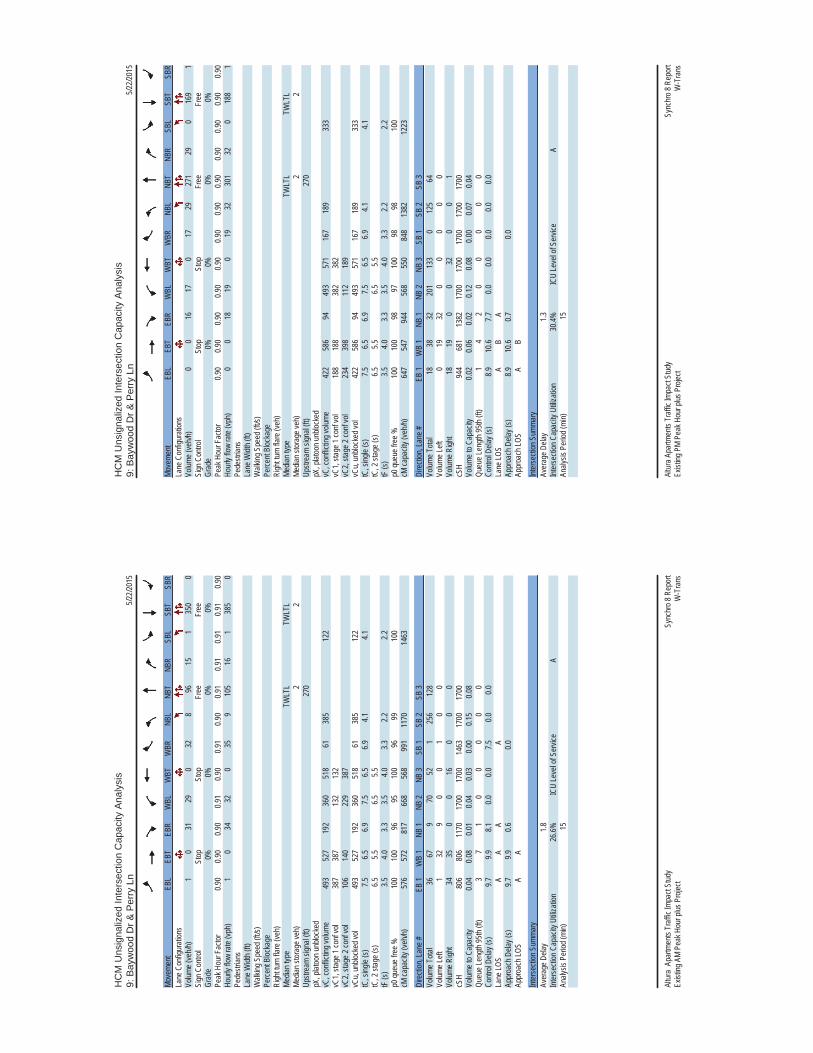
HC
M U
nsig
naliz
ed In
ters
ectio
n C
apac
ity A
naly
sis
9: B
ayw
ood
Dr &
Per
ry L
n5/2
2/201
5
Sync
hro 8
Rep
ort
Altur
a Ap
artm
ents
Traff
ic Im
pact
Stud
y Ex
isting
AM
Peak
Hou
r plus
Pro
ject
W-T
rans
Move
ment
EBL
EBT
EBR
WBL
WBT
WBR
NBL
NBT
NBR
SBL
SBT
SBR
Lane
Con
figur
ation
sVo
lume (
veh/h
)1
031
290
328
9615
135
00
Sign
Con
trol
Stop
Stop
Free
Free
Grad
e0%
0%0%
0%Pe
ak H
our F
actor
0.90
0.90
0.90
0.91
0.90
0.91
0.90
0.91
0.91
0.91
0.91
0.90
Hour
ly flo
w ra
te (vp
h)1
034
320
359
105
161
385
0Pe
destr
ians
Lane
Widt
h (ft)
Walk
ing S
peed
(ft/s
)Pe
rcent
Bloc
kage
Righ
t turn
flare
(veh
)Me
dian t
ype
TWLT
LTW
LTL
Media
n stor
age v
eh)
22
Upstr
eam
signa
l (ft)
270
pX, p
latoo
n unb
locke
dvC
, con
flictin
g volu
me49
352
719
236
051
861
385
122
vC1,
stage
1 co
nf vo
l38
738
713
213
2vC
2, sta
ge 2
conf
vol
106
140
229
387
vCu,
unblo
cked
vol
493
527
192
360
518
6138
512
2tC
, sing
le (s)
7.56.5
6.97.5
6.56.9
4.14.1
tC, 2
stag
e (s)
6.55.5
6.55.5
tF (s
)3.5
4.03.3
3.54.0
3.32.2
2.2p0
queu
e fre
e %10
010
096
9510
096
9910
0cM
capa
city (
veh/h
)57
657
281
766
856
899
111
7014
63
Dire
ction
, Lan
e #EB
1W
B 1
NB 1
NB 2
NB 3
SB 1
SB 2
SB 3
Volum
e Tota
l36
679
7052
125
612
8Vo
lume L
eft1
329
00
10
0Vo
lume R
ight
3435
00
160
00
cSH
806
806
1170
1700
1700
1463
1700
1700
Volum
e to C
apac
ity0.0
40.0
80.0
10.0
40.0
30.0
00.1
50.0
8Qu
eue L
ength
95th
(ft)
37
10
00
00
Contr
ol De
lay (s
)9.7
9.98.1
0.00.0
7.50.0
0.0La
ne LO
SA
AA
AAp
proa
ch D
elay (
s)9.7
9.90.6
0.0Ap
proa
ch LO
SA
A
Inter
secti
on S
umma
ryAv
erag
e Dela
y 1.8
Inter
secti
on C
apac
ity U
tiliza
tion
26.6%
ICU
Leve
l of S
ervic
e A
Analy
sis P
eriod
(min)
15
HC
M U
nsig
naliz
ed In
ters
ectio
n C
apac
ity A
naly
sis
9: B
ayw
ood
Dr &
Per
ry L
n5/2
2/201
5
Sync
hro 8
Rep
ort
Altur
a Apa
rtmen
ts Tr
affic
Impa
ct St
udy
Exist
ing P
M Pe
ak H
our p
lus P
rojec
tW
-Tra
ns
Move
ment
EBL
EBT
EBR
WBL
WBT
WBR
NBL
NBT
NBR
SBL
SBT
SBR
Lane
Con
figur
ation
sVo
lume (
veh/h
)0
016
170
1729
271
290
169
1Si
gn C
ontro
lSt
opSt
opFr
eeFr
eeGr
ade
0%0%
0%0%
Peak
Hou
r Fac
tor0.9
00.9
00.9
00.9
00.9
00.9
00.9
00.9
00.9
00.9
00.9
00.9
0Ho
urly
flow
rate
(vph)
00
1819
019
3230
132
018
81
Pede
strian
sLa
ne W
idth (
ft)W
alking
Spe
ed (f
t/s)
Perce
nt Bl
ocka
geRi
ght tu
rn fla
re (v
eh)
Media
n typ
eTW
LTL
TWLT
LMe
dian s
torag
e veh
)2
2Up
strea
m sig
nal (f
t)27
0pX
, plat
oon u
nbloc
ked
vC, c
onflic
ting v
olume
422
586
9449
357
116
718
933
3vC
1, sta
ge 1
conf
vol
188
188
382
382
vC2,
stage
2 co
nf vo
l23
439
811
218
9vC
u, un
block
ed vo
l42
258
694
493
571
167
189
333
tC, s
ingle
(s)7.5
6.56.9
7.56.5
6.94.1
4.1tC
, 2 st
age (
s)6.5
5.56.5
5.5tF
(s)
3.54.0
3.33.5
4.03.3
2.22.2
p0 qu
eue f
ree %
100
100
9897
100
9898
100
cM ca
pacit
y (ve
h/h)
647
547
944
568
550
848
1382
1223
Dire
ction
, Lan
e #EB
1W
B 1
NB 1
NB 2
NB 3
SB 1
SB 2
SB 3
Volum
e Tota
l18
3832
201
133
012
564
Volum
e Left
019
320
00
00
Volum
e Righ
t18
190
032
00
1cS
H94
468
113
8217
0017
0017
0017
0017
00Vo
lume t
o Cap
acity
0.02
0.06
0.02
0.12
0.08
0.00
0.07
0.04
Queu
e Len
gth 95
th (ft
)1
42
00
00
0Co
ntrol
Delay
(s)
8.910
.67.7
0.00.0
0.00.0
0.0La
ne LO
SA
BA
Appr
oach
Dela
y (s)
8.910
.60.7
0.0Ap
proa
ch LO
SA
B
Inter
secti
on S
umma
ryAv
erag
e Dela
y 1.3
Inter
secti
on C
apac
ity U
tiliza
tion
30.4%
ICU
Leve
l of S
ervic
e A
Analy
sis P
eriod
(min)
15
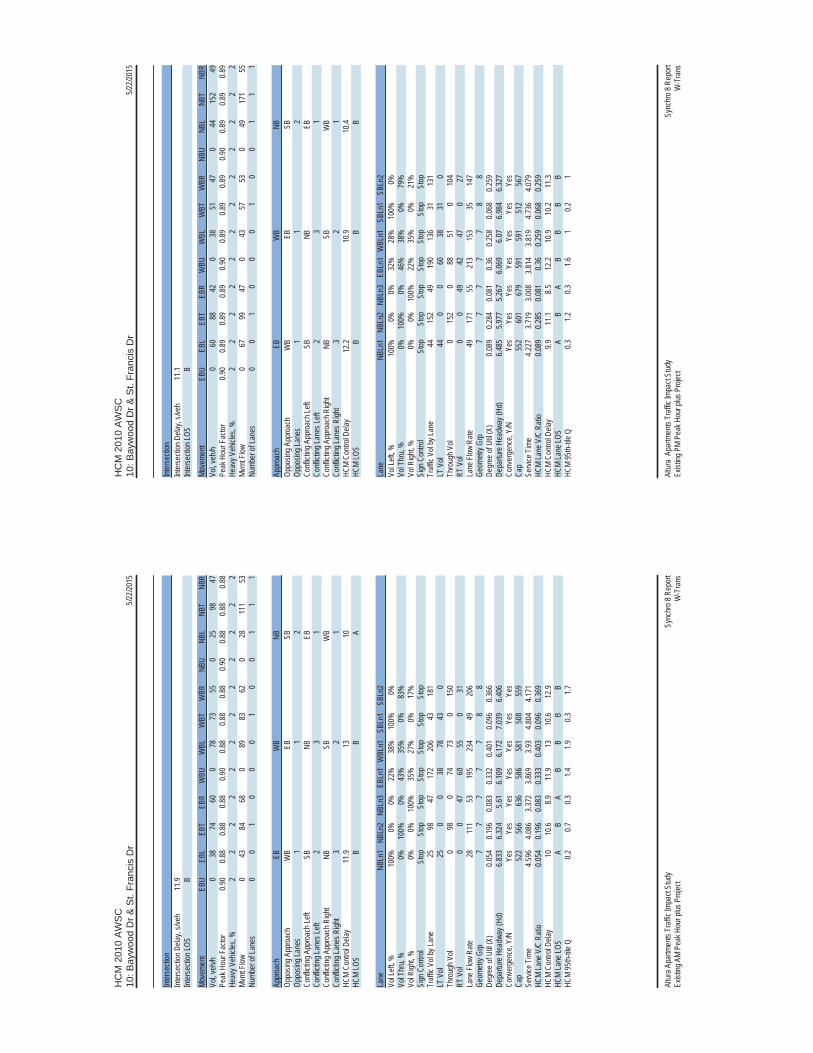
HC
M 2
010
AW
SC
10: B
ayw
ood
Dr &
St.
Fran
cis
Dr
5/22/2
015
Sync
hro 8
Rep
ort
Altur
a Apa
rtmen
ts Tr
affic
Impa
ct St
udy
Exist
ing A
M Pe
ak H
our p
lus P
rojec
tW
-Tra
ns
Inter
secti
onInt
erse
ction
Dela
y, s/v
eh11
.9Int
erse
ction
LOS
B
Move
ment
EBU
EBL
EBT
EBR
WBU
WBL
WBT
WBR
NBU
NBL
NBT
NBR
Vol, v
eh/h
038
7460
078
7355
025
9847
Peak
Hou
r Fac
tor0.9
00.8
80.8
80.8
80.9
00.8
80.8
80.8
80.9
00.8
80.8
80.8
8He
avy V
ehicl
es, %
22
22
22
22
22
22
Mvmt
Flow
043
8468
089
8362
028
111
53Nu
mber
of La
nes
00
10
00
10
01
11
Appr
oach
EBW
BNB
Oppo
sing A
ppro
ach
WB
EBSB
Oppo
sing L
anes
11
2Co
nflict
ing A
ppro
ach L
eftSB
NBEB
Confl
icting
Lane
s Left
23
1Co
nflict
ing A
ppro
ach R
ight
NBSB
WB
Confl
icting
Lane
s Righ
t3
21
HCM
Contr
ol De
lay11
.913
10HC
M LO
SB
BA
Lane
NBLn
1NB
Ln2
NBLn
3EB
Ln1
WBL
n1SB
Ln1
SBLn
2Vo
l Left
, %10
0%0%
0%22
%38
%10
0%0%
Vol T
hru,
%0%
100%
0%43
%35
%0%
83%
Vol R
ight, %
0%0%
100%
35%
27%
0%17
%Si
gn C
ontro
lSt
opSt
opSt
opSt
opSt
opSt
opSt
opTr
affic
Vol b
y Lan
e25
9847
172
206
4318
1LT
Vol
250
038
7843
0Th
roug
h Vol
098
074
730
150
RT V
ol0
047
6055
031
Lane
Flow
Rate
2811
153
195
234
4920
6Ge
ometr
y Grp
77
77
78
8De
gree
of U
til (X
)0.0
540.1
960.0
830.3
320.4
010.0
960.3
66De
partu
re H
eadw
ay (H
d)6.8
336.3
245.6
16.1
096.1
727.0
396.4
06Co
nver
genc
e, Y/
NYe
sYe
sYe
sYe
sYe
sYe
sYe
sCa
p52
256
663
658
658
150
855
9Se
rvice
Tim
e4.5
964.0
863.3
723.8
693.9
34.8
044.1
71HC
M La
ne V
/C R
atio
0.054
0.196
0.083
0.333
0.403
0.096
0.369
HCM
Contr
ol De
lay10
10.6
8.911
.913
10.6
12.9
HCM
Lane
LOS
AB
AB
BB
BHC
M 95
th-tile
Q0.2
0.70.3
1.41.9
0.31.7
HC
M 2
010
AW
SC
10: B
ayw
ood
Dr &
St.
Fran
cis
Dr
5/22/2
015
Sync
hro 8
Rep
ort
Altur
a Ap
artm
ents
Traff
ic Im
pact
Stud
y Ex
isting
PM
Peak
Hou
r plus
Pro
ject
W-T
rans
Inter
secti
onInt
erse
ction
Dela
y, s/v
eh11
.1Int
erse
ction
LOS
B
Move
ment
EBU
EBL
EBT
EBR
WBU
WBL
WBT
WBR
NBU
NBL
NBT
NBR
Vol, v
eh/h
060
8842
038
5147
044
152
49Pe
ak H
our F
actor
0.90
0.89
0.89
0.89
0.90
0.89
0.89
0.89
0.90
0.89
0.89
0.89
Heav
y Veh
icles
, %2
22
22
22
22
22
2Mv
mt F
low0
6799
470
4357
530
4917
155
Numb
er of
Lane
s0
01
00
01
00
11
1
Appr
oach
EBW
BNB
Oppo
sing A
ppro
ach
WB
EBSB
Oppo
sing L
anes
11
2Co
nflict
ing A
ppro
ach L
eftSB
NBEB
Confl
icting
Lane
s Left
23
1Co
nflict
ing A
ppro
ach R
ight
NBSB
WB
Confl
icting
Lane
s Righ
t3
21
HCM
Contr
ol De
lay12
.210
.910
.4HC
M LO
SB
BB
Lane
NBLn
1NB
Ln2
NBLn
3EB
Ln1
WBL
n1SB
Ln1
SBLn
2Vo
l Left
, %10
0%0%
0%32
%28
%10
0%0%
Vol T
hru,
%0%
100%
0%46
%38
%0%
79%
Vol R
ight, %
0%0%
100%
22%
35%
0%21
%Si
gn C
ontro
lSt
opSt
opSt
opSt
opSt
opSt
opSt
opTr
affic
Vol b
y Lan
e44
152
4919
013
631
131
LT V
ol44
00
6038
310
Thro
ugh V
ol0
152
088
510
104
RT V
ol0
049
4247
027
Lane
Flow
Rate
4917
155
213
153
3514
7Ge
ometr
y Grp
77
77
78
8De
gree
of U
til (X
)0.0
890.2
840.0
810.3
60.2
580.0
680.2
59De
partu
re H
eadw
ay (H
d)6.4
855.9
775.2
676.0
696.0
76.9
846.3
27Co
nver
genc
e, Y/
NYe
sYe
sYe
sYe
sYe
sYe
sYe
sCa
p55
260
167
959
159
151
256
7Se
rvice
Tim
e4.2
273.7
193.0
083.8
143.8
194.7
364.0
79HC
M La
ne V
/C R
atio
0.089
0.285
0.081
0.36
0.259
0.068
0.259
HCM
Contr
ol De
lay9.9
11.1
8.512
.210
.910
.211
.3HC
M La
ne LO
SA
BA
BB
BB
HCM
95th-
tile Q
0.31.2
0.31.6
10.2
1

HC
M 2
010
AW
SC
10: B
ayw
ood
Dr &
St.
Fran
cis
Dr
5/22/2
015
Sync
hro 8
Rep
ort
Altur
a Ap
artm
ents
Traff
ic Im
pact
Stud
y Ex
isting
AM
Peak
Hou
r plus
Pro
ject
W-T
rans
Inter
secti
onInt
erse
ction
Dela
y, s/v
ehInt
erse
ction
LOS
Move
ment
SBU
SBL
SBT
SBR
Vol, v
eh/h
043
150
31Pe
ak H
our F
actor
0.90
0.88
0.88
0.88
Heav
y Veh
icles
, %2
22
2Mv
mt F
low0
4917
035
Numb
er of
Lane
s0
11
0
Appr
oach
SBOp
posin
g App
roac
hNB
Oppo
sing L
anes
3Co
nflict
ing A
ppro
ach L
eftW
BCo
nflict
ing La
nes L
eft1
Confl
icting
App
roac
h Righ
tEB
Confl
icting
Lane
s Righ
t1
HCM
Contr
ol De
lay12
.5HC
M LO
SB
Lane
HC
M 2
010
AW
SC
10: B
ayw
ood
Dr &
St.
Fran
cis
Dr
5/22/2
015
Sync
hro 8
Rep
ort
Altur
a Ap
artm
ents
Traff
ic Im
pact
Stud
y Ex
isting
PM
Peak
Hou
r plus
Pro
ject
W-T
rans
Inter
secti
onInt
erse
ction
Dela
y, s/v
ehInt
erse
ction
LOS
Move
ment
SBU
SBL
SBT
SBR
Vol, v
eh/h
031
104
27Pe
ak H
our F
actor
0.90
0.89
0.89
0.89
Heav
y Veh
icles
, %2
22
2Mv
mt F
low0
3511
730
Numb
er of
Lane
s0
11
0
Appr
oach
SBOp
posin
g App
roac
hNB
Oppo
sing L
anes
3Co
nflict
ing A
ppro
ach L
eftW
BCo
nflict
ing La
nes L
eft1
Confl
icting
App
roac
h Righ
tEB
Confl
icting
Lane
s Righ
t1
HCM
Contr
ol De
lay11
.1HC
M LO
SB
Lane
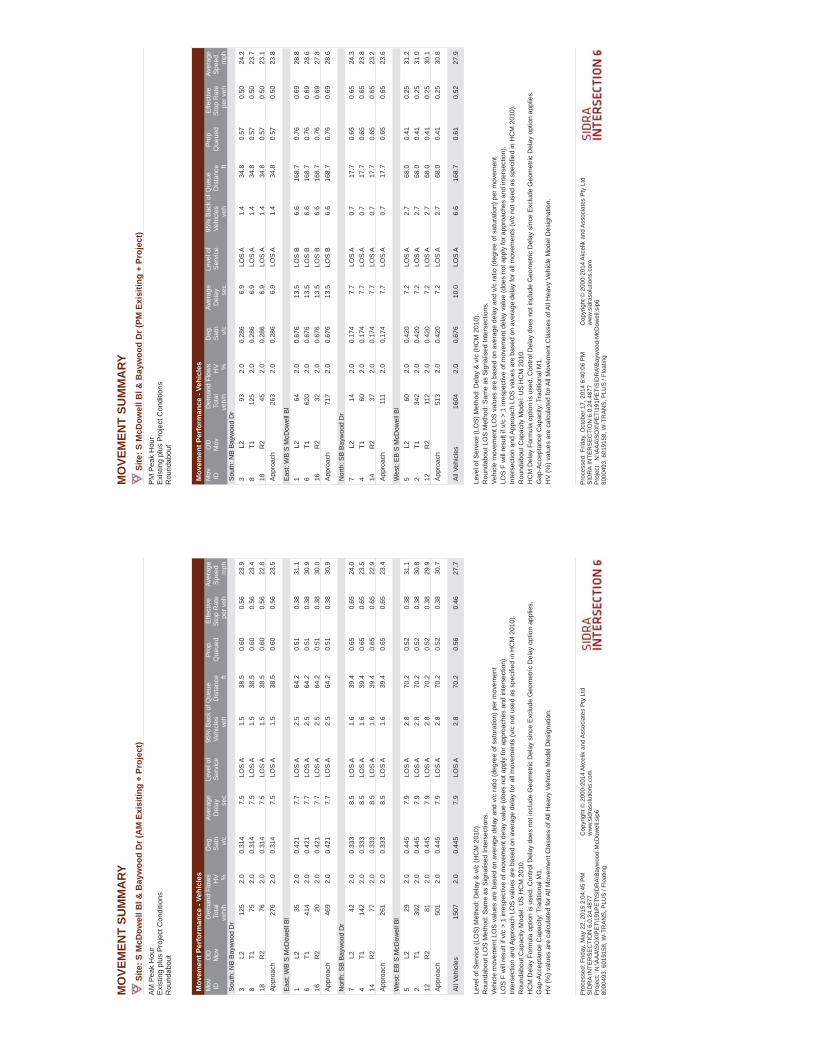
MO
VEM
ENT
SUM
MA
RYSi
te:S
McD
owel
l Bl &
Bay
woo
d D
r (A
M E
xisi
ting
+ Pr
ojec
t) A
M P
eak
Hou
rE
xist
ing
plus
Pro
ject
Con
ditio
nsR
ound
abou
t
Mov
emen
t Per
form
ance
-Ve
hicl
esD
eman
d Fl
ows
95%
Bac
k of
Que
ueM
ov IDO
DM
ovD
eg.
Satn
Aver
age
Del
ay
Leve
l of
Serv
ice
Prop
. Q
ueue
dEf
fect
ive
Stop
Rat
eAv
erag
eSp
eed
To
tal
HV
Vehi
cles
Dis
tanc
eve
h/h
%v/
cse
cve
hft
per v
ehm
phSo
uth:
NB
Bay
woo
d D
r3
L212
52.
00.
314
7.5
LOS
A1.
538
.50.
600.
5623
.98
T175
2.0
0.31
47.
5LO
S A
1.5
38.5
0.60
0.56
23.4
18R
276
2.0
0.31
47.
5LO
S A
1.5
38.5
0.60
0.56
22.8
Appr
oach
276
2.0
0.31
47.
5LO
S A
1.5
38.5
0.60
0.56
23.5
East
: WB
S M
cDow
ell B
l1
L235
2.0
0.42
17.
7LO
S A
2.5
64.2
0.51
0.38
31.1
6T1
414
2.0
0.42
17.
7LO
S A
2.5
64.2
0.51
0.38
30.9
16R
220
2.0
0.42
17.
7LO
S A
2.5
64.2
0.51
0.38
30.0
Appr
oach
469
2.0
0.42
17.
7LO
S A
2.5
64.2
0.51
0.38
30.9
Nor
th: S
B B
ayw
ood
Dr
7L2
422.
00.
333
8.5
LOS
A1.
639
.40.
650.
6524
.04
T114
22.
00.
333
8.5
LOS
A1.
639
.40.
650.
6523
.514
R2
772.
00.
333
8.5
LOS
A1.
639
.40.
650.
6522
.9Ap
proa
ch26
12.
00.
333
8.5
LOS
A1.
639
.40.
650.
6523
.4
Wes
t: E
B S
McD
owel
l Bl
5L2
292.
00.
445
7.9
LOS
A2.
870
.20.
520.
3831
.12
T139
22.
00.
445
7.9
LOS
A2.
870
.20.
520.
3830
.812
R2
812.
00.
445
7.9
LOS
A2.
870
.20.
520.
3829
.9Ap
proa
ch50
12.
00.
445
7.9
LOS
A2.
870
.20.
520.
3830
.7
All V
ehic
les
1507
2.0
0.44
57.
9LO
S A
2.8
70.2
0.56
0.46
27.7
Leve
l of S
ervi
ce (L
OS)
Met
hod:
Del
ay &
v/c
(HC
M 2
010)
. R
ound
abou
t LO
S M
etho
d: S
ame
as S
igna
lised
Inte
rsec
tions
.Ve
hicl
e m
ovem
ent L
OS
val
ues
are
base
d on
ave
rage
del
ay a
nd v
/c ra
tio (d
egre
e of
sat
urat
ion)
per
mov
emen
tLO
S F
will
resu
lt if
v/c
> 1
irres
pect
ive
of m
ovem
ent d
elay
val
ue (d
oes
not a
pply
for a
ppro
ache
s an
d in
ters
ectio
n).
Inte
rsec
tion
and
Appr
oach
LO
S va
lues
are
bas
ed o
n av
erag
e de
lay
for a
ll m
ovem
ents
(v/c
not
use
d as
spe
cifie
d in
HC
M 2
010)
.R
ound
abou
t Cap
acity
Mod
el: U
S H
CM
201
0.H
CM
Del
ay F
orm
ula
optio
n is
use
d. C
ontro
l Del
ay d
oes
not i
nclu
de G
eom
etric
Del
ay s
ince
Exc
lude
Geo
met
ric D
elay
opt
ion
appl
ies.
Gap
-Acc
epta
nce
Cap
acity
: Tra
ditio
nal M
1.H
V (%
) val
ues
are
calc
ulat
ed fo
r All
Mov
emen
t Cla
sses
of A
ll H
eavy
Veh
icle
Mod
el D
esig
natio
n.
Pro
cess
ed: F
riday
, May
22,
201
5 2:
04:4
5 P
MS
IDR
A IN
TER
SEC
TIO
N 6
.0.2
4.48
77C
opyr
ight
© 2
000-
2014
Akc
elik
and
Ass
ocia
tes
Pty
Ltd
ww
w.s
idra
solu
tions
.com
Pro
ject
: N
:\AAA
\SO
X\PE
T\19
1PET
\SID
RA\
Bayw
ood-
McD
owel
l.sip
680
0049
3, 6
0191
58, W
-TR
ANS
, PLU
S /
Floa
ting
MO
VEM
ENT
SUM
MA
RYSi
te:S
McD
owel
l Bl &
Bay
woo
d D
r (PM
Exi
sitin
g +
Proj
ect)
PM
Pea
k H
our
Exi
stin
g pl
us P
roje
ct C
ondi
tions
Rou
ndab
out
Mov
emen
t Per
form
ance
-Ve
hicl
esD
eman
d Fl
ows
95%
Bac
k of
Que
ueM
ov IDO
DM
ovD
eg.
Satn
Aver
age
Del
ay
Leve
l of
Serv
ice
Prop
. Q
ueue
dEf
fect
ive
Stop
Rat
eAv
erag
eSp
eed
To
tal
HV
Vehi
cles
Dis
tanc
eve
h/h
%v/
cse
cve
hft
per v
ehm
phSo
uth:
NB
Bay
woo
d D
r3
L293
2.0
0.28
66.
9LO
S A
1.4
34.8
0.57
0.50
24.2
8T1
125
2.0
0.28
66.
9LO
S A
1.4
34.8
0.57
0.50
23.7
18R
245
2.0
0.28
66.
9LO
S A
1.4
34.8
0.57
0.50
23.1
Appr
oach
263
2.0
0.28
66.
9LO
S A
1.4
34.8
0.57
0.50
23.8
East
: WB
S M
cDow
ell B
l1
L264
2.0
0.67
613
.5LO
S B
6.6
168.
70.
760.
6928
.86
T162
02.
00.
676
13.5
LOS
B6.
616
8.7
0.76
0.69
28.6
16R
232
2.0
0.67
613
.5LO
S B
6.6
168.
70.
760.
6927
.8Ap
proa
ch71
72.
00.
676
13.5
LOS
B6.
616
8.7
0.76
0.69
28.6
Nor
th: S
B B
ayw
ood
Dr
7L2
142.
00.
174
7.7
LOS
A0.
717
.70.
650.
6524
.34
T160
2.0
0.17
47.
7LO
S A
0.7
17.7
0.65
0.65
23.8
14R
237
2.0
0.17
47.
7LO
S A
0.7
17.7
0.65
0.65
23.2
Appr
oach
111
2.0
0.17
47.
7LO
S A
0.7
17.7
0.65
0.65
23.6
Wes
t: E
B S
McD
owel
l Bl
5L2
602.
00.
420
7.2
LOS
A2.
768
.00.
410.
2531
.22
T134
22.
00.
420
7.2
LOS
A2.
768
.00.
410.
2531
.012
R2
112
2.0
0.42
07.
2LO
S A
2.7
68.0
0.41
0.25
30.1
Appr
oach
513
2.0
0.42
07.
2LO
S A
2.7
68.0
0.41
0.25
30.8
All V
ehic
les
1604
2.0
0.67
610
.0LO
S A
6.6
168.
70.
610.
5227
.9
Leve
l of S
ervi
ce (L
OS)
Met
hod:
Del
ay &
v/c
(HC
M 2
010)
. R
ound
abou
t LO
S M
etho
d: S
ame
as S
igna
lised
Inte
rsec
tions
.Ve
hicl
e m
ovem
ent L
OS
val
ues
are
base
d on
ave
rage
del
ay a
nd v
/c ra
tio (d
egre
e of
sat
urat
ion)
per
mov
emen
tLO
S F
will
resu
lt if
v/c
> 1
irres
pect
ive
of m
ovem
ent d
elay
val
ue (d
oes
not a
pply
for a
ppro
ache
s an
d in
ters
ectio
n).
Inte
rsec
tion
and
Appr
oach
LO
S va
lues
are
bas
ed o
n av
erag
e de
lay
for a
ll m
ovem
ents
(v/c
not
use
d as
spe
cifie
d in
HC
M 2
010)
.R
ound
abou
t Cap
acity
Mod
el: U
S H
CM
201
0.H
CM
Del
ay F
orm
ula
optio
n is
use
d. C
ontro
l Del
ay d
oes
not i
nclu
de G
eom
etric
Del
ay s
ince
Exc
lude
Geo
met
ric D
elay
opt
ion
appl
ies.
Gap
-Acc
epta
nce
Cap
acity
: Tra
ditio
nal M
1.H
V (%
) val
ues
are
calc
ulat
ed fo
r All
Mov
emen
t Cla
sses
of A
ll H
eavy
Veh
icle
Mod
el D
esig
natio
n.
Pro
cess
ed: F
riday
, Oct
ober
17,
201
4 6:
40:0
6 PM
SID
RA
INTE
RSE
CTI
ON
6.0
.24.
4877
Cop
yrig
ht ©
200
0-20
14 A
kcel
ik a
nd A
ssoc
iate
s Pt
y Lt
dw
ww
.sid
raso
lutio
ns.c
omP
roje
ct:
N:\A
AA\S
OX\
PET\
191P
ET\S
IDR
A\Ba
ywoo
d-M
cDow
ell.s
ip6
8000
493,
601
9158
, W-T
RAN
S, P
LUS
/ Fl
oatin
g

HC
M S
igna
lized
Inte
rsec
tion
Cap
acity
Ana
lysi
s1:
Was
hing
ton
St &
Lak
evill
e S
t7/1
/2015
Bayw
ood A
partm
ents
Traff
ic Im
pact
Stud
ySy
nchr
o 8 R
epor
tBa
selin
e AM
Peak
Hou
r plus
Pro
ject
W-T
rans
Move
ment
EBL
EBT
EBR
WBL
WBT
WBR
NBL
NBT
NBR
SBL
SBT
SBR
Lane
Con
figur
ation
sVo
lume (
vph)
3323
426
229
204
101
2760
918
111
967
845
Ideal
Flow
(vphp
l)19
0019
0019
0019
0019
0019
0019
0019
0019
0019
0019
0019
00To
tal Lo
st tim
e (s)
4.24.2
4.24.0
4.24.0
4.2La
ne U
til. F
actor
1.00
1.00
1.00
1.00
0.95
1.00
0.95
Frpb
, ped
/bike
s1.0
01.0
00.9
91.0
00.9
81.0
01.0
0Flp
b, pe
d/bike
s1.0
01.0
01.0
01.0
01.0
01.0
01.0
0Fr
t0.9
91.0
00.9
51.0
00.9
71.0
00.9
9Flt
Pro
tected
0.99
0.95
1.00
0.95
1.00
0.95
1.00
Satd.
Flow
(pro
t)17
1717
7016
5417
7033
5117
7034
97Flt
Per
mitte
d0.9
90.9
51.0
00.9
51.0
00.9
51.0
0Sa
td. F
low (p
erm)
1717
1770
1654
1770
3351
1770
3497
Peak
-hou
r fac
tor, P
HF0.9
10.9
10.9
10.9
10.9
10.9
10.9
10.9
10.9
10.9
10.9
10.9
1Ad
j. Flow
(vph
)36
257
2925
222
411
130
669
199
131
745
49RT
OR R
educ
tion (
vph)
00
00
120
019
00
30
Lane
Gro
up F
low (v
ph)
032
20
252
323
030
849
013
179
10
Confl
. Ped
s. (#
/hr)
67
76
418
184
Confl
. Bike
s (#/h
r)8
1320
12He
avy V
ehicl
es (%
)2%
10%
2%2%
11%
2%2%
2%2%
2%2%
2%Tu
rn T
ype
Split
NASp
litNA
Prot
NAPr
otNA
Prote
cted P
hase
s7
78
85
21
6Pe
rmitte
d Pha
ses
Actua
ted G
reen
, G (s
)27
.629
.329
.34.4
44.0
13.1
52.7
Effec
tive G
reen
, g (s
)27
.629
.329
.34.4
44.0
13.1
52.7
Actua
ted g/
C Ra
tio0.2
10.2
20.2
20.0
30.3
40.1
00.4
0Cl
eara
nce T
ime (
s)4.2
4.24.2
4.04.2
4.04.2
Vehic
le Ex
tensio
n (s)
2.52.5
2.52.0
4.02.0
4.0La
ne G
rp C
ap (v
ph)
362
397
371
5911
2817
714
11v/s
Rati
o Pro
tc0
.190.1
4c0
.200.0
2c0
.25c0
.070.2
3v/s
Rati
o Per
mv/c
Rati
o0.8
90.6
30.8
70.5
10.7
50.7
40.5
6Un
iform
Dela
y, d1
50.0
45.8
48.8
62.0
38.5
57.1
30.0
Prog
ress
ion F
actor
1.00
1.00
1.00
1.00
1.00
1.00
1.00
Incre
menta
l Dela
y, d2
22.2
2.918
.82.5
3.113
.50.6
Delay
(s)
72.3
48.7
67.6
64.5
41.5
70.6
30.6
Leve
l of S
ervic
eE
DE
ED
EC
Appr
oach
Dela
y (s)
72.3
59.5
42.3
36.3
Appr
oach
LOS
EE
DD
Inter
secti
on S
umma
ryHC
M 20
00 C
ontro
l Dela
y47
.5HC
M 20
00 Le
vel o
f Ser
vice
DHC
M 20
00 V
olume
to C
apac
ity ra
tio0.8
1Ac
tuated
Cyc
le Le
ngth
(s)
130.6
Sum
of los
t time
(s)
16.6
Inter
secti
on C
apac
ity U
tiliza
tion
79.3%
ICU
Leve
l of S
ervic
eD
Analy
sis P
eriod
(min)
15c
Criti
cal L
ane G
roup
HC
M S
igna
lized
Inte
rsec
tion
Cap
acity
Ana
lysi
s1:
Was
hing
ton
St &
Lak
evill
e S
t7/1
/2015
Bayw
ood A
partm
ents
Traff
ic Im
pact
Stud
ySy
nchr
o 8 R
epor
tBa
selin
e PM
Peak
Hou
r plus
Pro
ject
W-T
rans
Move
ment
EBL
EBT
EBR
WBL
WBT
WBR
NBL
NBT
NBR
SBL
SBT
SBR
Lane
Con
figur
ation
sVo
lume (
vph)
6017
946
268
228
137
6188
520
812
789
459
Ideal
Flow
(vphp
l)19
0019
0019
0019
0019
0019
0019
0019
0019
0019
0019
0019
00To
tal Lo
st tim
e (s)
4.24.2
4.24.0
4.24.0
4.2La
ne U
til. F
actor
1.00
1.00
1.00
1.00
0.95
1.00
0.95
Frpb
, ped
/bike
s0.9
91.0
00.9
81.0
00.9
81.0
01.0
0Flp
b, pe
d/bike
s1.0
01.0
01.0
01.0
01.0
01.0
01.0
0Fr
t0.9
81.0
00.9
41.0
00.9
71.0
00.9
9Flt
Pro
tected
0.99
0.95
1.00
0.95
1.00
0.95
1.00
Satd.
Flow
(pro
t)17
4617
7016
6717
7033
5717
7034
95Flt
Per
mitte
d0.9
90.9
51.0
00.9
51.0
00.9
51.0
0Sa
td. F
low (p
erm)
1746
1770
1667
1770
3357
1770
3495
Peak
-hou
r fac
tor, P
HF0.9
60.9
60.9
60.9
60.9
60.9
60.9
60.9
60.9
60.9
60.9
60.9
6Ad
j. Flow
(vph
)62
186
4827
923
814
364
922
217
132
931
61RT
OR R
educ
tion (
vph)
00
00
150
013
00
30
Lane
Gro
up F
low (v
ph)
029
60
279
366
064
1126
013
298
90
Confl
. Ped
s. (#
/hr)
2818
1828
732
327
Confl
. Bike
s (#/h
r)8
1320
12He
avy V
ehicl
es (%
)2%
6%2%
2%7%
2%2%
2%2%
2%2%
2%Tu
rn T
ype
Split
NASp
litNA
Prot
NAPr
otNA
Prote
cted P
hase
s7
78
85
21
6Pe
rmitte
d Pha
ses
Actua
ted G
reen
, G (s
)25
.833
.333
.310
.151
.413
.755
.0Ef
fectiv
e Gre
en, g
(s)
25.8
33.3
33.3
10.1
51.4
13.7
55.0
Actua
ted g/
C Ra
tio0.1
80.2
40.2
40.0
70.3
70.1
00.3
9Cl
eara
nce T
ime (
s)4.2
4.24.2
4.04.2
4.04.2
Vehic
le Ex
tensio
n (s)
2.52.5
2.52.0
4.02.0
4.0La
ne G
rp C
ap (v
ph)
319
418
394
126
1225
172
1365
v/s R
atio P
rot
c0.17
0.16
c0.22
0.04
c0.34
0.07
c0.28
v/s R
atio P
erm
v/c R
atio
0.93
0.67
0.93
0.51
0.92
0.77
0.72
Unifo
rm D
elay,
d156
.648
.752
.663
.042
.762
.036
.5Pr
ogre
ssion
Fac
tor1.0
01.0
01.0
01.0
01.0
01.0
01.0
0Inc
reme
ntal D
elay,
d231
.93.6
27.7
1.211
.116
.72.1
Delay
(s)
88.5
52.3
80.3
64.1
53.9
78.7
38.5
Leve
l of S
ervic
eF
DF
ED
ED
Appr
oach
Dela
y (s)
88.5
68.5
54.4
43.2
Appr
oach
LOS
FE
DD
Inter
secti
on S
umma
ryHC
M 20
00 C
ontro
l Dela
y56
.5HC
M 20
00 Le
vel o
f Ser
vice
EHC
M 20
00 V
olume
to C
apac
ity ra
tio0.9
1Ac
tuated
Cyc
le Le
ngth
(s)
140.8
Sum
of los
t time
(s)
16.6
Inter
secti
on C
apac
ity U
tiliza
tion
95.4%
ICU
Leve
l of S
ervic
eF
Analy
sis P
eriod
(min)
15c
Criti
cal L
ane G
roup
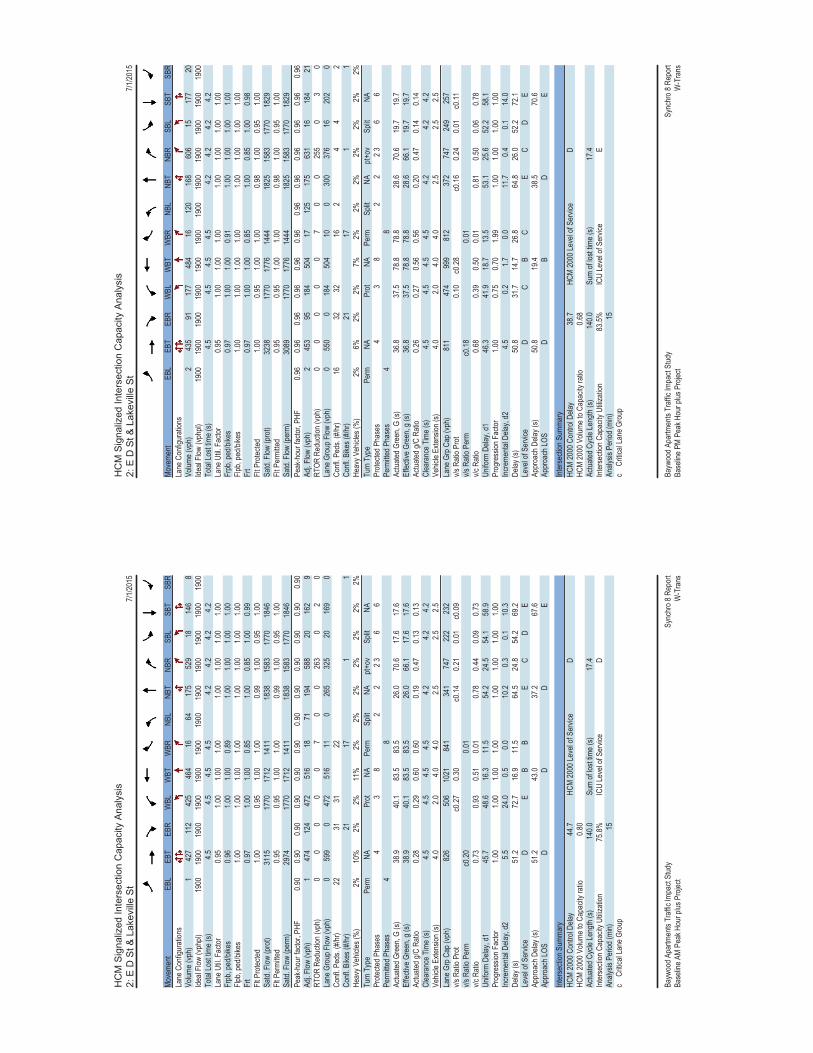
HC
M S
igna
lized
Inte
rsec
tion
Cap
acity
Ana
lysi
s2:
E D
St &
Lak
evill
e S
t7/1
/2015
Bayw
ood A
partm
ents
Traff
ic Im
pact
Stud
ySy
nchr
o 8 R
epor
tBa
selin
e AM
Peak
Hou
r plus
Pro
ject
W-T
rans
Move
ment
EBL
EBT
EBR
WBL
WBT
WBR
NBL
NBT
NBR
SBL
SBT
SBR
Lane
Con
figur
ation
sVo
lume (
vph)
142
711
242
546
416
6417
552
918
146
8Ide
al Flo
w (vp
hpl)
1900
1900
1900
1900
1900
1900
1900
1900
1900
1900
1900
1900
Total
Lost
time (
s)4.5
4.54.5
4.54.2
4.24.2
4.2La
ne U
til. F
actor
0.95
1.00
1.00
1.00
1.00
1.00
1.00
1.00
Frpb
, ped
/bike
s0.9
61.0
01.0
00.8
91.0
01.0
01.0
01.0
0Flp
b, pe
d/bike
s1.0
01.0
01.0
01.0
01.0
01.0
01.0
01.0
0Fr
t0.9
71.0
01.0
00.8
51.0
00.8
51.0
00.9
9Flt
Pro
tected
1.00
0.95
1.00
1.00
0.99
1.00
0.95
1.00
Satd.
Flow
(pro
t)31
1517
7017
1214
1118
3815
8317
7018
46Flt
Per
mitte
d0.9
50.9
51.0
01.0
00.9
91.0
00.9
51.0
0Sa
td. F
low (p
erm)
2974
1770
1712
1411
1838
1583
1770
1846
Peak
-hou
r fac
tor, P
HF0.9
00.9
00.9
00.9
00.9
00.9
00.9
00.9
00.9
00.9
00.9
00.9
0Ad
j. Flow
(vph
)1
474
124
472
516
1871
194
588
2016
29
RTOR
Red
uctio
n (vp
h)0
00
00
70
026
30
20
Lane
Gro
up F
low (v
ph)
059
90
472
516
110
265
325
2016
90
Confl
. Ped
s. (#
/hr)
2231
3122
Confl
. Bike
s (#/h
r)21
171
1He
avy V
ehicl
es (%
)2%
10%
2%2%
11%
2%2%
2%2%
2%2%
2%Tu
rn T
ype
Perm
NAPr
otNA
Perm
Split
NApt+
ovSp
litNA
Prote
cted P
hase
s4
38
22
2 36
6Pe
rmitte
d Pha
ses
48
Actua
ted G
reen
, G (s
)38
.940
.183
.583
.526
.070
.617
.617
.6Ef
fectiv
e Gre
en, g
(s)
38.9
40.1
83.5
83.5
26.0
66.1
17.6
17.6
Actua
ted g/
C Ra
tio0.2
80.2
90.6
00.6
00.1
90.4
70.1
30.1
3Cl
eara
nce T
ime (
s)4.5
4.54.5
4.54.2
4.24.2
Vehic
le Ex
tensio
n (s)
4.02.0
4.04.0
2.52.5
2.5La
ne G
rp C
ap (v
ph)
826
506
1021
841
341
747
222
232
v/s R
atio P
rot
c0.27
0.30
c0.14
0.21
0.01
c0.09
v/s R
atio P
erm
c0.20
0.01
v/c R
atio
0.73
0.93
0.51
0.01
0.78
0.44
0.09
0.73
Unifo
rm D
elay,
d145
.748
.616
.311
.554
.224
.554
.158
.9Pr
ogre
ssion
Fac
tor1.0
01.0
01.0
01.0
01.0
01.0
01.0
01.0
0Inc
reme
ntal D
elay,
d25.5
24.0
0.50.0
10.2
0.30.1
10.3
Delay
(s)
51.2
72.7
16.9
11.5
64.5
24.8
54.2
69.2
Leve
l of S
ervic
eD
EB
BE
CD
EAp
proa
ch D
elay (
s)51
.243
.037
.267
.6Ap
proa
ch LO
SD
DD
E
Inter
secti
on S
umma
ryHC
M 20
00 C
ontro
l Dela
y44
.7HC
M 20
00 Le
vel o
f Ser
vice
DHC
M 20
00 V
olume
to C
apac
ity ra
tio0.8
0Ac
tuated
Cyc
le Le
ngth
(s)
140.0
Sum
of los
t time
(s)
17.4
Inter
secti
on C
apac
ity U
tiliza
tion
75.8%
ICU
Leve
l of S
ervic
eD
Analy
sis P
eriod
(min)
15c
Criti
cal L
ane G
roup
HC
M S
igna
lized
Inte
rsec
tion
Cap
acity
Ana
lysi
s2:
E D
St &
Lak
evill
e S
t7/1
/2015
Bayw
ood A
partm
ents
Traff
ic Im
pact
Stud
ySy
nchr
o 8 R
epor
tBa
selin
e PM
Peak
Hou
r plus
Pro
ject
W-T
rans
Move
ment
EBL
EBT
EBR
WBL
WBT
WBR
NBL
NBT
NBR
SBL
SBT
SBR
Lane
Con
figur
ation
sVo
lume (
vph)
243
591
177
484
1612
016
860
615
177
20Ide
al Flo
w (vp
hpl)
1900
1900
1900
1900
1900
1900
1900
1900
1900
1900
1900
1900
Total
Lost
time (
s)4.5
4.54.5
4.54.2
4.24.2
4.2La
ne U
til. F
actor
0.95
1.00
1.00
1.00
1.00
1.00
1.00
1.00
Frpb
, ped
/bike
s0.9
71.0
01.0
00.9
11.0
01.0
01.0
01.0
0Flp
b, pe
d/bike
s1.0
01.0
01.0
01.0
01.0
01.0
01.0
01.0
0Fr
t0.9
71.0
01.0
00.8
51.0
00.8
51.0
00.9
8Flt
Pro
tected
1.00
0.95
1.00
1.00
0.98
1.00
0.95
1.00
Satd.
Flow
(pro
t)32
3817
7017
7614
4418
2515
8317
7018
29Flt
Per
mitte
d0.9
50.9
51.0
01.0
00.9
81.0
00.9
51.0
0Sa
td. F
low (p
erm)
3089
1770
1776
1444
1825
1583
1770
1829
Peak
-hou
r fac
tor, P
HF0.9
60.9
60.9
60.9
60.9
60.9
60.9
60.9
60.9
60.9
60.9
60.9
6Ad
j. Flow
(vph
)2
453
9518
450
417
125
175
631
1618
421
RTOR
Red
uctio
n (vp
h)0
00
00
70
025
50
30
Lane
Gro
up F
low (v
ph)
055
00
184
504
100
300
376
1620
20
Confl
. Ped
s. (#
/hr)
1632
3216
24
42
Confl
. Bike
s (#/h
r)21
171
1He
avy V
ehicl
es (%
)2%
6%2%
2%7%
2%2%
2%2%
2%2%
2%Tu
rn T
ype
Perm
NAPr
otNA
Perm
Split
NApt+
ovSp
litNA
Prote
cted P
hase
s4
38
22
2 36
6Pe
rmitte
d Pha
ses
48
Actua
ted G
reen
, G (s
)36
.837
.578
.878
.828
.670
.619
.719
.7Ef
fectiv
e Gre
en, g
(s)
36.8
37.5
78.8
78.8
28.6
66.1
19.7
19.7
Actua
ted g/
C Ra
tio0.2
60.2
70.5
60.5
60.2
00.4
70.1
40.1
4Cl
eara
nce T
ime (
s)4.5
4.54.5
4.54.2
4.24.2
Vehic
le Ex
tensio
n (s)
4.02.0
4.04.0
2.52.5
2.5La
ne G
rp C
ap (v
ph)
811
474
999
812
372
747
249
257
v/s R
atio P
rot
0.10
c0.28
c0.16
0.24
0.01
c0.11
v/s R
atio P
erm
c0.18
0.01
v/c R
atio
0.68
0.39
0.50
0.01
0.81
0.50
0.06
0.78
Unifo
rm D
elay,
d146
.341
.918
.713
.553
.125
.652
.258
.1Pr
ogre
ssion
Fac
tor1.0
00.7
50.7
01.9
91.0
01.0
01.0
01.0
0Inc
reme
ntal D
elay,
d24.5
0.21.7
0.011
.70.4
0.114
.0De
lay (s
)50
.831
.714
.726
.864
.826
.052
.272
.1Le
vel o
f Ser
vice
DC
BC
EC
DE
Appr
oach
Dela
y (s)
50.8
19.4
38.5
70.6
Appr
oach
LOS
DB
DE
Inter
secti
on S
umma
ryHC
M 20
00 C
ontro
l Dela
y38
.7HC
M 20
00 Le
vel o
f Ser
vice
DHC
M 20
00 V
olume
to C
apac
ity ra
tio0.6
8Ac
tuated
Cyc
le Le
ngth
(s)
140.0
Sum
of los
t time
(s)
17.4
Inter
secti
on C
apac
ity U
tiliza
tion
83.5%
ICU
Leve
l of S
ervic
eE
Analy
sis P
eriod
(min)
15c
Criti
cal L
ane G
roup
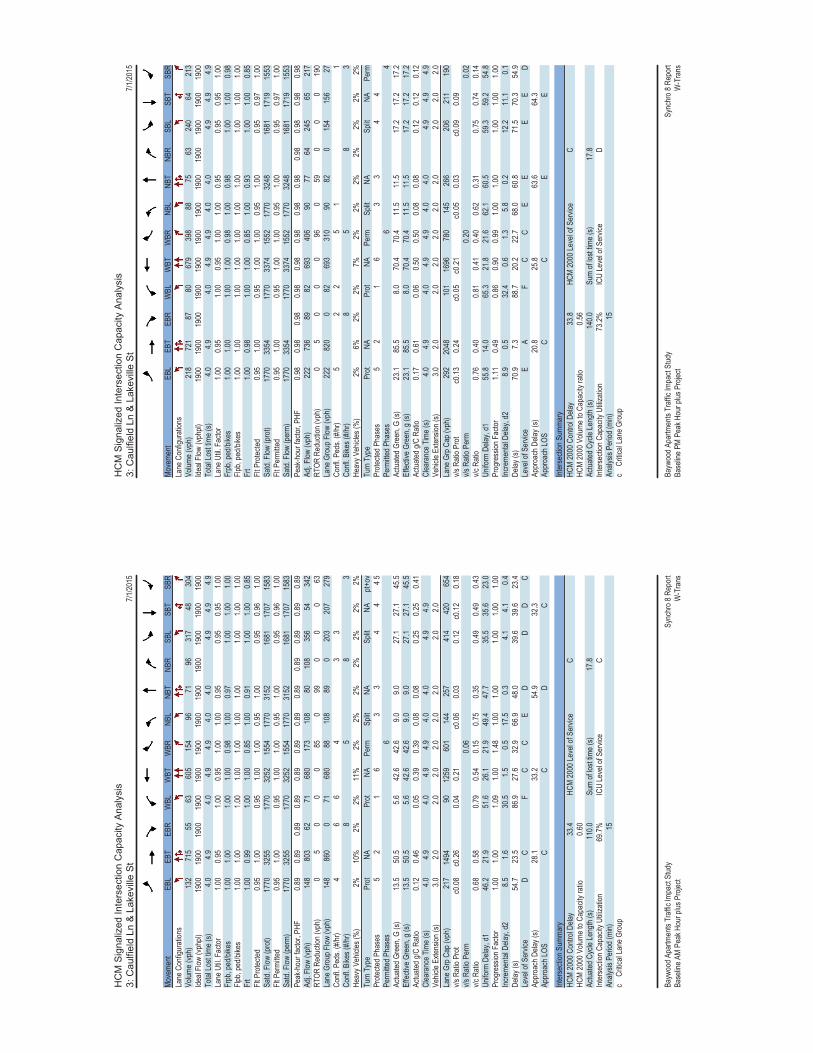
HC
M S
igna
lized
Inte
rsec
tion
Cap
acity
Ana
lysi
s3:
Cau
lfiel
d Ln
& L
akev
ille
St
7/1/20
15
Bayw
ood A
partm
ents
Traff
ic Im
pact
Stud
ySy
nchr
o 8 R
epor
tBa
selin
e AM
Peak
Hou
r plus
Pro
ject
W-T
rans
Move
ment
EBL
EBT
EBR
WBL
WBT
WBR
NBL
NBT
NBR
SBL
SBT
SBR
Lane
Con
figur
ation
sVo
lume (
vph)
132
715
5563
605
154
9671
9631
748
304
Ideal
Flow
(vphp
l)19
0019
0019
0019
0019
0019
0019
0019
0019
0019
0019
0019
00To
tal Lo
st tim
e (s)
4.04.9
4.04.9
4.94.0
4.04.9
4.94.9
Lane
Util.
Fac
tor1.0
00.9
51.0
00.9
51.0
01.0
00.9
50.9
50.9
51.0
0Fr
pb, p
ed/bi
kes
1.00
1.00
1.00
1.00
0.98
1.00
0.97
1.00
1.00
1.00
Flpb,
ped/b
ikes
1.00
1.00
1.00
1.00
1.00
1.00
1.00
1.00
1.00
1.00
Frt
1.00
0.99
1.00
1.00
0.85
1.00
0.91
1.00
1.00
0.85
Flt P
rotec
ted0.9
51.0
00.9
51.0
01.0
00.9
51.0
00.9
50.9
61.0
0Sa
td. F
low (p
rot)
1770
3255
1770
3252
1554
1770
3152
1681
1707
1583
Flt P
ermi
tted
0.95
1.00
0.95
1.00
1.00
0.95
1.00
0.95
0.96
1.00
Satd.
Flow
(per
m)17
7032
5517
7032
5215
5417
7031
5216
8117
0715
83Pe
ak-h
our f
actor
, PHF
0.89
0.89
0.89
0.89
0.89
0.89
0.89
0.89
0.89
0.89
0.89
0.89
Adj. F
low (v
ph)
148
803
6271
680
173
108
8010
835
654
342
RTOR
Red
uctio
n (vp
h)0
50
00
850
990
00
63La
ne G
roup
Flow
(vph
)14
886
00
7168
088
108
890
203
207
279
Confl
. Ped
s. (#
/hr)
46
64
33
Confl
. Bike
s (#/h
r)8
58
3He
avy V
ehicl
es (%
)2%
10%
2%2%
11%
2%2%
2%2%
2%2%
2%Tu
rn T
ype
Prot
NAPr
otNA
Perm
Split
NASp
litNA
pt+ov
Prote
cted P
hase
s5
21
63
34
44 5
Perm
itted P
hase
s6
Actua
ted G
reen
, G (s
)13
.550
.55.6
42.6
42.6
9.09.0
27.1
27.1
45.5
Effec
tive G
reen
, g (s
)13
.550
.55.6
42.6
42.6
9.09.0
27.1
27.1
45.5
Actua
ted g/
C Ra
tio0.1
20.4
60.0
50.3
90.3
90.0
80.0
80.2
50.2
50.4
1Cl
eara
nce T
ime (
s)4.0
4.94.0
4.94.9
4.04.0
4.94.9
Vehic
le Ex
tensio
n (s)
3.02.0
2.02.0
2.02.0
2.02.0
2.0La
ne G
rp C
ap (v
ph)
217
1494
9012
5960
114
425
741
442
065
4v/s
Rati
o Pro
tc0
.08c0
.260.0
40.2
1c0
.060.0
30.1
2c0
.120.1
8v/s
Rati
o Per
m0.0
6v/c
Rati
o0.6
80.5
80.7
90.5
40.1
50.7
50.3
50.4
90.4
90.4
3Un
iform
Dela
y, d1
46.2
21.9
51.6
26.1
21.9
49.4
47.7
35.5
35.6
23.0
Prog
ress
ion F
actor
1.00
1.00
1.09
1.00
1.48
1.00
1.00
1.00
1.00
1.00
Incre
menta
l Dela
y, d2
8.51.6
30.5
1.50.5
17.5
0.34.1
4.10.4
Delay
(s)
54.7
23.5
86.9
27.6
32.9
66.9
48.0
39.6
39.6
23.4
Leve
l of S
ervic
eD
CF
CC
ED
DD
CAp
proa
ch D
elay (
s)28
.133
.254
.932
.3Ap
proa
ch LO
SC
CD
C
Inter
secti
on S
umma
ryHC
M 20
00 C
ontro
l Dela
y33
.4HC
M 20
00 Le
vel o
f Ser
vice
CHC
M 20
00 V
olume
to C
apac
ity ra
tio0.6
0Ac
tuated
Cyc
le Le
ngth
(s)
110.0
Sum
of los
t time
(s)
17.8
Inter
secti
on C
apac
ity U
tiliza
tion
69.7%
ICU
Leve
l of S
ervic
eC
Analy
sis P
eriod
(min)
15c
Criti
cal L
ane G
roup
HC
M S
igna
lized
Inte
rsec
tion
Cap
acity
Ana
lysi
s3:
Cau
lfiel
d Ln
& L
akev
ille
St
7/1/20
15
Bayw
ood A
partm
ents
Traff
ic Im
pact
Stud
ySy
nchr
o 8 R
epor
tBa
selin
e PM
Peak
Hou
r plus
Pro
ject
W-T
rans
Move
ment
EBL
EBT
EBR
WBL
WBT
WBR
NBL
NBT
NBR
SBL
SBT
SBR
Lane
Con
figur
ation
sVo
lume (
vph)
218
721
8780
679
398
8875
6324
064
213
Ideal
Flow
(vphp
l)19
0019
0019
0019
0019
0019
0019
0019
0019
0019
0019
0019
00To
tal Lo
st tim
e (s)
4.04.9
4.04.9
4.94.0
4.04.9
4.94.9
Lane
Util.
Fac
tor1.0
00.9
51.0
00.9
51.0
01.0
00.9
50.9
50.9
51.0
0Fr
pb, p
ed/bi
kes
1.00
1.00
1.00
1.00
0.98
1.00
0.98
1.00
1.00
0.98
Flpb,
ped/b
ikes
1.00
1.00
1.00
1.00
1.00
1.00
1.00
1.00
1.00
1.00
Frt
1.00
0.98
1.00
1.00
0.85
1.00
0.93
1.00
1.00
0.85
Flt P
rotec
ted0.9
51.0
00.9
51.0
01.0
00.9
51.0
00.9
50.9
71.0
0Sa
td. F
low (p
rot)
1770
3354
1770
3374
1552
1770
3248
1681
1719
1553
Flt P
ermi
tted
0.95
1.00
0.95
1.00
1.00
0.95
1.00
0.95
0.97
1.00
Satd.
Flow
(per
m)17
7033
5417
7033
7415
5217
7032
4816
8117
1915
53Pe
ak-h
our f
actor
, PHF
0.98
0.98
0.98
0.98
0.98
0.98
0.98
0.98
0.98
0.98
0.98
0.98
Adj. F
low (v
ph)
222
736
8982
693
406
9077
6424
565
217
RTOR
Red
uctio
n (vp
h)0
50
00
960
590
00
190
Lane
Gro
up F
low (v
ph)
222
820
082
693
310
9082
015
415
627
Confl
. Ped
s. (#
/hr)
52
25
11
Confl
. Bike
s (#/h
r)8
58
3He
avy V
ehicl
es (%
)2%
6%2%
2%7%
2%2%
2%2%
2%2%
2%Tu
rn T
ype
Prot
NAPr
otNA
Perm
Split
NASp
litNA
Perm
Prote
cted P
hase
s5
21
63
34
4Pe
rmitte
d Pha
ses
64
Actua
ted G
reen
, G (s
)23
.185
.58.0
70.4
70.4
11.5
11.5
17.2
17.2
17.2
Effec
tive G
reen
, g (s
)23
.185
.58.0
70.4
70.4
11.5
11.5
17.2
17.2
17.2
Actua
ted g/
C Ra
tio0.1
70.6
10.0
60.5
00.5
00.0
80.0
80.1
20.1
20.1
2Cl
eara
nce T
ime (
s)4.0
4.94.0
4.94.9
4.04.0
4.94.9
4.9Ve
hicle
Exten
sion (
s)3.0
2.02.0
2.02.0
2.02.0
2.02.0
2.0La
ne G
rp C
ap (v
ph)
292
2048
101
1696
780
145
266
206
211
190
v/s R
atio P
rot
c0.13
0.24
c0.05
c0.21
c0.05
0.03
c0.09
0.09
v/s R
atio P
erm
0.20
0.02
v/c R
atio
0.76
0.40
0.81
0.41
0.40
0.62
0.31
0.75
0.74
0.14
Unifo
rm D
elay,
d155
.814
.065
.321
.821
.662
.160
.559
.359
.254
.8Pr
ogre
ssion
Fac
tor1.1
10.4
90.8
60.9
00.9
91.0
01.0
01.0
01.0
01.0
0Inc
reme
ntal D
elay,
d28.9
0.532
.40.6
1.35.8
0.212
.211
.10.1
Delay
(s)
70.9
7.388
.720
.222
.768
.060
.871
.570
.354
.9Le
vel o
f Ser
vice
EA
FC
CE
EE
ED
Appr
oach
Dela
y (s)
20.8
25.8
63.6
64.3
Appr
oach
LOS
CC
EE
Inter
secti
on S
umma
ryHC
M 20
00 C
ontro
l Dela
y33
.8HC
M 20
00 Le
vel o
f Ser
vice
CHC
M 20
00 V
olume
to C
apac
ity ra
tio0.5
6Ac
tuated
Cyc
le Le
ngth
(s)
140.0
Sum
of los
t time
(s)
17.8
Inter
secti
on C
apac
ity U
tiliza
tion
73.2%
ICU
Leve
l of S
ervic
eD
Analy
sis P
eriod
(min)
15c
Criti
cal L
ane G
roup
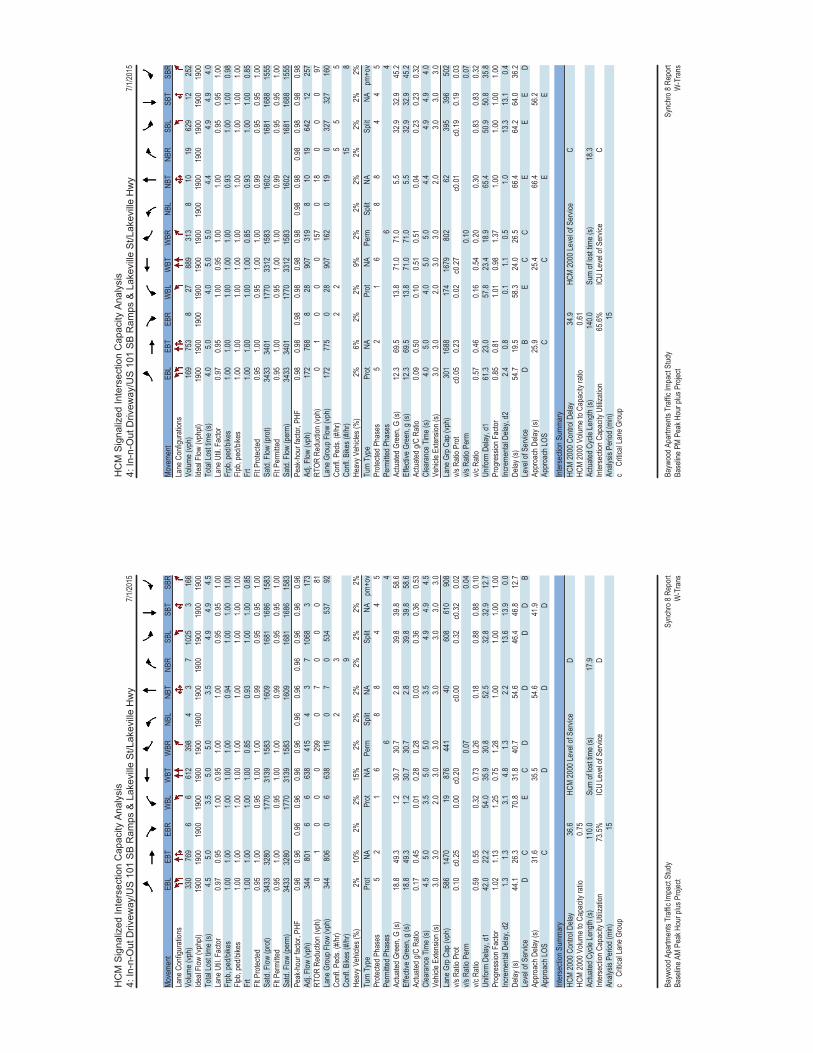
HC
M S
igna
lized
Inte
rsec
tion
Cap
acity
Ana
lysi
s4:
In-n
-Out
Driv
eway
/US
101
SB
Ram
ps &
Lak
evill
e S
t/Lak
evill
e H
wy
7/1/20
15
Bayw
ood A
partm
ents
Traff
ic Im
pact
Stud
ySy
nchr
o 8 R
epor
tBa
selin
e AM
Peak
Hou
r plus
Pro
ject
W-T
rans
Move
ment
EBL
EBT
EBR
WBL
WBT
WBR
NBL
NBT
NBR
SBL
SBT
SBR
Lane
Con
figur
ation
sVo
lume (
vph)
330
769
66
612
398
43
710
253
166
Ideal
Flow
(vphp
l)19
0019
0019
0019
0019
0019
0019
0019
0019
0019
0019
0019
00To
tal Lo
st tim
e (s)
4.55.0
3.55.0
5.03.5
4.94.9
4.5La
ne U
til. F
actor
0.97
0.95
1.00
0.95
1.00
1.00
0.95
0.95
1.00
Frpb
, ped
/bike
s1.0
01.0
01.0
01.0
01.0
00.9
41.0
01.0
01.0
0Flp
b, pe
d/bike
s1.0
01.0
01.0
01.0
01.0
01.0
01.0
01.0
01.0
0Fr
t1.0
01.0
01.0
01.0
00.8
50.9
31.0
01.0
00.8
5Flt
Pro
tected
0.95
1.00
0.95
1.00
1.00
0.99
0.95
0.95
1.00
Satd.
Flow
(pro
t)34
3332
8017
7031
3915
8316
0916
8116
8615
83Flt
Per
mitte
d0.9
51.0
00.9
51.0
01.0
00.9
90.9
50.9
51.0
0Sa
td. F
low (p
erm)
3433
3280
1770
3139
1583
1609
1681
1686
1583
Peak
-hou
r fac
tor, P
HF0.9
60.9
60.9
60.9
60.9
60.9
60.9
60.9
60.9
60.9
60.9
60.9
6Ad
j. Flow
(vph
)34
480
16
663
841
54
37
1068
317
3RT
OR R
educ
tion (
vph)
01
00
029
90
70
00
81La
ne G
roup
Flow
(vph
)34
480
60
663
811
60
70
534
537
92Co
nfl. P
eds.
(#/hr
)2
3Co
nfl. B
ikes (
#/hr)
9He
avy V
ehicl
es (%
)2%
10%
2%2%
15%
2%2%
2%2%
2%2%
2%Tu
rn T
ype
Prot
NAPr
otNA
Perm
Split
NASp
litNA
pm+o
vPr
otecte
d Pha
ses
52
16
88
44
5Pe
rmitte
d Pha
ses
64
Actua
ted G
reen
, G (s
)18
.849
.31.2
30.7
30.7
2.839
.839
.858
.6Ef
fectiv
e Gre
en, g
(s)
18.8
49.3
1.230
.730
.72.8
39.8
39.8
58.6
Actua
ted g/
C Ra
tio0.1
70.4
50.0
10.2
80.2
80.0
30.3
60.3
60.5
3Cl
eara
nce T
ime (
s)4.5
5.03.5
5.05.0
3.54.9
4.94.5
Vehic
le Ex
tensio
n (s)
3.03.0
2.03.0
3.03.0
3.03.0
3.0La
ne G
rp C
ap (v
ph)
586
1470
1987
644
140
608
610
908
v/s R
atio P
rot
0.10
c0.25
0.00
c0.20
c0.00
0.32
c0.32
0.02
v/s R
atio P
erm
0.07
0.04
v/c R
atio
0.59
0.55
0.32
0.73
0.26
0.18
0.88
0.88
0.10
Unifo
rm D
elay,
d142
.022
.254
.035
.930
.852
.532
.832
.912
.7Pr
ogre
ssion
Fac
tor1.0
21.1
31.2
50.7
51.2
81.0
01.0
01.0
01.0
0Inc
reme
ntal D
elay,
d21.3
1.33.1
4.81.3
2.213
.613
.90.0
Delay
(s)
44.1
26.3
70.8
31.8
40.7
54.6
46.4
46.8
12.7
Leve
l of S
ervic
eD
CE
CD
DD
DB
Appr
oach
Dela
y (s)
31.6
35.5
54.6
41.9
Appr
oach
LOS
CD
DD
Inter
secti
on S
umma
ryHC
M 20
00 C
ontro
l Dela
y36
.6HC
M 20
00 Le
vel o
f Ser
vice
DHC
M 20
00 V
olume
to C
apac
ity ra
tio0.7
5Ac
tuated
Cyc
le Le
ngth
(s)
110.0
Sum
of los
t time
(s)
17.9
Inter
secti
on C
apac
ity U
tiliza
tion
73.5%
ICU
Leve
l of S
ervic
eD
Analy
sis P
eriod
(min)
15c
Criti
cal L
ane G
roup
HC
M S
igna
lized
Inte
rsec
tion
Cap
acity
Ana
lysi
s4:
In-n
-Out
Driv
eway
/US
101
SB
Ram
ps &
Lak
evill
e S
t/Lak
evill
e H
wy
7/1/20
15
Bayw
ood A
partm
ents
Traff
ic Im
pact
Stud
ySy
nchr
o 8 R
epor
tBa
selin
e PM
Peak
Hou
r plus
Pro
ject
W-T
rans
Move
ment
EBL
EBT
EBR
WBL
WBT
WBR
NBL
NBT
NBR
SBL
SBT
SBR
Lane
Con
figur
ation
sVo
lume (
vph)
169
753
827
889
313
810
1962
912
252
Ideal
Flow
(vphp
l)19
0019
0019
0019
0019
0019
0019
0019
0019
0019
0019
0019
00To
tal Lo
st tim
e (s)
4.05.0
4.05.0
5.04.4
4.94.9
4.0La
ne U
til. F
actor
0.97
0.95
1.00
0.95
1.00
1.00
0.95
0.95
1.00
Frpb
, ped
/bike
s1.0
01.0
01.0
01.0
01.0
00.9
31.0
01.0
00.9
8Flp
b, pe
d/bike
s1.0
01.0
01.0
01.0
01.0
01.0
01.0
01.0
01.0
0Fr
t1.0
01.0
01.0
01.0
00.8
50.9
31.0
01.0
00.8
5Flt
Pro
tected
0.95
1.00
0.95
1.00
1.00
0.99
0.95
0.95
1.00
Satd.
Flow
(pro
t)34
3334
0117
7033
1215
8316
0216
8116
8815
55Flt
Per
mitte
d0.9
51.0
00.9
51.0
01.0
00.9
90.9
50.9
51.0
0Sa
td. F
low (p
erm)
3433
3401
1770
3312
1583
1602
1681
1688
1555
Peak
-hou
r fac
tor, P
HF0.9
80.9
80.9
80.9
80.9
80.9
80.9
80.9
80.9
80.9
80.9
80.9
8Ad
j. Flow
(vph
)17
276
88
2890
731
98
1019
642
1225
7RT
OR R
educ
tion (
vph)
01
00
015
70
180
00
97La
ne G
roup
Flow
(vph
)17
277
50
2890
716
20
190
327
327
160
Confl
. Ped
s. (#
/hr)
22
55
5Co
nfl. B
ikes (
#/hr)
158
Heav
y Veh
icles
(%)
2%6%
2%2%
9%2%
2%2%
2%2%
2%2%
Turn
Typ
ePr
otNA
Prot
NAPe
rmSp
litNA
Split
NApm
+ov
Prote
cted P
hase
s5
21
68
84
45
Perm
itted P
hase
s6
4Ac
tuated
Gre
en, G
(s)
12.3
69.5
13.8
71.0
71.0
5.532
.932
.945
.2Ef
fectiv
e Gre
en, g
(s)
12.3
69.5
13.8
71.0
71.0
5.532
.932
.945
.2Ac
tuated
g/C
Ratio
0.09
0.50
0.10
0.51
0.51
0.04
0.23
0.23
0.32
Clea
ranc
e Tim
e (s)
4.05.0
4.05.0
5.04.4
4.94.9
4.0Ve
hicle
Exten
sion (
s)3.0
3.02.0
3.03.0
2.03.0
3.03.0
Lane
Grp
Cap
(vph
)30
116
8817
416
7980
262
395
396
502
v/s R
atio P
rot
c0.05
0.23
0.02
c0.27
c0.01
c0.19
0.19
0.03
v/s R
atio P
erm
0.10
0.07
v/c R
atio
0.57
0.46
0.16
0.54
0.20
0.30
0.83
0.83
0.32
Unifo
rm D
elay,
d161
.323
.057
.823
.418
.965
.450
.950
.835
.8Pr
ogre
ssion
Fac
tor0.8
50.8
11.0
10.9
81.3
71.0
01.0
01.0
01.0
0Inc
reme
ntal D
elay,
d22.4
0.80.1
1.10.5
1.013
.313
.10.4
Delay
(s)
54.7
19.5
58.3
24.0
26.5
66.4
64.2
64.0
36.2
Leve
l of S
ervic
eD
BE
CC
EE
ED
Appr
oach
Dela
y (s)
25.9
25.4
66.4
56.2
Appr
oach
LOS
CC
EE
Inter
secti
on S
umma
ryHC
M 20
00 C
ontro
l Dela
y34
.9HC
M 20
00 Le
vel o
f Ser
vice
CHC
M 20
00 V
olume
to C
apac
ity ra
tio0.6
1Ac
tuated
Cyc
le Le
ngth
(s)
140.0
Sum
of los
t time
(s)
18.3
Inter
secti
on C
apac
ity U
tiliza
tion
65.6%
ICU
Leve
l of S
ervic
eC
Analy
sis P
eriod
(min)
15c
Criti
cal L
ane G
roup
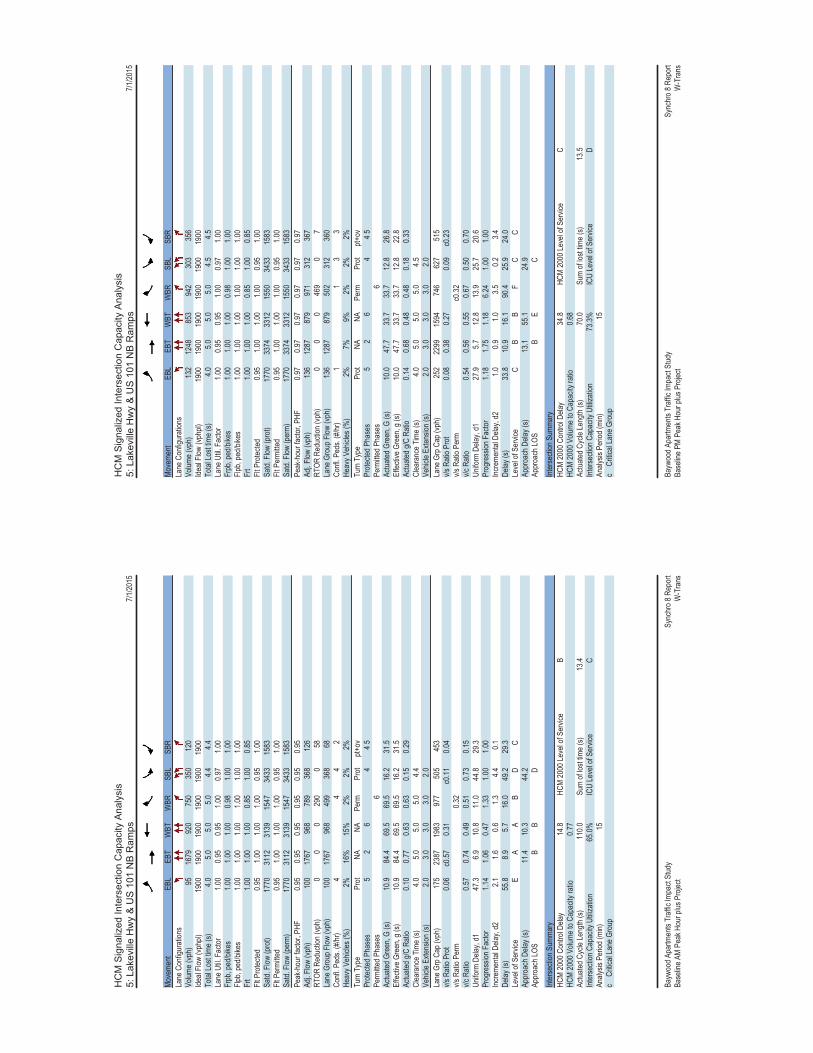
HC
M S
igna
lized
Inte
rsec
tion
Cap
acity
Ana
lysi
s5:
Lak
evill
e H
wy
& U
S 1
01 N
B R
amps
7/1/20
15
Bayw
ood A
partm
ents
Traff
ic Im
pact
Stud
ySy
nchr
o 8 R
epor
tBa
selin
e AM
Peak
Hou
r plus
Pro
ject
W-T
rans
Move
ment
EBL
EBT
WBT
WBR
SBL
SBR
Lane
Con
figur
ation
sVo
lume (
vph)
9516
7992
075
035
012
0Ide
al Flo
w (vp
hpl)
1900
1900
1900
1900
1900
1900
Total
Lost
time (
s)4.0
5.05.0
5.04.4
4.4La
ne U
til. F
actor
1.00
0.95
0.95
1.00
0.97
1.00
Frpb
, ped
/bike
s1.0
01.0
01.0
00.9
81.0
01.0
0Flp
b, pe
d/bike
s1.0
01.0
01.0
01.0
01.0
01.0
0Fr
t1.0
01.0
01.0
00.8
51.0
00.8
5Flt
Pro
tected
0.95
1.00
1.00
1.00
0.95
1.00
Satd.
Flow
(pro
t)17
7031
1231
3915
4734
3315
83Flt
Per
mitte
d0.9
51.0
01.0
01.0
00.9
51.0
0Sa
td. F
low (p
erm)
1770
3112
3139
1547
3433
1583
Peak
-hou
r fac
tor, P
HF0.9
50.9
50.9
50.9
50.9
50.9
5Ad
j. Flow
(vph
)10
017
6796
878
936
812
6RT
OR R
educ
tion (
vph)
00
029
00
58La
ne G
roup
Flow
(vph
)10
017
6796
849
936
868
Confl
. Ped
s. (#
/hr)
44
42
Heav
y Veh
icles
(%)
2%16
%15
%2%
2%2%
Turn
Typ
ePr
otNA
NAPe
rmPr
otpt+
ovPr
otecte
d Pha
ses
52
64
4 5Pe
rmitte
d Pha
ses
6Ac
tuated
Gre
en, G
(s)
10.9
84.4
69.5
69.5
16.2
31.5
Effec
tive G
reen
, g (s
)10
.984
.469
.569
.516
.231
.5Ac
tuated
g/C
Ratio
0.10
0.77
0.63
0.63
0.15
0.29
Clea
ranc
e Tim
e (s)
4.05.0
5.05.0
4.4Ve
hicle
Exten
sion (
s)2.0
3.03.0
3.02.0
Lane
Grp
Cap
(vph
)17
523
8719
8397
750
545
3v/s
Rati
o Pro
t0.0
6c0
.570.3
1c0
.110.0
4v/s
Rati
o Per
m0.3
2v/c
Rati
o0.5
70.7
40.4
90.5
10.7
30.1
5Un
iform
Dela
y, d1
47.3
6.910
.811
.044
.829
.3Pr
ogre
ssion
Fac
tor1.1
41.0
60.4
71.3
31.0
01.0
0Inc
reme
ntal D
elay,
d22.1
1.60.6
1.34.4
0.1De
lay (s
)55
.88.9
5.716
.049
.229
.3Le
vel o
f Ser
vice
EA
AB
DC
Appr
oach
Dela
y (s)
11.4
10.3
44.2
Appr
oach
LOS
BB
D
Inter
secti
on S
umma
ryHC
M 20
00 C
ontro
l Dela
y14
.8HC
M 20
00 Le
vel o
f Ser
vice
BHC
M 20
00 V
olume
to C
apac
ity ra
tio0.7
7Ac
tuated
Cyc
le Le
ngth
(s)
110.0
Sum
of los
t time
(s)
13.4
Inter
secti
on C
apac
ity U
tiliza
tion
65.0%
ICU
Leve
l of S
ervic
eC
Analy
sis P
eriod
(min)
15c
Criti
cal L
ane G
roup
HC
M S
igna
lized
Inte
rsec
tion
Cap
acity
Ana
lysi
s5:
Lak
evill
e H
wy
& U
S 1
01 N
B R
amps
7/1/20
15
Bayw
ood A
partm
ents
Traff
ic Im
pact
Stud
ySy
nchr
o 8 R
epor
tBa
selin
e PM
Peak
Hou
r plus
Pro
ject
W-T
rans
Move
ment
EBL
EBT
WBT
WBR
SBL
SBR
Lane
Con
figur
ation
sVo
lume (
vph)
132
1248
853
942
303
356
Ideal
Flow
(vphp
l)19
0019
0019
0019
0019
0019
00To
tal Lo
st tim
e (s)
4.05.0
5.05.0
4.54.5
Lane
Util.
Fac
tor1.0
00.9
50.9
51.0
00.9
71.0
0Fr
pb, p
ed/bi
kes
1.00
1.00
1.00
0.98
1.00
1.00
Flpb,
ped/b
ikes
1.00
1.00
1.00
1.00
1.00
1.00
Frt
1.00
1.00
1.00
0.85
1.00
0.85
Flt P
rotec
ted0.9
51.0
01.0
01.0
00.9
51.0
0Sa
td. F
low (p
rot)
1770
3374
3312
1550
3433
1583
Flt P
ermi
tted
0.95
1.00
1.00
1.00
0.95
1.00
Satd.
Flow
(per
m)17
7033
7433
1215
5034
3315
83Pe
ak-h
our f
actor
, PHF
0.97
0.97
0.97
0.97
0.97
0.97
Adj. F
low (v
ph)
136
1287
879
971
312
367
RTOR
Red
uctio
n (vp
h)0
00
469
07
Lane
Gro
up F
low (v
ph)
136
1287
879
502
312
360
Confl
. Ped
s. (#
/hr)
11
33
Heav
y Veh
icles
(%)
2%7%
9%2%
2%2%
Turn
Typ
ePr
otNA
NAPe
rmPr
otpt+
ovPr
otecte
d Pha
ses
52
64
4 5Pe
rmitte
d Pha
ses
6Ac
tuated
Gre
en, G
(s)
10.0
47.7
33.7
33.7
12.8
26.8
Effec
tive G
reen
, g (s
)10
.047
.733
.733
.712
.822
.8Ac
tuated
g/C
Ratio
0.14
0.68
0.48
0.48
0.18
0.33
Clea
ranc
e Tim
e (s)
4.05.0
5.05.0
4.5Ve
hicle
Exten
sion (
s)2.0
3.03.0
3.02.0
Lane
Grp
Cap
(vph
)25
222
9915
9474
662
751
5v/s
Rati
o Pro
t0.0
80.3
80.2
70.0
9c0
.23v/s
Rati
o Per
mc0
.32v/c
Rati
o0.5
40.5
60.5
50.6
70.5
00.7
0Un
iform
Dela
y, d1
27.9
5.712
.813
.925
.720
.6Pr
ogre
ssion
Fac
tor1.1
81.7
51.1
86.2
41.0
01.0
0Inc
reme
ntal D
elay,
d21.0
0.91.0
3.50.2
3.4De
lay (s
)33
.810
.916
.190
.425
.924
.0Le
vel o
f Ser
vice
CB
BF
CC
Appr
oach
Dela
y (s)
13.1
55.1
24.9
Appr
oach
LOS
BE
C
Inter
secti
on S
umma
ryHC
M 20
00 C
ontro
l Dela
y34
.8HC
M 20
00 Le
vel o
f Ser
vice
CHC
M 20
00 V
olume
to C
apac
ity ra
tio0.6
8Ac
tuated
Cyc
le Le
ngth
(s)
70.0
Sum
of los
t time
(s)
13.5
Inter
secti
on C
apac
ity U
tiliza
tion
73.3%
ICU
Leve
l of S
ervic
eD
Analy
sis P
eriod
(min)
15c
Criti
cal L
ane G
roup
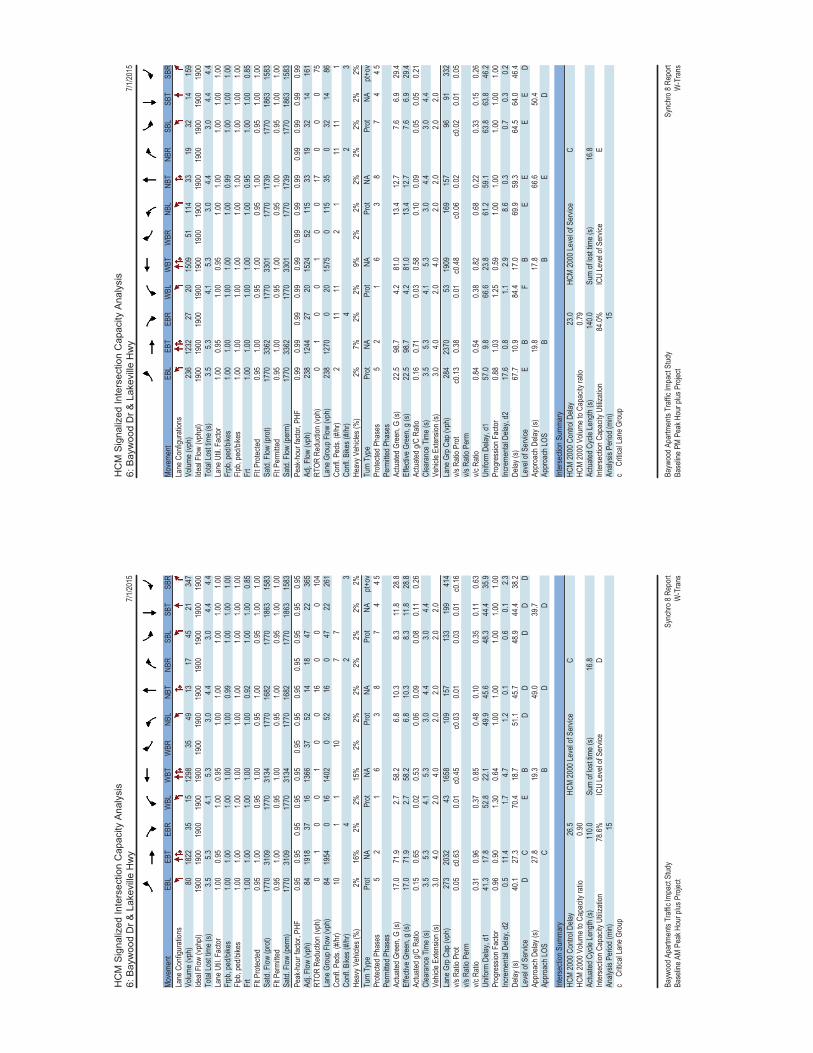
HC
M S
igna
lized
Inte
rsec
tion
Cap
acity
Ana
lysi
s6:
Bay
woo
d D
r & L
akev
ille
Hw
y7/1
/2015
Bayw
ood A
partm
ents
Traff
ic Im
pact
Stud
ySy
nchr
o 8 R
epor
tBa
selin
e AM
Peak
Hou
r plus
Pro
ject
W-T
rans
Move
ment
EBL
EBT
EBR
WBL
WBT
WBR
NBL
NBT
NBR
SBL
SBT
SBR
Lane
Con
figur
ation
sVo
lume (
vph)
8018
2235
1512
9835
4913
1745
2134
7Ide
al Flo
w (vp
hpl)
1900
1900
1900
1900
1900
1900
1900
1900
1900
1900
1900
1900
Total
Lost
time (
s)3.5
5.34.1
5.33.0
4.43.0
4.44.4
Lane
Util.
Fac
tor1.0
00.9
51.0
00.9
51.0
01.0
01.0
01.0
01.0
0Fr
pb, p
ed/bi
kes
1.00
1.00
1.00
1.00
1.00
0.99
1.00
1.00
1.00
Flpb,
ped/b
ikes
1.00
1.00
1.00
1.00
1.00
1.00
1.00
1.00
1.00
Frt
1.00
1.00
1.00
1.00
1.00
0.92
1.00
1.00
0.85
Flt P
rotec
ted0.9
51.0
00.9
51.0
00.9
51.0
00.9
51.0
01.0
0Sa
td. F
low (p
rot)
1770
3109
1770
3134
1770
1682
1770
1863
1583
Flt P
ermi
tted
0.95
1.00
0.95
1.00
0.95
1.00
0.95
1.00
1.00
Satd.
Flow
(per
m)17
7031
0917
7031
3417
7016
8217
7018
6315
83Pe
ak-h
our f
actor
, PHF
0.95
0.95
0.95
0.95
0.95
0.95
0.95
0.95
0.95
0.95
0.95
0.95
Adj. F
low (v
ph)
8419
1837
1613
6637
5214
1847
2236
5RT
OR R
educ
tion (
vph)
01
00
10
016
00
010
4La
ne G
roup
Flow
(vph
)84
1954
016
1402
052
160
4722
261
Confl
. Ped
s. (#
/hr)
101
110
77
Confl
. Bike
s (#/h
r)4
23
Heav
y Veh
icles
(%)
2%16
%2%
2%15
%2%
2%2%
2%2%
2%2%
Turn
Typ
ePr
otNA
Prot
NAPr
otNA
Prot
NApt+
ovPr
otecte
d Pha
ses
52
16
38
74
4 5Pe
rmitte
d Pha
ses
Actua
ted G
reen
, G (s
)17
.071
.92.7
58.2
6.810
.38.3
11.8
28.8
Effec
tive G
reen
, g (s
)17
.071
.92.7
58.2
6.810
.38.3
11.8
28.8
Actua
ted g/
C Ra
tio0.1
50.6
50.0
20.5
30.0
60.0
90.0
80.1
10.2
6Cl
eara
nce T
ime (
s)3.5
5.34.1
5.33.0
4.43.0
4.4Ve
hicle
Exten
sion (
s)3.0
4.02.0
4.02.0
2.02.0
2.0La
ne G
rp C
ap (v
ph)
273
2032
4316
5810
915
713
319
941
4v/s
Rati
o Pro
t0.0
5c0
.630.0
1c0
.45c0
.030.0
10.0
30.0
1c0
.16v/s
Rati
o Per
mv/c
Rati
o0.3
10.9
60.3
70.8
50.4
80.1
00.3
50.1
10.6
3Un
iform
Dela
y, d1
41.3
17.8
52.8
22.1
49.9
45.6
48.3
44.4
35.9
Prog
ress
ion F
actor
0.96
0.90
1.30
0.64
1.00
1.00
1.00
1.00
1.00
Incre
menta
l Dela
y, d2
0.511
.41.7
4.71.2
0.10.6
0.12.3
Delay
(s)
40.1
27.3
70.4
18.7
51.1
45.7
48.9
44.4
38.2
Leve
l of S
ervic
eD
CE
BD
DD
DD
Appr
oach
Dela
y (s)
27.8
19.3
49.0
39.7
Appr
oach
LOS
CB
DD
Inter
secti
on S
umma
ryHC
M 20
00 C
ontro
l Dela
y26
.5HC
M 20
00 Le
vel o
f Ser
vice
CHC
M 20
00 V
olume
to C
apac
ity ra
tio0.9
0Ac
tuated
Cyc
le Le
ngth
(s)
110.0
Sum
of los
t time
(s)
16.8
Inter
secti
on C
apac
ity U
tiliza
tion
78.6%
ICU
Leve
l of S
ervic
eD
Analy
sis P
eriod
(min)
15c
Criti
cal L
ane G
roup
HC
M S
igna
lized
Inte
rsec
tion
Cap
acity
Ana
lysi
s6:
Bay
woo
d D
r & L
akev
ille
Hw
y7/1
/2015
Bayw
ood A
partm
ents
Traff
ic Im
pact
Stud
ySy
nchr
o 8 R
epor
tBa
selin
e PM
Peak
Hou
r plus
Pro
ject
W-T
rans
Move
ment
EBL
EBT
EBR
WBL
WBT
WBR
NBL
NBT
NBR
SBL
SBT
SBR
Lane
Con
figur
ation
sVo
lume (
vph)
236
1232
2720
1509
5111
433
1932
1415
9Ide
al Flo
w (vp
hpl)
1900
1900
1900
1900
1900
1900
1900
1900
1900
1900
1900
1900
Total
Lost
time (
s)3.5
5.34.1
5.33.0
4.43.0
4.44.4
Lane
Util.
Fac
tor1.0
00.9
51.0
00.9
51.0
01.0
01.0
01.0
01.0
0Fr
pb, p
ed/bi
kes
1.00
1.00
1.00
1.00
1.00
0.99
1.00
1.00
1.00
Flpb,
ped/b
ikes
1.00
1.00
1.00
1.00
1.00
1.00
1.00
1.00
1.00
Frt
1.00
1.00
1.00
1.00
1.00
0.95
1.00
1.00
0.85
Flt P
rotec
ted0.9
51.0
00.9
51.0
00.9
51.0
00.9
51.0
01.0
0Sa
td. F
low (p
rot)
1770
3362
1770
3301
1770
1739
1770
1863
1583
Flt P
ermi
tted
0.95
1.00
0.95
1.00
0.95
1.00
0.95
1.00
1.00
Satd.
Flow
(per
m)17
7033
6217
7033
0117
7017
3917
7018
6315
83Pe
ak-h
our f
actor
, PHF
0.99
0.99
0.99
0.99
0.99
0.99
0.99
0.99
0.99
0.99
0.99
0.99
Adj. F
low (v
ph)
238
1244
2720
1524
5211
533
1932
1416
1RT
OR R
educ
tion (
vph)
01
00
10
017
00
075
Lane
Gro
up F
low (v
ph)
238
1270
020
1575
011
535
032
1486
Confl
. Ped
s. (#
/hr)
211
112
111
111
Confl
. Bike
s (#/h
r)4
23
Heav
y Veh
icles
(%)
2%7%
2%2%
9%2%
2%2%
2%2%
2%2%
Turn
Typ
ePr
otNA
Prot
NAPr
otNA
Prot
NApt+
ovPr
otecte
d Pha
ses
52
16
38
74
4 5Pe
rmitte
d Pha
ses
Actua
ted G
reen
, G (s
)22
.598
.74.2
81.0
13.4
12.7
7.66.9
29.4
Effec
tive G
reen
, g (s
)22
.598
.74.2
81.0
13.4
12.7
7.66.9
29.4
Actua
ted g/
C Ra
tio0.1
60.7
10.0
30.5
80.1
00.0
90.0
50.0
50.2
1Cl
eara
nce T
ime (
s)3.5
5.34.1
5.33.0
4.43.0
4.4Ve
hicle
Exten
sion (
s)3.0
4.02.0
4.02.0
2.02.0
2.0La
ne G
rp C
ap (v
ph)
284
2370
5319
0916
915
796
9133
2v/s
Rati
o Pro
tc0
.130.3
80.0
1c0
.48c0
.060.0
2c0
.020.0
10.0
5v/s
Rati
o Per
mv/c
Rati
o0.8
40.5
40.3
80.8
20.6
80.2
20.3
30.1
50.2
6Un
iform
Dela
y, d1
57.0
9.866
.623
.861
.259
.163
.863
.846
.2Pr
ogre
ssion
Fac
tor0.8
81.0
31.2
50.5
91.0
01.0
01.0
01.0
01.0
0Inc
reme
ntal D
elay,
d217
.60.8
1.12.9
8.60.3
0.70.3
0.2De
lay (s
)67
.710
.984
.417
.069
.959
.364
.564
.046
.4Le
vel o
f Ser
vice
EB
FB
EE
EE
DAp
proa
ch D
elay (
s)19
.817
.866
.650
.4Ap
proa
ch LO
SB
BE
D
Inter
secti
on S
umma
ryHC
M 20
00 C
ontro
l Dela
y23
.0HC
M 20
00 Le
vel o
f Ser
vice
CHC
M 20
00 V
olume
to C
apac
ity ra
tio0.7
9Ac
tuated
Cyc
le Le
ngth
(s)
140.0
Sum
of los
t time
(s)
16.8
Inter
secti
on C
apac
ity U
tiliza
tion
84.0%
ICU
Leve
l of S
ervic
eE
Analy
sis P
eriod
(min)
15c
Criti
cal L
ane G
roup

HC
M S
igna
lized
Inte
rsec
tion
Cap
acity
Ana
lysi
s7:
Cas
a G
rand
e R
d &
Lak
evill
e H
wy
7/1/20
15
Bayw
ood A
partm
ents
Traff
ic Im
pact
Stud
ySy
nchr
o 8 R
epor
tBa
selin
e AM
Peak
Hou
r plus
Pro
ject
W-T
rans
Move
ment
EBL
EBT
EBR
WBL
WBT
WBR
NBL
NBT
NBR
SBL
SBT
SBR
Lane
Con
figur
ation
sVo
lume (
vph)
135
1716
5521
979
1415
367
4316
4423
1Ide
al Flo
w (vp
hpl)
1900
1900
1900
1900
1900
1900
1900
1900
1900
1900
1900
1900
Total
Lost
time (
s)4.5
5.54.5
5.54.0
4.14.1
4.14.1
Lane
Util.
Fac
tor1.0
00.9
51.0
00.9
51.0
01.0
01.0
01.0
01.0
0Fr
pb, p
ed/bi
kes
1.00
1.00
1.00
1.00
1.00
1.00
0.99
1.00
0.98
Flpb,
ped/b
ikes
1.00
1.00
1.00
1.00
1.00
1.00
1.00
1.00
1.00
Frt
1.00
1.00
1.00
1.00
0.85
1.00
0.94
1.00
0.85
Flt P
rotec
ted0.9
51.0
00.9
51.0
01.0
00.9
51.0
00.9
91.0
0Sa
td. F
low (p
rot)
1770
3106
1770
3139
1583
1761
1743
1837
1552
Flt P
ermi
tted
0.95
1.00
0.95
1.00
1.00
0.71
1.00
0.91
1.00
Satd.
Flow
(per
m)17
7031
0617
7031
3915
8313
2417
4316
9915
52Pe
ak-h
our f
actor
, PHF
0.91
0.91
0.91
0.91
0.91
0.91
0.91
0.91
0.91
0.91
0.91
0.91
Adj. F
low (v
ph)
148
1886
6023
1076
1516
874
4718
4825
4RT
OR R
educ
tion (
vph)
01
00
00
024
00
020
9La
ne G
roup
Flow
(vph
)14
819
450
2310
7615
168
970
066
45Co
nfl. P
eds.
(#/hr
)4
44
11
4Co
nfl. B
ikes (
#/hr)
42
1He
avy V
ehicl
es (%
)2%
16%
2%2%
15%
2%2%
2%2%
2%2%
2%Tu
rn T
ype
Prot
NAPr
otNA
Free
Perm
NAPe
rmNA
Perm
Prote
cted P
hase
s5
21
68
4Pe
rmitte
d Pha
ses
Free
84
4Ac
tuated
Gre
en, G
(s)
13.4
73.0
3.663
.211
0.019
.319
.319
.319
.3Ef
fectiv
e Gre
en, g
(s)
13.4
73.0
3.663
.211
0.019
.319
.319
.319
.3Ac
tuated
g/C
Ratio
0.12
0.66
0.03
0.57
1.00
0.18
0.18
0.18
0.18
Clea
ranc
e Tim
e (s)
4.55.5
4.55.5
4.14.1
4.14.1
Vehic
le Ex
tensio
n (s)
2.03.0
2.03.0
3.03.0
2.52.5
Lane
Grp
Cap
(vph
)21
520
6157
1803
1583
232
305
298
272
v/s R
atio P
rot
0.08
c0.63
0.01
c0.34
0.06
v/s R
atio P
erm
0.01
c0.13
0.04
0.03
v/c R
atio
0.69
0.94
0.40
0.60
0.01
0.72
0.32
0.22
0.16
Unifo
rm D
elay,
d146
.316
.652
.115
.20.0
42.8
39.6
38.9
38.5
Prog
ress
ion F
actor
1.15
0.32
0.63
0.29
1.00
1.00
1.00
1.00
1.00
Incre
menta
l Dela
y, d2
3.76.0
1.41.2
0.010
.70.6
0.30.2
Delay
(s)
57.1
11.3
34.2
5.70.0
53.5
40.2
39.2
38.7
Leve
l of S
ervic
eE
BC
AA
DD
DD
Appr
oach
Dela
y (s)
14.5
6.247
.938
.8Ap
proa
ch LO
SB
AD
D
Inter
secti
on S
umma
ryHC
M 20
00 C
ontro
l Dela
y16
.7HC
M 20
00 Le
vel o
f Ser
vice
BHC
M 20
00 V
olume
to C
apac
ity ra
tio0.9
0Ac
tuated
Cyc
le Le
ngth
(s)
110.0
Sum
of los
t time
(s)
14.1
Inter
secti
on C
apac
ity U
tiliza
tion
81.3%
ICU
Leve
l of S
ervic
eD
Analy
sis P
eriod
(min)
15c
Criti
cal L
ane G
roup
HC
M S
igna
lized
Inte
rsec
tion
Cap
acity
Ana
lysi
s7:
Cas
a G
rand
e R
d &
Lak
evill
e H
wy
7/1/20
15
Bayw
ood A
partm
ents
Traff
ic Im
pact
Stud
ySy
nchr
o 8 R
epor
tBa
selin
e PM
Peak
Hou
r plus
Pro
ject
W-T
rans
Move
ment
EBL
EBT
EBR
WBL
WBT
WBR
NBL
NBT
NBR
SBL
SBT
SBR
Lane
Con
figur
ation
sVo
lume (
vph)
188
968
145
4714
0832
128
7723
765
86Ide
al Flo
w (vp
hpl)
1900
1900
1900
1900
1900
1900
1900
1900
1900
1900
1900
1900
Total
Lost
time (
s)4.5
5.54.5
5.54.0
4.14.1
4.14.1
Lane
Util.
Fac
tor1.0
00.9
51.0
00.9
51.0
01.0
01.0
01.0
01.0
0Fr
pb, p
ed/bi
kes
1.00
0.99
1.00
1.00
1.00
1.00
1.00
1.00
0.98
Flpb,
ped/b
ikes
1.00
1.00
1.00
1.00
1.00
1.00
1.00
1.00
1.00
Frt
1.00
0.98
1.00
1.00
0.85
1.00
0.97
1.00
0.85
Flt P
rotec
ted0.9
51.0
00.9
51.0
01.0
00.9
51.0
01.0
01.0
0Sa
td. F
low (p
rot)
1770
3082
1770
3139
1583
1762
1791
1854
1552
Flt P
ermi
tted
0.95
1.00
0.95
1.00
1.00
0.67
1.00
0.97
1.00
Satd.
Flow
(per
m)17
7030
8217
7031
3915
8312
3717
9118
1615
52Pe
ak-h
our f
actor
, PHF
0.95
0.95
0.95
0.95
0.95
0.95
0.95
0.95
0.95
0.95
0.95
0.95
Adj. F
low (v
ph)
198
1019
153
4914
8234
135
8124
768
91RT
OR R
educ
tion (
vph)
09
00
00
08
00
078
Lane
Gro
up F
low (v
ph)
198
1163
049
1482
3413
597
00
7513
Confl
. Ped
s. (#
/hr)
1010
32
23
Confl
. Bike
s (#/h
r)4
21
Heav
y Veh
icles
(%)
2%16
%2%
2%15
%2%
2%2%
2%2%
2%2%
Turn
Typ
ePr
otNA
Prot
NAFr
eePe
rmNA
Perm
NAPe
rmPr
otecte
d Pha
ses
52
16
84
Perm
itted P
hase
sFr
ee8
44
Actua
ted G
reen
, G (s
)19
.190
.216
.187
.214
0.019
.619
.619
.619
.6Ef
fectiv
e Gre
en, g
(s)
19.1
90.2
16.1
87.2
140.0
19.6
19.6
19.6
19.6
Actua
ted g/
C Ra
tio0.1
40.6
40.1
20.6
21.0
00.1
40.1
40.1
40.1
4Cl
eara
nce T
ime (
s)4.5
5.54.5
5.54.1
4.14.1
4.1Ve
hicle
Exten
sion (
s)2.0
3.02.0
3.03.0
3.02.5
2.5La
ne G
rp C
ap (v
ph)
241
1985
203
1955
1583
173
250
254
217
v/s R
atio P
rot
c0.11
0.38
0.03
c0.47
0.05
v/s R
atio P
erm
0.02
c0.11
0.04
0.01
v/c R
atio
0.82
0.59
0.24
0.76
0.02
0.78
0.39
0.30
0.06
Unifo
rm D
elay,
d158
.814
.256
.418
.90.0
58.1
54.8
54.0
52.2
Prog
ress
ion F
actor
0.87
0.90
0.76
0.62
1.00
1.00
1.00
1.00
1.00
Incre
menta
l Dela
y, d2
17.1
1.10.1
1.20.0
20.0
1.00.5
0.1De
lay (s
)68
.414
.042
.813
.00.0
78.2
55.8
54.5
52.3
Leve
l of S
ervic
eE
BD
BA
EE
DD
Appr
oach
Dela
y (s)
21.8
13.6
68.4
53.3
Appr
oach
LOS
CB
ED
Inter
secti
on S
umma
ryHC
M 20
00 C
ontro
l Dela
y22
.9HC
M 20
00 Le
vel o
f Ser
vice
CHC
M 20
00 V
olume
to C
apac
ity ra
tio0.7
7Ac
tuated
Cyc
le Le
ngth
(s)
140.0
Sum
of los
t time
(s)
14.1
Inter
secti
on C
apac
ity U
tiliza
tion
75.3%
ICU
Leve
l of S
ervic
eD
Analy
sis P
eriod
(min)
15c
Criti
cal L
ane G
roup

HC
M S
igna
lized
Inte
rsec
tion
Cap
acity
Ana
lysi
s8:
McD
owel
l Bl &
Lak
evill
e H
wy
7/1/20
15
Bayw
ood A
partm
ents
Traff
ic Im
pact
Stud
ySy
nchr
o 8 R
epor
tBa
selin
e AM
Peak
Hou
r plus
Pro
ject
W-T
rans
Move
ment
EBL
EBT
EBR
WBL
WBT
WBR
NBL
NBT
NBR
SBL
SBT
SBR
Lane
Con
figur
ation
sVo
lume (
vph)
1510
2471
532
763
7322
792
920
928
120
Ideal
Flow
(vphp
l)19
0019
0019
0019
0019
0019
0019
0019
0019
0019
0019
0019
00To
tal Lo
st tim
e (s)
3.05.5
3.05.5
3.04.8
3.04.8
Lane
Util.
Fac
tor1.0
00.9
51.0
00.9
51.0
00.9
51.0
00.9
5Fr
pb, p
ed/bi
kes
1.00
1.00
1.00
1.00
1.00
1.00
1.00
1.00
Flpb,
ped/b
ikes
1.00
1.00
1.00
1.00
1.00
1.00
1.00
1.00
Frt
1.00
0.94
1.00
0.99
1.00
0.99
1.00
0.99
Flt P
rotec
ted0.9
51.0
00.9
51.0
00.9
51.0
00.9
51.0
0Sa
td. F
low (p
rot)
1770
3073
1770
3126
1770
3484
1770
3499
Flt P
ermi
tted
0.95
1.00
0.95
1.00
0.95
1.00
0.95
1.00
Satd.
Flow
(per
m)17
7030
7317
7031
2617
7034
8417
7034
99Pe
ak-h
our f
actor
, PHF
0.93
0.93
0.93
0.93
0.93
0.93
0.93
0.93
0.93
0.93
0.93
0.93
Adj. F
low (v
ph)
1611
0176
934
820
7824
499
1022
530
222
RTOR
Red
uctio
n (vp
h)0
820
05
00
80
05
0La
ne G
roup
Flow
(vph
)16
1788
034
893
024
410
10
225
319
0Co
nfl. P
eds.
(#/hr
)1
1Co
nfl. B
ikes (
#/hr)
15
2He
avy V
ehicl
es (%
)2%
16%
2%2%
15%
2%2%
2%2%
2%2%
2%Tu
rn T
ype
Prot
NAPr
otNA
Prot
NAPr
otNA
Prote
cted P
hase
s5
21
63
87
4Pe
rmitte
d Pha
ses
Actua
ted G
reen
, G (s
)4.8
54.4
4.654
.220
.317
.517
.214
.4Ef
fectiv
e Gre
en, g
(s)
4.854
.44.6
54.2
20.3
17.5
17.2
14.4
Actua
ted g/
C Ra
tio0.0
40.4
90.0
40.4
90.1
80.1
60.1
60.1
3Cl
eara
nce T
ime (
s)3.0
5.53.0
5.53.0
4.83.0
4.8Ve
hicle
Exten
sion (
s)2.0
3.02.0
3.03.0
2.02.0
2.0La
ne G
rp C
ap (v
ph)
7715
1974
1540
326
554
276
458
v/s R
atio P
rot
0.01
c0.58
0.02
c0.29
c0.14
0.03
c0.13
0.09
v/s R
atio P
erm
v/c R
atio
0.21
1.18
0.46
0.58
0.75
0.18
0.82
0.70
Unifo
rm D
elay,
d150
.827
.851
.519
.842
.440
.044
.945
.7Pr
ogre
ssion
Fac
tor0.7
30.5
61.0
01.0
01.0
01.0
01.0
01.0
0Inc
reme
ntal D
elay,
d20.2
83.0
1.61.6
9.10.1
15.9
3.7De
lay (s
)37
.198
.653
.121
.451
.540
.160
.849
.4Le
vel o
f Ser
vice
DF
DC
DD
ED
Appr
oach
Dela
y (s)
98.1
22.6
48.0
54.1
Appr
oach
LOS
FC
DD
Inter
secti
on S
umma
ryHC
M 20
00 C
ontro
l Dela
y67
.9HC
M 20
00 Le
vel o
f Ser
vice
EHC
M 20
00 V
olume
to C
apac
ity ra
tio1.0
2Ac
tuated
Cyc
le Le
ngth
(s)
110.0
Sum
of los
t time
(s)
16.3
Inter
secti
on C
apac
ity U
tiliza
tion
84.6%
ICU
Leve
l of S
ervic
eE
Analy
sis P
eriod
(min)
15c
Criti
cal L
ane G
roup
HC
M S
igna
lized
Inte
rsec
tion
Cap
acity
Ana
lysi
s8:
McD
owel
l Bl &
Lak
evill
e H
wy
7/1/20
15
Bayw
ood A
partm
ents
Traff
ic Im
pact
Stud
ySy
nchr
o 8 R
epor
tBa
selin
e PM
Peak
Hou
r plus
Pro
ject
W-T
rans
Move
ment
EBL
EBT
EBR
WBL
WBT
WBR
NBL
NBT
NBR
SBL
SBT
SBR
Lane
Con
figur
ation
sVo
lume (
vph)
1081
311
913
949
226
573
366
979
9121
Ideal
Flow
(vphp
l)19
0019
0019
0019
0019
0019
0019
0019
0019
0019
0019
0019
00To
tal Lo
st tim
e (s)
3.05.5
3.05.5
3.04.8
3.04.8
Lane
Util.
Fac
tor1.0
00.9
51.0
00.9
51.0
00.9
51.0
00.9
5Fr
pb, p
ed/bi
kes
1.00
1.00
1.00
1.00
1.00
1.00
1.00
1.00
Flpb,
ped/b
ikes
1.00
1.00
1.00
1.00
1.00
1.00
1.00
1.00
Frt
1.00
0.98
1.00
0.97
1.00
1.00
1.00
0.97
Flt P
rotec
ted0.9
51.0
00.9
51.0
00.9
51.0
00.9
51.0
0Sa
td. F
low (p
rot)
1770
3323
1770
3246
1770
3523
1770
3426
Flt P
ermi
tted
0.95
1.00
0.95
1.00
0.95
1.00
0.95
1.00
Satd.
Flow
(per
m)17
7033
2317
7032
4617
7035
2317
7034
26Pe
ak-h
our f
actor
, PHF
0.93
0.93
0.93
0.93
0.93
0.93
0.93
0.93
0.93
0.93
0.93
0.93
Adj. F
low (v
ph)
1187
412
814
1020
243
616
394
1085
9823
RTOR
Red
uctio
n (vp
h)0
80
014
00
10
017
0La
ne G
roup
Flow
(vph
)11
994
014
1249
061
640
30
8510
40
Confl
. Ped
s. (#
/hr)
31
13
1616
Confl
. Bike
s (#/h
r)1
52
Heav
y Veh
icles
(%)
2%7%
2%2%
9%2%
2%2%
2%2%
2%2%
Turn
Typ
ePr
otNA
Prot
NAPr
otNA
Prot
NAPr
otecte
d Pha
ses
52
16
38
74
Perm
itted P
hase
sAc
tuated
Gre
en, G
(s)
2.655
.54.0
56.9
55.0
53.3
10.9
9.2Ef
fectiv
e Gre
en, g
(s)
2.655
.54.0
56.9
55.0
53.3
10.9
9.2Ac
tuated
g/C
Ratio
0.02
0.40
0.03
0.41
0.39
0.38
0.08
0.07
Clea
ranc
e Tim
e (s)
3.05.5
3.05.5
3.04.8
3.04.8
Vehic
le Ex
tensio
n (s)
2.03.0
2.03.0
3.02.0
2.02.0
Lane
Grp
Cap
(vph
)32
1317
5013
1969
513
4113
722
5v/s
Rati
o Pro
t0.0
1c0
.300.0
1c0
.38c0
.350.1
1c0
.050.0
3v/s
Rati
o Per
mv/c
Rati
o0.3
40.7
50.2
80.9
50.8
90.3
00.6
20.4
6Un
iform
Dela
y, d1
67.9
36.4
66.6
40.1
39.6
30.3
62.5
63.0
Prog
ress
ion F
actor
1.28
0.54
1.00
1.00
1.00
1.00
1.00
1.00
Incre
menta
l Dela
y, d2
2.03.5
1.115
.013
.00.0
6.10.6
Delay
(s)
89.0
23.3
67.7
55.1
52.6
30.4
68.7
63.6
Leve
l of S
ervic
eF
CE
ED
CE
EAp
proa
ch D
elay (
s)24
.055
.243
.865
.7Ap
proa
ch LO
SC
ED
E
Inter
secti
on S
umma
ryHC
M 20
00 C
ontro
l Dela
y43
.5HC
M 20
00 Le
vel o
f Ser
vice
DHC
M 20
00 V
olume
to C
apac
ity ra
tio0.9
0Ac
tuated
Cyc
le Le
ngth
(s)
140.0
Sum
of los
t time
(s)
16.3
Inter
secti
on C
apac
ity U
tiliza
tion
83.8%
ICU
Leve
l of S
ervic
eE
Analy
sis P
eriod
(min)
15c
Criti
cal L
ane G
roup

HC
M U
nsig
naliz
ed In
ters
ectio
n C
apac
ity A
naly
sis
9: B
ayw
ood
Dr &
Per
ry L
n7/1
/2015
Bayw
ood A
partm
ents
Traff
ic Im
pact
Stud
ySy
nchr
o 8 R
epor
tBa
selin
e AM
Peak
Hou
r plus
Pro
ject
W-T
rans
Move
ment
EBL
EBT
EBR
WBL
WBT
WBR
NBL
NBT
NBR
SBL
SBT
SBR
Lane
Con
figur
ation
sVo
lume (
veh/h
)1
031
290
328
102
151
357
0Si
gn C
ontro
lSt
opSt
opFr
eeFr
eeGr
ade
0%0%
0%0%
Peak
Hou
r Fac
tor0.9
00.9
00.9
00.9
10.9
00.9
10.9
00.9
10.9
10.9
10.9
10.9
0Ho
urly
flow
rate
(vph)
10
3432
035
911
216
139
20
Pede
strian
sLa
ne W
idth (
ft)W
alking
Spe
ed (f
t/s)
Perce
nt Bl
ocka
geRi
ght tu
rn fla
re (v
eh)
Media
n typ
eTW
LTL
TWLT
LMe
dian s
torag
e veh
)2
2Up
strea
m sig
nal (f
t)27
0pX
, plat
oon u
nbloc
ked
vC, c
onflic
ting v
olume
503
541
196
371
533
6439
212
9vC
1, sta
ge 1
conf
vol
395
395
138
138
vC2,
stage
2 co
nf vo
l10
914
623
339
5vC
u, un
block
ed vo
l50
354
119
637
153
364
392
129
tC, s
ingle
(s)7.5
6.56.9
7.56.5
6.94.1
4.1tC
, 2 st
age (
s)6.5
5.56.5
5.5tF
(s)
3.54.0
3.33.5
4.03.3
2.22.2
p0 qu
eue f
ree %
100
100
9695
100
9699
100
cM ca
pacit
y (ve
h/h)
570
567
812
663
563
987
1163
1455
Dire
ction
, Lan
e #EB
1W
B 1
NB 1
NB 2
NB 3
SB 1
SB 2
SB 3
Volum
e Tota
l36
679
7554
126
213
1Vo
lume L
eft1
329
00
10
0Vo
lume R
ight
3435
00
160
00
cSH
801
800
1163
1700
1700
1455
1700
1700
Volum
e to C
apac
ity0.0
40.0
80.0
10.0
40.0
30.0
00.1
50.0
8Qu
eue L
ength
95th
(ft)
37
10
00
00
Contr
ol De
lay (s
)9.7
9.98.1
0.00.0
7.50.0
0.0La
ne LO
SA
AA
AAp
proa
ch D
elay (
s)9.7
9.90.5
0.0Ap
proa
ch LO
SA
A
Inter
secti
on S
umma
ryAv
erag
e Dela
y 1.7
Inter
secti
on C
apac
ity U
tiliza
tion
26.8%
ICU
Leve
l of S
ervic
e A
Analy
sis P
eriod
(min)
15
HC
M U
nsig
naliz
ed In
ters
ectio
n C
apac
ity A
naly
sis
9: B
ayw
ood
Dr &
Per
ry L
n7/1
/2015
Bayw
ood A
partm
ents
Traff
ic Im
pact
Stud
ySy
nchr
o 8 R
epor
tBa
selin
e PM
Peak
Hou
r plus
Pro
ject
W-T
rans
Move
ment
EBL
EBT
EBR
WBL
WBT
WBR
NBL
NBT
NBR
SBL
SBT
SBR
Lane
Con
figur
ation
sVo
lume (
veh/h
)0
016
170
1729
279
290
176
1Si
gn C
ontro
lSt
opSt
opFr
eeFr
eeGr
ade
0%0%
0%0%
Peak
Hou
r Fac
tor0.9
00.9
00.9
00.9
00.9
00.9
00.9
00.9
00.9
00.9
00.9
00.9
0Ho
urly
flow
rate
(vph)
00
1819
019
3231
032
019
61
Pede
strian
sLa
ne W
idth (
ft)W
alking
Spe
ed (f
t/s)
Perce
nt Bl
ocka
geRi
ght tu
rn fla
re (v
eh)
Media
n typ
eTW
LTL
TWLT
LMe
dian s
torag
e veh
)2
2Up
strea
m sig
nal (f
t)27
0pX
, plat
oon u
nbloc
ked
vC, c
onflic
ting v
olume
434
603
9850
658
717
119
734
2vC
1, sta
ge 1
conf
vol
196
196
391
391
vC2,
stage
2 co
nf vo
l23
840
711
619
7vC
u, un
block
ed vo
l43
460
398
506
587
171
197
342
tC, s
ingle
(s)7.5
6.56.9
7.56.5
6.94.1
4.1tC
, 2 st
age (
s)6.5
5.56.5
5.5tF
(s)
3.54.0
3.33.5
4.03.3
2.22.2
p0 qu
eue f
ree %
100
100
9897
100
9898
100
cM ca
pacit
y (ve
h/h)
640
540
938
561
544
843
1373
1214
Dire
ction
, Lan
e #EB
1W
B 1
NB 1
NB 2
NB 3
SB 1
SB 2
SB 3
Volum
e Tota
l18
3832
207
136
013
066
Volum
e Left
019
320
00
00
Volum
e Righ
t18
190
032
00
1cS
H93
867
413
7317
0017
0017
0017
0017
00Vo
lume t
o Cap
acity
0.02
0.06
0.02
0.12
0.08
0.00
0.08
0.04
Queu
e Len
gth 95
th (ft
)1
42
00
00
0Co
ntrol
Delay
(s)
8.910
.77.7
0.00.0
0.00.0
0.0La
ne LO
SA
BA
Appr
oach
Dela
y (s)
8.910
.70.7
0.0Ap
proa
ch LO
SA
B
Inter
secti
on S
umma
ryAv
erag
e Dela
y 1.3
Inter
secti
on C
apac
ity U
tiliza
tion
30.6%
ICU
Leve
l of S
ervic
e A
Analy
sis P
eriod
(min)
15
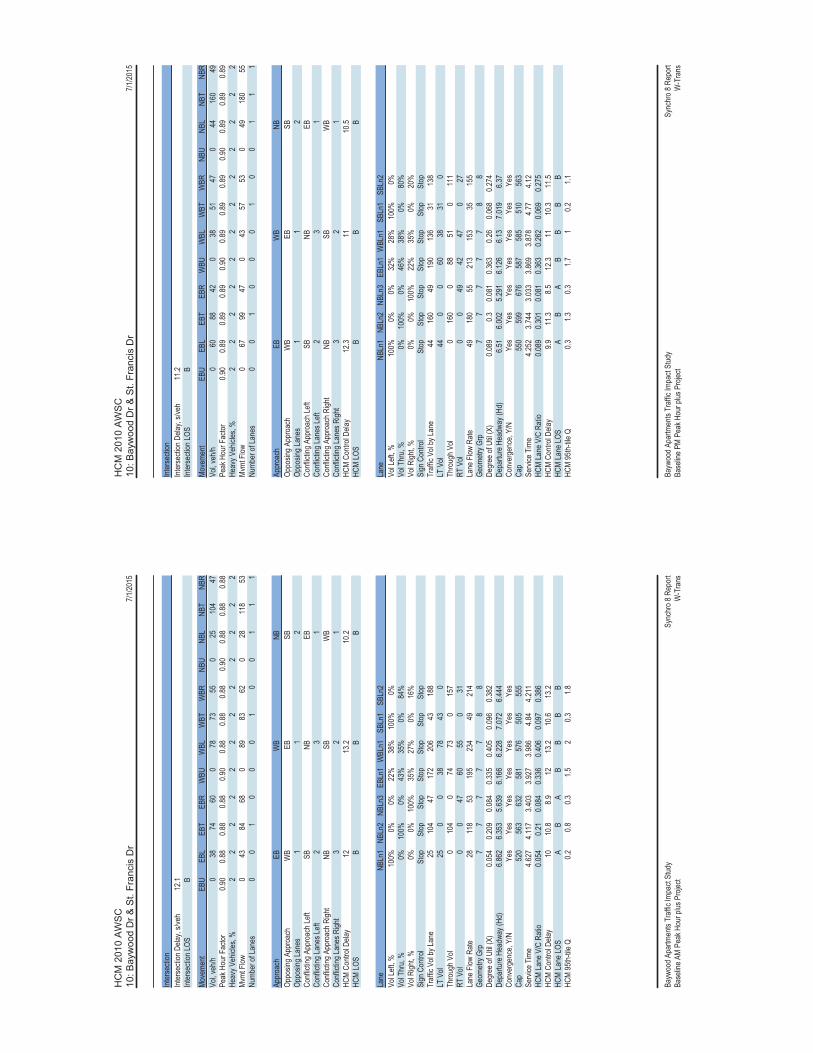
HC
M 2
010
AW
SC
10: B
ayw
ood
Dr &
St.
Fran
cis
Dr
7/1/20
15
Bayw
ood A
partm
ents
Traff
ic Im
pact
Stud
ySy
nchr
o 8 R
epor
tBa
selin
e AM
Peak
Hou
r plus
Pro
ject
W-T
rans
Inter
secti
onInt
erse
ction
Dela
y, s/v
eh12
.1Int
erse
ction
LOS
B
Move
ment
EBU
EBL
EBT
EBR
WBU
WBL
WBT
WBR
NBU
NBL
NBT
NBR
Vol, v
eh/h
038
7460
078
7355
025
104
47Pe
ak H
our F
actor
0.90
0.88
0.88
0.88
0.90
0.88
0.88
0.88
0.90
0.88
0.88
0.88
Heav
y Veh
icles
, %2
22
22
22
22
22
2Mv
mt F
low0
4384
680
8983
620
2811
853
Numb
er of
Lane
s0
01
00
01
00
11
1
Appr
oach
EBW
BNB
Oppo
sing A
ppro
ach
WB
EBSB
Oppo
sing L
anes
11
2Co
nflict
ing A
ppro
ach L
eftSB
NBEB
Confl
icting
Lane
s Left
23
1Co
nflict
ing A
ppro
ach R
ight
NBSB
WB
Confl
icting
Lane
s Righ
t3
21
HCM
Contr
ol De
lay12
13.2
10.2
HCM
LOS
BB
B
Lane
NBLn
1NB
Ln2
NBLn
3EB
Ln1
WBL
n1SB
Ln1
SBLn
2Vo
l Left
, %10
0%0%
0%22
%38
%10
0%0%
Vol T
hru,
%0%
100%
0%43
%35
%0%
84%
Vol R
ight, %
0%0%
100%
35%
27%
0%16
%Si
gn C
ontro
lSt
opSt
opSt
opSt
opSt
opSt
opSt
opTr
affic
Vol b
y Lan
e25
104
4717
220
643
188
LT V
ol25
00
3878
430
Thro
ugh V
ol0
104
074
730
157
RT V
ol0
047
6055
031
Lane
Flow
Rate
2811
853
195
234
4921
4Ge
ometr
y Grp
77
77
78
8De
gree
of U
til (X
)0.0
540.2
090.0
840.3
350.4
050.0
960.3
82De
partu
re H
eadw
ay (H
d)6.8
626.3
535.6
396.1
666.2
287.0
726.4
44Co
nver
genc
e, Y/
NYe
sYe
sYe
sYe
sYe
sYe
sYe
sCa
p52
056
363
258
157
650
555
5Se
rvice
Tim
e4.6
274.1
173.4
033.9
273.9
864.8
44.2
11HC
M La
ne V
/C R
atio
0.054
0.21
0.084
0.336
0.406
0.097
0.386
HCM
Contr
ol De
lay10
10.8
8.912
13.2
10.6
13.2
HCM
Lane
LOS
AB
AB
BB
BHC
M 95
th-tile
Q0.2
0.80.3
1.52
0.31.8
HC
M 2
010
AW
SC
10: B
ayw
ood
Dr &
St.
Fran
cis
Dr
7/1/20
15
Bayw
ood A
partm
ents
Traff
ic Im
pact
Stud
ySy
nchr
o 8 R
epor
tBa
selin
e PM
Peak
Hou
r plus
Pro
ject
W-T
rans
Inter
secti
onInt
erse
ction
Dela
y, s/v
eh11
.2Int
erse
ction
LOS
B
Move
ment
EBU
EBL
EBT
EBR
WBU
WBL
WBT
WBR
NBU
NBL
NBT
NBR
Vol, v
eh/h
060
8842
038
5147
044
160
49Pe
ak H
our F
actor
0.90
0.89
0.89
0.89
0.90
0.89
0.89
0.89
0.90
0.89
0.89
0.89
Heav
y Veh
icles
, %2
22
22
22
22
22
2Mv
mt F
low0
6799
470
4357
530
4918
055
Numb
er of
Lane
s0
01
00
01
00
11
1
Appr
oach
EBW
BNB
Oppo
sing A
ppro
ach
WB
EBSB
Oppo
sing L
anes
11
2Co
nflict
ing A
ppro
ach L
eftSB
NBEB
Confl
icting
Lane
s Left
23
1Co
nflict
ing A
ppro
ach R
ight
NBSB
WB
Confl
icting
Lane
s Righ
t3
21
HCM
Contr
ol De
lay12
.311
10.5
HCM
LOS
BB
B
Lane
NBLn
1NB
Ln2
NBLn
3EB
Ln1
WBL
n1SB
Ln1
SBLn
2Vo
l Left
, %10
0%0%
0%32
%28
%10
0%0%
Vol T
hru,
%0%
100%
0%46
%38
%0%
80%
Vol R
ight, %
0%0%
100%
22%
35%
0%20
%Si
gn C
ontro
lSt
opSt
opSt
opSt
opSt
opSt
opSt
opTr
affic
Vol b
y Lan
e44
160
4919
013
631
138
LT V
ol44
00
6038
310
Thro
ugh V
ol0
160
088
510
111
RT V
ol0
049
4247
027
Lane
Flow
Rate
4918
055
213
153
3515
5Ge
ometr
y Grp
77
77
78
8De
gree
of U
til (X
)0.0
890.3
0.081
0.363
0.26
0.068
0.274
Depa
rture
Hea
dway
(Hd)
6.51
6.002
5.291
6.126
6.13
7.019
6.37
Conv
erge
nce,
Y/N
Yes
Yes
Yes
Yes
Yes
Yes
Yes
Cap
550
599
676
587
585
510
563
Servi
ce T
ime
4.252
3.744
3.033
3.869
3.878
4.77
4.12
HCM
Lane
V/C
Rati
o0.0
890.3
010.0
810.3
630.2
620.0
690.2
75HC
M Co
ntrol
Delay
9.911
.38.5
12.3
1110
.311
.5HC
M La
ne LO
SA
BA
BB
BB
HCM
95th-
tile Q
0.31.3
0.31.7
10.2
1.1

HC
M 2
010
AW
SC
10: B
ayw
ood
Dr &
St.
Fran
cis
Dr
7/1/20
15
Bayw
ood A
partm
ents
Traff
ic Im
pact
Stud
ySy
nchr
o 8 R
epor
tBa
selin
e AM
Peak
Hou
r plus
Pro
ject
W-T
rans
Inter
secti
onInt
erse
ction
Dela
y, s/v
ehInt
erse
ction
LOS
Move
ment
SBU
SBL
SBT
SBR
Vol, v
eh/h
043
157
31Pe
ak H
our F
actor
0.90
0.88
0.88
0.88
Heav
y Veh
icles
, %2
22
2Mv
mt F
low0
4917
835
Numb
er of
Lane
s0
11
0
Appr
oach
SBOp
posin
g App
roac
hNB
Oppo
sing L
anes
3Co
nflict
ing A
ppro
ach L
eftW
BCo
nflict
ing La
nes L
eft1
Confl
icting
App
roac
h Righ
tEB
Confl
icting
Lane
s Righ
t1
HCM
Contr
ol De
lay12
.7HC
M LO
SB
Lane
HC
M 2
010
AW
SC
10: B
ayw
ood
Dr &
St.
Fran
cis
Dr
7/1/20
15
Bayw
ood A
partm
ents
Traff
ic Im
pact
Stud
ySy
nchr
o 8 R
epor
tBa
selin
e PM
Peak
Hou
r plus
Pro
ject
W-T
rans
Inter
secti
onInt
erse
ction
Dela
y, s/v
ehInt
erse
ction
LOS
Move
ment
SBU
SBL
SBT
SBR
Vol, v
eh/h
031
111
27Pe
ak H
our F
actor
0.90
0.89
0.89
0.89
Heav
y Veh
icles
, %2
22
2Mv
mt F
low0
3512
530
Numb
er of
Lane
s0
11
0
Appr
oach
SBOp
posin
g App
roac
hNB
Oppo
sing L
anes
3Co
nflict
ing A
ppro
ach L
eftW
BCo
nflict
ing La
nes L
eft1
Confl
icting
App
roac
h Righ
tEB
Confl
icting
Lane
s Righ
t1
HCM
Contr
ol De
lay11
.3HC
M LO
SB
Lane

MO
VEM
ENT
SUM
MA
RYSi
te:S
McD
owel
l Bl &
Bay
woo
d D
r (A
M B
asel
ine
+ Pr
ojec
t) A
M P
eak
Hou
rB
asel
ine
plus
Pro
ject
Con
ditio
nsR
ound
abou
t
Mov
emen
t Per
form
ance
-Ve
hicl
esD
eman
d Fl
ows
95%
Bac
k of
Que
ueM
ov IDO
DM
ovD
eg.
Satn
Aver
age
Del
ay
Leve
l of
Serv
ice
Prop
. Q
ueue
dEf
fect
ive
Stop
Rat
eAv
erag
eSp
eed
To
tal
HV
Vehi
cles
Dis
tanc
eve
h/h
%v/
cse
cve
hft
per v
ehm
phSo
uth:
NB
Bay
woo
d D
r3
L212
52.
00.
350
8.6
LOS
A1.
742
.50.
650.
6423
.78
T180
2.0
0.35
08.
6LO
S A
1.7
42.5
0.65
0.64
23.2
18R
277
2.0
0.35
08.
6LO
S A
1.7
42.5
0.65
0.64
22.6
Appr
oach
282
2.0
0.35
08.
6LO
S A
1.7
42.5
0.65
0.64
23.2
East
: WB
S M
cDow
ell B
l1
L242
2.0
0.46
88.
4LO
S A
3.0
75.1
0.55
0.41
30.8
6T1
457
2.0
0.46
88.
4LO
S A
3.0
75.1
0.55
0.41
30.6
16R
220
2.0
0.46
88.
4LO
S A
3.0
75.1
0.55
0.41
29.7
Appr
oach
519
2.0
0.46
88.
4LO
S A
3.0
75.1
0.55
0.41
30.6
Nor
th: S
B B
ayw
ood
Dr
7L2
422.
00.
352
9.2
LOS
A1.
742
.30.
670.
6923
.94
T114
32.
00.
352
9.2
LOS
A1.
742
.30.
670.
6923
.414
R2
772.
00.
352
9.2
LOS
A1.
742
.30.
670.
6922
.8Ap
proa
ch26
22.
00.
352
9.2
LOS
A1.
742
.30.
670.
6923
.3
Wes
t: E
B S
McD
owel
l Bl
5L2
292.
00.
524
9.3
LOS
A3.
690
.90.
580.
4430
.52
T147
62.
00.
524
9.3
LOS
A3.
690
.90.
580.
4430
.312
R2
812.
00.
524
9.3
LOS
A3.
690
.90.
580.
4429
.4Ap
proa
ch58
62.
00.
524
9.3
LOS
A3.
690
.90.
580.
4430
.1
All V
ehic
les
1649
2.0
0.52
48.
9LO
S A
3.6
90.9
0.60
0.50
27.6
Leve
l of S
ervi
ce (L
OS)
Met
hod:
Del
ay &
v/c
(HC
M 2
010)
. R
ound
abou
t LO
S M
etho
d: S
ame
as S
igna
lised
Inte
rsec
tions
.Ve
hicl
e m
ovem
ent L
OS
val
ues
are
base
d on
ave
rage
del
ay a
nd v
/c ra
tio (d
egre
e of
sat
urat
ion)
per
mov
emen
tLO
S F
will
resu
lt if
v/c
> 1
irres
pect
ive
of m
ovem
ent d
elay
val
ue (d
oes
not a
pply
for a
ppro
ache
s an
d in
ters
ectio
n).
Inte
rsec
tion
and
Appr
oach
LO
S va
lues
are
bas
ed o
n av
erag
e de
lay
for a
ll m
ovem
ents
(v/c
not
use
d as
spe
cifie
d in
HC
M 2
010)
.R
ound
abou
t Cap
acity
Mod
el: U
S H
CM
201
0.H
CM
Del
ay F
orm
ula
optio
n is
use
d. C
ontro
l Del
ay d
oes
not i
nclu
de G
eom
etric
Del
ay s
ince
Exc
lude
Geo
met
ric D
elay
opt
ion
appl
ies.
Gap
-Acc
epta
nce
Cap
acity
: Tra
ditio
nal M
1.H
V (%
) val
ues
are
calc
ulat
ed fo
r All
Mov
emen
t Cla
sses
of A
ll H
eavy
Veh
icle
Mod
el D
esig
natio
n.
Pro
cess
ed: F
riday
, May
22,
201
5 2:
14:4
4 P
MS
IDR
A IN
TER
SEC
TIO
N 6
.0.2
4.48
77C
opyr
ight
© 2
000-
2014
Akc
elik
and
Ass
ocia
tes
Pty
Ltd
ww
w.s
idra
solu
tions
.com
Pro
ject
: N
:\AAA
\SO
X\PE
T\19
1PET
\SID
RA\
Bayw
ood-
McD
owel
l.sip
680
0049
3, 6
0191
58, W
-TR
ANS
, PLU
S /
Floa
ting
MO
VEM
ENT
SUM
MA
RYSi
te:S
McD
owel
l Bl &
Bay
woo
d D
r (PM
Bas
elin
e +
Proj
ect)
PM
Pea
k H
our
Bas
elin
e pl
us P
roje
ct C
ondi
tions
Rou
ndab
out
Mov
emen
t Per
form
ance
-Ve
hicl
esD
eman
d Fl
ows
95%
Bac
k of
Que
ueM
ov IDO
DM
ovD
eg.
Satn
Aver
age
Del
ay
Leve
l of
Serv
ice
Prop
. Q
ueue
dEf
fect
ive
Stop
Rat
eAv
erag
eSp
eed
To
tal
HV
Vehi
cles
Dis
tanc
eve
h/h
%v/
cse
cve
hft
per v
ehm
phSo
uth:
NB
Bay
woo
d D
r3
L293
2.0
0.30
97.
5LO
S A
1.5
37.8
0.60
0.55
24.1
8T1
127
2.0
0.30
97.
5LO
S A
1.5
37.8
0.60
0.55
23.6
18R
252
2.0
0.30
97.
5LO
S A
1.5
37.8
0.60
0.55
23.0
Appr
oach
273
2.0
0.30
97.
5LO
S A
1.5
37.8
0.60
0.55
23.7
East
: WB
S M
cDow
ell B
l1
L268
2.0
0.75
316
.7LO
S B
9.2
233.
50.
860.
8327
.76
T169
62.
00.
753
16.7
LOS
B9.
223
3.5
0.86
0.83
27.5
16R
232
2.0
0.75
316
.7LO
S B
9.2
233.
50.
860.
8326
.8Ap
proa
ch79
62.
00.
753
16.7
LOS
B9.
223
3.5
0.86
0.83
27.5
Nor
th: S
B B
ayw
ood
Dr
7L2
142.
00.
197
8.6
LOS
A0.
819
.80.
670.
6724
.04
T164
2.0
0.19
78.
6LO
S A
0.8
19.8
0.67
0.67
23.6
14R
237
2.0
0.19
78.
6LO
S A
0.8
19.8
0.67
0.67
23.0
Appr
oach
115
2.0
0.19
78.
6LO
S A
0.8
19.8
0.67
0.67
23.4
Wes
t: E
B S
McD
owel
l Bl
5L2
602.
00.
460
7.8
LOS
A3.
178
.10.
450.
2831
.02
T138
62.
00.
460
7.8
LOS
A3.
178
.10.
450.
2830
.812
R2
112
2.0
0.46
07.
8LO
S A
3.1
78.1
0.45
0.28
29.9
Appr
oach
557
2.0
0.46
07.
8LO
S A
3.1
78.1
0.45
0.28
30.6
All V
ehic
les
1742
2.0
0.75
311
.9LO
S B
9.2
233.
50.
670.
6027
.4
Leve
l of S
ervi
ce (L
OS)
Met
hod:
Del
ay &
v/c
(HC
M 2
010)
. R
ound
abou
t LO
S M
etho
d: S
ame
as S
igna
lised
Inte
rsec
tions
.Ve
hicl
e m
ovem
ent L
OS
val
ues
are
base
d on
ave
rage
del
ay a
nd v
/c ra
tio (d
egre
e of
sat
urat
ion)
per
mov
emen
tLO
S F
will
resu
lt if
v/c
> 1
irres
pect
ive
of m
ovem
ent d
elay
val
ue (d
oes
not a
pply
for a
ppro
ache
s an
d in
ters
ectio
n).
Inte
rsec
tion
and
Appr
oach
LO
S va
lues
are
bas
ed o
n av
erag
e de
lay
for a
ll m
ovem
ents
(v/c
not
use
d as
spe
cifie
d in
HC
M 2
010)
.R
ound
abou
t Cap
acity
Mod
el: U
S H
CM
201
0.H
CM
Del
ay F
orm
ula
optio
n is
use
d. C
ontro
l Del
ay d
oes
not i
nclu
de G
eom
etric
Del
ay s
ince
Exc
lude
Geo
met
ric D
elay
opt
ion
appl
ies.
Gap
-Acc
epta
nce
Cap
acity
: Tra
ditio
nal M
1.H
V (%
) val
ues
are
calc
ulat
ed fo
r All
Mov
emen
t Cla
sses
of A
ll H
eavy
Veh
icle
Mod
el D
esig
natio
n.
Pro
cess
ed: F
riday
, May
22,
201
5 2:
14:4
8 P
MS
IDR
A IN
TER
SEC
TIO
N 6
.0.2
4.48
77C
opyr
ight
© 2
000-
2014
Akc
elik
and
Ass
ocia
tes
Pty
Ltd
ww
w.s
idra
solu
tions
.com
Pro
ject
: N
:\AAA
\SO
X\PE
T\19
1PET
\SID
RA\
Bayw
ood-
McD
owel
l.sip
680
0049
3, 6
0191
58, W
-TR
ANS
, PLU
S /
Floa
ting

HC
M S
igna
lized
Inte
rsec
tion
Cap
acity
Ana
lysi
s1:
Was
hing
ton
St &
Lak
evill
e S
t5/2
2/201
5
Sync
hro 8
Rep
ort
Altur
a Ap
artm
ents
Traff
ic Im
pact
Stud
y Fu
ture A
M Pe
ak H
our -
plus
Pro
ject
W-T
rans
Move
ment
EBL
EBT
EBR
WBL
WBT
WBR
NBL
NBT
NBR
SBL
SBT
SBR
Lane
Con
figur
ation
sVo
lume (
vph)
4424
140
231
213
128
5057
417
114
385
754
Ideal
Flow
(vphp
l)19
0019
0019
0019
0019
0019
0019
0019
0019
0019
0019
0019
00To
tal Lo
st tim
e (s)
4.24.2
4.24.0
4.24.0
4.2La
ne U
til. F
actor
1.00
1.00
1.00
1.00
0.95
1.00
0.95
Frpb
, ped
/bike
s1.0
01.0
00.9
91.0
00.9
81.0
01.0
0Flp
b, pe
d/bike
s1.0
01.0
01.0
01.0
01.0
01.0
01.0
0Fr
t0.9
81.0
00.9
41.0
00.9
71.0
00.9
9Flt
Pro
tected
0.99
0.95
1.00
0.95
1.00
0.95
1.00
Satd.
Flow
(pro
t)17
1317
7016
4717
7033
5117
7034
99Flt
Per
mitte
d0.9
90.9
51.0
00.9
51.0
00.9
51.0
0Sa
td. F
low (p
erm)
1713
1770
1647
1770
3351
1770
3499
Peak
-hou
r fac
tor, P
HF1.0
01.0
01.0
01.0
01.0
01.0
01.0
01.0
01.0
01.0
01.0
01.0
0Ad
j. Flow
(vph
)44
241
4023
121
312
850
574
171
143
857
54RT
OR R
educ
tion (
vph)
00
00
160
021
00
30
Lane
Gro
up F
low (v
ph)
032
50
231
325
050
724
014
390
80
Confl
. Ped
s. (#
/hr)
67
76
418
184
Confl
. Bike
s (#/h
r)8
1320
12He
avy V
ehicl
es (%
)2%
10%
2%2%
11%
2%2%
2%2%
2%2%
2%Tu
rn T
ype
Split
NASp
litNA
Prot
NAPr
otNA
Prote
cted P
hase
s7
78
85
21
6Pe
rmitte
d Pha
ses
Actua
ted G
reen
, G (s
)26
.627
.327
.34.5
33.9
12.6
42.0
Effec
tive G
reen
, g (s
)26
.627
.327
.34.5
33.9
12.6
42.0
Actua
ted g/
C Ra
tio0.2
30.2
30.2
30.0
40.2
90.1
10.3
6Cl
eara
nce T
ime (
s)4.2
4.24.2
4.04.2
4.04.2
Vehic
le Ex
tensio
n (s)
2.52.5
2.52.0
4.02.0
4.0La
ne G
rp C
ap (v
ph)
389
413
384
6897
019
012
56v/s
Rati
o Pro
tc0
.190.1
3c0
.200.0
30.2
2c0
.08c0
.26v/s
Rati
o Per
mv/c
Rati
o0.8
40.5
60.8
50.7
40.7
50.7
50.7
2Un
iform
Dela
y, d1
43.1
39.5
42.8
55.7
37.7
50.7
32.5
Prog
ress
ion F
actor
1.00
1.00
1.00
1.00
1.00
1.00
1.00
Incre
menta
l Dela
y, d2
14.1
1.315
.429
.53.4
13.8
2.2De
lay (s
)57
.240
.958
.385
.141
.064
.534
.7Le
vel o
f Ser
vice
ED
EF
DE
CAp
proa
ch D
elay (
s)57
.251
.243
.838
.7Ap
proa
ch LO
SE
DD
D
Inter
secti
on S
umma
ryHC
M 20
00 C
ontro
l Dela
y45
.0HC
M 20
00 Le
vel o
f Ser
vice
DHC
M 20
00 V
olume
to C
apac
ity ra
tio0.8
1Ac
tuated
Cyc
le Le
ngth
(s)
117.0
Sum
of los
t time
(s)
16.6
Inter
secti
on C
apac
ity U
tiliza
tion
82.6%
ICU
Leve
l of S
ervic
eE
Analy
sis P
eriod
(min)
15c
Criti
cal L
ane G
roup
HC
M S
igna
lized
Inte
rsec
tion
Cap
acity
Ana
lysi
s1:
Was
hing
ton
St &
Lak
evill
e S
t5/2
2/201
5
Sync
hro 8
Rep
ort
Altur
a Ap
artm
ents
Traff
ic Im
pact
Stud
y Fu
ture P
M Pe
ak H
our p
lus P
rojec
tW
-Tra
ns
Move
ment
EBL
EBT
EBR
WBL
WBT
WBR
NBL
NBT
NBR
SBL
SBT
SBR
Lane
Con
figur
ation
sVo
lume (
vph)
6026
280
451
321
156
6876
725
811
810
2312
2Ide
al Flo
w (vp
hpl)
1900
1900
1900
1900
1900
1900
1900
1900
1900
1900
1900
1900
Total
Lost
time (
s)4.2
4.24.2
4.04.2
4.04.2
Lane
Util.
Fac
tor1.0
01.0
01.0
01.0
00.9
51.0
00.9
5Fr
pb, p
ed/bi
kes
0.99
1.00
0.98
1.00
0.97
1.00
0.99
Flpb,
ped/b
ikes
1.00
1.00
1.00
1.00
1.00
1.00
1.00
Frt
0.97
1.00
0.95
1.00
0.96
1.00
0.98
Flt P
rotec
ted0.9
90.9
51.0
00.9
51.0
00.9
51.0
0Sa
td. F
low (p
rot)
1738
1770
1682
1770
3298
1770
3462
Flt P
ermi
tted
0.99
0.95
1.00
0.95
1.00
0.95
1.00
Satd.
Flow
(per
m)17
3817
7016
8217
7032
9817
7034
62Pe
ak-h
our f
actor
, PHF
1.00
1.00
1.00
1.00
1.00
1.00
1.00
1.00
1.00
1.00
1.00
1.00
Adj. F
low (v
ph)
6026
280
451
321
156
6876
725
811
810
2312
2RT
OR R
educ
tion (
vph)
00
00
120
024
00
70
Lane
Gro
up F
low (v
ph)
040
20
451
465
068
1001
011
811
380
Confl
. Ped
s. (#
/hr)
2818
1828
732
327
Confl
. Bike
s (#/h
r)8
1320
12He
avy V
ehicl
es (%
)2%
6%2%
2%7%
2%2%
2%2%
2%2%
2%Tu
rn T
ype
Split
NASp
litNA
Prot
NAPr
otNA
Prote
cted P
hase
s7
78
85
21
6Pe
rmitte
d Pha
ses
Actua
ted G
reen
, G (s
)32
.237
.837
.86.0
44.4
9.047
.4Ef
fectiv
e Gre
en, g
(s)
32.2
37.8
37.8
6.044
.49.0
47.4
Actua
ted g/
C Ra
tio0.2
30.2
70.2
70.0
40.3
20.0
60.3
4Cl
eara
nce T
ime (
s)4.2
4.24.2
4.04.2
4.04.2
Vehic
le Ex
tensio
n (s)
2.52.5
2.52.0
4.02.0
4.0La
ne G
rp C
ap (v
ph)
399
477
454
7510
4511
311
72v/s
Rati
o Pro
tc0
.230.2
5c0
.280.0
4c0
.300.0
7c0
.33v/s
Rati
o Per
mv/c
Rati
o1.0
10.9
51.0
20.9
10.9
61.0
40.9
7Un
iform
Dela
y, d1
53.9
50.1
51.1
66.7
46.9
65.5
45.6
Prog
ress
ion F
actor
1.00
0.90
0.90
1.00
1.00
1.00
1.00
Incre
menta
l Dela
y, d2
46.9
18.2
37.0
71.0
19.4
97.0
20.2
Delay
(s)
100.8
63.5
83.1
137.8
66.3
162.5
65.9
Leve
l of S
ervic
eF
EF
FE
FE
Appr
oach
Dela
y (s)
100.8
73.6
70.7
74.9
Appr
oach
LOS
FE
EE
Inter
secti
on S
umma
ryHC
M 20
00 C
ontro
l Dela
y76
.2HC
M 20
00 Le
vel o
f Ser
vice
EHC
M 20
00 V
olume
to C
apac
ity ra
tio1.0
1Ac
tuated
Cyc
le Le
ngth
(s)
140.0
Sum
of los
t time
(s)
16.6
Inter
secti
on C
apac
ity U
tiliza
tion
100.2
%IC
U Le
vel o
f Ser
vice
GAn
alysis
Per
iod (m
in)15
c C
ritica
l Lan
e Gro
up
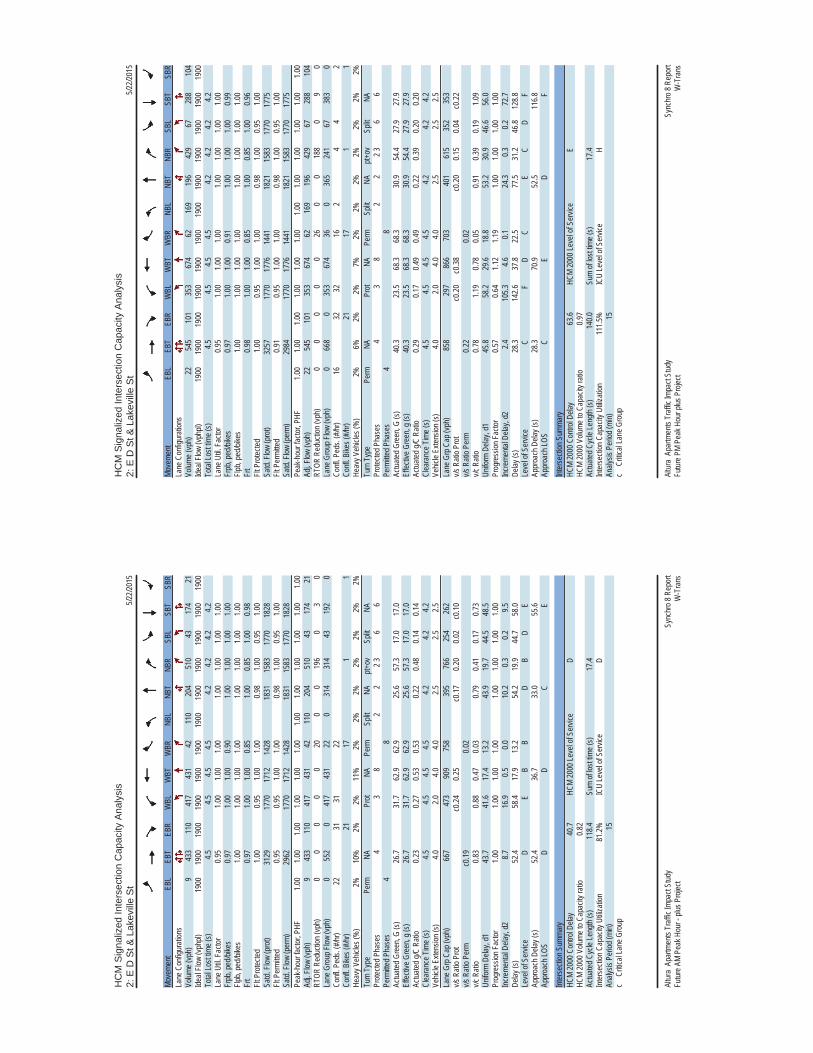
HC
M S
igna
lized
Inte
rsec
tion
Cap
acity
Ana
lysi
s2:
E D
St &
Lak
evill
e S
t5/2
2/201
5
Sync
hro 8
Rep
ort
Altur
a Ap
artm
ents
Traff
ic Im
pact
Stud
y Fu
ture A
M Pe
ak H
our -
plus
Pro
ject
W-T
rans
Move
ment
EBL
EBT
EBR
WBL
WBT
WBR
NBL
NBT
NBR
SBL
SBT
SBR
Lane
Con
figur
ation
sVo
lume (
vph)
943
311
041
743
142
110
204
510
4317
421
Ideal
Flow
(vphp
l)19
0019
0019
0019
0019
0019
0019
0019
0019
0019
0019
0019
00To
tal Lo
st tim
e (s)
4.54.5
4.54.5
4.24.2
4.24.2
Lane
Util.
Fac
tor0.9
51.0
01.0
01.0
01.0
01.0
01.0
01.0
0Fr
pb, p
ed/bi
kes
0.97
1.00
1.00
0.90
1.00
1.00
1.00
1.00
Flpb,
ped/b
ikes
1.00
1.00
1.00
1.00
1.00
1.00
1.00
1.00
Frt
0.97
1.00
1.00
0.85
1.00
0.85
1.00
0.98
Flt P
rotec
ted1.0
00.9
51.0
01.0
00.9
81.0
00.9
51.0
0Sa
td. F
low (p
rot)
3129
1770
1712
1428
1831
1583
1770
1828
Flt P
ermi
tted
0.95
0.95
1.00
1.00
0.98
1.00
0.95
1.00
Satd.
Flow
(per
m)29
6217
7017
1214
2818
3115
8317
7018
28Pe
ak-h
our f
actor
, PHF
1.00
1.00
1.00
1.00
1.00
1.00
1.00
1.00
1.00
1.00
1.00
1.00
Adj. F
low (v
ph)
943
311
041
743
142
110
204
510
4317
421
RTOR
Red
uctio
n (vp
h)0
00
00
200
019
60
30
Lane
Gro
up F
low (v
ph)
055
20
417
431
220
314
314
4319
20
Confl
. Ped
s. (#
/hr)
2231
3122
Confl
. Bike
s (#/h
r)21
171
1He
avy V
ehicl
es (%
)2%
10%
2%2%
11%
2%2%
2%2%
2%2%
2%Tu
rn T
ype
Perm
NAPr
otNA
Perm
Split
NApt+
ovSp
litNA
Prote
cted P
hase
s4
38
22
2 36
6Pe
rmitte
d Pha
ses
48
Actua
ted G
reen
, G (s
)26
.731
.762
.962
.925
.657
.317
.017
.0Ef
fectiv
e Gre
en, g
(s)
26.7
31.7
62.9
62.9
25.6
57.3
17.0
17.0
Actua
ted g/
C Ra
tio0.2
30.2
70.5
30.5
30.2
20.4
80.1
40.1
4Cl
eara
nce T
ime (
s)4.5
4.54.5
4.54.2
4.24.2
Vehic
le Ex
tensio
n (s)
4.02.0
4.04.0
2.52.5
2.5La
ne G
rp C
ap (v
ph)
667
473
909
758
395
766
254
262
v/s R
atio P
rot
c0.24
0.25
c0.17
0.20
0.02
c0.10
v/s R
atio P
erm
c0.19
0.02
v/c R
atio
0.83
0.88
0.47
0.03
0.79
0.41
0.17
0.73
Unifo
rm D
elay,
d143
.741
.617
.413
.243
.919
.744
.548
.5Pr
ogre
ssion
Fac
tor1.0
01.0
01.0
01.0
01.0
01.0
01.0
01.0
0Inc
reme
ntal D
elay,
d28.7
16.9
0.50.0
10.2
0.30.2
9.5De
lay (s
)52
.458
.417
.913
.254
.219
.944
.758
.0Le
vel o
f Ser
vice
DE
BB
DB
DE
Appr
oach
Dela
y (s)
52.4
36.7
33.0
55.6
Appr
oach
LOS
DD
CE
Inter
secti
on S
umma
ryHC
M 20
00 C
ontro
l Dela
y40
.7HC
M 20
00 Le
vel o
f Ser
vice
DHC
M 20
00 V
olume
to C
apac
ity ra
tio0.8
2Ac
tuated
Cyc
le Le
ngth
(s)
118.4
Sum
of los
t time
(s)
17.4
Inter
secti
on C
apac
ity U
tiliza
tion
81.2%
ICU
Leve
l of S
ervic
eD
Analy
sis P
eriod
(min)
15c
Criti
cal L
ane G
roup
HC
M S
igna
lized
Inte
rsec
tion
Cap
acity
Ana
lysi
s2:
E D
St &
Lak
evill
e S
t5/2
2/201
5
Sync
hro 8
Rep
ort
Altur
a Ap
artm
ents
Traff
ic Im
pact
Stud
y Fu
ture P
M Pe
ak H
our p
lus P
rojec
tW
-Tra
ns
Move
ment
EBL
EBT
EBR
WBL
WBT
WBR
NBL
NBT
NBR
SBL
SBT
SBR
Lane
Con
figur
ation
sVo
lume (
vph)
2254
510
135
367
462
169
196
429
6728
810
4Ide
al Flo
w (vp
hpl)
1900
1900
1900
1900
1900
1900
1900
1900
1900
1900
1900
1900
Total
Lost
time (
s)4.5
4.54.5
4.54.2
4.24.2
4.2La
ne U
til. F
actor
0.95
1.00
1.00
1.00
1.00
1.00
1.00
1.00
Frpb
, ped
/bike
s0.9
71.0
01.0
00.9
11.0
01.0
01.0
00.9
9Flp
b, pe
d/bike
s1.0
01.0
01.0
01.0
01.0
01.0
01.0
01.0
0Fr
t0.9
81.0
01.0
00.8
51.0
00.8
51.0
00.9
6Flt
Pro
tected
1.00
0.95
1.00
1.00
0.98
1.00
0.95
1.00
Satd.
Flow
(pro
t)32
5717
7017
7614
4118
2115
8317
7017
75Flt
Per
mitte
d0.9
10.9
51.0
01.0
00.9
81.0
00.9
51.0
0Sa
td. F
low (p
erm)
2984
1770
1776
1441
1821
1583
1770
1775
Peak
-hou
r fac
tor, P
HF1.0
01.0
01.0
01.0
01.0
01.0
01.0
01.0
01.0
01.0
01.0
01.0
0Ad
j. Flow
(vph
)22
545
101
353
674
6216
919
642
967
288
104
RTOR
Red
uctio
n (vp
h)0
00
00
260
018
80
90
Lane
Gro
up F
low (v
ph)
066
80
353
674
360
365
241
6738
30
Confl
. Ped
s. (#
/hr)
1632
3216
24
42
Confl
. Bike
s (#/h
r)21
171
1He
avy V
ehicl
es (%
)2%
6%2%
2%7%
2%2%
2%2%
2%2%
2%Tu
rn T
ype
Perm
NAPr
otNA
Perm
Split
NApt+
ovSp
litNA
Prote
cted P
hase
s4
38
22
2 36
6Pe
rmitte
d Pha
ses
48
Actua
ted G
reen
, G (s
)40
.323
.568
.368
.330
.954
.427
.927
.9Ef
fectiv
e Gre
en, g
(s)
40.3
23.5
68.3
68.3
30.9
54.4
27.9
27.9
Actua
ted g/
C Ra
tio0.2
90.1
70.4
90.4
90.2
20.3
90.2
00.2
0Cl
eara
nce T
ime (
s)4.5
4.54.5
4.54.2
4.24.2
Vehic
le Ex
tensio
n (s)
4.02.0
4.04.0
2.52.5
2.5La
ne G
rp C
ap (v
ph)
858
297
866
703
401
615
352
353
v/s R
atio P
rot
c0.20
c0.38
c0.20
0.15
0.04
c0.22
v/s R
atio P
erm
0.22
0.02
v/c R
atio
0.78
1.19
0.78
0.05
0.91
0.39
0.19
1.09
Unifo
rm D
elay,
d145
.858
.229
.618
.853
.230
.946
.656
.0Pr
ogre
ssion
Fac
tor0.5
70.6
41.1
21.1
91.0
01.0
01.0
01.0
0Inc
reme
ntal D
elay,
d22.4
105.3
4.60.1
24.3
0.30.2
72.7
Delay
(s)
28.3
142.6
37.8
22.5
77.5
31.2
46.8
128.8
Leve
l of S
ervic
eC
FD
CE
CD
FAp
proa
ch D
elay (
s)28
.370
.952
.511
6.8Ap
proa
ch LO
SC
ED
F
Inter
secti
on S
umma
ryHC
M 20
00 C
ontro
l Dela
y63
.6HC
M 20
00 Le
vel o
f Ser
vice
EHC
M 20
00 V
olume
to C
apac
ity ra
tio0.9
7Ac
tuated
Cyc
le Le
ngth
(s)
140.0
Sum
of los
t time
(s)
17.4
Inter
secti
on C
apac
ity U
tiliza
tion
111.5
%IC
U Le
vel o
f Ser
vice
HAn
alysis
Per
iod (m
in)15
c C
ritica
l Lan
e Gro
up
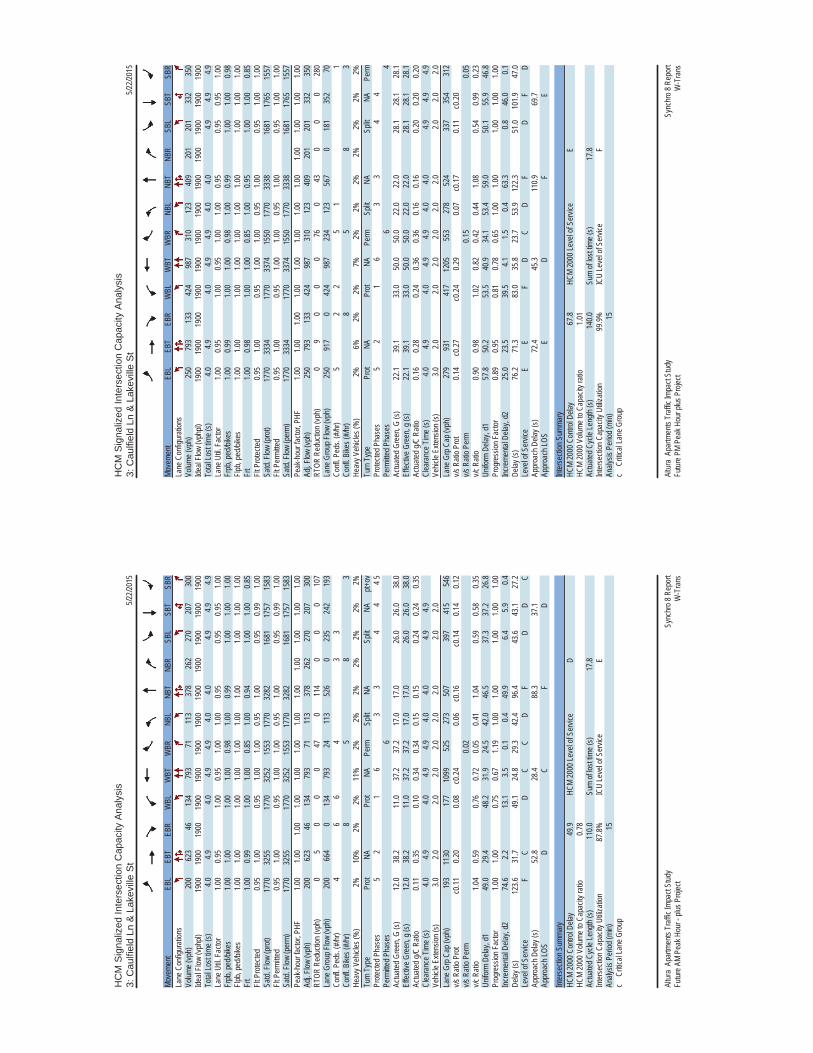
HC
M S
igna
lized
Inte
rsec
tion
Cap
acity
Ana
lysi
s3:
Cau
lfiel
d Ln
& L
akev
ille
St
5/22/2
015
Sync
hro 8
Rep
ort
Altur
a Ap
artm
ents
Traff
ic Im
pact
Stud
y Fu
ture A
M Pe
ak H
our -
plus
Pro
ject
W-T
rans
Move
ment
EBL
EBT
EBR
WBL
WBT
WBR
NBL
NBT
NBR
SBL
SBT
SBR
Lane
Con
figur
ation
sVo
lume (
vph)
200
623
4613
479
371
113
378
262
270
207
300
Ideal
Flow
(vphp
l)19
0019
0019
0019
0019
0019
0019
0019
0019
0019
0019
0019
00To
tal Lo
st tim
e (s)
4.04.9
4.04.9
4.94.0
4.04.9
4.94.9
Lane
Util.
Fac
tor1.0
00.9
51.0
00.9
51.0
01.0
00.9
50.9
50.9
51.0
0Fr
pb, p
ed/bi
kes
1.00
1.00
1.00
1.00
0.98
1.00
0.99
1.00
1.00
1.00
Flpb,
ped/b
ikes
1.00
1.00
1.00
1.00
1.00
1.00
1.00
1.00
1.00
1.00
Frt
1.00
0.99
1.00
1.00
0.85
1.00
0.94
1.00
1.00
0.85
Flt P
rotec
ted0.9
51.0
00.9
51.0
01.0
00.9
51.0
00.9
50.9
91.0
0Sa
td. F
low (p
rot)
1770
3255
1770
3252
1553
1770
3282
1681
1757
1583
Flt P
ermi
tted
0.95
1.00
0.95
1.00
1.00
0.95
1.00
0.95
0.99
1.00
Satd.
Flow
(per
m)17
7032
5517
7032
5215
5317
7032
8216
8117
5715
83Pe
ak-h
our f
actor
, PHF
1.00
1.00
1.00
1.00
1.00
1.00
1.00
1.00
1.00
1.00
1.00
1.00
Adj. F
low (v
ph)
200
623
4613
479
371
113
378
262
270
207
300
RTOR
Red
uctio
n (vp
h)0
50
00
470
114
00
010
7La
ne G
roup
Flow
(vph
)20
066
40
134
793
2411
352
60
235
242
193
Confl
. Ped
s. (#
/hr)
46
64
33
Confl
. Bike
s (#/h
r)8
58
3He
avy V
ehicl
es (%
)2%
10%
2%2%
11%
2%2%
2%2%
2%2%
2%Tu
rn T
ype
Prot
NAPr
otNA
Perm
Split
NASp
litNA
pt+ov
Prote
cted P
hase
s5
21
63
34
44 5
Perm
itted P
hase
s6
Actua
ted G
reen
, G (s
)12
.038
.211
.037
.237
.217
.017
.026
.026
.038
.0Ef
fectiv
e Gre
en, g
(s)
12.0
38.2
11.0
37.2
37.2
17.0
17.0
26.0
26.0
38.0
Actua
ted g/
C Ra
tio0.1
10.3
50.1
00.3
40.3
40.1
50.1
50.2
40.2
40.3
5Cl
eara
nce T
ime (
s)4.0
4.94.0
4.94.9
4.04.0
4.94.9
Vehic
le Ex
tensio
n (s)
3.02.0
2.02.0
2.02.0
2.02.0
2.0La
ne G
rp C
ap (v
ph)
193
1130
177
1099
525
273
507
397
415
546
v/s R
atio P
rot
c0.11
0.20
0.08
c0.24
0.06
c0.16
c0.14
0.14
0.12
v/s R
atio P
erm
0.02
v/c R
atio
1.04
0.59
0.76
0.72
0.05
0.41
1.04
0.59
0.58
0.35
Unifo
rm D
elay,
d149
.029
.448
.231
.924
.542
.046
.537
.337
.226
.8Pr
ogre
ssion
Fac
tor1.0
01.0
00.7
50.6
71.1
91.0
01.0
01.0
01.0
01.0
0Inc
reme
ntal D
elay,
d274
.62.2
13.1
3.50.1
0.449
.96.4
5.90.4
Delay
(s)
123.6
31.7
49.1
24.8
29.3
42.4
96.4
43.6
43.1
27.2
Leve
l of S
ervic
eF
CD
CC
DF
DD
CAp
proa
ch D
elay (
s)52
.828
.488
.337
.1Ap
proa
ch LO
SD
CF
D
Inter
secti
on S
umma
ryHC
M 20
00 C
ontro
l Dela
y49
.9HC
M 20
00 Le
vel o
f Ser
vice
DHC
M 20
00 V
olume
to C
apac
ity ra
tio0.7
8Ac
tuated
Cyc
le Le
ngth
(s)
110.0
Sum
of los
t time
(s)
17.8
Inter
secti
on C
apac
ity U
tiliza
tion
87.8%
ICU
Leve
l of S
ervic
eE
Analy
sis P
eriod
(min)
15c
Criti
cal L
ane G
roup
HC
M S
igna
lized
Inte
rsec
tion
Cap
acity
Ana
lysi
s3:
Cau
lfiel
d Ln
& L
akev
ille
St
5/22/2
015
Sync
hro 8
Rep
ort
Altur
a Ap
artm
ents
Traff
ic Im
pact
Stud
y Fu
ture P
M Pe
ak H
our p
lus P
rojec
tW
-Tra
ns
Move
ment
EBL
EBT
EBR
WBL
WBT
WBR
NBL
NBT
NBR
SBL
SBT
SBR
Lane
Con
figur
ation
sVo
lume (
vph)
250
793
133
424
987
310
123
409
201
201
332
350
Ideal
Flow
(vphp
l)19
0019
0019
0019
0019
0019
0019
0019
0019
0019
0019
0019
00To
tal Lo
st tim
e (s)
4.04.9
4.04.9
4.94.0
4.04.9
4.94.9
Lane
Util.
Fac
tor1.0
00.9
51.0
00.9
51.0
01.0
00.9
50.9
50.9
51.0
0Fr
pb, p
ed/bi
kes
1.00
0.99
1.00
1.00
0.98
1.00
0.99
1.00
1.00
0.98
Flpb,
ped/b
ikes
1.00
1.00
1.00
1.00
1.00
1.00
1.00
1.00
1.00
1.00
Frt
1.00
0.98
1.00
1.00
0.85
1.00
0.95
1.00
1.00
0.85
Flt P
rotec
ted0.9
51.0
00.9
51.0
01.0
00.9
51.0
00.9
51.0
01.0
0Sa
td. F
low (p
rot)
1770
3334
1770
3374
1550
1770
3338
1681
1765
1557
Flt P
ermi
tted
0.95
1.00
0.95
1.00
1.00
0.95
1.00
0.95
1.00
1.00
Satd.
Flow
(per
m)17
7033
3417
7033
7415
5017
7033
3816
8117
6515
57Pe
ak-h
our f
actor
, PHF
1.00
1.00
1.00
1.00
1.00
1.00
1.00
1.00
1.00
1.00
1.00
1.00
Adj. F
low (v
ph)
250
793
133
424
987
310
123
409
201
201
332
350
RTOR
Red
uctio
n (vp
h)0
90
00
760
430
00
280
Lane
Gro
up F
low (v
ph)
250
917
042
498
723
412
356
70
181
352
70Co
nfl. P
eds.
(#/hr
)5
22
51
1Co
nfl. B
ikes (
#/hr)
85
83
Heav
y Veh
icles
(%)
2%6%
2%2%
7%2%
2%2%
2%2%
2%2%
Turn
Typ
ePr
otNA
Prot
NAPe
rmSp
litNA
Split
NAPe
rmPr
otecte
d Pha
ses
52
16
33
44
Perm
itted P
hase
s6
4Ac
tuated
Gre
en, G
(s)
22.1
39.1
33.0
50.0
50.0
22.0
22.0
28.1
28.1
28.1
Effec
tive G
reen
, g (s
)22
.139
.133
.050
.050
.022
.022
.028
.128
.128
.1Ac
tuated
g/C
Ratio
0.16
0.28
0.24
0.36
0.36
0.16
0.16
0.20
0.20
0.20
Clea
ranc
e Tim
e (s)
4.04.9
4.04.9
4.94.0
4.04.9
4.94.9
Vehic
le Ex
tensio
n (s)
3.02.0
2.02.0
2.02.0
2.02.0
2.02.0
Lane
Grp
Cap
(vph
)27
993
141
712
0555
327
852
433
735
431
2v/s
Rati
o Pro
t0.1
4c0
.27c0
.240.2
90.0
7c0
.170.1
1c0
.20v/s
Rati
o Per
m0.1
50.0
5v/c
Rati
o0.9
00.9
81.0
20.8
20.4
20.4
41.0
80.5
40.9
90.2
3Un
iform
Dela
y, d1
57.8
50.2
53.5
40.9
34.1
53.4
59.0
50.1
55.9
46.8
Prog
ress
ion F
actor
0.89
0.95
0.81
0.78
0.65
1.00
1.00
1.00
1.00
1.00
Incre
menta
l Dela
y, d2
25.0
23.5
39.5
4.11.5
0.463
.30.8
46.0
0.1De
lay (s
)76
.271
.383
.035
.823
.753
.912
2.351
.010
1.947
.0Le
vel o
f Ser
vice
EE
FD
CD
FD
FD
Appr
oach
Dela
y (s)
72.4
45.3
110.9
69.7
Appr
oach
LOS
ED
FE
Inter
secti
on S
umma
ryHC
M 20
00 C
ontro
l Dela
y67
.8HC
M 20
00 Le
vel o
f Ser
vice
EHC
M 20
00 V
olume
to C
apac
ity ra
tio1.0
1Ac
tuated
Cyc
le Le
ngth
(s)
140.0
Sum
of los
t time
(s)
17.8
Inter
secti
on C
apac
ity U
tiliza
tion
99.9%
ICU
Leve
l of S
ervic
eF
Analy
sis P
eriod
(min)
15c
Criti
cal L
ane G
roup

HC
M S
igna
lized
Inte
rsec
tion
Cap
acity
Ana
lysi
s4:
In-n
-Out
Driv
eway
/US
101
SB
Ram
ps &
Lak
evill
e S
t/Lak
evill
e H
wy
5/22/2
015
Sync
hro 8
Rep
ort
Altur
a Ap
artm
ents
Traff
ic Im
pact
Stud
y Fu
ture A
M Pe
ak H
our -
plus
Pro
ject
W-T
rans
Move
ment
EBL
EBT
EBR
WBL
WBT
WBR
NBL
NBT
NBR
SBL
SBT
SBR
Lane
Con
figur
ation
sVo
lume (
vph)
310
925
106
769
378
55
792
35
298
Ideal
Flow
(vphp
l)19
0019
0019
0019
0019
0019
0019
0019
0019
0019
0019
0019
00To
tal Lo
st tim
e (s)
4.55.0
3.55.0
5.03.5
4.94.9
4.5La
ne U
til. F
actor
0.97
0.95
1.00
0.95
1.00
1.00
0.95
0.95
1.00
Frpb
, ped
/bike
s1.0
01.0
01.0
01.0
01.0
00.9
31.0
01.0
01.0
0Flp
b, pe
d/bike
s1.0
01.0
01.0
01.0
01.0
01.0
01.0
01.0
01.0
0Fr
t1.0
01.0
01.0
01.0
00.8
50.9
41.0
01.0
00.8
5Flt
Pro
tected
0.95
1.00
0.95
1.00
1.00
0.99
0.95
0.95
1.00
Satd.
Flow
(pro
t)34
3332
7917
7031
3915
8316
1816
8116
8615
83Flt
Per
mitte
d0.9
51.0
00.9
51.0
01.0
00.9
90.9
50.9
51.0
0Sa
td. F
low (p
erm)
3433
3279
1770
3139
1583
1618
1681
1686
1583
Peak
-hou
r fac
tor, P
HF1.0
01.0
01.0
01.0
01.0
01.0
01.0
01.0
01.0
01.0
01.0
01.0
0Ad
j. Flow
(vph
)31
092
510
676
937
85
57
923
529
8RT
OR R
educ
tion (
vph)
00
00
024
10
70
00
90La
ne G
roup
Flow
(vph
)31
093
50
676
913
70
100
461
467
208
Confl
. Ped
s. (#
/hr)
23
Confl
. Bike
s (#/h
r)9
Heav
y Veh
icles
(%)
2%10
%2%
2%15
%2%
2%2%
2%2%
2%2%
Turn
Typ
ePr
otNA
Prot
NAPe
rmSp
litNA
Split
NApm
+ov
Prote
cted P
hase
s5
21
68
84
45
Perm
itted P
hase
s6
4Ac
tuated
Gre
en, G
(s)
16.6
56.2
1.239
.839
.82.0
33.7
33.7
50.3
Effec
tive G
reen
, g (s
)16
.656
.21.2
39.8
39.8
2.033
.733
.750
.3Ac
tuated
g/C
Ratio
0.15
0.51
0.01
0.36
0.36
0.02
0.31
0.31
0.46
Clea
ranc
e Tim
e (s)
4.55.0
3.55.0
5.03.5
4.94.9
4.5Ve
hicle
Exten
sion (
s)3.0
3.02.0
3.03.0
3.03.0
3.03.0
Lane
Grp
Cap
(vph
)51
816
7519
1135
572
2951
451
678
8v/s
Rati
o Pro
t0.0
9c0
.280.0
0c0
.24c0
.010.2
7c0
.280.0
4v/s
Rati
o Per
m0.0
90.0
9v/c
Rati
o0.6
00.5
60.3
20.6
80.2
40.3
50.9
00.9
10.2
6Un
iform
Dela
y, d1
43.6
18.4
54.0
29.7
24.5
53.4
36.5
36.6
18.4
Prog
ress
ion F
actor
0.91
0.75
1.24
0.53
0.57
1.00
1.00
1.00
1.00
Incre
menta
l Dela
y, d2
1.41.0
3.02.8
0.97.2
18.1
19.3
0.2De
lay (s
)40
.914
.969
.718
.514
.860
.554
.655
.918
.6Le
vel o
f Ser
vice
DB
EB
BE
DE
BAp
proa
ch D
elay (
s)21
.417
.660
.546
.3Ap
proa
ch LO
SC
BE
D
Inter
secti
on S
umma
ryHC
M 20
00 C
ontro
l Dela
y28
.7HC
M 20
00 Le
vel o
f Ser
vice
CHC
M 20
00 V
olume
to C
apac
ity ra
tio0.7
4Ac
tuated
Cyc
le Le
ngth
(s)
110.0
Sum
of los
t time
(s)
17.9
Inter
secti
on C
apac
ity U
tiliza
tion
74.8%
ICU
Leve
l of S
ervic
eD
Analy
sis P
eriod
(min)
15c
Criti
cal L
ane G
roup
HC
M S
igna
lized
Inte
rsec
tion
Cap
acity
Ana
lysi
s4:
In-n
-Out
Driv
eway
/US
101
SB
Ram
ps &
Lak
evill
e S
t/Lak
evill
e H
wy
5/22/2
015
Sync
hro 8
Rep
ort
Altur
a Ap
artm
ents
Traff
ic Im
pact
Stud
y Fu
ture P
M Pe
ak H
our p
lus P
rojec
tW
-Tra
ns
Move
ment
EBL
EBT
EBR
WBL
WBT
WBR
NBL
NBT
NBR
SBL
SBT
SBR
Lane
Con
figur
ation
sVo
lume (
vph)
160
1109
1532
1364
280
255
1068
15
377
Ideal
Flow
(vphp
l)19
0019
0019
0019
0019
0019
0019
0019
0019
0019
0019
0019
00To
tal Lo
st tim
e (s)
4.05.0
4.05.0
5.04.4
4.94.9
4.0La
ne U
til. F
actor
0.97
0.95
1.00
0.95
1.00
1.00
0.95
0.95
1.00
Frpb
, ped
/bike
s1.0
01.0
01.0
01.0
01.0
00.9
71.0
01.0
00.9
8Flp
b, pe
d/bike
s1.0
01.0
01.0
01.0
01.0
01.0
01.0
01.0
01.0
0Fr
t1.0
01.0
01.0
01.0
00.8
50.9
71.0
01.0
00.8
5Flt
Pro
tected
0.95
1.00
0.95
1.00
1.00
0.97
0.95
0.95
1.00
Satd.
Flow
(pro
t)34
3334
0017
7033
1215
8316
9116
8116
8715
55Flt
Per
mitte
d0.9
51.0
00.9
51.0
01.0
00.9
70.9
50.9
51.0
0Sa
td. F
low (p
erm)
3433
3400
1770
3312
1583
1691
1681
1687
1555
Peak
-hou
r fac
tor, P
HF1.0
01.0
01.0
01.0
01.0
01.0
01.0
01.0
01.0
01.0
01.0
01.0
0Ad
j. Flow
(vph
)16
011
0915
3213
6428
025
510
681
537
7RT
OR R
educ
tion (
vph)
00
00
014
10
90
00
60La
ne G
roup
Flow
(vph
)16
011
240
3213
6413
90
310
340
346
317
Confl
. Ped
s. (#
/hr)
22
55
5Co
nfl. B
ikes (
#/hr)
158
Heav
y Veh
icles
(%)
2%6%
2%2%
9%2%
2%2%
2%2%
2%2%
Turn
Typ
ePr
otNA
Prot
NAPe
rmSp
litNA
Split
NApm
+ov
Prote
cted P
hase
s5
21
68
84
45
Perm
itted P
hase
s6
4Ac
tuated
Gre
en, G
(s)
11.9
72.0
9.669
.769
.75.7
34.4
34.4
46.3
Effec
tive G
reen
, g (s
)11
.972
.09.6
69.7
69.7
5.734
.434
.446
.3Ac
tuated
g/C
Ratio
0.09
0.51
0.07
0.50
0.50
0.04
0.25
0.25
0.33
Clea
ranc
e Tim
e (s)
4.05.0
4.05.0
5.04.4
4.94.9
4.0Ve
hicle
Exten
sion (
s)3.0
3.02.0
3.03.0
2.03.0
3.03.0
Lane
Grp
Cap
(vph
)29
117
4812
116
4878
868
413
414
514
v/s R
atio P
rot
0.05
c0.33
0.02
c0.41
c0.02
0.20
c0.21
0.05
v/s R
atio P
erm
0.09
0.15
v/c R
atio
0.55
0.64
0.26
0.83
0.18
0.46
0.82
0.84
0.62
Unifo
rm D
elay,
d161
.524
.761
.930
.019
.465
.649
.950
.139
.4Pr
ogre
ssion
Fac
tor1.2
00.4
80.9
80.9
11.5
51.0
01.0
01.0
01.0
0Inc
reme
ntal D
elay,
d21.0
0.90.3
3.00.3
1.812
.513
.62.2
Delay
(s)
75.0
12.6
60.9
30.4
30.4
67.4
62.4
63.7
41.6
Leve
l of S
ervic
eE
BE
CC
EE
ED
Appr
oach
Dela
y (s)
20.4
31.0
67.4
55.5
Appr
oach
LOS
CC
EE
Inter
secti
on S
umma
ryHC
M 20
00 C
ontro
l Dela
y34
.4HC
M 20
00 Le
vel o
f Ser
vice
CHC
M 20
00 V
olume
to C
apac
ity ra
tio0.8
0Ac
tuated
Cyc
le Le
ngth
(s)
140.0
Sum
of los
t time
(s)
18.3
Inter
secti
on C
apac
ity U
tiliza
tion
80.0%
ICU
Leve
l of S
ervic
eD
Analy
sis P
eriod
(min)
15c
Criti
cal L
ane G
roup
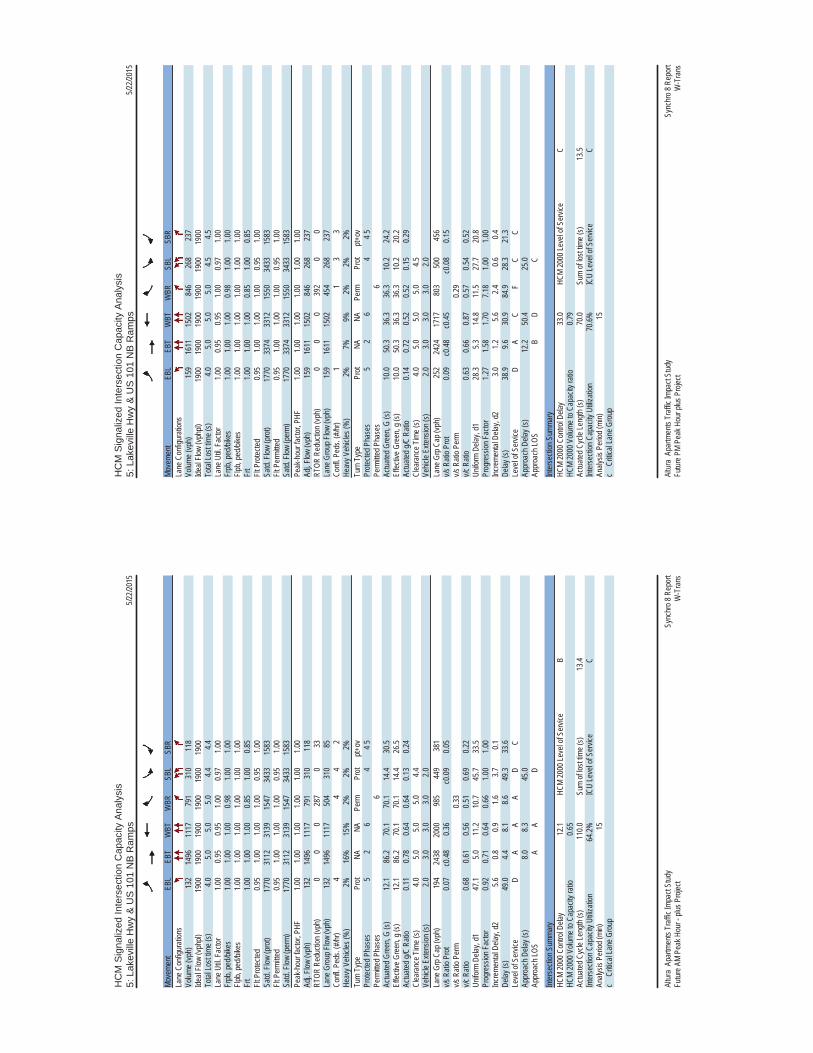
HC
M S
igna
lized
Inte
rsec
tion
Cap
acity
Ana
lysi
s5:
Lak
evill
e H
wy
& U
S 1
01 N
B R
amps
5/22/2
015
Sync
hro 8
Rep
ort
Altur
a Ap
artm
ents
Traff
ic Im
pact
Stud
y Fu
ture A
M Pe
ak H
our -
plus
Pro
ject
W-T
rans
Move
ment
EBL
EBT
WBT
WBR
SBL
SBR
Lane
Con
figur
ation
sVo
lume (
vph)
132
1496
1117
791
310
118
Ideal
Flow
(vphp
l)19
0019
0019
0019
0019
0019
00To
tal Lo
st tim
e (s)
4.05.0
5.05.0
4.44.4
Lane
Util.
Fac
tor1.0
00.9
50.9
51.0
00.9
71.0
0Fr
pb, p
ed/bi
kes
1.00
1.00
1.00
0.98
1.00
1.00
Flpb,
ped/b
ikes
1.00
1.00
1.00
1.00
1.00
1.00
Frt
1.00
1.00
1.00
0.85
1.00
0.85
Flt P
rotec
ted0.9
51.0
01.0
01.0
00.9
51.0
0Sa
td. F
low (p
rot)
1770
3112
3139
1547
3433
1583
Flt P
ermi
tted
0.95
1.00
1.00
1.00
0.95
1.00
Satd.
Flow
(per
m)17
7031
1231
3915
4734
3315
83Pe
ak-h
our f
actor
, PHF
1.00
1.00
1.00
1.00
1.00
1.00
Adj. F
low (v
ph)
132
1496
1117
791
310
118
RTOR
Red
uctio
n (vp
h)0
00
287
033
Lane
Gro
up F
low (v
ph)
132
1496
1117
504
310
85Co
nfl. P
eds.
(#/hr
)4
44
2He
avy V
ehicl
es (%
)2%
16%
15%
2%2%
2%Tu
rn T
ype
Prot
NANA
Perm
Prot
pt+ov
Prote
cted P
hase
s5
26
44 5
Perm
itted P
hase
s6
Actua
ted G
reen
, G (s
)12
.186
.270
.170
.114
.430
.5Ef
fectiv
e Gre
en, g
(s)
12.1
86.2
70.1
70.1
14.4
26.5
Actua
ted g/
C Ra
tio0.1
10.7
80.6
40.6
40.1
30.2
4Cl
eara
nce T
ime (
s)4.0
5.05.0
5.04.4
Vehic
le Ex
tensio
n (s)
2.03.0
3.03.0
2.0La
ne G
rp C
ap (v
ph)
194
2438
2000
985
449
381
v/s R
atio P
rot
0.07
c0.48
0.36
c0.09
0.05
v/s R
atio P
erm
0.33
v/c R
atio
0.68
0.61
0.56
0.51
0.69
0.22
Unifo
rm D
elay,
d147
.15.0
11.2
10.7
45.7
33.5
Prog
ress
ion F
actor
0.92
0.71
0.64
0.66
1.00
1.00
Incre
menta
l Dela
y, d2
5.60.8
0.91.6
3.70.1
Delay
(s)
49.0
4.48.1
8.649
.333
.6Le
vel o
f Ser
vice
DA
AA
DC
Appr
oach
Dela
y (s)
8.08.3
45.0
Appr
oach
LOS
AA
D
Inter
secti
on S
umma
ryHC
M 20
00 C
ontro
l Dela
y12
.1HC
M 20
00 Le
vel o
f Ser
vice
BHC
M 20
00 V
olume
to C
apac
ity ra
tio0.6
5Ac
tuated
Cyc
le Le
ngth
(s)
110.0
Sum
of los
t time
(s)
13.4
Inter
secti
on C
apac
ity U
tiliza
tion
64.2%
ICU
Leve
l of S
ervic
eC
Analy
sis P
eriod
(min)
15c
Criti
cal L
ane G
roup
HC
M S
igna
lized
Inte
rsec
tion
Cap
acity
Ana
lysi
s5:
Lak
evill
e H
wy
& U
S 1
01 N
B R
amps
5/22/2
015
Sync
hro 8
Rep
ort
Altur
a Ap
artm
ents
Traff
ic Im
pact
Stud
y Fu
ture P
M Pe
ak H
our p
lus P
rojec
tW
-Tra
ns
Move
ment
EBL
EBT
WBT
WBR
SBL
SBR
Lane
Con
figur
ation
sVo
lume (
vph)
159
1611
1502
846
268
237
Ideal
Flow
(vphp
l)19
0019
0019
0019
0019
0019
00To
tal Lo
st tim
e (s)
4.05.0
5.05.0
4.54.5
Lane
Util.
Fac
tor1.0
00.9
50.9
51.0
00.9
71.0
0Fr
pb, p
ed/bi
kes
1.00
1.00
1.00
0.98
1.00
1.00
Flpb,
ped/b
ikes
1.00
1.00
1.00
1.00
1.00
1.00
Frt
1.00
1.00
1.00
0.85
1.00
0.85
Flt P
rotec
ted0.9
51.0
01.0
01.0
00.9
51.0
0Sa
td. F
low (p
rot)
1770
3374
3312
1550
3433
1583
Flt P
ermi
tted
0.95
1.00
1.00
1.00
0.95
1.00
Satd.
Flow
(per
m)17
7033
7433
1215
5034
3315
83Pe
ak-h
our f
actor
, PHF
1.00
1.00
1.00
1.00
1.00
1.00
Adj. F
low (v
ph)
159
1611
1502
846
268
237
RTOR
Red
uctio
n (vp
h)0
00
392
00
Lane
Gro
up F
low (v
ph)
159
1611
1502
454
268
237
Confl
. Ped
s. (#
/hr)
11
33
Heav
y Veh
icles
(%)
2%7%
9%2%
2%2%
Turn
Typ
ePr
otNA
NAPe
rmPr
otpt+
ovPr
otecte
d Pha
ses
52
64
4 5Pe
rmitte
d Pha
ses
6Ac
tuated
Gre
en, G
(s)
10.0
50.3
36.3
36.3
10.2
24.2
Effec
tive G
reen
, g (s
)10
.050
.336
.336
.310
.220
.2Ac
tuated
g/C
Ratio
0.14
0.72
0.52
0.52
0.15
0.29
Clea
ranc
e Tim
e (s)
4.05.0
5.05.0
4.5Ve
hicle
Exten
sion (
s)2.0
3.03.0
3.02.0
Lane
Grp
Cap
(vph
)25
224
2417
1780
350
045
6v/s
Rati
o Pro
t0.0
9c0
.48c0
.45c0
.080.1
5v/s
Rati
o Per
m0.2
9v/c
Rati
o0.6
30.6
60.8
70.5
70.5
40.5
2Un
iform
Dela
y, d1
28.3
5.314
.811
.527
.720
.8Pr
ogre
ssion
Fac
tor1.2
71.5
81.7
07.1
81.0
01.0
0Inc
reme
ntal D
elay,
d23.0
1.25.6
2.40.6
0.4De
lay (s
)38
.99.6
30.9
84.9
28.3
21.3
Leve
l of S
ervic
eD
AC
FC
CAp
proa
ch D
elay (
s)12
.250
.425
.0Ap
proa
ch LO
SB
DC
Inter
secti
on S
umma
ryHC
M 20
00 C
ontro
l Dela
y33
.0HC
M 20
00 Le
vel o
f Ser
vice
CHC
M 20
00 V
olume
to C
apac
ity ra
tio0.7
9Ac
tuated
Cyc
le Le
ngth
(s)
70.0
Sum
of los
t time
(s)
13.5
Inter
secti
on C
apac
ity U
tiliza
tion
70.6%
ICU
Leve
l of S
ervic
eC
Analy
sis P
eriod
(min)
15c
Criti
cal L
ane G
roup
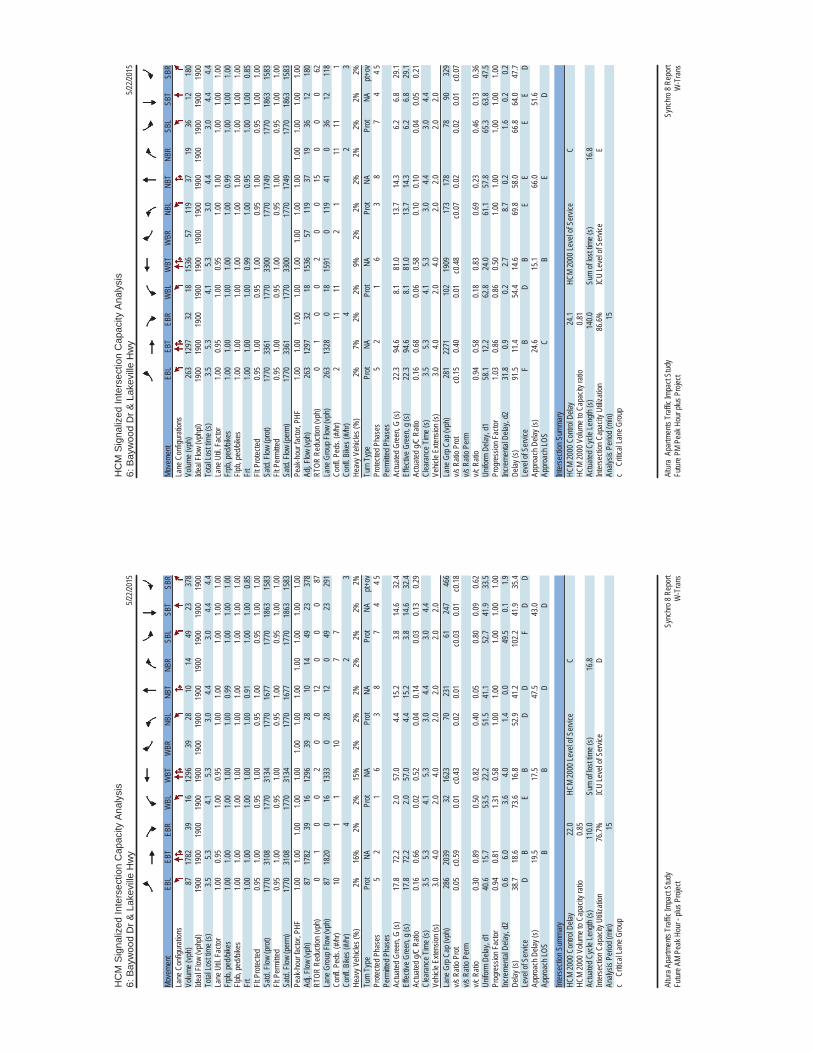
HC
M S
igna
lized
Inte
rsec
tion
Cap
acity
Ana
lysi
s6:
Bay
woo
d D
r & L
akev
ille
Hw
y5/2
2/201
5
Sync
hro 8
Rep
ort
Altur
a Apa
rtmen
ts Tr
affic
Impa
ct St
udy
Futur
e AM
Peak
Hou
r - pl
us P
rojec
tW
-Tra
ns
Move
ment
EBL
EBT
EBR
WBL
WBT
WBR
NBL
NBT
NBR
SBL
SBT
SBR
Lane
Con
figur
ation
sVo
lume (
vph)
8717
8239
1612
9639
2810
1449
2337
8Ide
al Flo
w (vp
hpl)
1900
1900
1900
1900
1900
1900
1900
1900
1900
1900
1900
1900
Total
Lost
time (
s)3.5
5.34.1
5.33.0
4.43.0
4.44.4
Lane
Util.
Fac
tor1.0
00.9
51.0
00.9
51.0
01.0
01.0
01.0
01.0
0Fr
pb, p
ed/bi
kes
1.00
1.00
1.00
1.00
1.00
0.99
1.00
1.00
1.00
Flpb,
ped/b
ikes
1.00
1.00
1.00
1.00
1.00
1.00
1.00
1.00
1.00
Frt
1.00
1.00
1.00
1.00
1.00
0.91
1.00
1.00
0.85
Flt P
rotec
ted0.9
51.0
00.9
51.0
00.9
51.0
00.9
51.0
01.0
0Sa
td. F
low (p
rot)
1770
3108
1770
3134
1770
1677
1770
1863
1583
Flt P
ermi
tted
0.95
1.00
0.95
1.00
0.95
1.00
0.95
1.00
1.00
Satd.
Flow
(per
m)17
7031
0817
7031
3417
7016
7717
7018
6315
83Pe
ak-h
our f
actor
, PHF
1.00
1.00
1.00
1.00
1.00
1.00
1.00
1.00
1.00
1.00
1.00
1.00
Adj. F
low (v
ph)
8717
8239
1612
9639
2810
1449
2337
8RT
OR R
educ
tion (
vph)
01
00
20
012
00
087
Lane
Gro
up F
low (v
ph)
8718
200
1613
330
2812
049
2329
1Co
nfl. P
eds.
(#/hr
)10
11
107
7Co
nfl. B
ikes (
#/hr)
42
3He
avy V
ehicl
es (%
)2%
16%
2%2%
15%
2%2%
2%2%
2%2%
2%Tu
rn T
ype
Prot
NAPr
otNA
Prot
NAPr
otNA
pt+ov
Prote
cted P
hase
s5
21
63
87
44 5
Perm
itted P
hase
sAc
tuated
Gre
en, G
(s)
17.8
72.2
2.057
.04.4
15.2
3.814
.632
.4Ef
fectiv
e Gre
en, g
(s)
17.8
72.2
2.057
.04.4
15.2
3.814
.632
.4Ac
tuated
g/C
Ratio
0.16
0.66
0.02
0.52
0.04
0.14
0.03
0.13
0.29
Clea
ranc
e Tim
e (s)
3.55.3
4.15.3
3.04.4
3.04.4
Vehic
le Ex
tensio
n (s)
3.04.0
2.04.0
2.02.0
2.02.0
Lane
Grp
Cap
(vph
)28
620
3932
1623
7023
161
247
466
v/s R
atio P
rot
0.05
c0.59
0.01
c0.43
0.02
0.01
c0.03
0.01
c0.18
v/s R
atio P
erm
v/c R
atio
0.30
0.89
0.50
0.82
0.40
0.05
0.80
0.09
0.62
Unifo
rm D
elay,
d140
.615
.753
.522
.251
.541
.152
.741
.933
.5Pr
ogre
ssion
Fac
tor0.9
40.8
11.3
10.5
81.0
01.0
01.0
01.0
01.0
0Inc
reme
ntal D
elay,
d20.6
6.03.6
4.01.4
0.049
.50.1
1.9De
lay (s
)38
.718
.673
.616
.852
.941
.210
2.241
.935
.4Le
vel o
f Ser
vice
DB
EB
DD
FD
DAp
proa
ch D
elay (
s)19
.517
.547
.543
.0Ap
proa
ch LO
SB
BD
D
Inter
secti
on S
umma
ryHC
M 20
00 C
ontro
l Dela
y22
.0HC
M 20
00 Le
vel o
f Ser
vice
CHC
M 20
00 V
olume
to C
apac
ity ra
tio0.8
5Ac
tuated
Cyc
le Le
ngth
(s)
110.0
Sum
of los
t time
(s)
16.8
Inter
secti
on C
apac
ity U
tiliza
tion
76.7%
ICU
Leve
l of S
ervic
eD
Analy
sis P
eriod
(min)
15c
Criti
cal L
ane G
roup
HC
M S
igna
lized
Inte
rsec
tion
Cap
acity
Ana
lysi
s6:
Bay
woo
d D
r & L
akev
ille
Hw
y5/2
2/201
5
Sync
hro 8
Rep
ort
Altur
a Ap
artm
ents
Traff
ic Im
pact
Stud
y Fu
ture P
M Pe
ak H
our p
lus P
rojec
tW
-Tra
ns
Move
ment
EBL
EBT
EBR
WBL
WBT
WBR
NBL
NBT
NBR
SBL
SBT
SBR
Lane
Con
figur
ation
sVo
lume (
vph)
263
1297
3218
1536
5711
937
1936
1218
0Ide
al Flo
w (vp
hpl)
1900
1900
1900
1900
1900
1900
1900
1900
1900
1900
1900
1900
Total
Lost
time (
s)3.5
5.34.1
5.33.0
4.43.0
4.44.4
Lane
Util.
Fac
tor1.0
00.9
51.0
00.9
51.0
01.0
01.0
01.0
01.0
0Fr
pb, p
ed/bi
kes
1.00
1.00
1.00
1.00
1.00
0.99
1.00
1.00
1.00
Flpb,
ped/b
ikes
1.00
1.00
1.00
1.00
1.00
1.00
1.00
1.00
1.00
Frt
1.00
1.00
1.00
0.99
1.00
0.95
1.00
1.00
0.85
Flt P
rotec
ted0.9
51.0
00.9
51.0
00.9
51.0
00.9
51.0
01.0
0Sa
td. F
low (p
rot)
1770
3361
1770
3300
1770
1749
1770
1863
1583
Flt P
ermi
tted
0.95
1.00
0.95
1.00
0.95
1.00
0.95
1.00
1.00
Satd.
Flow
(per
m)17
7033
6117
7033
0017
7017
4917
7018
6315
83Pe
ak-h
our f
actor
, PHF
1.00
1.00
1.00
1.00
1.00
1.00
1.00
1.00
1.00
1.00
1.00
1.00
Adj. F
low (v
ph)
263
1297
3218
1536
5711
937
1936
1218
0RT
OR R
educ
tion (
vph)
01
00
20
015
00
062
Lane
Gro
up F
low (v
ph)
263
1328
018
1591
011
941
036
1211
8Co
nfl. P
eds.
(#/hr
)2
1111
21
1111
1Co
nfl. B
ikes (
#/hr)
42
3He
avy V
ehicl
es (%
)2%
7%2%
2%9%
2%2%
2%2%
2%2%
2%Tu
rn T
ype
Prot
NAPr
otNA
Prot
NAPr
otNA
pt+ov
Prote
cted P
hase
s5
21
63
87
44 5
Perm
itted P
hase
sAc
tuated
Gre
en, G
(s)
22.3
94.6
8.181
.013
.714
.36.2
6.829
.1Ef
fectiv
e Gre
en, g
(s)
22.3
94.6
8.181
.013
.714
.36.2
6.829
.1Ac
tuated
g/C
Ratio
0.16
0.68
0.06
0.58
0.10
0.10
0.04
0.05
0.21
Clea
ranc
e Tim
e (s)
3.55.3
4.15.3
3.04.4
3.04.4
Vehic
le Ex
tensio
n (s)
3.04.0
2.04.0
2.02.0
2.02.0
Lane
Grp
Cap
(vph
)28
122
7110
219
0917
317
878
9032
9v/s
Rati
o Pro
tc0
.150.4
00.0
1c0
.48c0
.070.0
20.0
20.0
1c0
.07v/s
Rati
o Per
mv/c
Rati
o0.9
40.5
80.1
80.8
30.6
90.2
30.4
60.1
30.3
6Un
iform
Dela
y, d1
58.1
12.2
62.8
24.0
61.1
57.8
65.3
63.8
47.5
Prog
ress
ion F
actor
1.03
0.86
0.86
0.50
1.00
1.00
1.00
1.00
1.00
Incre
menta
l Dela
y, d2
31.8
0.90.2
2.78.7
0.21.6
0.20.2
Delay
(s)
91.5
11.4
54.4
14.6
69.8
58.0
66.8
64.0
47.7
Leve
l of S
ervic
eF
BD
BE
EE
ED
Appr
oach
Dela
y (s)
24.6
15.1
66.0
51.6
Appr
oach
LOS
CB
ED
Inter
secti
on S
umma
ryHC
M 20
00 C
ontro
l Dela
y24
.1HC
M 20
00 Le
vel o
f Ser
vice
CHC
M 20
00 V
olume
to C
apac
ity ra
tio0.8
1Ac
tuated
Cyc
le Le
ngth
(s)
140.0
Sum
of los
t time
(s)
16.8
Inter
secti
on C
apac
ity U
tiliza
tion
86.6%
ICU
Leve
l of S
ervic
eE
Analy
sis P
eriod
(min)
15c
Criti
cal L
ane G
roup
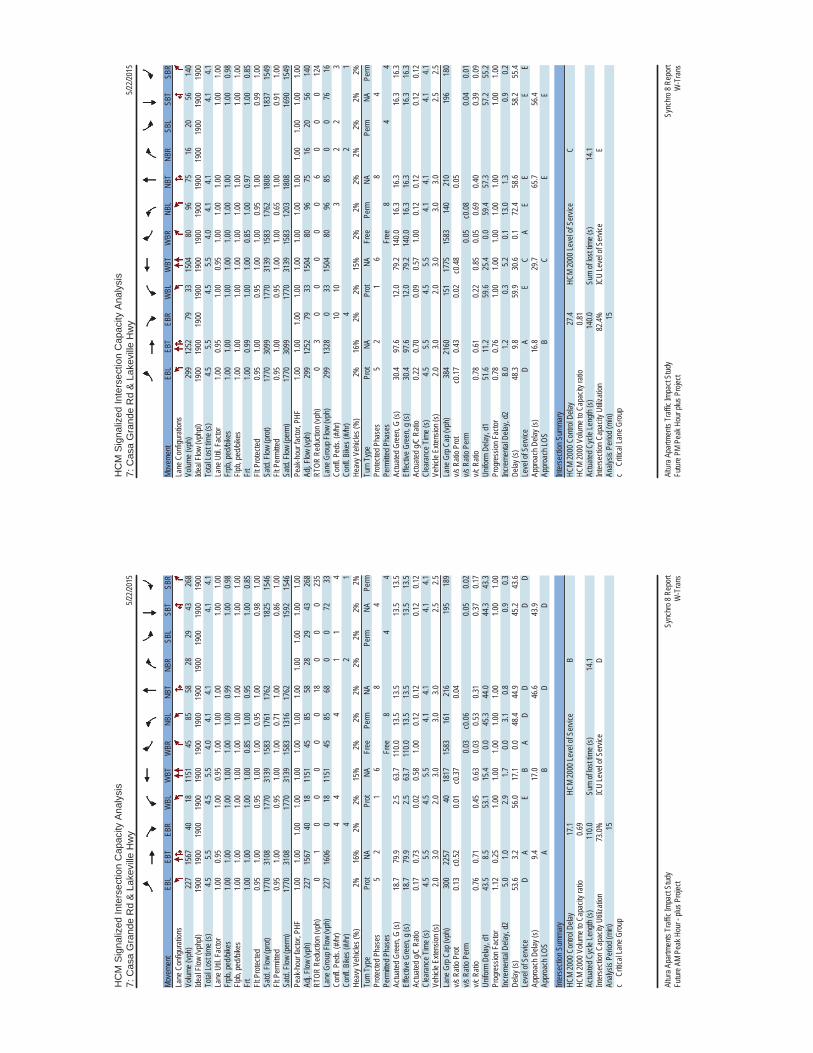
HC
M S
igna
lized
Inte
rsec
tion
Cap
acity
Ana
lysi
s7:
Cas
a G
rand
e R
d &
Lak
evill
e H
wy
5/22/2
015
Sync
hro 8
Rep
ort
Altur
a Apa
rtmen
ts Tr
affic
Impa
ct St
udy
Futur
e AM
Peak
Hou
r - pl
us P
rojec
tW
-Tra
ns
Move
ment
EBL
EBT
EBR
WBL
WBT
WBR
NBL
NBT
NBR
SBL
SBT
SBR
Lane
Con
figur
ation
sVo
lume (
vph)
227
1567
4018
1151
4585
5828
2943
268
Ideal
Flow
(vphp
l)19
0019
0019
0019
0019
0019
0019
0019
0019
0019
0019
0019
00To
tal Lo
st tim
e (s)
4.55.5
4.55.5
4.04.1
4.14.1
4.1La
ne U
til. F
actor
1.00
0.95
1.00
0.95
1.00
1.00
1.00
1.00
1.00
Frpb
, ped
/bike
s1.0
01.0
01.0
01.0
01.0
01.0
00.9
91.0
00.9
8Flp
b, pe
d/bike
s1.0
01.0
01.0
01.0
01.0
01.0
01.0
01.0
01.0
0Fr
t1.0
01.0
01.0
01.0
00.8
51.0
00.9
51.0
00.8
5Flt
Pro
tected
0.95
1.00
0.95
1.00
1.00
0.95
1.00
0.98
1.00
Satd.
Flow
(pro
t)17
7031
0817
7031
3915
8317
6117
6218
2515
46Flt
Per
mitte
d0.9
51.0
00.9
51.0
01.0
00.7
11.0
00.8
61.0
0Sa
td. F
low (p
erm)
1770
3108
1770
3139
1583
1316
1762
1592
1546
Peak
-hou
r fac
tor, P
HF1.0
01.0
01.0
01.0
01.0
01.0
01.0
01.0
01.0
01.0
01.0
01.0
0Ad
j. Flow
(vph
)22
715
6740
1811
5145
8558
2829
4326
8RT
OR R
educ
tion (
vph)
01
00
00
018
00
023
5La
ne G
roup
Flow
(vph
)22
716
060
1811
5145
8568
00
7233
Confl
. Ped
s. (#
/hr)
44
41
14
Confl
. Bike
s (#/h
r)4
21
Heav
y Veh
icles
(%)
2%16
%2%
2%15
%2%
2%2%
2%2%
2%2%
Turn
Typ
ePr
otNA
Prot
NAFr
eePe
rmNA
Perm
NAPe
rmPr
otecte
d Pha
ses
52
16
84
Perm
itted P
hase
sFr
ee8
44
Actua
ted G
reen
, G (s
)18
.779
.92.5
63.7
110.0
13.5
13.5
13.5
13.5
Effec
tive G
reen
, g (s
)18
.779
.92.5
63.7
110.0
13.5
13.5
13.5
13.5
Actua
ted g/
C Ra
tio0.1
70.7
30.0
20.5
81.0
00.1
20.1
20.1
20.1
2Cl
eara
nce T
ime (
s)4.5
5.54.5
5.54.1
4.14.1
4.1Ve
hicle
Exten
sion (
s)2.0
3.02.0
3.03.0
3.02.5
2.5La
ne G
rp C
ap (v
ph)
300
2257
4018
1715
8316
121
619
518
9v/s
Rati
o Pro
t0.1
3c0
.520.0
1c0
.370.0
4v/s
Rati
o Per
m0.0
3c0
.060.0
50.0
2v/c
Rati
o0.7
60.7
10.4
50.6
30.0
30.5
30.3
10.3
70.1
7Un
iform
Dela
y, d1
43.5
8.553
.115
.40.0
45.3
44.0
44.3
43.3
Prog
ress
ion F
actor
1.12
0.25
1.00
1.00
1.00
1.00
1.00
1.00
1.00
Incre
menta
l Dela
y, d2
5.01.0
2.91.7
0.03.1
0.80.9
0.3De
lay (s
)53
.63.2
56.0
17.1
0.048
.444
.945
.243
.6Le
vel o
f Ser
vice
DA
EB
AD
DD
DAp
proa
ch D
elay (
s)9.4
17.0
46.6
43.9
Appr
oach
LOS
AB
DD
Inter
secti
on S
umma
ryHC
M 20
00 C
ontro
l Dela
y17
.1HC
M 20
00 Le
vel o
f Ser
vice
BHC
M 20
00 V
olume
to C
apac
ity ra
tio0.6
9Ac
tuated
Cyc
le Le
ngth
(s)
110.0
Sum
of los
t time
(s)
14.1
Inter
secti
on C
apac
ity U
tiliza
tion
73.0%
ICU
Leve
l of S
ervic
eD
Analy
sis P
eriod
(min)
15c
Criti
cal L
ane G
roup
HC
M S
igna
lized
Inte
rsec
tion
Cap
acity
Ana
lysi
s7:
Cas
a G
rand
e R
d &
Lak
evill
e H
wy
5/22/2
015
Sync
hro 8
Rep
ort
Altur
a Apa
rtmen
ts Tr
affic
Impa
ct St
udy
Futur
e PM
Peak
Hou
r plus
Pro
ject
W-T
rans
Move
ment
EBL
EBT
EBR
WBL
WBT
WBR
NBL
NBT
NBR
SBL
SBT
SBR
Lane
Con
figur
ation
sVo
lume (
vph)
299
1252
7933
1504
8096
7516
2056
140
Ideal
Flow
(vphp
l)19
0019
0019
0019
0019
0019
0019
0019
0019
0019
0019
0019
00To
tal Lo
st tim
e (s)
4.55.5
4.55.5
4.04.1
4.14.1
4.1La
ne U
til. F
actor
1.00
0.95
1.00
0.95
1.00
1.00
1.00
1.00
1.00
Frpb
, ped
/bike
s1.0
01.0
01.0
01.0
01.0
01.0
01.0
01.0
00.9
8Flp
b, pe
d/bike
s1.0
01.0
01.0
01.0
01.0
01.0
01.0
01.0
01.0
0Fr
t1.0
00.9
91.0
01.0
00.8
51.0
00.9
71.0
00.8
5Flt
Pro
tected
0.95
1.00
0.95
1.00
1.00
0.95
1.00
0.99
1.00
Satd.
Flow
(pro
t)17
7030
9917
7031
3915
8317
6218
0818
3715
49Flt
Per
mitte
d0.9
51.0
00.9
51.0
01.0
00.6
51.0
00.9
11.0
0Sa
td. F
low (p
erm)
1770
3099
1770
3139
1583
1203
1808
1690
1549
Peak
-hou
r fac
tor, P
HF1.0
01.0
01.0
01.0
01.0
01.0
01.0
01.0
01.0
01.0
01.0
01.0
0Ad
j. Flow
(vph
)29
912
5279
3315
0480
9675
1620
5614
0RT
OR R
educ
tion (
vph)
03
00
00
06
00
012
4La
ne G
roup
Flow
(vph
)29
913
280
3315
0480
9685
00
7616
Confl
. Ped
s. (#
/hr)
1010
32
23
Confl
. Bike
s (#/h
r)4
21
Heav
y Veh
icles
(%)
2%16
%2%
2%15
%2%
2%2%
2%2%
2%2%
Turn
Typ
ePr
otNA
Prot
NAFr
eePe
rmNA
Perm
NAPe
rmPr
otecte
d Pha
ses
52
16
84
Perm
itted P
hase
sFr
ee8
44
Actua
ted G
reen
, G (s
)30
.497
.612
.079
.214
0.016
.316
.316
.316
.3Ef
fectiv
e Gre
en, g
(s)
30.4
97.6
12.0
79.2
140.0
16.3
16.3
16.3
16.3
Actua
ted g/
C Ra
tio0.2
20.7
00.0
90.5
71.0
00.1
20.1
20.1
20.1
2Cl
eara
nce T
ime (
s)4.5
5.54.5
5.54.1
4.14.1
4.1Ve
hicle
Exten
sion (
s)2.0
3.02.0
3.03.0
3.02.5
2.5La
ne G
rp C
ap (v
ph)
384
2160
151
1775
1583
140
210
196
180
v/s R
atio P
rot
c0.17
0.43
0.02
c0.48
0.05
v/s R
atio P
erm
0.05
c0.08
0.04
0.01
v/c R
atio
0.78
0.61
0.22
0.85
0.05
0.69
0.40
0.39
0.09
Unifo
rm D
elay,
d151
.611
.259
.625
.40.0
59.4
57.3
57.2
55.2
Prog
ress
ion F
actor
0.78
0.76
1.00
1.00
1.00
1.00
1.00
1.00
1.00
Incre
menta
l Dela
y, d2
8.01.2
0.35.2
0.113
.01.3
0.90.2
Delay
(s)
48.3
9.859
.930
.60.1
72.4
58.6
58.2
55.4
Leve
l of S
ervic
eD
AE
CA
EE
EE
Appr
oach
Dela
y (s)
16.8
29.7
65.7
56.4
Appr
oach
LOS
BC
EE
Inter
secti
on S
umma
ryHC
M 20
00 C
ontro
l Dela
y27
.4HC
M 20
00 Le
vel o
f Ser
vice
CHC
M 20
00 V
olume
to C
apac
ity ra
tio0.8
1Ac
tuated
Cyc
le Le
ngth
(s)
140.0
Sum
of los
t time
(s)
14.1
Inter
secti
on C
apac
ity U
tiliza
tion
82.4%
ICU
Leve
l of S
ervic
eE
Analy
sis P
eriod
(min)
15c
Criti
cal L
ane G
roup
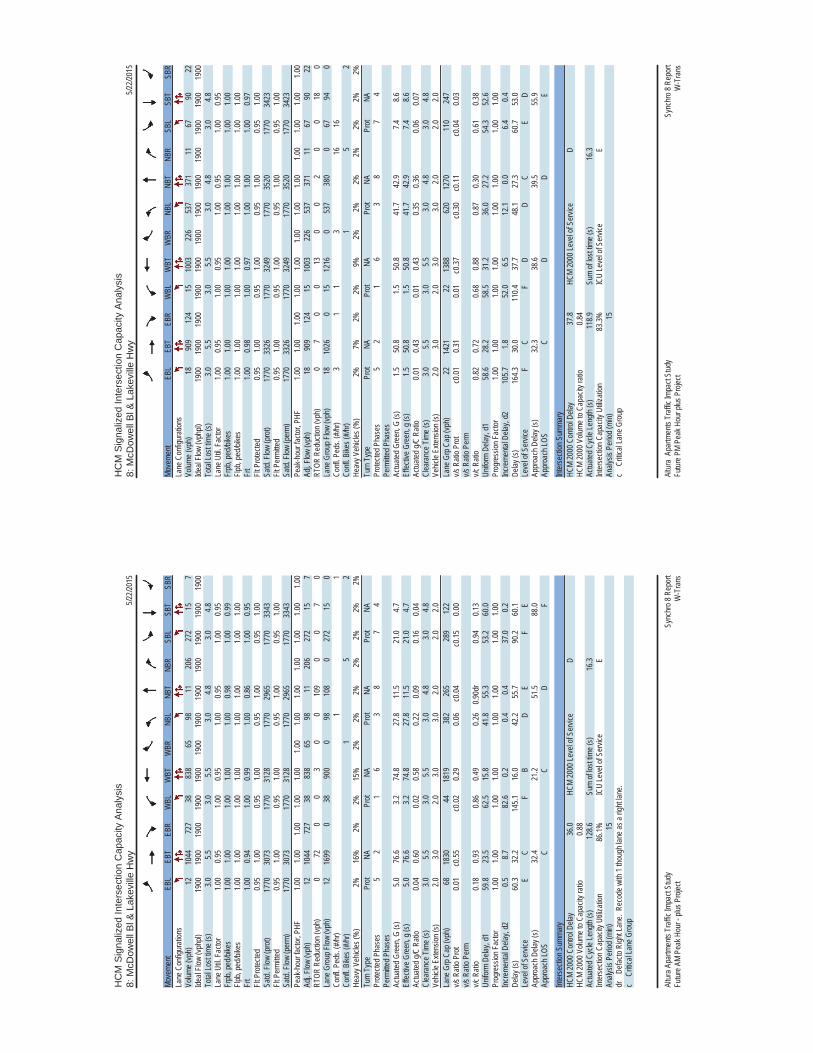
HC
M S
igna
lized
Inte
rsec
tion
Cap
acity
Ana
lysi
s8:
McD
owel
l Bl &
Lak
evill
e H
wy
5/22/2
015
Sync
hro 8
Rep
ort
Altur
a Apa
rtmen
ts Tr
affic
Impa
ct St
udy
Futur
e AM
Peak
Hou
r - pl
us P
rojec
tW
-Tra
ns
Move
ment
EBL
EBT
EBR
WBL
WBT
WBR
NBL
NBT
NBR
SBL
SBT
SBR
Lane
Con
figur
ation
sVo
lume (
vph)
1210
4472
738
838
6598
1120
627
215
7Ide
al Flo
w (vp
hpl)
1900
1900
1900
1900
1900
1900
1900
1900
1900
1900
1900
1900
Total
Lost
time (
s)3.0
5.53.0
5.53.0
4.83.0
4.8La
ne U
til. F
actor
1.00
0.95
1.00
0.95
1.00
0.95
1.00
0.95
Frpb
, ped
/bike
s1.0
01.0
01.0
01.0
01.0
00.9
81.0
00.9
9Flp
b, pe
d/bike
s1.0
01.0
01.0
01.0
01.0
01.0
01.0
01.0
0Fr
t1.0
00.9
41.0
00.9
91.0
00.8
61.0
00.9
5Flt
Pro
tected
0.95
1.00
0.95
1.00
0.95
1.00
0.95
1.00
Satd.
Flow
(pro
t)17
7030
7317
7031
2817
7029
6517
7033
43Flt
Per
mitte
d0.9
51.0
00.9
51.0
00.9
51.0
00.9
51.0
0Sa
td. F
low (p
erm)
1770
3073
1770
3128
1770
2965
1770
3343
Peak
-hou
r fac
tor, P
HF1.0
01.0
01.0
01.0
01.0
01.0
01.0
01.0
01.0
01.0
01.0
01.0
0Ad
j. Flow
(vph
)12
1044
727
3883
865
9811
206
272
157
RTOR
Red
uctio
n (vp
h)0
720
03
00
109
00
70
Lane
Gro
up F
low (v
ph)
1216
990
3890
00
9810
80
272
150
Confl
. Ped
s. (#
/hr)
11
Confl
. Bike
s (#/h
r)1
52
Heav
y Veh
icles
(%)
2%16
%2%
2%15
%2%
2%2%
2%2%
2%2%
Turn
Typ
ePr
otNA
Prot
NAPr
otNA
Prot
NAPr
otecte
d Pha
ses
52
16
38
74
Perm
itted P
hase
sAc
tuated
Gre
en, G
(s)
5.076
.63.2
74.8
27.8
11.5
21.0
4.7Ef
fectiv
e Gre
en, g
(s)
5.076
.63.2
74.8
27.8
11.5
21.0
4.7Ac
tuated
g/C
Ratio
0.04
0.60
0.02
0.58
0.22
0.09
0.16
0.04
Clea
ranc
e Tim
e (s)
3.05.5
3.05.5
3.04.8
3.04.8
Vehic
le Ex
tensio
n (s)
2.03.0
2.03.0
3.02.0
2.02.0
Lane
Grp
Cap
(vph
)68
1830
4418
1938
226
528
912
2v/s
Rati
o Pro
t0.0
1c0
.55c0
.020.2
90.0
6c0
.04c0
.150.0
0v/s
Rati
o Per
mv/c
Rati
o0.1
80.9
30.8
60.4
90.2
60.9
0dr
0.94
0.13
Unifo
rm D
elay,
d159
.823
.562
.515
.841
.855
.353
.260
.0Pr
ogre
ssion
Fac
tor1.0
01.0
01.0
01.0
01.0
01.0
01.0
01.0
0Inc
reme
ntal D
elay,
d20.5
8.782
.60.2
0.40.4
37.0
0.2De
lay (s
)60
.332
.214
5.116
.042
.255
.790
.260
.1Le
vel o
f Ser
vice
EC
FB
DE
FE
Appr
oach
Dela
y (s)
32.4
21.2
51.5
88.0
Appr
oach
LOS
CC
DF
Inter
secti
on S
umma
ryHC
M 20
00 C
ontro
l Dela
y36
.0HC
M 20
00 Le
vel o
f Ser
vice
DHC
M 20
00 V
olume
to C
apac
ity ra
tio0.8
8Ac
tuated
Cyc
le Le
ngth
(s)
128.6
Sum
of los
t time
(s)
16.3
Inter
secti
on C
apac
ity U
tiliza
tion
86.1%
ICU
Leve
l of S
ervic
eE
Analy
sis P
eriod
(min)
15dr
De
facto
Righ
t Lan
e. R
ecod
e with
1 tho
ugh l
ane a
s a rig
ht lan
e.c
Criti
cal L
ane G
roup
HC
M S
igna
lized
Inte
rsec
tion
Cap
acity
Ana
lysi
s8:
McD
owel
l Bl &
Lak
evill
e H
wy
5/22/2
015
Sync
hro 8
Rep
ort
Altur
a Ap
artm
ents
Traff
ic Im
pact
Stud
y Fu
ture P
M Pe
ak H
our p
lus P
rojec
tW
-Tra
ns
Move
ment
EBL
EBT
EBR
WBL
WBT
WBR
NBL
NBT
NBR
SBL
SBT
SBR
Lane
Con
figur
ation
sVo
lume (
vph)
1890
912
415
1003
226
537
371
1167
9022
Ideal
Flow
(vphp
l)19
0019
0019
0019
0019
0019
0019
0019
0019
0019
0019
0019
00To
tal Lo
st tim
e (s)
3.05.5
3.05.5
3.04.8
3.04.8
Lane
Util.
Fac
tor1.0
00.9
51.0
00.9
51.0
00.9
51.0
00.9
5Fr
pb, p
ed/bi
kes
1.00
1.00
1.00
1.00
1.00
1.00
1.00
1.00
Flpb,
ped/b
ikes
1.00
1.00
1.00
1.00
1.00
1.00
1.00
1.00
Frt
1.00
0.98
1.00
0.97
1.00
1.00
1.00
0.97
Flt P
rotec
ted0.9
51.0
00.9
51.0
00.9
51.0
00.9
51.0
0Sa
td. F
low (p
rot)
1770
3326
1770
3249
1770
3520
1770
3423
Flt P
ermi
tted
0.95
1.00
0.95
1.00
0.95
1.00
0.95
1.00
Satd.
Flow
(per
m)17
7033
2617
7032
4917
7035
2017
7034
23Pe
ak-h
our f
actor
, PHF
1.00
1.00
1.00
1.00
1.00
1.00
1.00
1.00
1.00
1.00
1.00
1.00
Adj. F
low (v
ph)
1890
912
415
1003
226
537
371
1167
9022
RTOR
Red
uctio
n (vp
h)0
70
013
00
20
018
0La
ne G
roup
Flow
(vph
)18
1026
015
1216
053
738
00
6794
0Co
nfl. P
eds.
(#/hr
)3
11
316
16Co
nfl. B
ikes (
#/hr)
15
2He
avy V
ehicl
es (%
)2%
7%2%
2%9%
2%2%
2%2%
2%2%
2%Tu
rn T
ype
Prot
NAPr
otNA
Prot
NAPr
otNA
Prote
cted P
hase
s5
21
63
87
4Pe
rmitte
d Pha
ses
Actua
ted G
reen
, G (s
)1.5
50.8
1.550
.841
.742
.97.4
8.6Ef
fectiv
e Gre
en, g
(s)
1.550
.81.5
50.8
41.7
42.9
7.48.6
Actua
ted g/
C Ra
tio0.0
10.4
30.0
10.4
30.3
50.3
60.0
60.0
7Cl
eara
nce T
ime (
s)3.0
5.53.0
5.53.0
4.83.0
4.8Ve
hicle
Exten
sion (
s)2.0
3.02.0
3.03.0
2.02.0
2.0La
ne G
rp C
ap (v
ph)
2214
2122
1388
620
1270
110
247
v/s R
atio P
rot
c0.01
0.31
0.01
c0.37
c0.30
c0.11
c0.04
0.03
v/s R
atio P
erm
v/c R
atio
0.82
0.72
0.68
0.88
0.87
0.30
0.61
0.38
Unifo
rm D
elay,
d158
.628
.258
.531
.236
.027
.254
.352
.6Pr
ogre
ssion
Fac
tor1.0
01.0
01.0
01.0
01.0
01.0
01.0
01.0
0Inc
reme
ntal D
elay,
d210
5.71.8
52.0
6.512
.10.0
6.40.4
Delay
(s)
164.3
30.0
110.4
37.7
48.1
27.3
60.7
53.0
Leve
l of S
ervic
eF
CF
DD
CE
DAp
proa
ch D
elay (
s)32
.338
.639
.555
.9Ap
proa
ch LO
SC
DD
E
Inter
secti
on S
umma
ryHC
M 20
00 C
ontro
l Dela
y37
.8HC
M 20
00 Le
vel o
f Ser
vice
DHC
M 20
00 V
olume
to C
apac
ity ra
tio0.8
4Ac
tuated
Cyc
le Le
ngth
(s)
118.9
Sum
of los
t time
(s)
16.3
Inter
secti
on C
apac
ity U
tiliza
tion
83.3%
ICU
Leve
l of S
ervic
eE
Analy
sis P
eriod
(min)
15c
Criti
cal L
ane G
roup
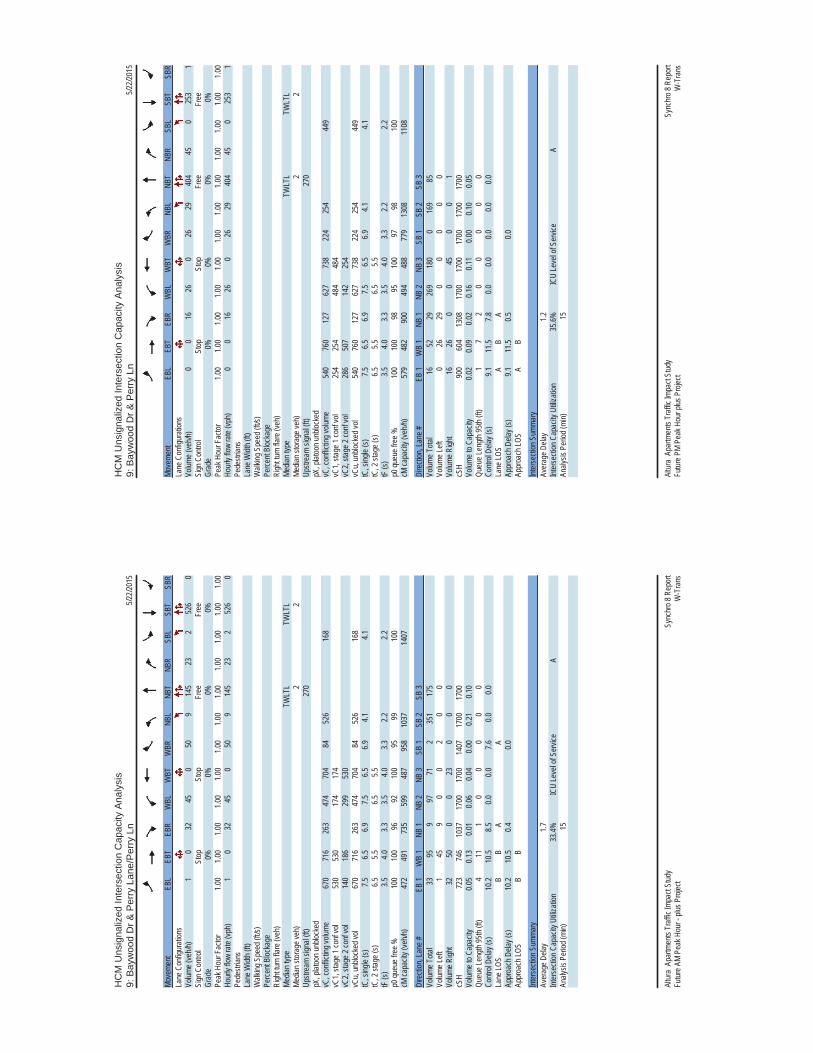
HC
M U
nsig
naliz
ed In
ters
ectio
n C
apac
ity A
naly
sis
9: B
ayw
ood
Dr &
Per
ry L
ane/
Per
ry L
n5/2
2/201
5
Sync
hro 8
Rep
ort
Altur
a Ap
artm
ents
Traff
ic Im
pact
Stud
y Fu
ture A
M Pe
ak H
our -
plus
Pro
ject
W-T
rans
Move
ment
EBL
EBT
EBR
WBL
WBT
WBR
NBL
NBT
NBR
SBL
SBT
SBR
Lane
Con
figur
ation
sVo
lume (
veh/h
)1
032
450
509
145
232
526
0Si
gn C
ontro
lSt
opSt
opFr
eeFr
eeGr
ade
0%0%
0%0%
Peak
Hou
r Fac
tor1.0
01.0
01.0
01.0
01.0
01.0
01.0
01.0
01.0
01.0
01.0
01.0
0Ho
urly
flow
rate
(vph)
10
3245
050
914
523
252
60
Pede
strian
sLa
ne W
idth (
ft)W
alking
Spe
ed (f
t/s)
Perce
nt Bl
ocka
geRi
ght tu
rn fla
re (v
eh)
Media
n typ
eTW
LTL
TWLT
LMe
dian s
torag
e veh
)2
2Up
strea
m sig
nal (f
t)27
0pX
, plat
oon u
nbloc
ked
vC, c
onflic
ting v
olume
670
716
263
474
704
8452
616
8vC
1, sta
ge 1
conf
vol
530
530
174
174
vC2,
stage
2 co
nf vo
l14
018
629
953
0vC
u, un
block
ed vo
l67
071
626
347
470
484
526
168
tC, s
ingle
(s)7.5
6.56.9
7.56.5
6.94.1
4.1tC
, 2 st
age (
s)6.5
5.56.5
5.5tF
(s)
3.54.0
3.33.5
4.03.3
2.22.2
p0 qu
eue f
ree %
100
100
9692
100
9599
100
cM ca
pacit
y (ve
h/h)
472
491
735
599
487
958
1037
1407
Dire
ction
, Lan
e #EB
1W
B 1
NB 1
NB 2
NB 3
SB 1
SB 2
SB 3
Volum
e Tota
l33
959
9771
235
117
5Vo
lume L
eft1
459
00
20
0Vo
lume R
ight
3250
00
230
00
cSH
723
746
1037
1700
1700
1407
1700
1700
Volum
e to C
apac
ity0.0
50.1
30.0
10.0
60.0
40.0
00.2
10.1
0Qu
eue L
ength
95th
(ft)
411
10
00
00
Contr
ol De
lay (s
)10
.210
.58.5
0.00.0
7.60.0
0.0La
ne LO
SB
BA
AAp
proa
ch D
elay (
s)10
.210
.50.4
0.0Ap
proa
ch LO
SB
B
Inter
secti
on S
umma
ryAv
erag
e Dela
y 1.7
Inter
secti
on C
apac
ity U
tiliza
tion
33.4%
ICU
Leve
l of S
ervic
e A
Analy
sis P
eriod
(min)
15
HC
M U
nsig
naliz
ed In
ters
ectio
n C
apac
ity A
naly
sis
9: B
ayw
ood
Dr &
Per
ry L
n5/2
2/201
5
Sync
hro 8
Rep
ort
Altur
a Ap
artm
ents
Traff
ic Im
pact
Stud
y Fu
ture P
M Pe
ak H
our p
lus P
rojec
tW
-Tra
ns
Move
ment
EBL
EBT
EBR
WBL
WBT
WBR
NBL
NBT
NBR
SBL
SBT
SBR
Lane
Con
figur
ation
sVo
lume (
veh/h
)0
016
260
2629
404
450
253
1Si
gn C
ontro
lSt
opSt
opFr
eeFr
eeGr
ade
0%0%
0%0%
Peak
Hou
r Fac
tor1.0
01.0
01.0
01.0
01.0
01.0
01.0
01.0
01.0
01.0
01.0
01.0
0Ho
urly
flow
rate
(vph)
00
1626
026
2940
445
025
31
Pede
strian
sLa
ne W
idth (
ft)W
alking
Spe
ed (f
t/s)
Perce
nt Bl
ocka
geRi
ght tu
rn fla
re (v
eh)
Media
n typ
eTW
LTL
TWLT
LMe
dian s
torag
e veh
)2
2Up
strea
m sig
nal (f
t)27
0pX
, plat
oon u
nbloc
ked
vC, c
onflic
ting v
olume
540
760
127
627
738
224
254
449
vC1,
stage
1 co
nf vo
l25
425
448
448
4vC
2, sta
ge 2
conf
vol
286
507
142
254
vCu,
unblo
cked
vol
540
760
127
627
738
224
254
449
tC, s
ingle
(s)7.5
6.56.9
7.56.5
6.94.1
4.1tC
, 2 st
age (
s)6.5
5.56.5
5.5tF
(s)
3.54.0
3.33.5
4.03.3
2.22.2
p0 qu
eue f
ree %
100
100
9895
100
9798
100
cM ca
pacit
y (ve
h/h)
579
482
900
494
488
779
1308
1108
Dire
ction
, Lan
e #EB
1W
B 1
NB 1
NB 2
NB 3
SB 1
SB 2
SB 3
Volum
e Tota
l16
5229
269
180
016
985
Volum
e Left
026
290
00
00
Volum
e Righ
t16
260
045
00
1cS
H90
060
413
0817
0017
0017
0017
0017
00Vo
lume t
o Cap
acity
0.02
0.09
0.02
0.16
0.11
0.00
0.10
0.05
Queu
e Len
gth 95
th (ft
)1
72
00
00
0Co
ntrol
Delay
(s)
9.111
.57.8
0.00.0
0.00.0
0.0La
ne LO
SA
BA
Appr
oach
Dela
y (s)
9.111
.50.5
0.0Ap
proa
ch LO
SA
B
Inter
secti
on S
umma
ryAv
erag
e Dela
y 1.2
Inter
secti
on C
apac
ity U
tiliza
tion
35.6%
ICU
Leve
l of S
ervic
e A
Analy
sis P
eriod
(min)
15

HC
M 2
010
AW
SC
10: B
ayw
ood
Dr &
St.
Fran
cis
Dr
5/22/2
015
Sync
hro 8
Rep
ort
Altur
a Ap
artm
ents
Traff
ic Im
pact
Stud
y Fu
ture A
M Pe
ak H
our -
plus
Pro
ject
W-T
rans
Inter
secti
onInt
erse
ction
Dela
y, s/v
eh11
.4Int
erse
ction
LOS
B
Move
ment
EBU
EBL
EBT
EBR
WBU
WBL
WBT
WBR
NBU
NBL
NBT
NBR
Vol, v
eh/h
039
9262
078
9055
031
9847
Peak
Hou
r Fac
tor1.0
01.0
01.0
01.0
01.0
01.0
01.0
01.0
01.0
01.0
01.0
01.0
0He
avy V
ehicl
es, %
22
22
22
22
22
22
Mvmt
Flow
039
9262
078
9055
031
9847
Numb
er of
Lane
s0
01
00
01
00
11
1
Appr
oach
EBW
BNB
Oppo
sing A
ppro
ach
WB
EBSB
Oppo
sing L
anes
11
2Co
nflict
ing A
ppro
ach L
eftSB
NBEB
Confl
icting
Lane
s Left
23
1Co
nflict
ing A
ppro
ach R
ight
NBSB
WB
Confl
icting
Lane
s Righ
t3
21
HCM
Contr
ol De
lay11
.512
.39.7
HCM
LOS
BB
A
Lane
NBLn
1NB
Ln2
NBLn
3EB
Ln1
WBL
n1SB
Ln1
SBLn
2Vo
l Left
, %10
0%0%
0%20
%35
%10
0%0%
Vol T
hru,
%0%
100%
0%48
%40
%0%
80%
Vol R
ight, %
0%0%
100%
32%
25%
0%20
%Si
gn C
ontro
lSt
opSt
opSt
opSt
opSt
opSt
opSt
opTr
affic
Vol b
y Lan
e31
9847
193
223
4318
8LT
Vol
310
039
7843
0Th
roug
h Vol
098
092
900
150
RT V
ol0
047
6255
038
Lane
Flow
Rate
3198
4719
322
343
188
Geom
etry G
rp7
77
77
88
Degr
ee of
Util
(X)
0.058
0.169
0.072
0.319
0.373
0.083
0.327
Depa
rture
Hea
dway
(Hd)
6.708
6.199
5.487
5.948
6.02
6.914
6.259
Conv
erge
nce,
Y/N
Yes
Yes
Yes
Yes
Yes
Yes
Yes
Cap
533
577
651
604
598
517
573
Servi
ce T
ime
4.459
3.95
3.237
3.697
3.768
4.668
4.013
HCM
Lane
V/C
Rati
o0.0
580.1
70.0
720.3
20.3
730.0
830.3
28HC
M Co
ntrol
Delay
9.910
.28.7
11.5
12.3
10.3
12HC
M La
ne LO
SA
BA
BB
BB
HCM
95th-
tile Q
0.20.6
0.21.4
1.70.3
1.4
HC
M 2
010
AW
SC
10: B
ayw
ood
Dr &
St.
Fran
cis
Dr
5/22/2
015
Sync
hro 8
Rep
ort
Altur
a Ap
artm
ents
Traff
ic Im
pact
Stud
y Fu
ture P
M Pe
ak H
our p
lus P
rojec
tW
-Tra
ns
Inter
secti
onInt
erse
ction
Dela
y, s/v
eh16
Inter
secti
on LO
SC
Move
ment
EBU
EBL
EBT
EBR
WBU
WBL
WBT
WBR
NBU
NBL
NBT
NBR
Vol, v
eh/h
060
225
490
5518
947
064
152
61Pe
ak H
our F
actor
1.00
1.00
1.00
1.00
1.00
1.00
1.00
1.00
1.00
1.00
1.00
1.00
Heav
y Veh
icles
, %2
22
22
22
22
22
2Mv
mt F
low0
6022
549
055
189
470
6415
261
Numb
er of
Lane
s0
01
00
01
00
11
1
Appr
oach
EBW
BNB
Oppo
sing A
ppro
ach
WB
EBSB
Oppo
sing L
anes
11
2Co
nflict
ing A
ppro
ach L
eftSB
NBEB
Confl
icting
Lane
s Left
23
1Co
nflict
ing A
ppro
ach R
ight
NBSB
WB
Confl
icting
Lane
s Righ
t3
21
HCM
Contr
ol De
lay19
.717
.411
.9HC
M LO
SC
CB
Lane
NBLn
1NB
Ln2
NBLn
3EB
Ln1
WBL
n1SB
Ln1
SBLn
2Vo
l Left
, %10
0%0%
0%18
%19
%10
0%0%
Vol T
hru,
%0%
100%
0%67
%65
%0%
69%
Vol R
ight, %
0%0%
100%
15%
16%
0%31
%Si
gn C
ontro
lSt
opSt
opSt
opSt
opSt
opSt
opSt
opTr
affic
Vol b
y Lan
e64
152
6133
429
145
150
LT V
ol64
00
6055
450
Thro
ugh V
ol0
152
022
518
90
104
RT V
ol0
061
4947
046
Lane
Flow
Rate
6415
261
334
291
4515
0Ge
ometr
y Grp
77
77
78
8De
gree
of U
til (X
)0.1
360.3
010.1
090.6
190.5
460.1
030.3
13De
partu
re H
eadw
ay (H
d)7.6
487.1
356.4
156.6
756.7
548.2
57.5
1Co
nver
genc
e, Y/
NYe
sYe
sYe
sYe
sYe
sYe
sYe
sCa
p46
850
355
854
153
543
447
9Se
rvice
Tim
e5.3
954.8
814.1
614.4
144.4
956.0
025.2
61HC
M La
ne V
/C R
atio
0.137
0.302
0.109
0.617
0.544
0.104
0.313
HCM
Contr
ol De
lay11
.612
.99.9
19.7
17.4
1213
.7HC
M La
ne LO
SB
BA
CC
BB
HCM
95th-
tile Q
0.51.3
0.44.2
3.30.3
1.3

HC
M 2
010
AW
SC
10: B
ayw
ood
Dr &
St.
Fran
cis
Dr
5/22/2
015
Sync
hro 8
Rep
ort
Altur
a Ap
artm
ents
Traff
ic Im
pact
Stud
y Fu
ture A
M Pe
ak H
our -
plus
Pro
ject
W-T
rans
Inter
secti
onInt
erse
ction
Dela
y, s/v
ehInt
erse
ction
LOS
Move
ment
SBU
SBL
SBT
SBR
Vol, v
eh/h
043
150
38Pe
ak H
our F
actor
1.00
1.00
1.00
1.00
Heav
y Veh
icles
, %2
22
2Mv
mt F
low0
4315
038
Numb
er of
Lane
s0
11
0
Appr
oach
SBOp
posin
g App
roac
hNB
Oppo
sing L
anes
3Co
nflict
ing A
ppro
ach L
eftW
BCo
nflict
ing La
nes L
eft1
Confl
icting
App
roac
h Righ
tEB
Confl
icting
Lane
s Righ
t1
HCM
Contr
ol De
lay11
.7HC
M LO
SB
Lane
HC
M 2
010
AW
SC
10: B
ayw
ood
Dr &
St.
Fran
cis
Dr
5/22/2
015
Sync
hro 8
Rep
ort
Altur
a Ap
artm
ents
Traff
ic Im
pact
Stud
y Fu
ture P
M Pe
ak H
our p
lus P
rojec
tW
-Tra
ns
Inter
secti
onInt
erse
ction
Dela
y, s/v
ehInt
erse
ction
LOS
Move
ment
SBU
SBL
SBT
SBR
Vol, v
eh/h
045
104
46Pe
ak H
our F
actor
1.00
1.00
1.00
1.00
Heav
y Veh
icles
, %2
22
2Mv
mt F
low0
4510
446
Numb
er of
Lane
s0
11
0
Appr
oach
SBOp
posin
g App
roac
hNB
Oppo
sing L
anes
3Co
nflict
ing A
ppro
ach L
eftW
BCo
nflict
ing La
nes L
eft1
Confl
icting
App
roac
h Righ
tEB
Confl
icting
Lane
s Righ
t1
HCM
Contr
ol De
lay13
.3HC
M LO
SB
Lane

MO
VEM
ENT
SUM
MA
RYSi
te:S
McD
owel
l Bl &
Bay
woo
d D
r (A
M F
utur
e pl
us P
roje
ct)
AM
Pea
k H
our
Futu
re p
lus
Pro
ject
Con
ditio
nsR
ound
abou
t
Mov
emen
t Per
form
ance
-Ve
hicl
esD
eman
d Fl
ows
95%
Bac
k of
Que
ueM
ov IDO
DM
ovD
eg.
Satn
Aver
age
Del
ay
Leve
l of
Serv
ice
Prop
. Q
ueue
dEf
fect
ive
Stop
Rat
eAv
erag
eSp
eed
To
tal
HV
Vehi
cles
Dis
tanc
eve
h/h
%v/
cse
cve
hft
per v
ehm
phSo
uth:
NB
Bay
woo
d D
r3
L210
92.
00.
401
12.1
LOS
B1.
948
.80.
740.
8022
.88
T163
2.0
0.40
112
.1LO
S B
1.9
48.8
0.74
0.80
22.4
18R
264
2.0
0.40
112
.1LO
S B
1.9
48.8
0.74
0.80
21.8
Appr
oach
236
2.0
0.40
112
.1LO
S B
1.9
48.8
0.74
0.80
22.4
East
: WB
S M
cDow
ell B
l1
L229
2.0
0.74
215
.3LO
S B
8.9
226.
80.
790.
6428
.36
T180
62.
00.
742
15.3
LOS
B8.
922
6.8
0.79
0.64
28.1
16R
217
2.0
0.74
215
.3LO
S B
8.9
226.
80.
790.
6427
.4Ap
proa
ch85
22.
00.
742
15.3
LOS
B8.
922
6.8
0.79
0.64
28.1
Nor
th: S
B B
ayw
ood
Dr
7L2
352.
00.
416
13.4
LOS
B2.
050
.30.
750.
8322
.84
T111
92.
00.
416
13.4
LOS
B2.
050
.30.
750.
8322
.414
R2
702.
00.
416
13.4
LOS
B2.
050
.30.
750.
8321
.9Ap
proa
ch22
42.
00.
416
13.4
LOS
B2.
050
.30.
750.
8322
.3
Wes
t: E
B S
McD
owel
l Bl
5L2
282.
00.
766
16.2
LOS
B10
.025
2.8
0.81
0.64
28.0
2T1
791
2.0
0.76
616
.2LO
S B
10.0
252.
80.
810.
6427
.812
R2
762.
00.
766
16.2
LOS
B10
.025
2.8
0.81
0.64
27.1
Appr
oach
895
2.0
0.76
616
.2LO
S B
10.0
252.
80.
810.
6427
.7
All V
ehic
les
2207
2.0
0.76
615
.1LO
S B
10.0
252.
80.
790.
6726
.5
Leve
l of S
ervi
ce (L
OS)
Met
hod:
Del
ay &
v/c
(HC
M 2
010)
. R
ound
abou
t LO
S M
etho
d: S
ame
as S
igna
lised
Inte
rsec
tions
.Ve
hicl
e m
ovem
ent L
OS
val
ues
are
base
d on
ave
rage
del
ay a
nd v
/c ra
tio (d
egre
e of
sat
urat
ion)
per
mov
emen
tLO
S F
will
resu
lt if
v/c
> 1
irres
pect
ive
of m
ovem
ent d
elay
val
ue (d
oes
not a
pply
for a
ppro
ache
s an
d in
ters
ectio
n).
Inte
rsec
tion
and
Appr
oach
LO
S va
lues
are
bas
ed o
n av
erag
e de
lay
for a
ll m
ovem
ents
(v/c
not
use
d as
spe
cifie
d in
HC
M 2
010)
.R
ound
abou
t Cap
acity
Mod
el: U
S H
CM
201
0.H
CM
Del
ay F
orm
ula
optio
n is
use
d. C
ontro
l Del
ay d
oes
not i
nclu
de G
eom
etric
Del
ay s
ince
Exc
lude
Geo
met
ric D
elay
opt
ion
appl
ies.
Gap
-Acc
epta
nce
Cap
acity
: Tra
ditio
nal M
1.H
V (%
) val
ues
are
calc
ulat
ed fo
r All
Mov
emen
t Cla
sses
of A
ll H
eavy
Veh
icle
Mod
el D
esig
natio
n.
Pro
cess
ed: F
riday
, May
22,
201
5 2:
17:4
1 P
MS
IDR
A IN
TER
SEC
TIO
N 6
.0.2
4.48
77C
opyr
ight
© 2
000-
2014
Akc
elik
and
Ass
ocia
tes
Pty
Ltd
ww
w.s
idra
solu
tions
.com
Pro
ject
: N
:\AAA
\SO
X\PE
T\19
1PET
\SID
RA\
Bayw
ood-
McD
owel
l.sip
680
0049
3, 6
0191
58, W
-TR
ANS
, PLU
S /
Floa
ting
MO
VEM
ENT
SUM
MA
RYSi
te:S
McD
owel
l Bl &
Bay
woo
d D
r (PM
Fut
ure
plus
Pro
ject
)P
M P
eak
Hou
rFu
ture
plu
s P
roje
ct C
ondi
tions
Rou
ndab
out
Mov
emen
t Per
form
ance
-Ve
hicl
esD
eman
d Fl
ows
95%
Bac
k of
Que
ueM
ov IDO
DM
ovD
eg.
Satn
Aver
age
Del
ay
Leve
l of
Serv
ice
Prop
. Q
ueue
dEf
fect
ive
Stop
Rat
eAv
erag
eSp
eed
To
tal
HV
Vehi
cles
Dis
tanc
eve
h/h
%v/
cse
cve
hft
per v
ehm
phSo
uth:
NB
Bay
woo
d D
r3
L278
2.0
0.47
416
.6LO
S B
2.3
58.4
0.79
0.90
22.0
8T1
105
2.0
0.47
416
.6LO
S B
2.3
58.4
0.79
0.90
21.6
18R
241
2.0
0.47
416
.6LO
S B
2.3
58.4
0.79
0.90
21.1
Appr
oach
224
2.0
0.47
416
.6LO
S B
2.3
58.4
0.79
0.90
21.6
East
: WB
S M
cDow
ell B
l1
L256
2.0
1.00
949
.5LO
S F
40.4
1025
.81.
001.
6019
.96
T199
92.
01.
009
49.5
LOS
F40
.410
25.8
1.00
1.60
19.8
16R
228
2.0
1.00
949
.5LO
S F
40.4
1025
.81.
001.
6019
.4Ap
proa
ch10
832.
01.
009
49.5
LOS
D40
.410
25.8
1.00
1.60
19.8
Nor
th: S
B B
ayw
ood
Dr
7L2
212.
00.
274
12.4
LOS
B1.
127
.10.
750.
7623
.04
T152
2.0
0.27
412
.4LO
S B
1.1
27.1
0.75
0.76
22.6
14R
250
2.0
0.27
412
.4LO
S B
1.1
27.1
0.75
0.76
22.0
Appr
oach
123
2.0
0.27
412
.4LO
S B
1.1
27.1
0.75
0.76
22.4
Wes
t: E
B S
McD
owel
l Bl
5L2
832.
00.
978
38.9
LOS
D38
.798
3.5
1.00
0.90
21.8
2T1
968
2.0
0.97
838
.9LO
S D
38.7
983.
51.
000.
9021
.712
R2
156
2.0
0.97
838
.9LO
S D
38.7
983.
51.
000.
9021
.3Ap
proa
ch12
072.
00.
978
38.9
LOS
D38
.798
3.5
1.00
0.90
21.7
All V
ehic
les
2637
2.0
1.00
940
.1LO
S D
40.4
1025
.80.
971.
1820
.9
Leve
l of S
ervi
ce (L
OS)
Met
hod:
Del
ay &
v/c
(HC
M 2
010)
. R
ound
abou
t LO
S M
etho
d: S
ame
as S
igna
lised
Inte
rsec
tions
.Ve
hicl
e m
ovem
ent L
OS
val
ues
are
base
d on
ave
rage
del
ay a
nd v
/c ra
tio (d
egre
e of
sat
urat
ion)
per
mov
emen
tLO
S F
will
resu
lt if
v/c
> 1
irres
pect
ive
of m
ovem
ent d
elay
val
ue (d
oes
not a
pply
for a
ppro
ache
s an
d in
ters
ectio
n).
Inte
rsec
tion
and
Appr
oach
LO
S va
lues
are
bas
ed o
n av
erag
e de
lay
for a
ll m
ovem
ents
(v/c
not
use
d as
spe
cifie
d in
HC
M 2
010)
.R
ound
abou
t Cap
acity
Mod
el: U
S H
CM
201
0.H
CM
Del
ay F
orm
ula
optio
n is
use
d. C
ontro
l Del
ay d
oes
not i
nclu
de G
eom
etric
Del
ay s
ince
Exc
lude
Geo
met
ric D
elay
opt
ion
appl
ies.
Gap
-Acc
epta
nce
Cap
acity
: Tra
ditio
nal M
1.H
V (%
) val
ues
are
calc
ulat
ed fo
r All
Mov
emen
t Cla
sses
of A
ll H
eavy
Veh
icle
Mod
el D
esig
natio
n.
Pro
cess
ed: F
riday
, May
22,
201
5 2:
17:4
4 P
MS
IDR
A IN
TER
SEC
TIO
N 6
.0.2
4.48
77C
opyr
ight
© 2
000-
2014
Akc
elik
and
Ass
ocia
tes
Pty
Ltd
ww
w.s
idra
solu
tions
.com
Pro
ject
: N
:\AAA
\SO
X\PE
T\19
1PET
\SID
RA\
Bayw
ood-
McD
owel
l.sip
680
0049
3, 6
0191
58, W
-TR
ANS
, PLU
S /
Floa
ting

HC
M U
nsig
naliz
ed In
ters
ectio
n C
apac
ity A
naly
sis
9: B
ayw
ood
Dr &
Per
ry L
n5/2
2/201
5
Sync
hro 8
Rep
ort
Altur
a Apa
rtmen
ts Tr
affic
Impa
ct St
udy
Futur
e AM
Peak
Hou
r with
Roa
d Diet
W-T
rans
Move
ment
EBL
EBT
EBR
WBL
WBT
WBR
NBL
NBT
NBR
SBL
SBT
SBR
Lane
Con
figur
ation
sVo
lume (
veh/h
)0
02
470
532
145
242
521
0Si
gn C
ontro
lSt
opSt
opFr
eeFr
eeGr
ade
0%0%
0%0%
Peak
Hou
r Fac
tor1.0
01.0
01.0
01.0
01.0
01.0
01.0
01.0
01.0
01.0
01.0
01.0
0Ho
urly
flow
rate
(vph)
00
247
053
214
524
252
10
Pede
strian
sLa
ne W
idth (
ft)W
alking
Spe
ed (f
t/s)
Perce
nt Bl
ocka
geRi
ght tu
rn fla
re (v
eh)
Media
n typ
eTW
LTL
TWLT
LMe
dian s
torag
e veh
)2
2Up
strea
m sig
nal (f
t)27
0pX
, plat
oon u
nbloc
ked
vC, c
onflic
ting v
olume
654
698
521
688
686
8452
116
9vC
1, sta
ge 1
conf
vol
525
525
161
161
vC2,
stage
2 co
nf vo
l13
017
352
752
5vC
u, un
block
ed vo
l65
469
852
168
868
684
521
169
tC, s
ingle
(s)7.5
6.56.9
7.56.5
6.94.1
4.1tC
, 2 st
age (
s)6.5
5.56.5
5.5tF
(s)
3.54.0
3.33.5
4.03.3
2.22.2
p0 qu
eue f
ree %
100
100
100
9010
094
100
100
cM ca
pacit
y (ve
h/h)
477
496
500
473
497
958
1041
1406
Dire
ction
, Lan
e #EB
1W
B 1
NB 1
NB 2
NB 3
SB 1
SB 2
Volum
e Tota
l2
100
297
722
521
Volum
e Left
047
20
02
0Vo
lume R
ight
253
00
240
0cS
H50
064
610
4117
0017
0014
0617
00Vo
lume t
o Cap
acity
0.00
0.15
0.00
0.06
0.04
0.00
0.31
Queu
e Len
gth 95
th (ft
)0
140
00
00
Contr
ol De
lay (s
)12
.211
.68.5
0.00.0
7.60.0
Lane
LOS
BB
AA
Appr
oach
Dela
y (s)
12.2
11.6
0.10.0
Appr
oach
LOS
BB
Inter
secti
on S
umma
ryAv
erag
e Dela
y 1.5
Inter
secti
on C
apac
ity U
tiliza
tion
46.6%
ICU
Leve
l of S
ervic
e A
Analy
sis P
eriod
(min)
15
HC
M U
nsig
naliz
ed In
ters
ectio
n C
apac
ity A
naly
sis
9: B
ayw
ood
Dr &
Per
ry L
n5/2
2/201
5
Sync
hro 8
Rep
ort
Altur
a Ap
artm
ents
Traff
ic Im
pact
Stud
y Fu
ture P
M Pe
ak H
our w
ith R
oad D
ietW
-Tra
ns
Move
ment
EBL
EBT
EBR
WBL
WBT
WBR
NBL
NBT
NBR
SBL
SBT
SBR
Lane
Con
figur
ation
sVo
lume (
veh/h
)0
00
270
270
394
470
249
0Si
gn C
ontro
lSt
opSt
opFr
eeFr
eeGr
ade
0%0%
0%0%
Peak
Hou
r Fac
tor1.0
01.0
01.0
01.0
01.0
01.0
01.0
01.0
01.0
01.0
01.0
01.0
0Ho
urly
flow
rate
(vph)
00
027
027
039
447
024
90
Pede
strian
sLa
ne W
idth (
ft)W
alking
Spe
ed (f
t/s)
Perce
nt Bl
ocka
geRi
ght tu
rn fla
re (v
eh)
Media
n typ
eTW
LTL
TWLT
LMe
dian s
torag
e veh
)2
2Up
strea
m sig
nal (f
t)27
0pX
, plat
oon u
nbloc
ked
vC, c
onflic
ting v
olume
473
690
249
666
666
220
249
441
vC1,
stage
1 co
nf vo
l24
924
941
841
8vC
2, sta
ge 2
conf
vol
224
441
249
249
vCu,
unblo
cked
vol
473
690
249
666
666
220
249
441
tC, s
ingle
(s)7.5
6.56.9
7.56.5
6.94.1
4.1tC
, 2 st
age (
s)6.5
5.56.5
5.5tF
(s)
3.54.0
3.33.5
4.03.3
2.22.2
p0 qu
eue f
ree %
100
100
100
9510
097
100
100
cM ca
pacit
y (ve
h/h)
626
522
751
525
533
783
1314
1115
Dire
ction
, Lan
e #EB
1W
B 1
NB 1
NB 2
NB 3
SB 1
SB 2
Volum
e Tota
l0
540
263
178
024
9Vo
lume L
eft0
270
00
00
Volum
e Righ
t0
270
047
00
cSH
1700
629
1700
1700
1700
1700
1700
Volum
e to C
apac
ity0.0
00.0
90.0
00.1
50.1
00.0
00.1
5Qu
eue L
ength
95th
(ft)
07
00
00
0Co
ntrol
Delay
(s)
0.011
.30.0
0.00.0
0.00.0
Lane
LOS
AB
Appr
oach
Dela
y (s)
0.011
.30.0
0.0Ap
proa
ch LO
SA
B
Inter
secti
on S
umma
ryAv
erag
e Dela
y 0.8
Inter
secti
on C
apac
ity U
tiliza
tion
23.1%
ICU
Leve
l of S
ervic
e A
Analy
sis P
eriod
(min)
15

HC
M U
nsig
naliz
ed In
ters
ectio
n C
apac
ity A
naly
sis
9: B
ayw
ood
Dr &
Per
ry L
ane/
Per
ry L
n5/2
2/201
5
Sync
hro 8
Rep
ort
Altur
a Ap
artm
ents
Traff
ic Im
pact
Stud
y Futu
re
AM P
eak H
our p
lus P
rojec
t with
Roa
d Diet
W-T
rans
Move
ment
EBL
EBT
EBR
WBL
WBT
WBR
NBL
NBT
NBR
SBL
SBT
SBR
Lane
Con
figur
ation
sVo
lume (
veh/h
)1
032
450
509
145
232
526
0Si
gn C
ontro
lSt
opSt
opFr
eeFr
eeGr
ade
0%0%
0%0%
Peak
Hou
r Fac
tor1.0
01.0
01.0
01.0
01.0
01.0
01.0
01.0
01.0
01.0
01.0
01.0
0Ho
urly
flow
rate
(vph)
10
3245
050
914
523
252
60
Pede
strian
sLa
ne W
idth (
ft)W
alking
Spe
ed (f
t/s)
Perce
nt Bl
ocka
geRi
ght tu
rn fla
re (v
eh)
Media
n typ
eTW
LTL
TWLT
LMe
dian s
torag
e veh
)2
2Up
strea
m sig
nal (f
t)27
0pX
, plat
oon u
nbloc
ked
vC, c
onflic
ting v
olume
670
716
526
736
704
8452
616
8vC
1, sta
ge 1
conf
vol
530
530
174
174
vC2,
stage
2 co
nf vo
l14
018
656
253
0vC
u, un
block
ed vo
l67
071
652
673
670
484
526
168
tC, s
ingle
(s)7.5
6.56.9
7.56.5
6.94.1
4.1tC
, 2 st
age (
s)6.5
5.56.5
5.5tF
(s)
3.54.0
3.33.5
4.03.3
2.22.2
p0 qu
eue f
ree %
100
100
9489
100
9599
100
cM ca
pacit
y (ve
h/h)
472
491
496
418
487
958
1037
1407
Dire
ction
, Lan
e #EB
1W
B 1
NB 1
NB 2
NB 3
SB 1
SB 2
Volum
e Tota
l33
959
9771
252
6Vo
lume L
eft1
459
00
20
Volum
e Righ
t32
500
023
00
cSH
496
595
1037
1700
1700
1407
1700
Volum
e to C
apac
ity0.0
70.1
60.0
10.0
60.0
40.0
00.3
1Qu
eue L
ength
95th
(ft)
514
10
00
0Co
ntrol
Delay
(s)
12.8
12.2
8.50.0
0.07.6
0.0La
ne LO
SB
BA
AAp
proa
ch D
elay (
s)12
.812
.20.4
0.0Ap
proa
ch LO
SB
B
Inter
secti
on S
umma
ryAv
erag
e Dela
y 2.0
Inter
secti
on C
apac
ity U
tiliza
tion
46.6%
ICU
Leve
l of S
ervic
e A
Analy
sis P
eriod
(min)
15
HC
M U
nsig
naliz
ed In
ters
ectio
n C
apac
ity A
naly
sis
9: B
ayw
ood
Dr &
Per
ry L
n5/2
2/201
5
Sync
hro 8
Rep
ort
Altur
a Ap
artm
ents
Traff
ic Im
pact
Stud
y Futu
re
PM P
eak H
our p
lus P
rojec
t with
Roa
d Diet
W-T
rans
Move
ment
EBL
EBT
EBR
WBL
WBT
WBR
NBL
NBT
NBR
SBL
SBT
SBR
Lane
Con
figur
ation
sVo
lume (
veh/h
)0
016
260
2629
404
450
253
1Si
gn C
ontro
lSt
opSt
opFr
eeFr
eeGr
ade
0%0%
0%0%
Peak
Hou
r Fac
tor1.0
01.0
01.0
01.0
01.0
01.0
01.0
01.0
01.0
01.0
01.0
01.0
0Ho
urly
flow
rate
(vph)
00
1626
026
2940
445
025
31
Pede
strian
sLa
ne W
idth (
ft)W
alking
Spe
ed (f
t/s)
Perce
nt Bl
ocka
geRi
ght tu
rn fla
re (v
eh)
Media
n typ
eTW
LTL
TWLT
LMe
dian s
torag
e veh
)2
2Up
strea
m sig
nal (f
t)27
0pX
, plat
oon u
nbloc
ked
vC, c
onflic
ting v
olume
540
760
254
754
738
224
254
449
vC1,
stage
1 co
nf vo
l25
425
448
448
4vC
2, sta
ge 2
conf
vol
286
507
269
254
vCu,
unblo
cked
vol
540
760
254
754
738
224
254
449
tC, s
ingle
(s)7.5
6.56.9
7.56.5
6.94.1
4.1tC
, 2 st
age (
s)6.5
5.56.5
5.5tF
(s)
3.54.0
3.33.5
4.03.3
2.22.2
p0 qu
eue f
ree %
100
100
9894
100
9798
100
cM ca
pacit
y (ve
h/h)
579
482
746
465
488
779
1308
1108
Dire
ction
, Lan
e #EB
1W
B 1
NB 1
NB 2
NB 3
SB 1
SB 2
Volum
e Tota
l16
5229
269
180
025
4Vo
lume L
eft0
2629
00
00
Volum
e Righ
t16
260
045
01
cSH
746
583
1308
1700
1700
1700
1700
Volum
e to C
apac
ity0.0
20.0
90.0
20.1
60.1
10.0
00.1
5Qu
eue L
ength
95th
(ft)
27
20
00
0Co
ntrol
Delay
(s)
9.911
.87.8
0.00.0
0.00.0
Lane
LOS
AB
AAp
proa
ch D
elay (
s)9.9
11.8
0.50.0
Appr
oach
LOS
AB
Inter
secti
on S
umma
ryAv
erag
e Dela
y 1.2
Inter
secti
on C
apac
ity U
tiliza
tion
36.4%
ICU
Leve
l of S
ervic
e A
Analy
sis P
eriod
(min)
15