Embed Size (px)
Citation preview
WirelessLabs
Xploration Begins Here
Traffic Blocking Theory for Data Services
Contents
Traffic Blocking Theory Application
Application 1: System Capacity Adjustment Method Based on Traffic Volume Requirements ................. 11
Application 2: System Capacity Adjustment Method Based on Experience Blocking Analysis ................. 12
Future Development................................................................................................................... 12
Traffic Blocking Analysis Methodology............................................................................ 4
Background.........................................................................................................................................2
Executive Summary....................................................................................................................... 1
Traffic Blocking Theory Analysis and Typical Results
Definition and Calculation Method of Session-level Hard Experience Blocking ......................................... 6
Definition and Calculation Method of Session-level Soft Experience Blocking .......................................... 7
Definition and Calculation Method of Packet Delay Blocking .................................................................. 8
Typical Results of Experience Blocking .................................................................................................... 9
Experience Blocking Calculation SDK .................................................................................................... 10
01 White Paper for the Traffic Blocking Theory for Data Services
Executive Summary
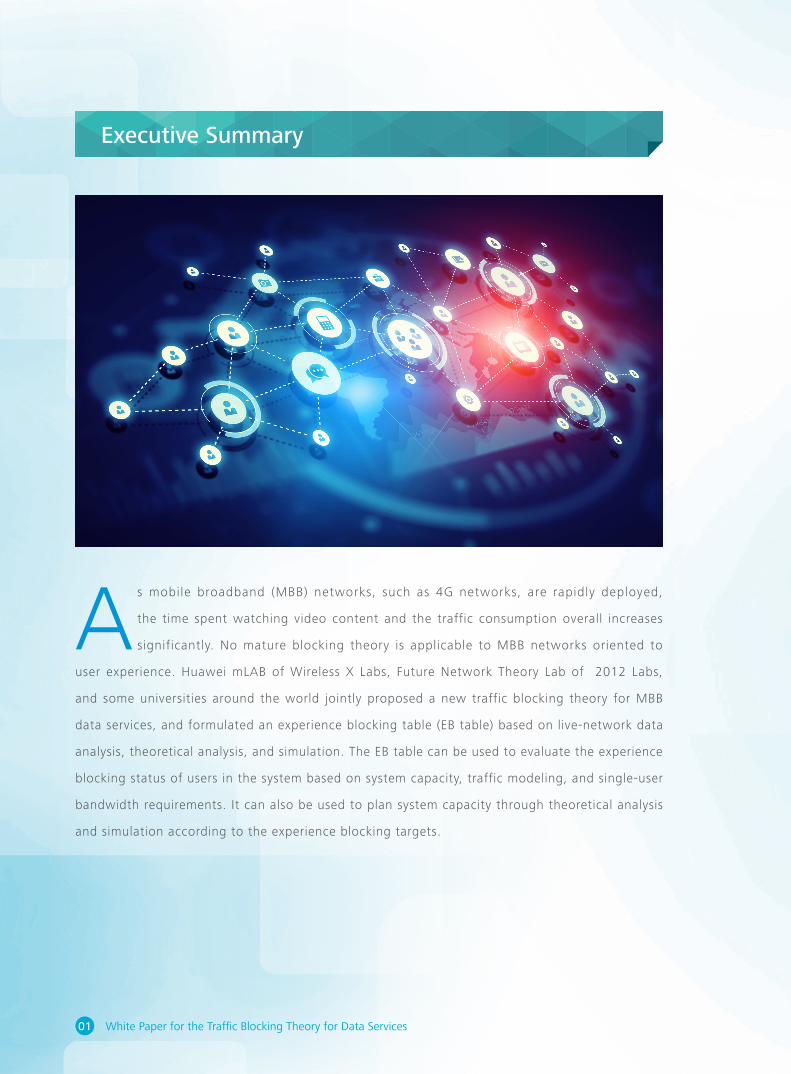
As mobile broadband (MBB) networks, such as 4G networks, are rapidly deployed,
the time spent watching video content and the traffic consumption overall increases
significantly. No mature blocking theory is applicable to MBB networks oriented to
user experience. Huawei mLAB of Wireless X Labs, Future Network Theory Lab of 2012 Labs,
and some universities around the world jointly proposed a new traffic blocking theory for MBB
data services, and formulated an experience blocking table (EB table) based on live-network data
analysis, theoretical analysis, and simulation. The EB table can be used to evaluate the experience
blocking status of users in the system based on system capacity, traffic modeling, and single-user
bandwidth requirements. It can also be used to plan system capacity through theoretical analysis
and simulation according to the experience blocking targets.
02White Paper for the Traffic Blocking Theory for Data Services
Background
In 1909, Danish mathematician Agner Krarup Erlang, proposed a traffic blocking probability theory and
this theory has been widely applied to voice networks. The theory is used for network simulation, planning
of system capacity, and call blocking probability analysis on the live network. In the Erlang B formula, new
incoming calls are blocked when all channels are occupied. In the Erlang C formula, new incoming calls can
be queued until there are available channel resources when all channels are occupied. This does not affect
users with ongoing services in the system.
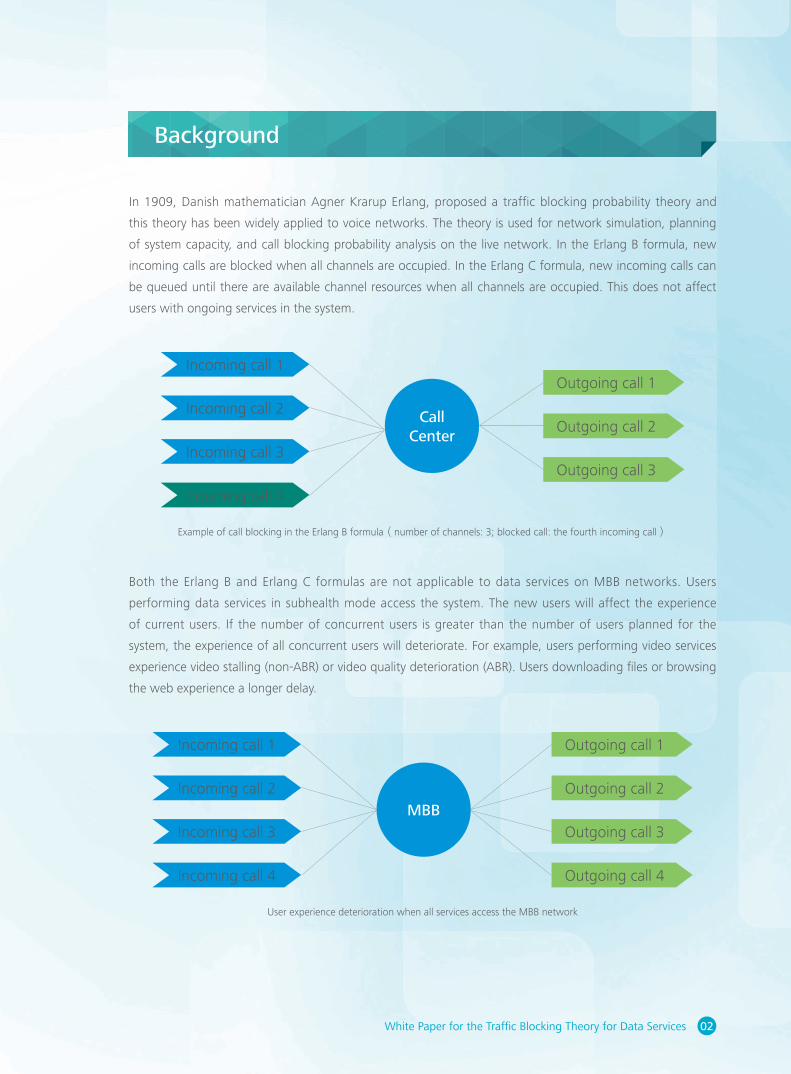
Both the Erlang B and Erlang C formulas are not applicable to data services on MBB networks. Users
performing data services in subhealth mode access the system. The new users will affect the experience
of current users. If the number of concurrent users is greater than the number of users planned for the
system, the experience of all concurrent users will deteriorate. For example, users performing video services
experience video stalling (non-ABR) or video quality deterioration (ABR). Users downloading files or browsing
the web experience a longer delay.
Example of call blocking in the Erlang B formula(number of channels: 3; blocked call: the fourth incoming call)
Call Center
Incoming call 1
Incoming call 2
Incoming call 3
Incoming call 4
Outgoing call 1
Outgoing call 2
Outgoing call 3
User experience deterioration when all services access the MBB network
MBB
Incoming call 1
Incoming call 2
Incoming call 3
Incoming call 4
Outgoing call 1
Outgoing call 2
Outgoing call 3
Outgoing call 4
03 White Paper for the Traffic Blocking Theory for Data Services
Background
At present, the cell-level or network-wide average user-perceived throughput is generally used to evaluate
the performance of MBB networks. This covers up some users' dissatisfaction with experience. Therefore,
session-level and data-packet-level experience blocking evaluation and related theories are urgently needed.
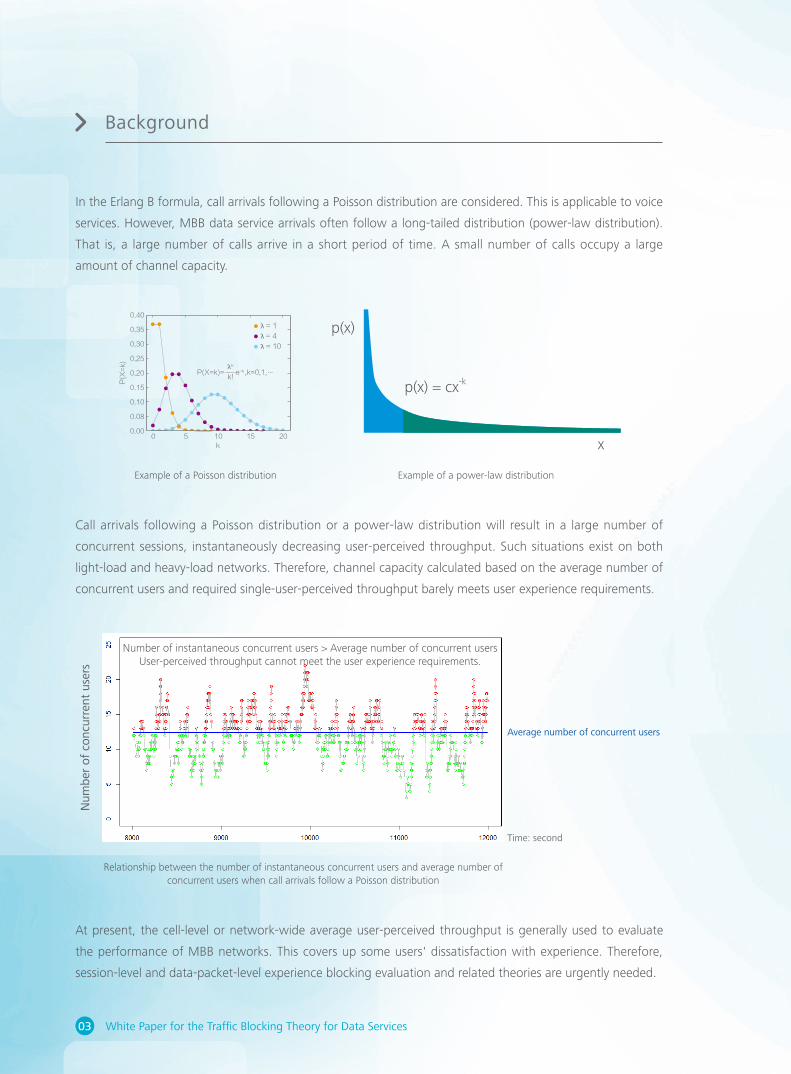
In the Erlang B formula, call arrivals following a Poisson distribution are considered. This is applicable to voice
services. However, MBB data service arrivals often follow a long-tailed distribution (power-law distribution).
That is, a large number of calls arrive in a short period of time. A small number of calls occupy a large
amount of channel capacity.
Call arrivals following a Poisson distribution or a power-law distribution will result in a large number of
concurrent sessions, instantaneously decreasing user-perceived throughput. Such situations exist on both
light-load and heavy-load networks. Therefore, channel capacity calculated based on the average number of
concurrent users and required single-user-perceived throughput barely meets user experience requirements.
Relationship between the number of instantaneous concurrent users and average number of concurrent users when call arrivals follow a Poisson distribution
Number of instantaneous concurrent users > Average number of concurrent usersUser-perceived throughput cannot meet the user experience requirements.
Num
ber
of c
oncu
rren
t us
ers
Average number of concurrent users
Time: second
Example of a Poisson distribution Example of a power-law distribution
λ= 1
λ= 4
λ= 10
0.40
0.35
0.30
0.25
0.20
0.15
0.10
0.08
0.000 5 10
k
P(X
=k)
15 20
P(X=k)=---- e-λ,k=0,1,…k!
λk
p(x) = cx-k
p(x)
x
04White Paper for the Traffic Blocking Theory for Data Services
No mature blocking theory is applicable to MBB networks oriented to user experience. Faced with such
problems and challenges, Huawei mLAB, Future Network Theory Lab, and some universities around the
world jointly perform related analysis based on live-network data, theoretical analysis, and simulation to
formulate the EB table for data services.
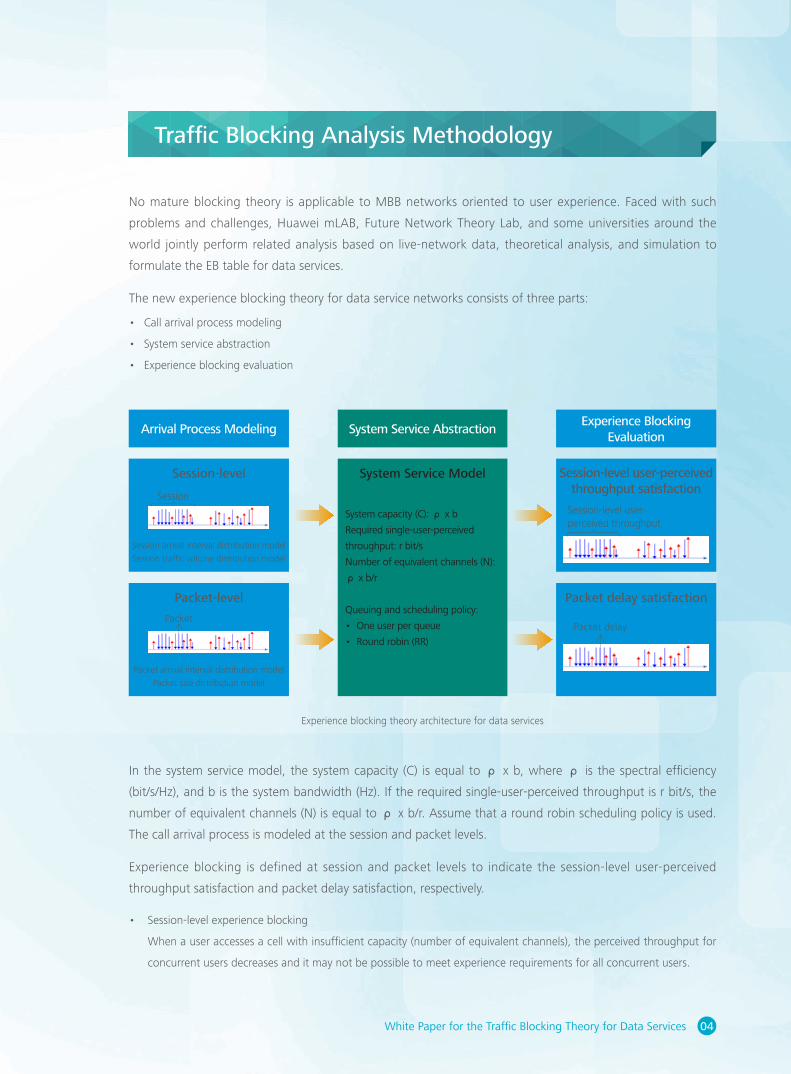
The new experience blocking theory for data service networks consists of three parts:
• Call arrival process modeling
• System service abstraction
• Experience blocking evaluation
In the system service model, the system capacity (C) is equal to ρ x b, where ρ is the spectral efficiency
(bit/s/Hz), and b is the system bandwidth (Hz). If the required single-user-perceived throughput is r bit/s, the
number of equivalent channels (N) is equal to ρ x b/r. Assume that a round robin scheduling policy is used.
The call arrival process is modeled at the session and packet levels.
Experience blocking is defined at session and packet levels to indicate the session-level user-perceived
throughput satisfaction and packet delay satisfaction, respectively.
• Session-level experience blocking
When a user accesses a cell with insufficient capacity (number of equivalent channels), the perceived throughput for
concurrent users decreases and it may not be possible to meet experience requirements for all concurrent users.
Traffic Blocking Analysis Methodology
Arrival Process Modeling System Service AbstractionExperience Blocking
Evaluation
Session-level
Session arrival interval distribution model
Session traffic volume distribution model
Session
Session-level user-perceived throughput satisfaction
Session-level user-perceived throughput
Packet-level
Packet arrival interval distribution model
Packet size distribution model
Packet
Packet delay satisfaction
Packet delay
System Service Model
System capacity (C): ρ x b
Required single-user-perceived
throughput: r bit/s
Number of equivalent channels (N):
ρ x b/r
Queuing and scheduling policy:
• One user per queue
• Round robin (RR)
Experience blocking theory architecture for data services
05 White Paper for the Traffic Blocking Theory for Data Services
Traffic Blocking Analysis Methodology
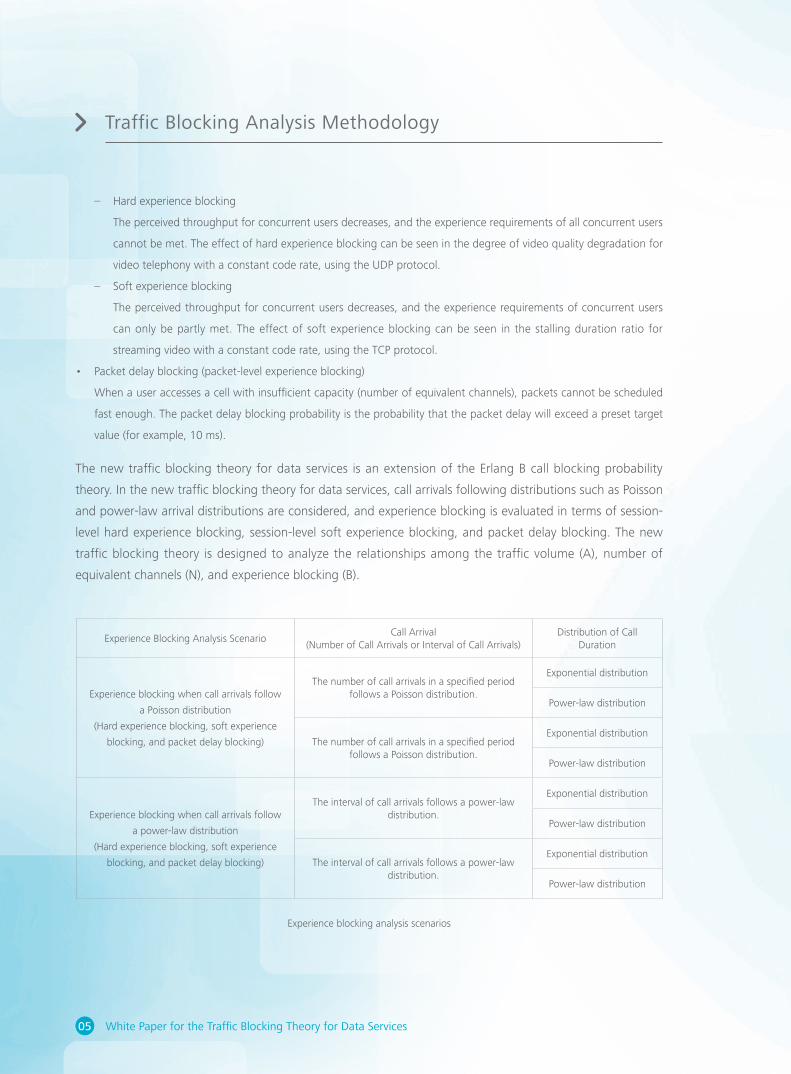
Experience Blocking Analysis ScenarioCall Arrival
(Number of Call Arrivals or Interval of Call Arrivals)Distribution of Call
Duration
Experience blocking when call arrivals follow
a Poisson distribution
(Hard experience blocking, soft experience
blocking, and packet delay blocking)
The number of call arrivals in a specified period follows a Poisson distribution.
Exponential distribution
Power-law distribution
The number of call arrivals in a specified period follows a Poisson distribution.
Exponential distribution
Power-law distribution
Experience blocking when call arrivals follow
a power-law distribution
(Hard experience blocking, soft experience
blocking, and packet delay blocking)
The interval of call arrivals follows a power-law distribution.
Exponential distribution
Power-law distribution
The interval of call arrivals follows a power-law distribution.
Exponential distribution
Power-law distribution
Experience blocking analysis scenarios
– Hard experience blocking
The perceived throughput for concurrent users decreases, and the experience requirements of all concurrent users
cannot be met. The effect of hard experience blocking can be seen in the degree of video quality degradation for
video telephony with a constant code rate, using the UDP protocol.
– Soft experience blocking
The perceived throughput for concurrent users decreases, and the experience requirements of concurrent users
can only be partly met. The effect of soft experience blocking can be seen in the stalling duration ratio for
streaming video with a constant code rate, using the TCP protocol.
• Packet delay blocking (packet-level experience blocking)
When a user accesses a cell with insufficient capacity (number of equivalent channels), packets cannot be scheduled
fast enough. The packet delay blocking probability is the probability that the packet delay will exceed a preset target
value (for example, 10 ms).
The new traffic blocking theory for data services is an extension of the Erlang B call blocking probability
theory. In the new traffic blocking theory for data services, call arrivals following distributions such as Poisson
and power-law arrival distributions are considered, and experience blocking is evaluated in terms of session-
level hard experience blocking, session-level soft experience blocking, and packet delay blocking. The new
traffic blocking theory is designed to analyze the relationships among the traffic volume (A), number of
equivalent channels (N), and experience blocking (B).
06White Paper for the Traffic Blocking Theory for Data Services
Traffic Blocking Theory Analysis and Typical Results
Based on the call access mode, system service abstraction, and traffic blocking characteristics of data service
networks, the following sections provide definitions, calculation methods, theories, and simulation results of
session-level experience blocking and packet-level experience blocking. In addition, an EB table is formulated
through theoretical analysis and simulation.
Definition
When a user accesses a cell with insufficient capacity (number of equivalent channels), the perceived
throughput for all concurrent users decreases and experience requirements for all concurrent users cannot
be met.
Calculation Method
If the number of concurrent users is greater than the number of equivalent channels in a specified period ti
( ∈ [T1, T2]) within the measurement period ([T1, T2]), throughput of all concurrent users in ti cannot meet
experience requirements. Hard blocking ratio can be calculated using the following formula:
Hard blocking ratio = Σti ∈ [T1, T2] Unsatisfied traffic volume [ti]/Total traffic volume
The methods of calculating the satisfied traffic volume and unsatisfied traffic volume in each ti are as follows:
• Number of concurrent users > Number of equivalent channels
Satisfied traffic volume = 0
Unsatisfied traffic volume = Number of concurrent users
• Number of concurrent users ≤ Number of equivalent channels
Satisfied traffic volume = Number of concurrent users
Unsatisfied traffic volume = 0
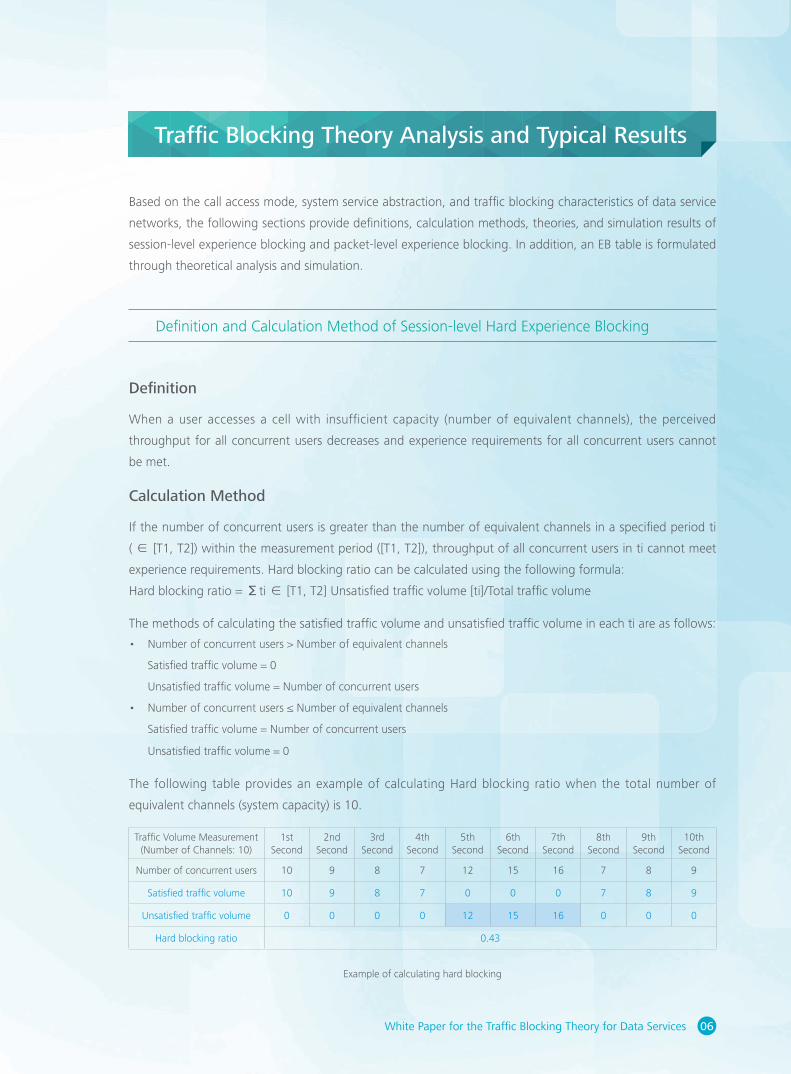
The following table provides an example of calculating Hard blocking ratio when the total number of
equivalent channels (system capacity) is 10.
Definition and Calculation Method of Session-level Hard Experience Blocking
Traffic Volume Measurement (Number of Channels: 10)
1st Second
2nd Second
3rd Second
4th Second
5th Second
6th Second
7th Second
8th Second
9th Second
10th Second
Number of concurrent users 10 9 8 7 12 15 16 7 8 9
Satisfied traffic volume 10 9 8 7 0 0 0 7 8 9
Unsatisfied traffic volume 0 0 0 0 12 15 16 0 0 0
Hard blocking ratio 0.43
Example of calculating hard blocking
07 White Paper for the Traffic Blocking Theory for Data Services
Traffic Blocking Theory Analysis and Typical Results
Definition and Calculation Method of Session-level Soft Experience Blocking
Definition
When a user accesses a cell with insufficient capacity (number of equivalent channels), the perceived
throughput for all concurrent users decreases and experience requirements for concurrent users can be partly
met.
Calculation Method
If the number of concurrent users is greater than the number of equivalent channels in a specified period ti (∈
[T1, T2]) within the measurement period ([T1, T2]), experience requirements of concurrent users in ti can be
partly met. Soft blocking ratio can be calculated using the following formula:
Soft blocking ratio = Σti ∈ [T1, T2] Unsatisfied traffic volume [ti]/Total traffic volume
The methods of calculating the satisfied traffic volume and unsatisfied traffic volume in each ti are as follows:
• Number of concurrent users > Number of equivalent channels
Satisfied traffic volume = Number of concurrent users x Actual single-user throughput/Required single-user
throughput
Unsatisfied traffic volume = Number of concurrent users x (1 – Actual single-user throughput/Required single-user
throughput)
• Number of concurrent users ≤ Number of equivalent channels
Satisfied traffic volume = Number of concurrent users
Unsatisfied traffic volume = 0
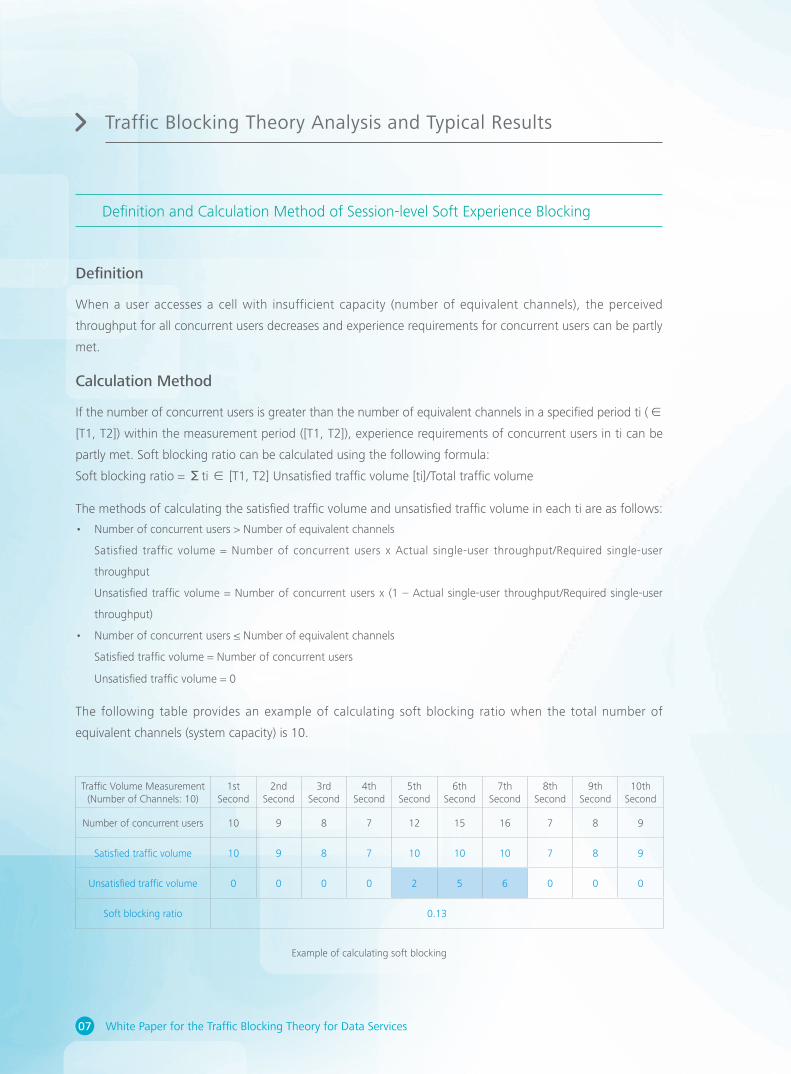
The following table provides an example of calculating soft blocking ratio when the total number of
equivalent channels (system capacity) is 10.
Traffic Volume Measurement (Number of Channels: 10)
1st Second
2nd Second
3rd Second
4th Second
5th Second
6th Second
7th Second
8th Second
9th Second
10th Second
Number of concurrent users 10 9 8 7 12 15 16 7 8 9
Satisfied traffic volume 10 9 8 7 10 10 10 7 8 9
Unsatisfied traffic volume 0 0 0 0 2 5 6 0 0 0
Soft blocking ratio 0.13
Example of calculating soft blocking
08White Paper for the Traffic Blocking Theory for Data Services
Traffic Blocking Theory Analysis and Typical Results
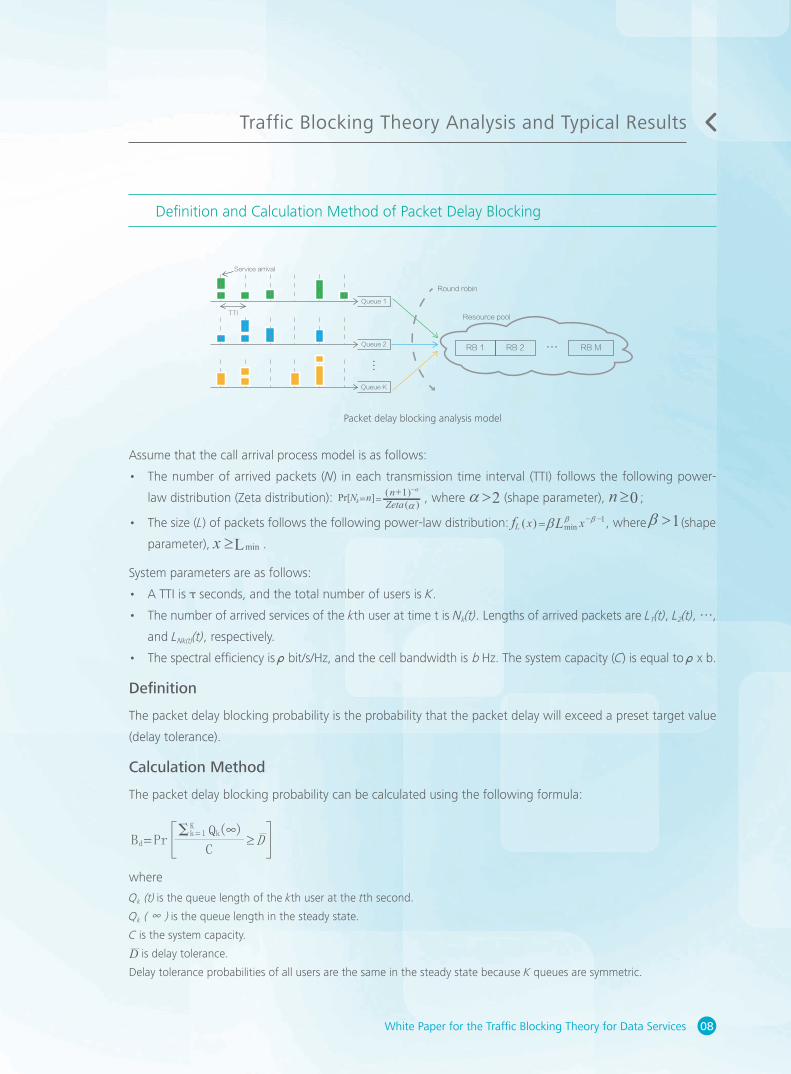
Definition and Calculation Method of Packet Delay Blocking
Assume that the call arrival process model is as follows:
• The number of arrived packets (N ) in each transmission time interval (TTI) follows the following power-
law distribution (Zeta distribution): , where (shape parameter), ;
• The size (L) of packets follows the following power-law distribution: , where (shape
parameter), .
System parameters are as follows:
• A TTI isτseconds, and the total number of users is K.
• The number of arrived services of the kth user at time t is Nk(t) . Lengths of arrived packets are L1(t) , L2(t) , …,
and LNk(t)(t) , respectively.
• The spectral efficiency isρbit/s/Hz, and the cell bandwidth is b Hz. The system capacity (C ) is equal toρx b.
Definition
The packet delay blocking probability is the probability that the packet delay will exceed a preset target value
(delay tolerance).
Calculation Method
The packet delay blocking probability can be calculated using the following formula:
where
Qk (t) is the queue length of the kth user at the tth second.
Qk ( ∞ ) is the queue length in the steady state.
C is the system capacity.
is delay tolerance.
Delay tolerance probabilities of all users are the same in the steady state because K queues are symmetric.
)()1(α
α
Zetan −+
=]Pr[ nNk=
1min
−−= βββ xL)(xfL
2>α1>β
n 0≥
x Lmin≥
D
≥D=PrC
Bd
∞)(QkKk=1Σ
Packet delay blocking analysis model
RB 1 RB 2 RB M
Resource pool
Service arrival
TTI
Queue 1
Queue 2
Queue K
Round robin
09 White Paper for the Traffic Blocking Theory for Data Services
where
A is the traffic volume. It i s equal toλxω .
λ is the average number of call arrivals in a measurement period.
ω is the average call duration in a measurement period.
N is the number of equivalent channels.
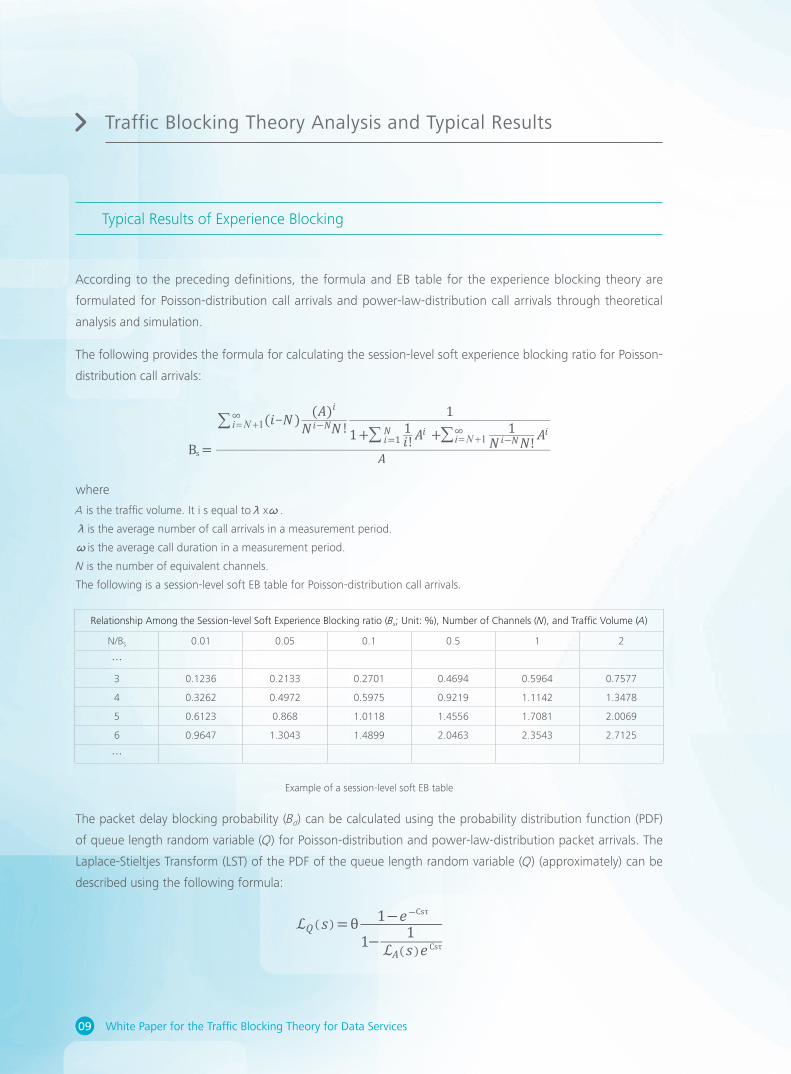
The following is a session-level soft EB table for Poisson-distribution call arrivals.
Relationship Among the Session-level Soft Experience Blocking ratio (Bs; Unit: %), Number of Channels (N ), and Traffic Volume (A)
N/BS 0.01 0.05 0.1 0.5 1 2
…
3 0.1236 0.2133 0.2701 0.4694 0.5964 0.7577
4 0.3262 0.4972 0.5975 0.9219 1.1142 1.3478
5 0.6123 0.868 1.0118 1.4556 1.7081 2.0069
6 0.9647 1.3043 1.4899 2.0463 2.3543 2.7125
…
Example of a session-level soft EB table
The packet delay blocking probability (Bd) can be calculated using the probability distribution function (PDF)
of queue length random variable (Q ) for Poisson-distribution and power-law-distribution packet arrivals. The
Laplace-Stieltjes Transform (LST) of the PDF of the queue length random variable (Q) (approximately) can be
described using the following formula:
=θ− 1− −𝑒𝑒 Csτ1
1ℒ𝑄𝑄 𝑠𝑠( (
Csτℒ𝐴𝐴 𝑠𝑠 𝑒𝑒( (
Typical Results of Experience Blocking
According to the preceding definitions, the formula and EB table for the experience blocking theory are
formulated for Poisson-distribution call arrivals and power-law-distribution call arrivals through theoretical
analysis and simulation.
The following provides the formula for calculating the session-level soft experience blocking ratio for Poisson-
distribution call arrivals:
1i N= +1i N= +
∑∑ ∑
Bs =
( (𝑖𝑖 𝑁𝑁 𝑁𝑁 𝑁𝑁( (𝐴𝐴
𝑖𝑖𝑖𝑖
𝑖𝑖
𝑁𝑁 !1
1+ 1𝑖𝑖 𝐴𝐴
𝑖𝑖𝐴𝐴+ 1𝑁𝑁 𝑁𝑁−
−−
𝑁𝑁 !!∞
𝑖𝑖 𝑖𝑖𝑁𝑁=1
∞
𝐴𝐴
Traffic Blocking Theory Analysis and Typical Results

10White Paper for the Traffic Blocking Theory for Data Services
Experience Blocking Calculation SDK
For industrial and engineering applications, Huawei mLAB launches an application kit for the new traffic
blocking theory, including a live-network traffic model analysis and simulation platform, EB table SDK, and
related websites.
The following figure provides the input and output parameters of the EB table SDK.
where
is the LST of the packet arrival process.
s is a complex number.
C is the system capacity.
θ is the idle rate of the system.
The following is a packet delay blocking table (target packet delay: 10 ms) for power-law-distribution packet
arrivals.
NOTE
When this table is used in a typical service scenario, the number of equivalent channels (N) in a system can be
calculated based on the system capacity and the typical rate of the service.
The traffic volume (A ) is a normalized value for the required service duration in a specified period.
Example of a packet delay blocking table
Relationship Among the Packet Delay Blocking Probability (Bd; Unit: %), Number of Channels (N ), and Traffic Volume (A)
N/Bd 0.01 0.05 0.1 0.5 1 2
…
3 0.0034 0.0035 0.0036 0.0043 0.0047 0.0102
4 0.0038 0.0036 0.0039 0.0053 0.0091 0.0249
5 0.0041 0.0046 0.0048 0.0096 0.0178 0.0471
6 0.0069 0.0072 0.0076 0.0111 0.0238 0.1434
…
InputTraffic model (Poisson or power-law)
Provide two of the following three
parameter values:
• Traffic volume
• Experience blocking ratio
• Number of channels
Output
Get the other one of the
following three parameter values:
• Traffic volume
• Experience blocking ratio
• Number of channels
EB table SDK
EB table SDK
Hard blocking
Soft blocking
Packet blocking
Poisson
Power-law
Traffic Blocking Theory Analysis and Typical Results
11 White Paper for the Traffic Blocking Theory for Data Services
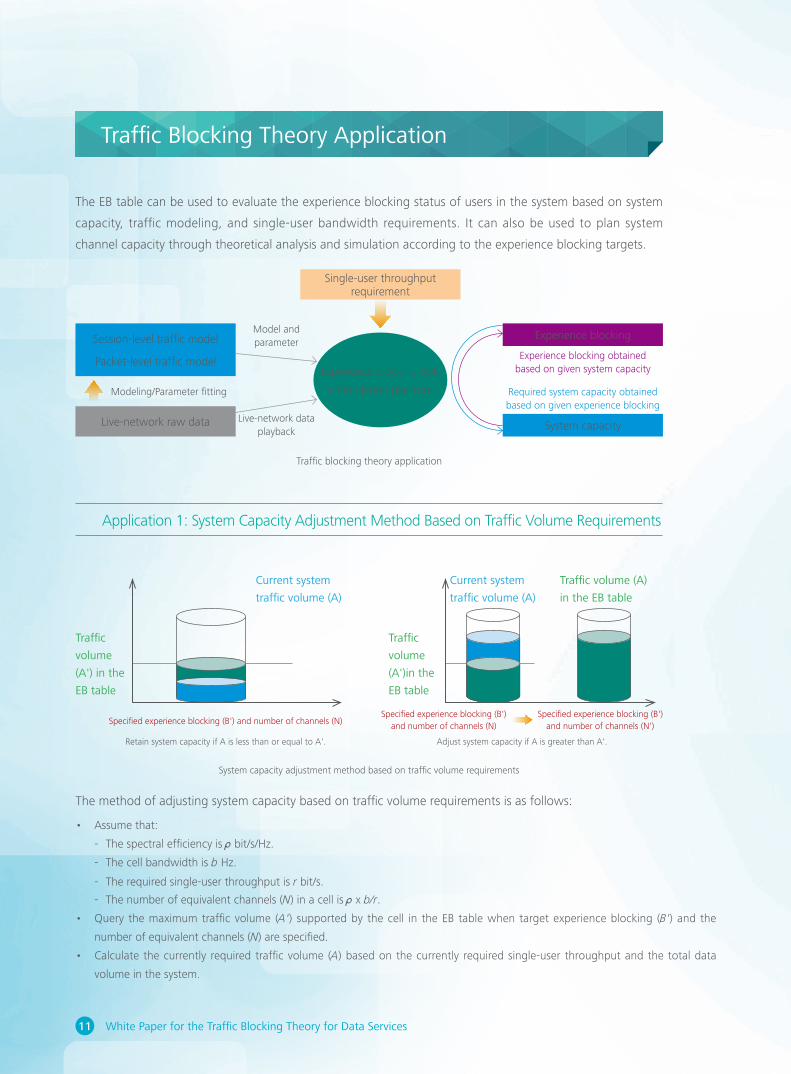
Application 1: System Capacity Adjustment Method Based on Traffic Volume Requirements
The method of adjusting system capacity based on traffic volume requirements is as follows:
• Assume that:
- The spectral efficiency isρbit/s/Hz.
- The cell bandwidth is b Hz.
- The required single-user throughput is r bit/s.
- The number of equivalent channels (N) in a cell isρx b/r .
• Query the maximum traffic volume (A' ) supported by the cell in the EB table when target experience blocking (B' ) and the
number of equivalent channels (N ) are specified.
• Calculate the currently required traffic volume (A ) based on the currently required single-user throughput and the total data
volume in the system.
System capacity adjustment method based on traffic volume requirements
Retain system capacity if A is less than or equal to A'. Adjust system capacity if A is greater than A'.
Specified experience blocking (B') and number of channels (N)
Traffic
volume
(A') in the
EB table
Current system
traffic volume (A)
Traffic
volume
(A')in the
EB table
Current system
traffic volume (A)
Traffic volume (A)
in the EB table
Specified experience blocking (B') and number of channels (N)
Specified experience blocking (B') and number of channels (N')
Traffic Blocking Theory Application
The EB table can be used to evaluate the experience blocking status of users in the system based on system
capacity, traffic modeling, and single-user bandwidth requirements. It can also be used to plan system
channel capacity through theoretical analysis and simulation according to the experience blocking targets.
Traffic blocking theory application
Single-user throughput requirement
Experience blocking SDK
+ Simulation platform
Live-network raw data
Session-level traffic model
Packet-level traffic model
Modeling/Parameter fitting
Model and parameter
Live-network data playback System capacity
Experience blocking
Experience blocking obtained based on given system capacity
Required system capacity obtainedbased on given experience blocking
12White Paper for the Traffic Blocking Theory for Data Services
Traffic Blocking Theory Application
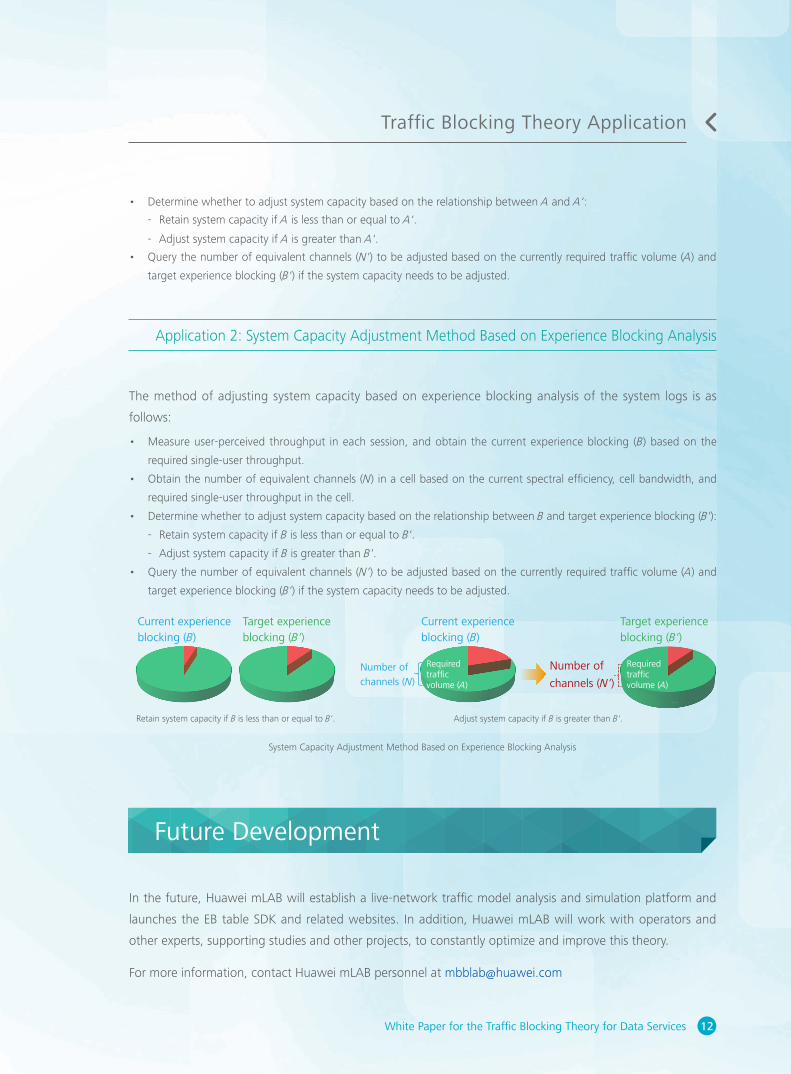
Application 2: System Capacity Adjustment Method Based on Experience Blocking Analysis
In the future, Huawei mLAB will establish a live-network traffic model analysis and simulation platform and
launches the EB table SDK and related websites. In addition, Huawei mLAB will work with operators and
other experts, supporting studies and other projects, to constantly optimize and improve this theory.
For more information, contact Huawei mLAB personnel at [email protected]
Future Development
• Determine whether to adjust system capacity based on the relationship between A and A' :
- Retain system capacity if A is less than or equal to A' .
- Adjust system capacity if A is greater than A' .
• Query the number of equivalent channels (N' ) to be adjusted based on the currently required traffic volume (A) and
target experience blocking (B' ) if the system capacity needs to be adjusted.
The method of adjusting system capacity based on experience blocking analysis of the system logs is as
follows:
• Measure user-perceived throughput in each session, and obtain the current experience blocking (B) based on the
required single-user throughput.
• Obtain the number of equivalent channels (N ) in a cell based on the current spectral efficiency, cell bandwidth, and
required single-user throughput in the cell.
• Determine whether to adjust system capacity based on the relationship between B and target experience blocking (B' ):
- Retain system capacity if B is less than or equal to B' .
- Adjust system capacity if B is greater than B' .
• Query the number of equivalent channels (N' ) to be adjusted based on the currently required traffic volume (A) and
target experience blocking (B' ) if the system capacity needs to be adjusted.
System Capacity Adjustment Method Based on Experience Blocking Analysis
Retain system capacity if B is less than or equal to B' . Adjust system capacity if B is greater than B' .
Current experience blocking (B)
Target experience blocking (B' )
Current experience blocking (B)
Number of channels (N)
Required traffic volume (A)
Target experience blocking (B' )
Number of
channels (N')
Required traffic volume (A)

X Labs is a brand-new platform designed to get together telecom operators, technical vendors and partners from vertical
sectors to explore future mobile application scenarios, drive business and technical innovations and build an open ecosystem.
X Labs have set up three laboratories, which aim to explore three major areas: people-to-people
connectivity, applications for vertical sectors and applications in household.
WirelessLabs
Copyright © Huawei Technologies Co., Ltd. 2017. All rights reserved.
No part of this document may be reproduced or transmitted in any form or by any means without prior written consent of Huawei Technologies Co., Ltd.
General Disclaimer
The information in this document may contain predictive statements including,
without limitation, statements regarding the future financial and operating results,
future product portfolio, new technology, etc. There are a number of factors
that could cause actual results and developments to differ materially from those
expressed or implied in the predictive statements. Therefore, such information
is provided for reference purpose only and constitutes neither an offer nor an
acceptance. Huawei may change the information at any time without notice.
Trademark Notice
, HUAWEI, and are trademarks or registered trademarks of Huawei Technologies Co., Ltd.
Other trademarks, product, service and company names mentioned are the property of their respective owners.
HUAWEI TECHNOLOGIES CO., LTD.
Huawei Industrial Base
Bantian Longgang
Shenzhen 518129, P.R. China
Tel: +86-755-28780808
Version No.: M3-042753-20170313-C-1.0
www.huawei.com