Embed Size (px)
Citation preview
8/2/2019 Traffic Baseline Conditions
http://slidepdf.com/reader/full/traffic-baseline-conditions 1/34
1 Traffic Baseline Conditions
Highway Network
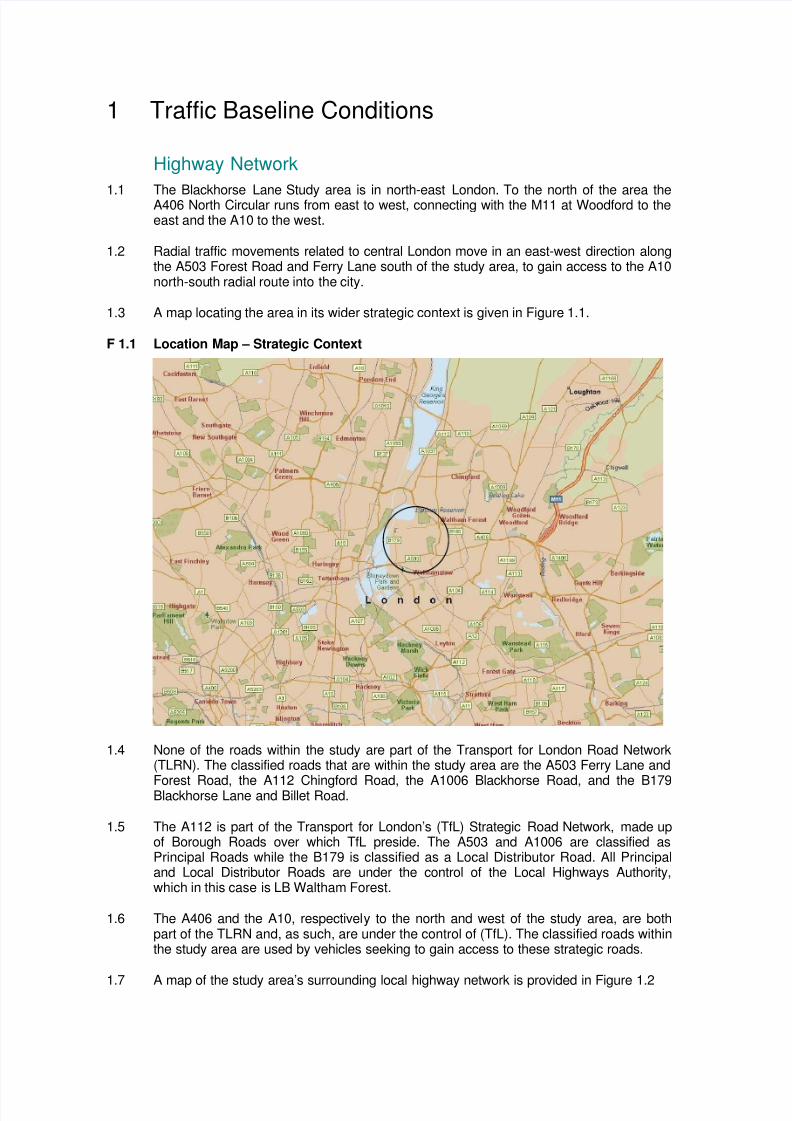
1.1 The Blackhorse Lane Study area is in north-east London. To the north of the area theA406 North Circular runs from east to west, connecting with the M11 at Woodford to theeast and the A10 to the west.
1.2 Radial traffic movements related to central London move in an east-west direction alongthe A503 Forest Road and Ferry Lane south of the study area, to gain access to the A10north-south radial route into the city.
1.3 A map locating the area in its wider strategic context is given in Figure 1.1.
F 1.1 Location Map – Strategic Context
1.4 None of the roads within the study are part of the Transport for London Road Network(TLRN). The classified roads that are within the study area are the A503 Ferry Lane and
Forest Road, the A112 Chingford Road, the A1006 Blackhorse Road, and the B179Blackhorse Lane and Billet Road.
1.5 The A112 is part of the Transport for London’s (TfL) Strategic Road Network, made upof Borough Roads over which TfL preside. The A503 and A1006 are classified asPrincipal Roads while the B179 is classified as a Local Distributor Road. All Principaland Local Distributor Roads are under the control of the Local Highways Authority,which in this case is LB Waltham Forest.
1.6 The A406 and the A10, respectively to the north and west of the study area, are bothpart of the TLRN and, as such, are under the control of (TfL). The classified roads withinthe study area are used by vehicles seeking to gain access to these strategic roads.
1.7 A map of the study area’s surrounding local highway network is provided in Figure 1.2
8/2/2019 Traffic Baseline Conditions
http://slidepdf.com/reader/full/traffic-baseline-conditions 2/34
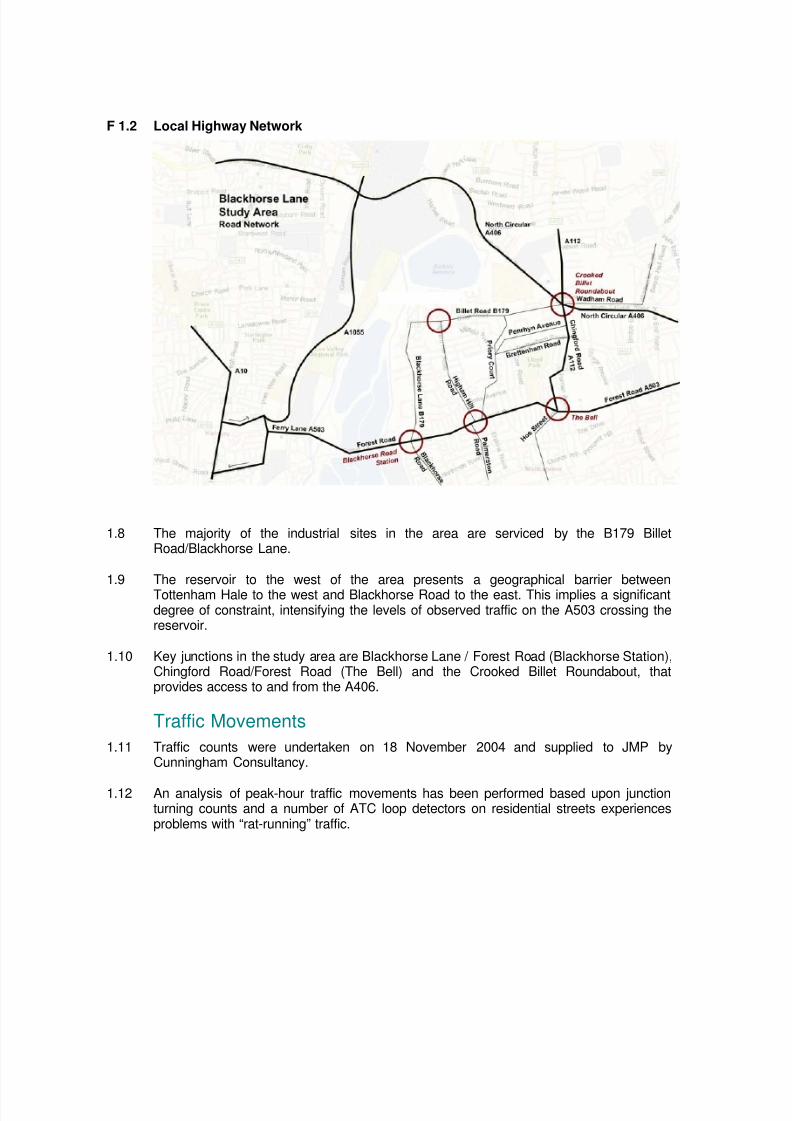
F 1.2 Local Highway Network
1.8 The majority of the industrial sites in the area are serviced by the B179 BilletRoad/Blackhorse Lane.
1.9 The reservoir to the west of the area presents a geographical barrier betweenTottenham Hale to the west and Blackhorse Road to the east. This implies a significantdegree of constraint, intensifying the levels of observed traffic on the A503 crossing thereservoir.
1.10 Key junctions in the study area are Blackhorse Lane / Forest Road (Blackhorse Station),Chingford Road/Forest Road (The Bell) and the Crooked Billet Roundabout, thatprovides access to and from the A406.
Traffic Movements
1.11 Traffic counts were undertaken on 18 November 2004 and supplied to JMP byCunningham Consultancy.
1.12 An analysis of peak-hour traffic movements has been performed based upon junctionturning counts and a number of ATC loop detectors on residential streets experiencesproblems with “rat-running” traffic.
8/2/2019 Traffic Baseline Conditions
http://slidepdf.com/reader/full/traffic-baseline-conditions 3/34
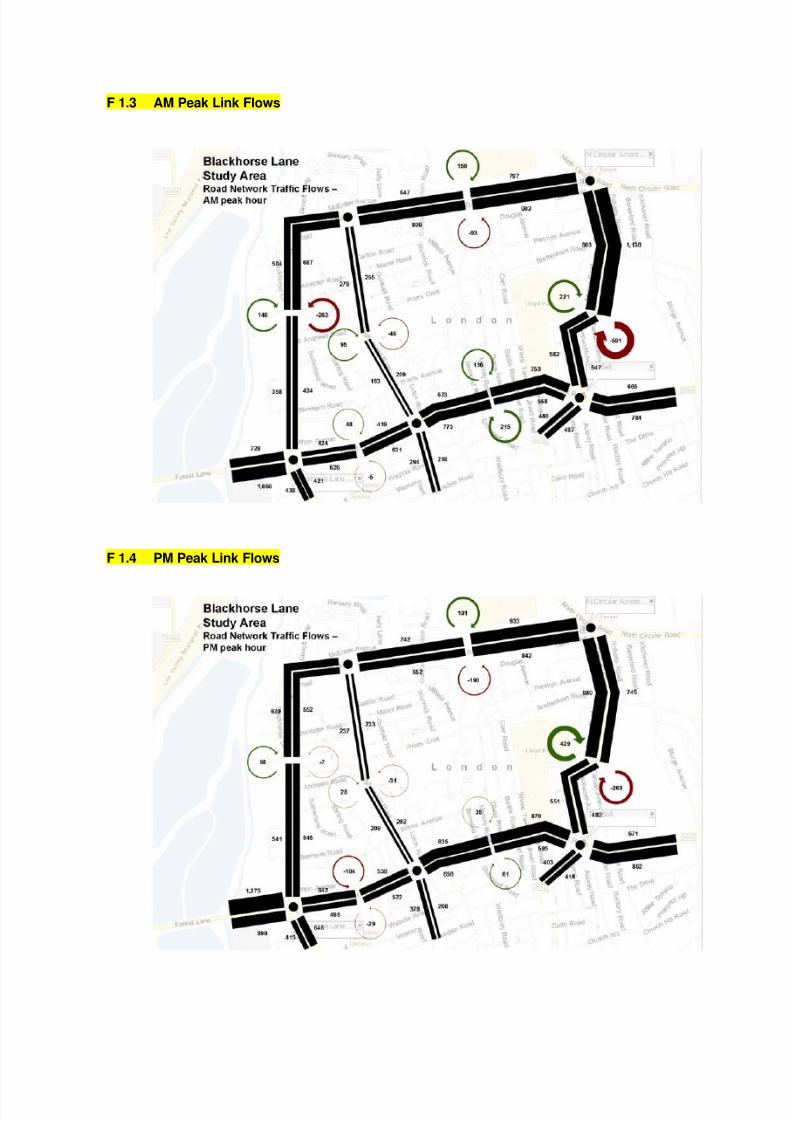
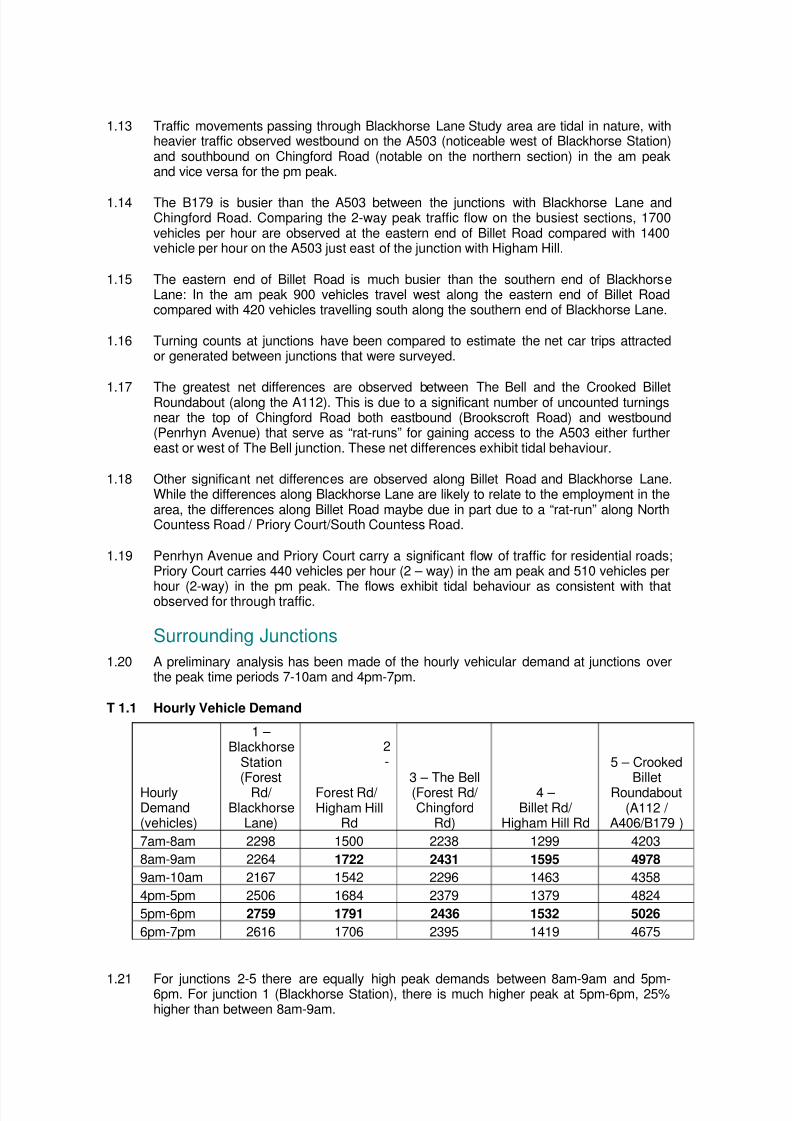
F 1.3 AM Peak Link Flows
F 1.4 PM Peak Link Flows
8/2/2019 Traffic Baseline Conditions
http://slidepdf.com/reader/full/traffic-baseline-conditions 4/34
1.13 Traffic movements passing through Blackhorse Lane Study area are tidal in nature, withheavier traffic observed westbound on the A503 (noticeable west of Blackhorse Station)and southbound on Chingford Road (notable on the northern section) in the am peakand vice versa for the pm peak.
1.14 The B179 is busier than the A503 between the junctions with Blackhorse Lane andChingford Road. Comparing the 2-way peak traffic flow on the busiest sections, 1700vehicles per hour are observed at the eastern end of Billet Road compared with 1400vehicle per hour on the A503 just east of the junction with Higham Hill.
1.15 The eastern end of Billet Road is much busier than the southern end of BlackhorseLane: In the am peak 900 vehicles travel west along the eastern end of Billet Roadcompared with 420 vehicles travelling south along the southern end of Blackhorse Lane.
1.16 Turning counts at junctions have been compared to estimate the net car trips attractedor generated between junctions that were surveyed.
1.17 The greatest net differences are observed between The Bell and the Crooked BilletRoundabout (along the A112). This is due to a significant number of uncounted turningsnear the top of Chingford Road both eastbound (Brookscroft Road) and westbound(Penrhyn Avenue) that serve as “rat-runs” for gaining access to the A503 either furthereast or west of The Bell junction. These net differences exhibit tidal behaviour.
1.18 Other significant net differences are observed along Billet Road and Blackhorse Lane.While the differences along Blackhorse Lane are likely to relate to the employment in thearea, the differences along Billet Road maybe due in part due to a “rat-run” along NorthCountess Road / Priory Court/South Countess Road.
1.19 Penrhyn Avenue and Priory Court carry a significant flow of traffic for residential roads;Priory Court carries 440 vehicles per hour (2 – way) in the am peak and 510 vehicles per
hour (2-way) in the pm peak. The flows exhibit tidal behaviour as consistent with thatobserved for through traffic.
Surrounding Junctions
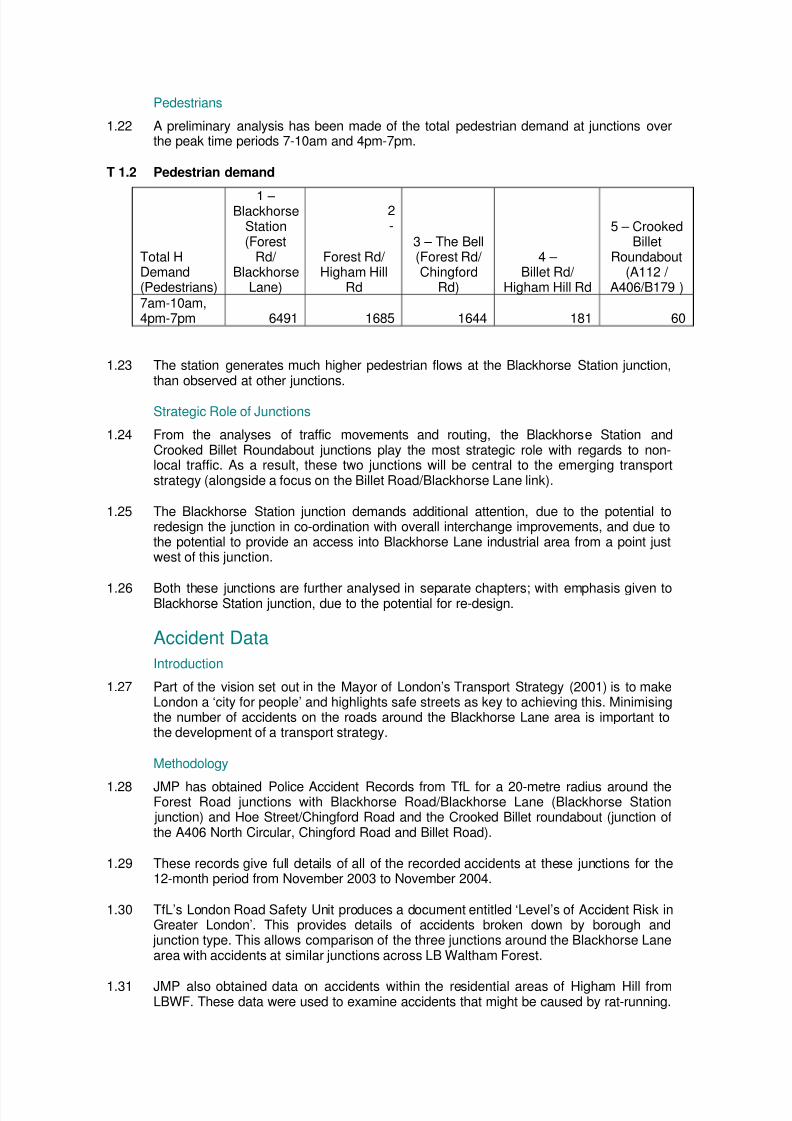
1.20 A preliminary analysis has been made of the hourly vehicular demand at junctions overthe peak time periods 7-10am and 4pm-7pm.
T 1.1 Hourly Vehicle Demand
HourlyDemand(vehicles)
1 – Blackhorse
Station(Forest
Rd/ Blackhorse
Lane)
2-
Forest Rd/ Higham Hill
Rd
3 – The Bell(Forest Rd/ Chingford
Rd)
4 – Billet Rd/
Higham Hill Rd
5 – CrookedBillet
Roundabout(A112 /
A406/B179 )
7am-8am 2298 1500 2238 1299 4203
8am-9am 2264 1722 2431 1595 4978
9am-10am 2167 1542 2296 1463 4358
4pm-5pm 2506 1684 2379 1379 4824
5pm-6pm 2759 1791 2436 1532 5026
6pm-7pm 2616 1706 2395 1419 4675
1.21 For junctions 2-5 there are equally high peak demands between 8am-9am and 5pm-6pm. For junction 1 (Blackhorse Station), there is much higher peak at 5pm-6pm, 25%higher than between 8am-9am.
8/2/2019 Traffic Baseline Conditions
http://slidepdf.com/reader/full/traffic-baseline-conditions 5/34
Pedestrians
1.22 A preliminary analysis has been made of the total pedestrian demand at junctions overthe peak time periods 7-10am and 4pm-7pm.
T 1.2 Pedestrian demand
Total HDemand(Pedestrians)
1 – Blackhorse
Station(Forest
Rd/ Blackhorse
Lane)
2-
Forest Rd/ Higham Hill
Rd
3 – The Bell(Forest Rd/ Chingford
Rd)
4 – Billet Rd/
Higham Hill Rd
5 – CrookedBillet
Roundabout(A112 /
A406/B179 )7am-10am,4pm-7pm 6491 1685 1644 181 60
1.23 The station generates much higher pedestrian flows at the Blackhorse Station junction,than observed at other junctions.
Strategic Role of Junctions
1.24 From the analyses of traffic movements and routing, the Blackhorse Station andCrooked Billet Roundabout junctions play the most strategic role with regards to non-local traffic. As a result, these two junctions will be central to the emerging transportstrategy (alongside a focus on the Billet Road/Blackhorse Lane link).
1.25 The Blackhorse Station junction demands additional attention, due to the potential toredesign the junction in co-ordination with overall interchange improvements, and due tothe potential to provide an access into Blackhorse Lane industrial area from a point justwest of this junction.
1.26 Both these junctions are further analysed in separate chapters; with emphasis given toBlackhorse Station junction, due to the potential for re-design.
Accident Data
Introduction
1.27 Part of the vision set out in the Mayor of London’s Transport Strategy (2001) is to makeLondon a ‘city for people’ and highlights safe streets as key to achieving this. Minimisingthe number of accidents on the roads around the Blackhorse Lane area is important tothe development of a transport strategy.
Methodology
1.28 JMP has obtained Police Accident Records from TfL for a 20-metre radius around theForest Road junctions with Blackhorse Road/Blackhorse Lane (Blackhorse Station junction) and Hoe Street/Chingford Road and the Crooked Billet roundabout (junction ofthe A406 North Circular, Chingford Road and Billet Road).
1.29 These records give full details of all of the recorded accidents at these junctions for the12-month period from November 2003 to November 2004.
1.30 TfL’s London Road Safety Unit produces a document entitled ‘Level’s of Accident Risk inGreater London’. This provides details of accidents broken down by borough and junction type. This allows comparison of the three junctions around the Blackhorse Lanearea with accidents at similar junctions across LB Waltham Forest.
1.31 JMP also obtained data on accidents within the residential areas of Higham Hill fromLBWF. These data were used to examine accidents that might be caused by rat-running.
8/2/2019 Traffic Baseline Conditions
http://slidepdf.com/reader/full/traffic-baseline-conditions 6/34
Automatic Traffic Signal Junctions
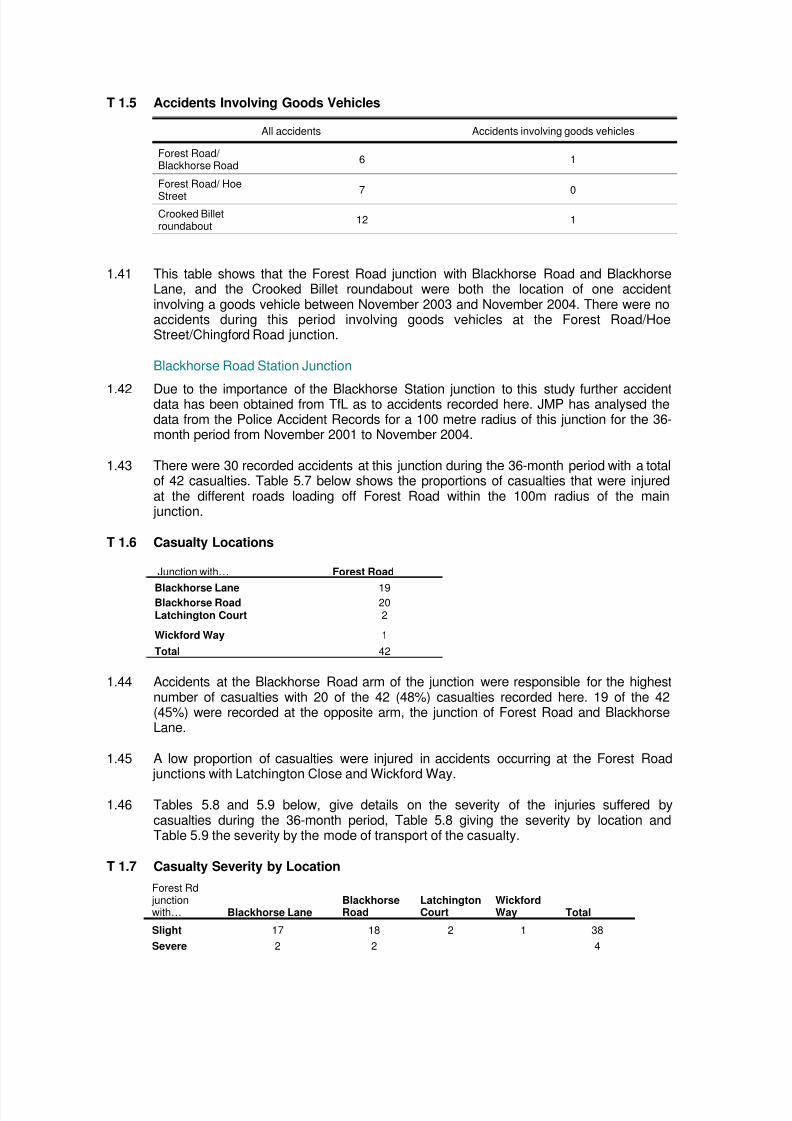
1.32 The Forest Road junctions with Blackhorse Road/Blackhorse Lane and HoeStreet/Chingford Road are both Automatic Traffic Signal (ATS) junctions. Table 5.4below shows details of the accidents at these two junctions compared with the averagenumber of accidents at all ATS junctions within LB Waltham Forest.
T 1.3 Comparison of Accidents at ATS Junctions
All accidents Fatal and serious accidents Non-pedestrian Pedestrian
Blackhorse Station 6 1 4 2
Forest Road/ HoeStreet
7 2 6 1
Waltham Forest 2.17 0.27 1.7 0.47
1.33 The table shows that in a 12-month period the average number of accidents expected atan ATS junction in LB Waltham Forest is 2.17, with 0.27 fatal or serious injuries and 1.7
non-pedestrian accidents.
1.34 From November 2003 to November 2004 there were a total of 6 accidents at theBlackhorse Station junction, one of which resulted in serious or fatal injury. Four of thesix accidents were non-pedestrian.
1.35 This junction experiences almost three times the average number of accidents for anATS junction in Waltham Forest and almost four times the average number of accidentsresulting in fatal or serious injury.
1.36 There was more than four times the number of pedestrian accidents at this junction thanthe Waltham Forest average.
1.37 There was an even higher than average incidence of accidents at the Forest Road junction with Hoe Street and Chingford Road with a total of 7 accidents, 2 of whichresulted in fatal or serious injuries. This is over 3 times the average number of accidentsand over 7 times the number of fatal or serious accidents.
Roundabouts
1.38 Table 5.5 below shows details of the accidents at the Crooked Billet Roundaboutcompared with the average number of accidents at roundabouts (excluding mini-roundabouts) in LB Waltham Forest.
T 1.4 Accident data comparison for roundabouts.
All accidents Fatal and serious accidents Non-pedestrian
Crooked Billetroundabout
12 0 12
Waltham Forest 3.77 0.57 3.57
1.39 This table shows that during the 12-month period from November 2003 to November2004 there was more than three times the Waltham Forest average number of accidentsat the Crooked Billet roundabout. However, none of these resulted in fatal or seriousinjuries and none involved pedestrians.
Accidents Involving Goods Vehicles
1.40 Table 5.6 below shows the number and location of all accidents involving goods vehiclesat the three junctions.
8/2/2019 Traffic Baseline Conditions
http://slidepdf.com/reader/full/traffic-baseline-conditions 7/34
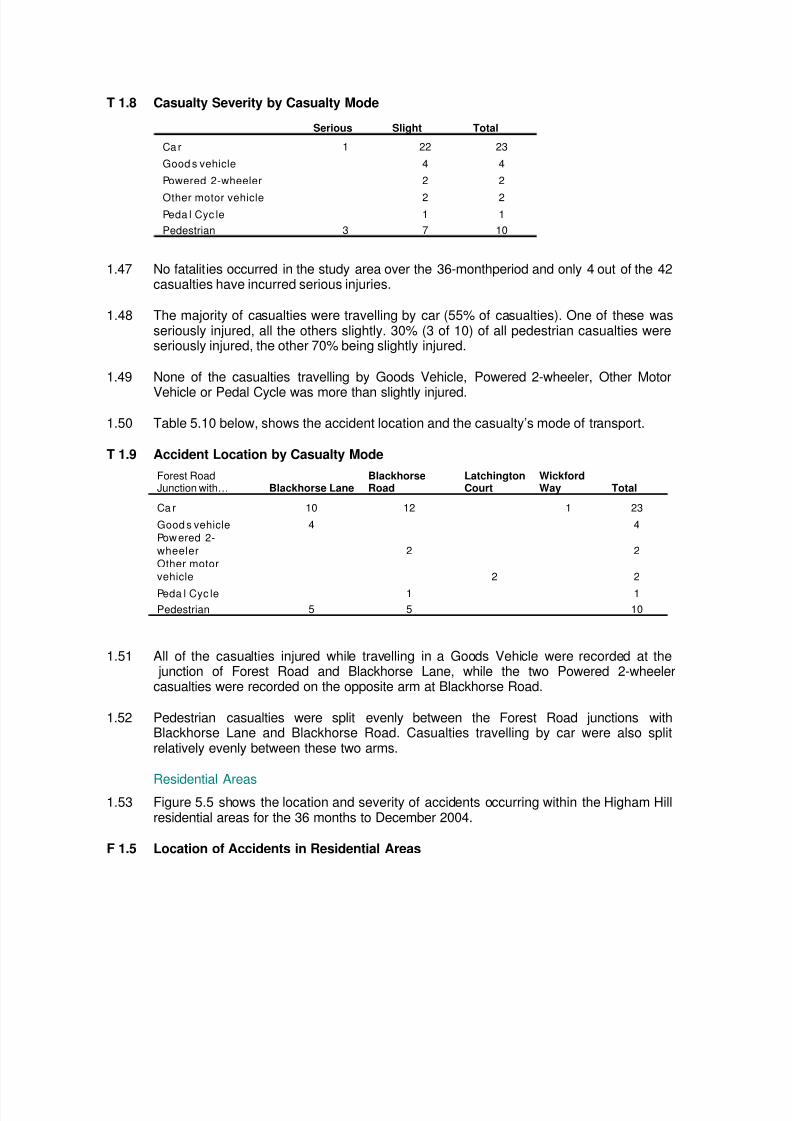
T 1.5 Accidents Involving Goods Vehicles
All accidents Accidents involving goods vehicles
Forest Road/ Blackhorse Road
6 1
Forest Road/ Hoe
Street7 0
Crooked Billetroundabout
12 1
1.41 This table shows that the Forest Road junction with Blackhorse Road and BlackhorseLane, and the Crooked Billet roundabout were both the location of one accidentinvolving a goods vehicle between November 2003 and November 2004. There were noaccidents during this period involving goods vehicles at the Forest Road/HoeStreet/Chingford Road junction.
Blackhorse Road Station Junction
1.42 Due to the importance of the Blackhorse Station junction to this study further accidentdata has been obtained from TfL as to accidents recorded here. JMP has analysed thedata from the Police Accident Records for a 100 metre radius of this junction for the 36-month period from November 2001 to November 2004.
1.43 There were 30 recorded accidents at this junction during the 36-month period with a totalof 42 casualties. Table 5.7 below shows the proportions of casualties that were injuredat the different roads loading off Forest Road within the 100m radius of the main junction.
T 1.6 Casualty Locations
Junction with… Forest Road
Blackhorse Lane 19Blackhorse Road 20Latchington Court 2
Wickford Way 1
Total 42
1.44 Accidents at the Blackhorse Road arm of the junction were responsible for the highestnumber of casualties with 20 of the 42 (48%) casualties recorded here. 19 of the 42(45%) were recorded at the opposite arm, the junction of Forest Road and BlackhorseLane.
1.45 A low proportion of casualties were injured in accidents occurring at the Forest Road junctions with Latchington Close and Wickford Way.
1.46 Tables 5.8 and 5.9 below, give details on the severity of the injuries suffered bycasualties during the 36-month period, Table 5.8 giving the severity by location andTable 5.9 the severity by the mode of transport of the casualty.
T 1.7 Casualty Severity by Location
Forest Rd junctionwith… Blackhorse Lane
BlackhorseRoad
LatchingtonCourt
WickfordWay Total
Slight 17 18 2 1 38
Severe 2 2 4
8/2/2019 Traffic Baseline Conditions
http://slidepdf.com/reader/full/traffic-baseline-conditions 8/34
T 1.8 Casualty Severity by Casualty Mode
Serious Slight Total
Ca r 1 22 23
Good s vehicle 4 4
Powered 2-wheeler 2 2
Other motor vehicle 2 2
Peda l Cyc le 1 1
Pedestrian 3 7 10
1.47 No fatalities occurred in the study area over the 36-monthperiod and only 4 out of the 42casualties have incurred serious injuries.
1.48 The majority of casualties were travelling by car (55% of casualties). One of these wasseriously injured, all the others slightly. 30% (3 of 10) of all pedestrian casualties wereseriously injured, the other 70% being slightly injured.
1.49 None of the casualties travelling by Goods Vehicle, Powered 2-wheeler, Other Motor
Vehicle or Pedal Cycle was more than slightly injured.
1.50 Table 5.10 below, shows the accident location and the casualty’s mode of transport.
T 1.9 Accident Location by Casualty Mode
Forest RoadJunction with… Blackhorse Lane
BlackhorseRoad
LatchingtonCourt
WickfordWay Total
Ca r 10 12 1 23
Good s vehicle 4 4
Powered 2-
wheeler 2 2
Other motor
vehicle 2 2
Peda l Cyc le 1 1
Pedestrian 5 5 10
1.51 All of the casualties injured while travelling in a Goods Vehicle were recorded at the junction of Forest Road and Blackhorse Lane, while the two Powered 2-wheelercasualties were recorded on the opposite arm at Blackhorse Road.
1.52 Pedestrian casualties were split evenly between the Forest Road junctions withBlackhorse Lane and Blackhorse Road. Casualties travelling by car were also splitrelatively evenly between these two arms.
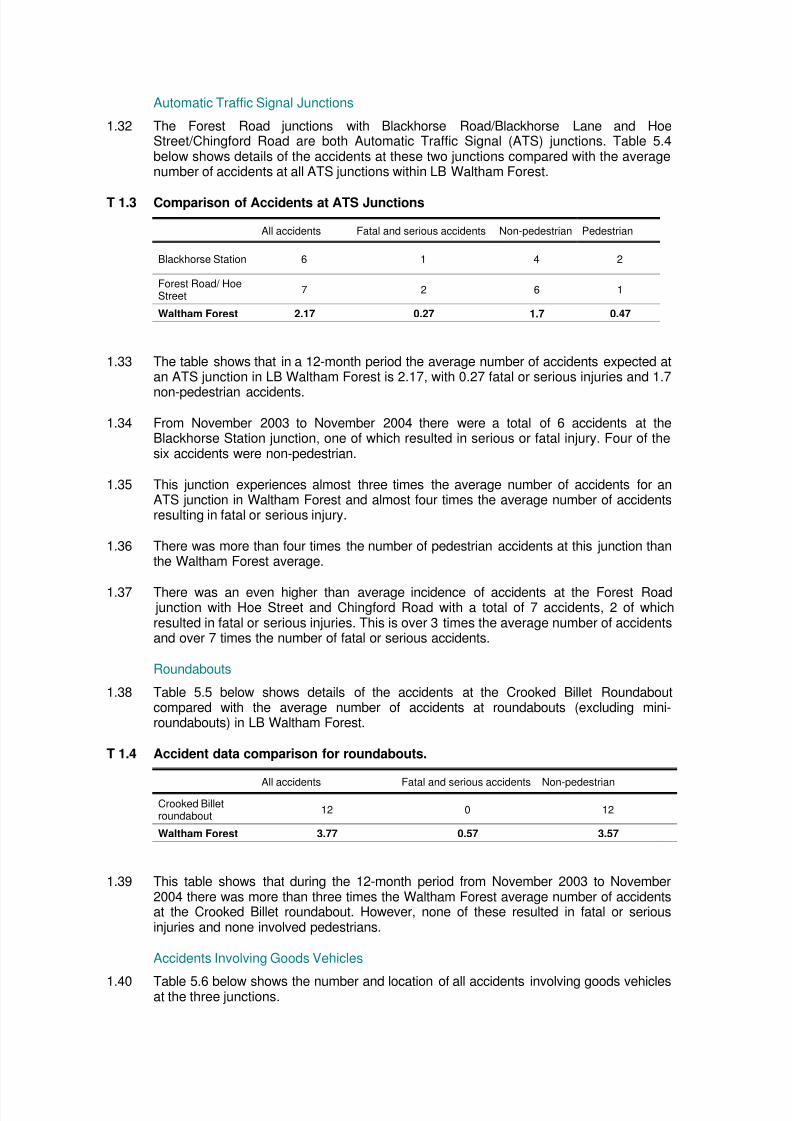
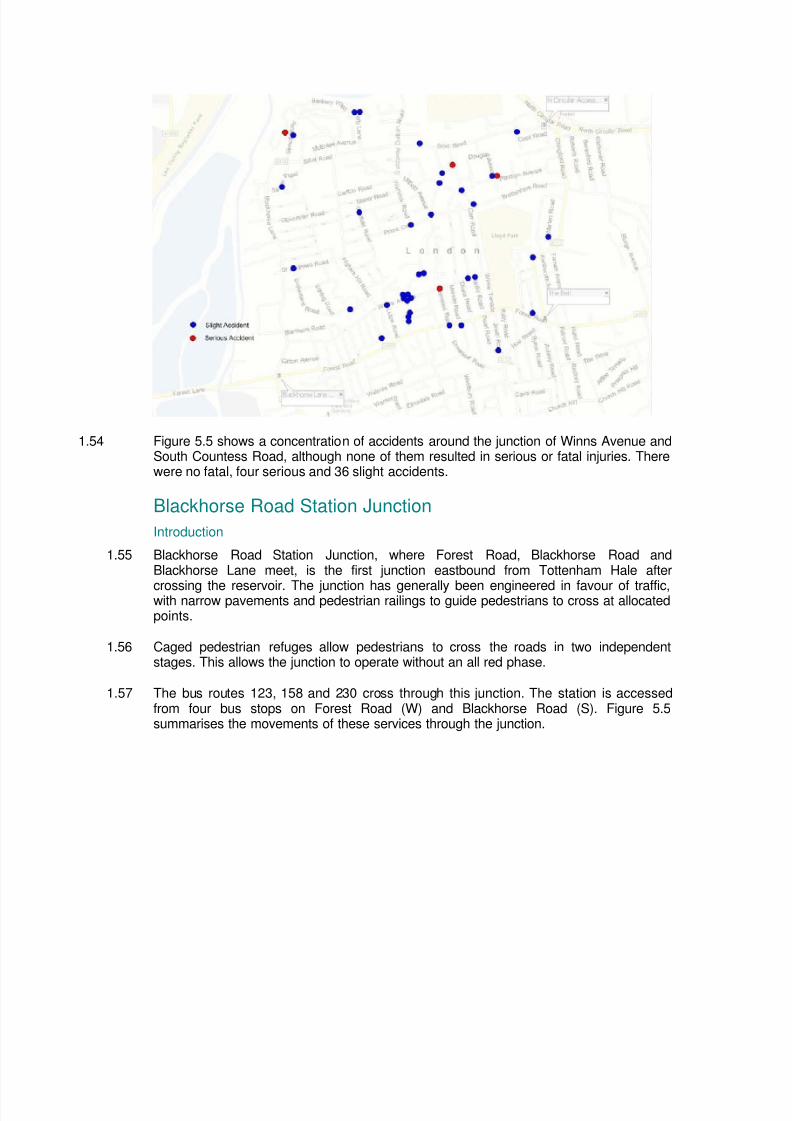
Residential Areas1.53 Figure 5.5 shows the location and severity of accidents occurring within the Higham Hill
residential areas for the 36 months to December 2004.
F 1.5 Location of Accidents in Residential Areas
8/2/2019 Traffic Baseline Conditions
http://slidepdf.com/reader/full/traffic-baseline-conditions 9/34
1.54 Figure 5.5 shows a concentration of accidents around the junction of Winns Avenue andSouth Countess Road, although none of them resulted in serious or fatal injuries. Therewere no fatal, four serious and 36 slight accidents.
Blackhorse Road Station Junction
Introduction
1.55 Blackhorse Road Station Junction, where Forest Road, Blackhorse Road andBlackhorse Lane meet, is the first junction eastbound from Tottenham Hale after
crossing the reservoir. The junction has generally been engineered in favour of traffic,with narrow pavements and pedestrian railings to guide pedestrians to cross at allocatedpoints.
1.56 Caged pedestrian refuges allow pedestrians to cross the roads in two independentstages. This allows the junction to operate without an all red phase.
1.57 The bus routes 123, 158 and 230 cross through this junction. The station is accessedfrom four bus stops on Forest Road (W) and Blackhorse Road (S). Figure 5.5summarises the movements of these services through the junction.
8/2/2019 Traffic Baseline Conditions
http://slidepdf.com/reader/full/traffic-baseline-conditions 10/34
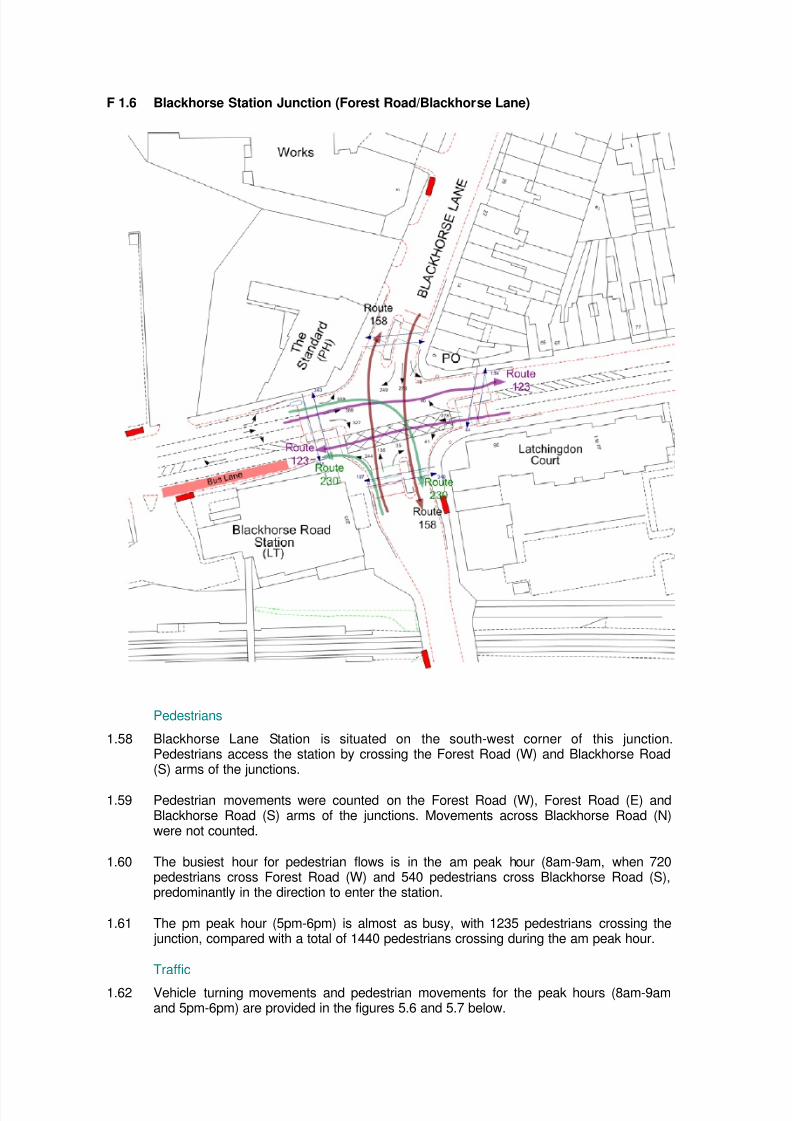
F 1.6 Blackhorse Station Junction (Forest Road/Blackhorse Lane)
Pedestrians
1.58 Blackhorse Lane Station is situated on the south-west corner of this junction.Pedestrians access the station by crossing the Forest Road (W) and Blackhorse Road(S) arms of the junctions.
1.59 Pedestrian movements were counted on the Forest Road (W), Forest Road (E) andBlackhorse Road (S) arms of the junctions. Movements across Blackhorse Road (N)were not counted.
1.60 The busiest hour for pedestrian flows is in the am peak hour (8am-9am, when 720pedestrians cross Forest Road (W) and 540 pedestrians cross Blackhorse Road (S),predominantly in the direction to enter the station.
1.61 The pm peak hour (5pm-6pm) is almost as busy, with 1235 pedestrians crossing the junction, compared with a total of 1440 pedestrians crossing during the am peak hour.
Traffic
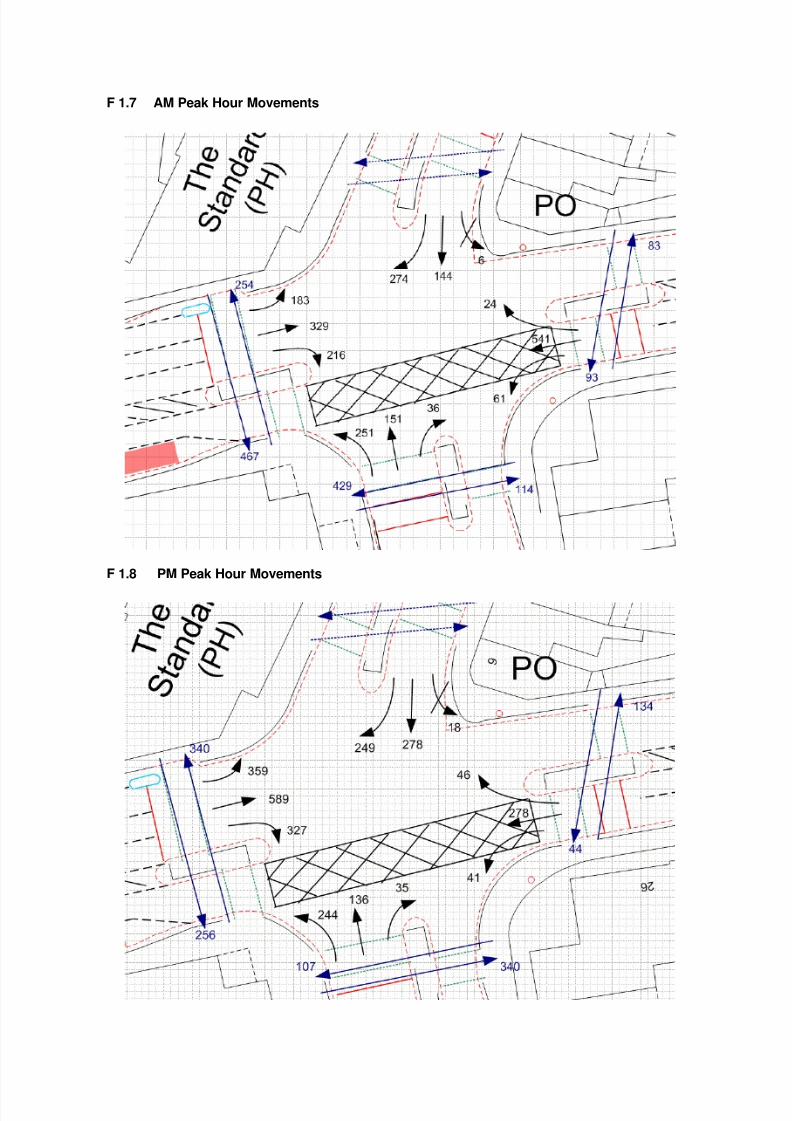
1.62 Vehicle turning movements and pedestrian movements for the peak hours (8am-9amand 5pm-6pm) are provided in the figures 5.6 and 5.7 below.
8/2/2019 Traffic Baseline Conditions
http://slidepdf.com/reader/full/traffic-baseline-conditions 11/34
F 1.7 AM Peak Hour Movements
F 1.8 PM Peak Hour Movements
8/2/2019 Traffic Baseline Conditions
http://slidepdf.com/reader/full/traffic-baseline-conditions 12/34
1.63 In addition to large tidal movements east-west along Forest Road, there are alsosignificant tidal movements between Forest Road (W) and Blackhorse Lane (N) andBlackhorse Road (S). There is much less activity between Forest Road (E) andBlackhorse Lane (N) / Blackhorse Road (S).
Method of Control
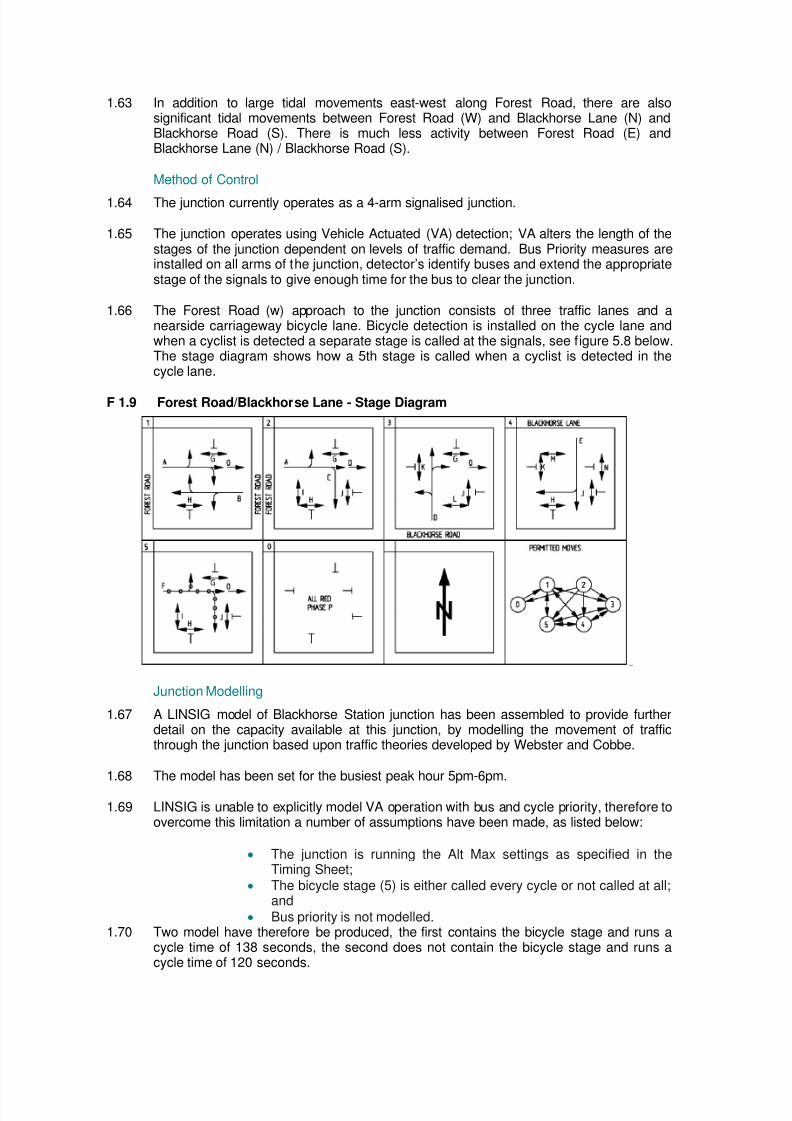
1.64 The junction currently operates as a 4-arm signalised junction.
1.65 The junction operates using Vehicle Actuated (VA) detection; VA alters the length of thestages of the junction dependent on levels of traffic demand. Bus Priority measures areinstalled on all arms of the junction, detector’s identify buses and extend the appropriatestage of the signals to give enough time for the bus to clear the junction.
1.66 The Forest Road (w) approach to the junction consists of three traffic lanes and anearside carriageway bicycle lane. Bicycle detection is installed on the cycle lane andwhen a cyclist is detected a separate stage is called at the signals, see figure 5.8 below.The stage diagram shows how a 5th stage is called when a cyclist is detected in thecycle lane.
F 1.9 Forest Road/Blackhorse Lane - Stage Diagram
Junction Modelling
1.67 A LINSIG model of Blackhorse Station junction has been assembled to provide furtherdetail on the capacity available at this junction, by modelling the movement of trafficthrough the junction based upon traffic theories developed by Webster and Cobbe.
1.68 The model has been set for the busiest peak hour 5pm-6pm.
1.69 LINSIG is unable to explicitly model VA operation with bus and cycle priority, therefore toovercome this limitation a number of assumptions have been made, as listed below:
• The junction is running the Alt Max settings as specified in theTiming Sheet;
• The bicycle stage (5) is either called every cycle or not called at all;and
• Bus priority is not modelled.1.70 Two model have therefore be produced, the first contains the bicycle stage and runs a
cycle time of 138 seconds, the second does not contain the bicycle stage and runs acycle time of 120 seconds.
8/2/2019 Traffic Baseline Conditions
http://slidepdf.com/reader/full/traffic-baseline-conditions 13/34
Baseline Model Results
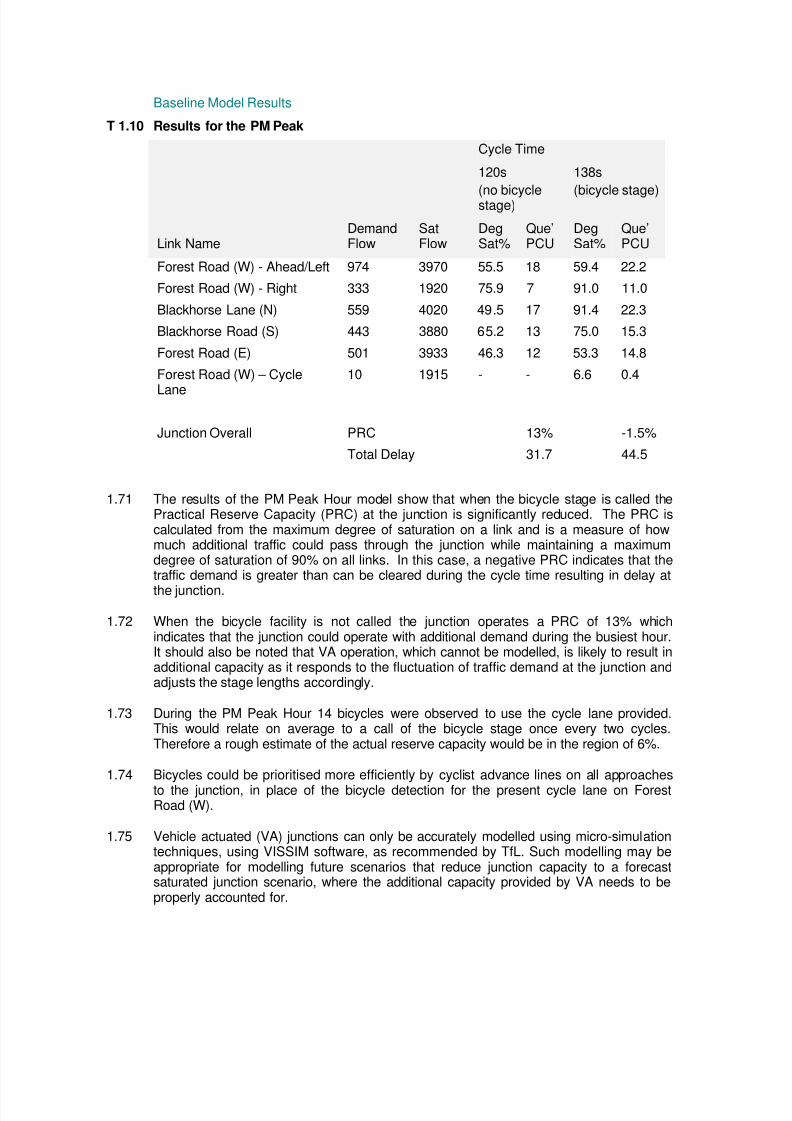
T 1.10 Results for the PM Peak
Cycle Time
120s
(no bicyclestage)
138s
(bicycle stage)
Link NameDemandFlow
SatFlow
DegSat%
Que’PCU
DegSat%
Que’PCU
Forest Road (W) - Ahead/Left 974 3970 55.5 18 59.4 22.2
Forest Road (W) - Right 333 1920 75.9 7 91.0 11.0
Blackhorse Lane (N) 559 4020 49.5 17 91.4 22.3
Blackhorse Road (S) 443 3880 65.2 13 75.0 15.3
Forest Road (E) 501 3933 46.3 12 53.3 14.8
Forest Road (W) – Cycle
Lane
10 1915 - - 6.6 0.4
PRC 13% -1.5%Junction Overall
Total Delay 31.7 44.5
1.71 The results of the PM Peak Hour model show that when the bicycle stage is called thePractical Reserve Capacity (PRC) at the junction is significantly reduced. The PRC iscalculated from the maximum degree of saturation on a link and is a measure of howmuch additional traffic could pass through the junction while maintaining a maximumdegree of saturation of 90% on all links. In this case, a negative PRC indicates that thetraffic demand is greater than can be cleared during the cycle time resulting in delay at
the junction.
1.72 When the bicycle facility is not called the junction operates a PRC of 13% whichindicates that the junction could operate with additional demand during the busiest hour.It should also be noted that VA operation, which cannot be modelled, is likely to result inadditional capacity as it responds to the fluctuation of traffic demand at the junction andadjusts the stage lengths accordingly.
1.73 During the PM Peak Hour 14 bicycles were observed to use the cycle lane provided.This would relate on average to a call of the bicycle stage once every two cycles.Therefore a rough estimate of the actual reserve capacity would be in the region of 6%.
1.74 Bicycles could be prioritised more efficiently by cyclist advance lines on all approaches
to the junction, in place of the bicycle detection for the present cycle lane on ForestRoad (W).
1.75 Vehicle actuated (VA) junctions can only be accurately modelled using micro-simulationtechniques, using VISSIM software, as recommended by TfL. Such modelling may beappropriate for modelling future scenarios that reduce junction capacity to a forecastsaturated junction scenario, where the additional capacity provided by VA needs to beproperly accounted for.
8/2/2019 Traffic Baseline Conditions
http://slidepdf.com/reader/full/traffic-baseline-conditions 14/34
Crooked Billet Roundabout
Introduction
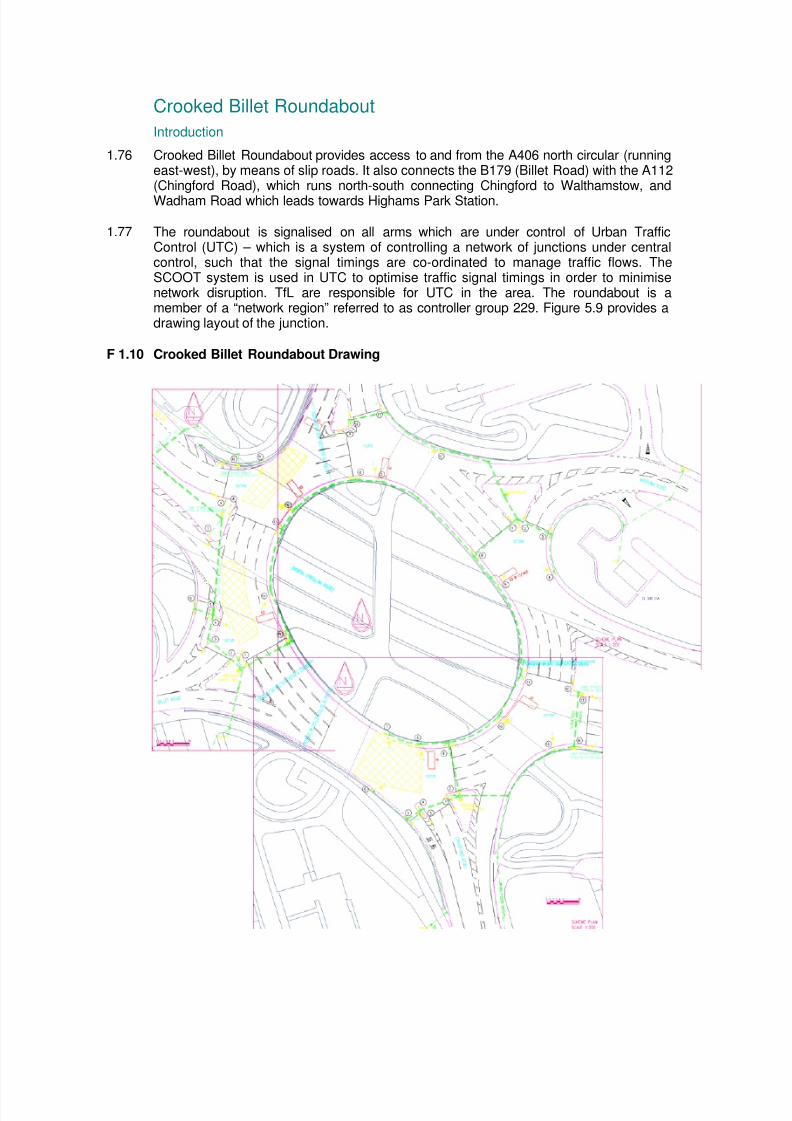
1.76 Crooked Billet Roundabout provides access to and from the A406 north circular (runningeast-west), by means of slip roads. It also connects the B179 (Billet Road) with the A112(Chingford Road), which runs north-south connecting Chingford to Walthamstow, and
Wadham Road which leads towards Highams Park Station.
1.77 The roundabout is signalised on all arms which are under control of Urban TrafficControl (UTC) – which is a system of controlling a network of junctions under centralcontrol, such that the signal timings are co-ordinated to manage traffic flows. TheSCOOT system is used in UTC to optimise traffic signal timings in order to minimisenetwork disruption. TfL are responsible for UTC in the area. The roundabout is amember of a “network region” referred to as controller group 229. Figure 5.9 provides adrawing layout of the junction.
F 1.10 Crooked Billet Roundabout Drawing
8/2/2019 Traffic Baseline Conditions
http://slidepdf.com/reader/full/traffic-baseline-conditions 15/34
2 Freight Movements and Access BaselineConditions
Introduction2.1 Freight is of importance to the study, due to
• Environmental concerns of “strategic” freight making use of theB179, that passes by residential homes and schools.
• Access issues to the industrial estates on Blackhorse Lane andBillet Road.
2.2 This section analyses freight movements through the area, and explores routing optionsfor freight access to the industrial zones in the study area.
Freight Movements
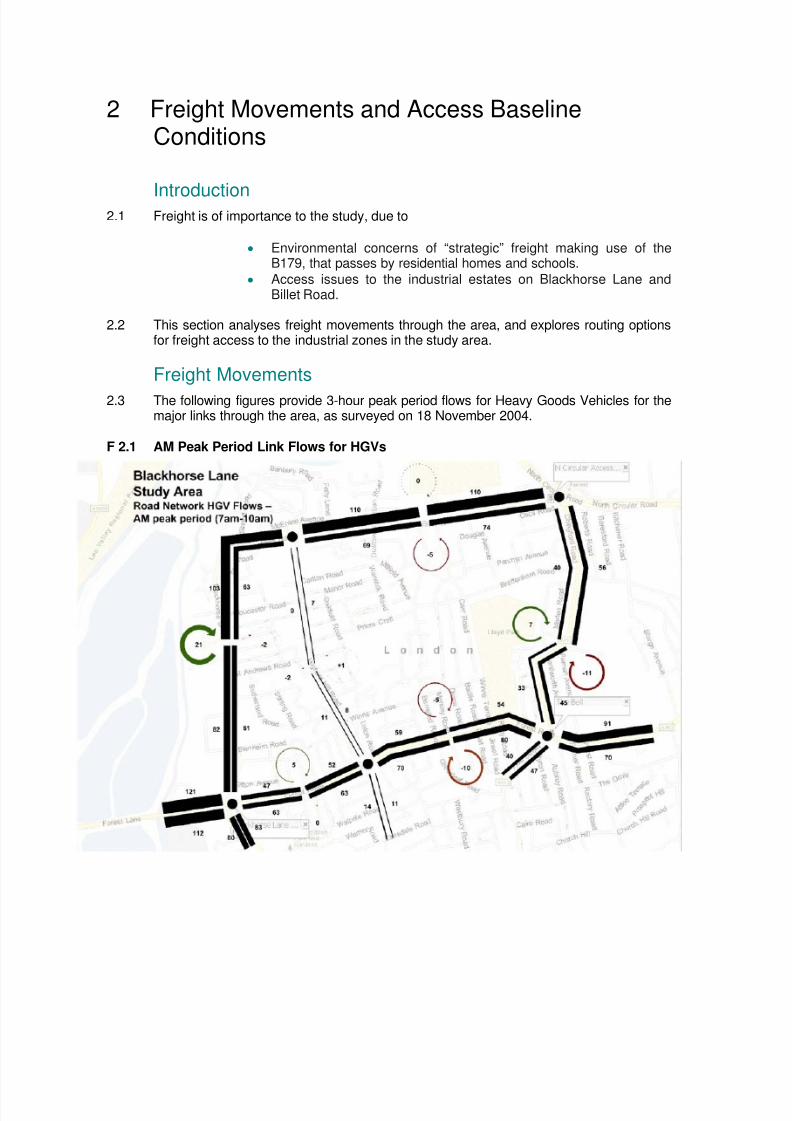
2.3 The following figures provide 3-hour peak period flows for Heavy Goods Vehicles for themajor links through the area, as surveyed on 18 November 2004.
F 2.1 AM Peak Period Link Flows for HGVs
8/2/2019 Traffic Baseline Conditions
http://slidepdf.com/reader/full/traffic-baseline-conditions 16/34
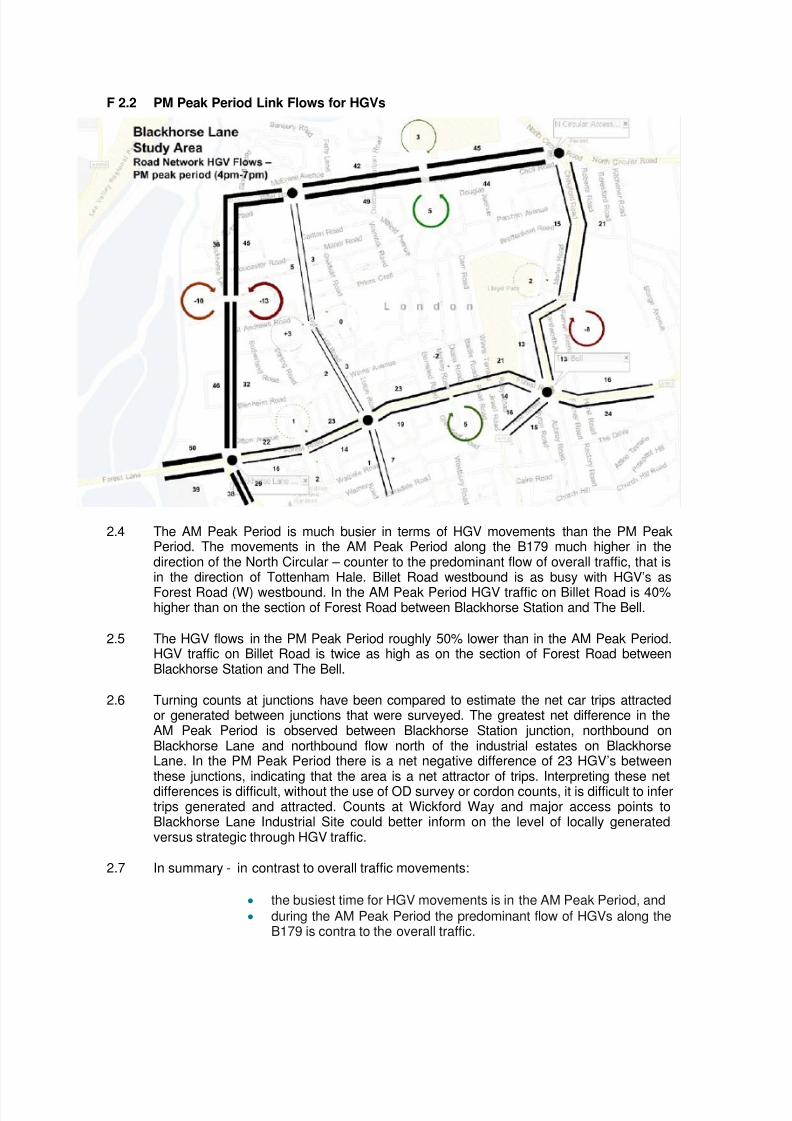
F 2.2 PM Peak Period Link Flows for HGVs
2.4 The AM Peak Period is much busier in terms of HGV movements than the PM PeakPeriod. The movements in the AM Peak Period along the B179 much higher in thedirection of the North Circular – counter to the predominant flow of overall traffic, that isin the direction of Tottenham Hale. Billet Road westbound is as busy with HGV’s as
Forest Road (W) westbound. In the AM Peak Period HGV traffic on Billet Road is 40%higher than on the section of Forest Road between Blackhorse Station and The Bell.
2.5 The HGV flows in the PM Peak Period roughly 50% lower than in the AM Peak Period.HGV traffic on Billet Road is twice as high as on the section of Forest Road betweenBlackhorse Station and The Bell.
2.6 Turning counts at junctions have been compared to estimate the net car trips attractedor generated between junctions that were surveyed. The greatest net difference in theAM Peak Period is observed between Blackhorse Station junction, northbound onBlackhorse Lane and northbound flow north of the industrial estates on BlackhorseLane. In the PM Peak Period there is a net negative difference of 23 HGV’s betweenthese junctions, indicating that the area is a net attractor of trips. Interpreting these netdifferences is difficult, without the use of OD survey or cordon counts, it is difficult to infertrips generated and attracted. Counts at Wickford Way and major access points toBlackhorse Lane Industrial Site could better inform on the level of locally generatedversus strategic through HGV traffic.
2.7 In summary - in contrast to overall traffic movements:
• the busiest time for HGV movements is in the AM Peak Period, and• during the AM Peak Period the predominant flow of HGVs along the
B179 is contra to the overall traffic.
8/2/2019 Traffic Baseline Conditions
http://slidepdf.com/reader/full/traffic-baseline-conditions 17/34
3 Car Parking Baseline Conditions
Car Parking as a Restraint
Employment uses
3.1 Car parking can be used as a form of trip end restraint. If there is no available carparking at a person’s intended destination it is likely that they will travel by different,possibly more sustainable mode, such as the bus or train.
Residential Areas
3.2 If parking provision for residential areas is restrained, households are made to thinkabout their choices in terms of owning a car, and in many cases their choice in owning amultiple number of cars.
3.3 Waltham Forests UDP has introduced maximum car parking standards (shown inAppendix A), this means that new developments can only provide a given amount of
parking that is set within these standards. Parking standards vary upon the type ofdevelopment and the size of development. For example different parking provisions areallowed for 1-2 bedroom houses and 3-4 bedroom houses. The standards are furtherdependent upon the Public Transport Accessibility Level (PTAL) for the location ofdevelopment and whether it is inside or outside of the CPZ. In many cases the maximumstandards allow only 1 or even less than 1 space per residential unit, this is especiallythe case in areas with high PTAL and within CPZs.
3.4 However, the standards should be interpreted as absolute maximums. Policyencourages developments to seek much lower parking provision than the maximumswhere possible. There are many relevant case studies in London where “low cardependent” developments have been successfully implemented. These developmentsset precedents for much lower parking provision; providing car-parking spaces from 50%
to as low as 15% per residential unit.
3.5 One of the keys to promoting sustainable transport is by firstly providing a low carprovision. Therefore by limiting the amount of new car parking provision being createdhopefully this can be achieved.
Enforcement and Transport Management
3.6 Schemes with low parking provision can only work in hand with effective parkingenforcement. Therefore, any low parking development will require extensions tocontrolled parking zones. Furthermore, in combination with this restraint on car-use, thedevelopment will need to secure necessary improvements to pedestrian, cycling andpublic transport accessibility to enable residents and employees real alternatives to use
of the car for their journeys to work.
Benefits to maximizing development potential
3.7 Judicious provision of low levels of parking spaces can help developers maximise thevalue of their land for active use, provided public transport is at a sufficiently accessiblelevel.
3.8 Full details of LBWF’s UDP parking standards and a list of relevant low-car developmentcase studies can be found in Appendix A.
Controlled Parking and 20mph Zones
8/2/2019 Traffic Baseline Conditions
http://slidepdf.com/reader/full/traffic-baseline-conditions 18/34
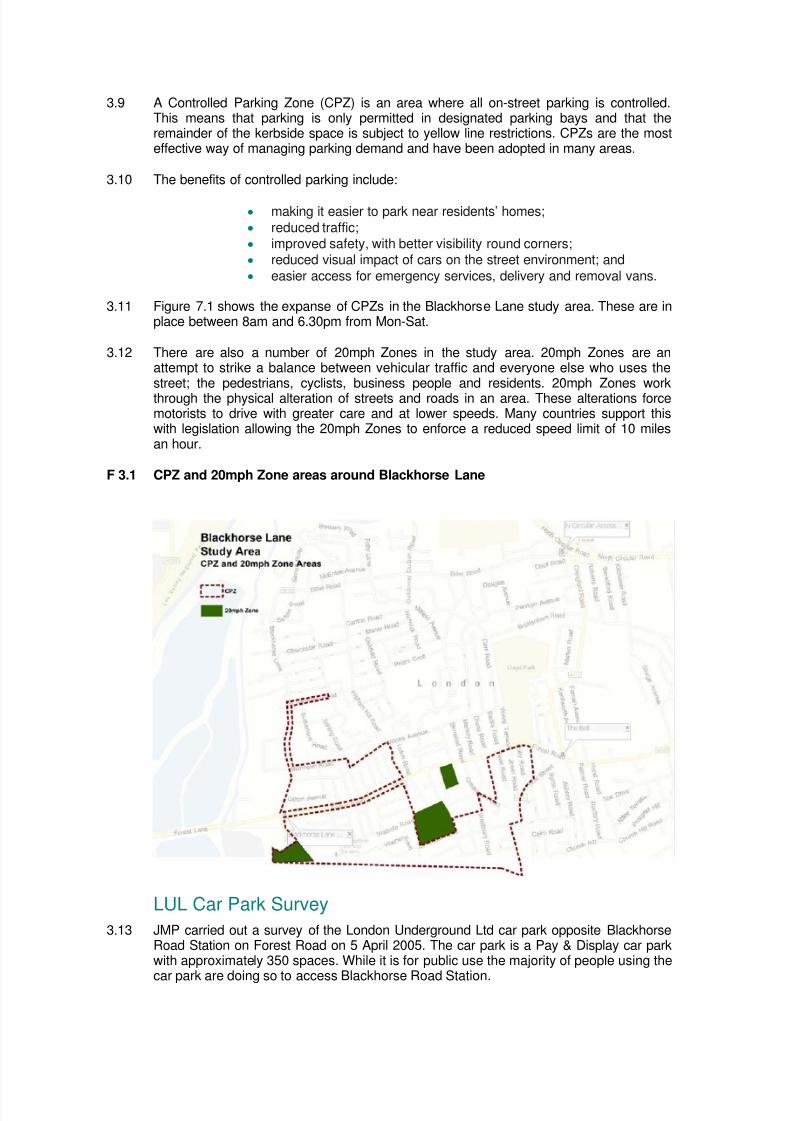
3.9 A Controlled Parking Zone (CPZ) is an area where all on-street parking is controlled.This means that parking is only permitted in designated parking bays and that theremainder of the kerbside space is subject to yellow line restrictions. CPZs are the mosteffective way of managing parking demand and have been adopted in many areas.
3.10 The benefits of controlled parking include:
• making it easier to park near residents’ homes;
• reduced traffic;
• improved safety, with better visibility round corners;
• reduced visual impact of cars on the street environment; and
• easier access for emergency services, delivery and removal vans.
3.11 Figure 7.1 shows the expanse of CPZs in the Blackhorse Lane study area. These are inplace between 8am and 6.30pm from Mon-Sat.
3.12 There are also a number of 20mph Zones in the study area. 20mph Zones are anattempt to strike a balance between vehicular traffic and everyone else who uses thestreet; the pedestrians, cyclists, business people and residents. 20mph Zones workthrough the physical alteration of streets and roads in an area. These alterations forcemotorists to drive with greater care and at lower speeds. Many countries support thiswith legislation allowing the 20mph Zones to enforce a reduced speed limit of 10 milesan hour.
F 3.1 CPZ and 20mph Zone areas around Blackhorse Lane
LUL Car Park Survey
3.13 JMP carried out a survey of the London Underground Ltd car park opposite BlackhorseRoad Station on Forest Road on 5 April 2005. The car park is a Pay & Display car parkwith approximately 350 spaces. While it is for public use the majority of people using the
car park are doing so to access Blackhorse Road Station.
8/2/2019 Traffic Baseline Conditions
http://slidepdf.com/reader/full/traffic-baseline-conditions 19/34
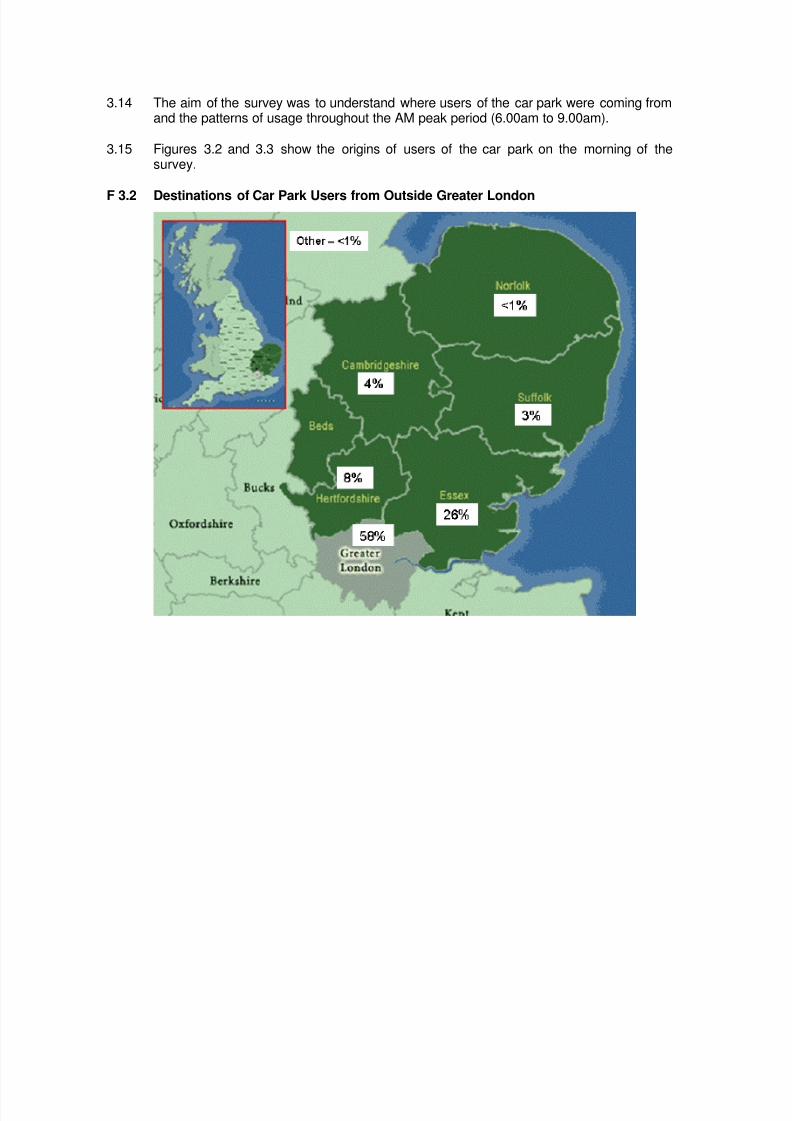
3.14 The aim of the survey was to understand where users of the car park were coming fromand the patterns of usage throughout the AM peak period (6.00am to 9.00am).
3.15 Figures 3.2 and 3.3 show the origins of users of the car park on the morning of thesurvey.
F 3.2 Destinations of Car Park Users from Outside Greater London
8/2/2019 Traffic Baseline Conditions
http://slidepdf.com/reader/full/traffic-baseline-conditions 20/34
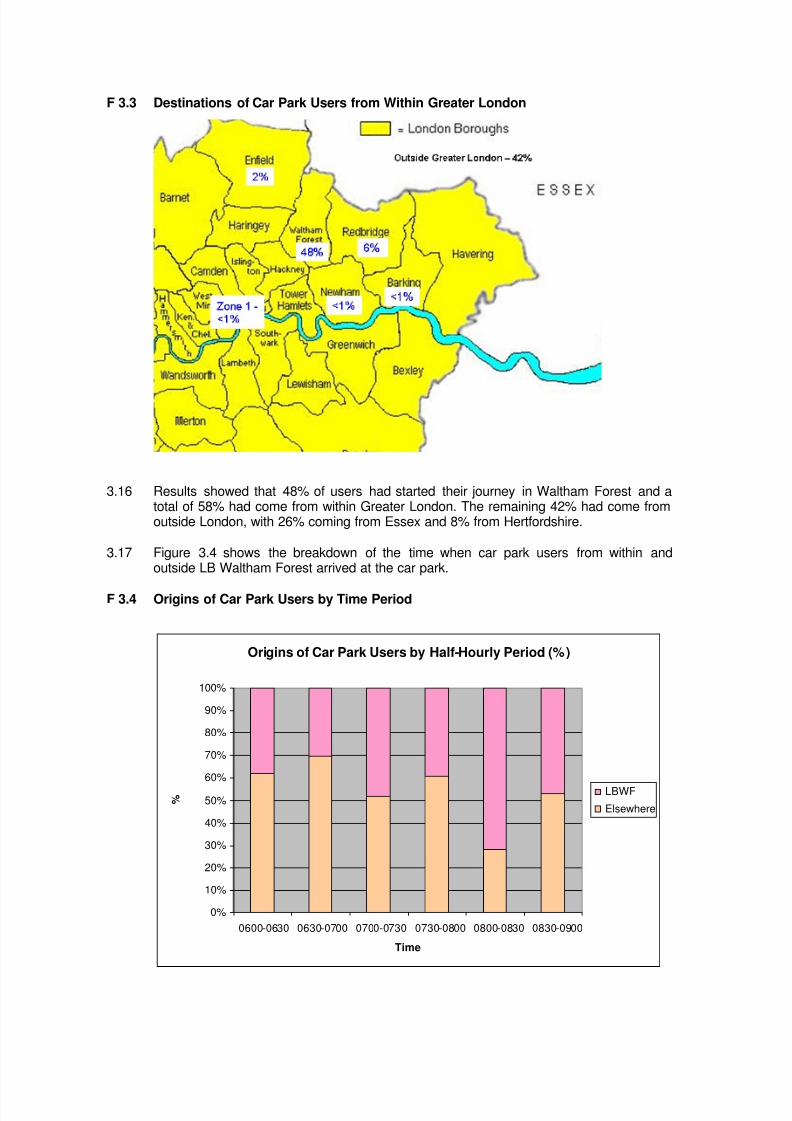
F 3.3 Destinations of Car Park Users from Within Greater London
3.16 Results showed that 48% of users had started their journey in Waltham Forest and atotal of 58% had come from within Greater London. The remaining 42% had come fromoutside London, with 26% coming from Essex and 8% from Hertfordshire.
3.17 Figure 3.4 shows the breakdown of the time when car park users from within andoutside LB Waltham Forest arrived at the car park.
F 3.4 Origins of Car Park Users by Time Period
Origins of Car Park Users by Half-Hourly Period (%)
0%
10%
20%
30%
40%
50%
60%
70%
80%
90%
100%
0600-0630 0630-0700 0700-0730 0730-0800 0800-0830 0830-0900
Time
%LBWF
Elsewhere
8/2/2019 Traffic Baseline Conditions
http://slidepdf.com/reader/full/traffic-baseline-conditions 21/34
3.18 For each half-hourly period surveyed, apart from 8.00-8.30am, more than half of thepeople arriving at the LUL car park were from outside LB Waltham Forest. Between 8.00and 8.30am 72% of arrivals were from within the borough.
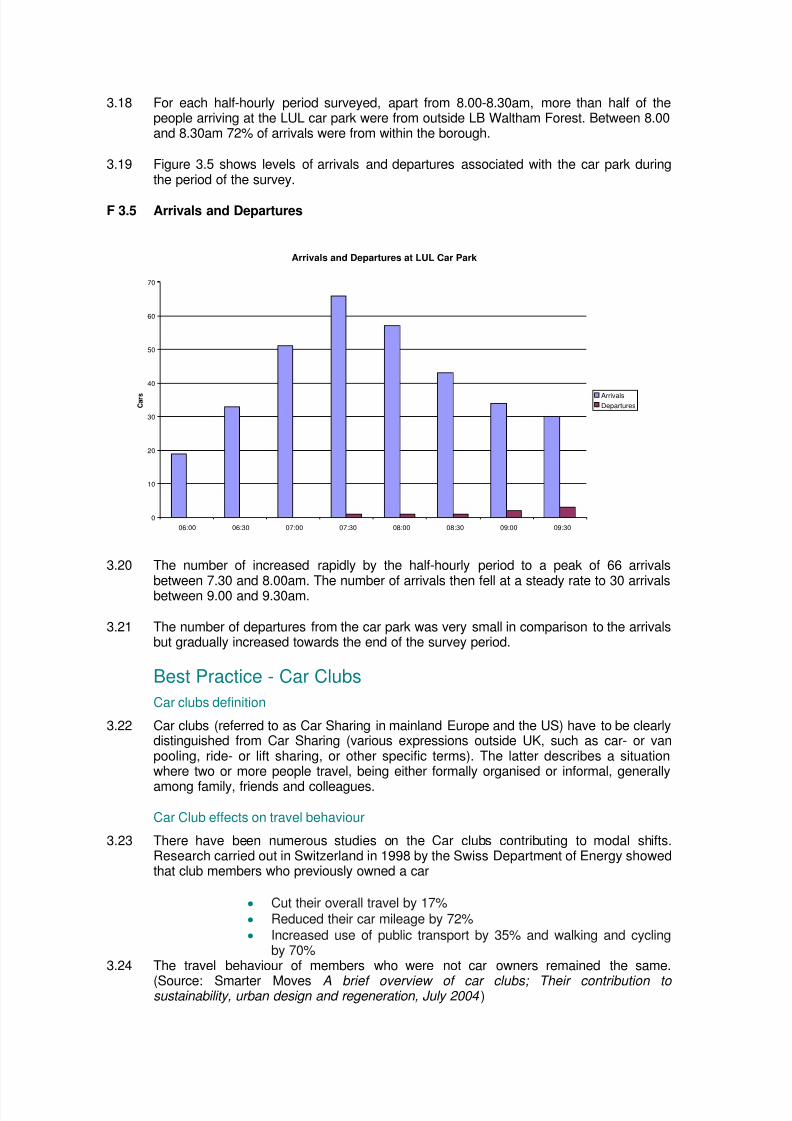
3.19 Figure 3.5 shows levels of arrivals and departures associated with the car park duringthe period of the survey.
F 3.5 Arrivals and Departures
Arrivals and Departures at LUL Car Park
0
10
20
30
40
50
60
70
06:00 06:30 07:00 07:30 08:00 08:30 09:00 09:30
C a r s Arrivals
Departures
3.20 The number of increased rapidly by the half-hourly period to a peak of 66 arrivalsbetween 7.30 and 8.00am. The number of arrivals then fell at a steady rate to 30 arrivalsbetween 9.00 and 9.30am.
3.21 The number of departures from the car park was very small in comparison to the arrivalsbut gradually increased towards the end of the survey period.
Best Practice - Car Clubs
Car clubs definition
3.22 Car clubs (referred to as Car Sharing in mainland Europe and the US) have to be clearlydistinguished from Car Sharing (various expressions outside UK, such as car- or vanpooling, ride- or lift sharing, or other specific terms). The latter describes a situationwhere two or more people travel, being either formally organised or informal, generally
among family, friends and colleagues.
Car Club effects on travel behaviour
3.23 There have been numerous studies on the Car clubs contributing to modal shifts.Research carried out in Switzerland in 1998 by the Swiss Department of Energy showedthat club members who previously owned a car
• Cut their overall travel by 17%
• Reduced their car mileage by 72%
• Increased use of public transport by 35% and walking and cyclingby 70%
3.24 The travel behaviour of members who were not car owners remained the same.
(Source: Smarter Moves A brief overview of car clubs; Their contribution to sustainability, urban design and regeneration, July 2004 )
8/2/2019 Traffic Baseline Conditions
http://slidepdf.com/reader/full/traffic-baseline-conditions 22/34
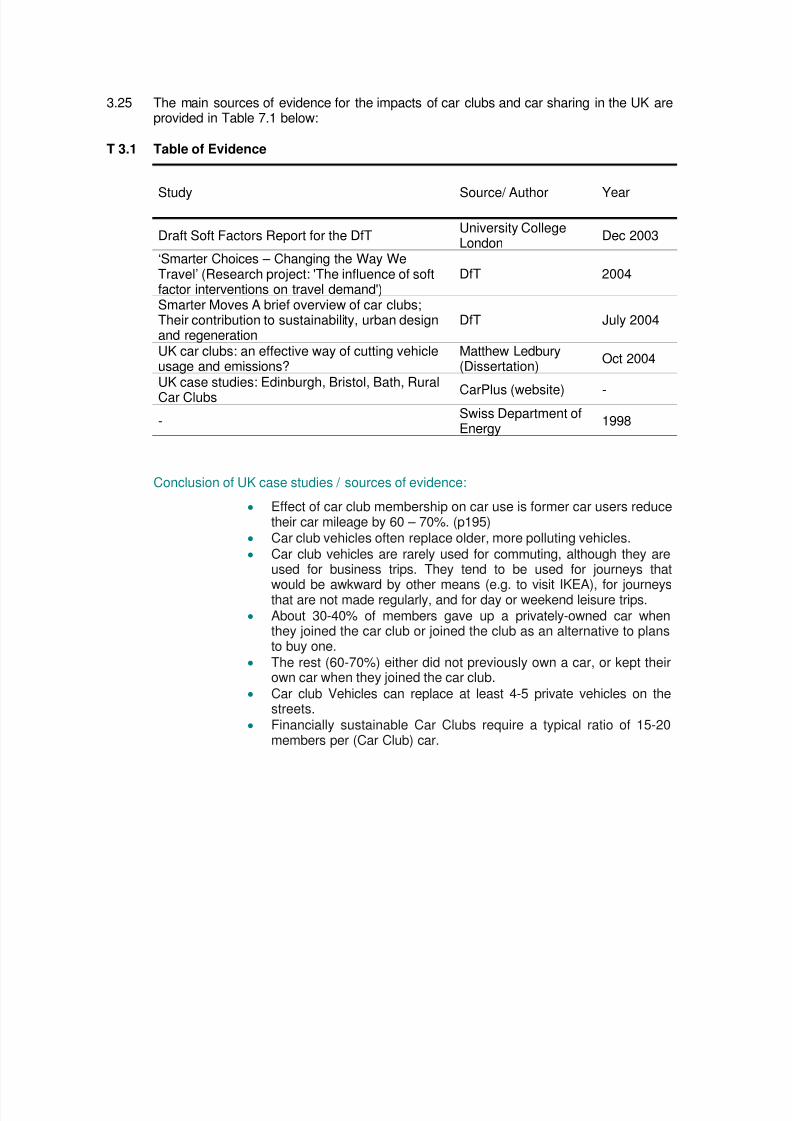
3.25 The main sources of evidence for the impacts of car clubs and car sharing in the UK areprovided in Table 7.1 below:
T 3.1 Table of Evidence
Study Source/ Author Year
Draft Soft Factors Report for the DfTUniversity CollegeLondon
Dec 2003
‘Smarter Choices – Changing the Way WeTravel’ (Research project: 'The influence of softfactor interventions on travel demand')
DfT 2004
Smarter Moves A brief overview of car clubs;Their contribution to sustainability, urban designand regeneration
DfT July 2004
UK car clubs: an effective way of cutting vehicleusage and emissions?
Matthew Ledbury(Dissertation)
Oct 2004
UK case studies: Edinburgh, Bristol, Bath, RuralCar Clubs CarPlus (website) -
-Swiss Department ofEnergy
1998
Conclusion of UK case studies / sources of evidence:
• Effect of car club membership on car use is former car users reducetheir car mileage by 60 – 70%. (p195)
• Car club vehicles often replace older, more polluting vehicles.
• Car club vehicles are rarely used for commuting, although they areused for business trips. They tend to be used for journeys that
would be awkward by other means (e.g. to visit IKEA), for journeysthat are not made regularly, and for day or weekend leisure trips.• About 30-40% of members gave up a privately-owned car when
they joined the car club or joined the club as an alternative to plansto buy one.
• The rest (60-70%) either did not previously own a car, or kept theirown car when they joined the car club.
• Car club Vehicles can replace at least 4-5 private vehicles on thestreets.
• Financially sustainable Car Clubs require a typical ratio of 15-20members per (Car Club) car.
8/2/2019 Traffic Baseline Conditions
http://slidepdf.com/reader/full/traffic-baseline-conditions 23/34
4 Public Transport Baseline Conditions
Blackhorse Road Station
Facilities at the station
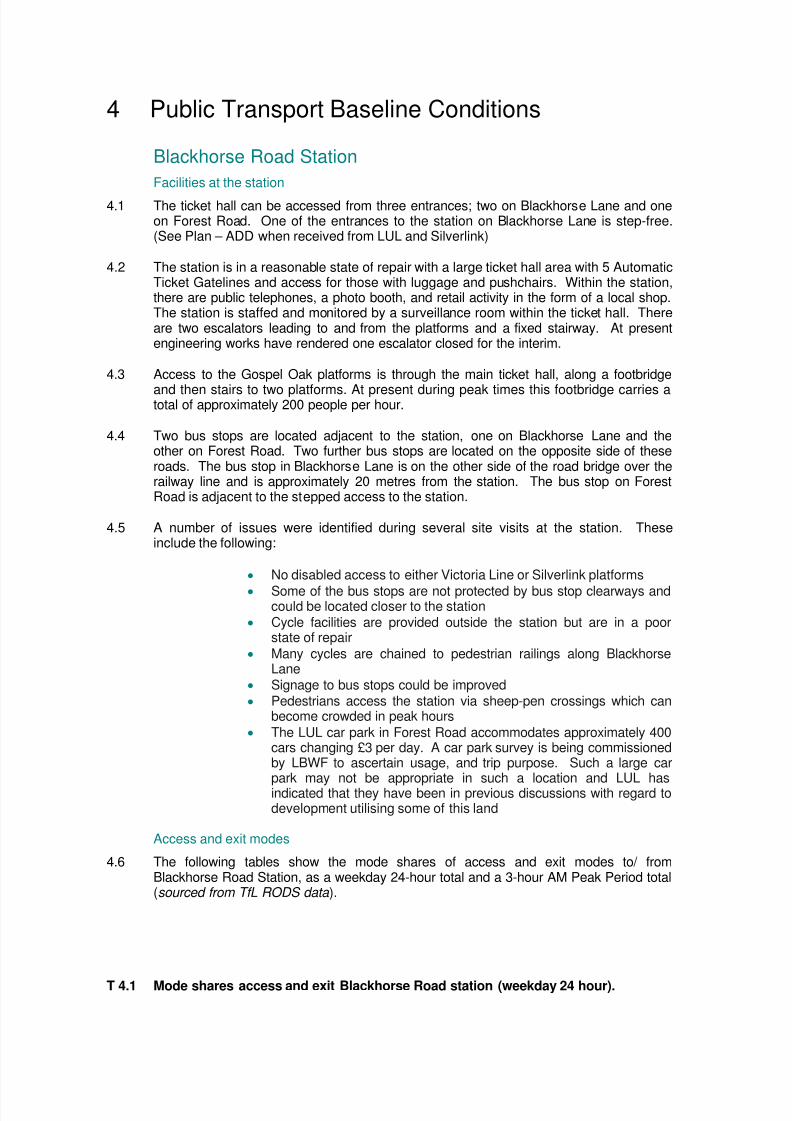
4.1 The ticket hall can be accessed from three entrances; two on Blackhorse Lane and oneon Forest Road. One of the entrances to the station on Blackhorse Lane is step-free.(See Plan – ADD when received from LUL and Silverlink)
4.2 The station is in a reasonable state of repair with a large ticket hall area with 5 AutomaticTicket Gatelines and access for those with luggage and pushchairs. Within the station,there are public telephones, a photo booth, and retail activity in the form of a local shop.The station is staffed and monitored by a surveillance room within the ticket hall. Thereare two escalators leading to and from the platforms and a fixed stairway. At presentengineering works have rendered one escalator closed for the interim.
4.3 Access to the Gospel Oak platforms is through the main ticket hall, along a footbridge
and then stairs to two platforms. At present during peak times this footbridge carries atotal of approximately 200 people per hour.
4.4 Two bus stops are located adjacent to the station, one on Blackhorse Lane and theother on Forest Road. Two further bus stops are located on the opposite side of theseroads. The bus stop in Blackhorse Lane is on the other side of the road bridge over therailway line and is approximately 20 metres from the station. The bus stop on ForestRoad is adjacent to the stepped access to the station.
4.5 A number of issues were identified during several site visits at the station. Theseinclude the following:
• No disabled access to either Victoria Line or Silverlink platforms
• Some of the bus stops are not protected by bus stop clearways andcould be located closer to the station
• Cycle facilities are provided outside the station but are in a poorstate of repair
• Many cycles are chained to pedestrian railings along BlackhorseLane
• Signage to bus stops could be improved
• Pedestrians access the station via sheep-pen crossings which canbecome crowded in peak hours
• The LUL car park in Forest Road accommodates approximately 400cars changing £3 per day. A car park survey is being commissionedby LBWF to ascertain usage, and trip purpose. Such a large carpark may not be appropriate in such a location and LUL hasindicated that they have been in previous discussions with regard todevelopment utilising some of this land
Access and exit modes
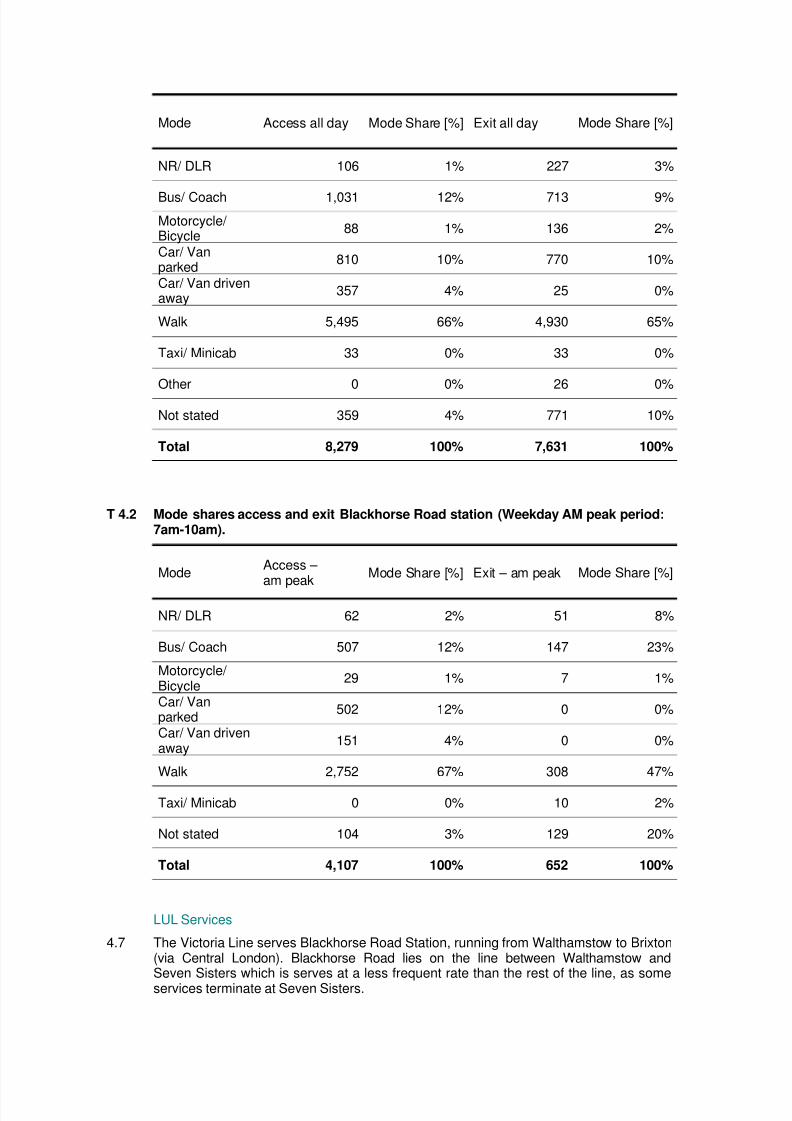
4.6 The following tables show the mode shares of access and exit modes to/ fromBlackhorse Road Station, as a weekday 24-hour total and a 3-hour AM Peak Period total(sourced from TfL RODS data ).
T 4.1 Mode shares access and exit Blackhorse Road station (weekday 24 hour).
8/2/2019 Traffic Baseline Conditions
http://slidepdf.com/reader/full/traffic-baseline-conditions 24/34
Mode Access all day Mode Share [%] Exit all day Mode Share [%]
NR/ DLR 106 1% 227 3%
Bus/ Coach 1,031 12% 713 9%
Motorcycle/ Bicycle
88 1% 136 2%
Car/ Vanparked
810 10% 770 10%
Car/ Van drivenaway
357 4% 25 0%
Walk 5,495 66% 4,930 65%
Taxi/ Minicab 33 0% 33 0%
Other 0 0% 26 0%
Not stated 359 4% 771 10%
Total 8,279 100% 7,631 100%
T 4.2 Mode shares access and exit Blackhorse Road station (Weekday AM peak period:7am-10am).
ModeAccess – am peak
Mode Share [%] Exit – am peak Mode Share [%]
NR/ DLR 62 2% 51 8%
Bus/ Coach 507 12% 147 23%
Motorcycle/ Bicycle
29 1% 7 1%
Car/ Vanparked
502 12% 0 0%
Car/ Van drivenaway
151 4% 0 0%
Walk 2,752 67% 308 47%
Taxi/ Minicab 0 0% 10 2%
Not stated 104 3% 129 20%
Total 4,107 100% 652 100%
LUL Services
4.7 The Victoria Line serves Blackhorse Road Station, running from Walthamstow to Brixton(via Central London). Blackhorse Road lies on the line between Walthamstow andSeven Sisters which is serves at a less frequent rate than the rest of the line, as someservices terminate at Seven Sisters.
8/2/2019 Traffic Baseline Conditions
http://slidepdf.com/reader/full/traffic-baseline-conditions 25/34
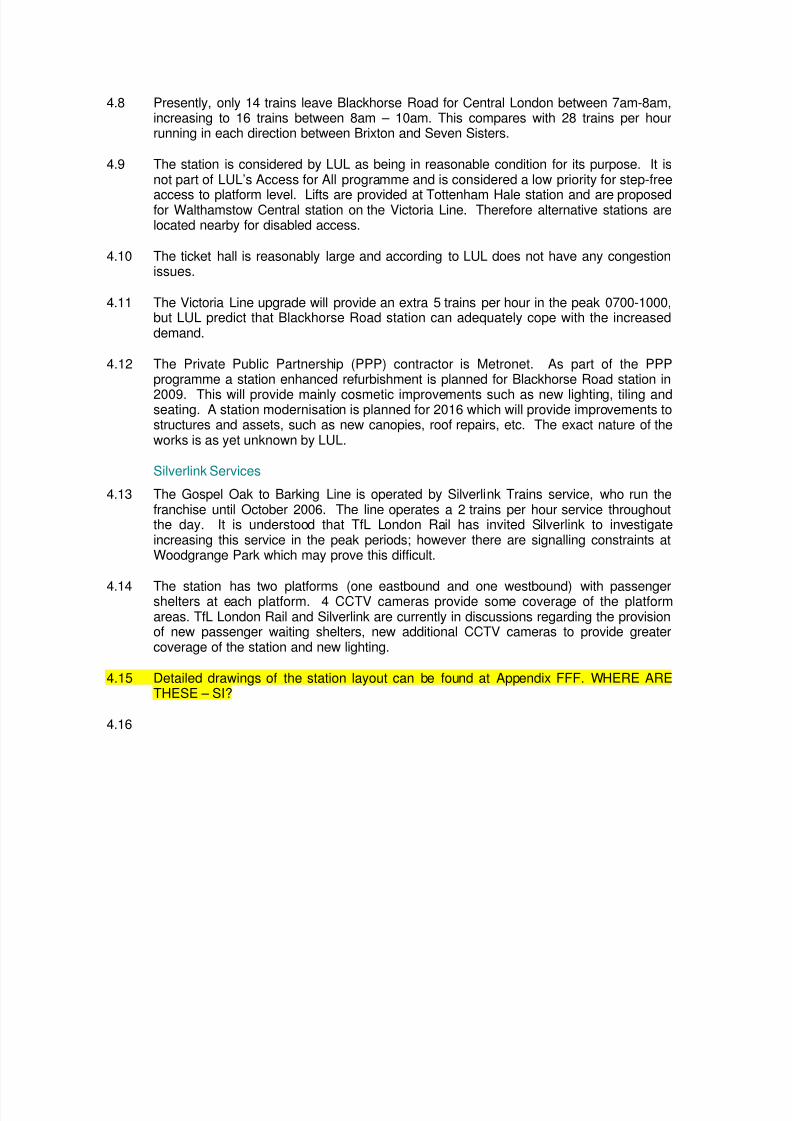
4.8 Presently, only 14 trains leave Blackhorse Road for Central London between 7am-8am,increasing to 16 trains between 8am – 10am. This compares with 28 trains per hourrunning in each direction between Brixton and Seven Sisters.
4.9 The station is considered by LUL as being in reasonable condition for its purpose. It isnot part of LUL’s Access for All programme and is considered a low priority for step-free
access to platform level. Lifts are provided at Tottenham Hale station and are proposedfor Walthamstow Central station on the Victoria Line. Therefore alternative stations arelocated nearby for disabled access.
4.10 The ticket hall is reasonably large and according to LUL does not have any congestionissues.
4.11 The Victoria Line upgrade will provide an extra 5 trains per hour in the peak 0700-1000,but LUL predict that Blackhorse Road station can adequately cope with the increaseddemand.
4.12 The Private Public Partnership (PPP) contractor is Metronet. As part of the PPPprogramme a station enhanced refurbishment is planned for Blackhorse Road station in
2009. This will provide mainly cosmetic improvements such as new lighting, tiling andseating. A station modernisation is planned for 2016 which will provide improvements tostructures and assets, such as new canopies, roof repairs, etc. The exact nature of theworks is as yet unknown by LUL.
Silverlink Services
4.13 The Gospel Oak to Barking Line is operated by Silverlink Trains service, who run thefranchise until October 2006. The line operates a 2 trains per hour service throughoutthe day. It is understood that TfL London Rail has invited Silverlink to investigateincreasing this service in the peak periods; however there are signalling constraints atWoodgrange Park which may prove this difficult.
4.14 The station has two platforms (one eastbound and one westbound) with passengershelters at each platform. 4 CCTV cameras provide some coverage of the platformareas. TfL London Rail and Silverlink are currently in discussions regarding the provisionof new passenger waiting shelters, new additional CCTV cameras to provide greatercoverage of the station and new lighting.
4.15 Detailed drawings of the station layout can be found at Appendix FFF. WHERE ARETHESE – SI?
4.16
8/2/2019 Traffic Baseline Conditions
http://slidepdf.com/reader/full/traffic-baseline-conditions 26/34
Bus Service Provision
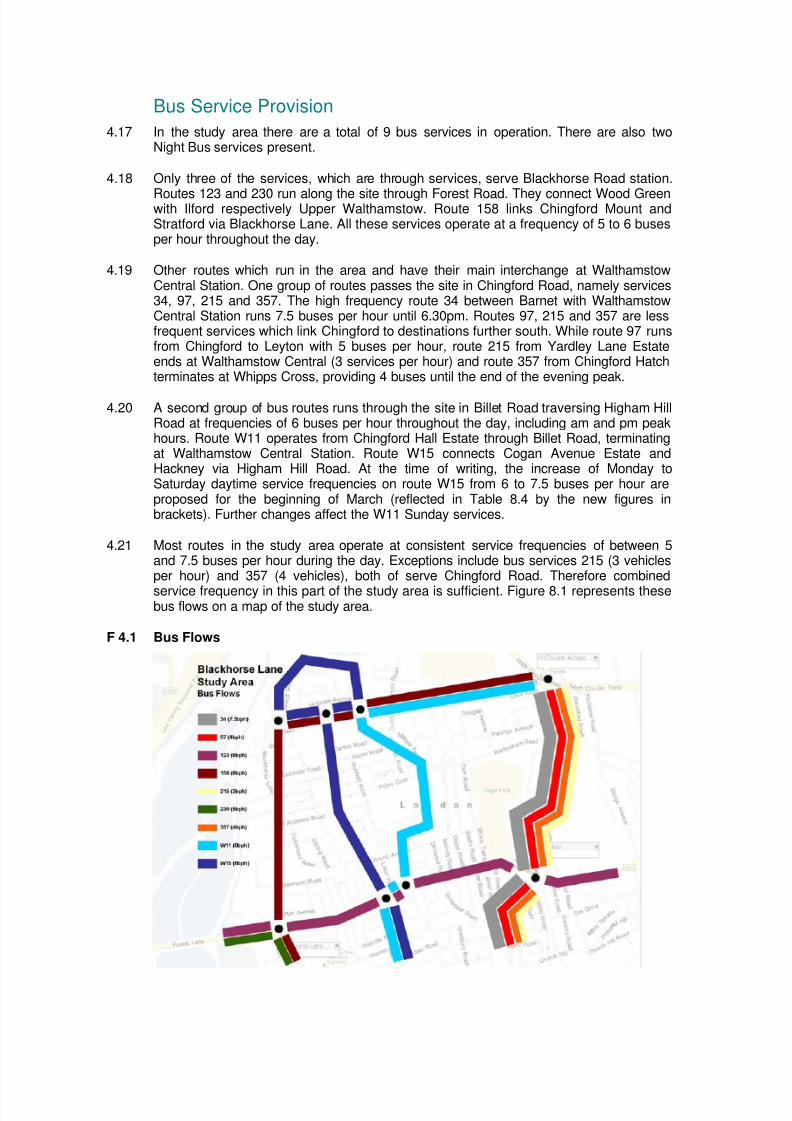
4.17 In the study area there are a total of 9 bus services in operation. There are also twoNight Bus services present.
4.18 Only three of the services, which are through services, serve Blackhorse Road station.
Routes 123 and 230 run along the site through Forest Road. They connect Wood Greenwith Ilford respectively Upper Walthamstow. Route 158 links Chingford Mount andStratford via Blackhorse Lane. All these services operate at a frequency of 5 to 6 busesper hour throughout the day.
4.19 Other routes which run in the area and have their main interchange at WalthamstowCentral Station. One group of routes passes the site in Chingford Road, namely services34, 97, 215 and 357. The high frequency route 34 between Barnet with WalthamstowCentral Station runs 7.5 buses per hour until 6.30pm. Routes 97, 215 and 357 are lessfrequent services which link Chingford to destinations further south. While route 97 runsfrom Chingford to Leyton with 5 buses per hour, route 215 from Yardley Lane Estateends at Walthamstow Central (3 services per hour) and route 357 from Chingford Hatchterminates at Whipps Cross, providing 4 buses until the end of the evening peak.
4.20 A second group of bus routes runs through the site in Billet Road traversing Higham HillRoad at frequencies of 6 buses per hour throughout the day, including am and pm peakhours. Route W11 operates from Chingford Hall Estate through Billet Road, terminatingat Walthamstow Central Station. Route W15 connects Cogan Avenue Estate andHackney via Higham Hill Road. At the time of writing, the increase of Monday toSaturday daytime service frequencies on route W15 from 6 to 7.5 buses per hour areproposed for the beginning of March (reflected in Table 8.4 by the new figures inbrackets). Further changes affect the W11 Sunday services.
4.21 Most routes in the study area operate at consistent service frequencies of between 5and 7.5 buses per hour during the day. Exceptions include bus services 215 (3 vehiclesper hour) and 357 (4 vehicles), both of serve Chingford Road. Therefore combined
service frequency in this part of the study area is sufficient. Figure 8.1 represents thesebus flows on a map of the study area.
F 4.1 Bus Flows
8/2/2019 Traffic Baseline Conditions
http://slidepdf.com/reader/full/traffic-baseline-conditions 27/34
4.22 The following Tables 8.3 and 8.5 summarise bus routings, service frequencies andcapacities.
T 4.3 Overview on day-time bus services.
Route No. From To
34 Barnet Walthamstow Central Station
97 Chingford Station Leyton
123 Wood Green Ilford
158 Chingford Mount Stratford
215 Yardley Lane Estate Walthamstow Central Station
230 Wood Green Upper Walthamstow
357 Chingford Hatch Whipps Cross
W11 Chingford Hall Estate Walthamstow Central Station
W15 Cogan Avenue Estate Hackney
T 4.4 Service frequencies and vehicle capacities.
Buses per hour*Route No. Vehicle
capacitiy* 0700-0930 0930-1600 1600-1830 1830-finish
34 85 7.5 7.5 7.5 4/3
97 90 5 5 5 4
123 90 6 6 6 3
158 90 5 5 5 3
215 90 3 3 3 2
230 90 5 5 5 4
357 85 4 4 4 2
W11 50 6 (7.5) 6 (7.5) 6 (7.5) 4
W15 45 6+ 6 6 6/4
All - 47.5 (49) 47.5 (49) 47.5 (49) 32/29
* Planning capacity for London Buses is 75-80% of the total vehicle capacity.
4.23 Transport for London’s bus data shows average loading figures far below planning
capacities on all routes. Table 8.5 lists the stations with the highest average loadingsduring am and pm peak hours.
8/2/2019 Traffic Baseline Conditions
http://slidepdf.com/reader/full/traffic-baseline-conditions 28/34
T 4.5 Vehicle loadings.
Maximum average loading [absolute/ percent] on routeRouteNo.
Planningcapacitiy 0700-1000 Station Name 1600-1900 Station Name
34 68 24 (35%)Chingford Rd
(southbd)
26 (38%)Bowes Rd
(southbd)97 72 42 (58%)
Chingford Rd(southbd)
33 (46%)High Rd(southbd)
123 72 37 (51%)W Forest TownHall (eastbd)
36 (50%)Blackhorse RdStn (eastbd)
158 72 40 (56%)Markhouse Rd(northbd)
43 (60%)Leyton Station(northbd)
215 72 43 (60%)Chingford Rd(southbd)
31 (43%)Walthamstow -Bell (northbd)
230 72 31 (43%)West Green(westbd)
38 (53%)Turnpike LaneStn (eastbd)
357 68 29 (43%)Chingford Rd(southbd)
39 (57%) Hoe St (northbd)
W11 40 20 (50%) Palmerston Rd(southbd)
26 (65%) WalthamstowMkt (northbd)
W15 36 25 (69%)Palmerston Rd(southbd)
26 (72%)Morning Lane(northbd)
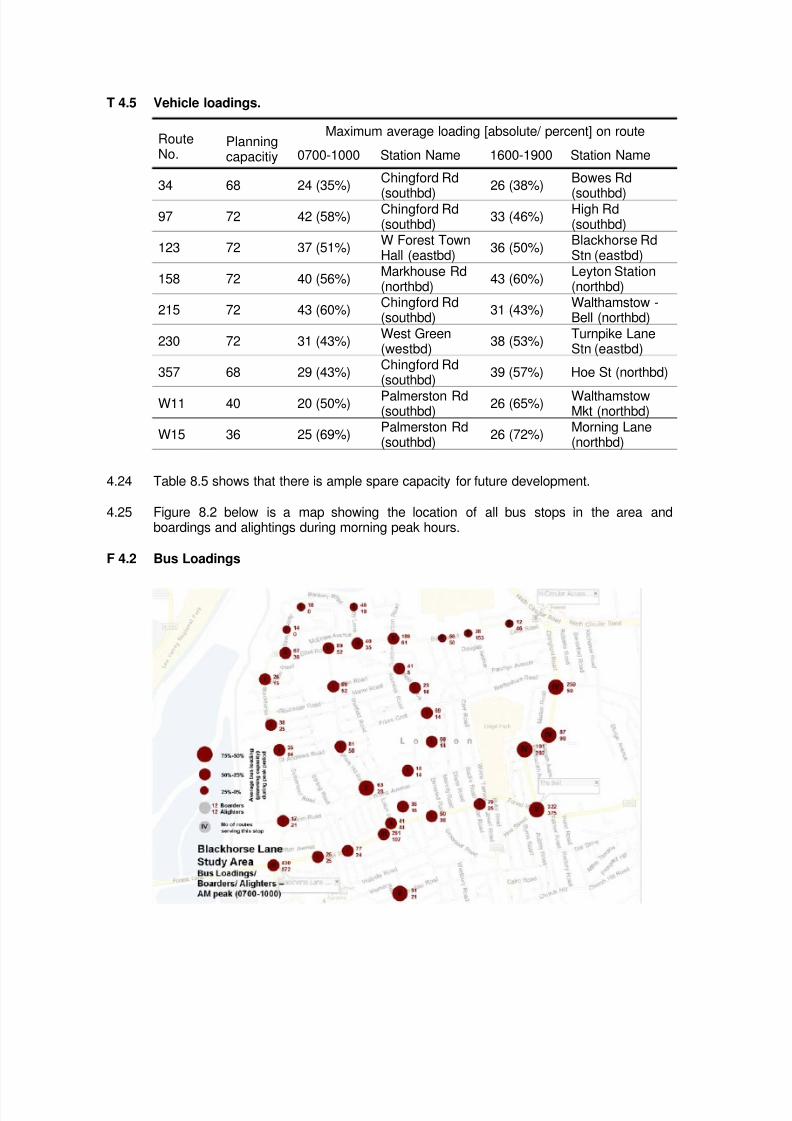
4.24 Table 8.5 shows that there is ample spare capacity for future development.
4.25 Figure 8.2 below is a map showing the location of all bus stops in the area andboardings and alightings during morning peak hours.
F 4.2 Bus Loadings
8/2/2019 Traffic Baseline Conditions
http://slidepdf.com/reader/full/traffic-baseline-conditions 29/34
Bus Reliability
Reliability of Frequent Services
4.26 The majority of services in the area can be classified as a frequent service. TfL’sdefinition of a frequent service is one providing a headway of 14 minutes or less. Thereliability of these services are judged by their level of regularity, rather than by their
adherence to published schedule. Regularity of services is deemed the most importantfactor for such services, since it can be largely assumed that passengers for suchservices will largely not rely upon timetables for timing their arrival at the bus-stops. InLondon this behaviour is reinforced by TfL only providing information on headway ofservices rather than timetabled times for these services.
4.27 For frequent services the measure of Excess Waiting Time (EWT) provides the mostcomparable measure of reliability of services. EWT measures the regularity of services,as a function of the variability of observed service headways. The higher the variability inservice headways, the greater the chance of a passenger having to wait excessivelylonger than expected for a service to arrive. The tables below also provide estimates ofthe probability of passengers experiencing these longer waiting times as a result ofservice irregularities.
4.28 In London, TfL measure EWT along with a number of other performance statistics (seetables 8.6 and 8.7 below) based around estimating the chance of a passengerexperiencing a long wait (>10 minutes, > 20 minutes, >30 minutes and >twice theservice headway). TfL also record the number of unobserved “missing” buses, thatought to have been observed based upon operator schedule information.
4.29 Outside of London, bus reliability is regulated by the Traffic Commission. PunctualityStandards outlined in the recently revised (1st January 2005) “Practice Direction:Standards for Local Buses” the definition of a frequent service is one where “the serviceinterval (headway ) is 10 minutes or less”. For such services, the Traffic Commissionexpect that at the starting point of each route on at least 95% of occasions:
• Six or more buses will depart within any period of 60 minutes, and
• The interval between consecutive buses will not exceed 15 minutes.
4.30 At other timing points from the start of the route, the Traffic Commission (TC) expectperformance measurement based upon EWT. The TC have yet to prescribe a suitablestandard for adherence. It is understood that TfL have previously used an EWT of 1.56as a benchmark.
4.31 It is not possible to directly compare the TC’s standards on service intervals exceeding15 minutes and TfL’s measures on chances of a long wait. Table 8.6 below providesTfL’s estimates of the chance for waiting more than 20 minutes. This performancestatistic is a less stringent standard than the TC’s standard for the services included in
the table, that have scheduled headways of 8-12 minutes.
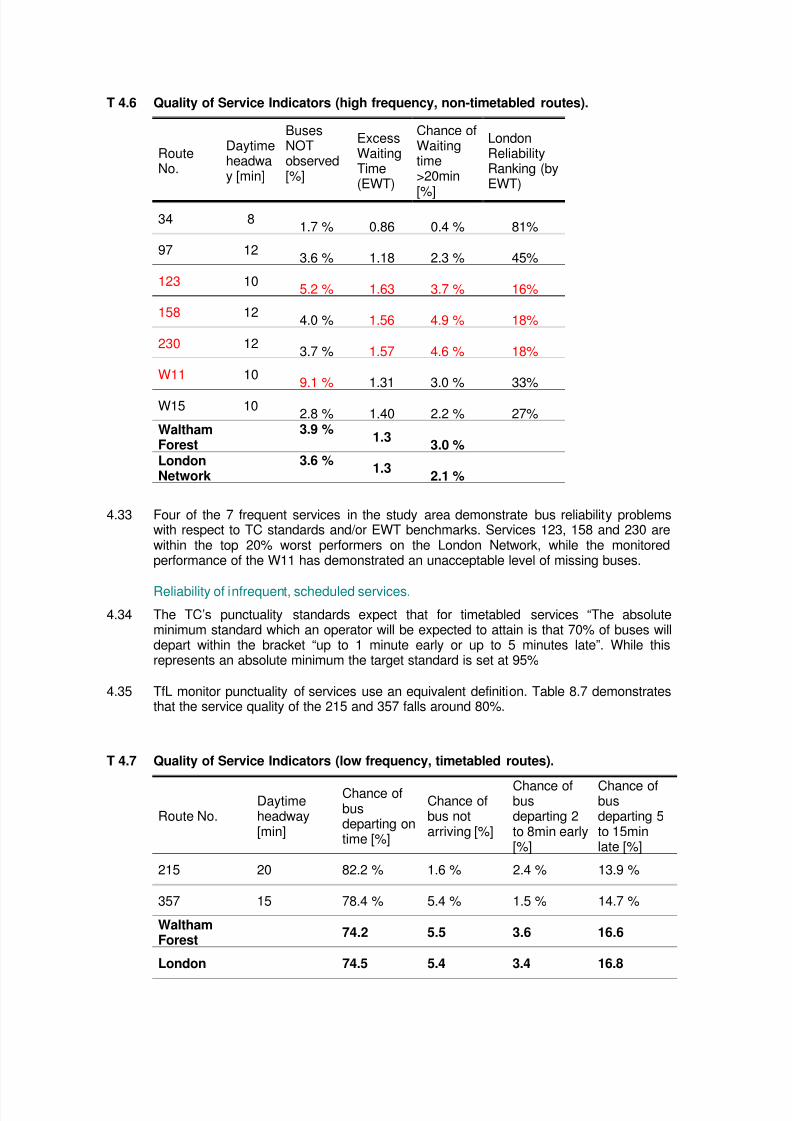
4.32 TfL reliability results of frequent (TfL definition) services running through and along thestudy area boundaries are provided in the table 8.7 below.
8/2/2019 Traffic Baseline Conditions
http://slidepdf.com/reader/full/traffic-baseline-conditions 30/34
T 4.6 Quality of Service Indicators (high frequency, non-timetabled routes).
RouteNo.
Daytimeheadway [min]
BusesNOTobserved[%]
ExcessWaitingTime(EWT)
Chance ofWaitingtime>20min
[%]
LondonReliabilityRanking (byEWT)
34 81.7 % 0.86 0.4 % 81%
97 123.6 % 1.18 2.3 % 45%
123 105.2 % 1.63 3.7 % 16%
158 124.0 % 1.56 4.9 % 18%
230 123.7 % 1.57 4.6 % 18%
W11 109.1 % 1.31 3.0 % 33%
W15 102.8 % 1.40 2.2 % 27%
WalthamForest
3.9 %1.3
3.0 %LondonNetwork
3.6 %1.3
2.1 %
4.33 Four of the 7 frequent services in the study area demonstrate bus reliability problemswith respect to TC standards and/or EWT benchmarks. Services 123, 158 and 230 arewithin the top 20% worst performers on the London Network, while the monitoredperformance of the W11 has demonstrated an unacceptable level of missing buses.
Reliability of infrequent, scheduled services.
4.34 The TC’s punctuality standards expect that for timetabled services “The absoluteminimum standard which an operator will be expected to attain is that 70% of buses willdepart within the bracket “up to 1 minute early or up to 5 minutes late”. While thisrepresents an absolute minimum the target standard is set at 95%
4.35 TfL monitor punctuality of services use an equivalent definition. Table 8.7 demonstratesthat the service quality of the 215 and 357 falls around 80%.
T 4.7 Quality of Service Indicators (low frequency, timetabled routes).
Route No.Daytimeheadway[min]
Chance ofbusdeparting ontime [%]
Chance ofbus notarriving [%]
Chance ofbusdeparting 2to 8min early[%]
Chance ofbusdeparting 5to 15minlate [%]
215 20 82.2 % 1.6 % 2.4 % 13.9 %
357 15 78.4 % 5.4 % 1.5 % 14.7 %
WalthamForest
74.2 5.5 3.6 16.6
London 74.5 5.4 3.4 16.8
8/2/2019 Traffic Baseline Conditions
http://slidepdf.com/reader/full/traffic-baseline-conditions 31/34
5 Pedestrian, Cycling and Environmental BaselineConditions
PedestriansIntroduction
5.1 The area around Blackhorse Lane is a diverse area with many different land-uses.Higham Hill, to the east of Blackhorse Lane and the south of Billet Road is a primarilyresidential area which includes supporting land-uses such as schools, local shops andopen space.
5.2 The nature of the area is conducive to short pedestrian trips between people’s housesand the nearby schools, shops and transport facilities. However, the area is bounded bya number of busy roads, and there are also land-uses in the area that attract trips byHeavy Goods Vehicles (HGVs).
5.3 The transport strategy of the Blackhorse Lane development framework must reflect thisdiversity of uses and mitigate the possible conflicts between them.
Local Issues
Forest Road / Blackhorse Lane Junction5.4 The Forest Road / Blackhorse Lane / Blackhorse Road junction is a busy four-arm
signalised junction with up to five lanes of traffic on one-arm. As such it is a significantobstacle for pedestrians.
5.5 At present the design of the junction and its signal timings are not very pedestrianoriented. All of the four arms of this junction have ‘sheep-pens’ in the centre of the road,meaning that pedestrians must cross in two stages, waiting in the sheep-pen for the
signals to change until they have priority to cross to the opposite side.
5.6 The Higham Hill residential area is to the north-east of this junction while BlackhorseRoad station is to the south-west. As such any pedestrian wishing to get from one to theother must cross at least two of the arms of this junction and potentially wait at up to foursets of traffic lights.
5.7 Changes to the design and signal timings of this junction could significantly reduce theobstruction that it currently poses to pedestrians. All-red phases for the traffic wouldallow pedestrians to cross one, or possibly even two, arms in a single movement.
Blackhorse Lane Industrial Areas5.8 The industrial sites along Blackhorse Lane (including the Sutherland Road area) attract
numerous trips by goods vehicles, both light and heavy. These do not create a pleasantand safe environment for pedestrians using Blackhorse Lane.
5.9 Pedestrians use Blackhorse Lane as a key route from the north-western parts of theHigham Hill residential area to access Blackhorse Road Station and Walthamstow HighStreet.
5.10 Currently there are few designated pedestrian crossings (either zebra, toucan or pelican)on Blackhorse Lane. Pedestrians may attempt to cross the road where there is nodesignated crossing and thus put themselves at risk of accident with the goods vehiclesand other vehicles on Blackhorse Lane.
On-Street Parking
5.11 A pedestrian wishing to cross the road in a hurry may do so without the assistance of apedestrian crossing facility such as a zebra or pelican crossing. Around the Blackhorse
8/2/2019 Traffic Baseline Conditions
http://slidepdf.com/reader/full/traffic-baseline-conditions 32/34
Lane and Higham Hill area there is a high incidence of on-street parking due to a lack ofprivate garages and driveways.
5.12 Pedestrians crossing the road in between parked cars are at a higher risk of accidentthan those crossing at a designated pedestrian crossing. Firstly they are less visible todrivers of vehicles on the road, and secondly their own visibility may be impaired
causing them to attempt to cross the road in front of oncoming traffic.
Crooked Billet Roundabout5.13 The Crooked Billet roundabout at the junction of the A406, Chingford Road and Billet
Road is a large six-arm roundabout which represents a significant physical andpsychological barrier to pedestrian movements from the Higham Hill residential areatowards South Chingford.
Rat-Running5.14 There are a number of local roads within the Higham Hill residential area that are
currently used as rat-runs by vehicles attempting to avoid congestion on the main roadsand find faster alternatives to reach their destination.
5.15 These include, among others, Winns Road and Priory Court, roads which are largelyresidential and as such are used by pedestrians and also have many parked cars onthem. The vehicles using these roads as rat-runs are often travelling at inappropriatelyhigh speeds considering the type of road, causing risk of collision with other vehiclesand with pedestrians.
5.16 The implementation of traffic-calming measures and the introduction of 20mph Zonesare possible ways of preventing rat-running, reducing the speed of vehicles using theroads and generally making them safer places for all road users.
Cycling
Infrastructure
5.17 There are now (2004) 20 miles of mostly advisory cycle lanes on almost all the mainroads in the borough except for roads on the outer rim bordering Epping Forest and theLee Valley.
5.18 Cycle lanes are continuous across side road junctions and at the junction of Forest Roadand Chingford Road coloured cycle lanes are marked across the main signalised junction.
5.19 There were 70 Advanced Stop Lines (ASLs) by 2004 and all new road schemes includeASLs whether or not they are on the London Cycle Network or LCN+. There are alsotwo cycle bridges in Leytonstone and two major roundabouts with cycle underpassfacilities.
5.20 The present London Cycle Network (LCN) only runs along the boundary of the studyarea – along Forest Road and a route along Brettenham Road and South CountessRoad.
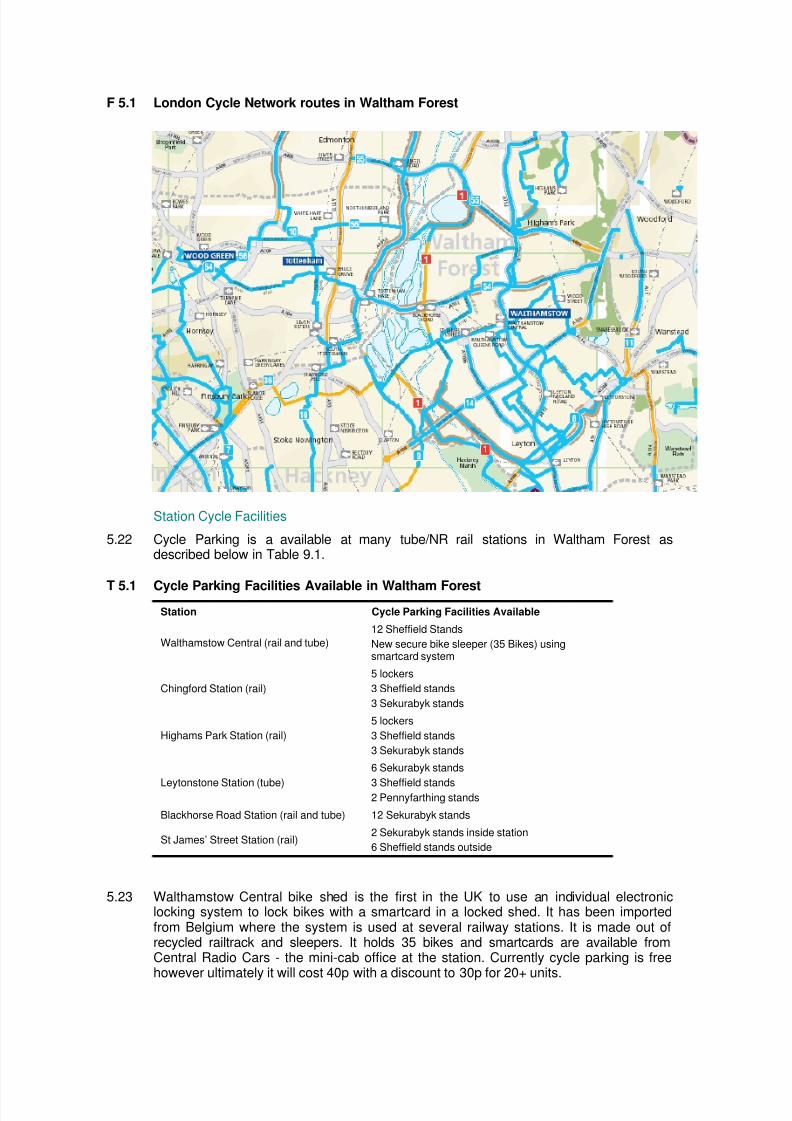
5.21 Blackhorse Lane and Blackhorse Road have been marked as potential future extensionsto the LCN. A map of the LCN (marked in blue) and potential extensions (marked inorange) is provided in figure 9.1 below.
8/2/2019 Traffic Baseline Conditions
http://slidepdf.com/reader/full/traffic-baseline-conditions 33/34
F 5.1 London Cycle Network routes in Waltham Forest
Station Cycle Facilities
5.22 Cycle Parking is a available at many tube/NR rail stations in Waltham Forest asdescribed below in Table 9.1.
T 5.1 Cycle Parking Facilities Available in Waltham Forest
Station Cycle Parking Facilities Available
Walthamstow Central (rail and tube)
12 Sheffield Stands
New secure bike sleeper (35 Bikes) usingsmartcard system
Chingford Station (rail)
5 lockers
3 Sheffield stands
3 Sekurabyk stands
Highams Park Station (rail)
5 lockers
3 Sheffield stands
3 Sekurabyk stands
Leytonstone Station (tube)
6 Sekurabyk stands
3 Sheffield stands2 Pennyfarthing stands
Blackhorse Road Station (rail and tube) 12 Sekurabyk stands
St James’ Street Station (rail)2 Sekurabyk stands inside station
6 Sheffield stands outside
5.23 Walthamstow Central bike shed is the first in the UK to use an individual electroniclocking system to lock bikes with a smartcard in a locked shed. It has been importedfrom Belgium where the system is used at several railway stations. It is made out ofrecycled railtrack and sleepers. It holds 35 bikes and smartcards are available fromCentral Radio Cars - the mini-cab office at the station. Currently cycle parking is freehowever ultimately it will cost 40p with a discount to 30p for 20+ units.
8/2/2019 Traffic Baseline Conditions
http://slidepdf.com/reader/full/traffic-baseline-conditions 34/34
5.24 There are plans to provide another two secure ‘smartcard’ bike sheds at bothLeytonstone station and Blackhorse Road Station, with a location at the latter station stillto be agreed.
5.25 There are further plans to provide cycle parking at stations where there are currently nofacilities. This is to include: Wood Street, Leyton Underground, High Road Leytonstone,
Leyton Midland Station and Walthamstow Queens Road.
Environmental Sensitivities
5.26 The environmental policy review (Policy Chapter) highlights several sensitive areas inthe TAIS study area which have to be considered under any future land-use or transportproposals.
5.27 In terms of transport, the review has highlighted that several of the roads within thestudy area are predicted to exceed UK Air Quality Strategy objectives for both PM10 andNO2 and that care must be taken when considering the current flow of traffic on theseroutes.
5.28 However, policy also lends itself to support the widespread reduction of unnecessarythrough traffic on residential roads in the study area. A case can be made for re-routingtraffic from those streets where pedestrian exposure to poor air quality is high, thereforeimproving local air quality and relocating the problem to less populated areas.
Safe Routes to Schools
5.29 Safe Routes to Schools (SRtS) projects encourage and enable children to walk andcycle to school through a package of practical and educational measures. SRtS is acommunity approach to:
• Encourage more people to walk and cycle to school safely;
• Improve road safety and reduce child casualties;
• Improve children’s health and development; and• Reduce traffic congestion and pollution.
5.30 SRtS initiatives include; developing school travel plans, encouraging cycling to school,walking buses and car sharing.
5.31 It is the job of the edu-action department to co-ordinate the school travel plans, whichwill determining the measures required to realise SRtS projects. The engineering SRtSteam then implement these recommended measures.
5.32 At present there is a cluster project commencing in the Blackhorse Lane area involving:
•
St Patrick’s Primary School• Stoneydowns Primary School; and
• Mishom Grove Primary School.
5.33 Willowfields Secondary School is also located nearby, but is currently not involved at thisstage. The three primary schools mentioned above will be developing travel plansshortly.
5.34 Edu-action would like to encourage SRtS requirements into the Transport and AccessStrategy, and are willing to feedback any progress on School Travel Plans in the area.